

Page 1
Page 1/77
HydrINS 2 / HydrINS 2 Mini flow meter
Programming of data logging with Winfluid
Revision
Date
Author
Modifications
Signature
01
08/06/11
GSE
Validation
GSE
00
1/04/10
MRE
Updated
HydrINS 2 and HydrINS 2 Mini
electromagnetic insertion flow meters
Programming of data logging
Page 2
Page 2/77
HydrINS 2 / HydrINS 2 Mini flow meter
Programming of data logging with Winfluid
CONTENTS
1 INTRODUCTION .......................................................................................................... 6
2 BASIC PROGRAMMING OF HYDRINS 2 / HYDRINS 2 MINI FLOW METERS ..................... 6
2.1 Configuration of the digital channel of the HydrINS 2 probe ................................................ 7
2.1.1 General Tab ........................................................................................................................... 7
2.1.2 Sensor Tab ............................................................................................................................. 8
2.1.2.1 General Tab .................................................................................................................... 9
2.1.2.2 Display Tab ................................................................................................................... 11
2.1.3 Strategy and other Tabs ...................................................................................................... 11
2.2 Transmission of the programming..................................................................................... 11
2.2.1 Direct transmission of the programming to the HydrINS 2 / HydrINS 2 Mini flow meter .. 11
2.2.2 Transmission of the programming to the flow meter during programming of the
associated standalone data logger .................................................................................................... 13
2.3 Real-time reading ............................................................................................................. 16
2.4 Taking a reading of recorded data ..................................................................................... 16
3 RETRIEVAL / PROGRAMMING OF THE FLOW METER .................................................. 17
3.1 Retrieval of the programming to the HydrINS 2 / HydrINS 2 Mini flow meter ..................... 17
3.2 Programming of a HydrINS 2 / HydrINS 2 Mini flow meter ................................................. 18
4 ADVANCED PROGRAMMING OF THE HYDRINS2 PROBE ............................................. 19
4.1 Programming of HydrINS 2 and HydrINS 2 Mini flow meters in advanced mode ................. 19
4.1.1 Conversion tab .................................................................................................................... 20
4.1.2 Sampling Tab ....................................................................................................................... 22
4.1.3 Calculation Tab .................................................................................................................... 22
Page 3
Page 3/77
HydrINS 2 / HydrINS 2 Mini flow meter
Programming of data logging with Winfluid
4.1.4 4-20 mA tab ......................................................................................................................... 23
4.1.5 Maintenance Tab ................................................................................................................ 24
4.1.6 Instrument Tab .................................................................................................................... 25
4.2 Real-time monitoring of recording (to pre-locate leaks by operating the step-test valves, for
example) .................................................................................................................................... 25
4.2.1 Configuration....................................................................................................................... 27
4.3 Use of the enabled 4-20 mA outputs (Display C) ................................................................ 29
4.4 Calculating a velocity profile using the HydrINS 2 / HydrINS 2 Mini probe .......................... 32
4.4.1 Introduction ........................................................................................................................ 32
4.4.2 Launching the Velocity Profile program .............................................................................. 33
4.4.3 Configuration....................................................................................................................... 33
4.4.4 Measurement ...................................................................................................................... 35
4.4.5 Measurement procedure: ................................................................................................... 39
4.5 Processing a profile .......................................................................................................... 43
4.5.1 Opening a velocity profile ................................................................................................... 43
4.5.2 Deleting a profile file ........................................................................................................... 44
4.5.3 Copying a profile file ........................................................................................................... 44
4.5.4 Modifying a velocity profile file ........................................................................................... 45
4.5.5 Printing and exporting data from a velocity profile ............................................................ 45
4.5.6 Programming a profile previously saved. ............................................................................ 46
4.5.7 Transferring a velocity profile to Winfluid .......................................................................... 47
4.5.8 Synchronisation of PC/Pocket PC profile files ..................................................................... 49
5 HYDRINS DISPLAY SOFTWARE ................................................................................... 49
6 REMOTE ASSISTANCE ................................................................................................ 53
7 MAINTENANCE ......................................................................................................... 55
8 HYDRINS SOFTWARE ................................................................................................ 57
Page 4
Page 4/77
HydrINS 2 / HydrINS 2 Mini flow meter
Programming of data logging with Winfluid
8.1 Configuration ................................................................................................................... 58
8.2 Content of menus ............................................................................................................. 59
8.2.1 Sensor menu: ...................................................................................................................... 59
8.2.2 File Menu:............................................................................................................................ 60
8.2.3 Maintenance Menu: ............................................................................................................ 61
8.3 Information displayed ...................................................................................................... 63
8.3.1 Identification box ................................................................................................................ 63
8.3.2 Installation Box .................................................................................................................... 64
8.3.3 Units box: ............................................................................................................................ 64
8.3.4 Sampling box ....................................................................................................................... 64
8.3.5 Calculation box .................................................................................................................... 65
8.3.6 Calibration box .................................................................................................................... 65
8.3.7 Serial Output Tab ................................................................................................................ 65
8.3.8 4-20 mA output tab ............................................................................................................. 67
8.3.9 Display Tab .......................................................................................................................... 67
APPENDIX 1: VELOCITY PROFILE PRINTING TEMPLATE ..................................................... 69
APPENDIX 1: ASSOCIATED HYDREKA CATALOGUE NUMBERS ........................................... 70
TABLE OF ILLUSTRATIONS ............................................................................................... 71
Page 5
Page 5/77
HydrINS 2 / HydrINS 2 Mini flow meter
Programming of data logging with Winfluid
This document constitutes the programming manual for the HydrINS2/HydrINS 2 Mini insertion flow
meter.
For the installation of the flow meter and a display, refer to the HydrINS 2 / HydrINS 2 Mini insertion
flow meter installation manual.
If you have any further questions, please contact our Customer Service Department
HYDREKA
34, route de Saint Romain – 69450 ST CYR AU MONT D’OR – France
Tel.: 33 4 72 53 11 53 – Fax: 33 4 78 83 44 37
E-mail: [email protected] or [email protected]
Customer Service: [email protected]
Rentals: [email protected]
Sales: [email protected]
Export: [email protected]
Page 6
Page 6/77
HydrINS 2 / HydrINS 2 Mini flow meter
Programming of data logging with Winfluid
1 Introduction
To allow you to familiarise yourself gradually with your flow meter, this manual begins with a
presentation of standard programming, and then builds up to advanced functionality.
You will need at least Winfluid 3.20 and a CC_HYDA3 or CC_HYDA3S cable to provide the connection
between the computer and the flow meter or between the computer and Display A or C if a Display is
used. If a standalone data logger is included in the acquisition system, you will also need a suitable
communication cable (refer to the Data Logger Manual).
2 Basic programming of HydrINS 2 / HydrINS 2 Mini flow meters
HydrINS 2 / HydrINS 2 Mini flow meters are programmed using Winfluid software. Winfluid also
performs data reading and report functions.
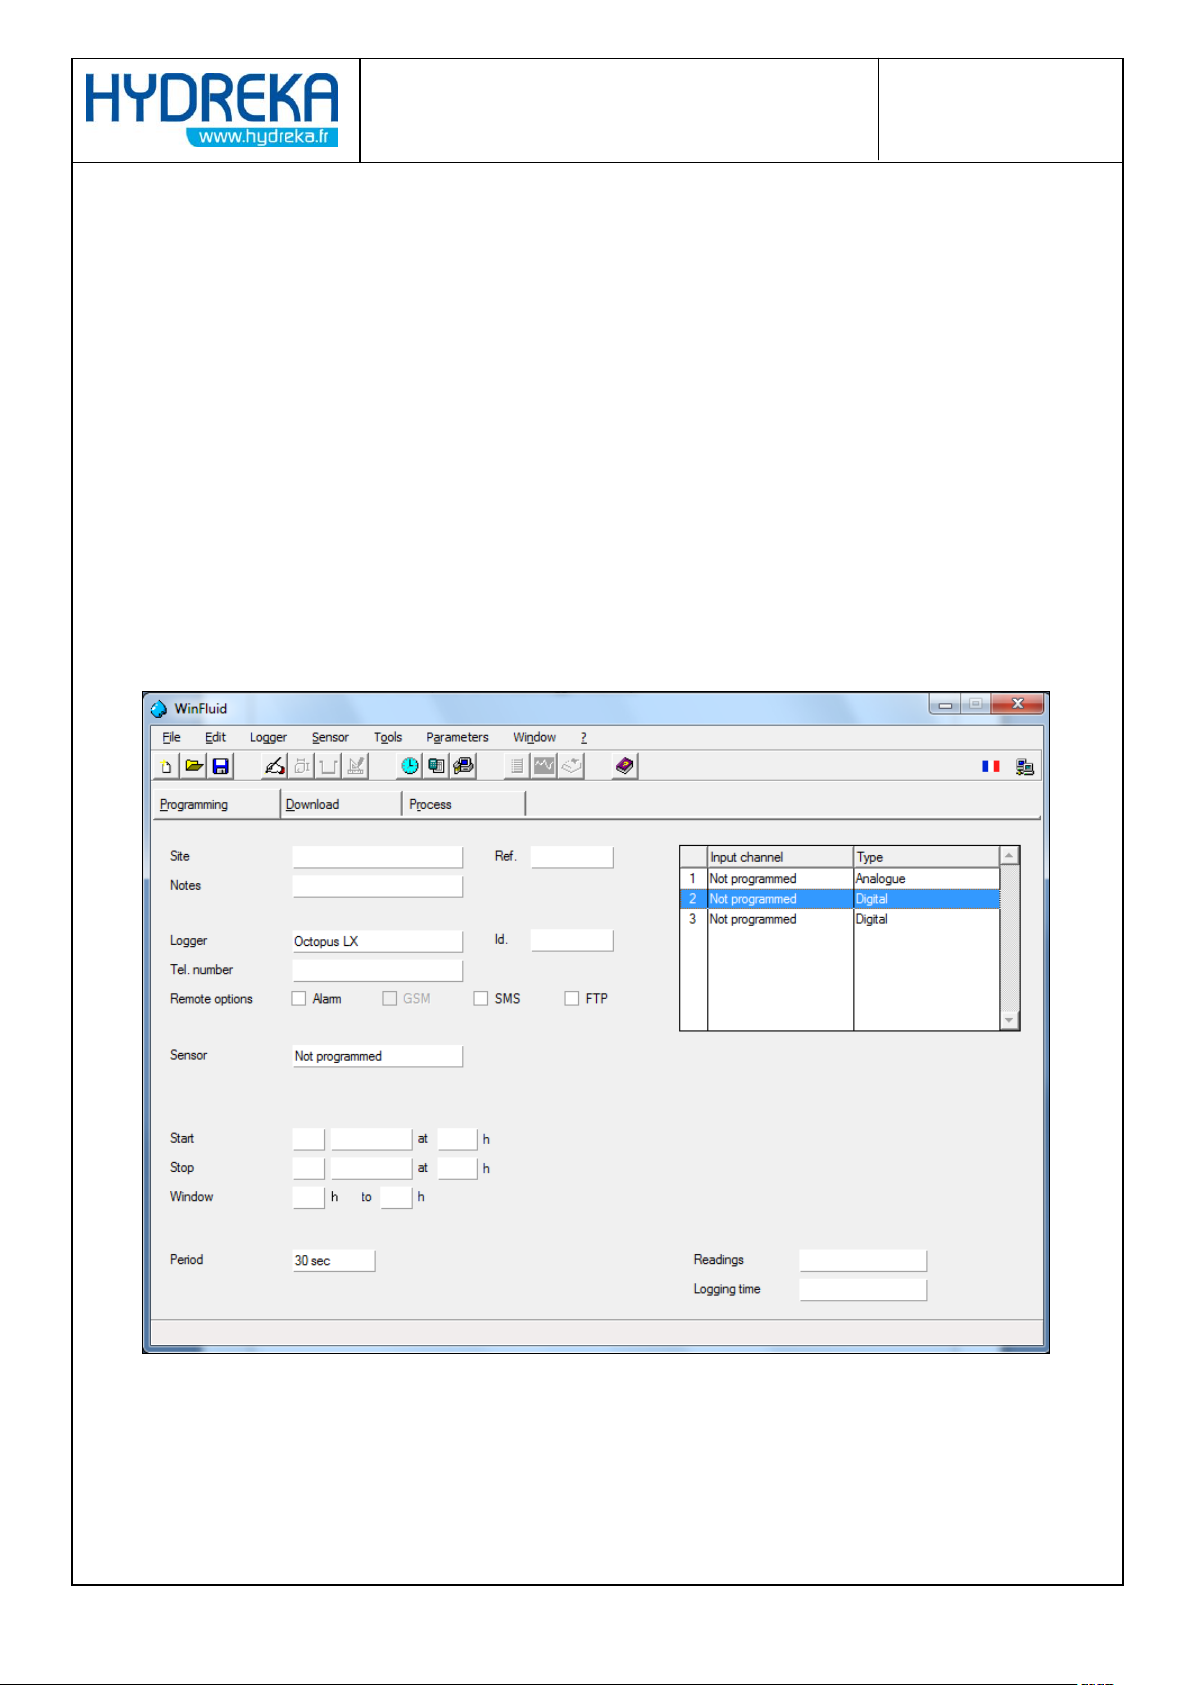
Launch the Winfluid program from Windows. The home screen is displayed. Click Parameters to
access the Winfluid configuration module.
Figure 1: General configuration of Winfluid – situation of the Parameters menu on the home screen
Page 7
Page 7/77
HydrINS 2 / HydrINS 2 Mini flow meter
Programming of data logging with Winfluid
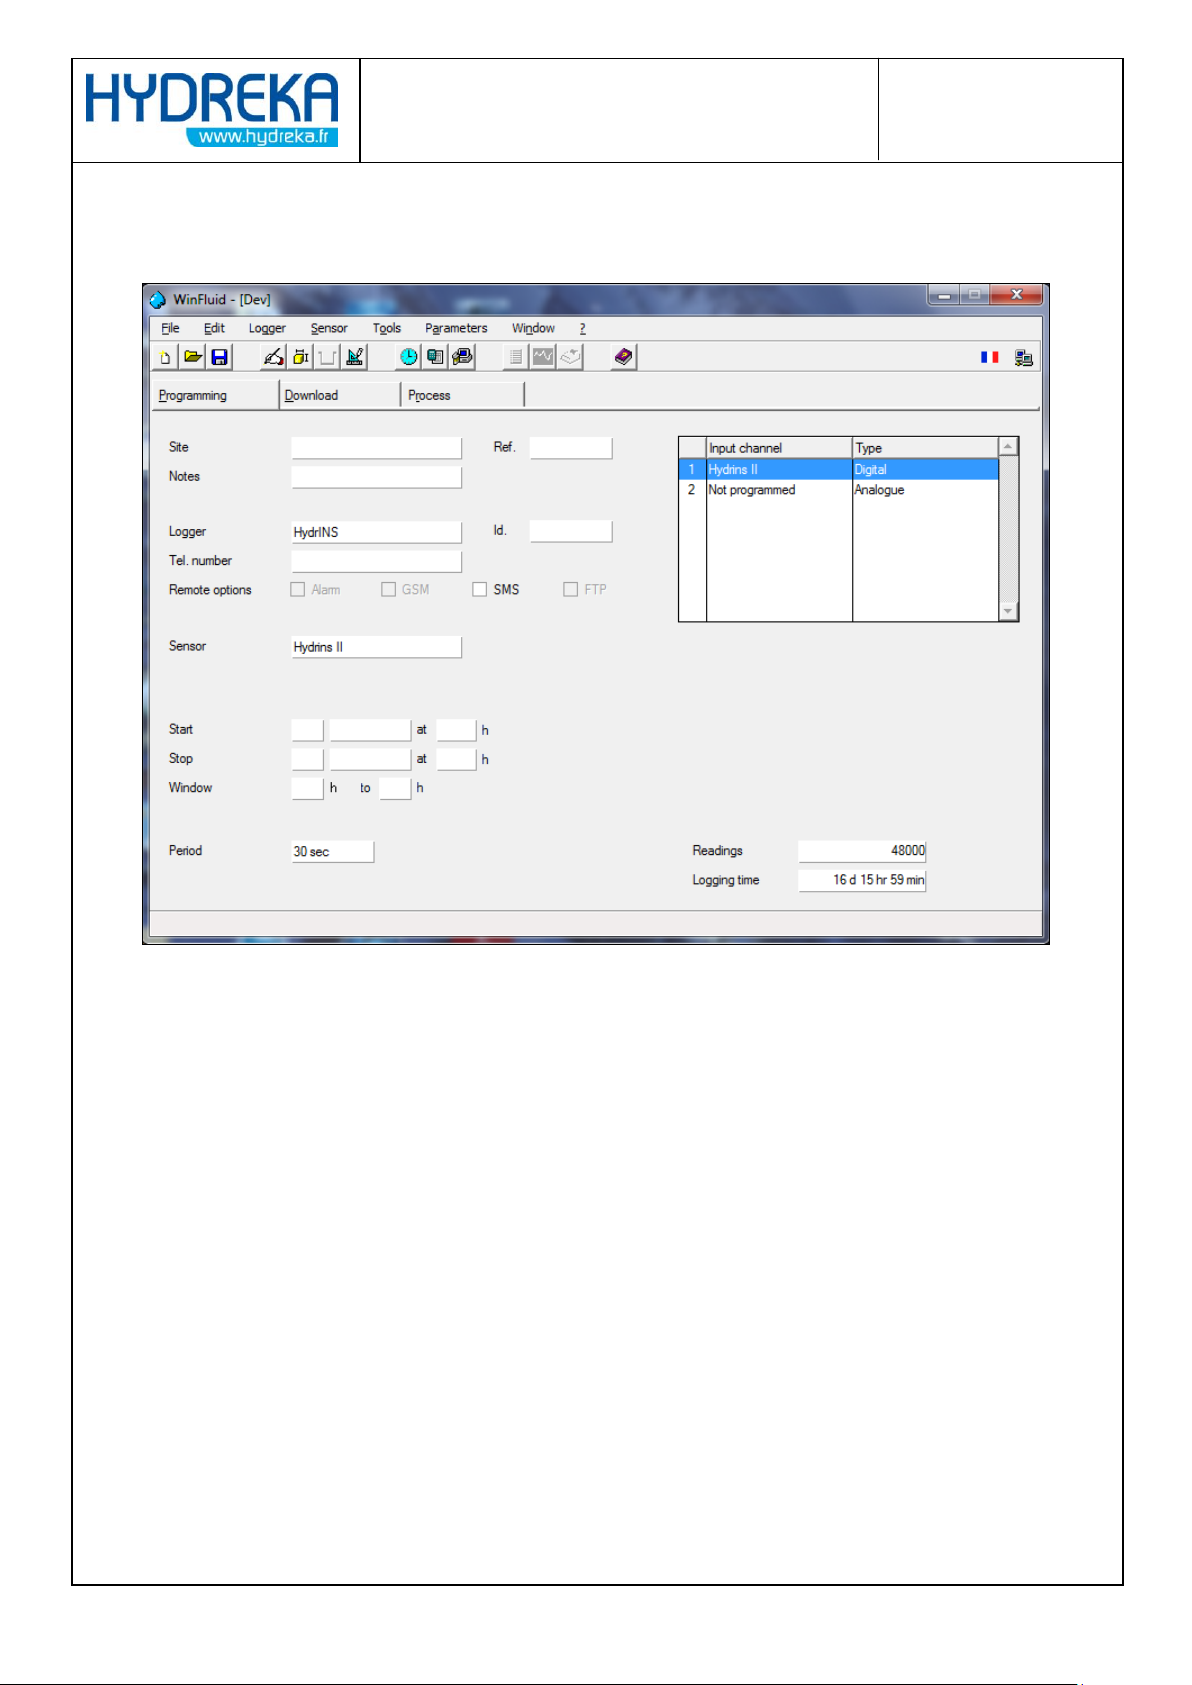
To configure the data logger, select the data logger in the Winfluid parameters (select the data
logger from the HYDREKA range if a data logger is used or Computer to program the flow meter and
the display), and then click the Programming tab.
Figure 2: View of the Winfluid home screen
2.1 Configuration of the digital channel of the HydrINS 2 probe
Double-click the digital channel on the Winfluid home screen to program the pulse input channel of
the HydrINS 2/HydrINS 2 Mini.
2.1.1 General Tab
Refer to the manual for your data logger
Page 8
Page 8/77
HydrINS 2 / HydrINS 2 Mini flow meter
Programming of data logging with Winfluid
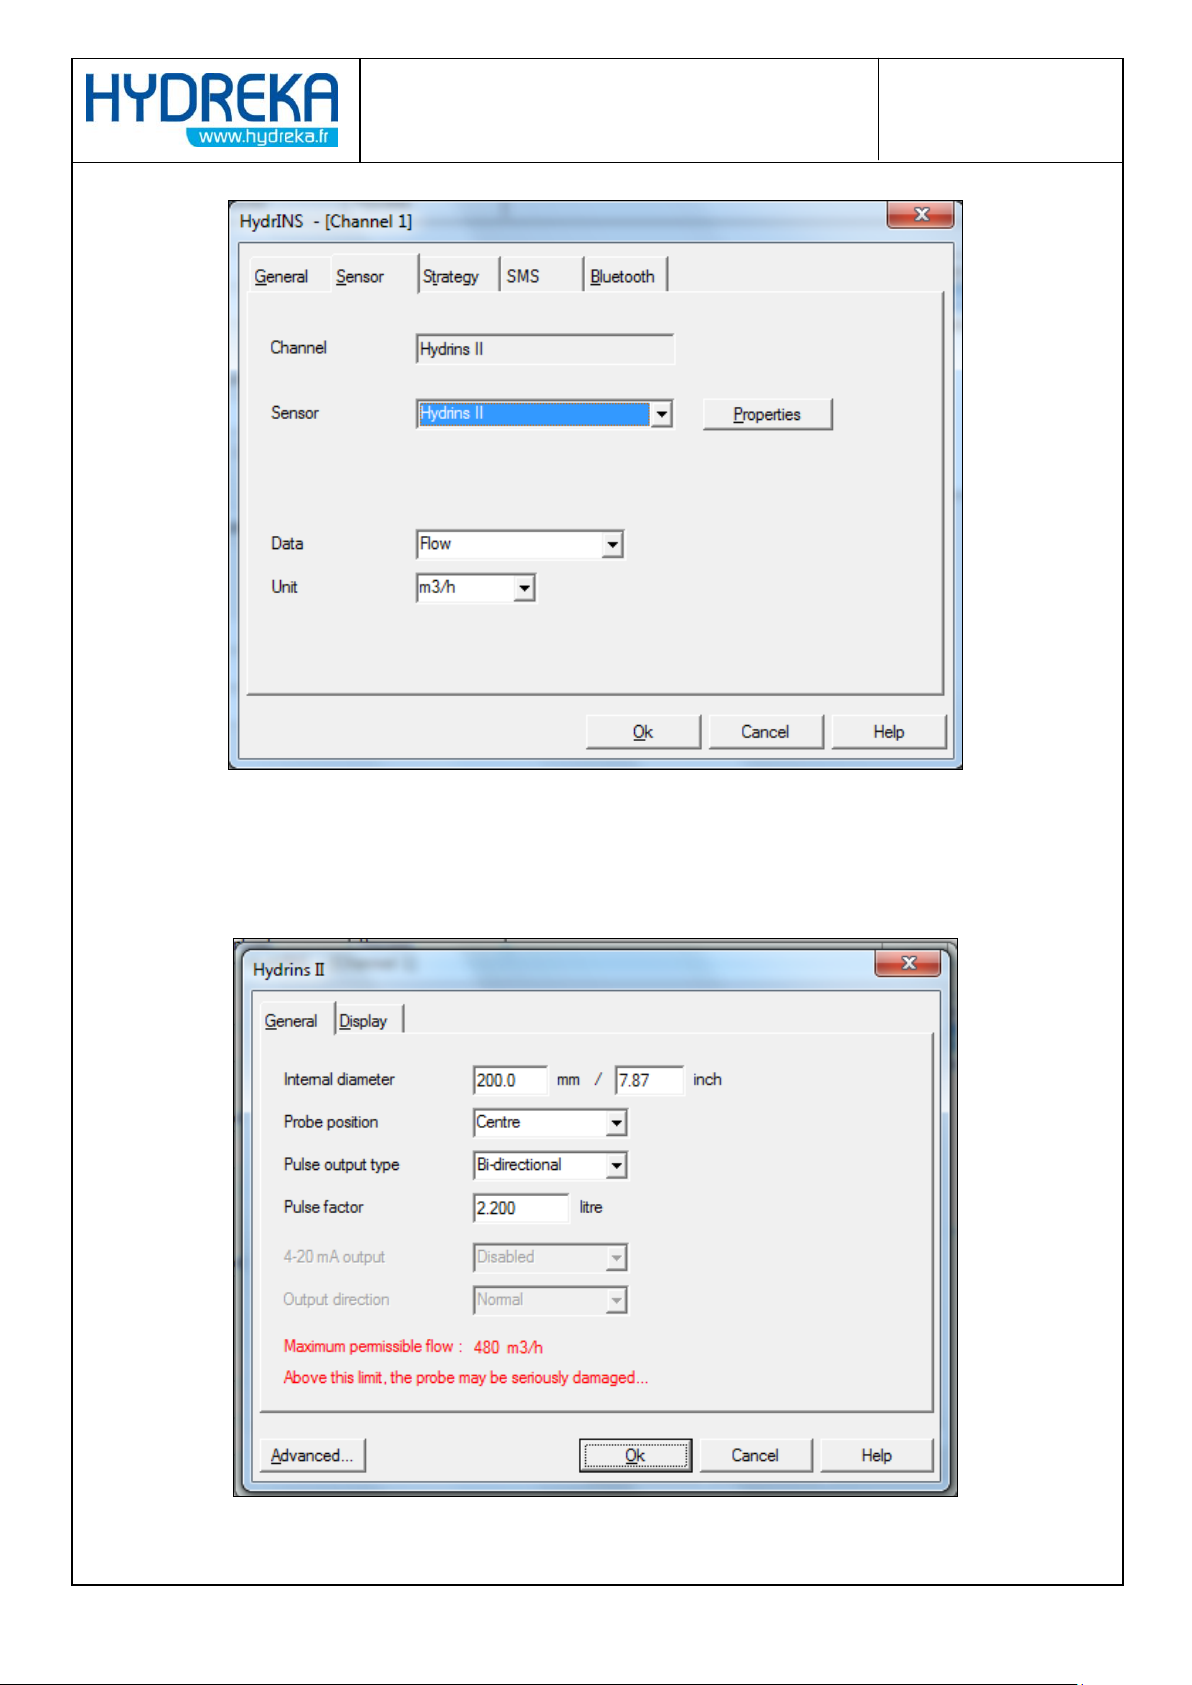
2.1.2 Sensor Tab
Figure 3: Overview of the sensor tab
In the Sensor field, select HydrINS II for the HydrINS 2 or Mini HydrINS for the HydrINS 2 Mini
Click Properties to display the probe programming window.
Page 9
Page 9/77
HydrINS 2 / HydrINS 2 Mini flow meter
Programming of data logging with Winfluid
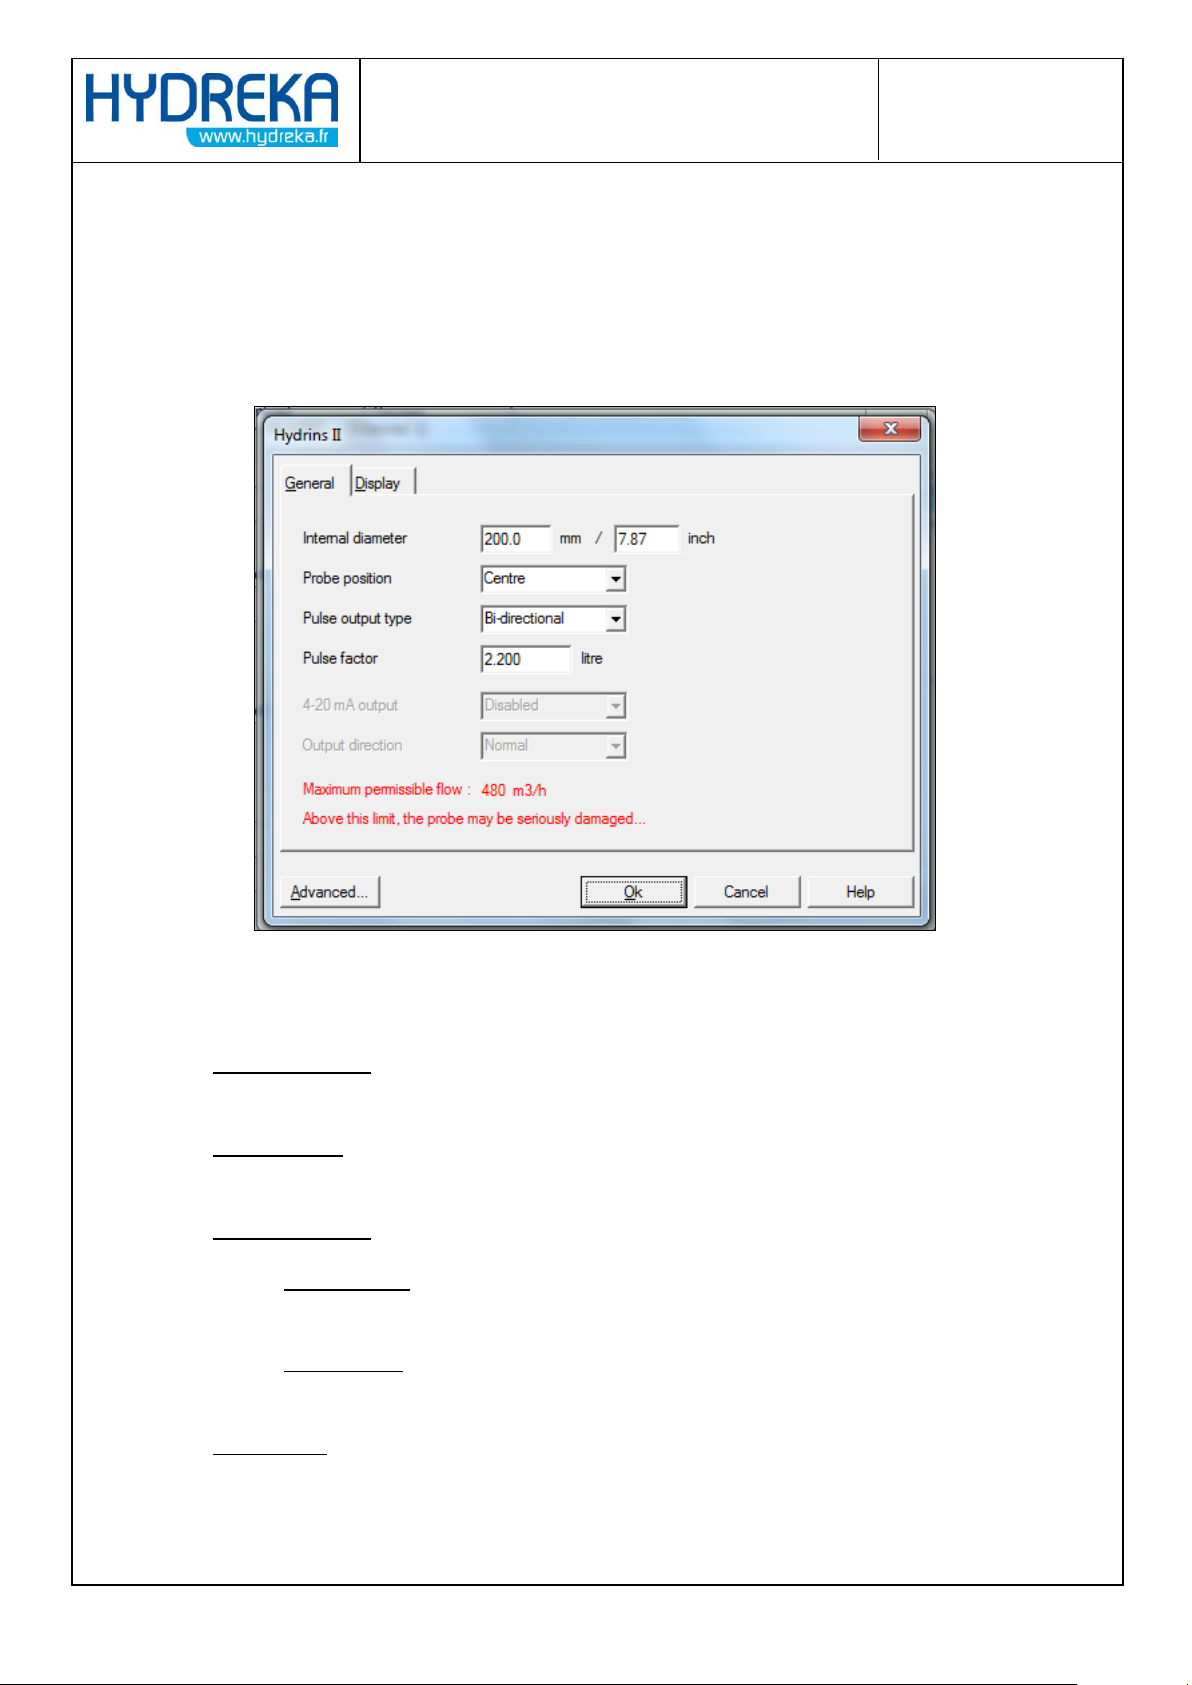
Figure 4: Programming window for the HydrINS 2 probe
Two programming modes are available: standard programming and advanced programming, to take
all internal parameters of the probe into account.
The current window displays standard programming. Advanced programming mode is accessed by
clicking the Advanced button.
2.1.2.1 General Tab
Figure 5: Overview of the HydrINS 2 probe programming window – General Tab
The General tab lets you enter the following information:
Internal diameter: inside diameter (mm) of the pipe in which the probe is installed (ID value
measured in the HydrINS 2 / HydrINS 2 Mini flow meter installation manual).
Probe position: Centre or 1/8
the position for which the profile factor is equal to 1.
Pulse output type: Type of pulse output (digital channel).
o Unidirectional: Pulses when the flow is in the normal direction between Pins A and B
of the probe and pulses in the reverse direction between Pins A and H of the probe
o Bi-directional: Pulses when the flow is in the normal direction and reverse between
Pins A and B of the probe. Direction contact between Pins A and H.
Pulse Factor: Volume corresponding to a pulse emitted on the frequency output of the
sensor.
th
diameter. Position of the probe in the pipe. The 1/8 position is
Page 10
Page 10/77
HydrINS 2 / HydrINS 2 Mini flow meter
Programming of data logging with Winfluid
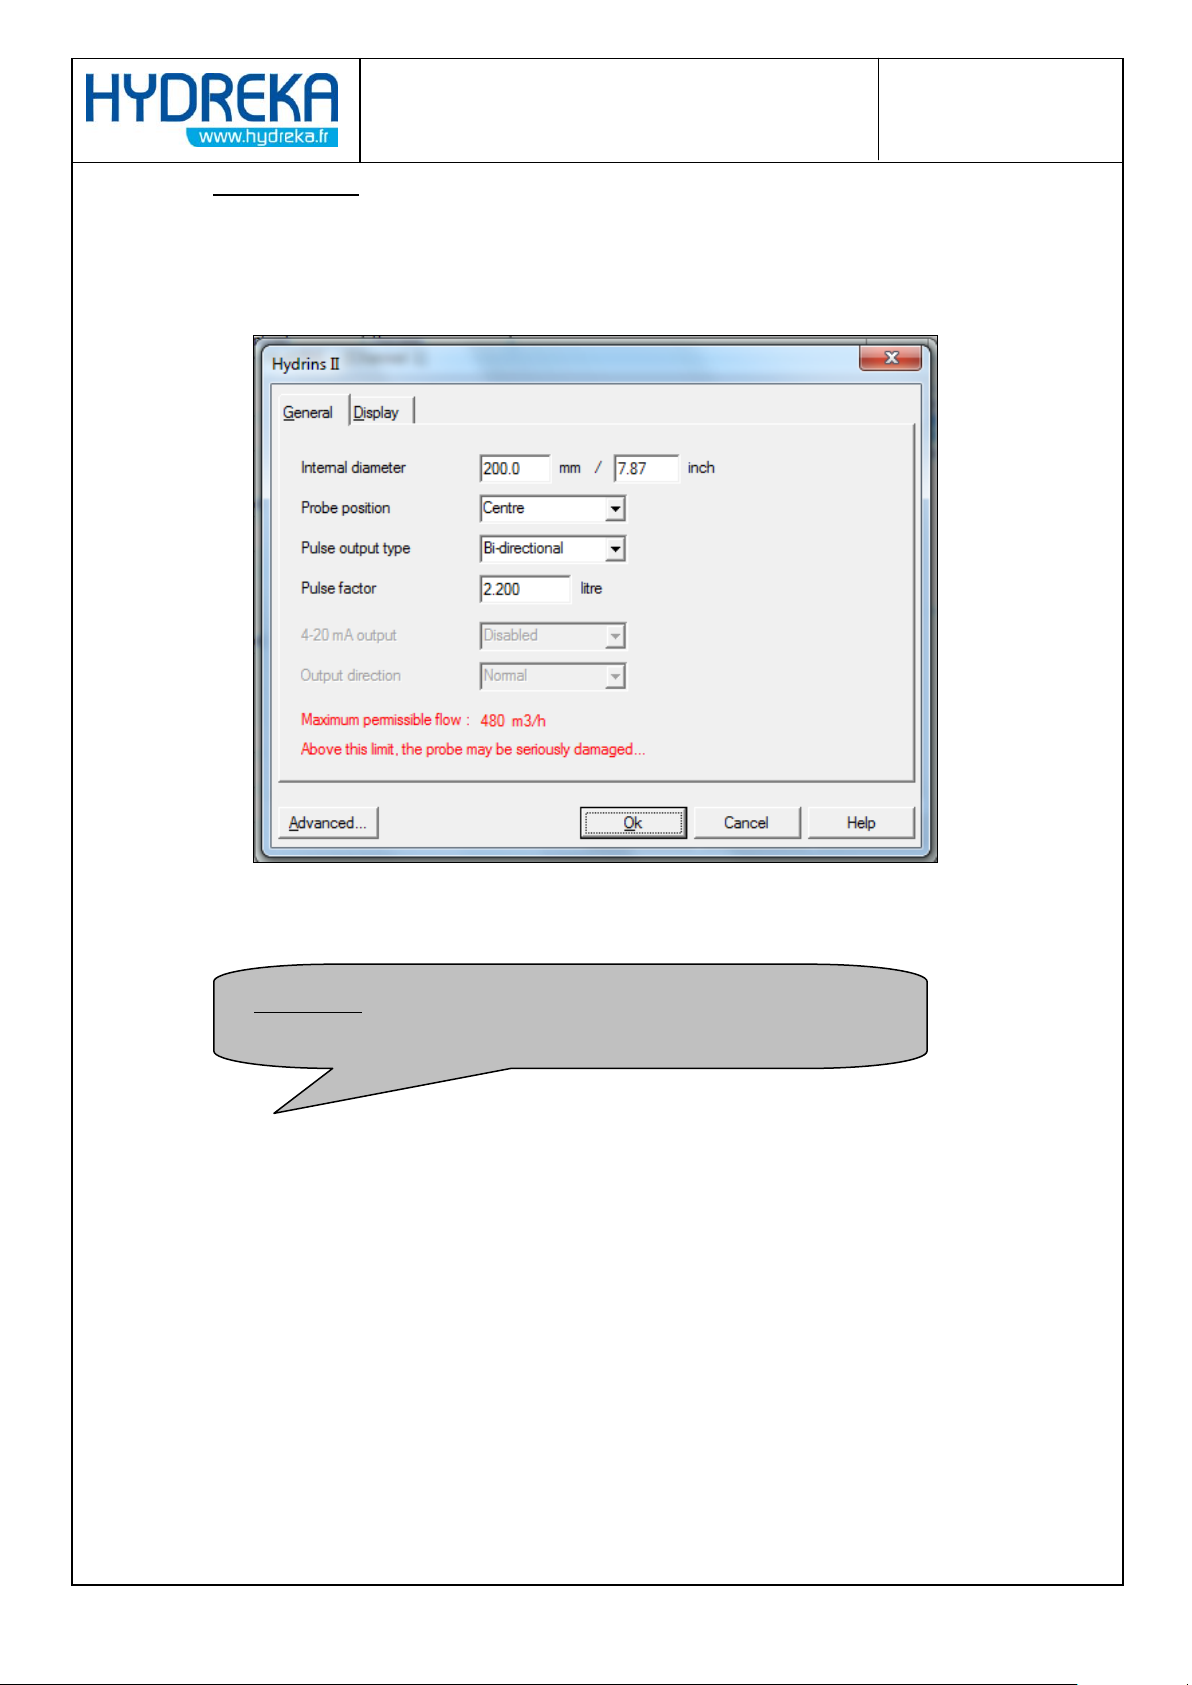
WARNING: If you do not observe the Maximum Tolerated Flow Rate
displayed in red, you may cause serious damage to the probe.
4-20 mA output: If a Display C is used and the output is 4-20 mA, this field must be set to
Enabled.
The window also displays a Maximum permissible flow. This maximum allowable flow rate is the
flow rate to be observed to prevent any physical damage to the probe.
Figure 6: Overview of the HydrINS 2 probe programming window – General Tab – Maximum allowable flow rate to be
observed
Page 11
Page 11/77
HydrINS 2 / HydrINS 2 Mini flow meter
Programming of data logging with Winfluid
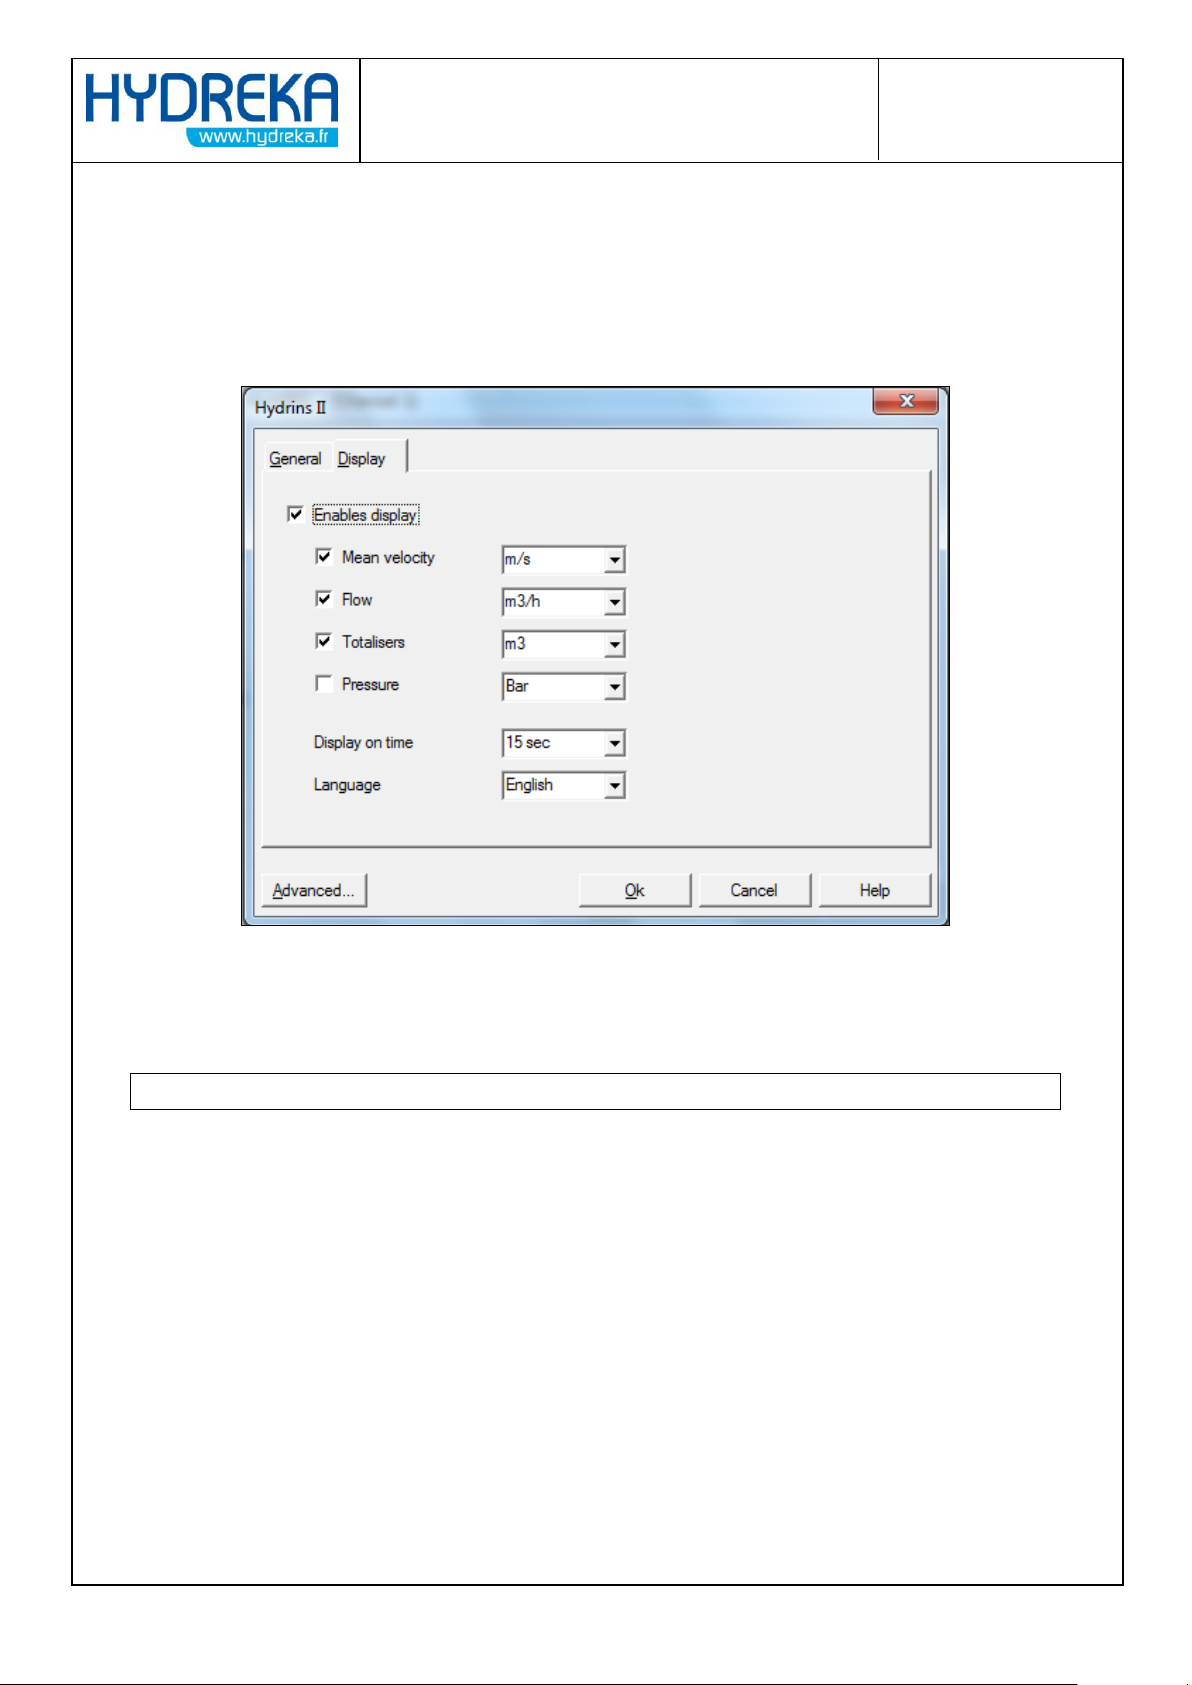
2.1.2.2 Display Tab
When a Display A or a Display C is used, you must select the Enable Display box and select each
parameter you wish to be displayed on the LCD screen if used.
Figure 7: Overview of the HydrINS 2 probe programming window
2.1.3 Strategy and other Tabs
Refer to the manual for your data logger
Confirm the programming by clicking OK and return to the Winfluid home screen.
2.2 Transmission of the programming
There are two ways to transmit the programming to the HydrINS 2 / HydrINS 2 Mini flow meter.
Connect the computer directly to the flow meter or to Display A or C, if used.
Or during the programming of a standalone data logger, if used.
2.2.1 Direct transmission of the programming to the HydrINS 2 / HydrINS 2 Mini flow
meter
Direct transmission of the programming to the flow meter is valid only when using the Computer
parameter as data logger (this can be set in the Parameters menu of the home menu). This mode is
used when you wish to program a flow meter so that you can view the values in real time, calibrate
or simulate the 4-20 mA outputs, or use the flow meter in combination with a remote management
system.
Page 12
Page 12/77
HydrINS 2 / HydrINS 2 Mini flow meter
Programming of data logging with Winfluid
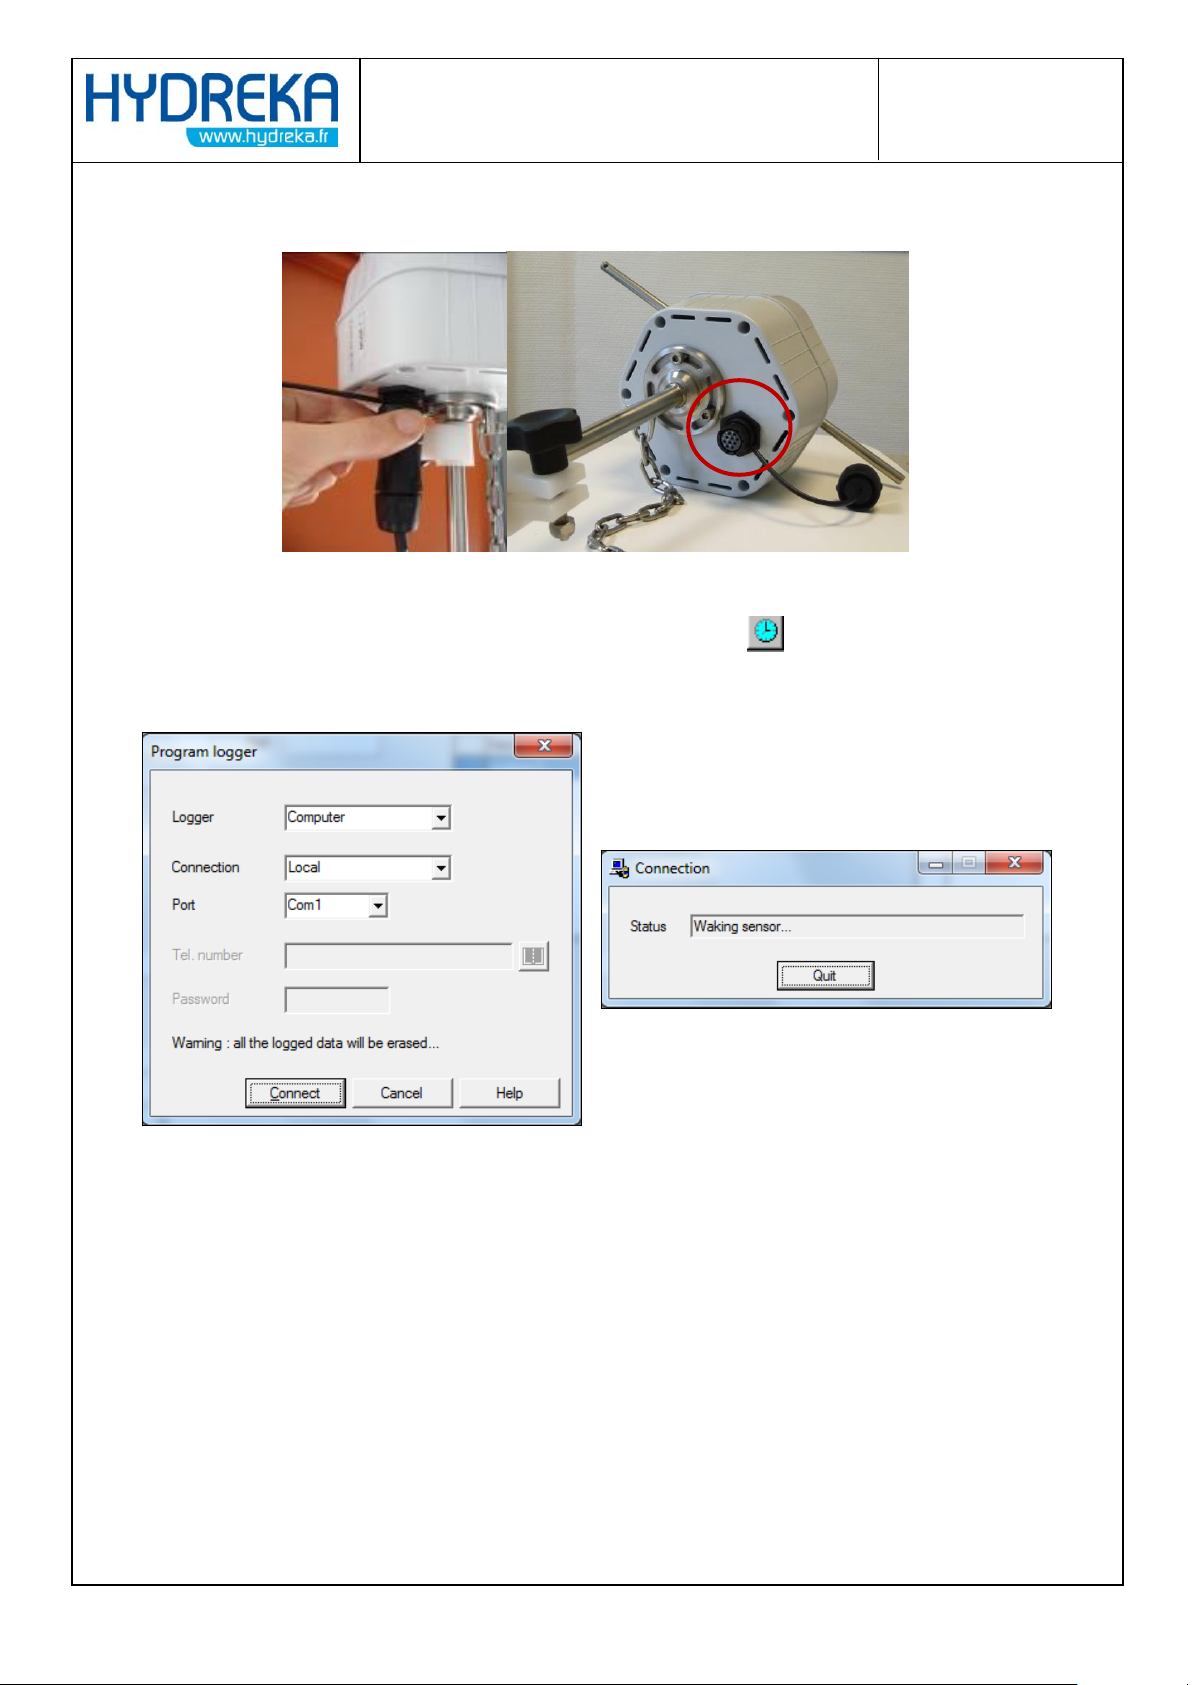
Connect your computer to the HydrINS 2 or HydrINS 2 Mini flow meter (or to Display A or C) using a
cable CC_HYDA3 or CC_HYDA3S.
Figure 8: Connection of the CC_HYDA3 or CC_HYDA3S cable to the flow meter
From the Winfluid home screen, click Logger > Program or click the icon in the toolbar.
The following communication window is displayed:
Figure 9: Connection dialogues for programming
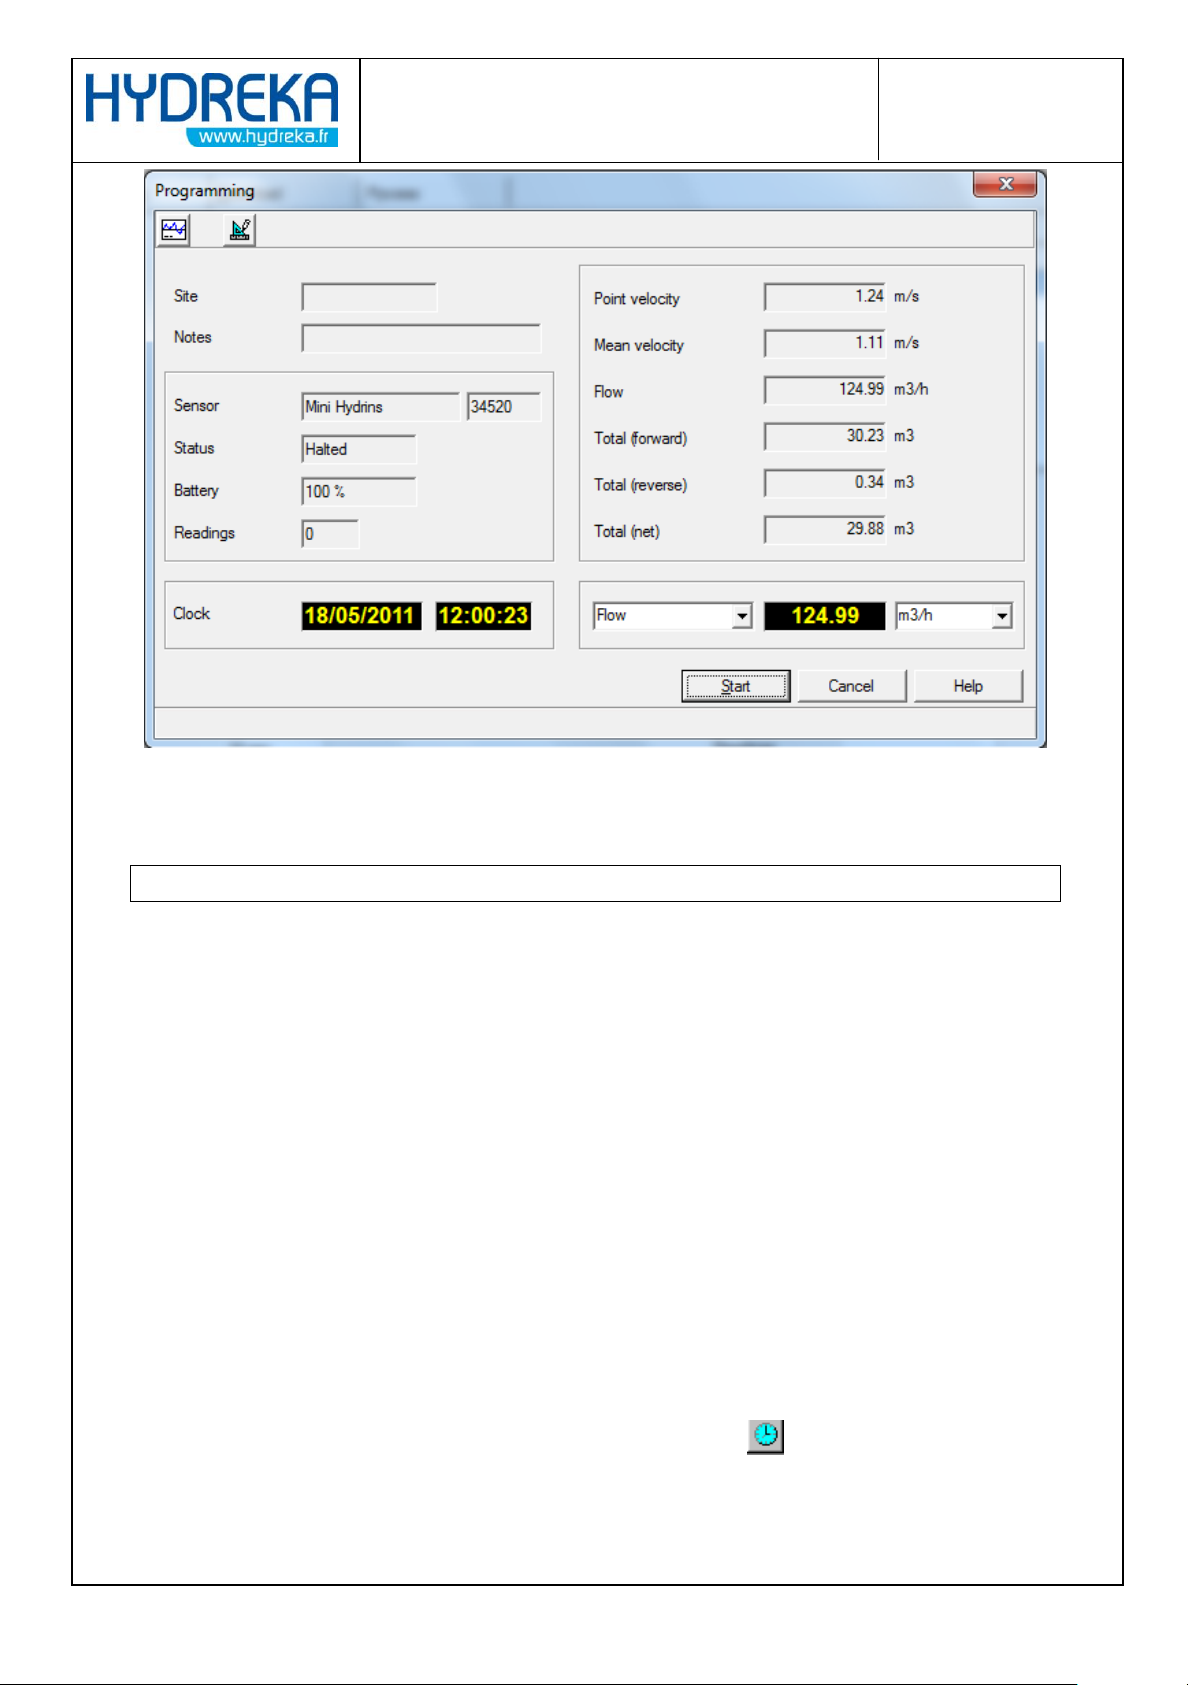
When programming is complete, the preview window before launching acquisition is displayed.
Page 13
Page 13/77
HydrINS 2 / HydrINS 2 Mini flow meter
Programming of data logging with Winfluid
Figure 10: Correct programming confirmation dialogues
Refer to Section 4.2 to learn how to use the flow meter in this operating mode.
Click 'Start' or 'Cancel' to launch or abort the acquisition
Disconnect the PC/Flow meter communication cable CC_HYDA3 or CC_HYDA3S.
2.2.2 Transmission of the programming to the flow meter during programming of the
associated standalone data logger
When it is operating, the HydrINS 2/HydrINS 2 Mini is connected to a data logger (CNT90S for
Lolog/Vista + or CNT102S for an Octopus LX), so that the logger can record the pulses emitted by the
flow meter.
Programming takes place in two steps. Firstly, the flow meter is connected to the PC via the RS232
output to receive its programming. Secondly, the flow meter is connected to a data logger and the
data logger is connected to the PC via the RS232 output so that it can be programmed.
Programming is performed according to the manual for the data logger being used. When defining a
digital input channel for the data logger, specify the sensor HydrINS II or Mini HydrINS.
The programming of the HydrINS 2 / HydrINS 2 Mini follows the programming steps of the input
channel as specified above.
From the Winfluid home screen, click Logger > Program or click the icon in the toolbar.
Page 14
Page 14/77
HydrINS 2 / HydrINS 2 Mini flow meter
Programming of data logging with Winfluid
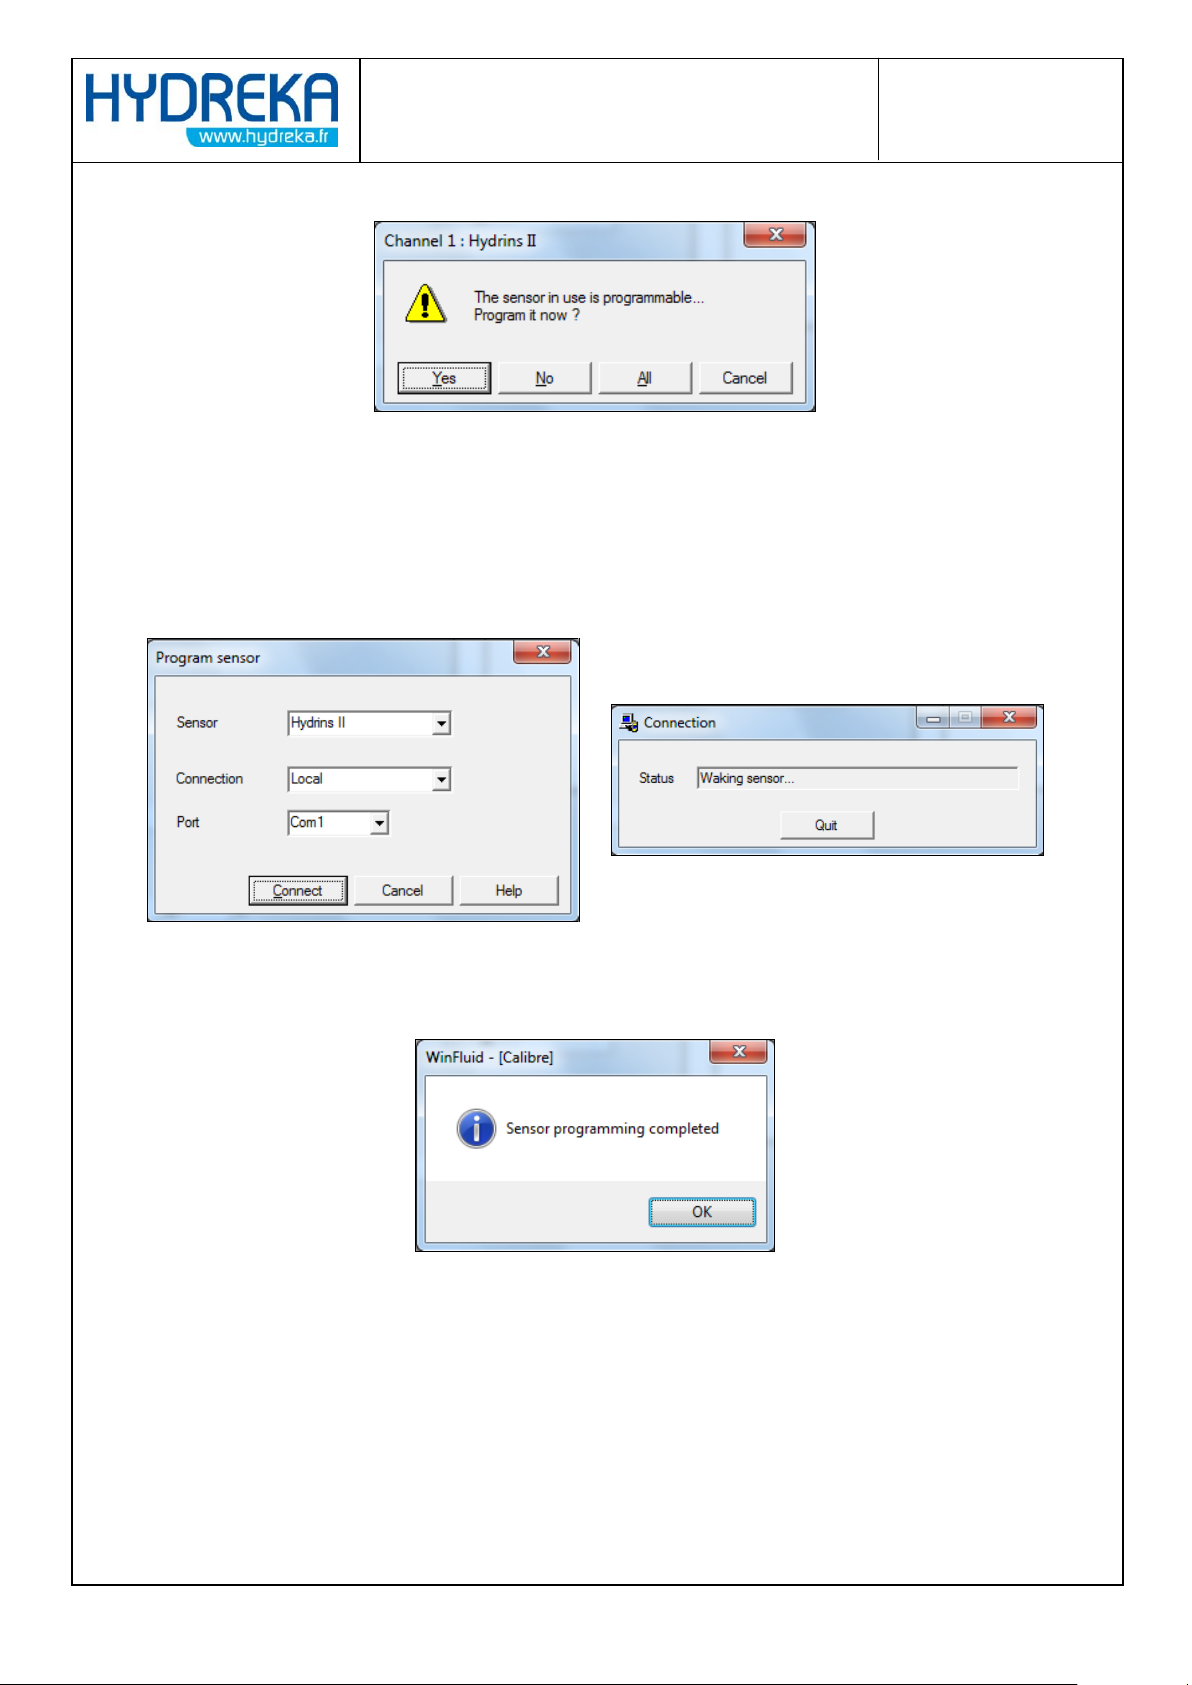
Figure 11: Programming dialogue
If the flow meter has already been programmed for the site and its configuration has not been
modified, click No and connect the flow meter to the digital input of the data logger.
If the flow meter needs to be programmed, connect it to the PC via its RS232 connection, and then
click Yes. When the sensor programming window appears, click Connect.
Figure 12: Connection dialogues for flow meter programming
When flow meter programming is finished, the following window is displayed.
Figure 13: Correct programming confirmation dialogues
The standalone data logger programming window is then displayed. Connect the flow meter to the
digital input of the data logger, and then connect the data logger to the PC via its RS232 output.
Page 15
Page 15/77
HydrINS 2 / HydrINS 2 Mini flow meter
Programming of data logging with Winfluid
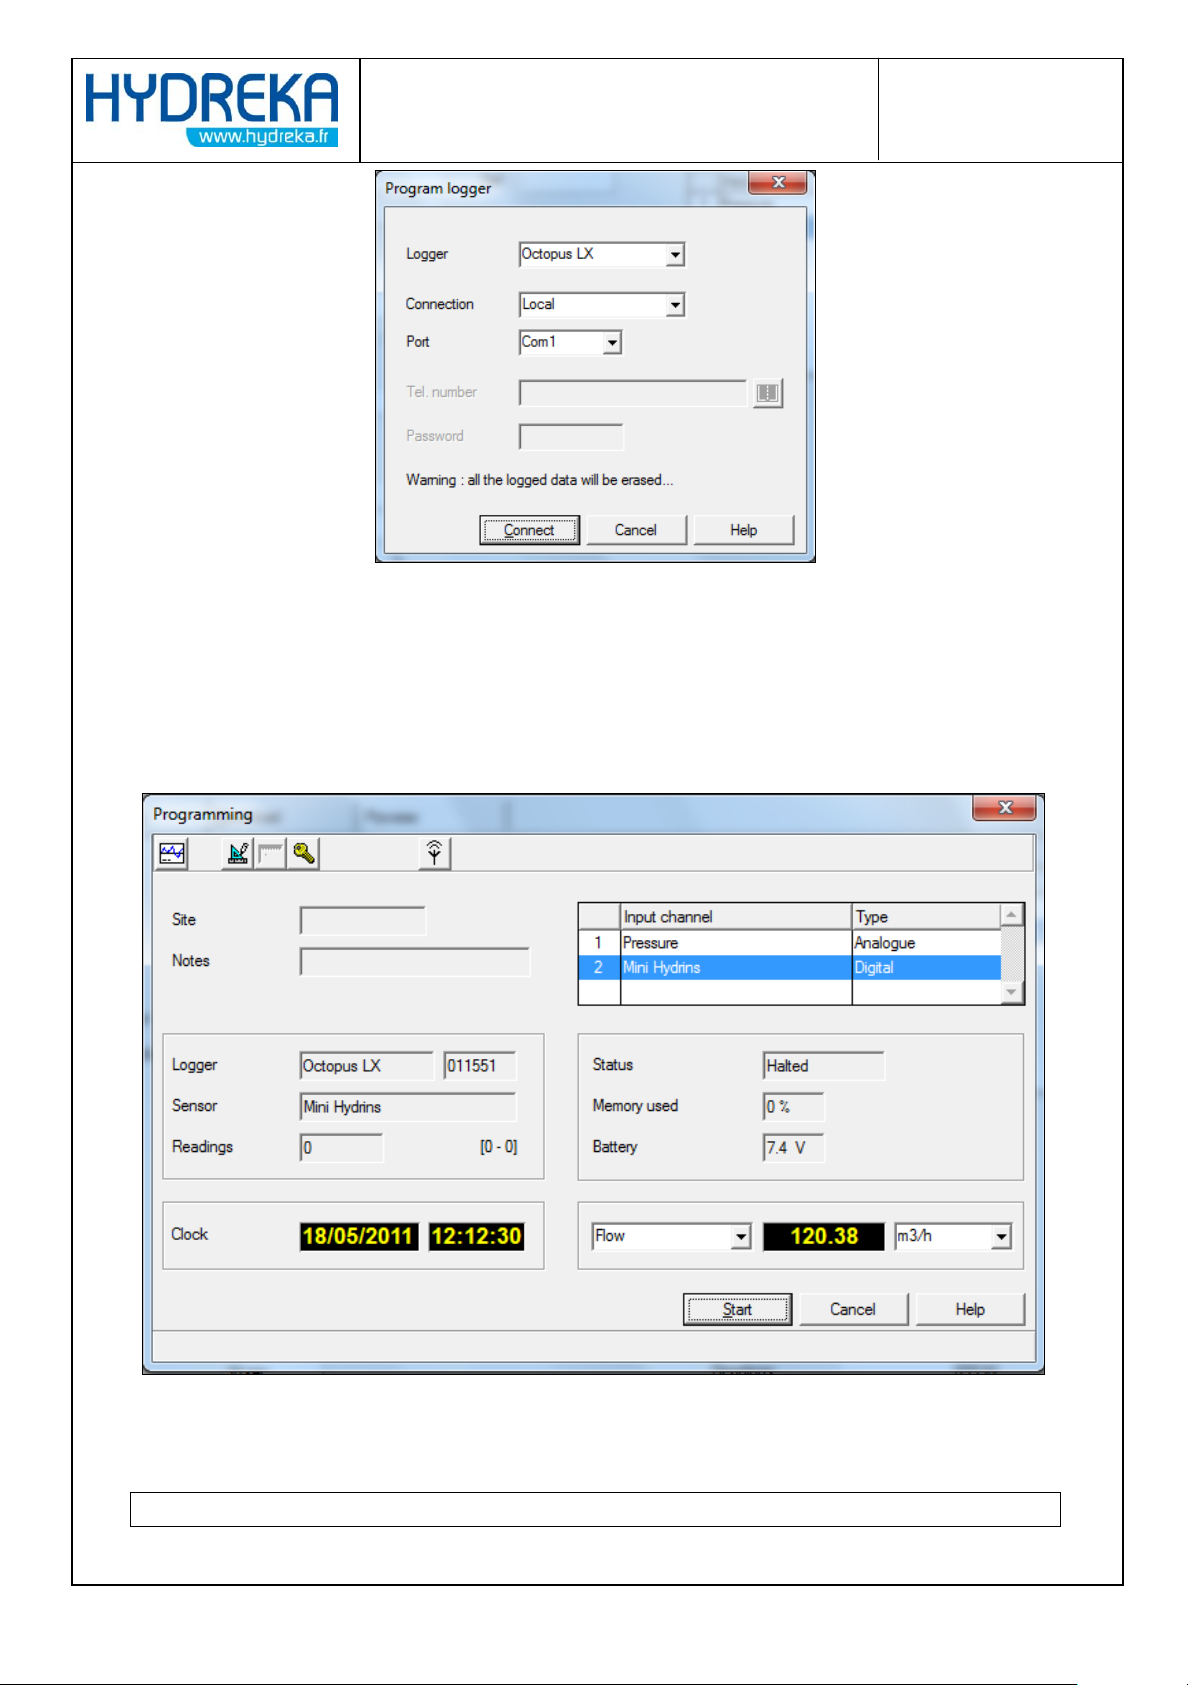
Figure 14: Connection dialogue for programming
Check that the correct communication port is being used (the ports used by the PC are shown in
black, and available ports are shown in red), and then click Connect to send the programming to the
data logger.
The following preview is displayed:
Figure 15: Preview window before launching acquisition by the data logger
Start the data logger by clicking the Start button.
Acquisition is launched.
Page 16
Page 16/77
HydrINS 2 / HydrINS 2 Mini flow meter
Programming of data logging with Winfluid
2.3 Real-time reading
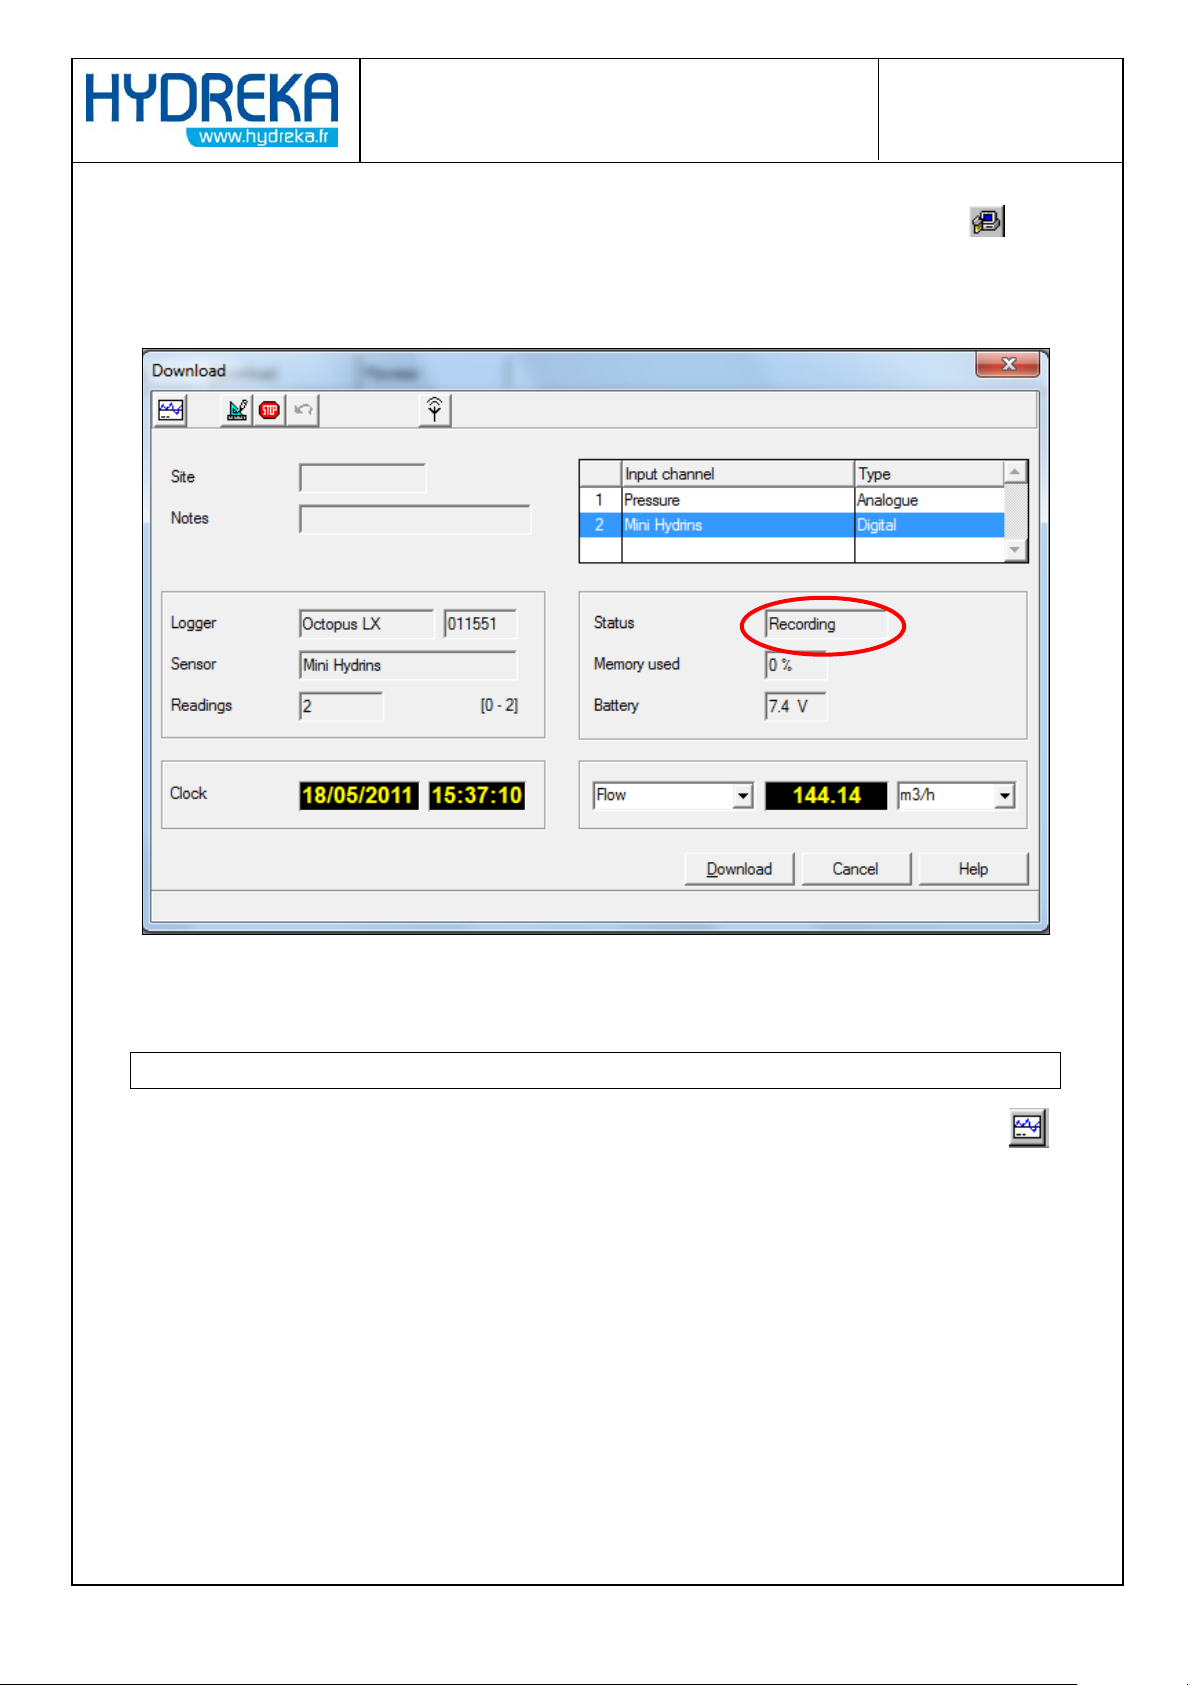
To check that the data logger is correctly configured or that recording is enabled, click the icon
from the Winfluid home screen.
The data logger dialogue box is displayed:
Figure 16: Status acquisition window
Check that the Status field says 'Recording'.
If so, acquisition is taking place properly. You can now leave the system in operation.
From this window, data acquisition can be monitored in real time on a graph by clicking the
icon.
This window also allows you to take a reading as indicated below.
2.4 Taking a reading of recorded data
To take a reading of the recorded data, repeat the steps listed in the previous section.
In the acquisition status window, click the Reading button.
Select the channel(s) to be read, and then click OK.
If you do not wish to take a reading, click Cancel before disconnecting
Page 17
Page 17/77
HydrINS 2 / HydrINS 2 Mini flow meter
Programming of data logging with Winfluid
After taking a reading, archive the file by clicking the icon.
3 Retrieval / Programming of the flow meter
You can retrieve the current configuration or program any HydrINS 2 / HydrINS 2 Mini flow meter
without going through the steps described above via the following procedure:
3.1 Retrieval of the programming to the HydrINS 2 / HydrINS 2 Mini flow
meter
Make a direct connection between computer and flow meter or between computer and display using
a CC_HYDA3 or CC_HYDA3S cable.
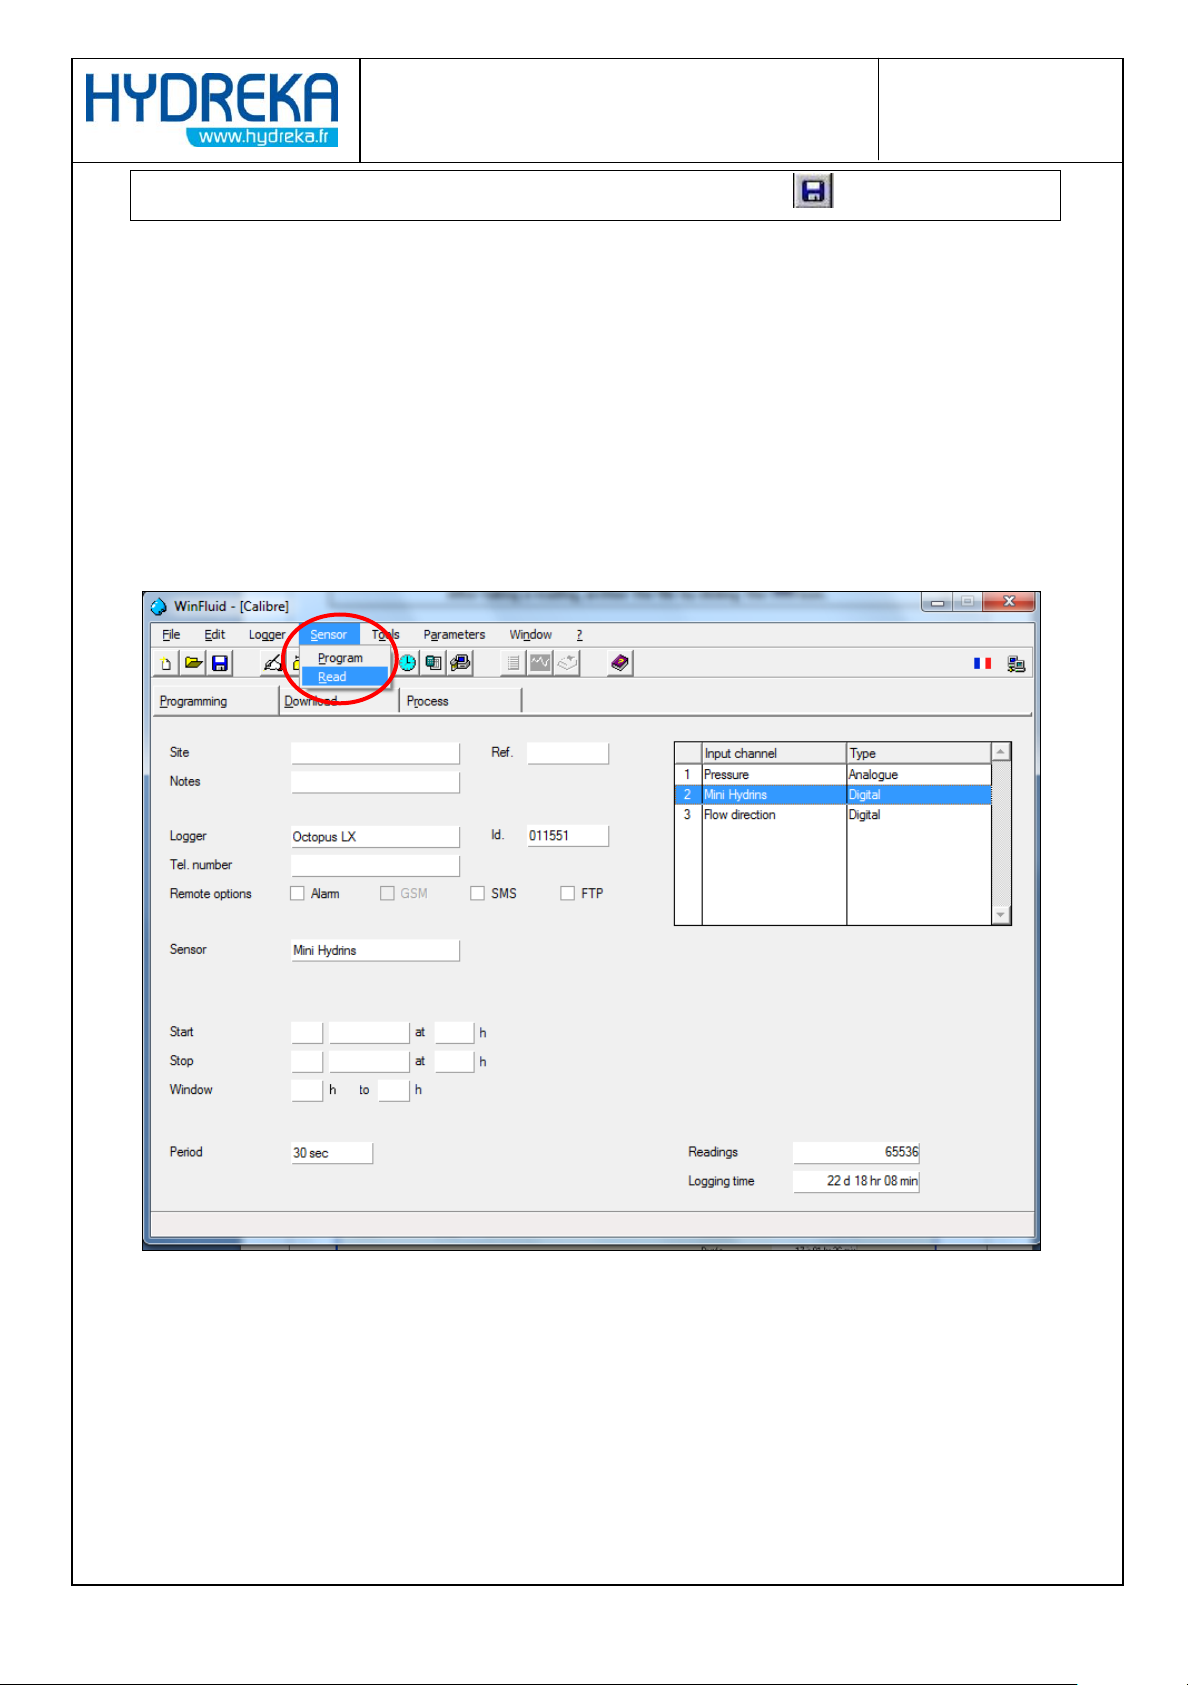
Click Sensor > Read
Figure 17: Retrieval of the flow meter programming from the main Winfluid screen
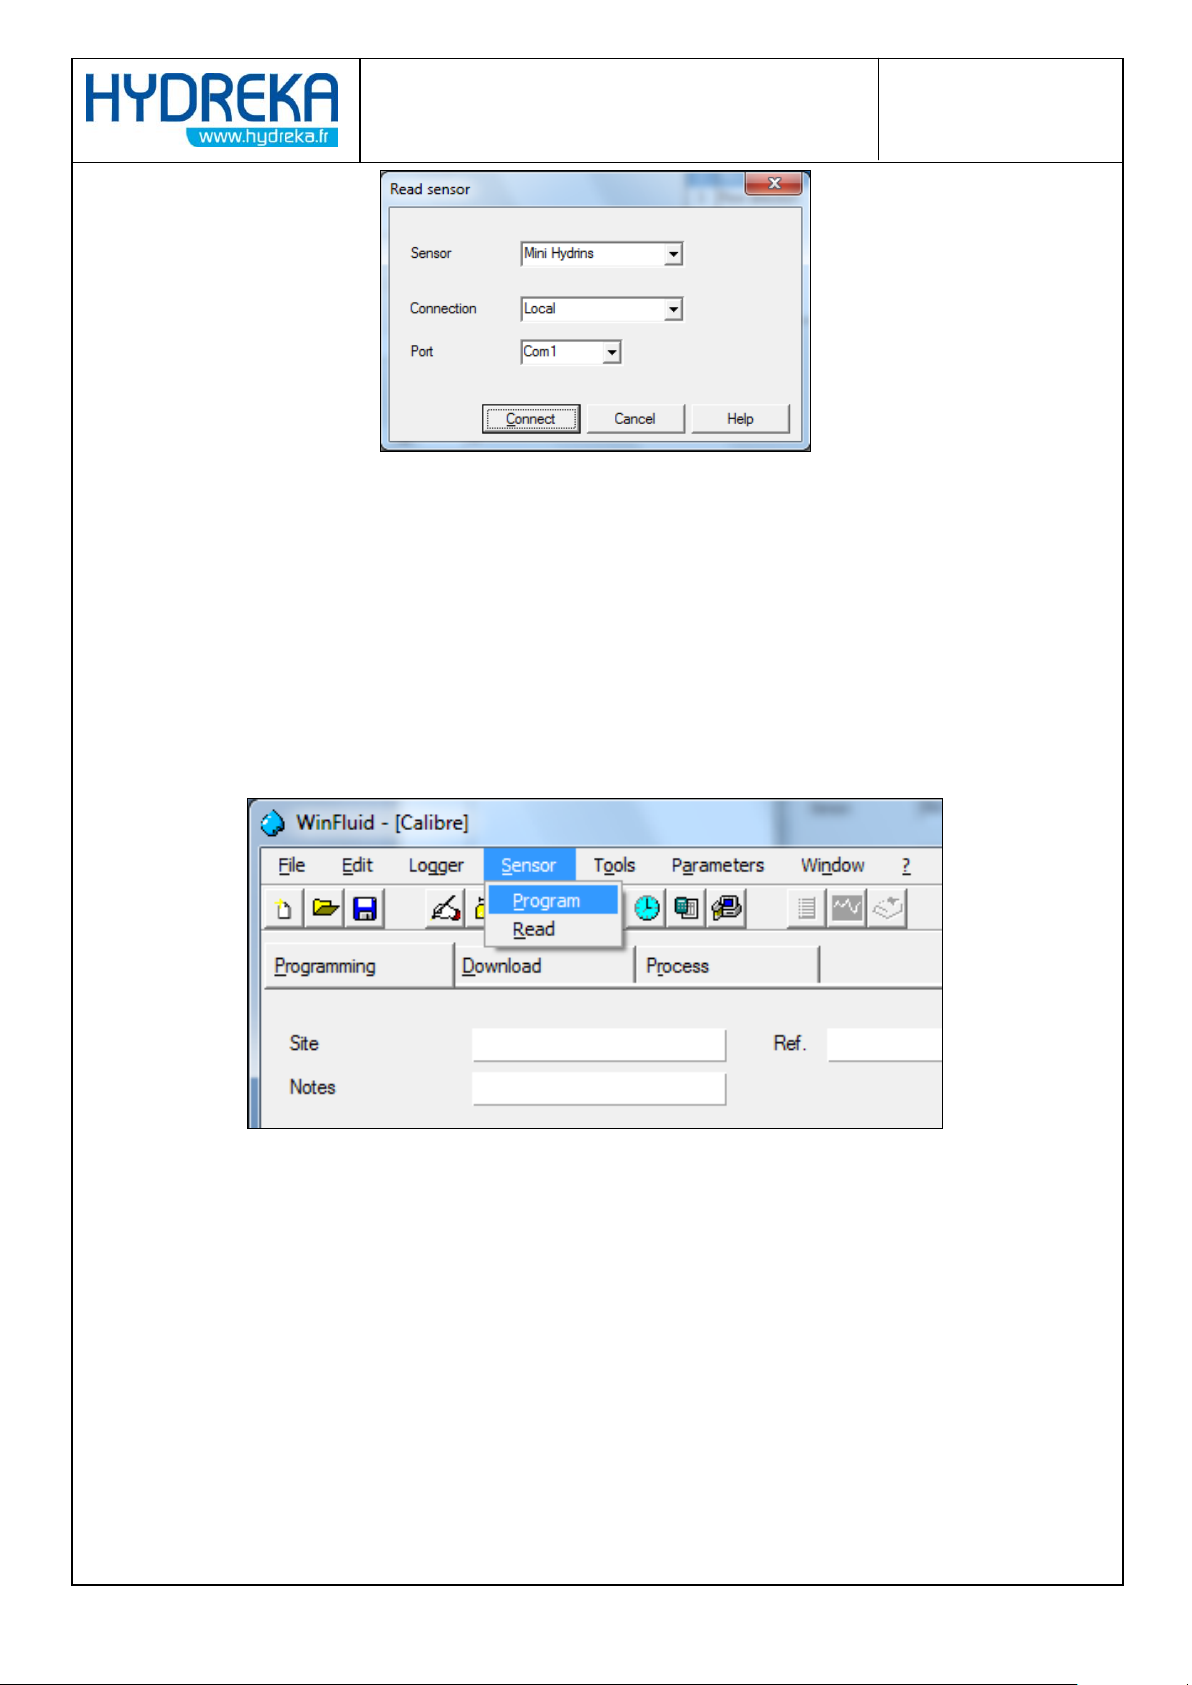
A communication configuration window is displayed
Page 18
Page 18/77
HydrINS 2 / HydrINS 2 Mini flow meter
Programming of data logging with Winfluid
Figure 18: Retrieval of the flow meter programming from the main Winfluid screen
Click Connection. When communication has been established, the data is loaded into Winfluid. You
can look at the data by double-clicking the input channel from the Winfluid home screen, in the
Sensor tab.
3.2 Programming of a HydrINS 2 / HydrINS 2 Mini flow meter
Make a direct connection between computer and flow meter or between computer and display using
a CC_HYDA3 or CC_HYDA3S cable.
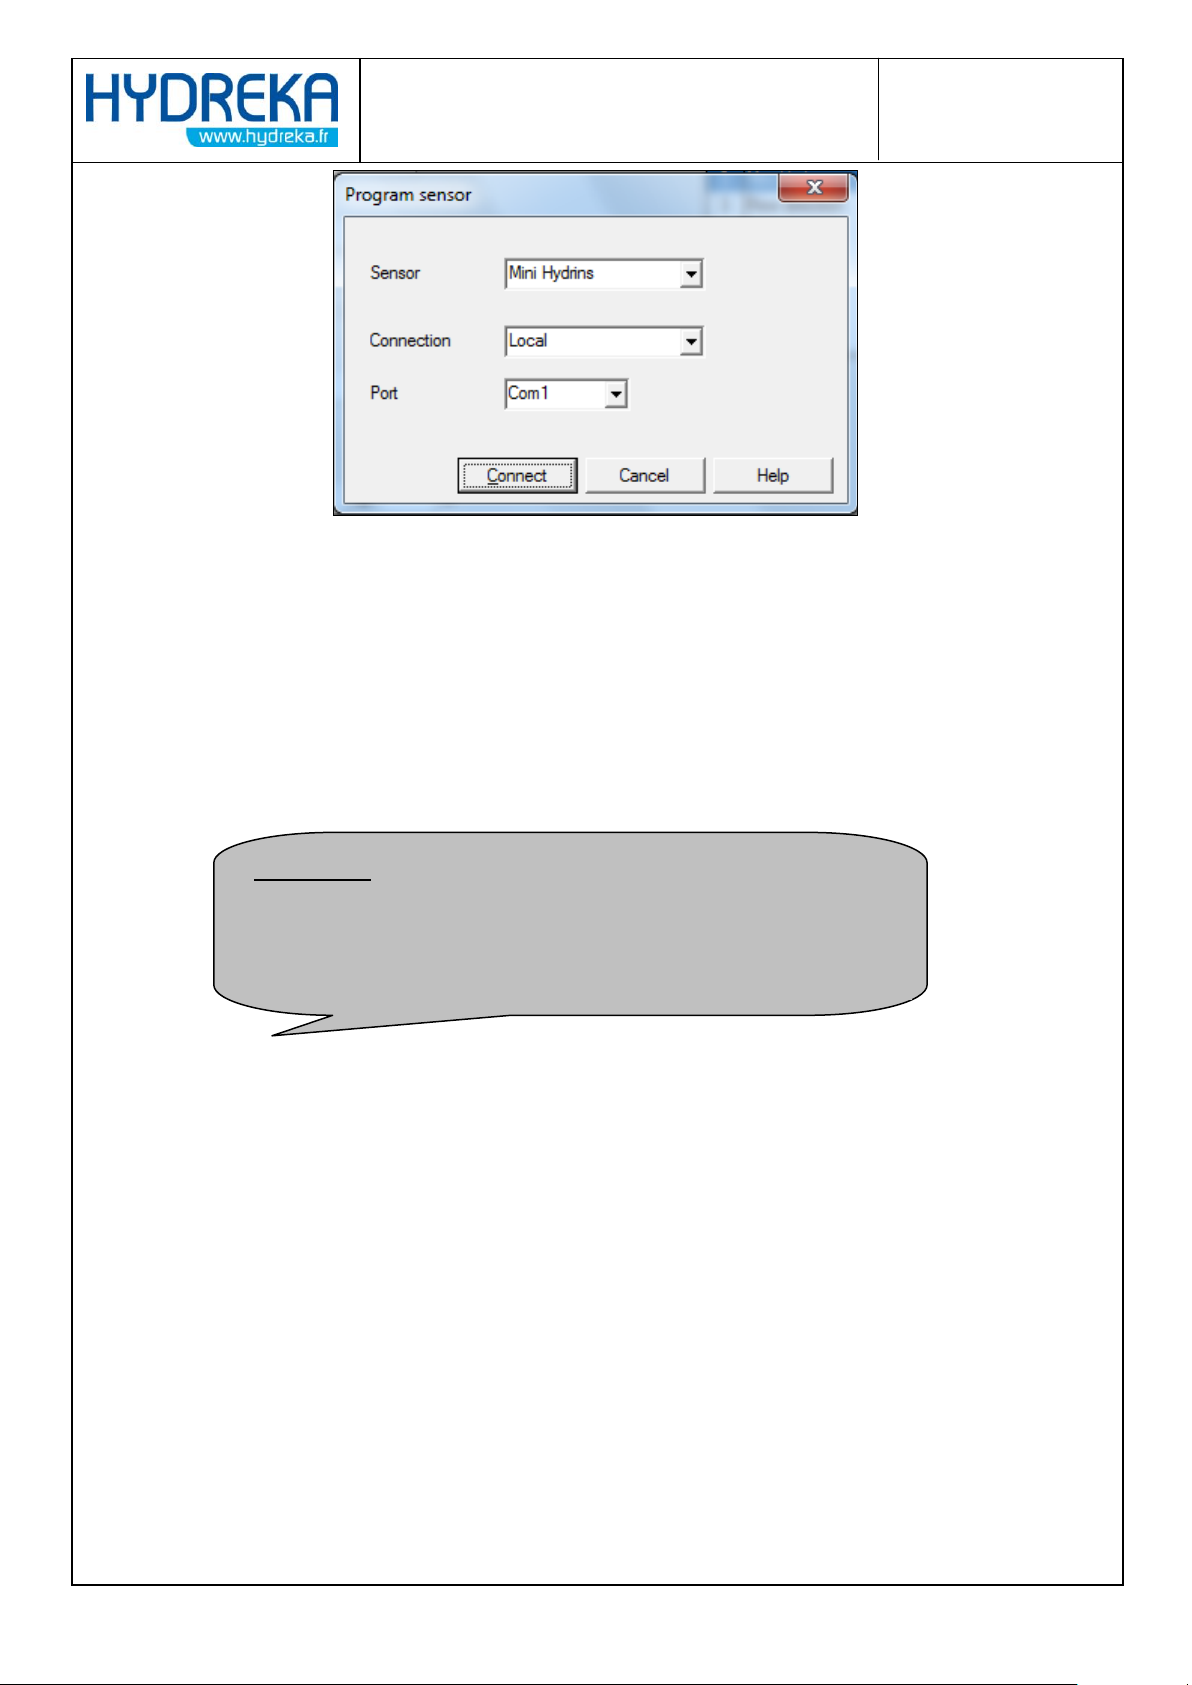
Click Sensor > Program
Figure 19: Programming the flow meter from the main Winfluid screen
A communication configuration window is displayed
Page 19
Page 19/77
HydrINS 2 / HydrINS 2 Mini flow meter
Programming of data logging with Winfluid
WARNING: ADVANCED programming mode should be used by
experienced HydrINS 2 / HydrINS 2 Mini users only. HYDREKA cannot
be held responsible for the accuracy of measurements if parameters
have been changed in Advanced mode
Figure 20: Programming the flow meter from the main Winfluid screen
Click Connect to establish communication with the sensor. The configuration data will be transferred
into the flow meter memory. Otherwise, click Cancel to return to the main screen
4 Advanced programming of the HydrINS2 probe
4.1 Programming of HydrINS 2 and HydrINS 2 Mini flow meters in
advanced mode
To program the HydrINS 2 / HydrINS 2 Mini probe in Advanced mode, return to the flow meter digital
channel programming step in the Sensor tab (section 2.1.2.1).
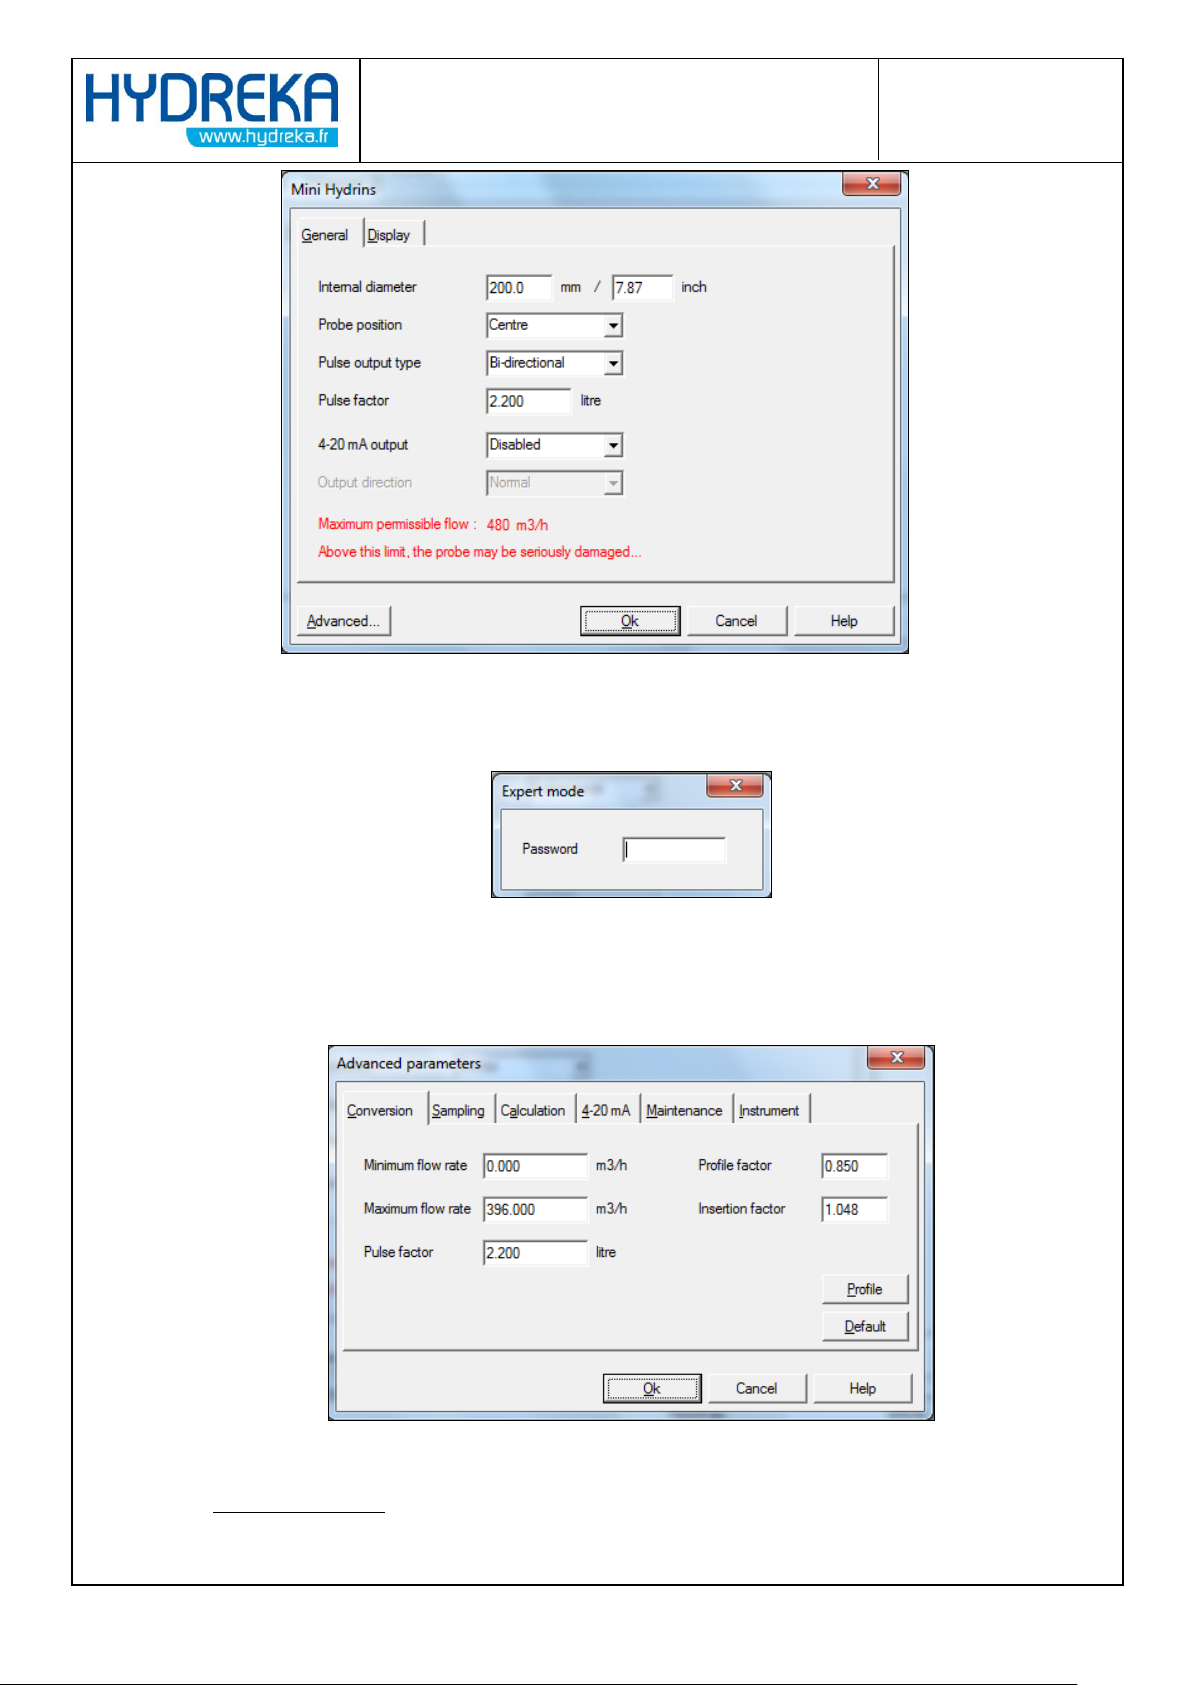
Click the Advanced button in the HydrINS probe programming window.
Page 20
Page 20/77
HydrINS 2 / HydrINS 2 Mini flow meter
Programming of data logging with Winfluid
Figure 21: Position of the Advanced button in the flow meter programming window
A password input window is displayed:
Figure 22: Password input window
Enter the password 'HydrINS' to go into Advanced mode (the password is not case-sensitive).
4.1.1 Conversion tab
Minimum flow rate: Flow rate that corresponds to zero pulse frequency
Figure 23: Advanced Mode – Conversion Tab
Page 21
Page 21/77
HydrINS 2 / HydrINS 2 Mini flow meter
Programming of data logging with Winfluid
Maximum flow rate: Flow rate that corresponds to the maximum pulse frequency of the
device (50 Hz). This maximum flow rate cannot be less than the flow rate for the minimum
pulse weight, and cannot exceed the maximum allowable flow rate indicated in red.
Pulse factor: Volume in litres corresponding to a pulse emitted by the sensor. This is
calculated so that the frequency will not exceed 50 Hz at maximum flow rate. When a data
logger is being used, when defining the recording period or entering a new pulse weight, if
this period is too long, there might be too many pulses to store in the event of maximum
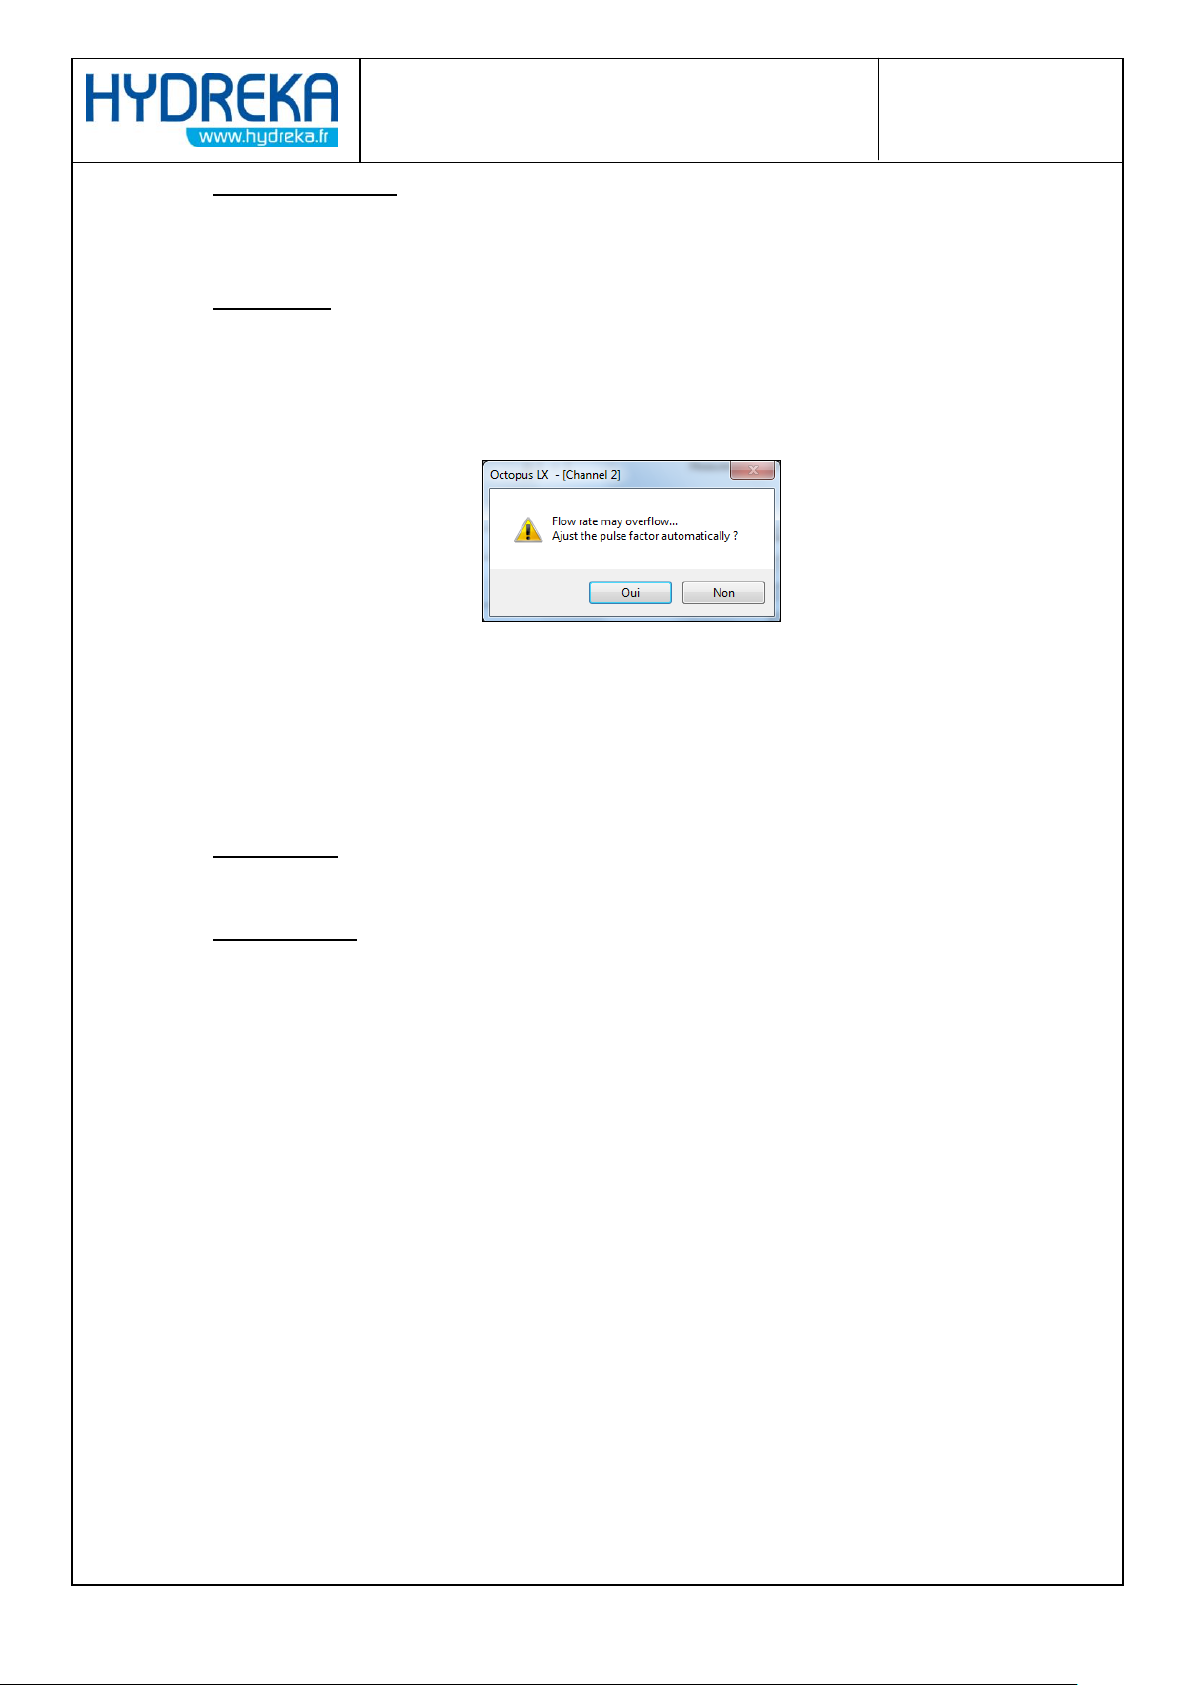
flow rate. In this case, the following warning message is displayed:
Figure 24: Flow signal saturation warning window
In this case, it is preferable to allow Winfluid to adjust the pulse weight automatically, and
click Yes. If you wish to keep the old pulse weight, click No, but in this case it is preferable to
reduce the recording period to avoid an overflow, which would lead to false negative
calculations.
Profile factor: Correction factor applied to the real velocity, according to the profile of the
pipe, to obtain the mean velocity
Insertion factor: Correction factor applied to the measured velocity, according to the position
of the probe in the pipe, to obtain the actual velocity
Two buttons are available on the right-hand side of the window:
The Profile button provides access to the velocity profile creation program.
The Default button restores the default settings of the fields in the Conversion tab.
Page 22
Page 22/77
HydrINS 2 / HydrINS 2 Mini flow meter
Programming of data logging with Winfluid
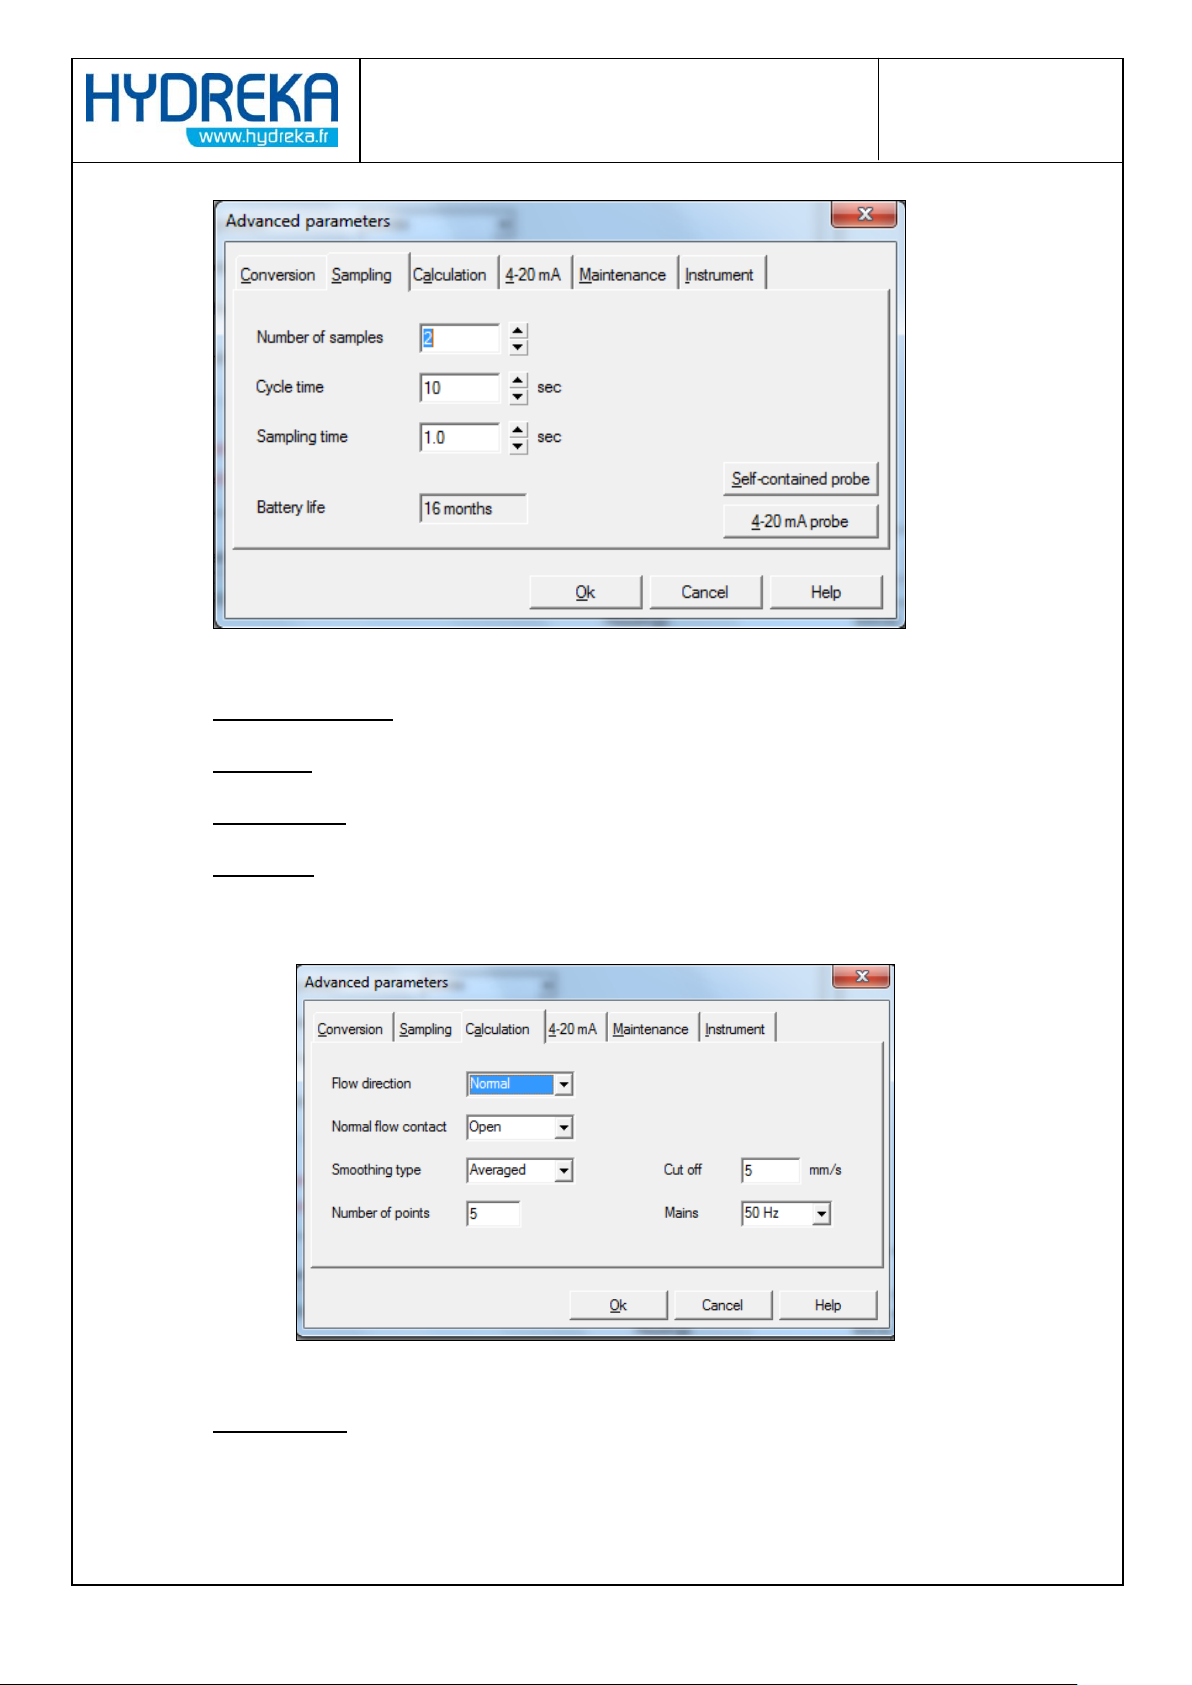
4.1.2 Sampling Tab
Figure 25: Advanced Mode – Sampling Tab
Number of samples: Number of samples in a cycle
Cycle time: Measurement frequency
Sampling time: Sampling frequency
Battery life: This estimate is affected by the sampling parameters and the type of battery
used
4.1.3 Calculation Tab
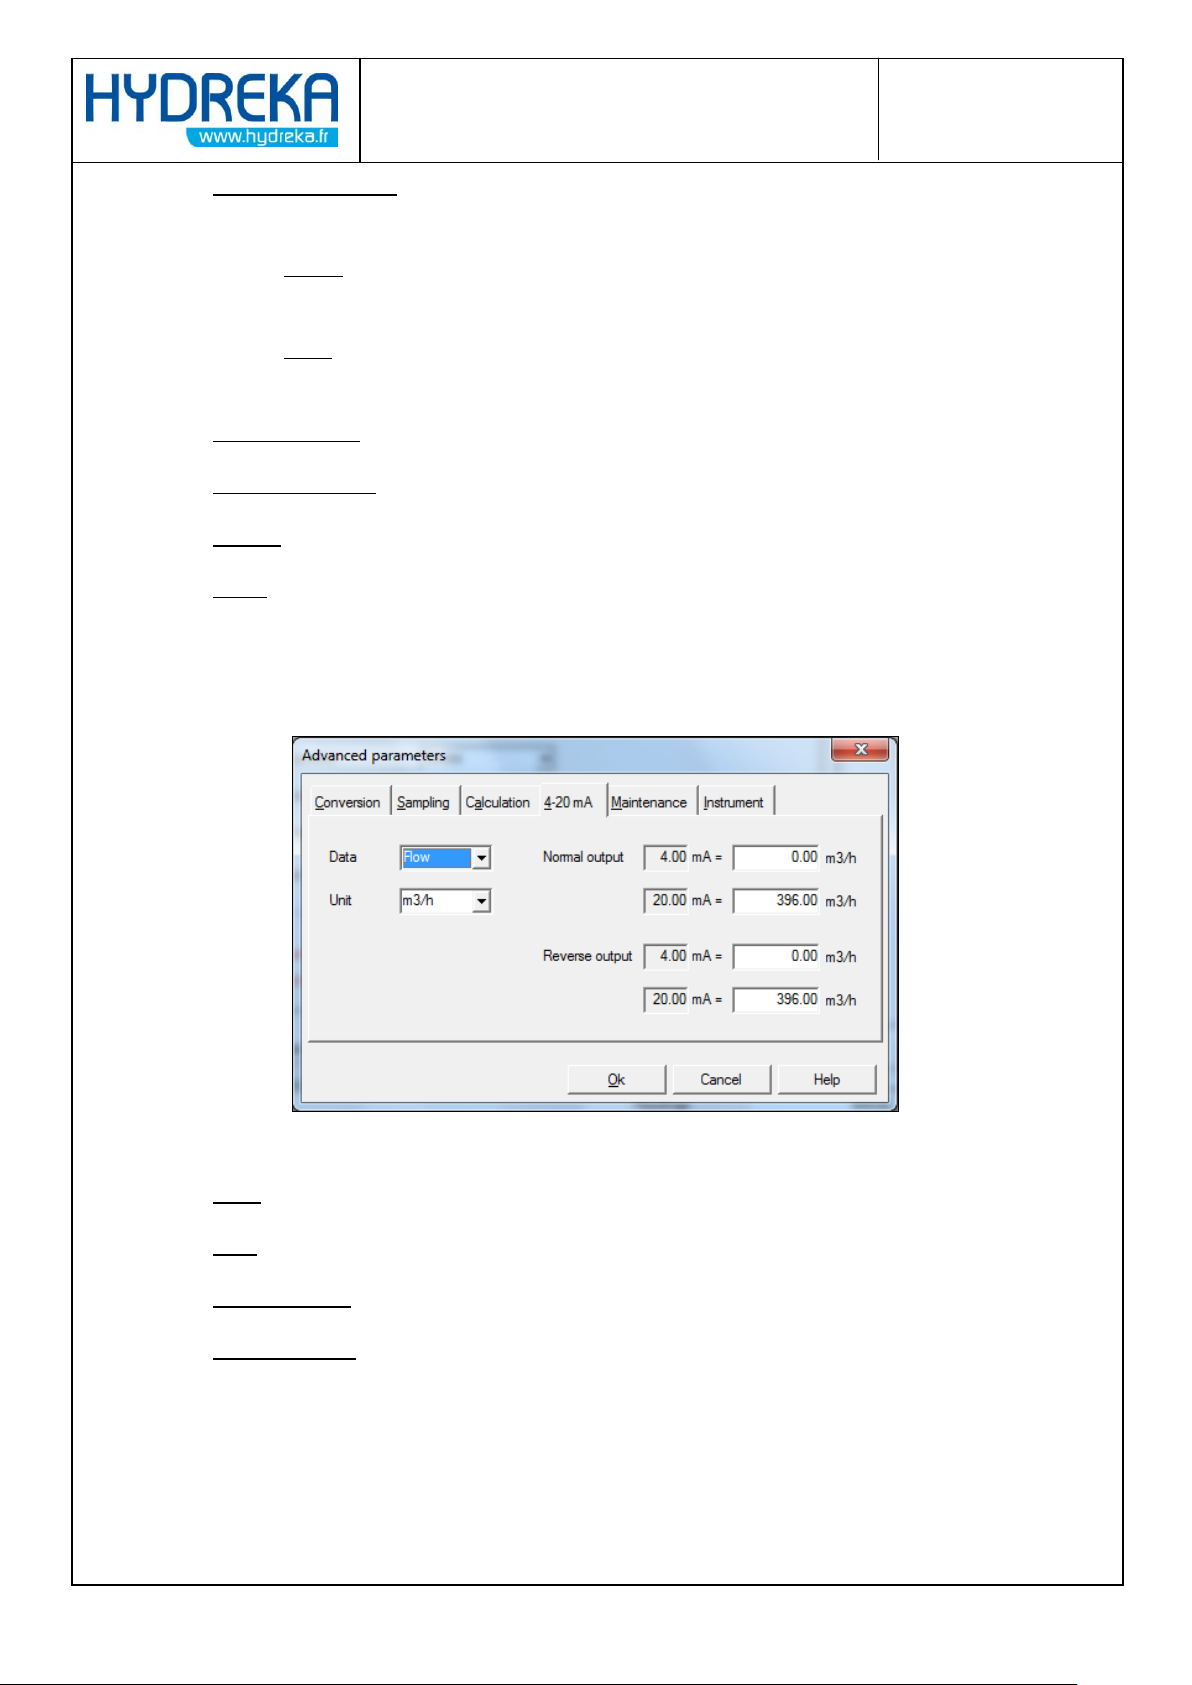
Flow direction: If the flow meter is oriented in the direction of the flow (according to the red
arrow on the head of the flow meter), leave the setting on Normal, but if not, select Reverse.
Figure 26: Advanced Mode – Calculation Tab
Page 23
Page 23/77
HydrINS 2 / HydrINS 2 Mini flow meter
Programming of data logging with Winfluid
Normal flow contact: This option lets you change the status of the direction contact for two-
way measurement:
o Closed: The direction contact is closed if the flow is positive, and open if the flow is
negative.
o Open: The direction contact is open if the flow is positive, and closed if the flow is
negative (default).
Smoothing type: Method for smoothing the measured values (Averaged or Exponential).
Number of points: Number of measurements averaged in the case of Averaged smoothing.
Cut-off: Velocities less than or equal to this value are taken as zero.
Mains: Mains frequency for filtering
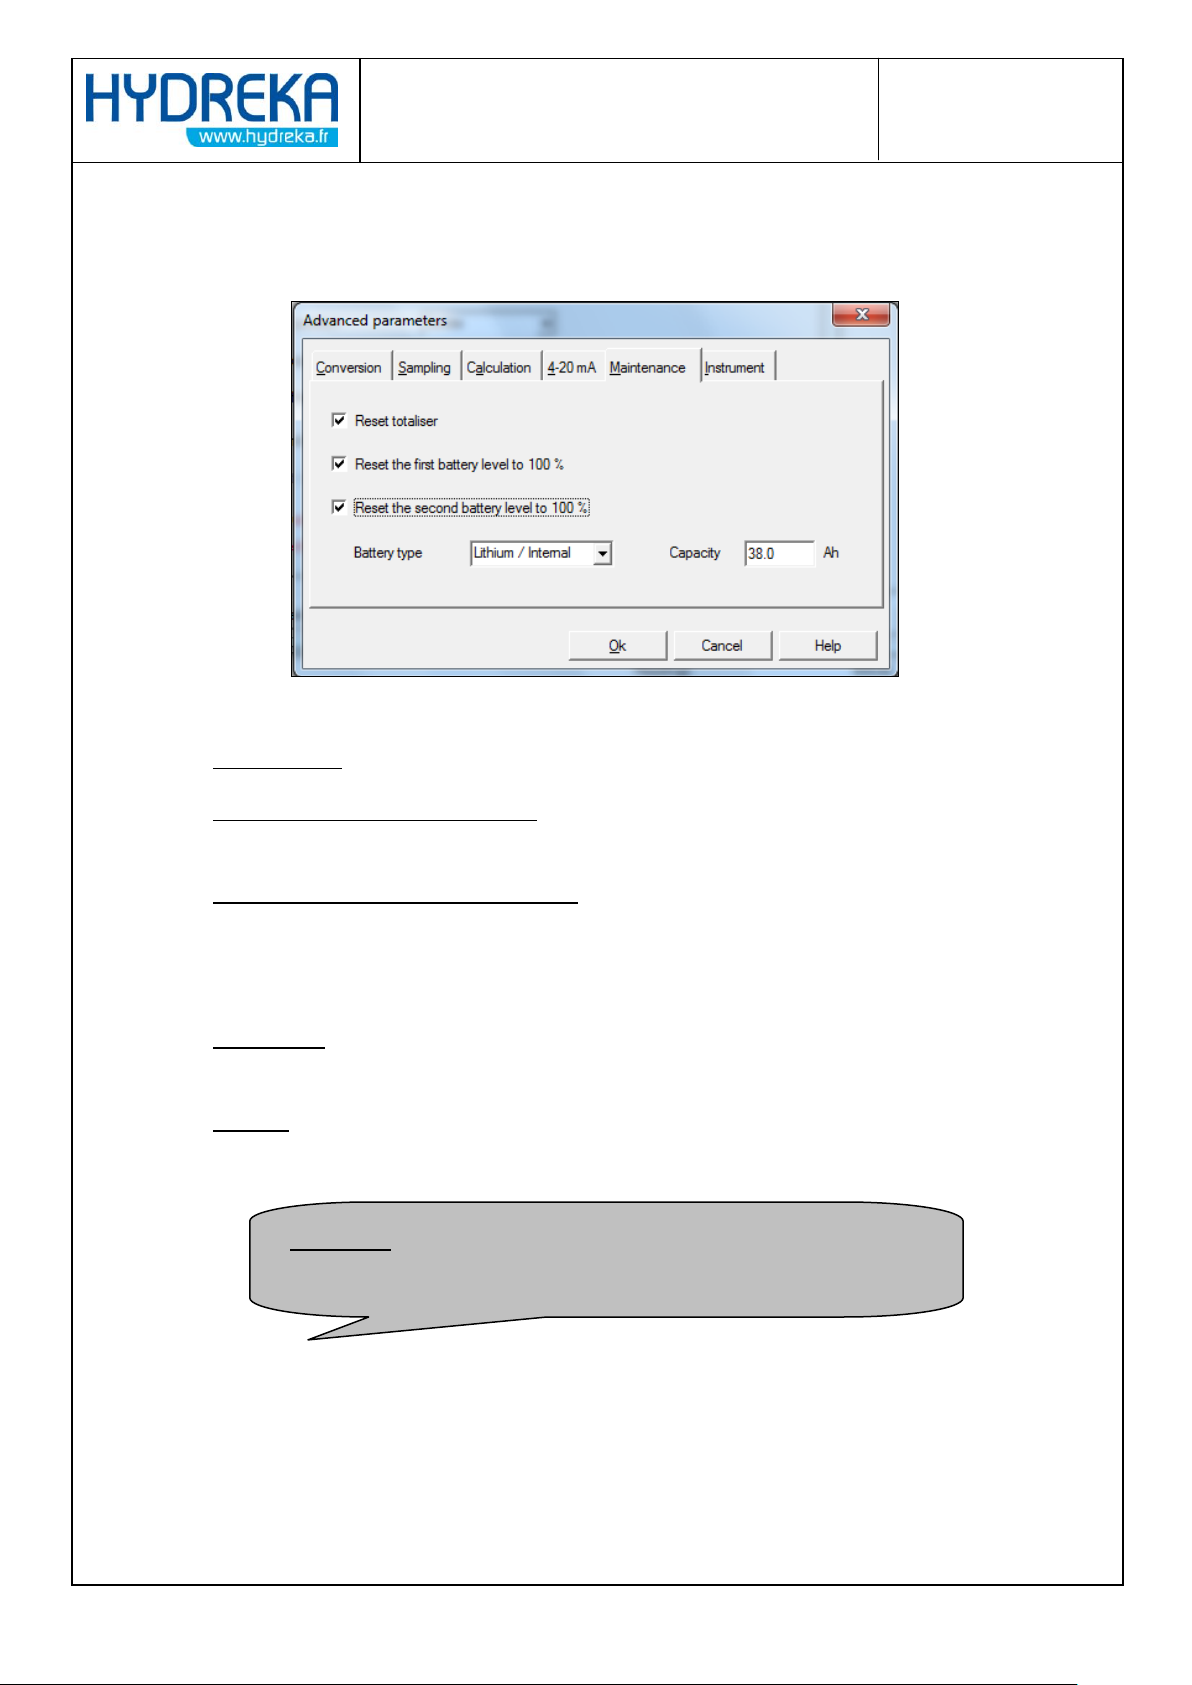
4.1.4 4-20 mA tab
This tab should be used only if a Display C is connected to the HydrINS 2 / HydrINS 2 Mini insertion
flow meter. It is used to adjust the scale of the 4-20 mA output.
Data: Type of data selected for the 4 – 20 mA outputs: Flow rate or Velocity
Unit: Unit for data type Flow rate or Velocity
Normal output: Measurement range for the 4-20 mA output in the forward direction
Reverse output: Measurement range for the 4-20 mA output in the reverse direction
Figure 27: Advanced Mode – 4-20 mA Tab
Page 24
Page 24/77
HydrINS 2 / HydrINS 2 Mini flow meter
Programming of data logging with Winfluid
WARNING: These parameters will be applied only if the flow meter is
reprogrammed.
4.1.5 Maintenance Tab
Figure 28: Advanced Mode – Maintenance Tab
Reset totaliser: Select this to zero the volume totalisers.
Reset the first Battery level to 100%: Select this after replacing Battery Number 1. This 19 Ah
capacity battery is always located in the head of the flow meter.
Reset the second Battery level to 100%: Select this after replacing Battery Number 2. This
battery is located in the head of the flow meter if no display is connected, and its capacity is
19 Ah. Otherwise, it is in the display, and there are different possible types (lithium, alkaline)
and capacities.
Battery type: Type of battery in the display. This parameter can be modified only if 'Return
the level of Battery #2 to 100%' is selected.
Capacity: Total capacity (in Ah) of the display battery. This parameter can be modified only if
'Return the level of Battery #2 to 100%' is selected.
Page 25
Page 25/77
HydrINS 2 / HydrINS 2 Mini flow meter
Programming of data logging with Winfluid
4.1.6 Instrument Tab
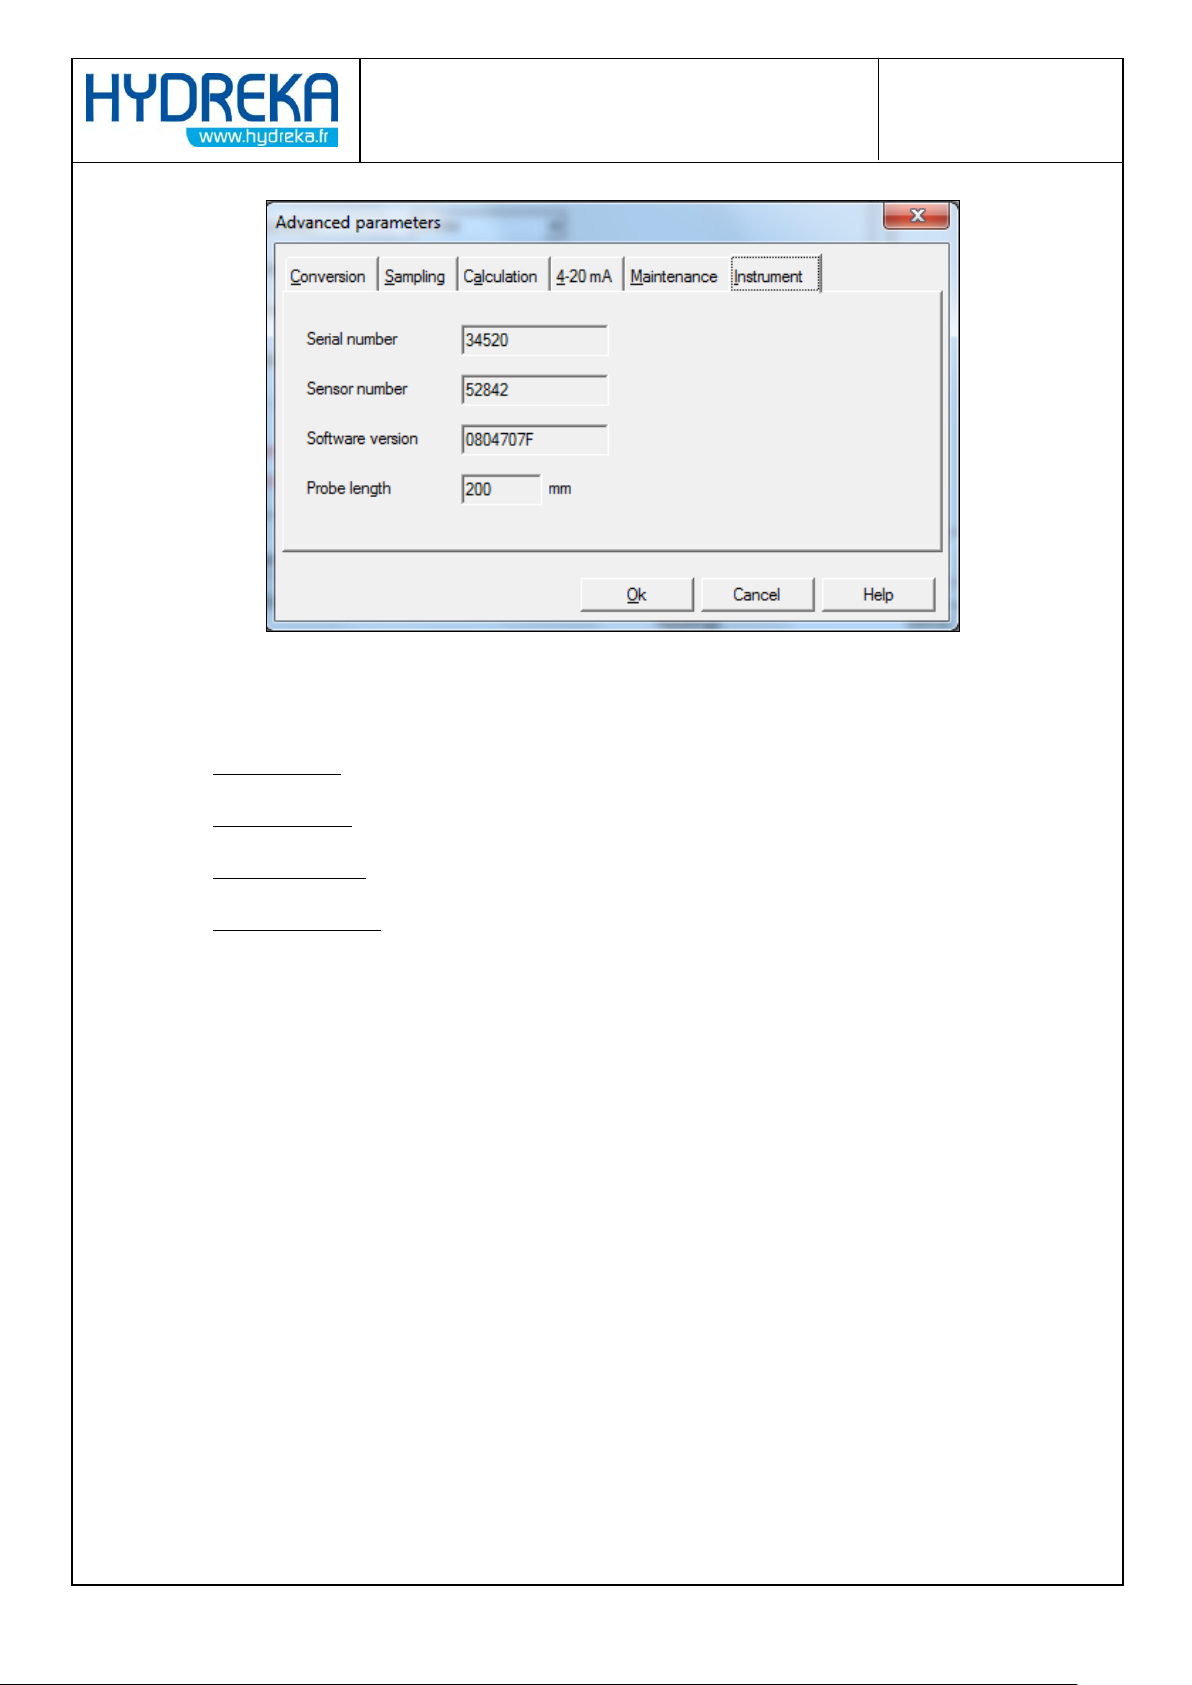
Figure 29: Advanced Mode – Instrument Tab
The identification parameters of the HydrINS 2 probe are as follows:
Serial Number
Sensor Number
Software Version
Probe length (mm)
4.2 Real-time monitoring of recording (to pre-locate leaks by operating
the step-test valves, for example)
Using Winfluid, the acquisition of flow data by the HydrINS 2 / HydrINS 2 Mini flow meter can be
monitored in real time. This allows you to monitor the effect of events occurring in the system on the
flow (e.g. operation of valves, bleeds, temporary consumption by an industrial operator, etc.).
You can do this by using the computer as a data logger. The computer communicates directly with
the flow meter connected to its serial port and records the data on its hard disk.
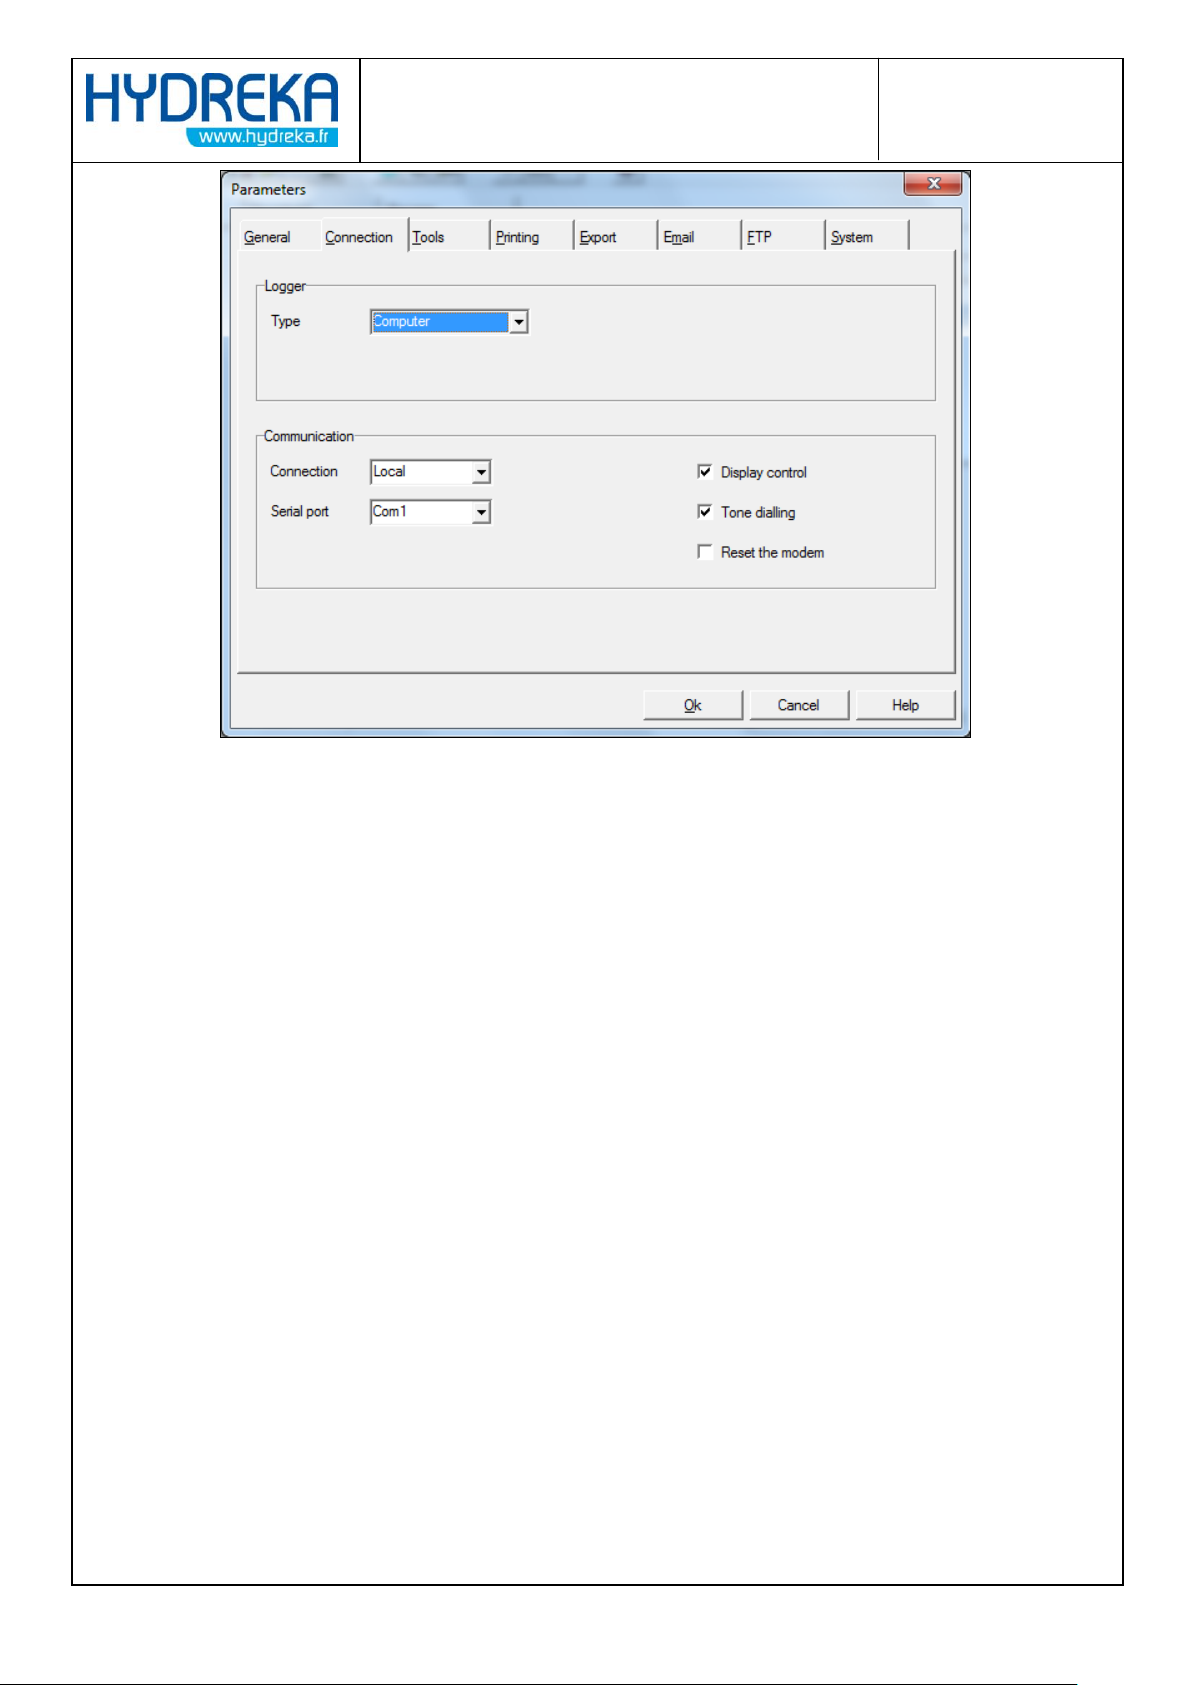
To create this configuration, click Parameters in the menu bar of the Winfluid home screen. In the
window displayed, click the Connect tab.
Page 26
Page 26/77
HydrINS 2 / HydrINS 2 Mini flow meter
Programming of data logging with Winfluid
Figure 30: Selecting the computer as data logger
Select Computer as the data logger, and click OK.
Page 27
Page 27/77
HydrINS 2 / HydrINS 2 Mini flow meter
Programming of data logging with Winfluid
4.2.1 Configuration
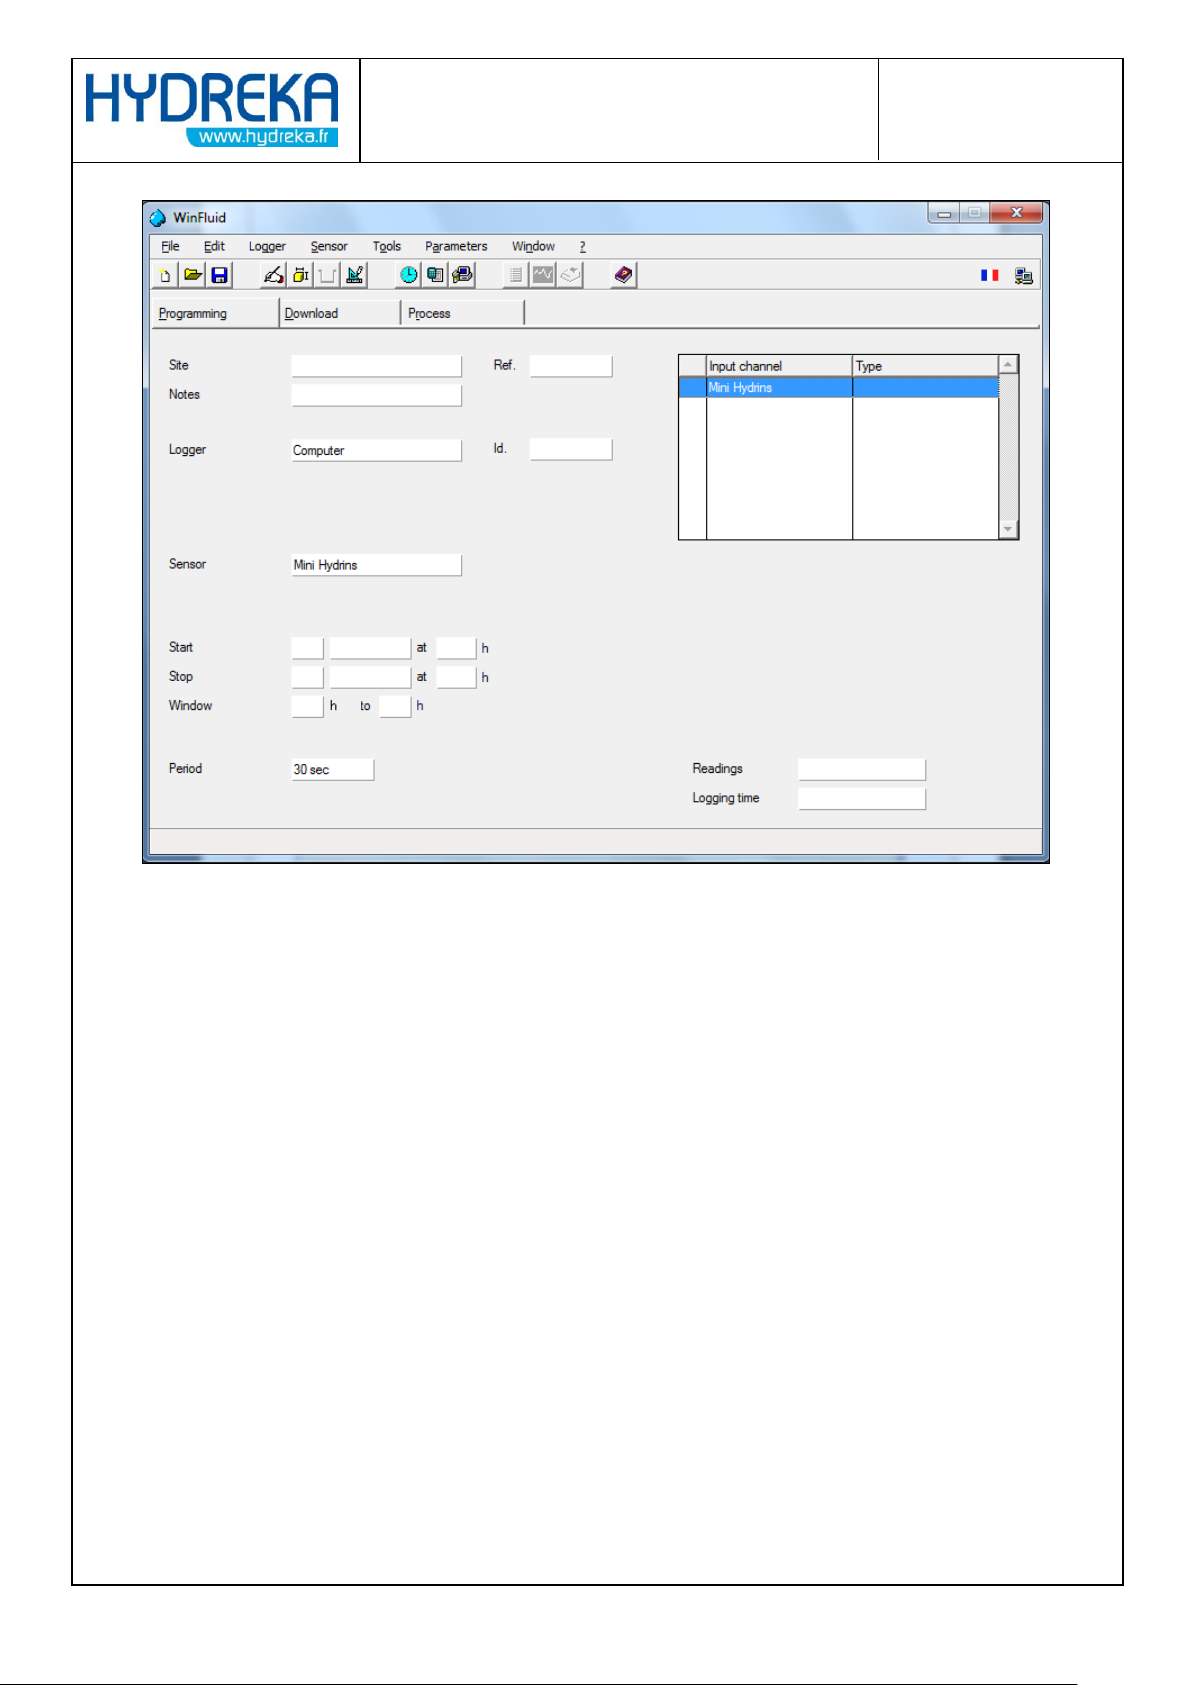
Figure 31: Winfluid home screen with the computer as data logger
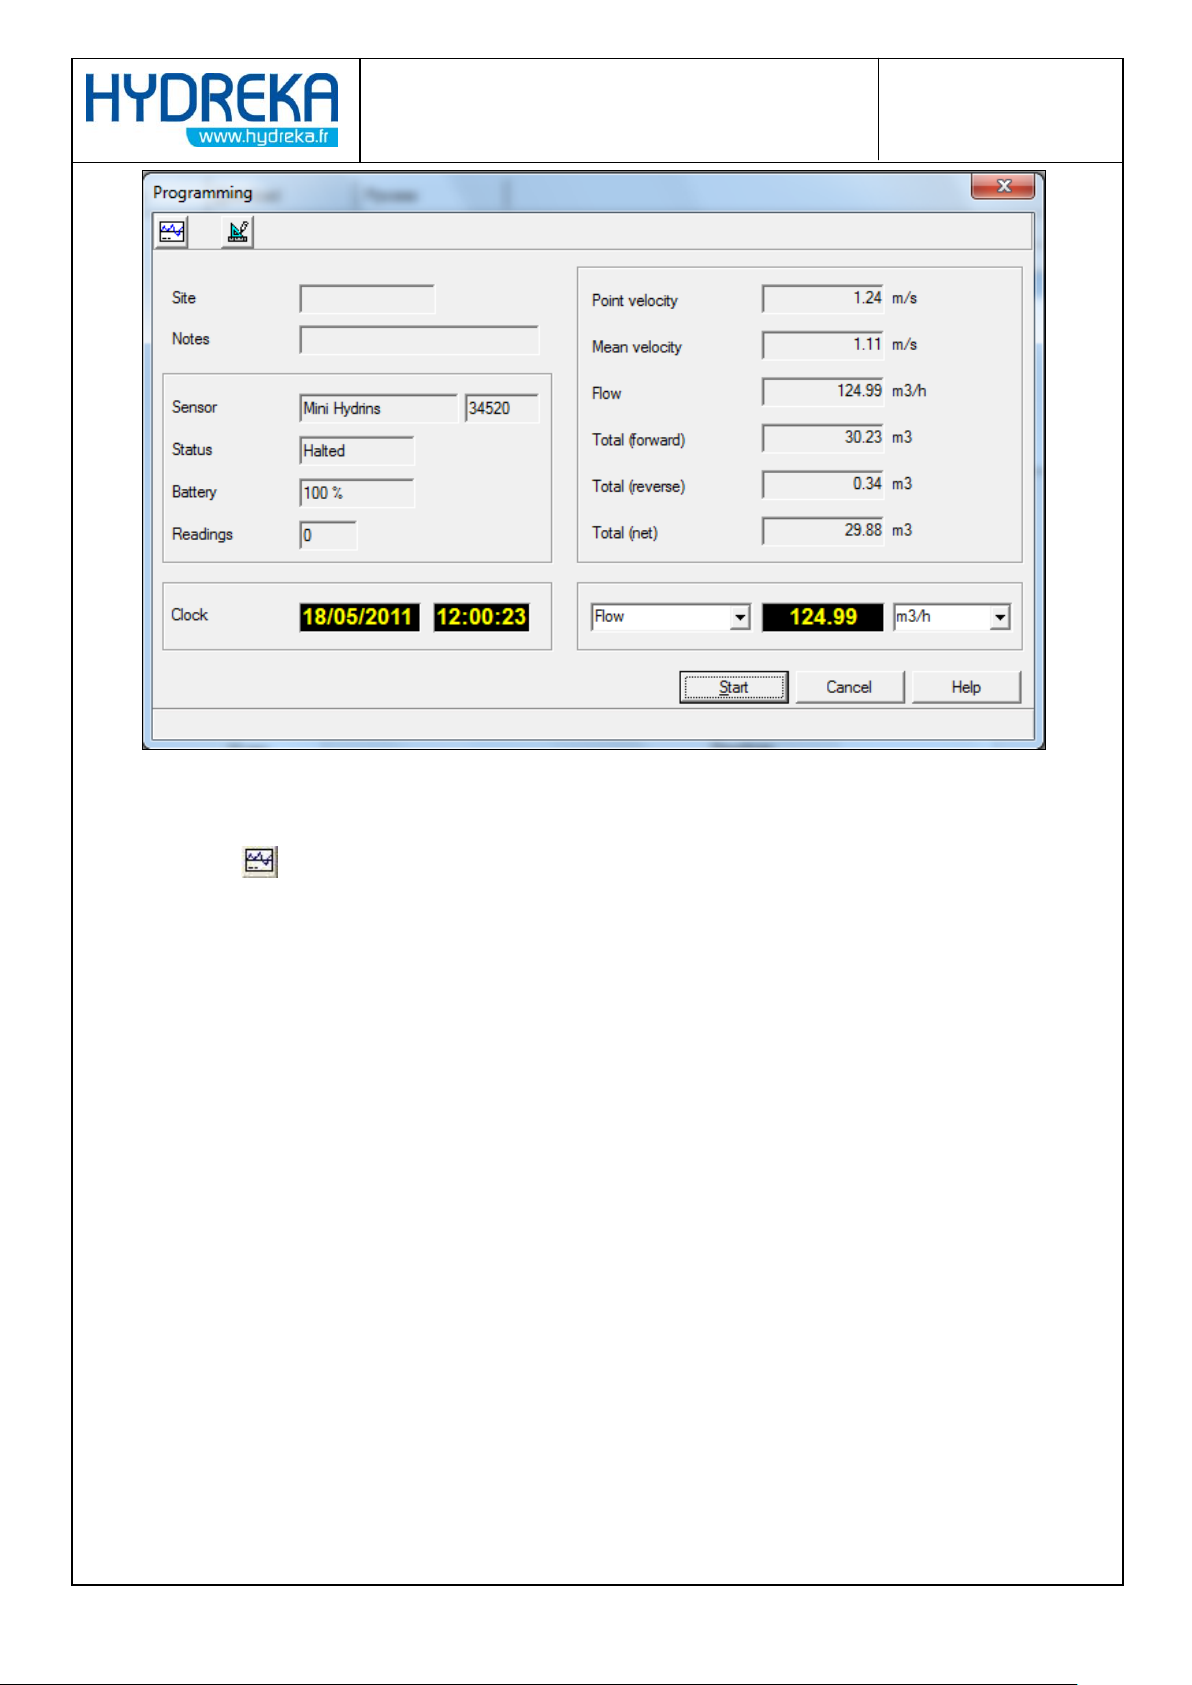
Program the HydrINS 2 probe as before, either in standard mode or advanced mode, until the
measurement status window is displayed after transmission of the configuration to the data logger.
Page 28
Page 28/77
HydrINS 2 / HydrINS 2 Mini flow meter
Programming of data logging with Winfluid
Figure 32: Real-time display in computer mode
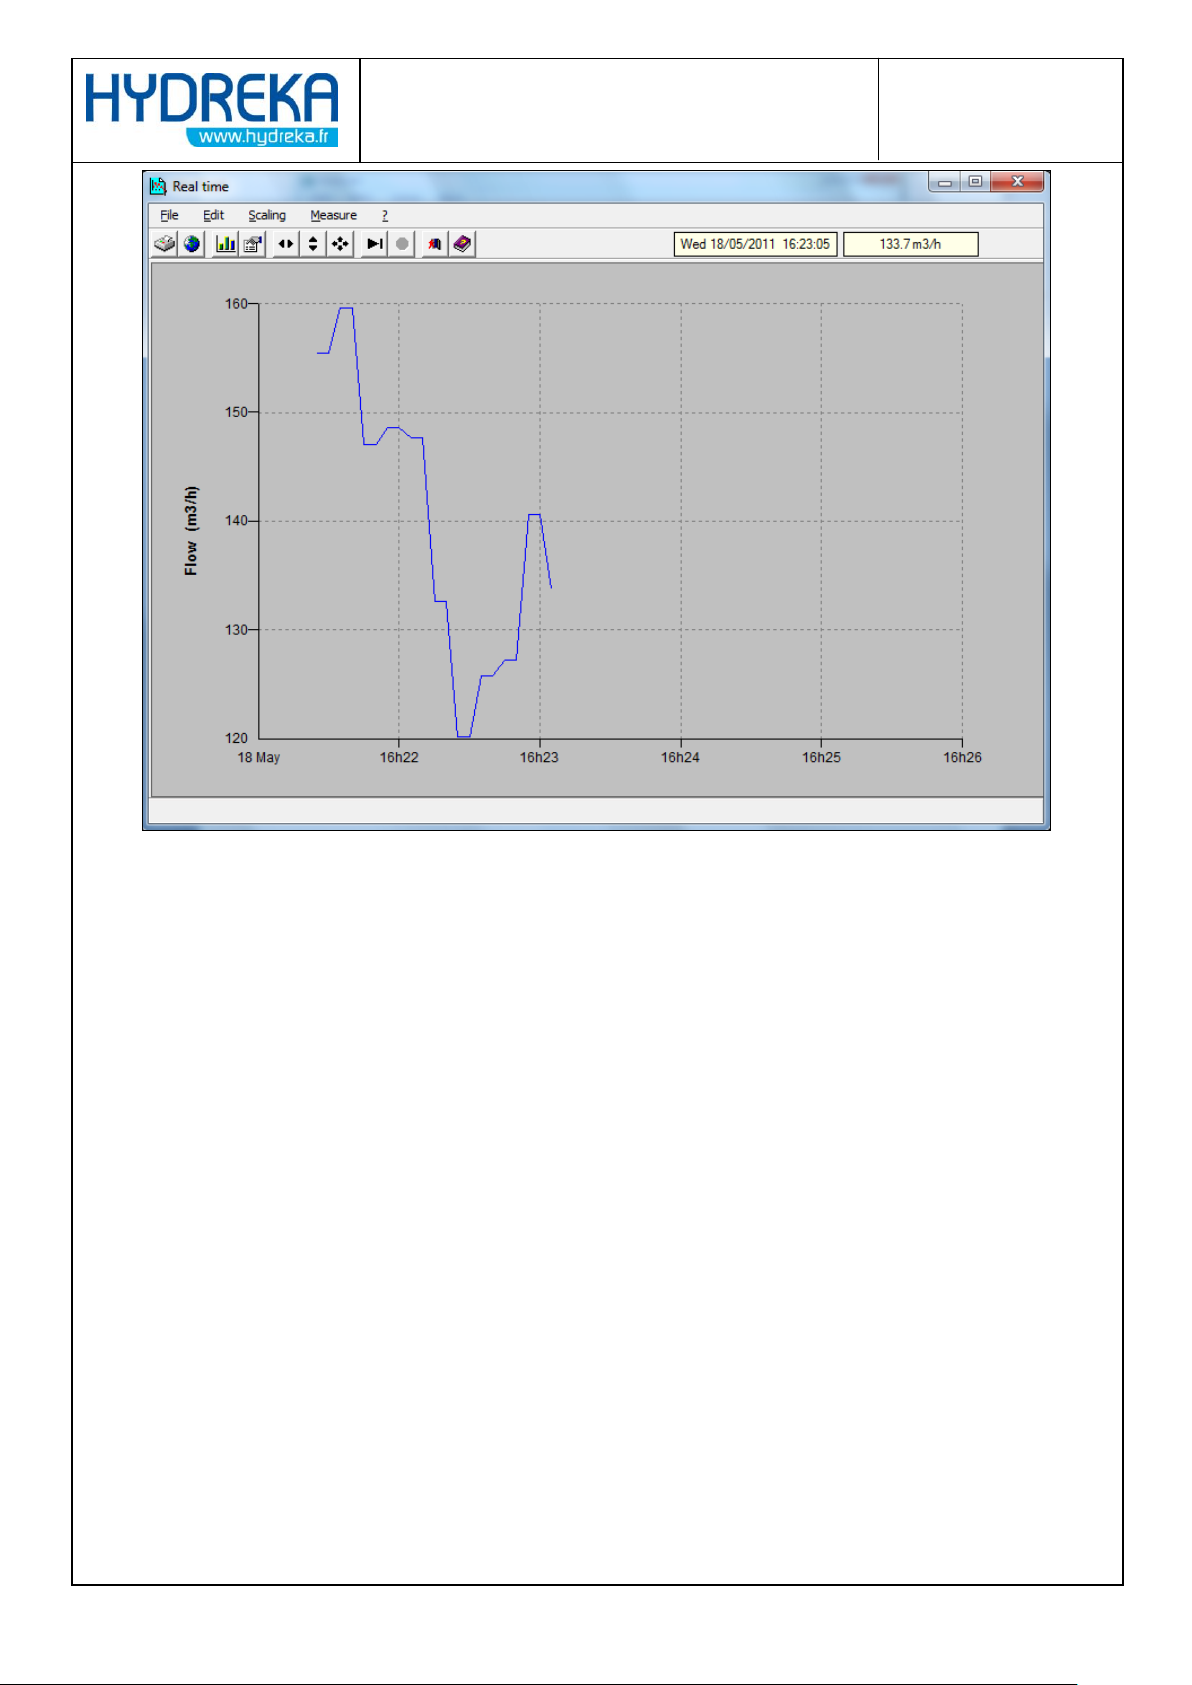
This screen allows you to view the velocity, the totals, and the flow rate instantaneously. Click the
graph icon to view the flow curve in real time.
Page 29
Page 29/77
HydrINS 2 / HydrINS 2 Mini flow meter
Programming of data logging with Winfluid
Figure 33: Flow curve
4.3 Use of the enabled 4-20 mA outputs (Display C)
If a Display C is used and the 4-20 mA outputs must be enabled to be sent to another entity of the
measurement system (remote management, etc.), this function must be enabled during acquisition
programming.
The data logger selected is Computer. The programming PC is connected to Display C via a
CC_HYDA3 or CC_HYDA3S cable and the display is connected to the HydrINS 2/HydrINS 2 Mini probe
configured in Mode 2.
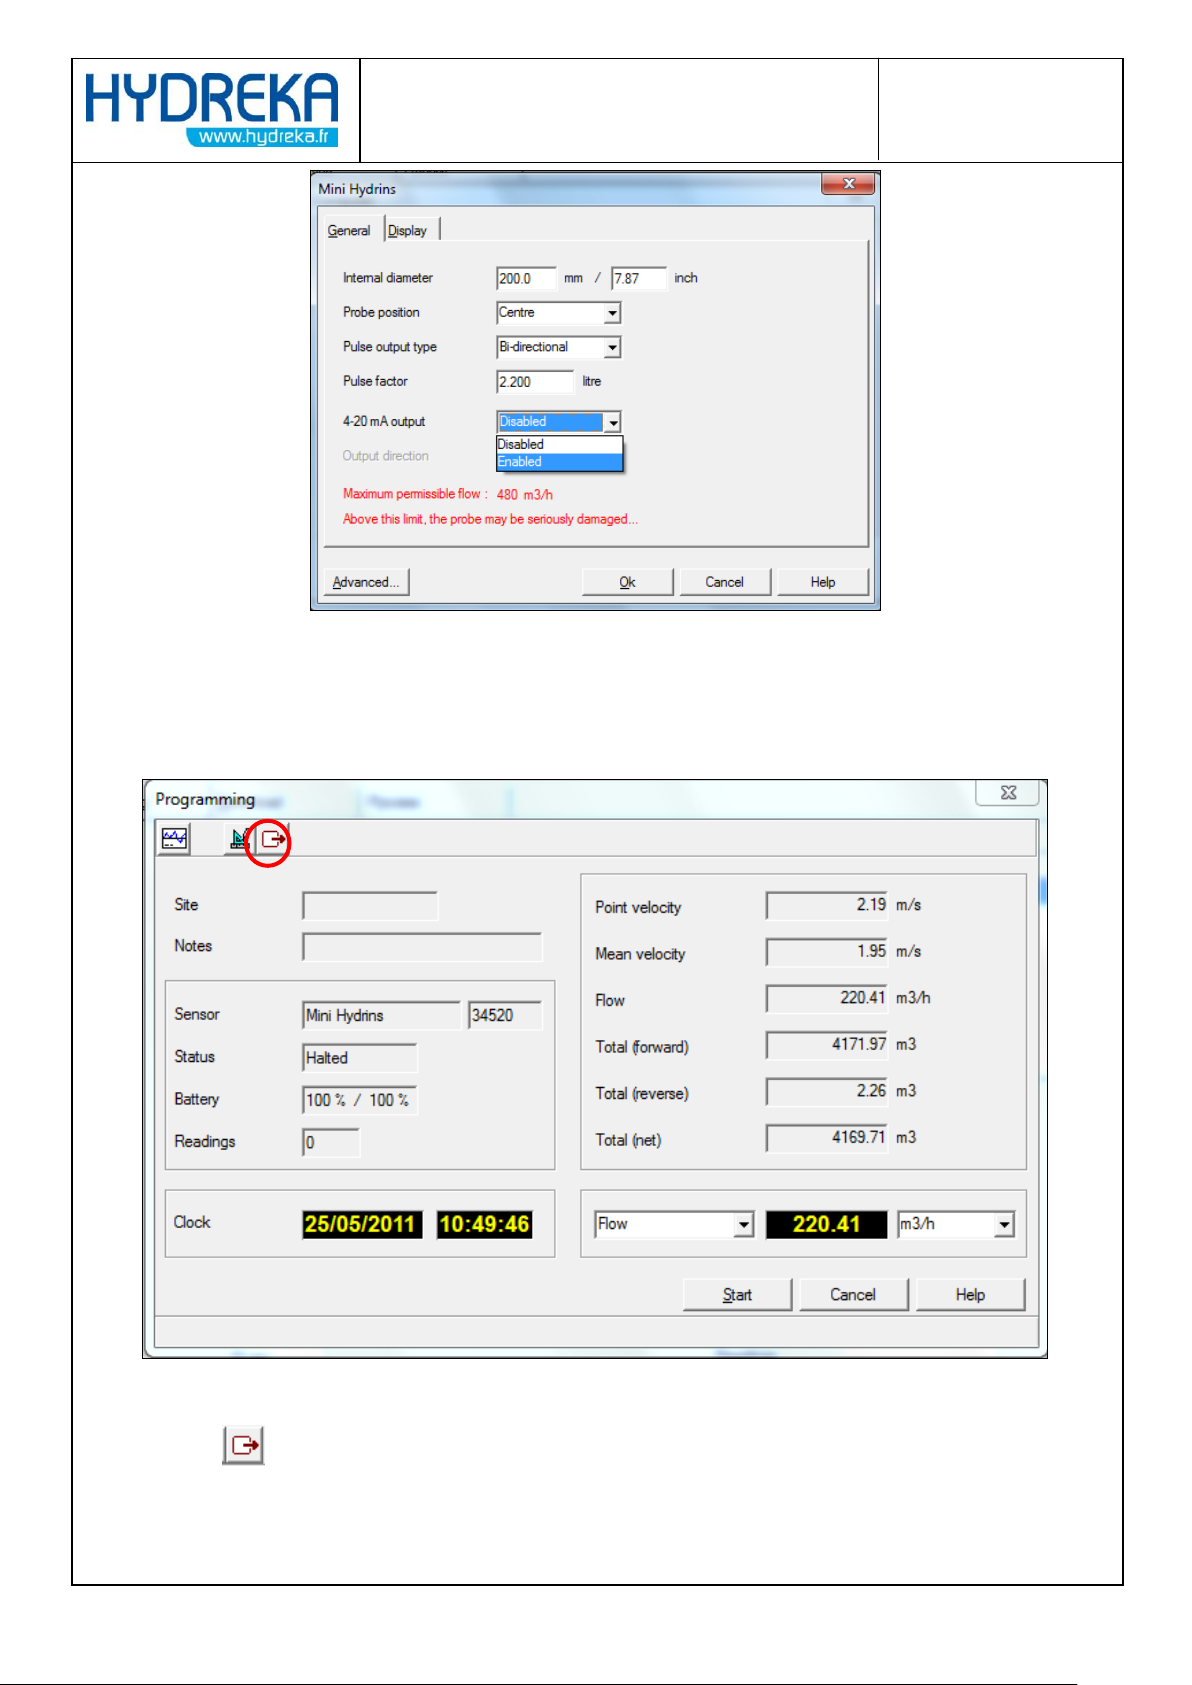
During the programming of recording, the 4-20 mA output must be set to Enabled in the General
probe properties tab:
Page 30
Page 30/77
HydrINS 2 / HydrINS 2 Mini flow meter
Programming of data logging with Winfluid
Figure 34: Enabling the 4-20 mA output of the display during programming
When programming is complete, an additional icon is displayed in the acquisition preview window:
Figure 35: Display C 4-20 mA output calibration icon
Click the icon to display the following window:
Page 31
Page 31/77
HydrINS 2 / HydrINS 2 Mini flow meter
Programming of data logging with Winfluid
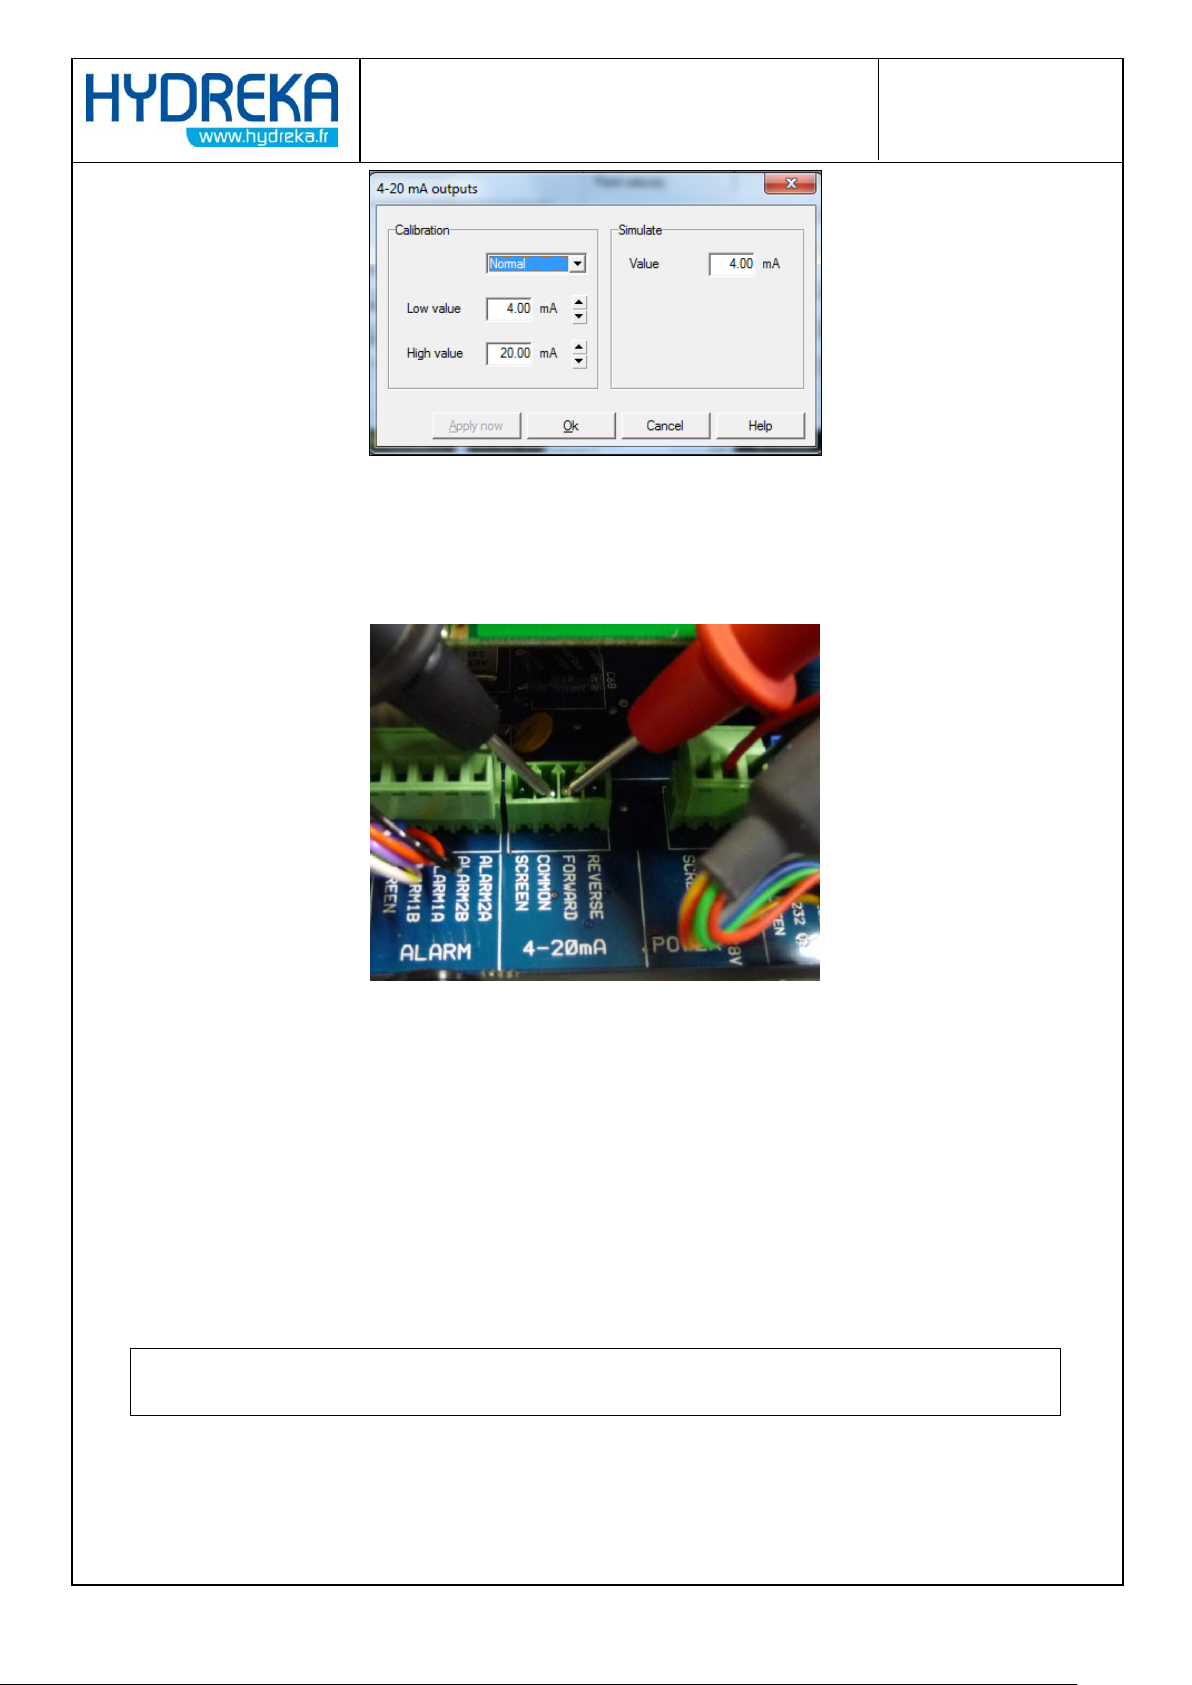
Figure 36: Display C 4-20 mA output calibration icon
This window lets you calibrate the enabled 4-20 mA output.
Connect the output requiring calibration to an ammeter
Figure 37: Checking the 4-20 mA output using an ammeter
Position the cursor on the lowest point, using either the left mouse button or the Tab key on
the keyboard, and enter the current reading seen on the ammeter.
Next, place the cursor on the highest point, and enter the current reading seen on the
ammeter.
Click the 'Apply' button to take the values entered into account.
Place the cursor on the output simulation value field, and check that the value read on the
ammeter matches the value entered.
When the output is correctly calibrated, accept the calibration by clicking OK and launch
acquisition
Page 32
Page 32/77
HydrINS 2 / HydrINS 2 Mini flow meter
Programming of data logging with Winfluid
4.4 Calculating a velocity profile using the HydrINS 2 / HydrINS 2 Mini
probe
4.4.1 Introduction
Creating a velocity profile helps to refine the profile coefficient and therefore obtain the best
possible velocity measurement, giving a preview of the shape of the profile (long or flat front) to
determine whether the flow meter can be installed on the site.
The calculation to determine the mean velocity is performed by numerical integration of the velocity
field in accordance with the ISO 3354-1988 standard. It is recommended that the flow rate should be
constant throughout the measurement.
Before creating a velocity profile, ensure that this is possible without the risk of damage to the
probes due to excessive velocities.
To do this, program the flow meter for insertion at the 1/8 position, insert the probe at 1/8, and take
a velocity measurement (the value is displayed in the status window displayed during real-time
reading – See the section on Real-time reading 2.3).
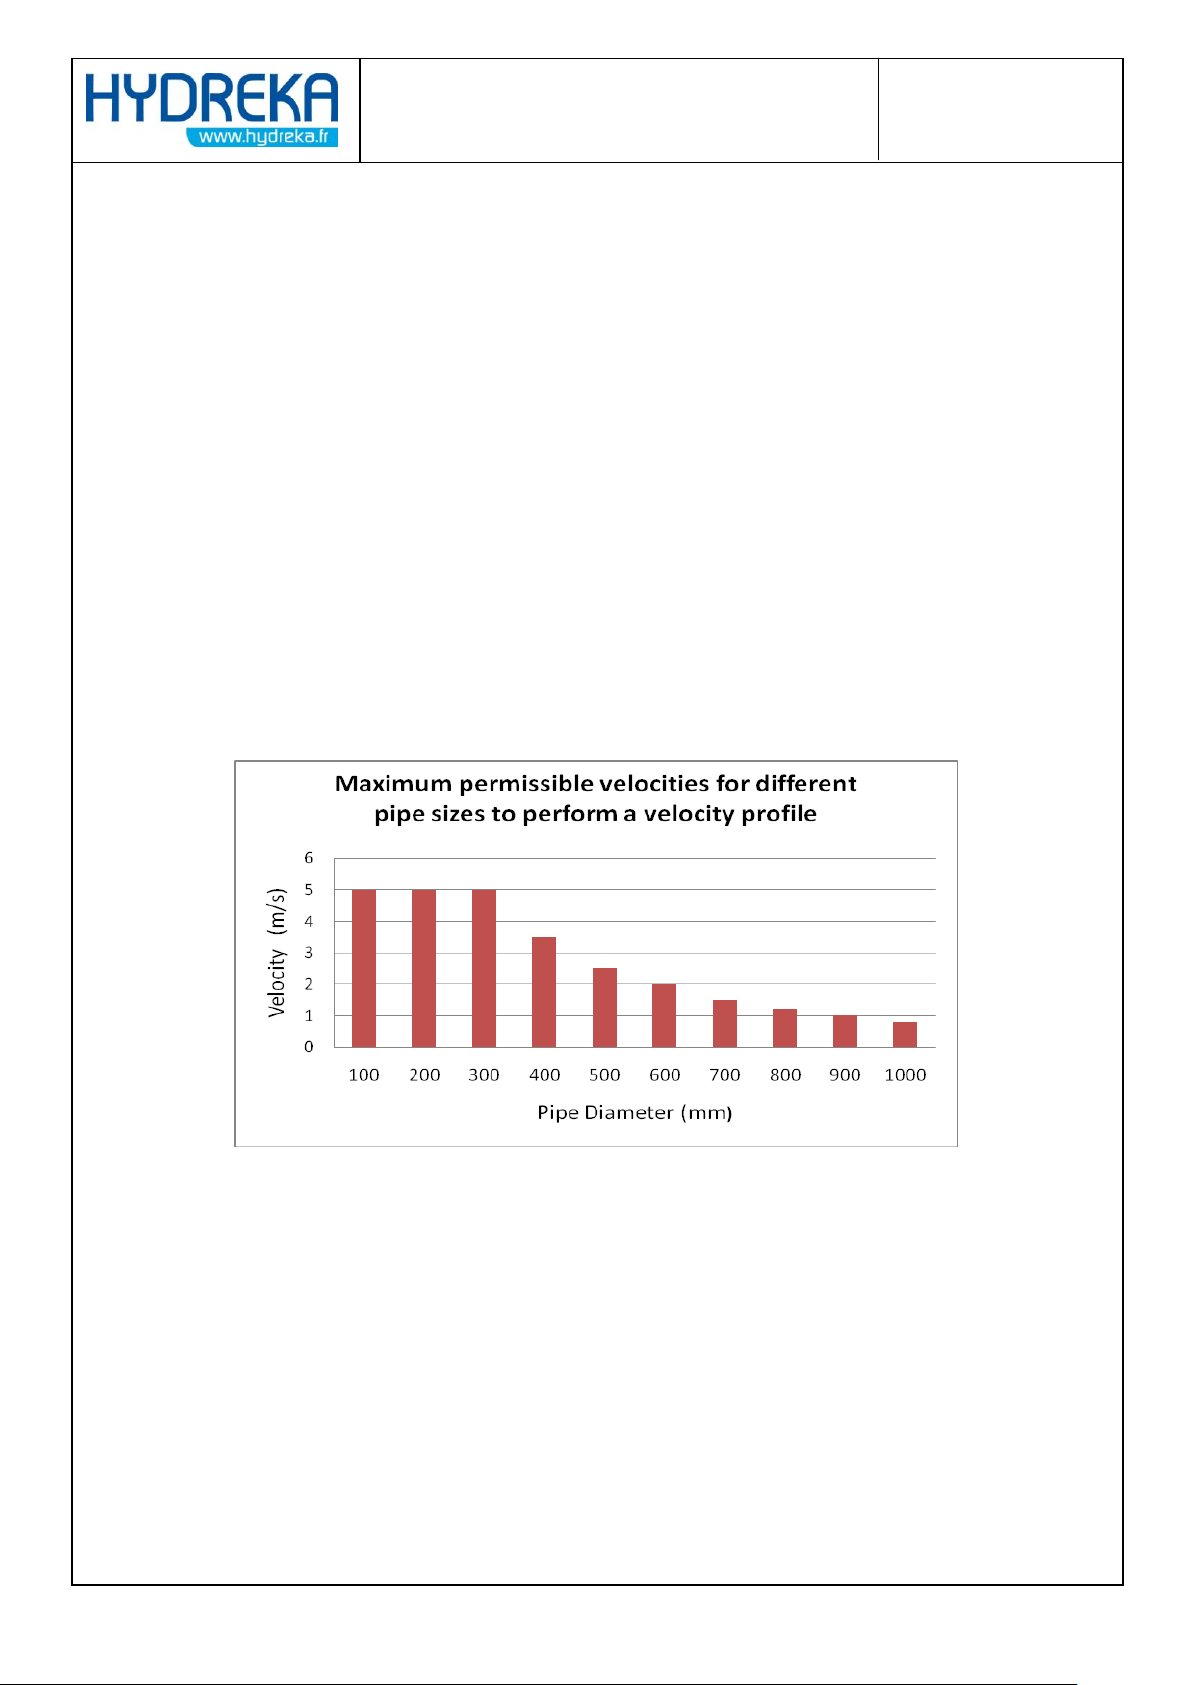
The order of magnitude of the maximum velocities to be observed is indicated on the chart below.
Figure 38: Velocity profile – maximum velocities for the creation of a velocity profile
Page 33
Page 33/77
HydrINS 2 / HydrINS 2 Mini flow meter
Programming of data logging with Winfluid
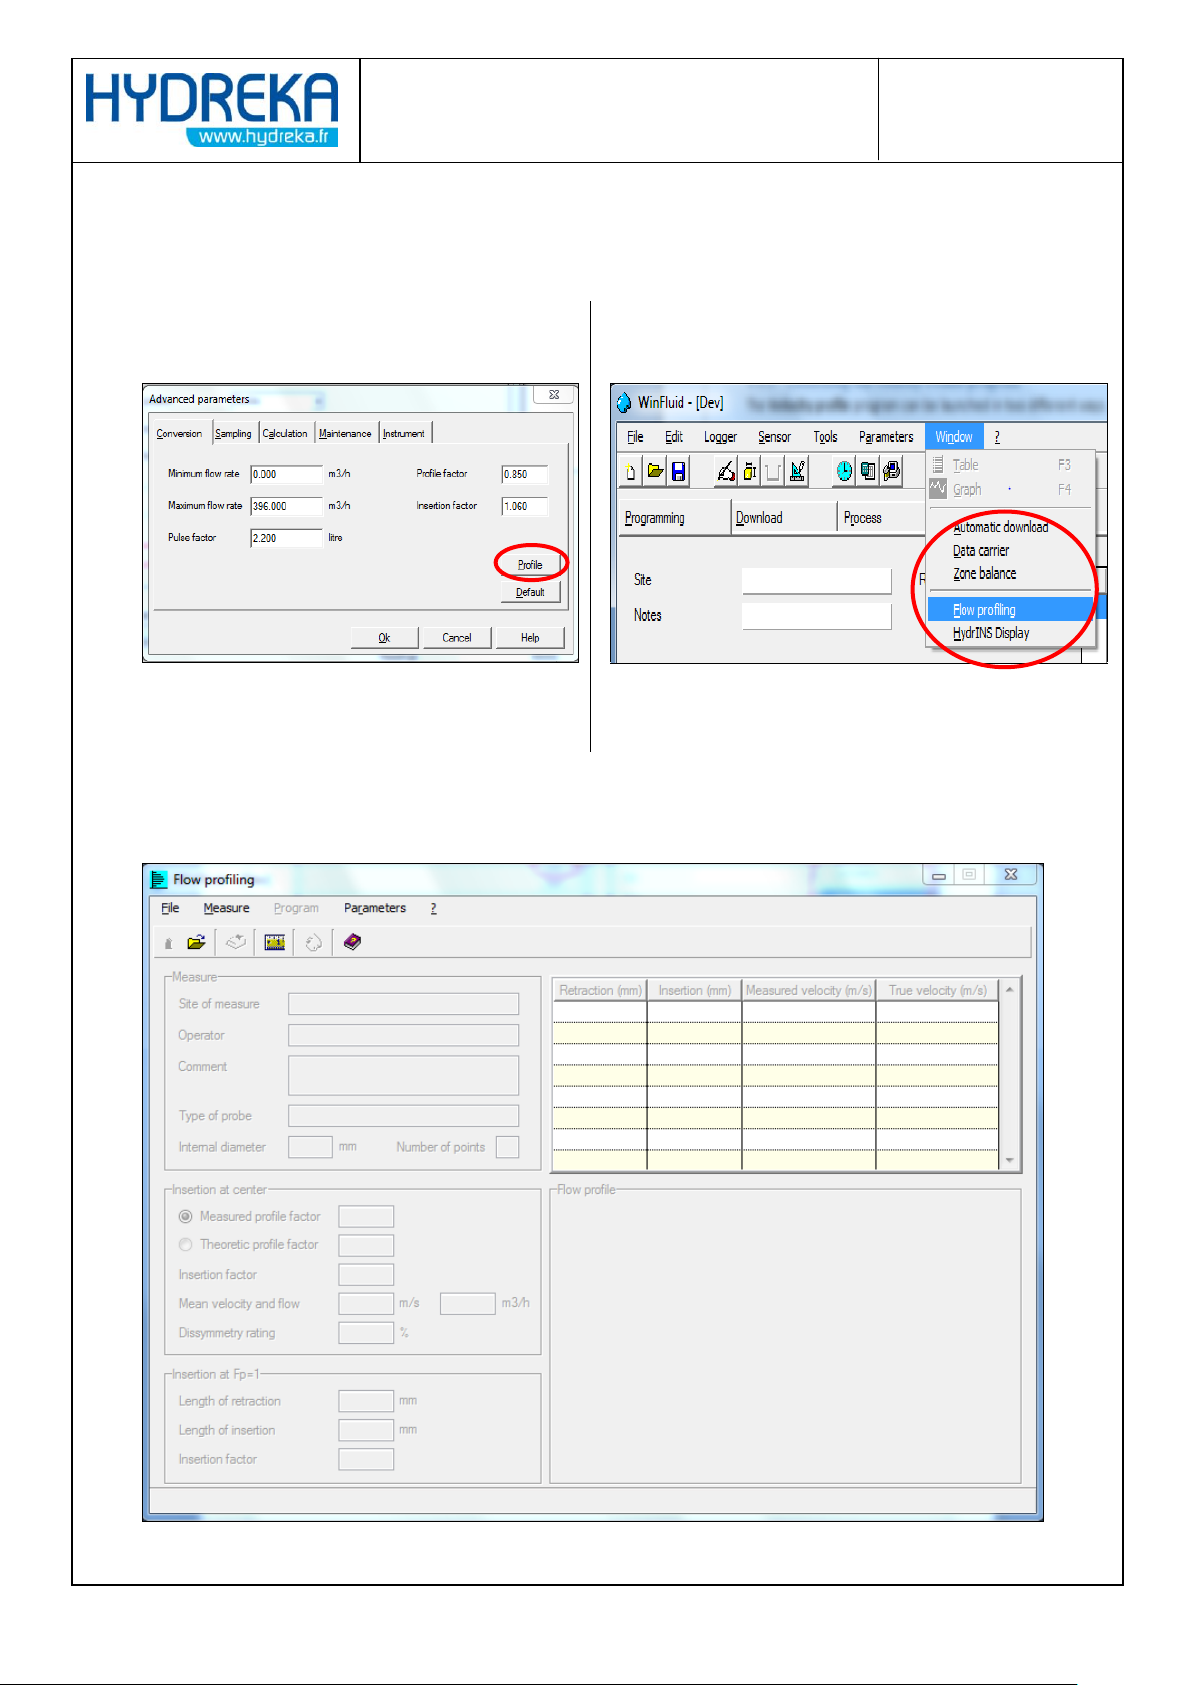
From the Conversion tab in Advanced mode
From the Winfluid home screen by clicking Window >
Velocity profile
Figure 39: Launching the velocity profile program from
Advanced mode
Figure 40: Launching the velocity profile program from the Winfluid
home screen
4.4.2 Launching the Velocity Profile program
The Velocity profile program can be launched in two different ways.
If at least one velocity profile has already been saved, the profile opening window is displayed. In this
case, click Cancel to launch a new profile.
4.4.3 Configuration
Page 34
Page 34/77
HydrINS 2 / HydrINS 2 Mini flow meter
Programming of data logging with Winfluid
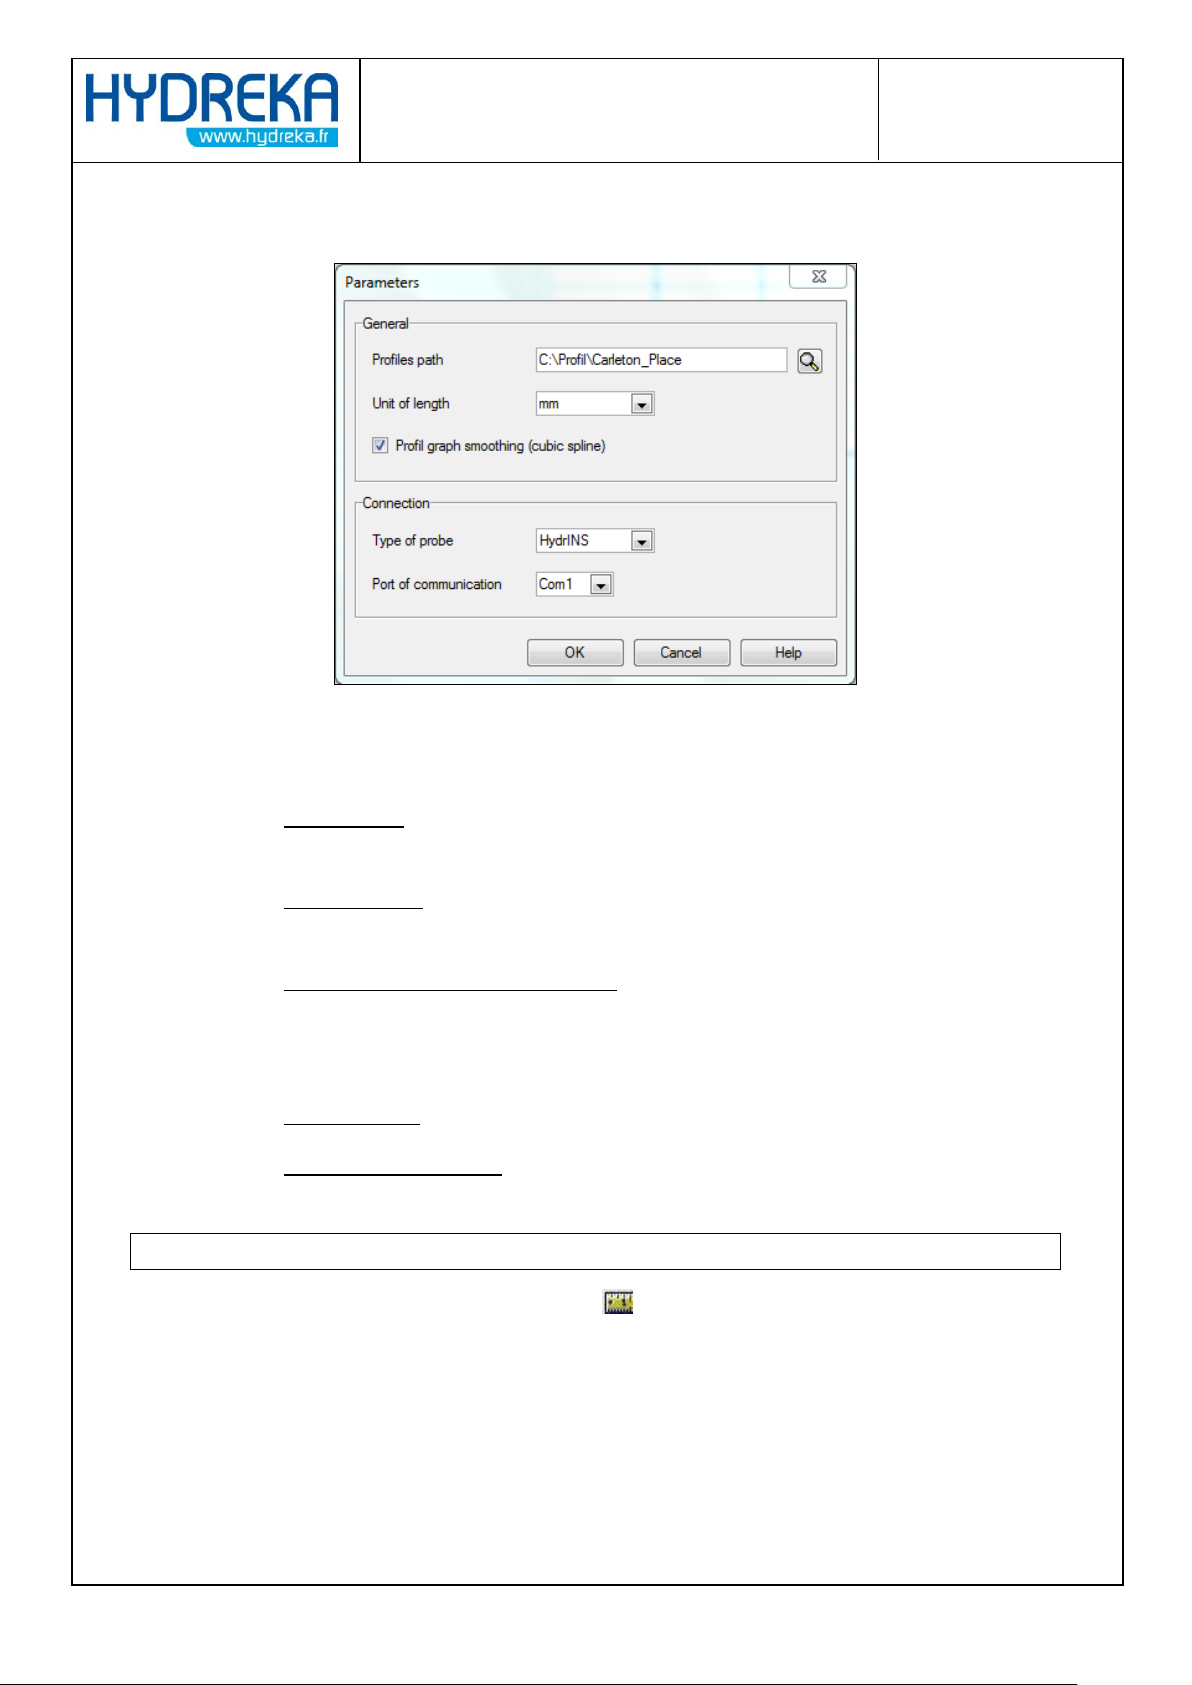
Click Parameters in the menu bar:
Figure 41: Velocity profile editing window
General box:
o Profiles path: Archive folder for measured profiles. If this folder does not exist, it will
be created automatically subject to the parent directory already existing.
o Unit of length: Display unit, metric or Imperial, for all the lengths measured
(diameter, raising distance, insertion length)
o Profil graph smoothing (cubic spline): Connect the points of the curves representing
the profiles measured via cubic spline interpolation.
Connection box:
o Type of probe: Type of flow meter used (Hydrins II, Mini Hydrins)
o Port of communication: Number of the serial port to which the flow meter is
connected
Click OK to confirm the parameters and return to the home screen
Figure 42: Velocity profile editing window
To start the velocity profile measurement, click the icon in the toolbar.
Page 35
Page 35/77
HydrINS 2 / HydrINS 2 Mini flow meter
Programming of data logging with Winfluid
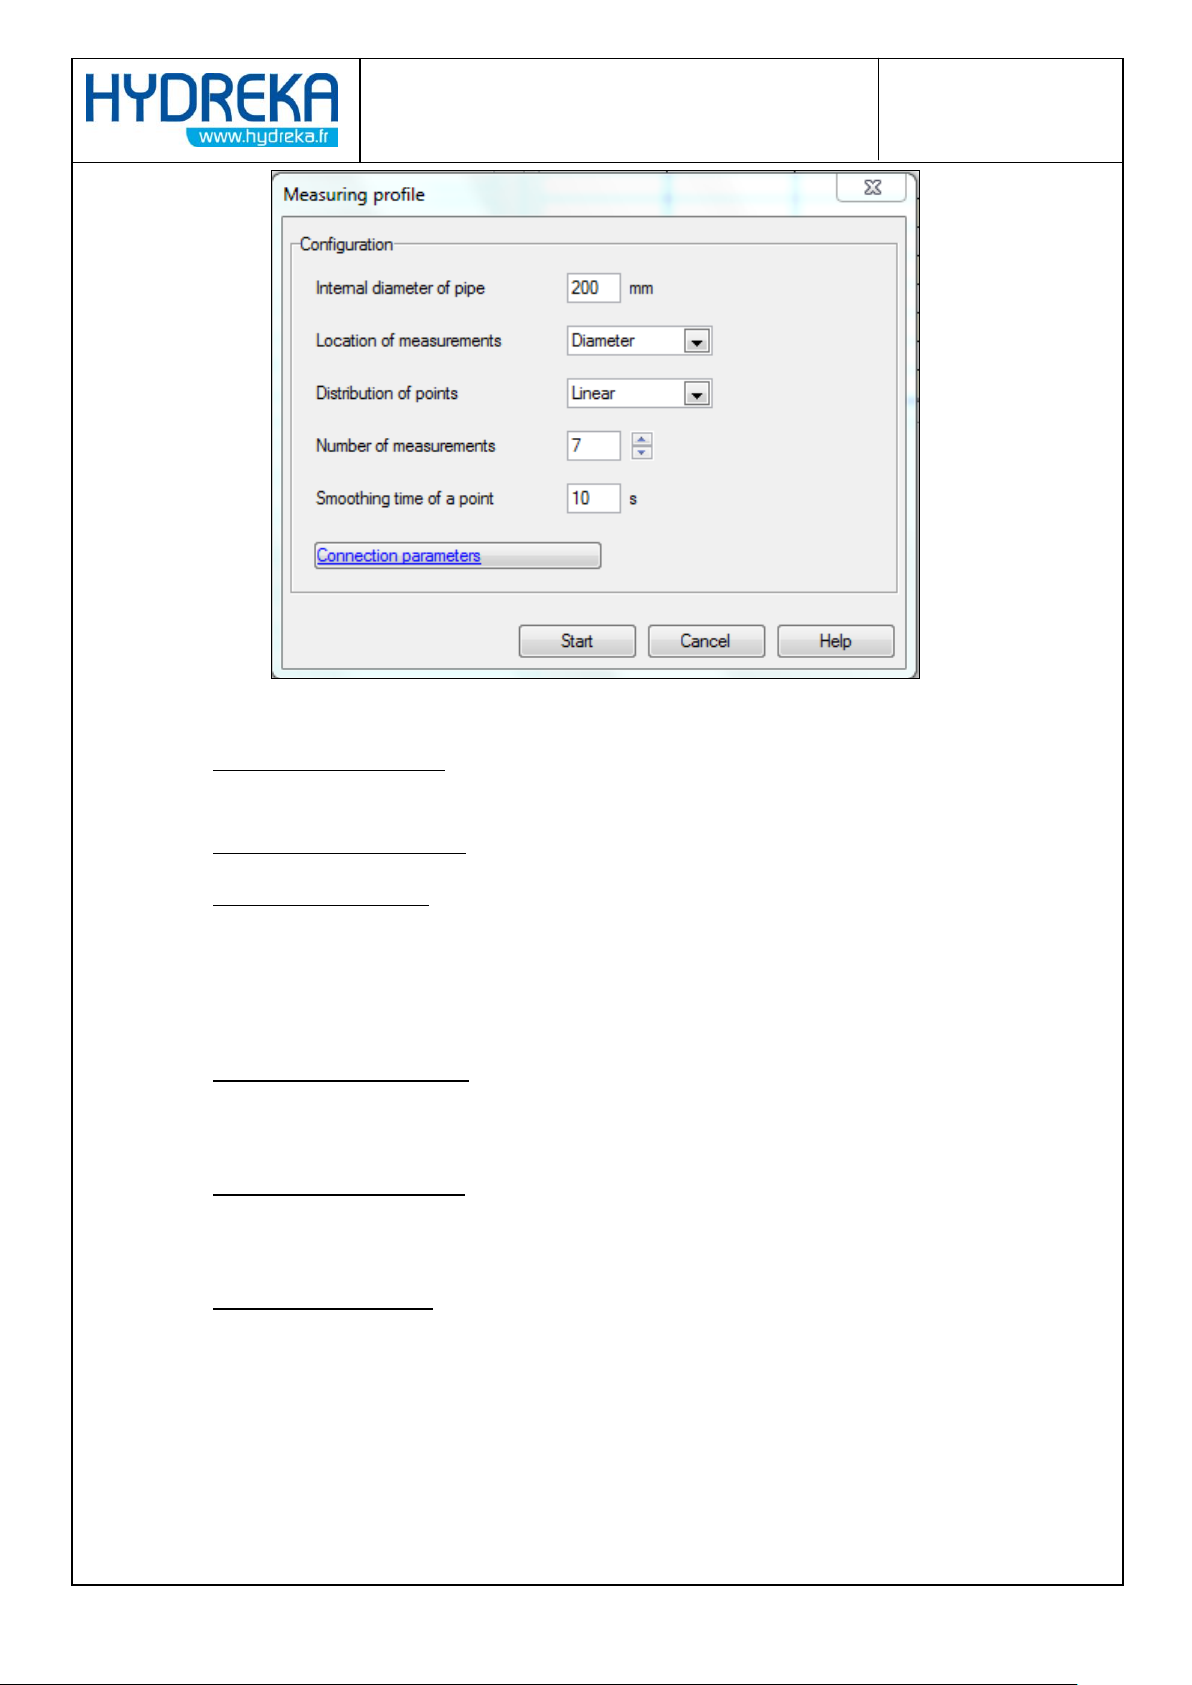
Figure 43: Velocity profile measurement window
Internal diameter of pipe: Inside diameter of the pipe on which the velocity profile is created
(ID value measured in the HydrINS 2 / HydrINS 2 MinI flow meter installation manual).
Locations of measurements: Calculation of profile on the diameter or radius only
Distribution of points: Type of distribution of the measurement points according to the
recommendations in Appendix D of the ISO 3354-1988 standard. The measurement points
can be distributed equidistantly from each other (linear mode) or according to an
exponential step from the centre (nonlinear mode). The location of each point is calculated
automatically according to the mode chosen.
Number of measurements: Total number of measurement points along the radius or
diameter of the pipe. The maximum number of points is 15 and the minimum number of
points is four for the radius or seven for the diameter.
Smoothing time of a point: Measurement duration for each point (seconds). The program
performs two instantaneous velocity measurements per second, and takes the measured
velocity to be the mean value of the measurements acquired during this 30 s period.
Connection parameters: Click this link to modify or check the type of probe used and the
serial port to which the flow meter is connected.
4.4.4 Measurement
Connect the HydrINS 2 flow meter to the computer using a CC_HYDA3 or CC_HYDA3S cable.
Page 36
Page 36/77
HydrINS 2 / HydrINS 2 Mini flow meter
Programming of data logging with Winfluid
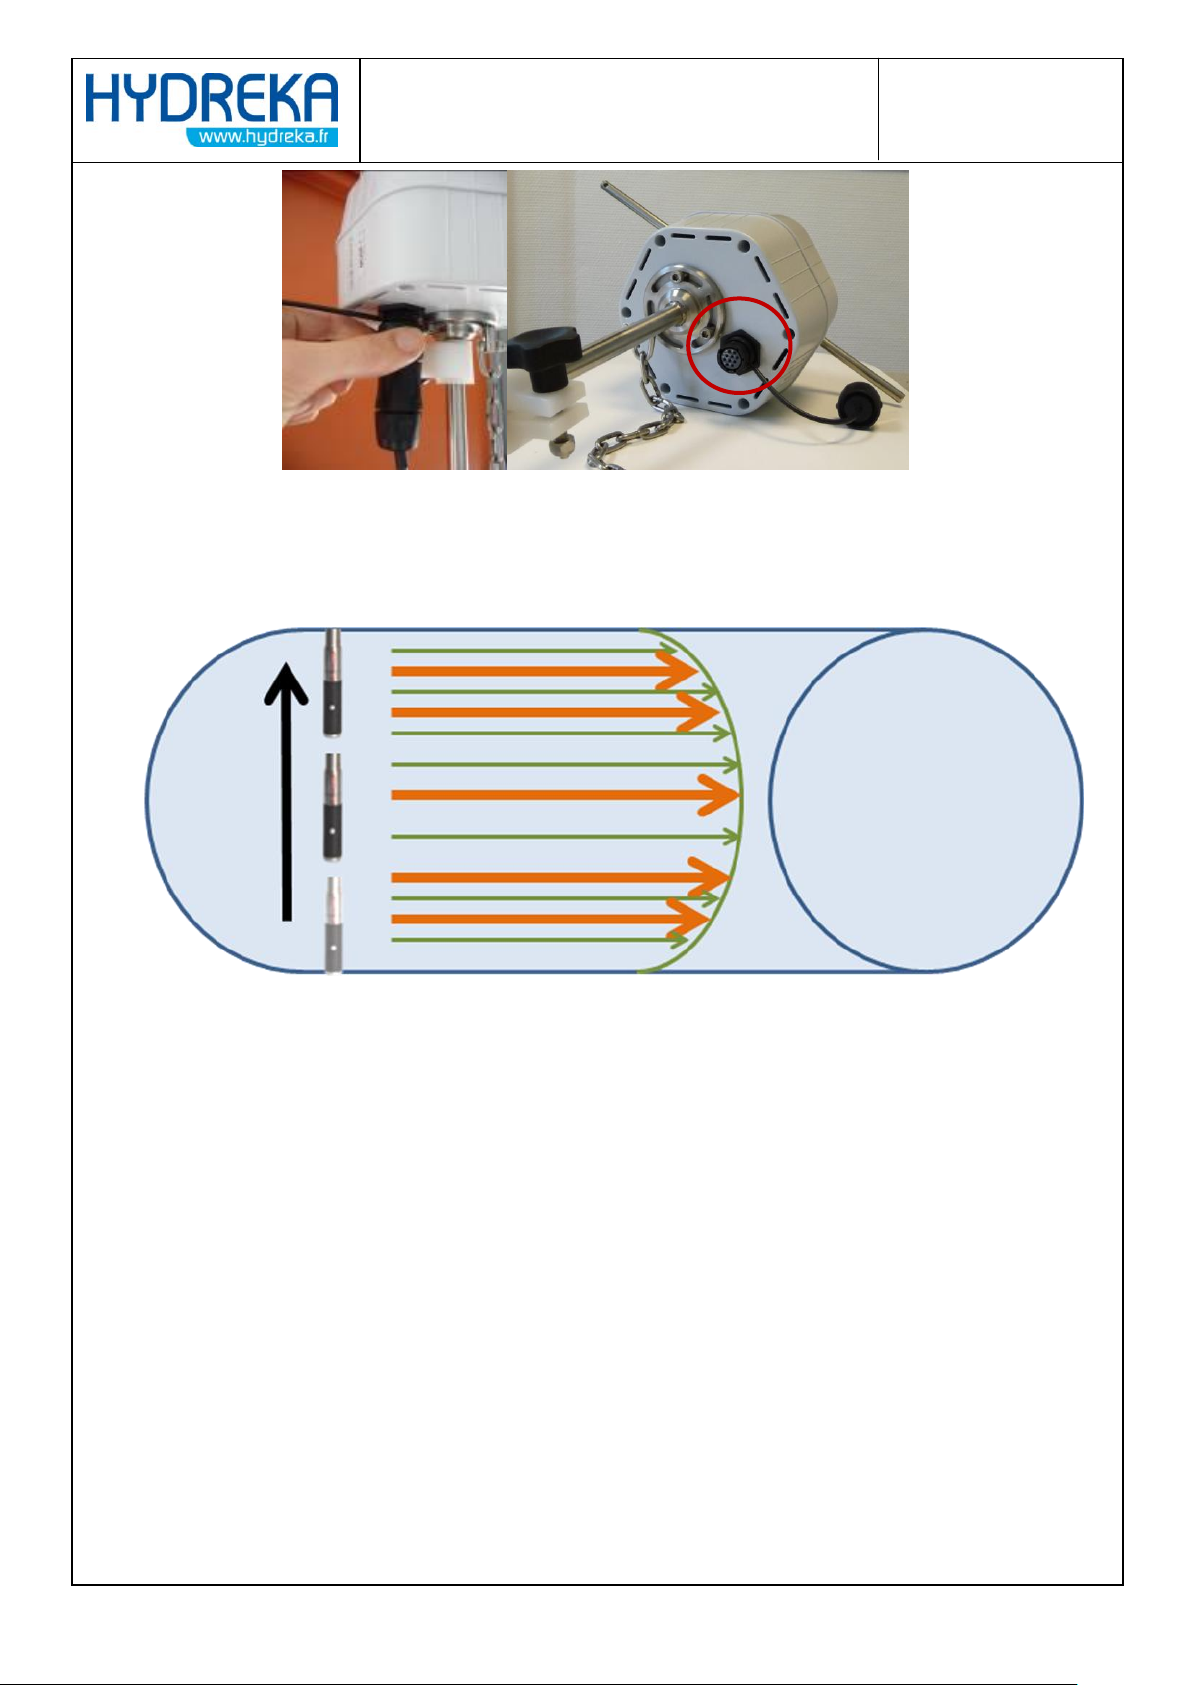
Figure 44: Connection of the CC_HYDA3 or CC_HYDA3S cable to the flow meter
Insert the probe until it stops against the bottom of the pipe. The profile is created from bottom to
top.
Click the Start button.
Figure 45: Probe routing for the velocity profile measurement
Page 37
Page 37/77
HydrINS 2 / HydrINS 2 Mini flow meter
Programming of data logging with Winfluid
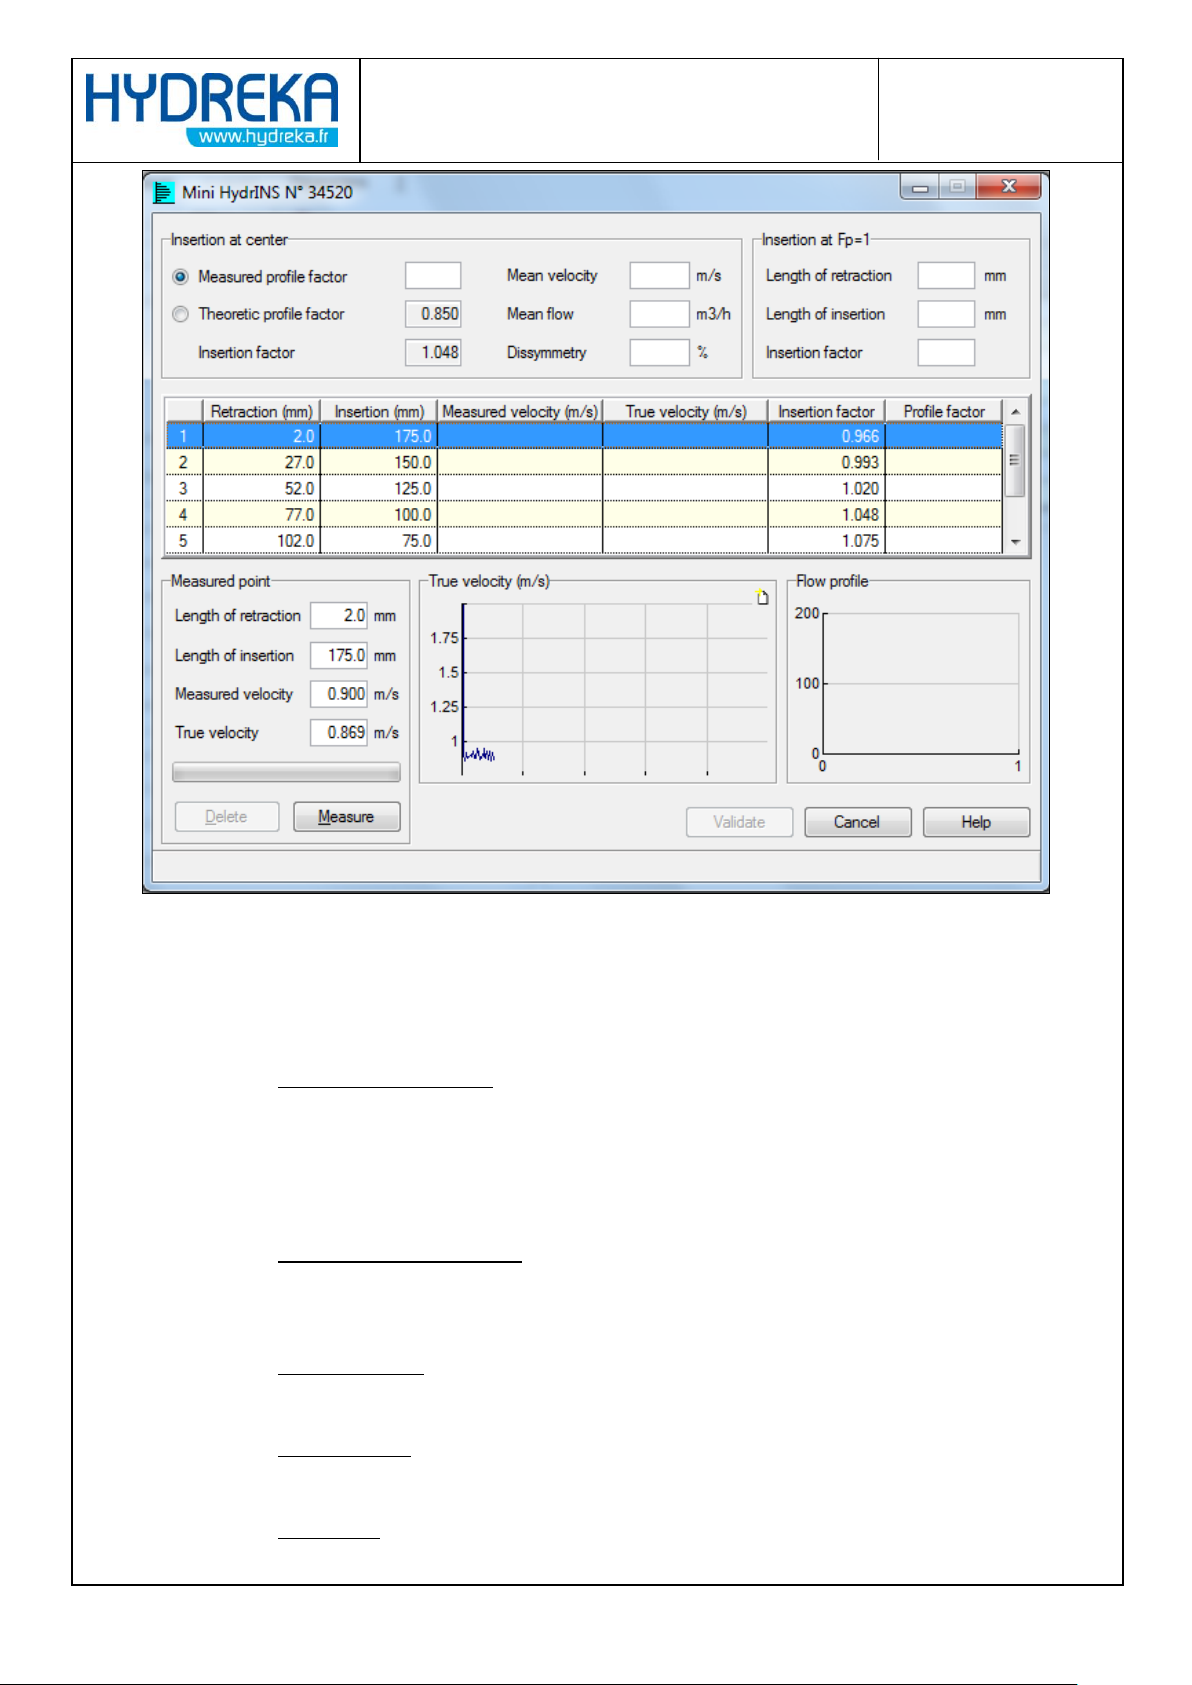
Figure 46: Velocity profile measurement window
The following parameters are presented in the measurement window:
Insertion at the centre box:
o Measured profile factor: Profile coefficient calculated from the measurements taken.
This coefficient is displayed as soon as the measurements of the first radius have been
taken. It is then recalculated after all the measurements. This coefficient applies to
the velocity measured at the centre corrected by the insertion coefficient to obtain
the mean velocity.
o Theoretical profile factor: Theoretical profile coefficient calculated at the centre of
the pipe. This coefficient applies to the velocity measured at the centre corrected by
the insertion coefficient to obtain the mean velocity.
o Insertion factor: Insertion coefficient calculated at the centre of the pipe, a function
of the pipe diameter, applied to the measured velocity to calculate the actual velocity.
o Mean velocity: Mean velocity at the centre (m/s) calculated according to the selected
profile coefficient, whether measured or theoretical.
o Mean flow: Mean flow rate at the centre (m3/h) calculated from the mean velocity.
Page 38
Page 38/77
HydrINS 2 / HydrINS 2 Mini flow meter
Programming of data logging with Winfluid
o Dissymmetry: Index of dissymmetry between the measurements of each radius (in
the event of measurements along the diameter) according to the ISO 3354-1998
standard. An index greater than 5% reflects excessive turbulence or a gyration effect,
and renders the velocity profile invalid.
Insertion at Fp = 1 box
This box is useful for cases where insertion at the centre is not possible (probe is too short,
velocity at the centre is too high, etc.). The insertion distance is then calculated so that the profile
coefficient is always equal to 1, which corresponds in theory to 1/8 diameter.
o Length of retraction: the raising distance of the measurement point from the opposite
wall for which the mean velocity is equal to the actual velocity (profile factor equal to 1)
o Length of insertion: Insertion length of the measurement point for which the mean
velocity is equal to the actual velocity.
o Insertion factor Insertion coefficient of the measurement point for which the mean
velocity is equal to the actual velocity.
Table of measurements box
This table of measurements represents all the measurements to be taken at the various insertion
points to calculate the profile coefficient. The first point represents the measurement point when
the probe is in contact with the wall opposite the insertion point.
o Retraction: Distance between the current measurement point and the so-called point of
origin where the probe butts up against the wall opposite the insertion orifice
o Insertion: Distance between the current measurement point and the insertion orifice.
o Measured velocity: Flow velocity (m/s) measured at the current point, as reported by the
measurement probe. The insertion coefficient is not applied.
o True velocity: Flow velocity (m/s) measured at the current point, reported by the
measurement probe and corrected by the insertion coefficient according to the insertion
length.
Measurement point box
This section summarises the current measurement point and displays the velocities in real time.
o Length of retraction: Distance between the current measurement point and the so-called
point of origin where the probe butts up against the wall opposite the insertion orifice
o Lenght of insertion: Distance between the current measurement point and the insertion
orifice.
o Measured velocity: Velocity measured in real time without applying the insertion
coefficient.
Page 39
Page 39/77
HydrINS 2 / HydrINS 2 Mini flow meter
Programming of data logging with Winfluid
o True velocity: Velocity measured in real time, corrected by the corresponding insertion
coefficient.
True velocity graph box
This graph represents the actual velocity as a function of time, and is used in particular to monitor
the stability of measurement at each point. It can be reset at any time by clicking the button
in the upper right-hand part of the graph.
Flow profile graph box
This graph shows how the actual velocity (m/s) varies as a function of insertion length.
Associated buttons
o The Measure button launches velocity measurement at the current measuring point.
o The Stop button interrupts the current velocity measurement
o The Delete button cancels velocity measurement at the current measuring point.
o The Validate button confirms the measured velocity field and gives access to the
profile confirmation window
o The Cancel button abandons the current velocity field measurement
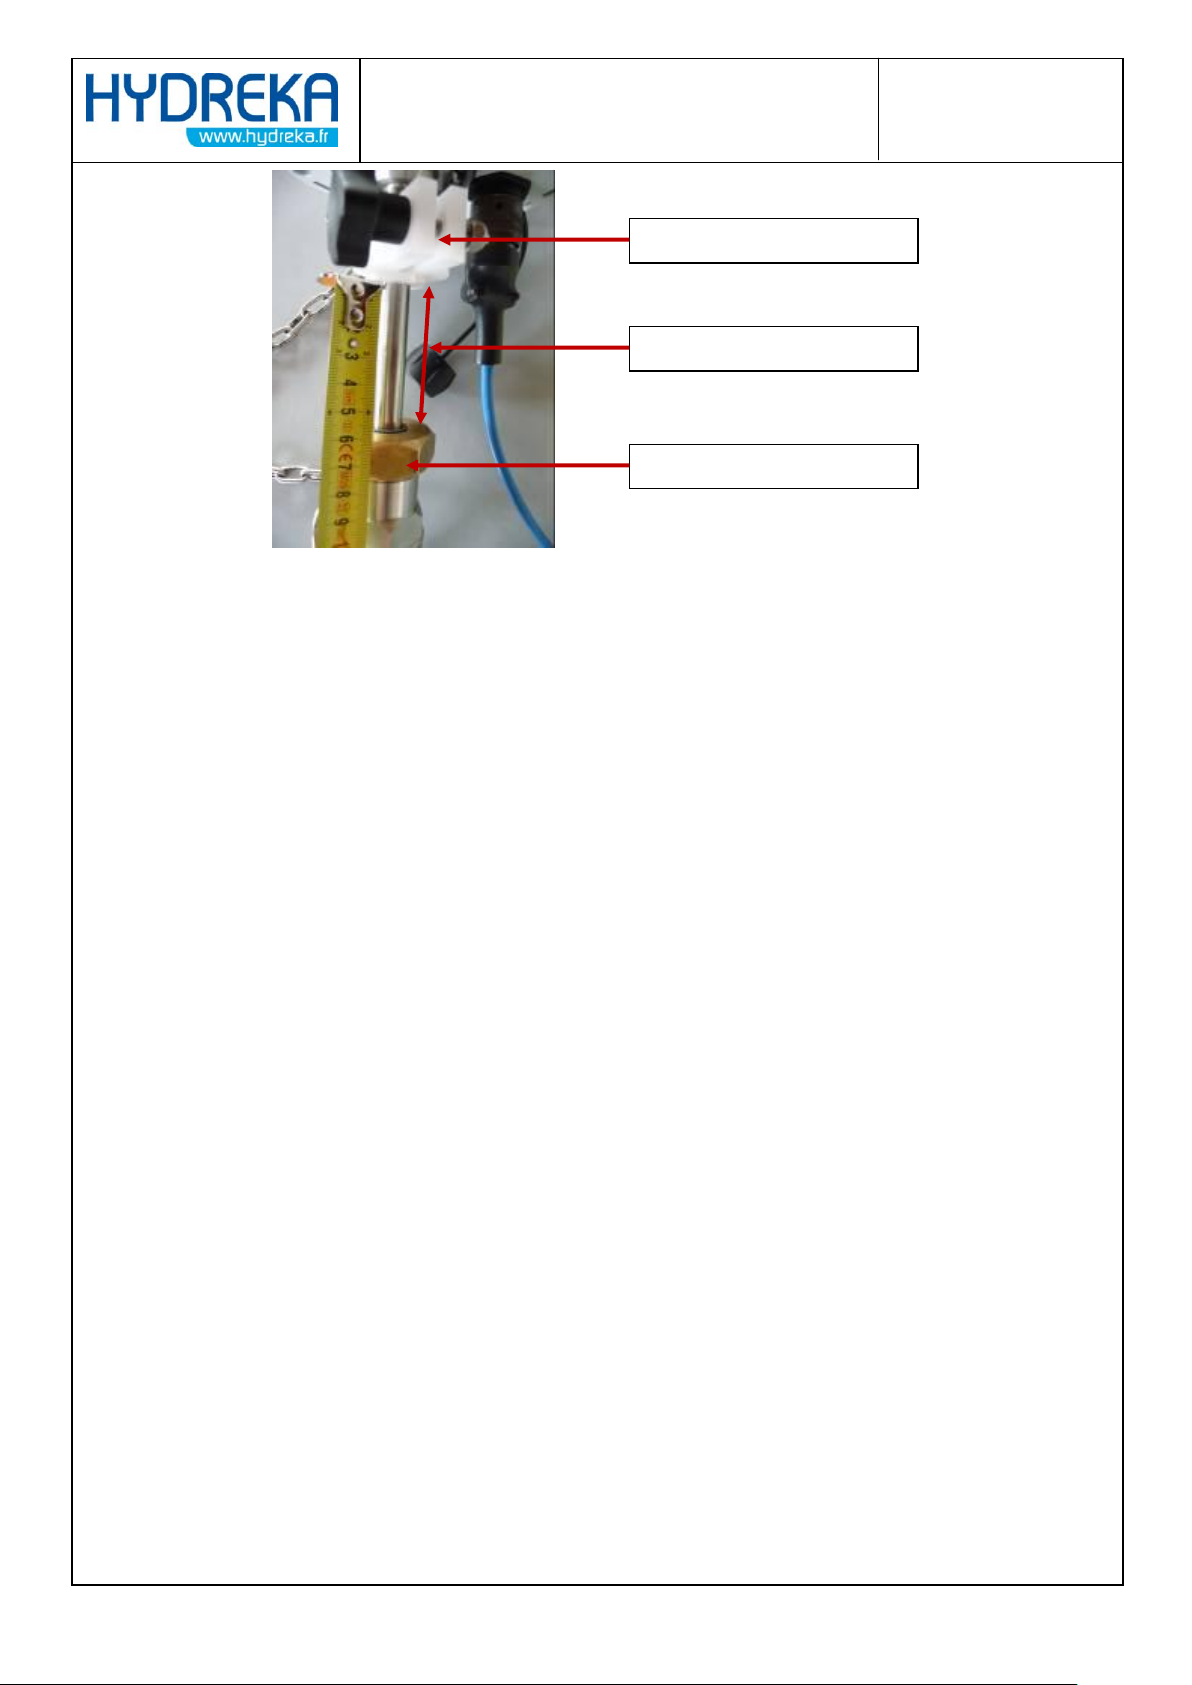
4.4.5 Measurement procedure:
The velocity profile is created for the entire inside diameter, from bottom to top. A raising distance is
measured for each point:
Page 40
Page 40/77
HydrINS 2 / HydrINS 2 Mini flow meter
Programming of data logging with Winfluid
Insertion marking
Clamp ring
Raising length
Figure 47: Measuring of probe raising for the creation of a velocity profile
Ensure that the insertion marker is fully loosened.
Insert the probe in the pipe until it stops against the wall opposite the insertion orifice.
Tighten the insertion marker. This point will provide the origin for the raising lengths (raising
length = 0 mm).
Position the cursor on the profile measurement screen at raising point No. 1.
Raise the flow meter by the value indicated in the 'raising' section.
Wait for the velocity reading to stabilise.
Launch the measurement of this first point by clicking the Measure button in the lower left-
hand part of the window.
When the measurement time has elapsed:
o Confirm the measurement point if correct.
o If not, cancel the point and repeat the measurement.
The program then moves on to the next measurement point.
For each measurement point defined, raise the probe by the raising length indicated, and
then repeat the above steps.
At any time you may return to a previously confirmed measurement point that does not look
right by clicking its line in the table of results and clicking the Measure button.
When all points have been measured, all the results are displayed (measured profile
coefficient at the centre, mean velocity and flow rate, insertion length and coefficient for Fp
= 1), and you can then confirm the entire profile measurement.
Page 41
Page 41/77
HydrINS 2 / HydrINS 2 Mini flow meter
Programming of data logging with Winfluid
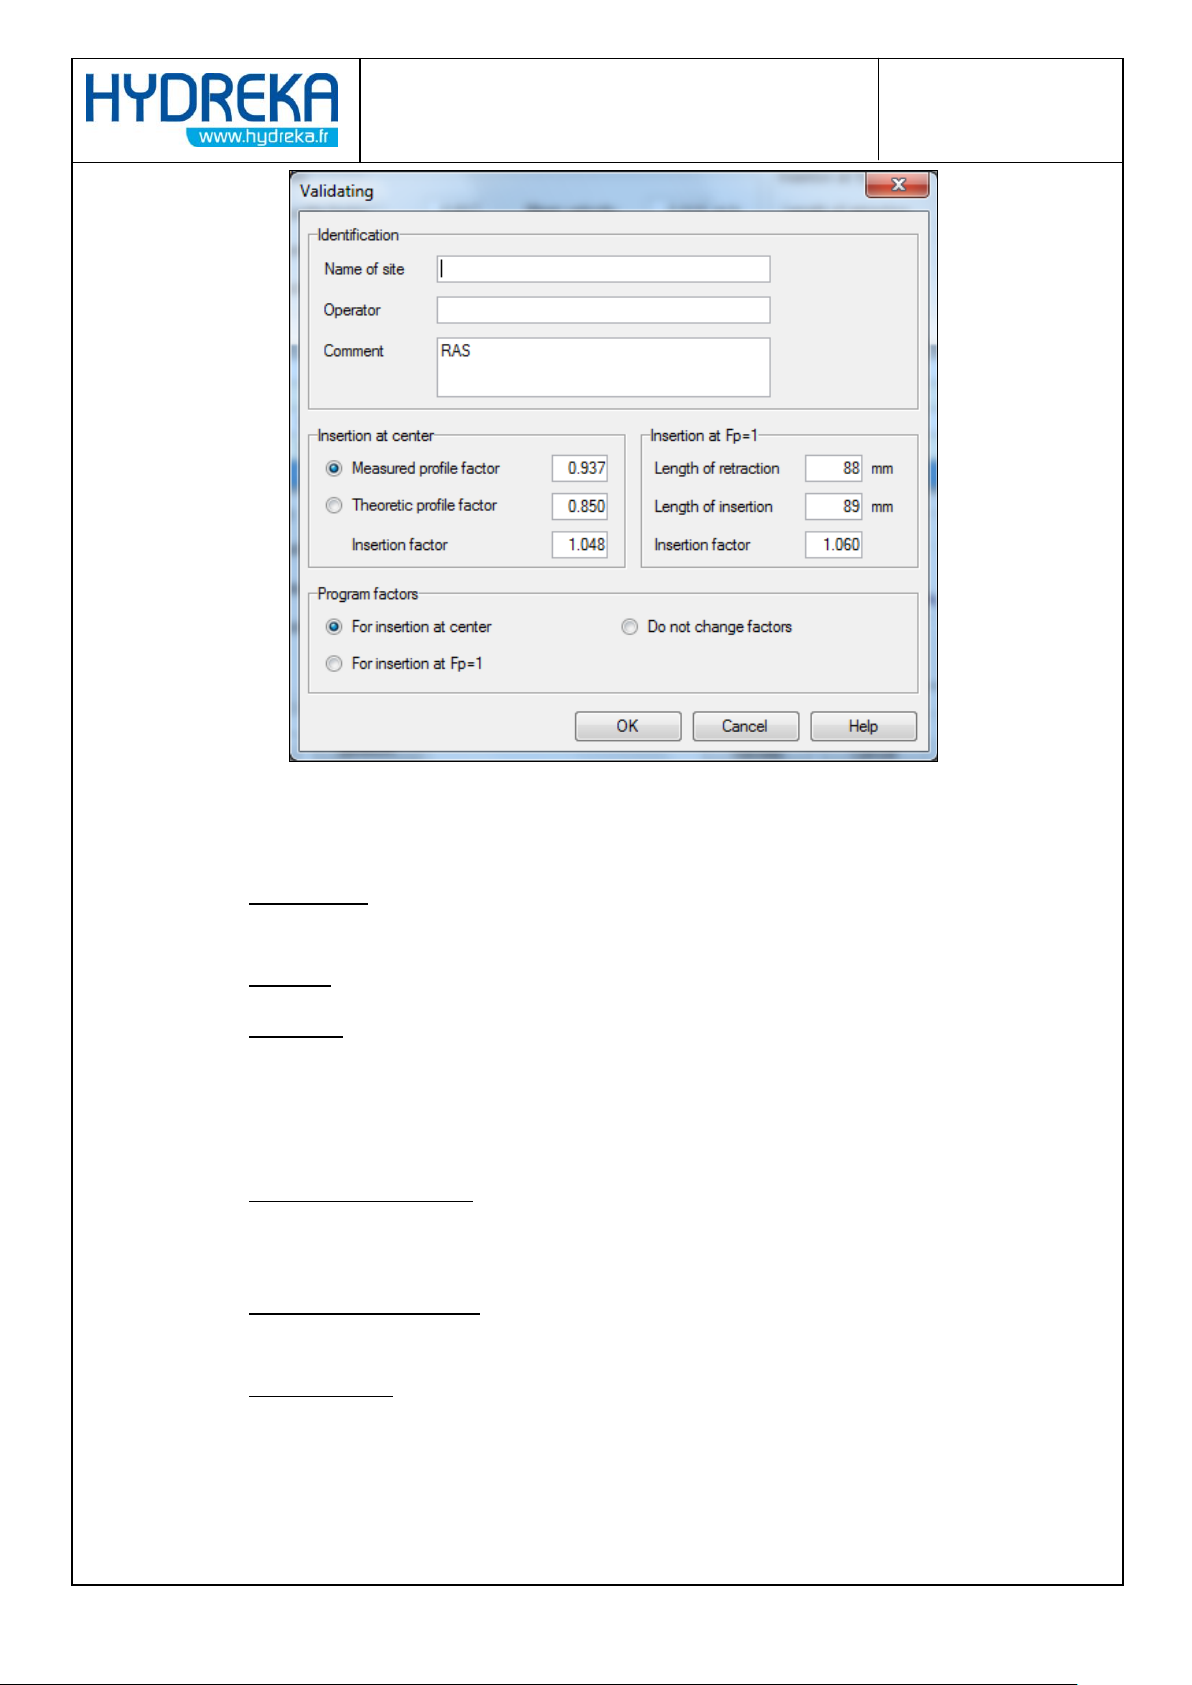
Figure 48: Measurement point confirmation window
Identification box:
o Name of site: Name of the site where measurement was performed (max. 32 characters).
This name will be used to identify the measured profile in the database.
o Operator: Name of user who performed the measurements (max. 64 characters)
o Comment: Free space to add comments (max. 255 characters)
Insertion at center box:
In this box, choose whether you wish to use centre insertion, and the type of profile
coefficient used (measured or theoretical).
o Measured profile factor: Profile coefficient that has just been measured, applicable to
the velocity measured at the centre corrected by the insertion coefficient to obtain the
mean velocity.
o Theoretical profile factor: This coefficient applies to the velocity measured at the centre
corrected by the insertion coefficient to obtain the mean velocity.
o Insertion factor: insertion coefficient calculated at the centre of the pipe.
Page 42
Page 42/77
HydrINS 2 / HydrINS 2 Mini flow meter
Programming of data logging with Winfluid
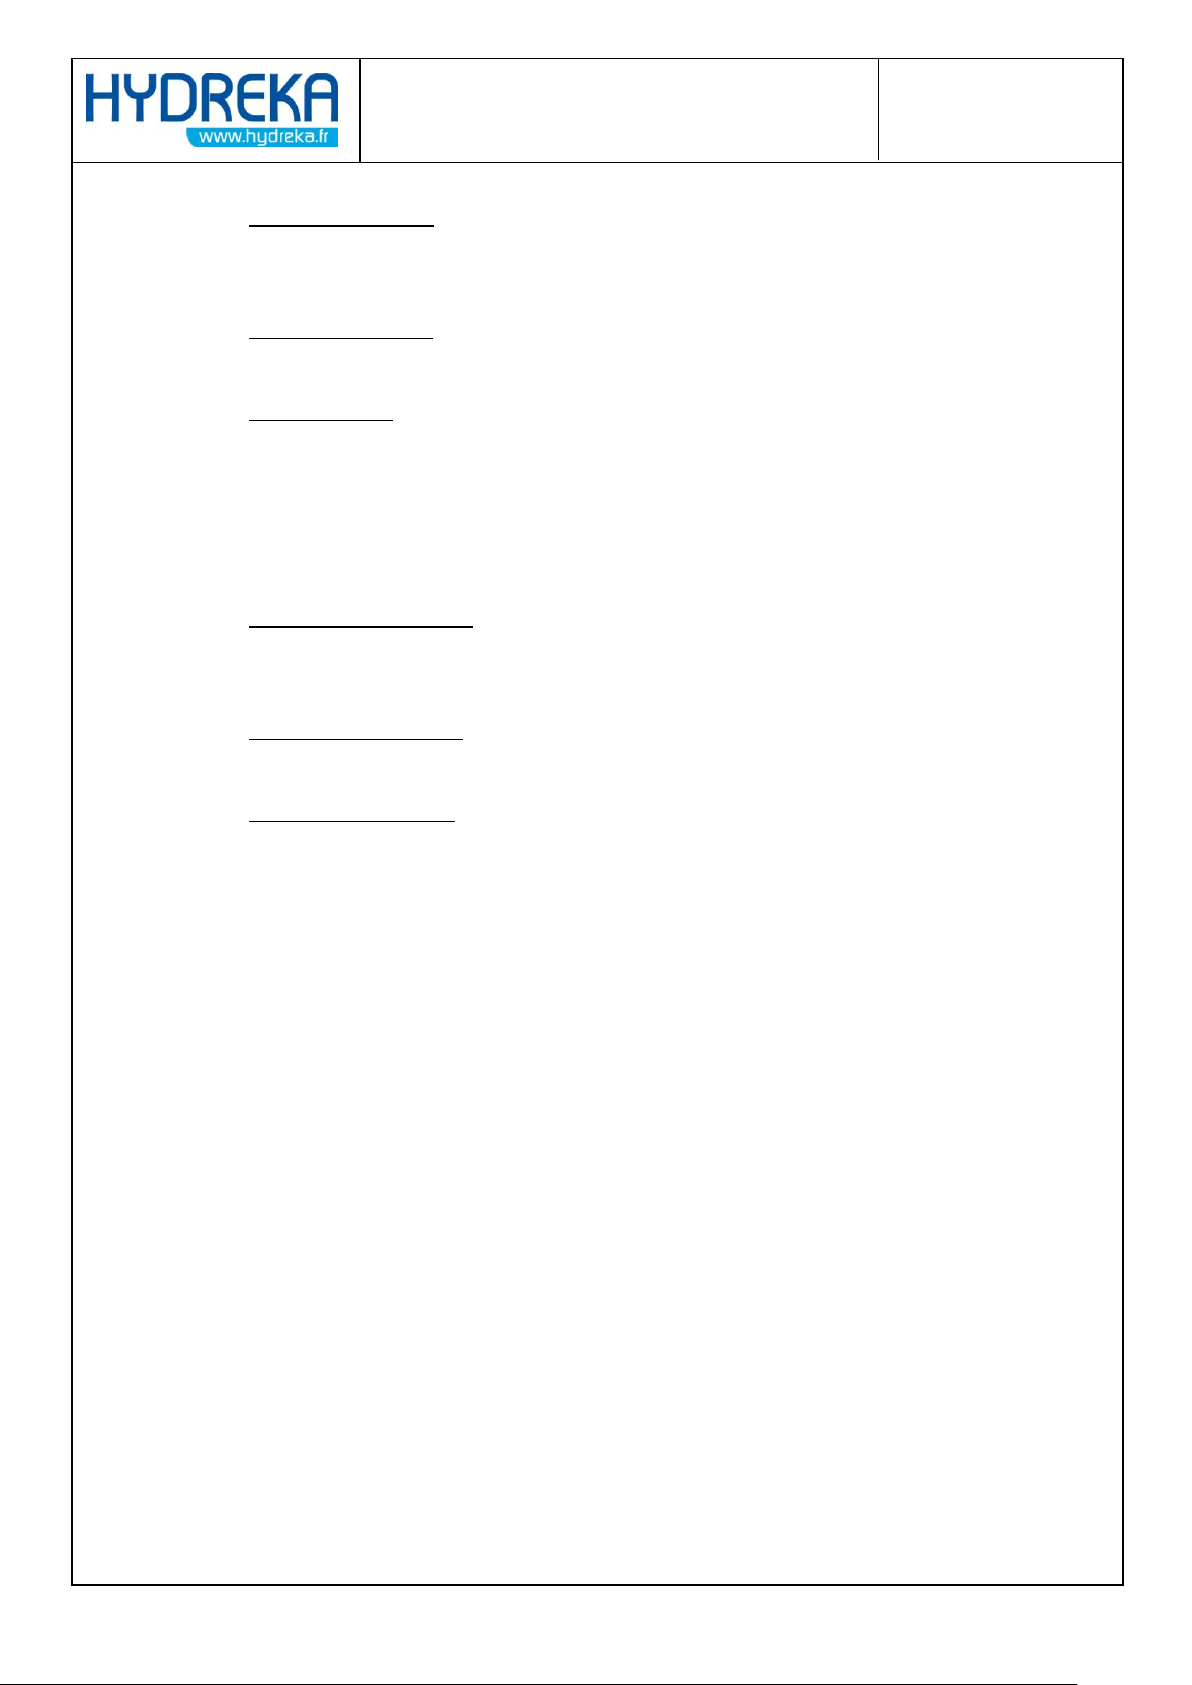
Insertion at Fp = 1 box
o Length of retraction: The raising distance of the measurement point from the lower edge
of the pipe for which the mean velocity is equal to the actual velocity (profile factor is
then equal to 1).
o Length of insertion: Insertion length of the measurement point for which the mean
velocity is equal to the actual velocity.
o Insertion factor: Insertion coefficient to be applied to the measured velocity to obtain the
actual velocity.
Program coefficients box:
In this box, select the type of insertion used: at the centre or at an insertion distance where
the profile factor is equal to 1.
o For insertion at center: After confirmation, the selected profile coefficient and the
coefficient of insertion at the centre will be programmed into the HydrINS 2 probe
connected to the serial port.
o For insertion at Fp =1: After confirmation, the profile coefficient equal to 1 and the
insertion coefficient at Fp = 1 will be programmed into the HydrINS 2 probe.
o Do not change factors: The coefficients currently programmed into the HydrINS 2 probe
will not be modified.
Click OK to confirm the profile and, if necessary, to program the new coefficients into the HydrINS
2/HydrINS 2 Mini probe connected to the serial port, or click Cancel to resume velocity field
measurement.
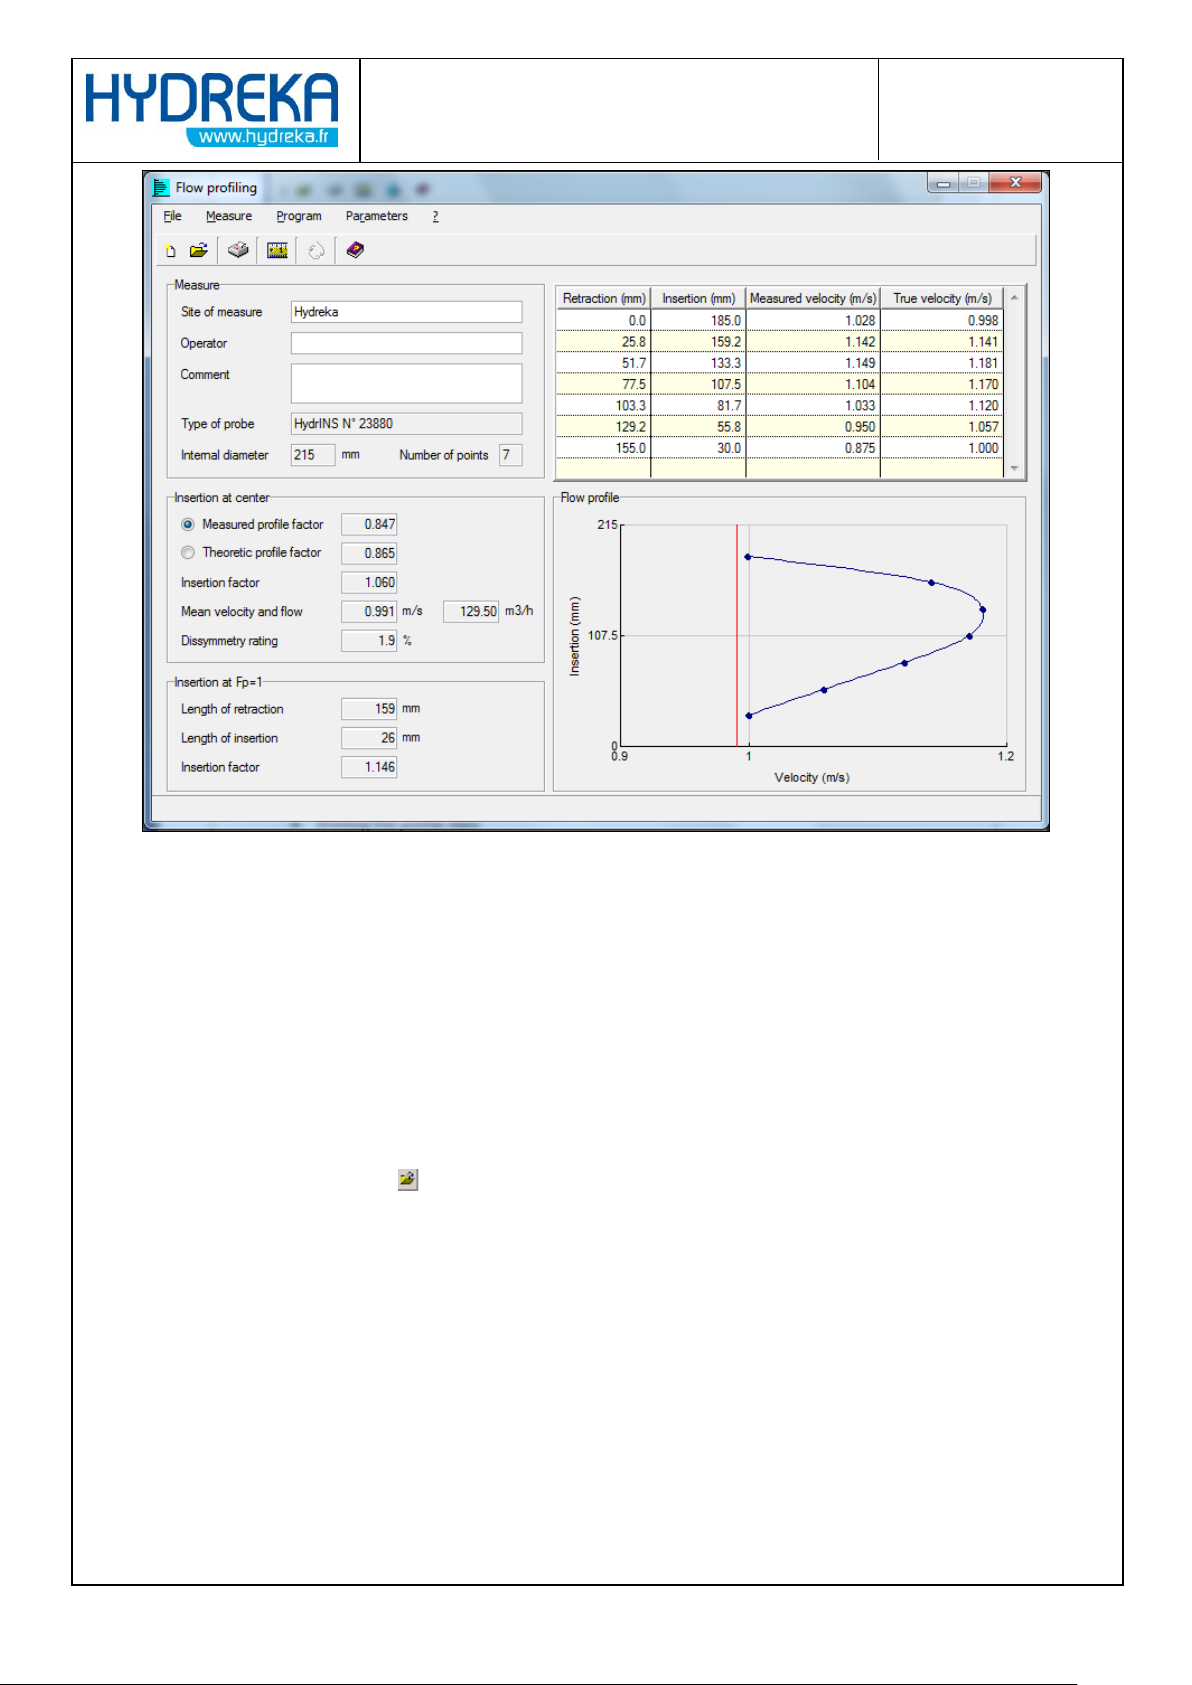
After confirmation by clicking OK, the profile is automatically archived and the screen summarising
the previous measurements appears on screen.
Page 43
Page 43/77
HydrINS 2 / HydrINS 2 Mini flow meter
Programming of data logging with Winfluid
Figure 49: Velocity profile preview screen
4.5 Processing a profile
Each profile measured is saved in a database for use in one of the following ways:
Programming of the main characteristics in the HydrINS 2 probe.
Transferring the profile to Winfluid
Printing the profile data
4.5.1 Opening a velocity profile
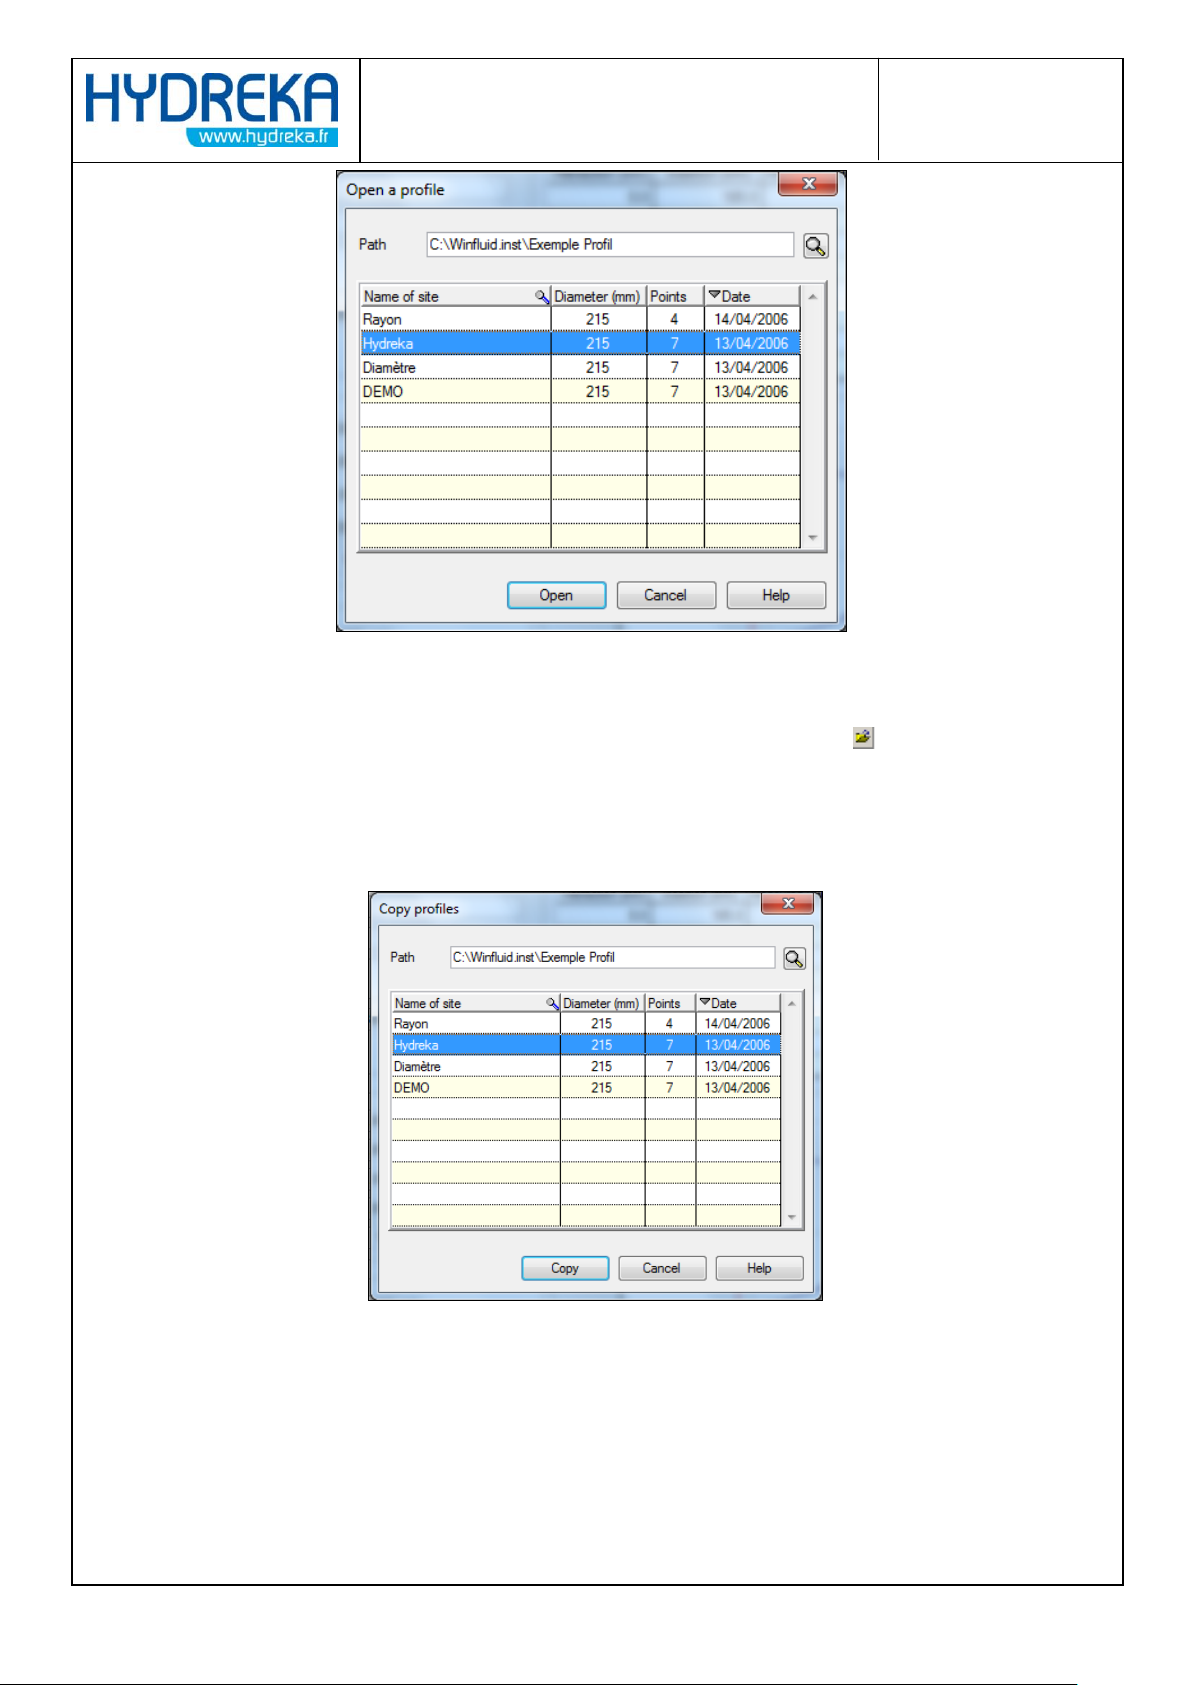
Click File > Open or click the button, and then select a velocity profile and click Open.
Page 44
Page 44/77
HydrINS 2 / HydrINS 2 Mini flow meter
Programming of data logging with Winfluid
Figure 50: Measurement opening window
4.5.2 Deleting a profile file
From the window used to open an existing velocity profile (File > Open or the button), select the
name of the site and press the Del key.
4.5.3 Copying a profile file
Click File > Copy
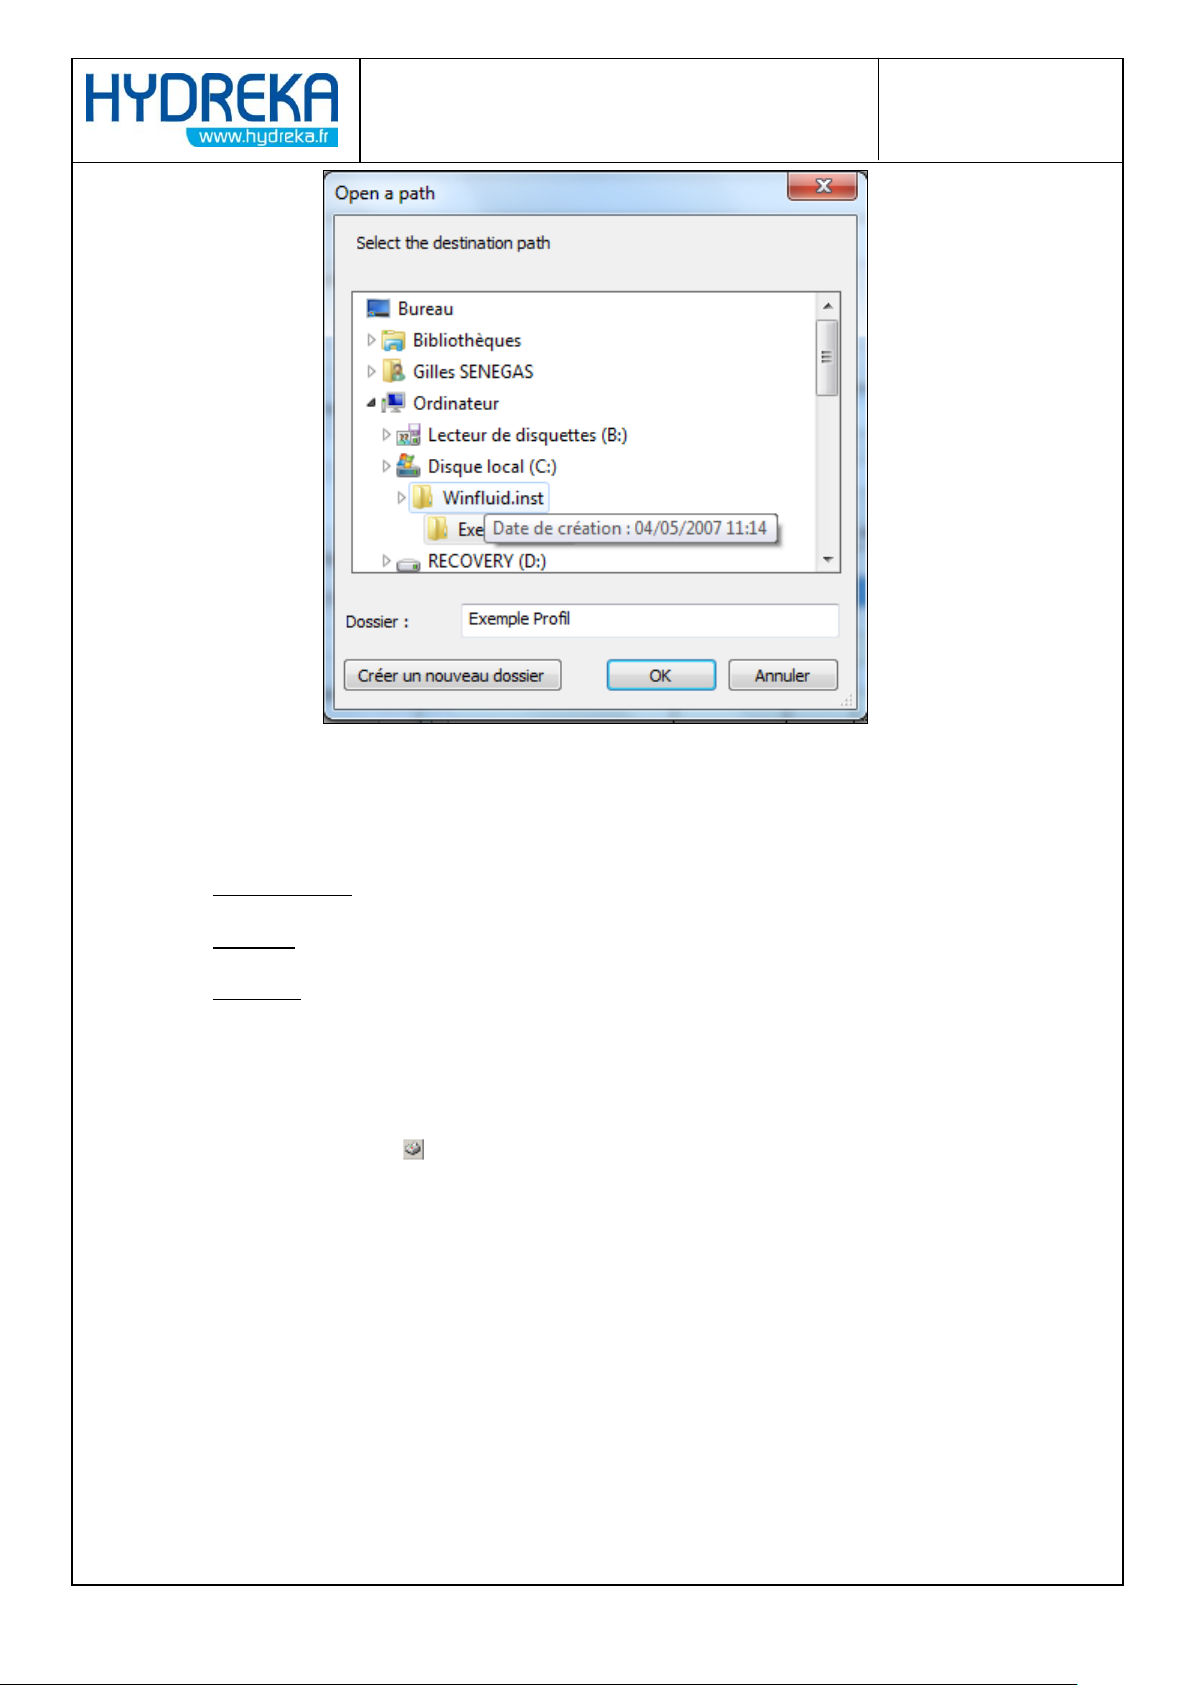
Figure 51: Selection window for measurements to be copied
Select the file to be copied, and then click Copy.
Select the destination directory, and then click Ok
Page 45
Page 45/77
HydrINS 2 / HydrINS 2 Mini flow meter
Programming of data logging with Winfluid
Figure 52: Copy destination directory selection window
4.5.4 Modifying a velocity profile file
Certain characteristics of an open profile file can be modified:
Site of measure
Operator
Comment
Any modification is automatically saved in the database on the disk after confirmation using the Tab
key or the Enter key on the keyboard.
4.5.5 Printing and exporting data from a velocity profile
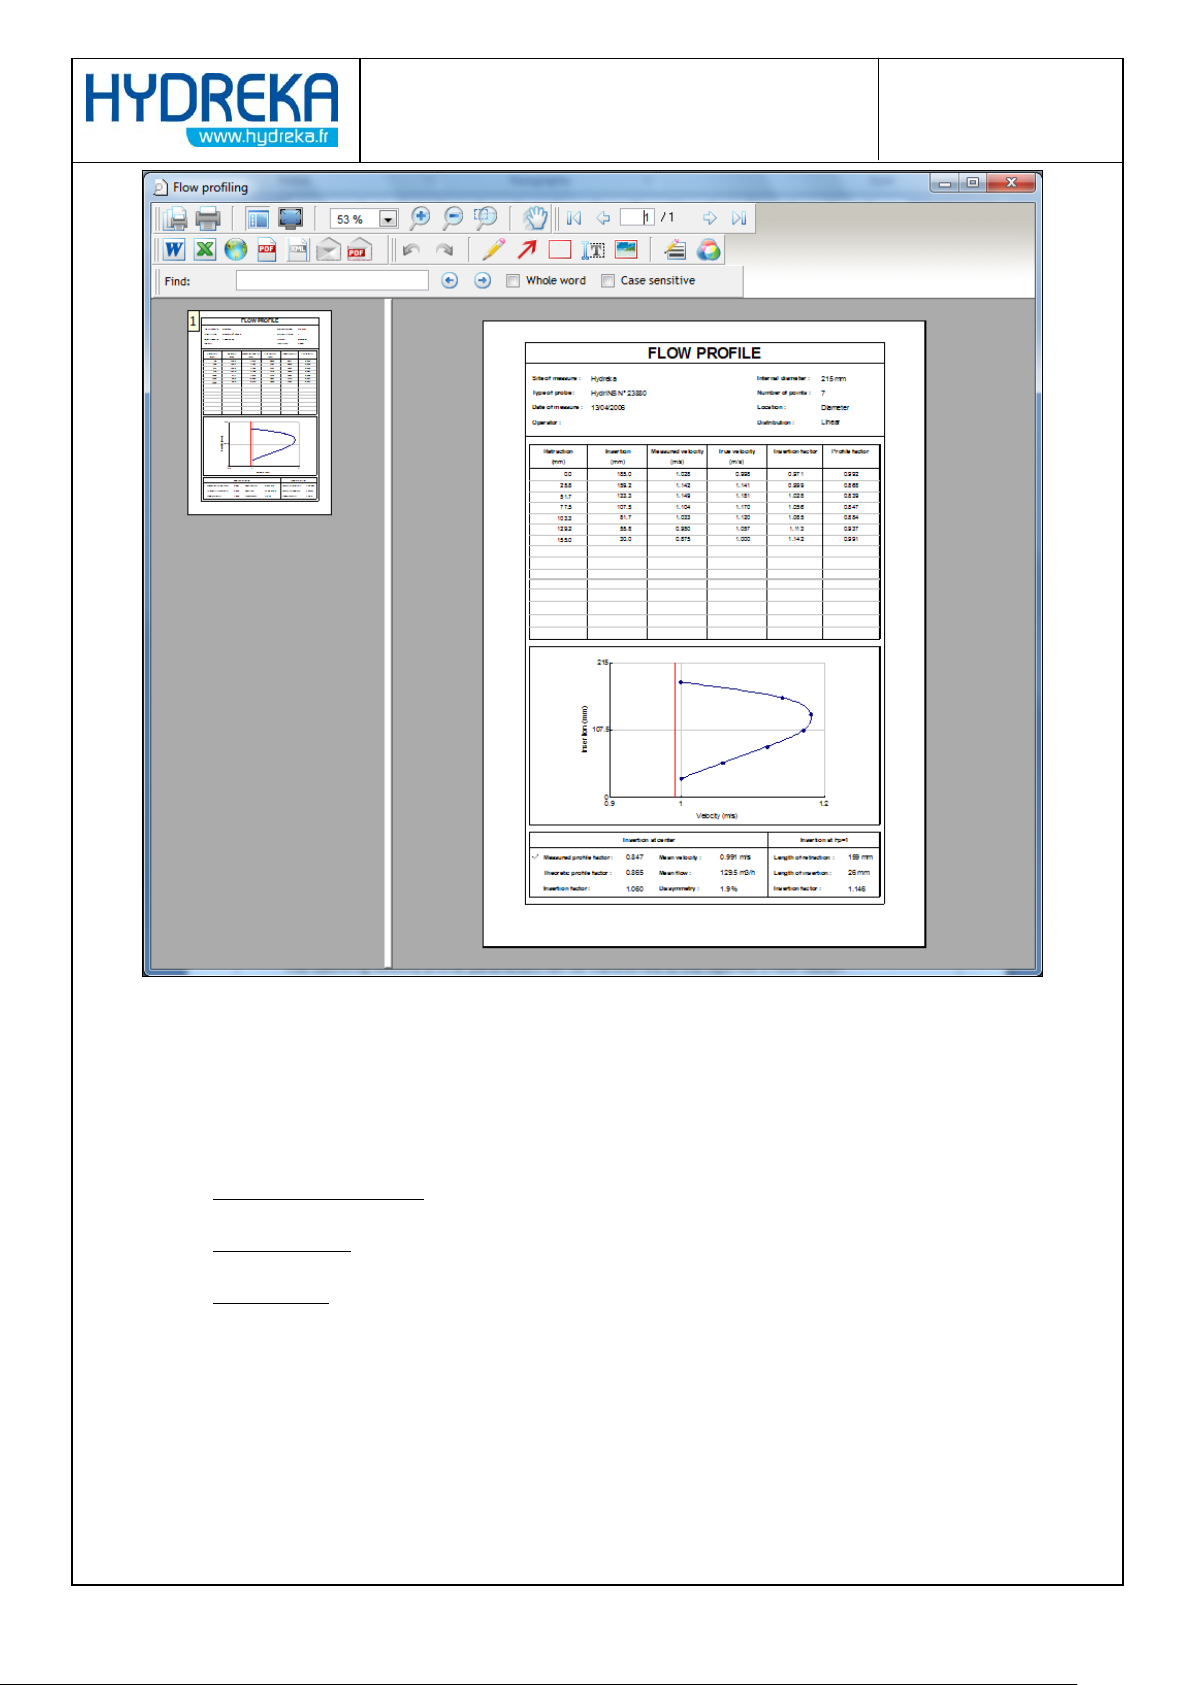
Click File > Print or click the button. The preview window is displayed, allowing you to select the
printing or export parameters: printer, xls, xml, e-mail formats, etc.
Page 46
Page 46/77
HydrINS 2 / HydrINS 2 Mini flow meter
Programming of data logging with Winfluid
Figure 53: Velocity profile measurement export window
Select the desired option and return to the main screen
4.5.6 Programming a profile previously saved.
The following velocity profile parameters can be transferred to the HydrINS 2 flow meter:
Internam diameter (ID)
Insertion factor
Profile factor
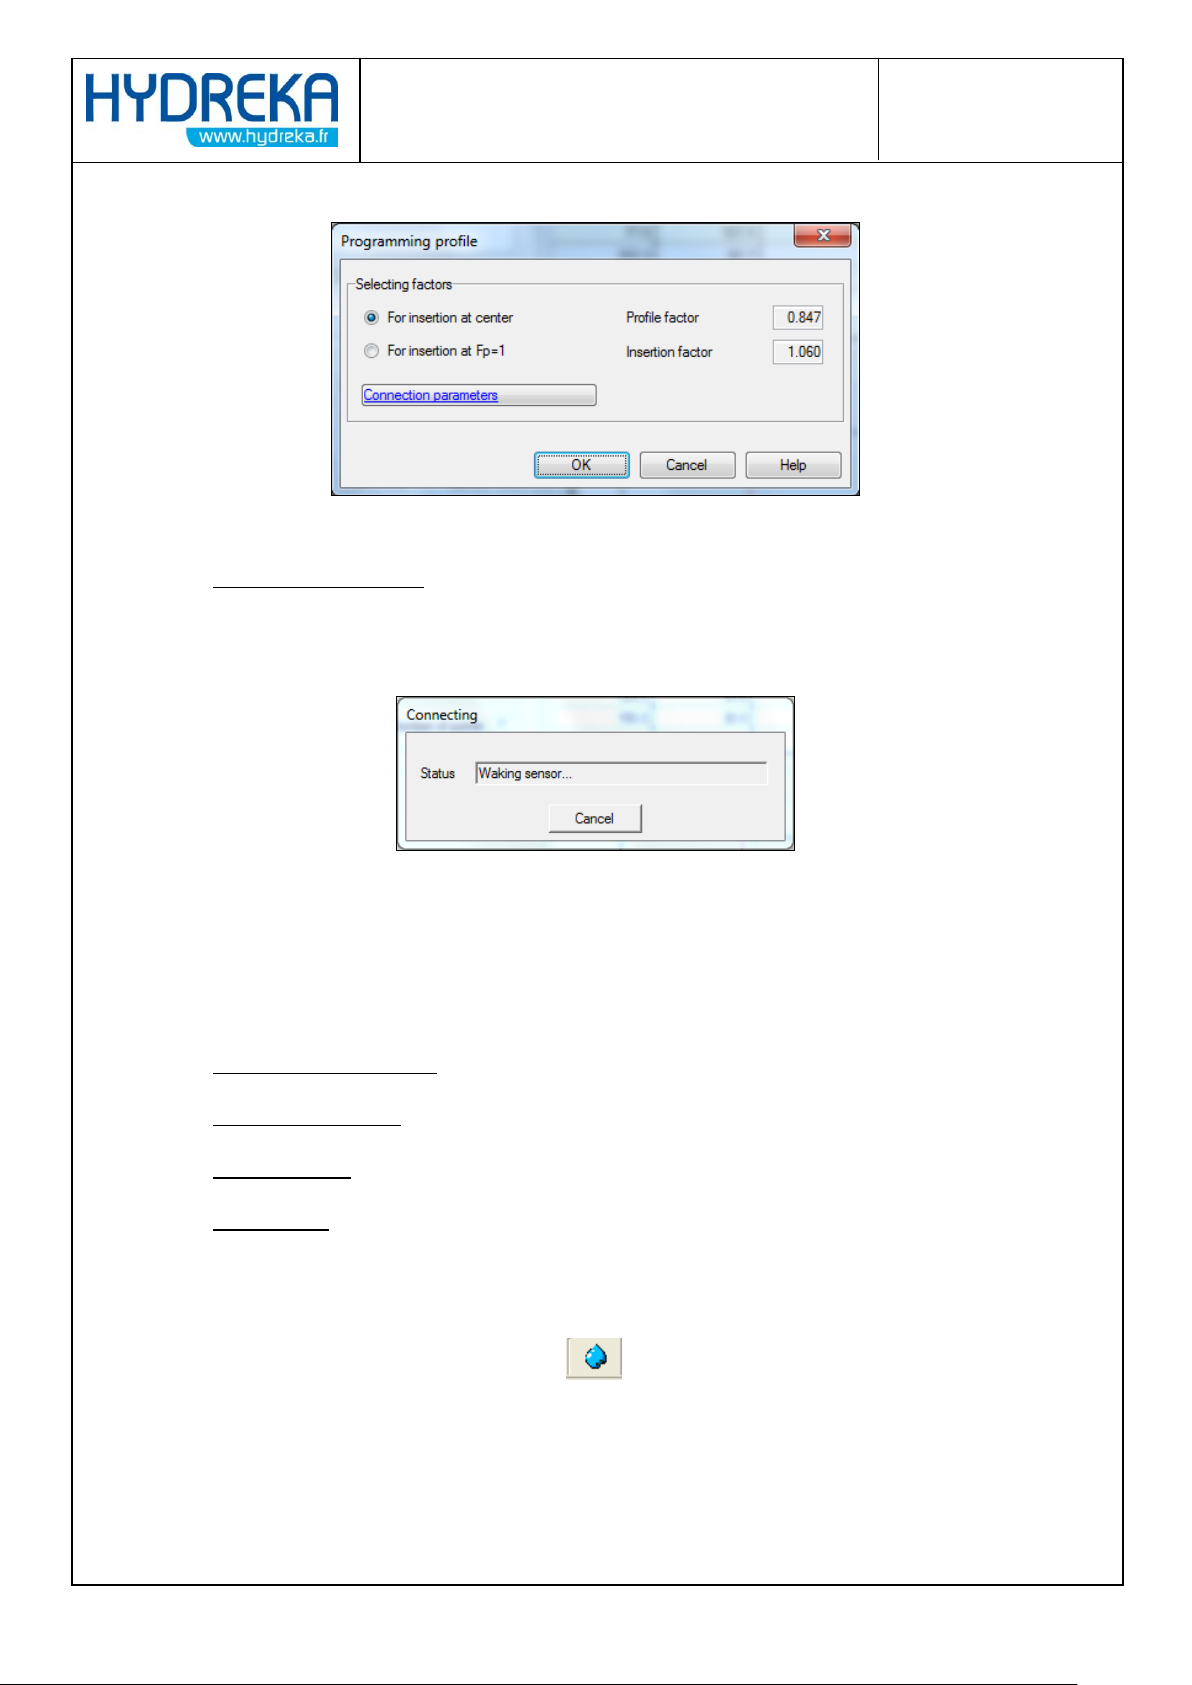
Select Program from the menu bar.
The following window opens:
Select the coefficients to be programmed:
For probe insertion at the centre of the pipe
Page 47
Page 47/77
HydrINS 2 / HydrINS 2 Mini flow meter
Programming of data logging with Winfluid
For probe insertion at the location where the profile factor is equal to 1
Figure 54: Flow meter programming window with velocity profile
Connection parameters: to ensure that the flow meter is properly connected. Gives access to
the same window as in section4.4.3
Click OK to establish transmission with the flow meter:
Figure 55: Programming the velocity profile
After programming, return to the main screen.
4.5.7 Transferring a velocity profile to Winfluid
Certain characteristics of a velocity profile can be sent directly to the Winfluid program:
Internal diameter of pipe
Position of the probe
Insertion factor
Profile factor
This function is available only when the Profile program has been launched from the Advanced
parameters window for the editing of the configuration of a HydrINS probe.
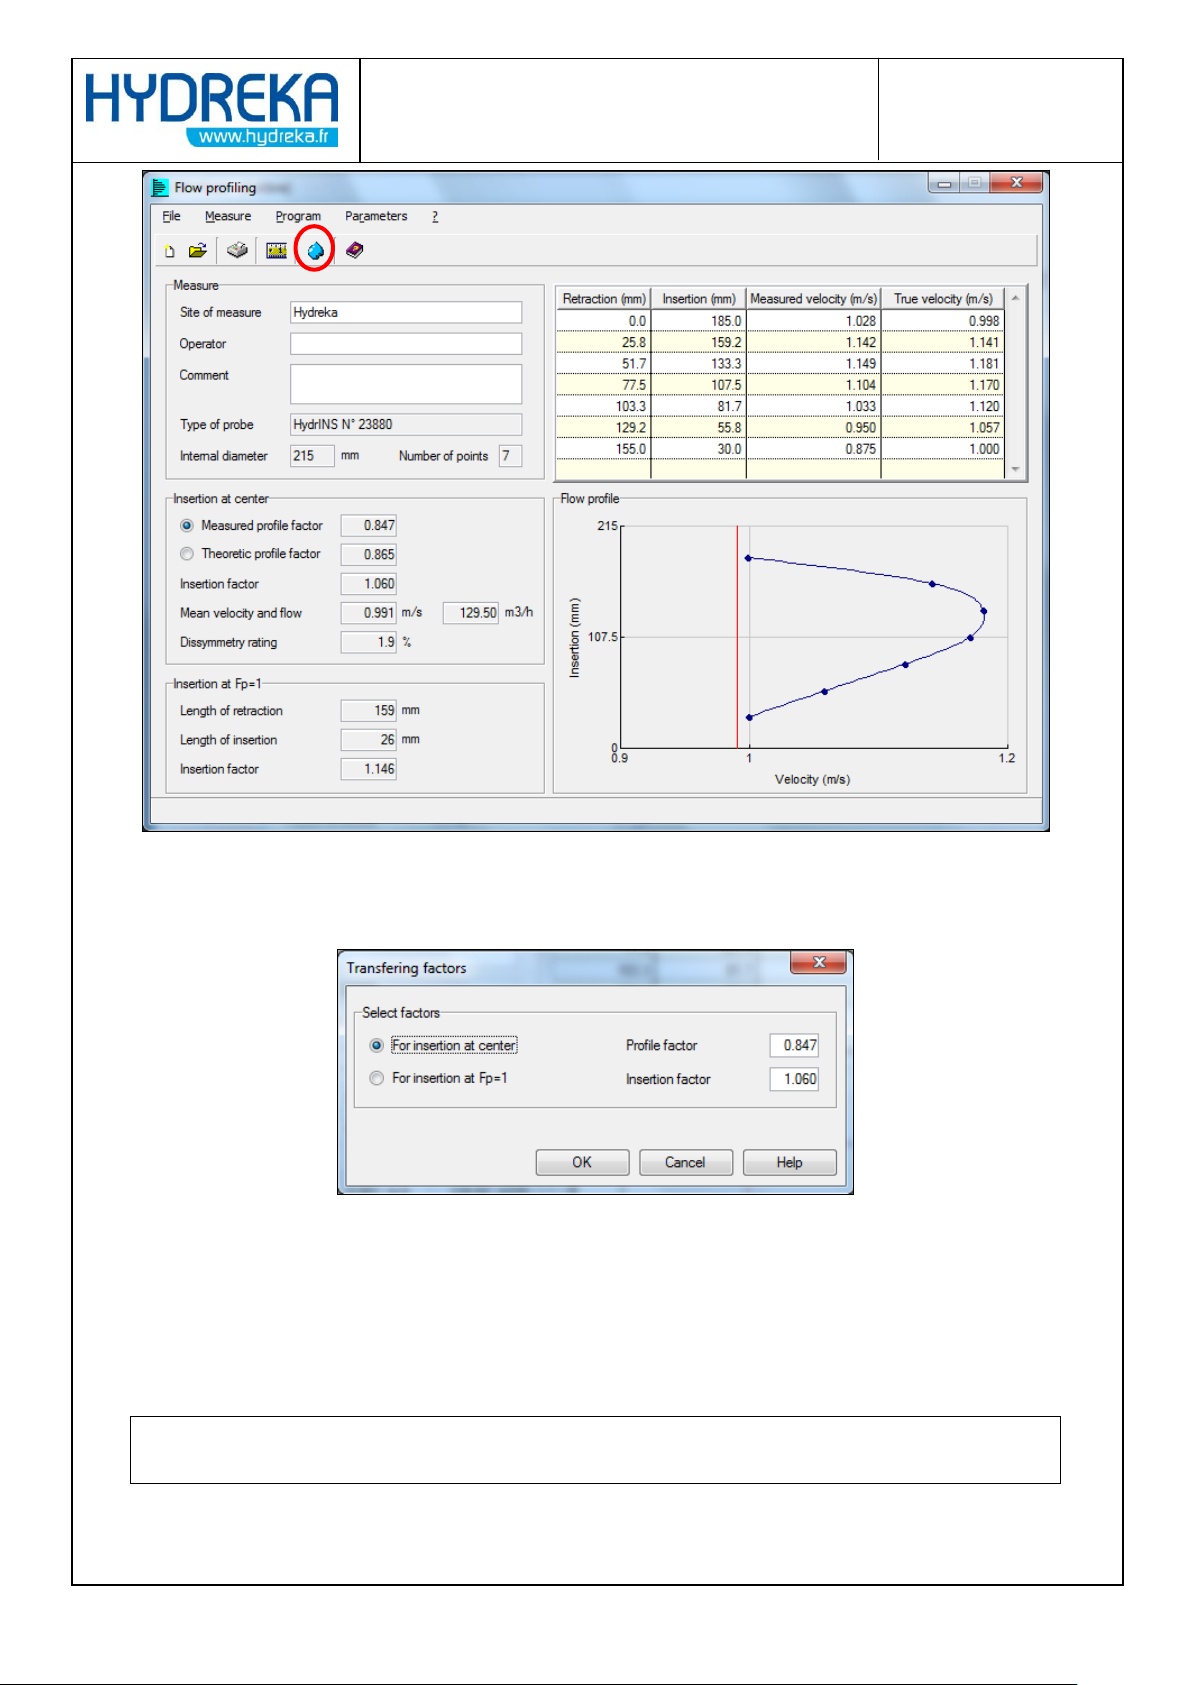
To send the stored profile to Winfluid, click the button in the toolbar.
Page 48
Page 48/77
HydrINS 2 / HydrINS 2 Mini flow meter
Programming of data logging with Winfluid
Figure 56: Sending the velocity profile programming to Winfluid
The following window then opens:
Figure 57: Window to send coefficients to Winfluid
Select the coefficients to be programmed:
For probe insertion at the centre of the pipe
For probe insertion at the location where the profile factor is equal to 1
Confirm this choice using the OK button: The Profile program then closes and the running of the
Winfluid program is resumed.
Page 49
Page 49/77
HydrINS 2 / HydrINS 2 Mini flow meter
Programming of data logging with Winfluid
WARNING: A profile measured using a HydrINS 2 cannot be sent to a
HydrINS 2 Mini.
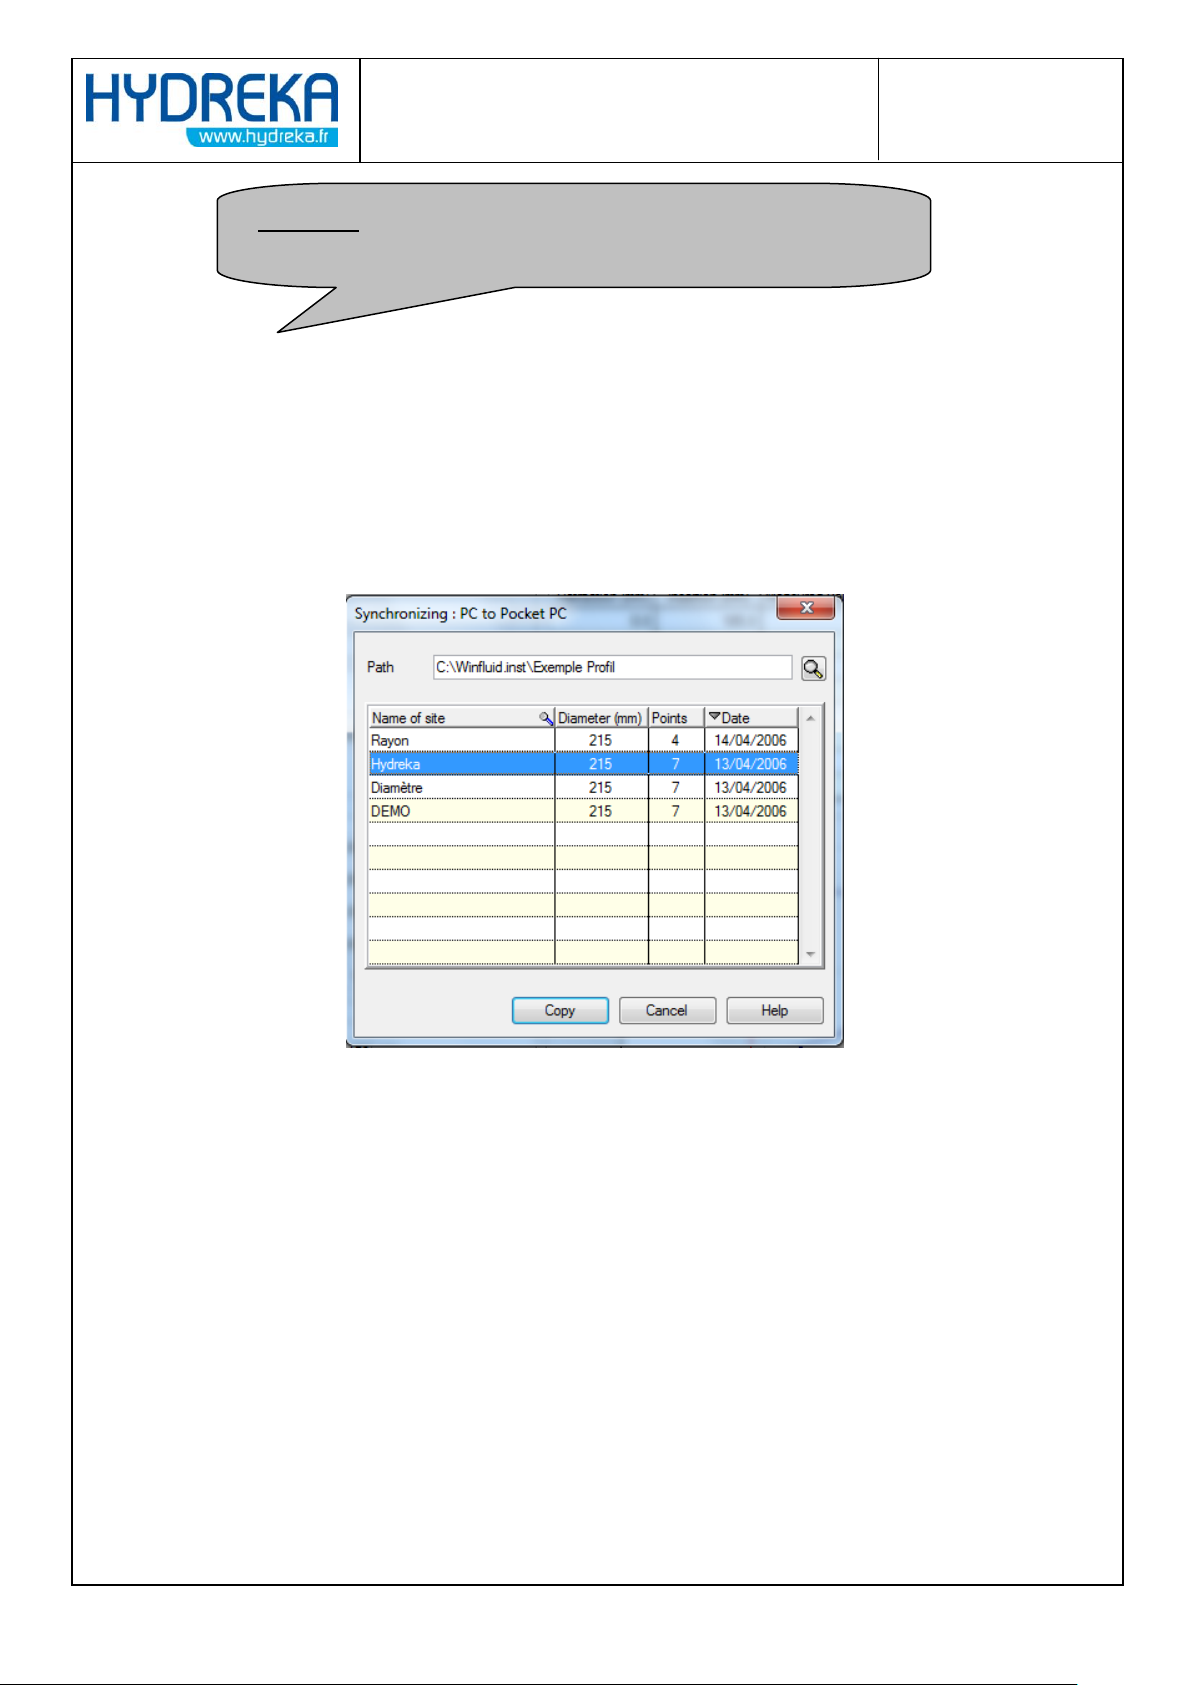
4.5.8 Synchronisation of PC/Pocket PC profile files
This tool lets you copy profiles measured in the field using a Pocket PC equipped with Profil Mobile
software to a desktop computer, or to copy profiles from a desktop computer to a Pocket PC so that
you can process them using Winfluid Mobile.
To copy one of more profiles from the PC to the computer, click File > Synchronise > PC to Pocket
from the menu bar.
Figure 58: Pocket PC to PC synchronisation window
Select the archive folder for the profiles to be copied and the profile(s) to be copied from the list, and
then confirm the selection by clicking the Copy button. The destination folder selection window is
then opened. Select the folder to which the selected profiles will be copied, and confirm copying by
clicking the OK button.
5 Hydrins Display Software
This software is used to view the measurement taken by the HydrINS flow meter in real time, as well
as battery status when the flow meter is not connected to a display unit.
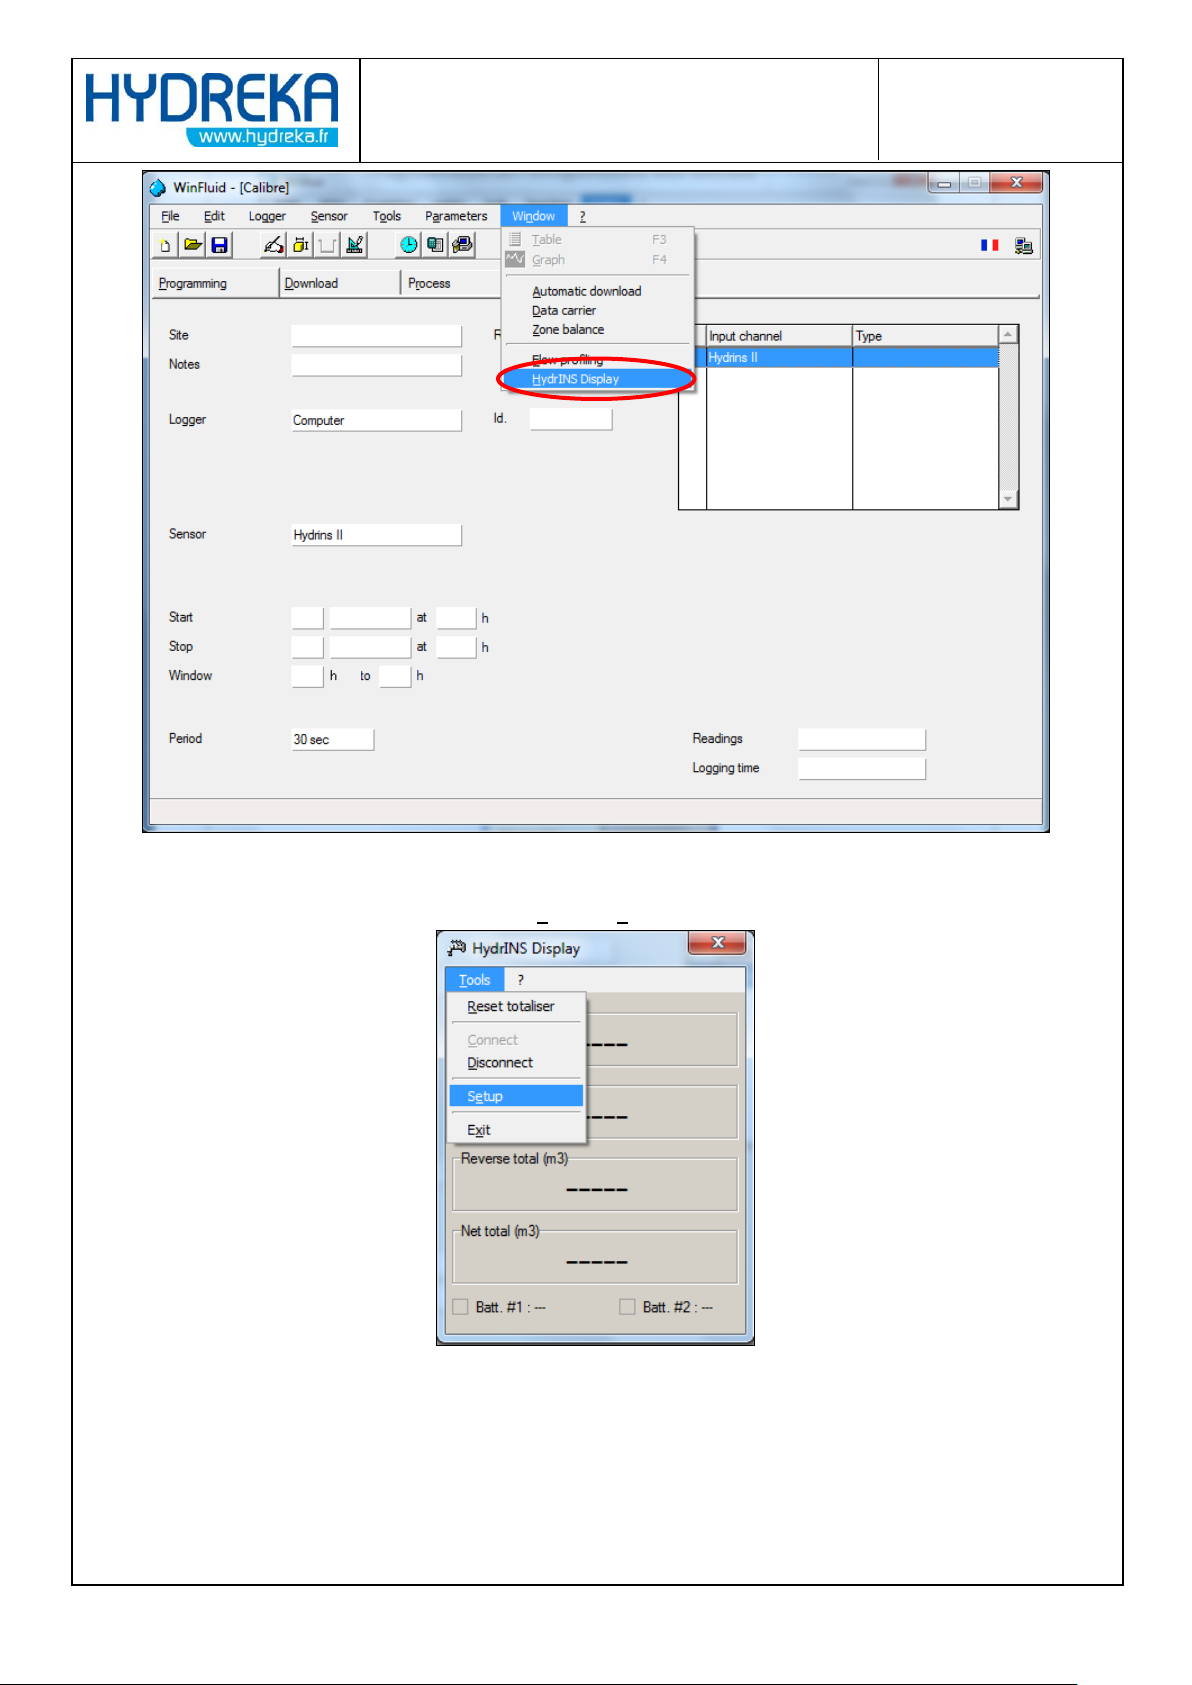
To launch it from the Winfluid main menu, click Window > HydrINS Display.
Page 50
Page 50/77
HydrINS 2 / HydrINS 2 Mini flow meter
Programming of data logging with Winfluid
Figure 59: Access to the HydrINS Display management window
To configure the software beforehand, click Tools > Setup.
Figure 60: HydrINS display tool – Access to configuration
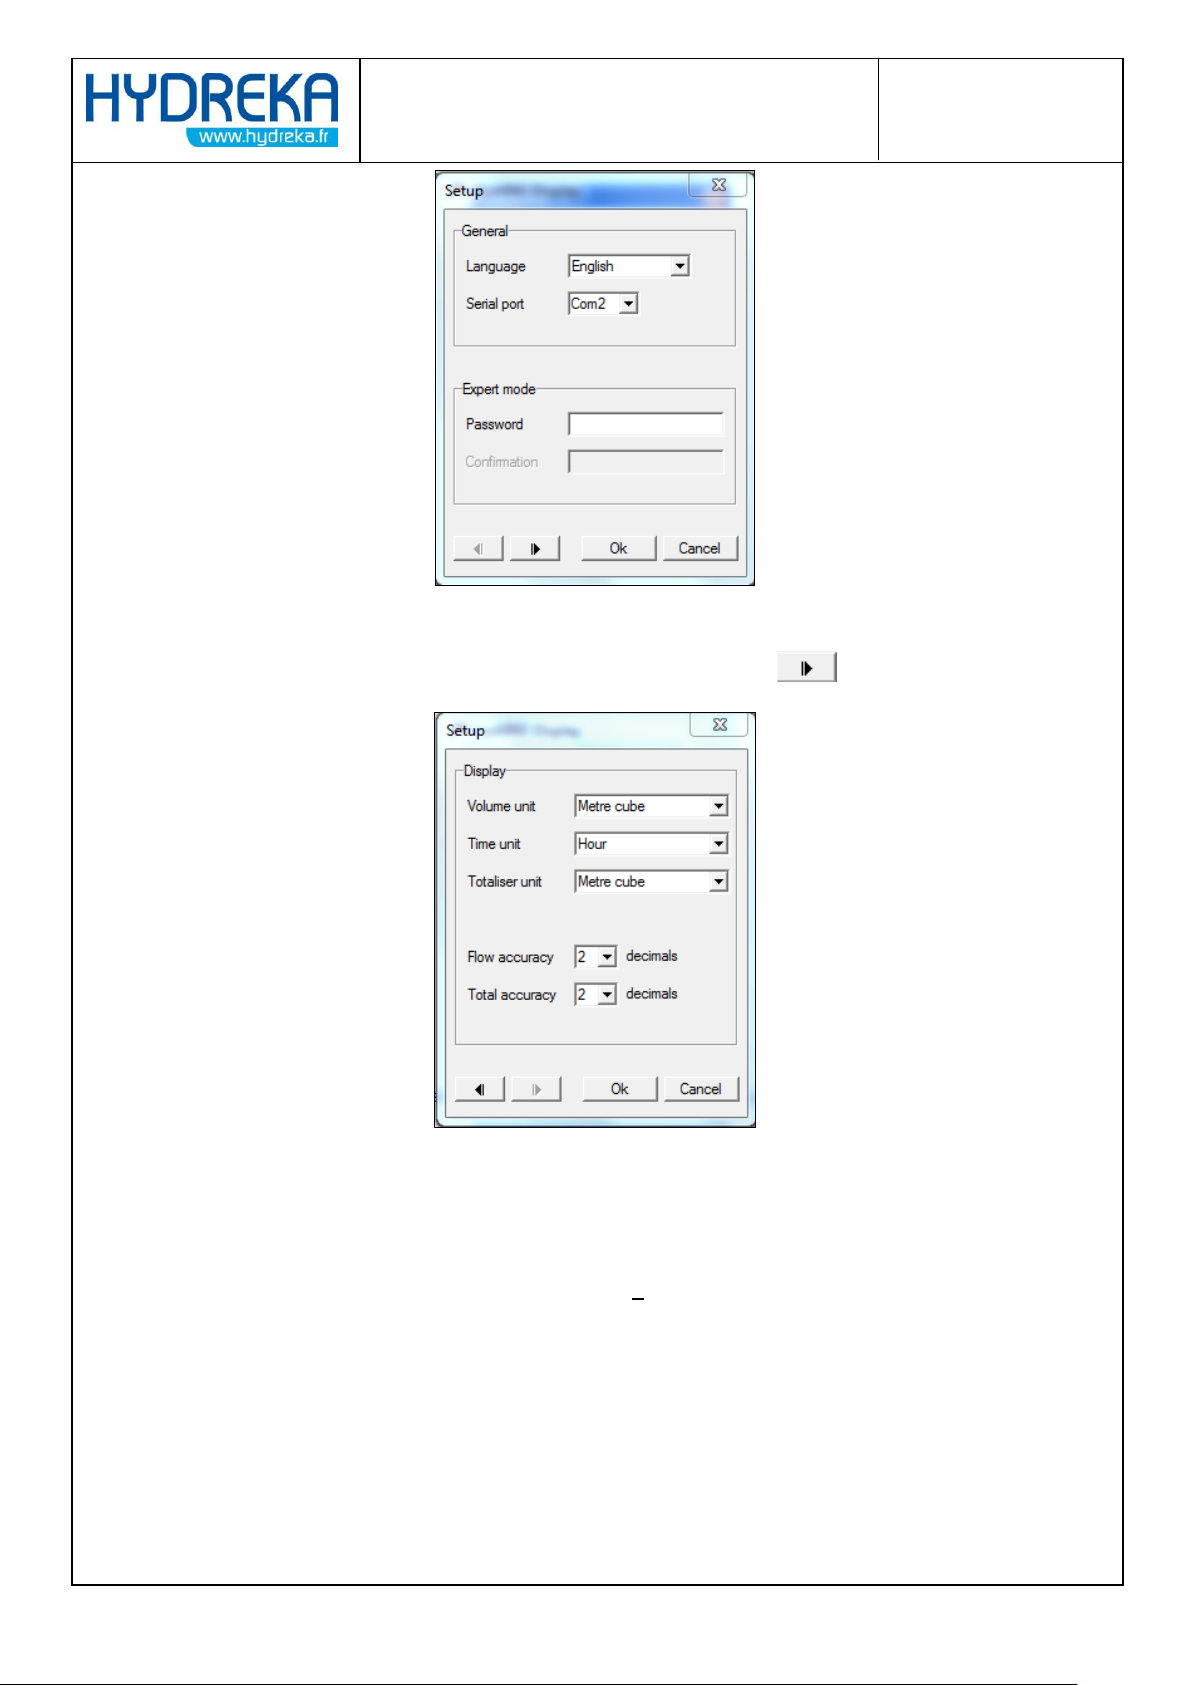
Next, define the language and then the serial port of the computer to which the flow meter is
connected.
Page 51
Page 51/77
HydrINS 2 / HydrINS 2 Mini flow meter
Programming of data logging with Winfluid
Figure 61: HydrINS Display Tool – Configuration
To access Advanced mode, enter the password and then confirm. Click .
Figure 62: HydrINS Display Tool – Display configuration
Set the units and the number of decimal places, and then click OK to confirm the display
configuration.
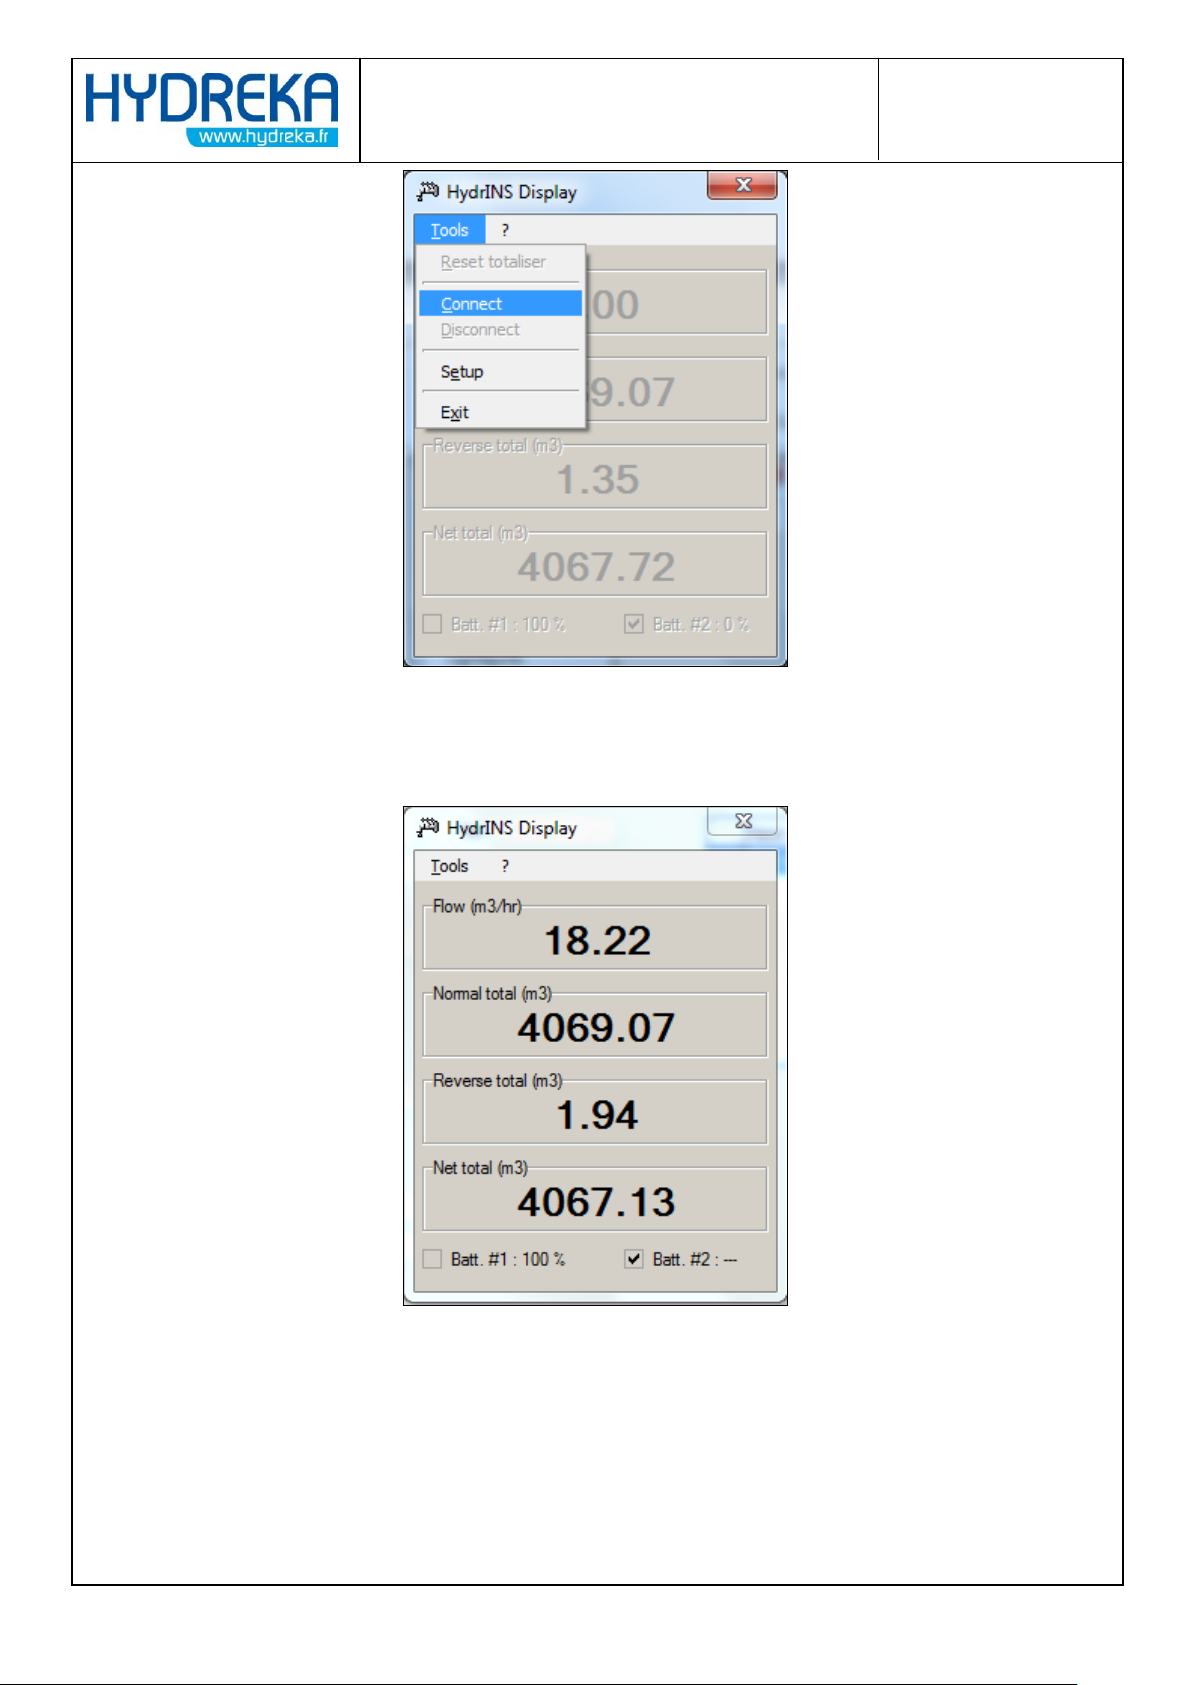
To view the measured values in real time, click Tools > Connect.
Page 52
Page 52/77
HydrINS 2 / HydrINS 2 Mini flow meter
Programming of data logging with Winfluid
Figure 63: HydrINS Display Tool – Connection
The flow rate, the totalisers, the battery used, and the remaining battery charge percentage for each
battery can then be viewed in real time.
Figure 64: HydrINS Display Tool – Real-time display
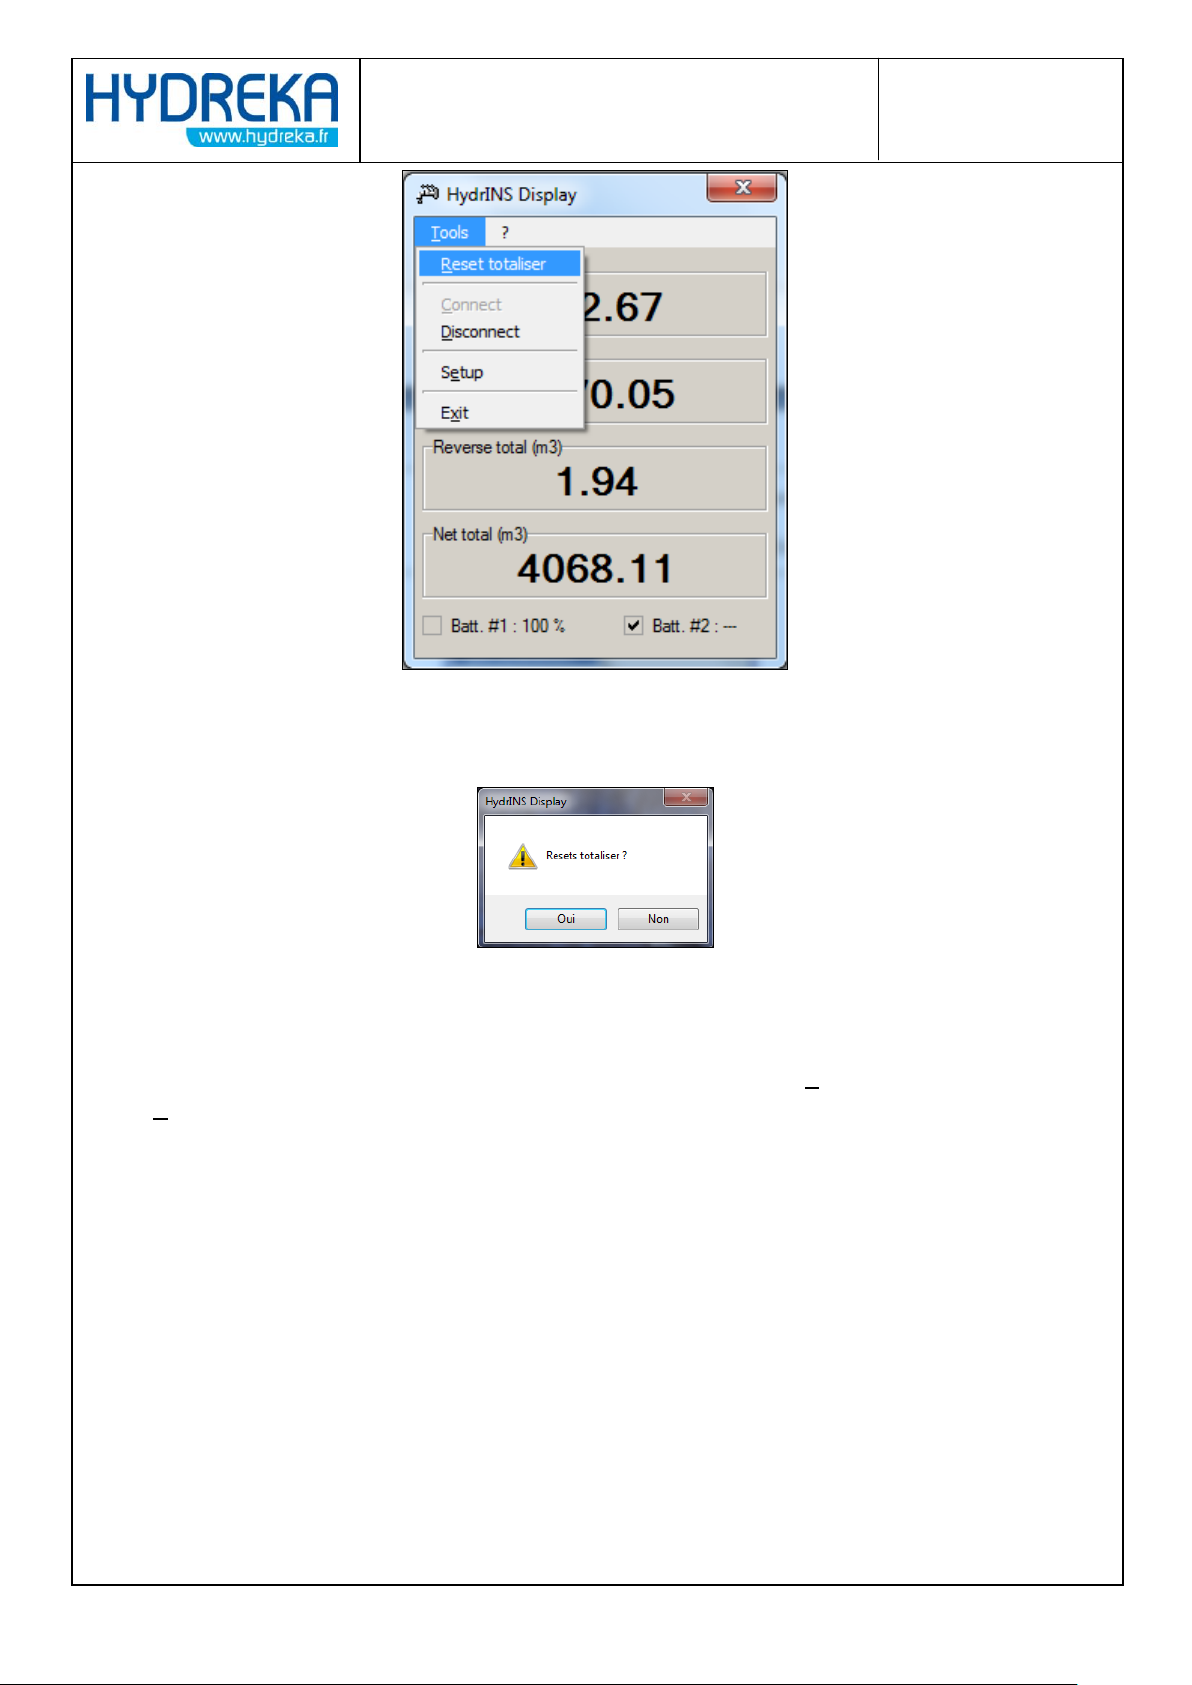
From the main menu, you can reset the internal totalisers and the flow meter.
Click Tools > Reset totalisers.
Page 53
Page 53/77
HydrINS 2 / HydrINS 2 Mini flow meter
Programming of data logging with Winfluid
Figure 65: HydrINS Display Tool – Reset totalisers
A confirmation window appears:
Figure 66: HydrINS Display Tool – Reset totalisers – Confirmation
Click Yes to confirm the reset.
To quit the program, first disconnect the flow meter by selecting Tools >Disconnect and then Tools
>Quit.
6 Remote assistance
In the event of problems when programming the HydrINS 2 / HydrINS 2 Mini flow meter, remote
assistance can be obtained using Winfluid functionality.
It allows one computer to take control of another remotely when both are connected to the Internet.
This allows a user to request remote assistance from a qualified person (Hydreka or other).
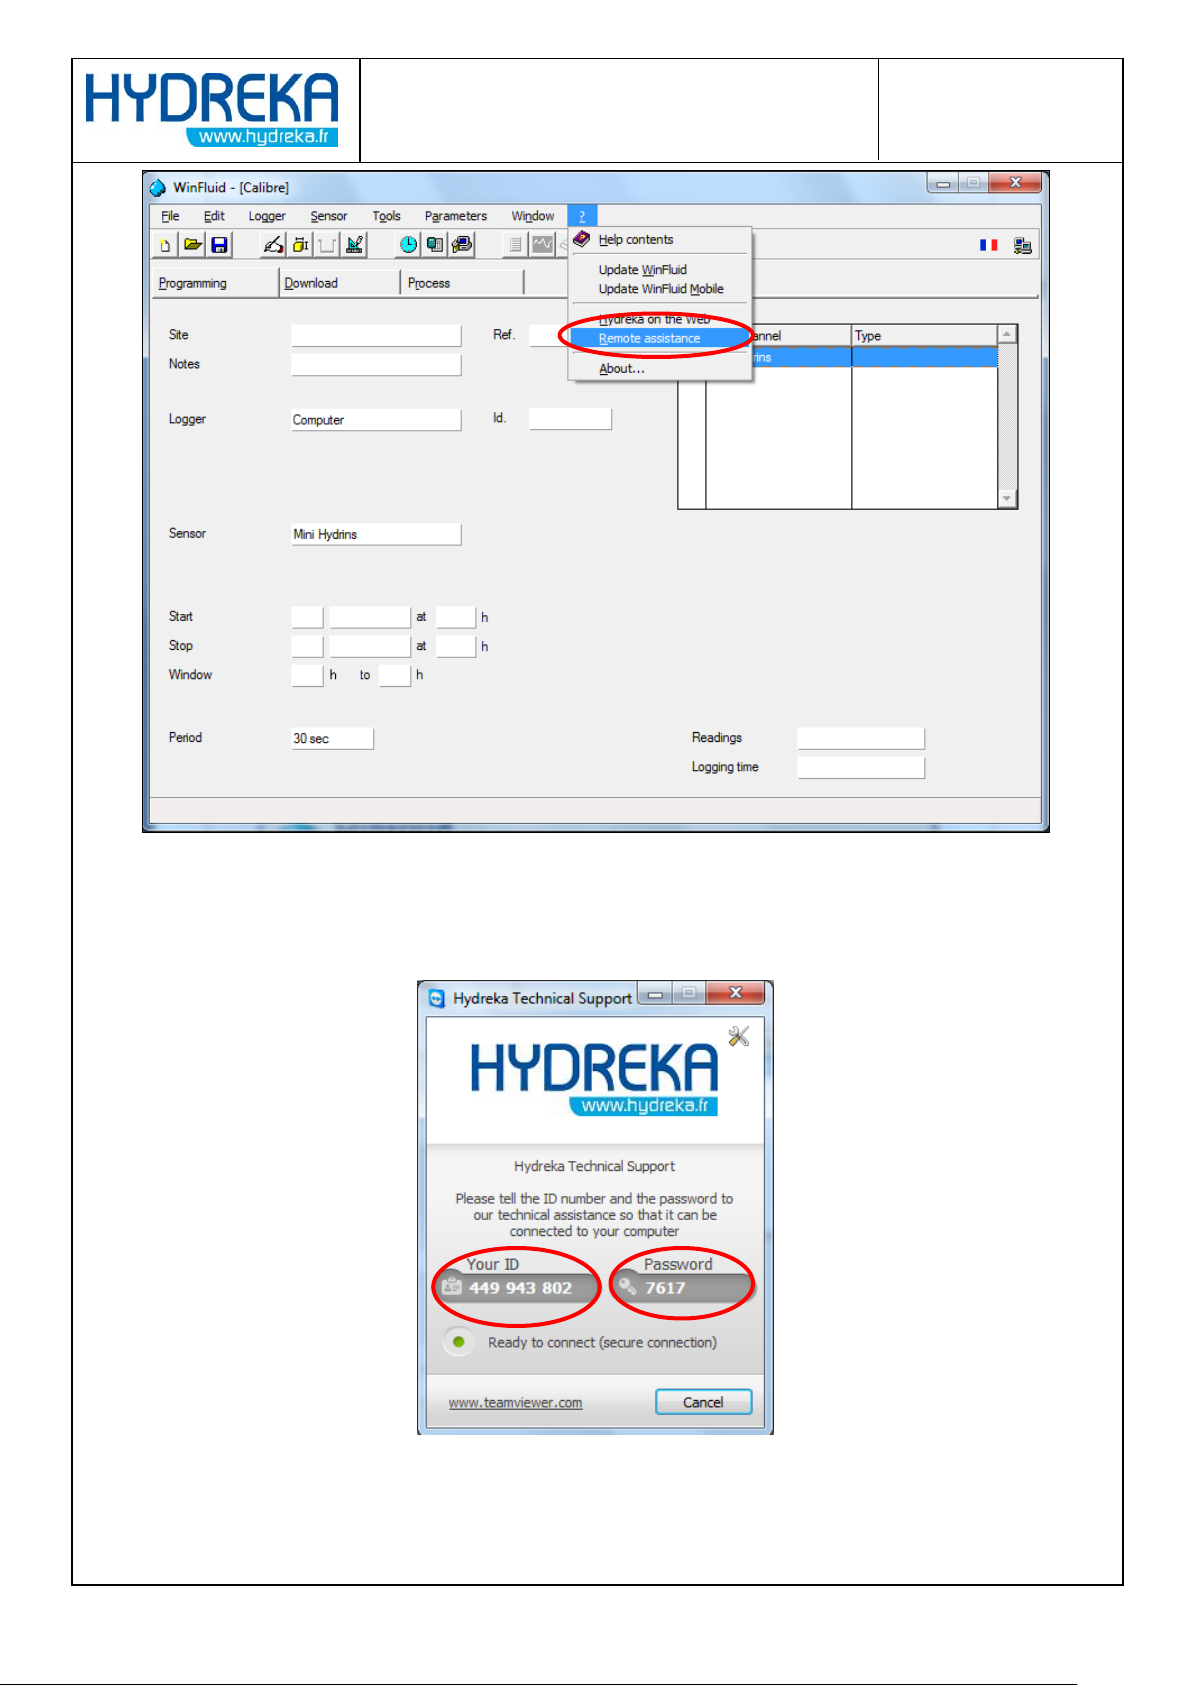
To do this, the user must establish a remote connection from Winfluid by clicking ? > Remote
assistance
Page 54
Page 54/77
HydrINS 2 / HydrINS 2 Mini flow meter
Programming of data logging with Winfluid
Figure 67: Launching remote assistance
Identifiers are then displayed. Inform the assistance operator of your ID and Password to allow
him/her to take control of the computer in the field.
Figure 68: Connection information for remote assistance
Page 55
Page 55/77
HydrINS 2 / HydrINS 2 Mini flow meter
Programming of data logging with Winfluid
7 Maintenance
Winfluid is constantly being upgraded. It is important to ensure that the Winfluid software is up to
date in order to make the most of the functionality of your probe. If your computer is connected to
the Internet, you can perform an automatic update search. If the need for an update is detected, the
update file is downloaded from the HYDREKA server.
After purchasing Winfluid or a Winfluid update, the user obtains free updates of Winfluid for one
year. Beyond that time, you must acquire an update from Hydreka to be able to update Winfluid. If
necessary, contact your Customer Service Representative.
If your PC is not connected to the Internet, check the Hydreka website to determine the latest
version of Winfluid.
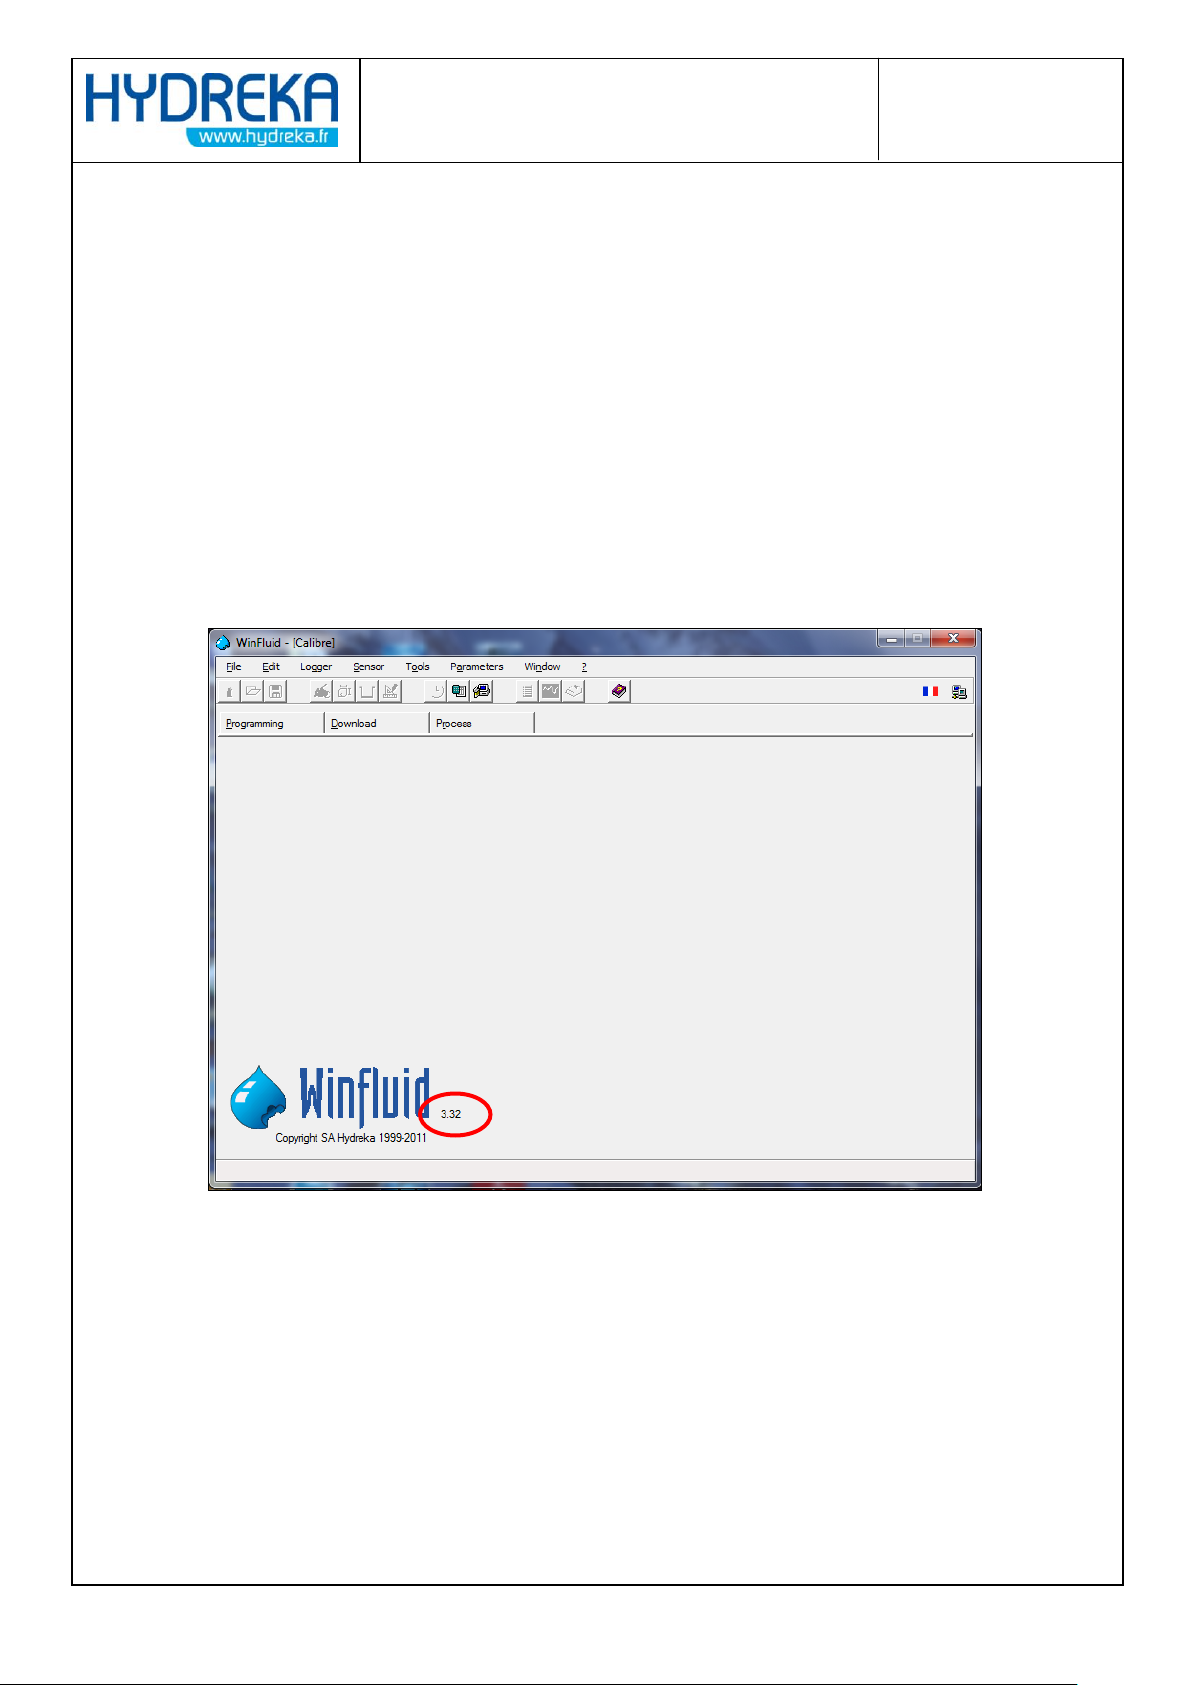
To find out the current version of your Winfluid software, read the version number in the bottom
left-hand corner of the home screen:
Figure 69: Checking the current version of Winfluid on the home screen
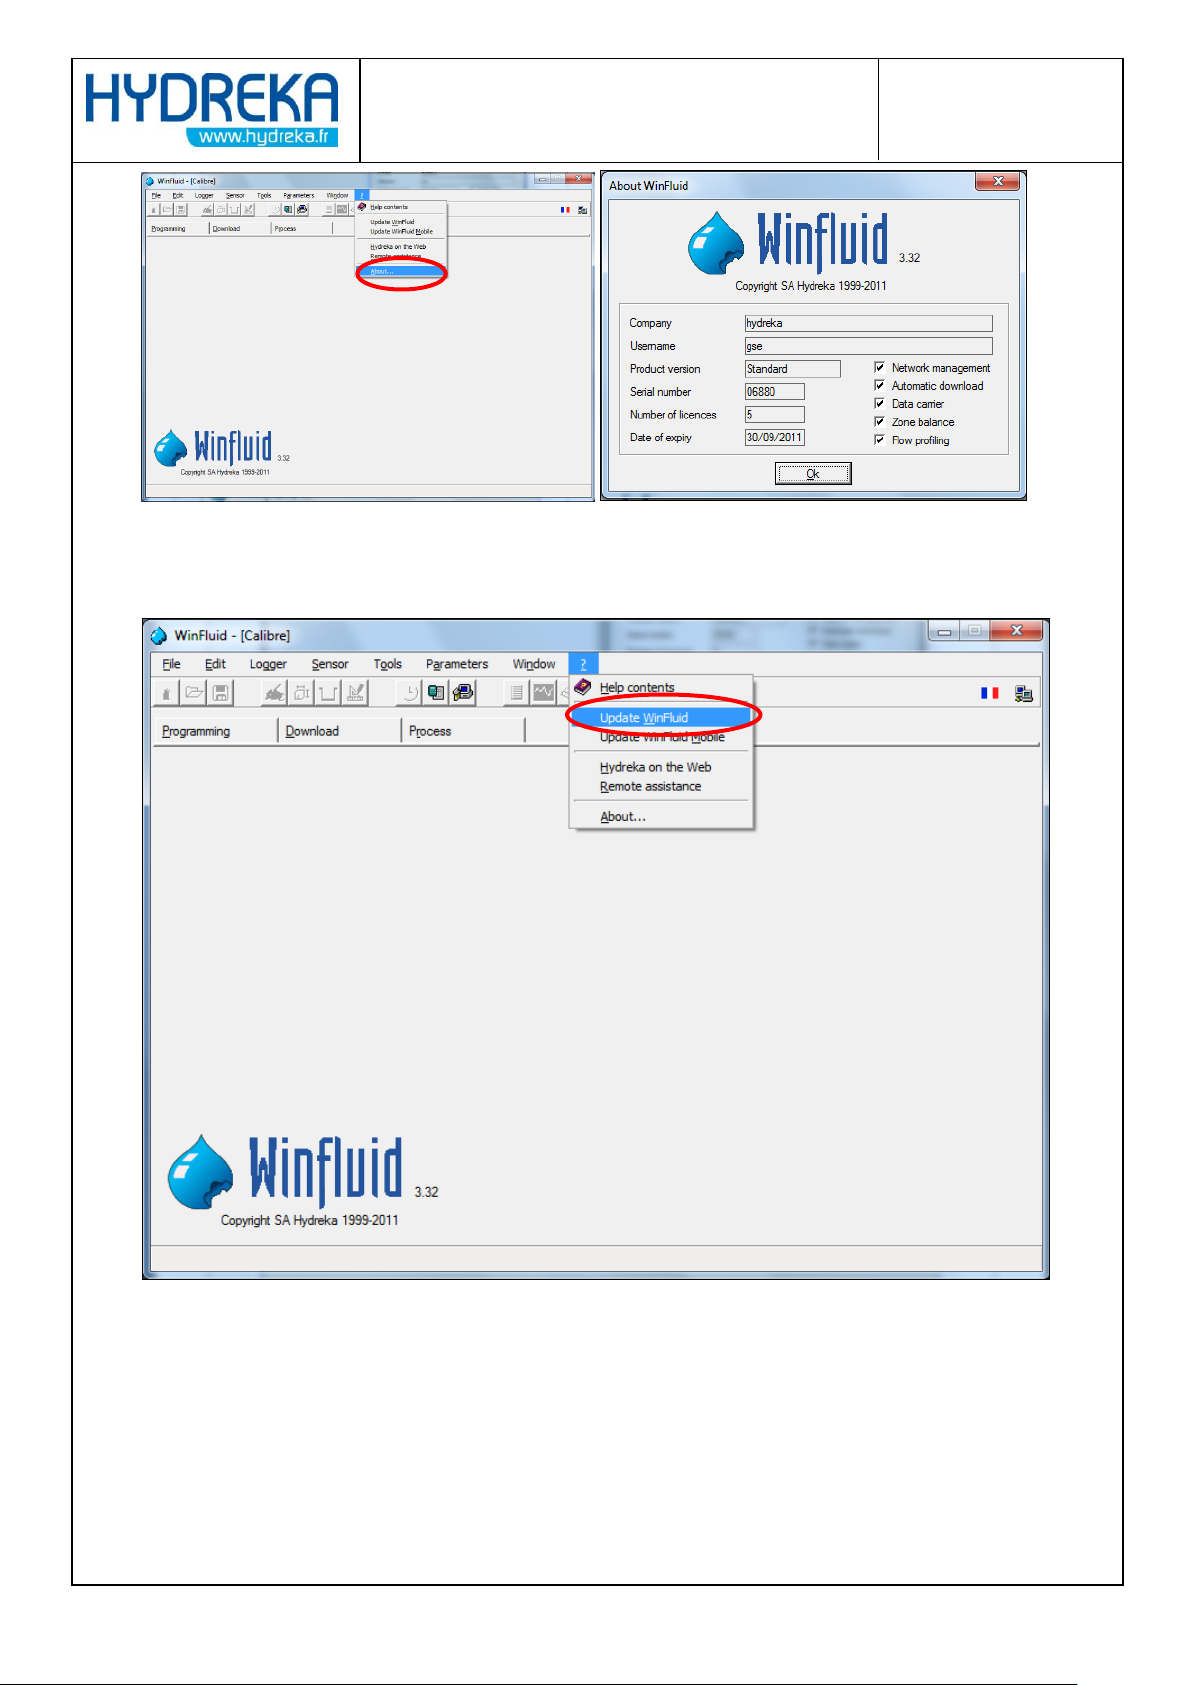
You can also view the current version by clicking ? > About to bring up the following window:
Page 56
Page 56/77
HydrINS 2 / HydrINS 2 Mini flow meter
Programming of data logging with Winfluid
Click ? > Update Winfluid
Figure 70: Displaying the About Winfluid section
Figure 71: Updating Winfluid from the main screen
The following window appears
Page 57
Page 57/77
HydrINS 2 / HydrINS 2 Mini flow meter
Programming of data logging with Winfluid
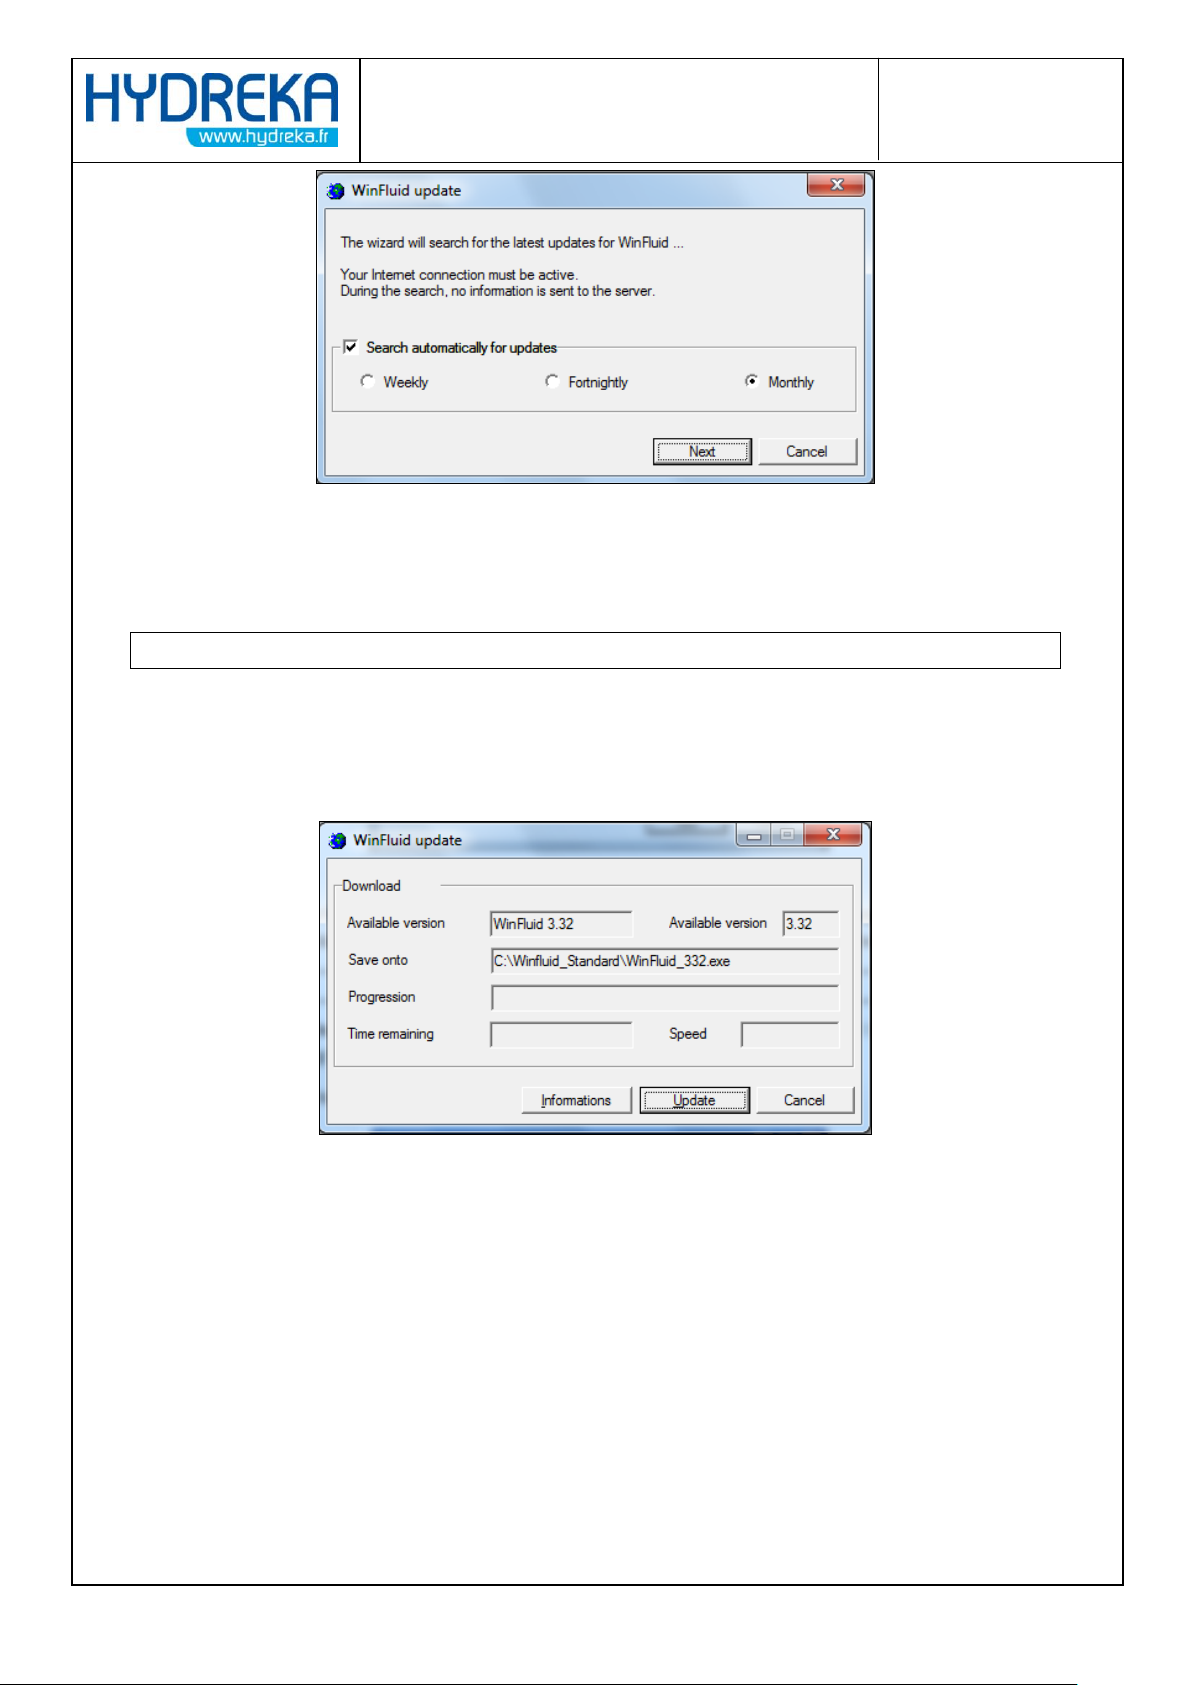
Figure 72: Winfluid update – selecting the update frequency
It is very useful to select the Search automatically for update box to receive a message about new
available updates when you open Winfluid (ensure that an Internet connection is active).
Click Next.
Click Update, and then enter your user name and the password provided by HYDREKA. Downloading
from the Hydreka server then begins.
When downloading is complete, the following window is displayed:
Figure 73: Winfluid update – Displaying the update information
Click Install to launch installation of the update.
8 HydrINS software
The Hydrins software is installed from two directories on the CD: Hydrins_Version_Francaise for the
French version and Hydrins_English_Version for the English version. It is a supplement to the Winfluid
software, used only when other data loggers or remote management are used.
This software is used for:
Page 58
Page 58/77
HydrINS 2 / HydrINS 2 Mini flow meter
Programming of data logging with Winfluid
Programming a HydrINS 2 flow meter
Read the configuration of a HydrINS 2 flow meter
View the measurements of a HydrINS 2 flow meter
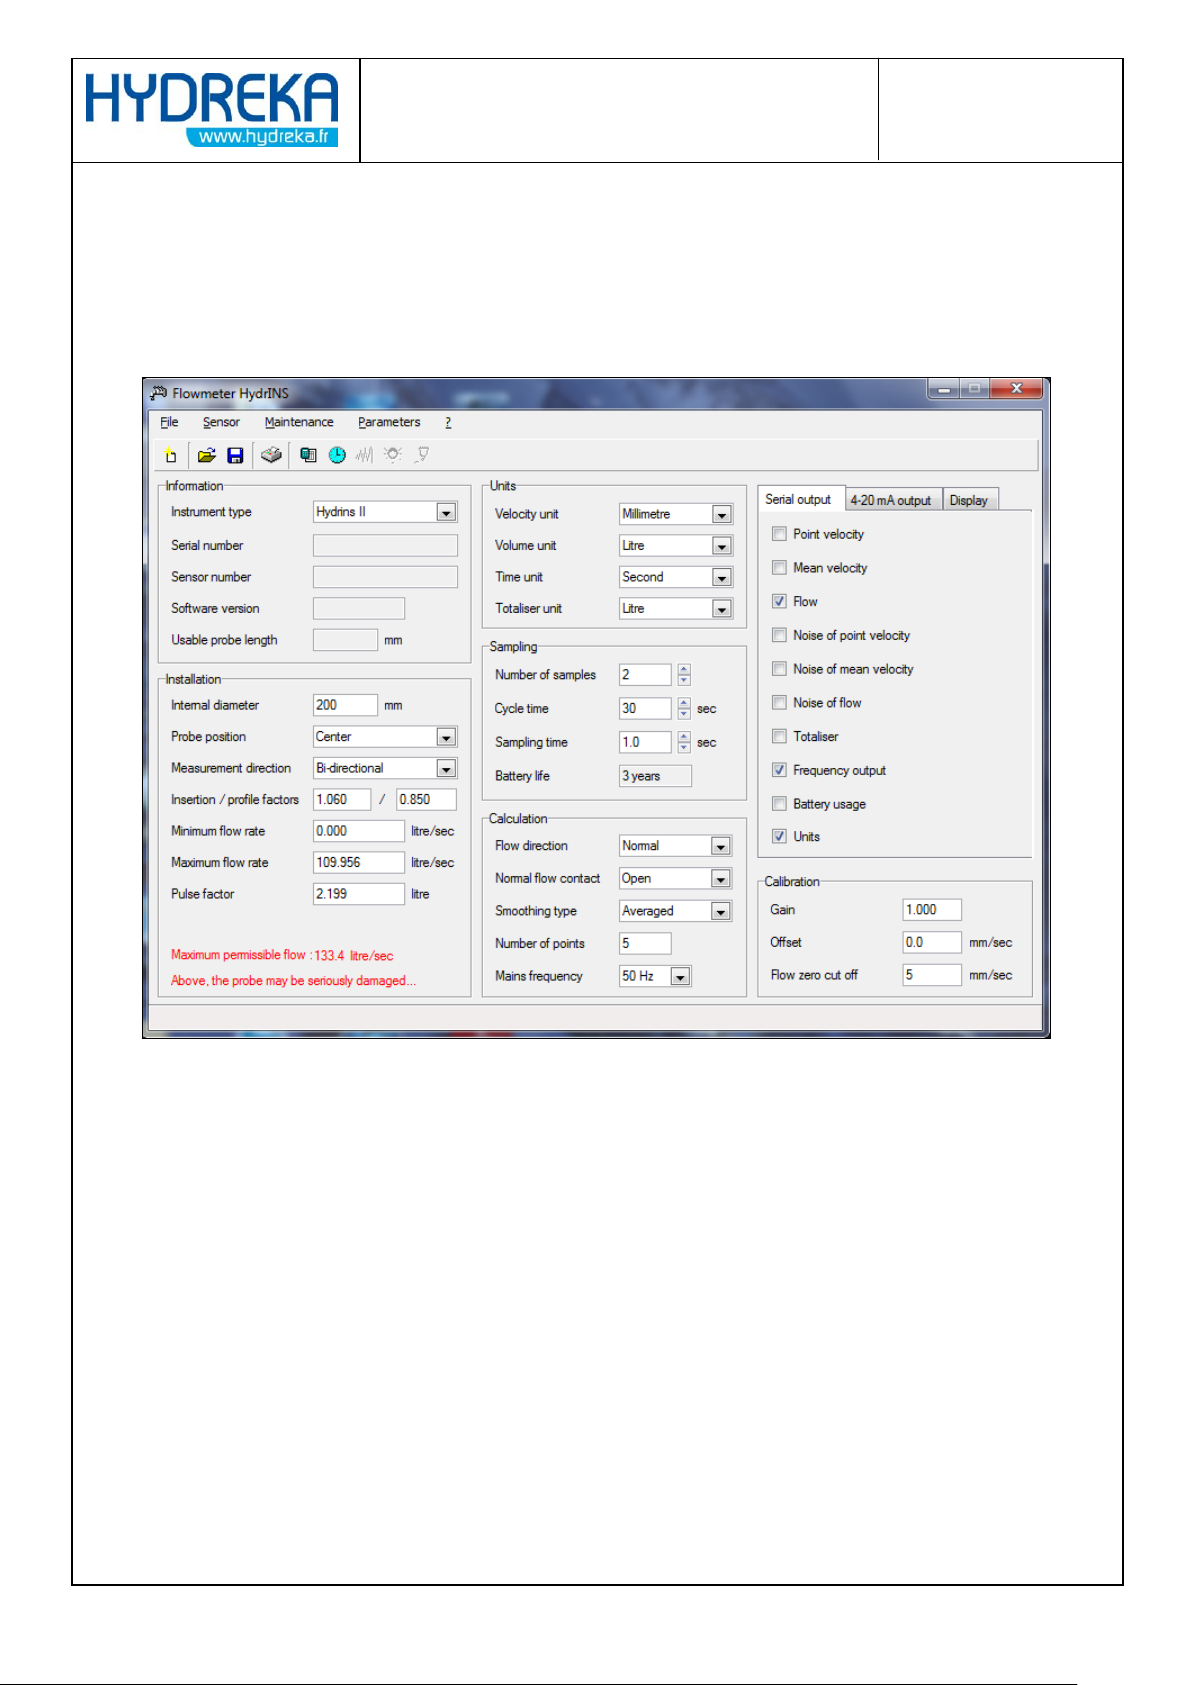
The software launch icon is in the directory C:\HydrINS by default. The home window is as follows:
Figure 74: HydrINS software – HydrINS software home screen
8.1 Configuration
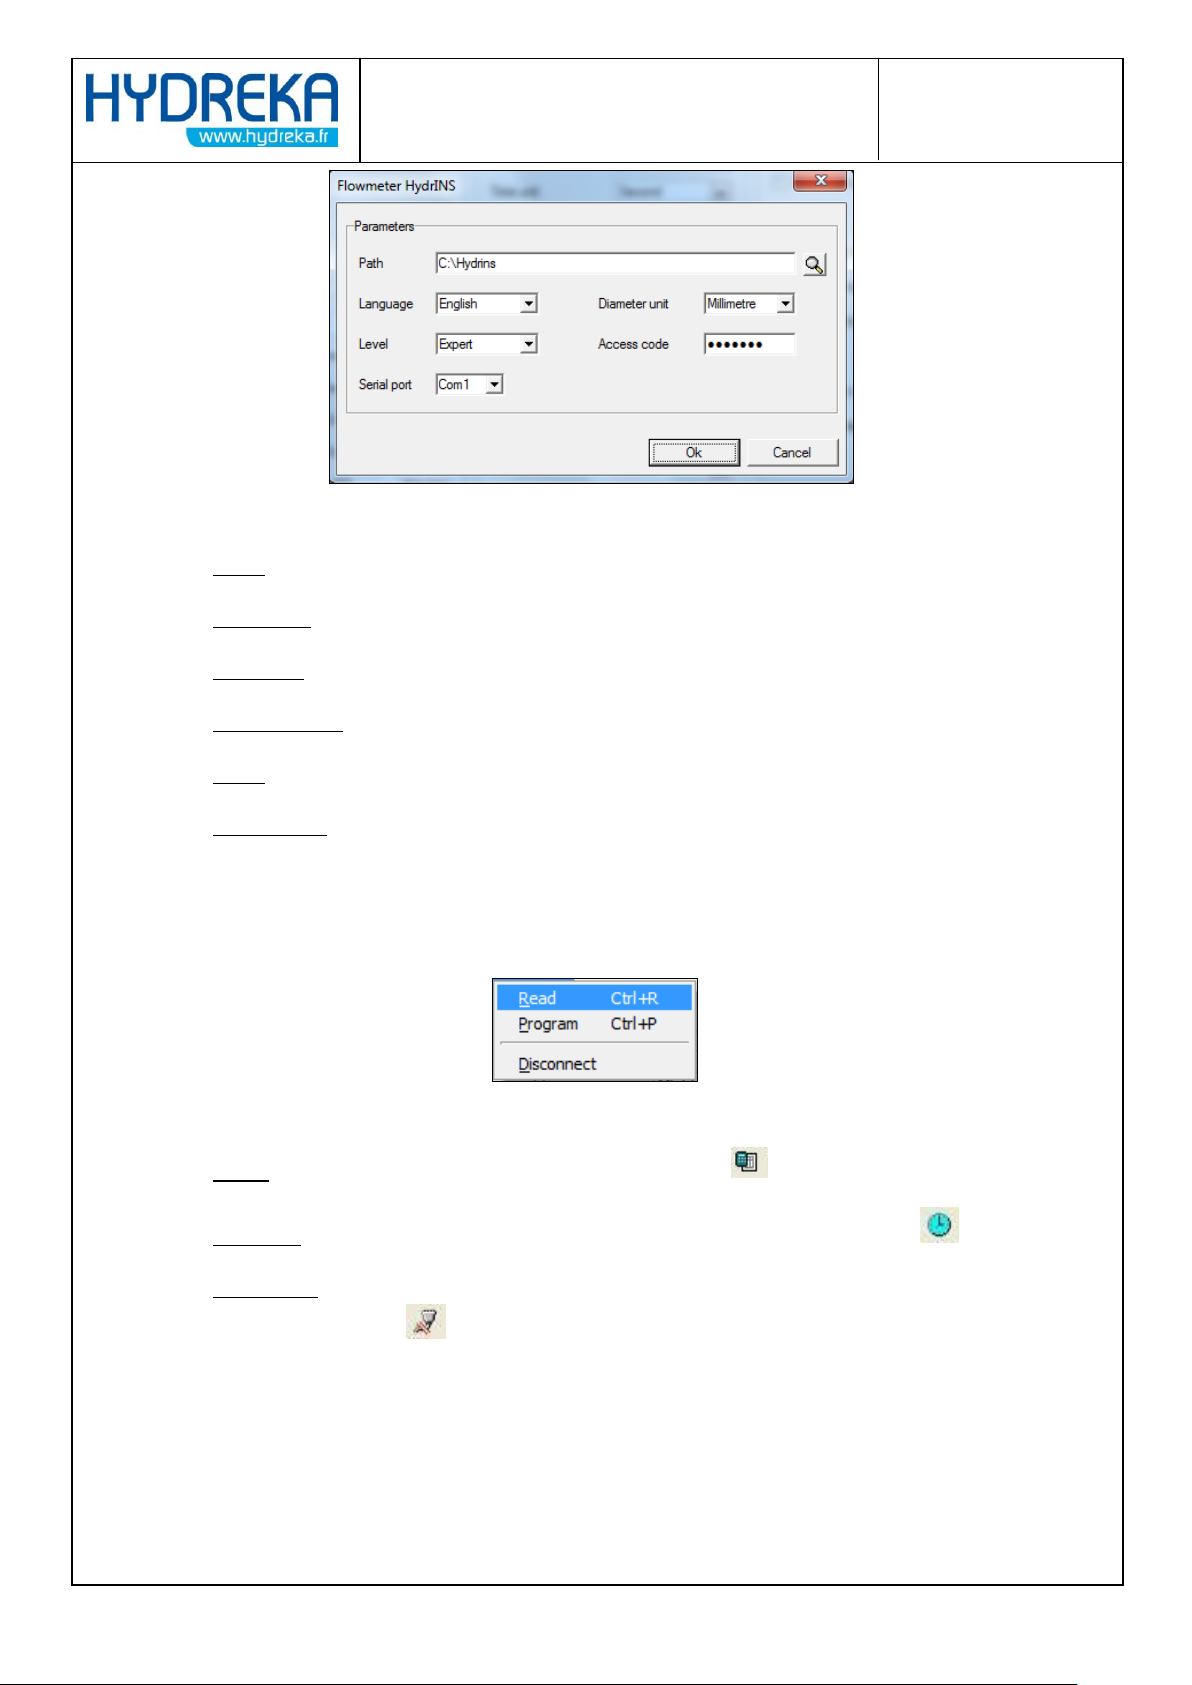
To configure the workspace, click Parameters in the menu bar.
Page 59
Page 59/77
HydrINS 2 / HydrINS 2 Mini flow meter
Programming of data logging with Winfluid
Figure 75: HydrINS software – Configuration of the workspace
Path: directory where the various configurations are archived
Serial port: serial port of the PC to which the HydrINS probe is connected
Language: language used by the software
Diameter unit: Unit of measurement used, metric or Imperial
Level: Software user level: Normal or Advanced.
Access code: to use Advanced Mode, enter the password 'HydrINS' (the password is not case-
sensitive).
8.2 Content of menus
8.2.1 Sensor menu:
Figure 76: HydrINS software - List of tasks available in the 'Sensor' menu
Read: retrieval of the configuration of the HydrINS probe. .
Program: Programming of the HydrINS probe with the displayed configuration. .
Disconnect: The HydrINS probe is disconnected from the serial port and starts up in
measurement mode. .
Page 60
Page 60/77
HydrINS 2 / HydrINS 2 Mini flow meter
Programming of data logging with Winfluid
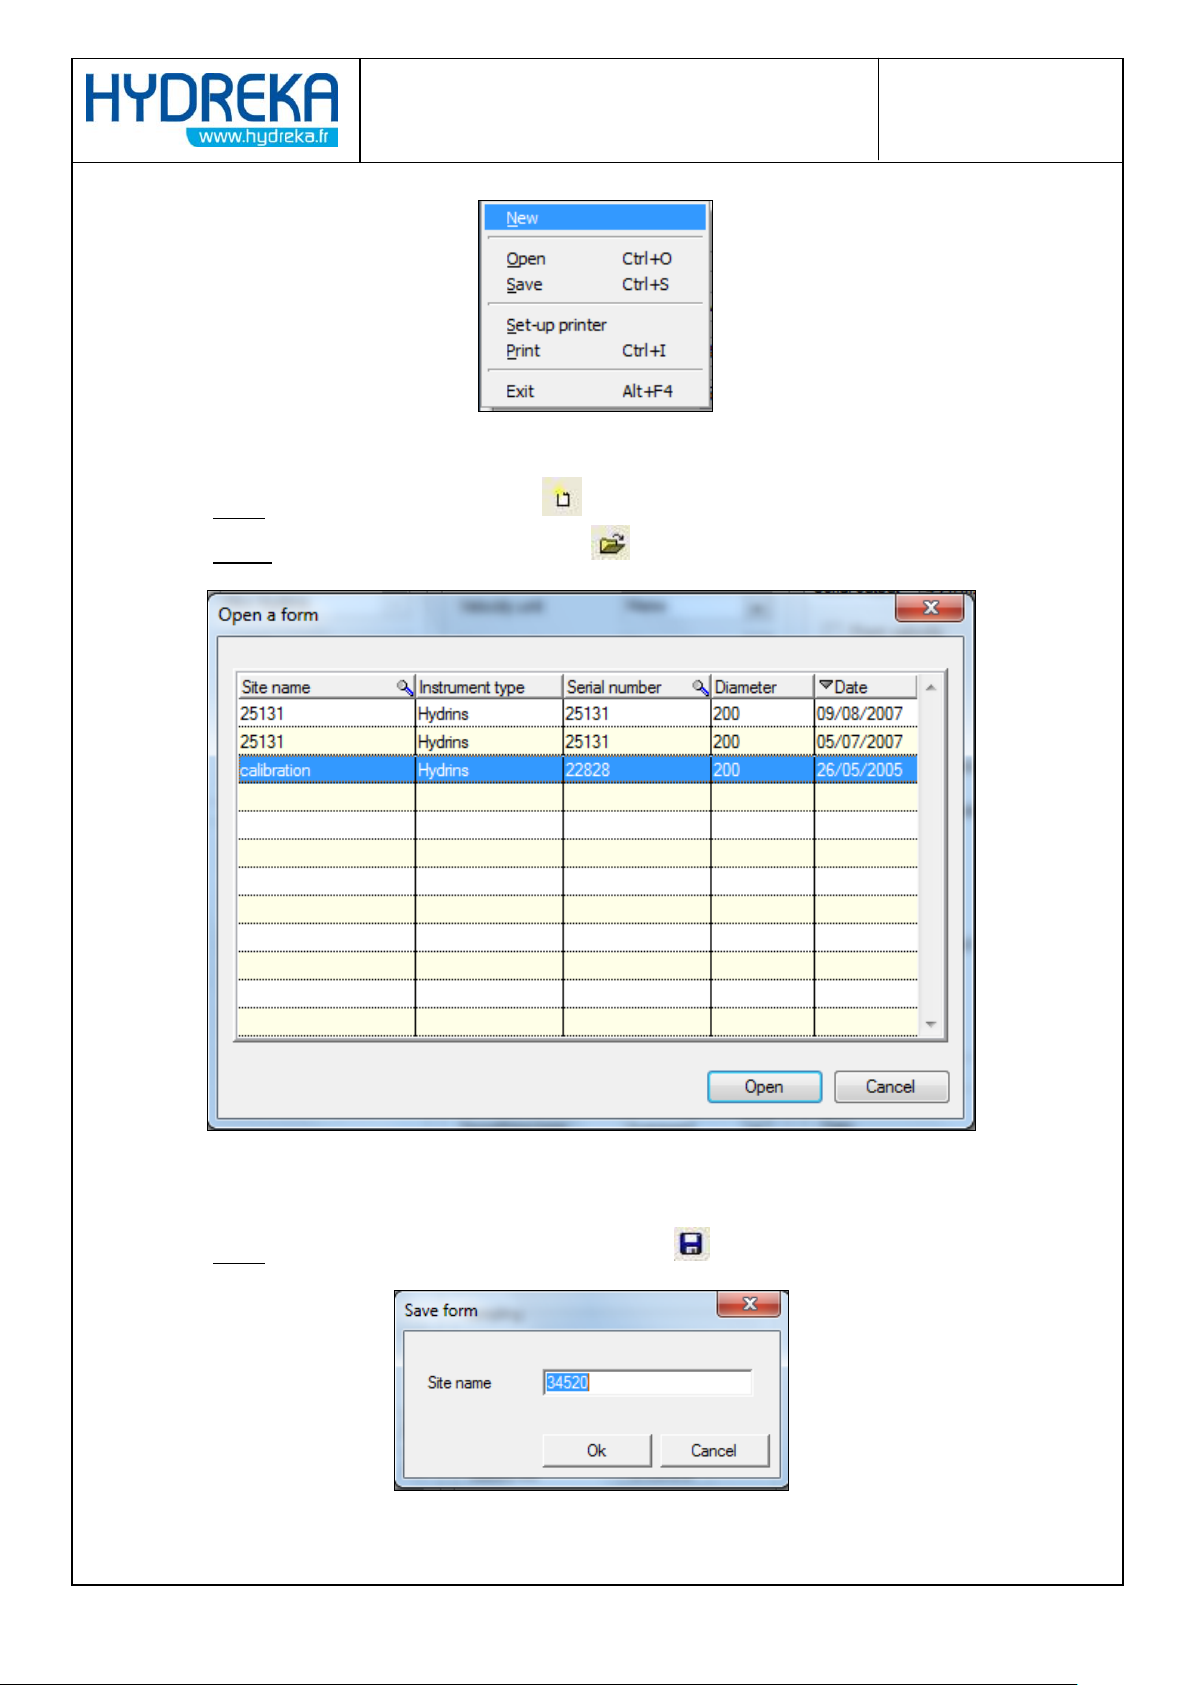
8.2.2 File Menu:
Figure 77: HydrINS software - List of tasks available in the 'File' menu
New: To create a new configuration. .
Open: Opening an archived configuration. .
Figure 78: HydrINS software - File opening window
Select the file, and then click Open.
Save: Saving the configuration displayed on screen. .
Figure 79: HydrINS software - File saving window
Page 61
Page 61/77
HydrINS 2 / HydrINS 2 Mini flow meter
Programming of data logging with Winfluid
Enter the name of the site and then click the OK button.
Setup printer: lets you configure the printer being used.
Print: Prints the configuration displayed on screen. .
Exit: ends the HydrINS program.
8.2.3 Maintenance Menu:
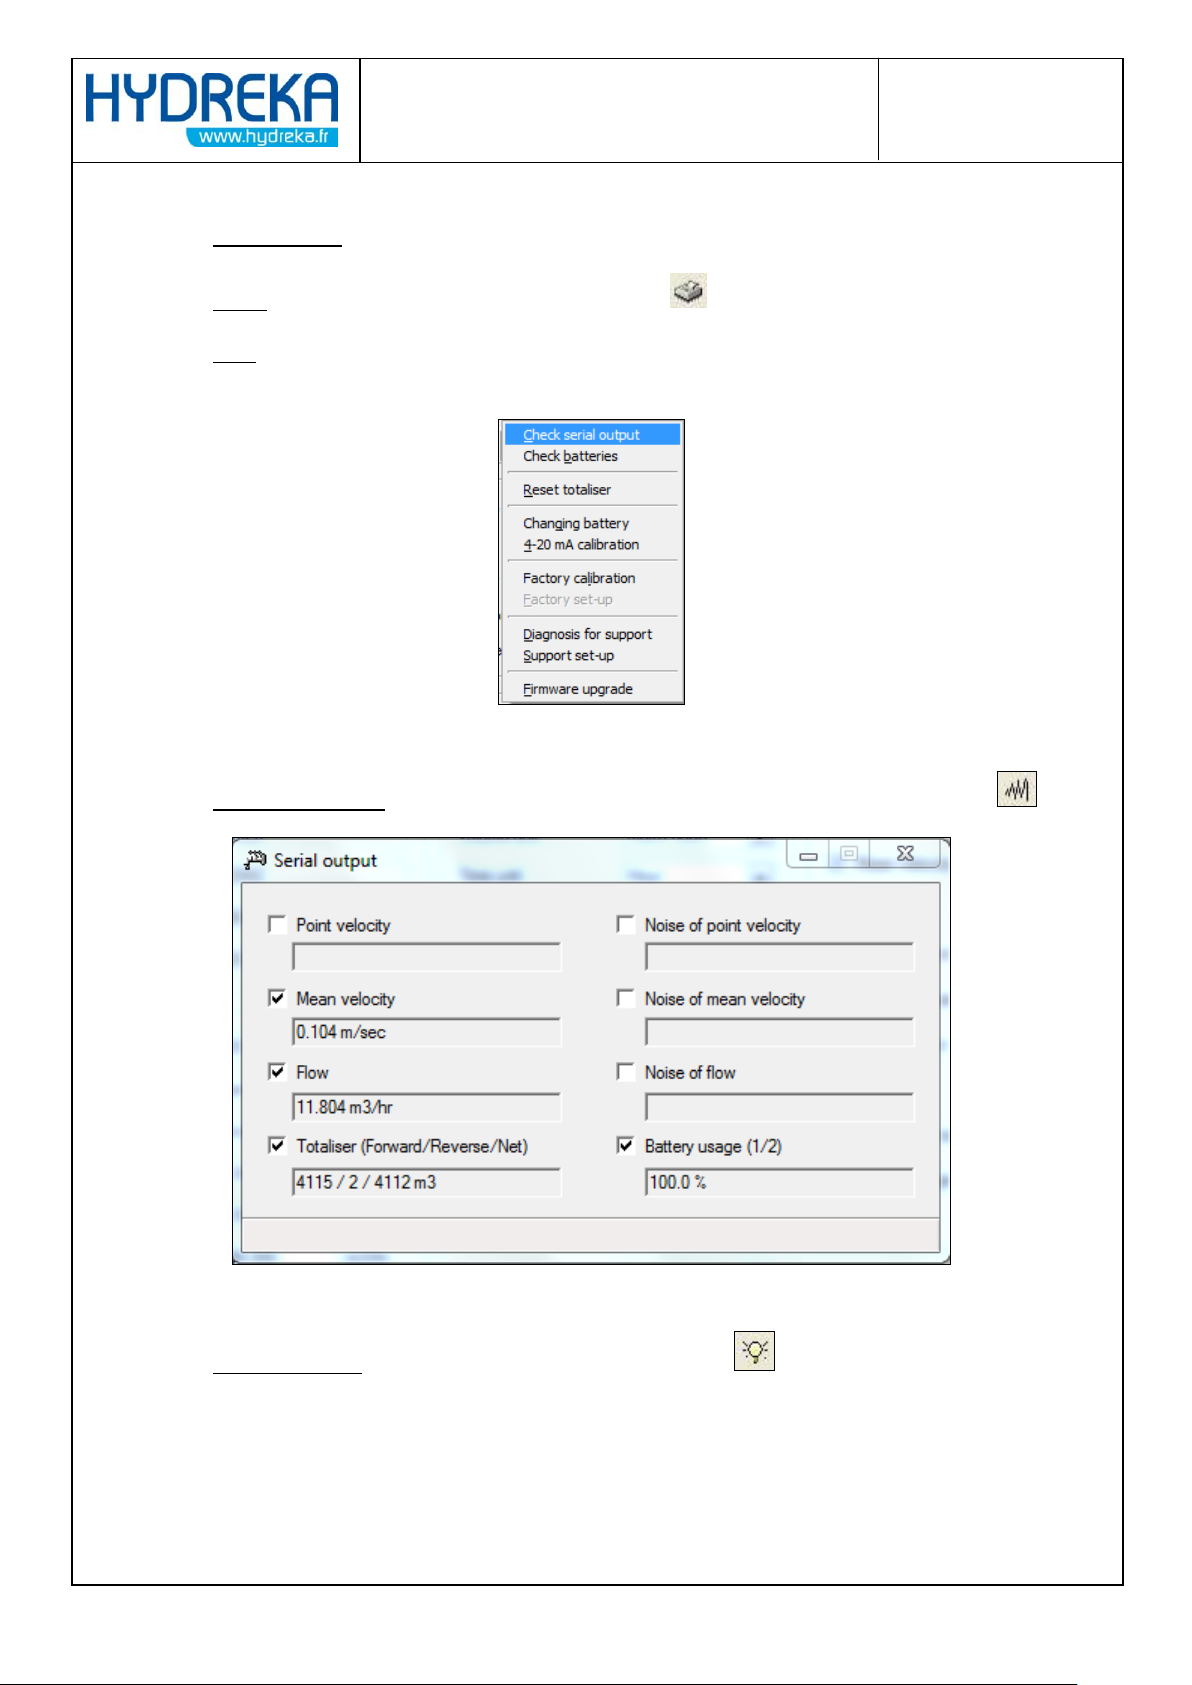
Figure 80: HydrINS - software List of tasks available in the 'Maintenance' menu
Check serial output: real-time display of the measurements selected in the serial output .
Check batteries: displays the available battery percentage .
Figure 81: Serial output test window
Page 62
Page 62/77
HydrINS 2 / HydrINS 2 Mini flow meter
Programming of data logging with Winfluid
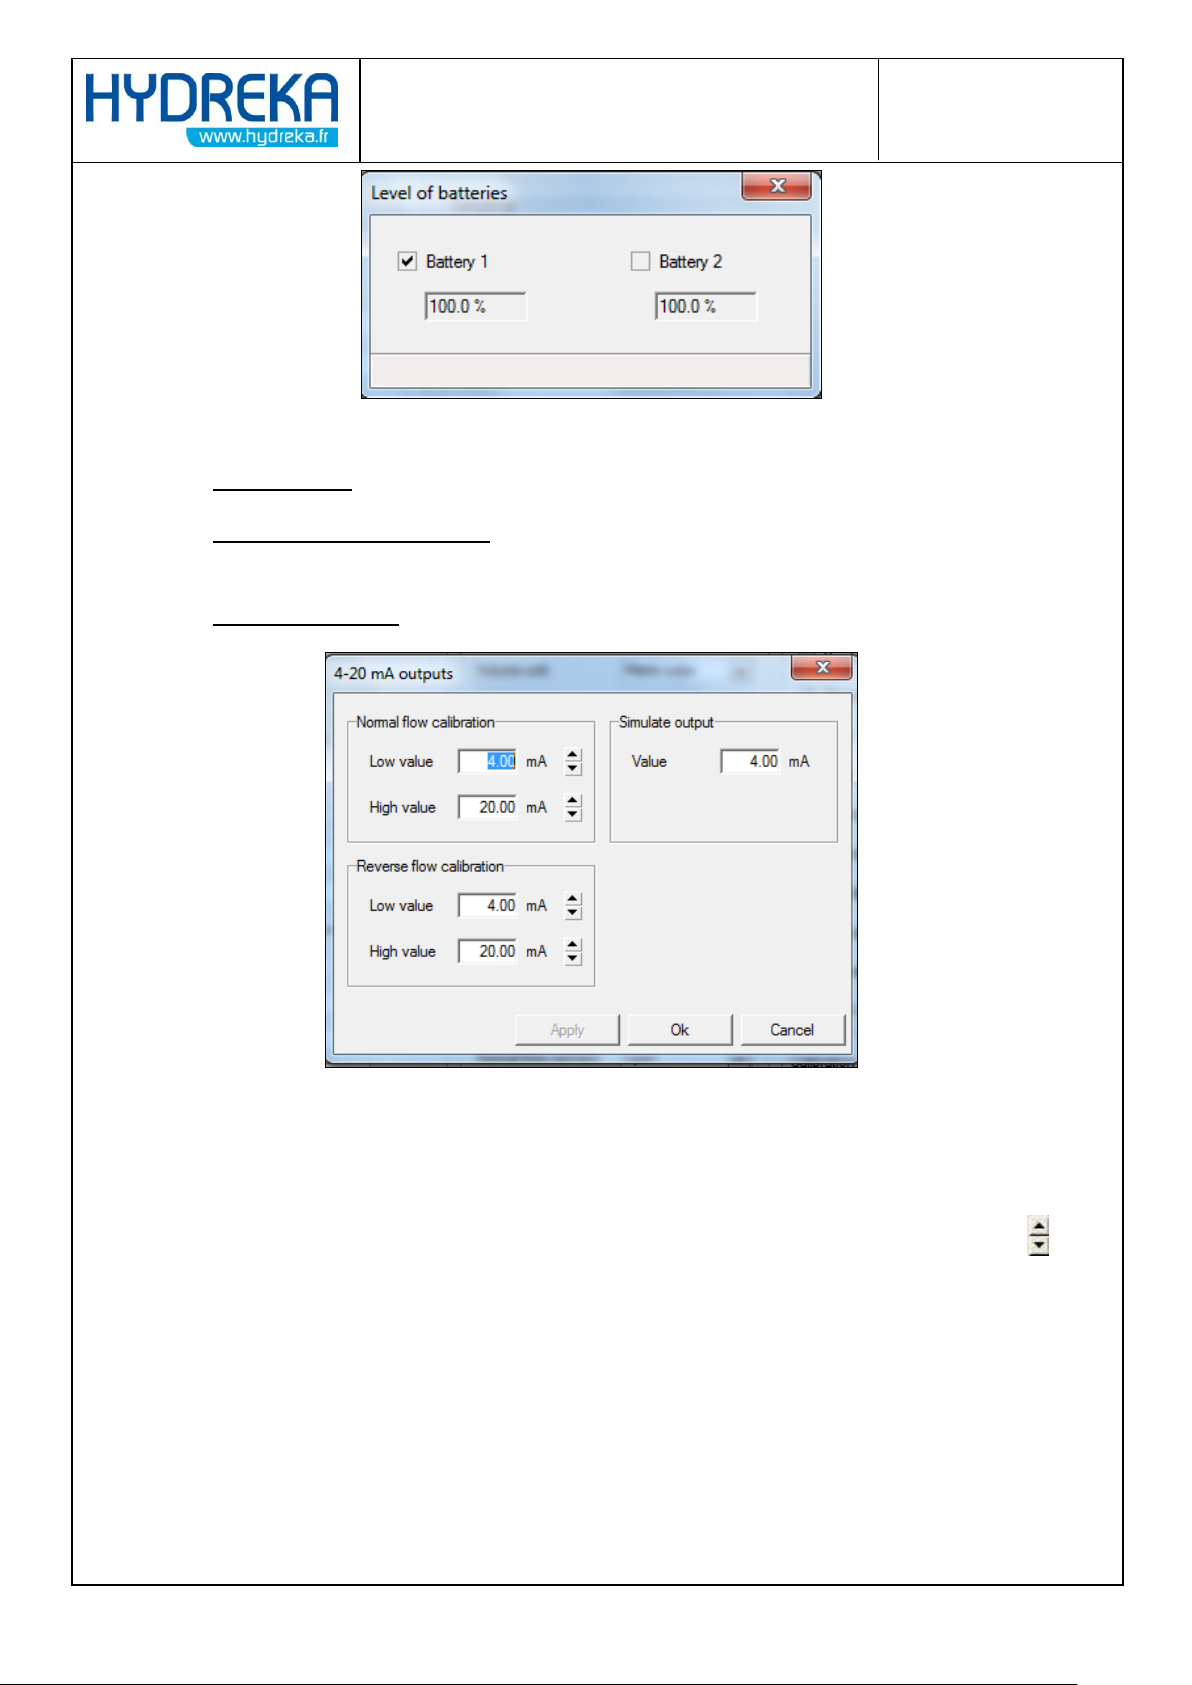
Figure 82: HydrINS software - Battery level display window
Totaliser reset: Resets the totalisers.
New Battery 1 / Battery 2: resets the available battery percentage when a battery is
replaced.
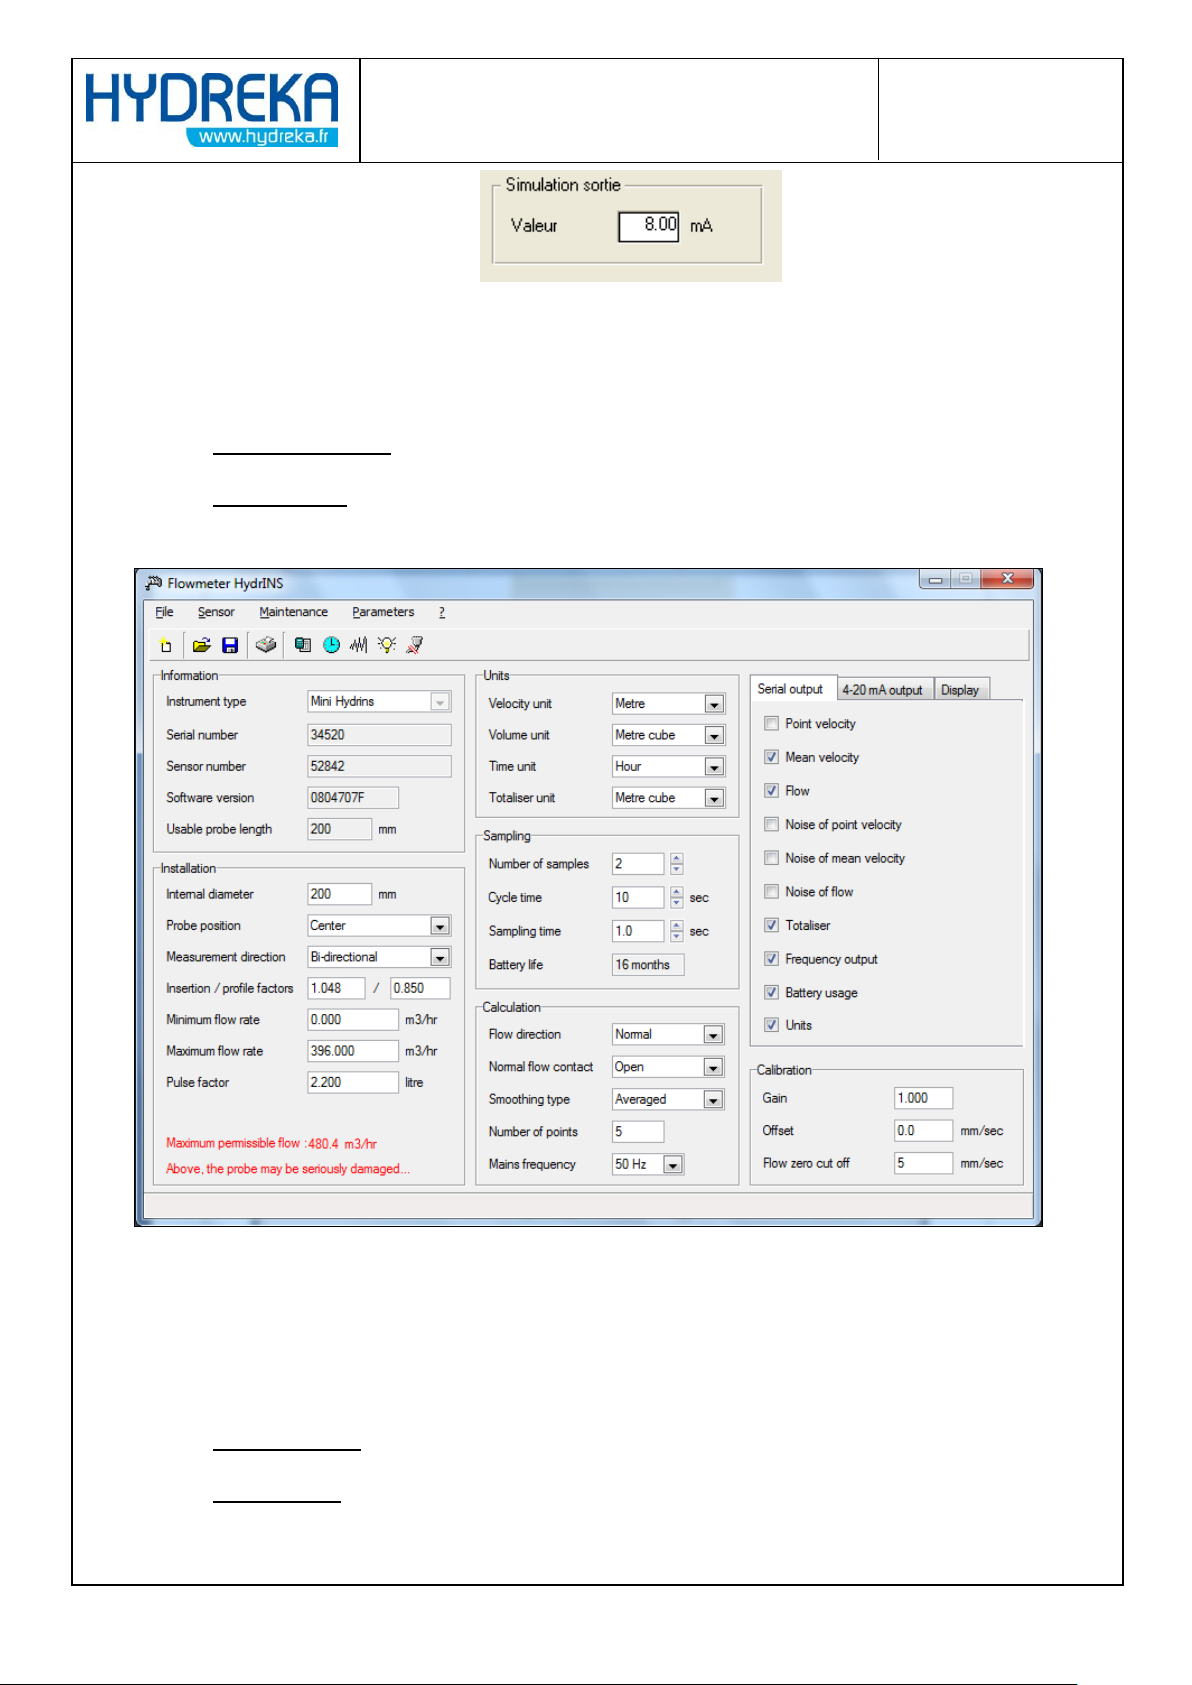
4-20 mA calibration: this option lets you calibrate or simulate the 4-20 mA outputs (Display C)
Figure 83: HydrINS software - 4-20 mA output calibration window
o Calibration box:
Connect an ammeter to the channel to be calibrated, place the cursor in the
corresponding section 'Low point 4.00 mA', for example, using the cursors
adjust the current value measured by the ammeter, and click the Apply button.
Proceed in the same way for the other points for each channel.
o Simulation box:
Enter the current value to be simulated in the value field of the output simulation
box.
Page 63
Page 63/77
HydrINS 2 / HydrINS 2 Mini flow meter
Programming of data logging with Winfluid
Figure 84: HydrINS software - Output value simulation window
Confirm using the Enter key. The current value is simulated on both channels at
the same time.
Factory calibration: Restores the probe's default calibration factors.
Factory Setup: Restores the probe's default configuration.
8.3 Information displayed
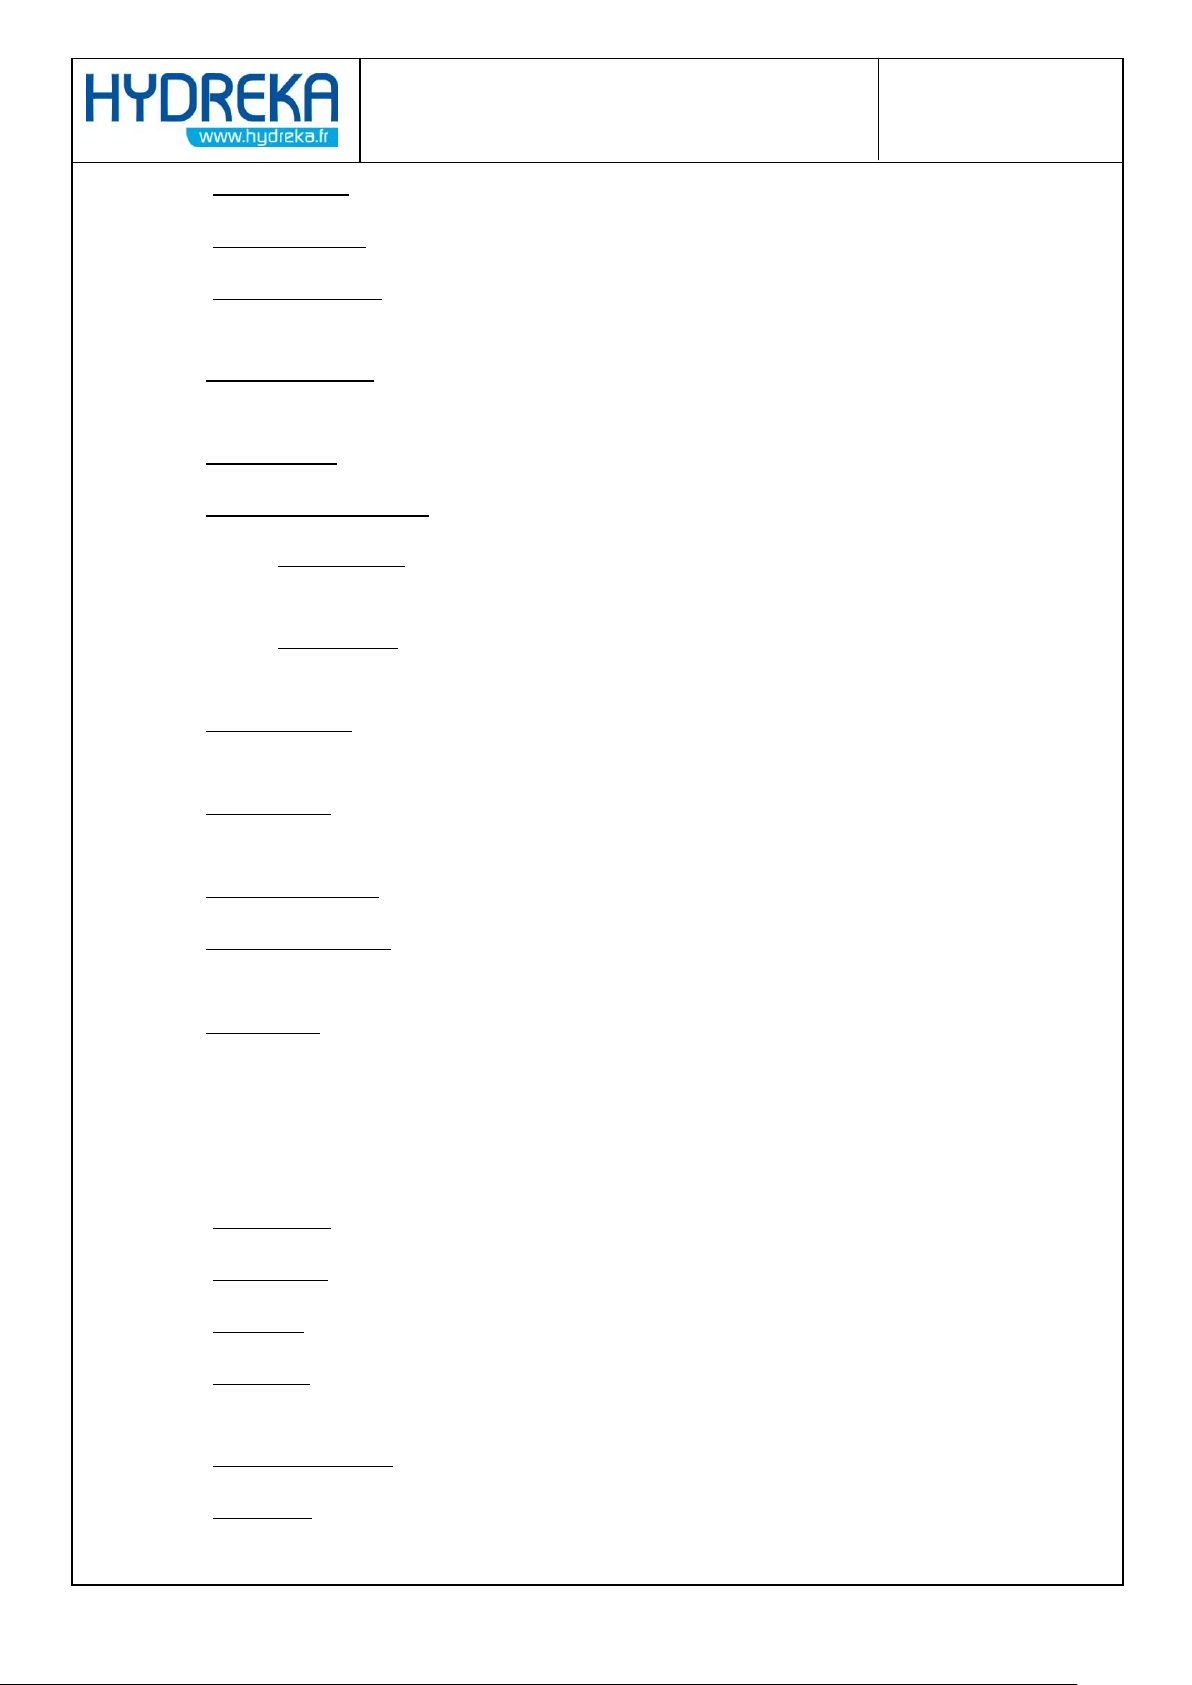
Figure 85: HydrINS software – HydrINS software home window
The following parameters are displayed:
8.3.1 Identification box
This box summarises the HydrINS 2 / HydrINS Mini identification parameters:
Instrument Type
Serial Number
Page 64
Page 64/77
HydrINS 2 / HydrINS 2 Mini flow meter
Programming of data logging with Winfluid
Sensor number
Software Version
Usable tube length
8.3.2 Installation Box
Internal diameter: internal diameter of the pipe (ID value measured in the HydrINS 2 /
HydrINS 2 Mini flow meter installation) manual.
Probe position: Centre or one-eighth diameter. Position of the probe in the pipe.
Measurement direction: Type of pulse output.
o Unidirectional: Pulses in the normal direction between Pins A and B of the probe and
pulses in the reverse direction between Pins A and H of the probe
o Bi-directional: Pulses in the normal and reverse direction between Pins A and B of the
probe. Probe H is the direction contact between Pins H and A.
Insertion factor: Coefficient applied to the measurement to obtain the actual velocity based
on the velocity measured by the probe.
Profile factor: Coefficient applied to the measurement to obtain the mean velocity based on
the actual velocity.
Minimum flow rate: Flow rate that corresponds to zero pulse frequency
Maximum flow rate: Flow rate that corresponds to the maximum pulse frequency of the
device (50 Hz).
Pulse factor: Volume corresponding to a pulse emitted by the sensor. The possible input of
the pulse weight gives rise to the maximum flow rate calculation for a maximum output
frequency of 50 Hz.
8.3.3 Units box:
Display unit for the measurements performed in real time.
Velocity unit: unit of velocity in millimetres, metres or feet per second
Volume unit: unit of flow in m3, litre, etc.
Time unit: unit of time for the flow rate measurement in seconds, minutes, hours or days.
Total unit: unit of volume for the totalisers: litre, m3, etc.
8.3.4 Sampling box
Number of samples: Number of samples in a cycle
Cycle time: Measurement frequency
Page 65
Page 65/77
HydrINS 2 / HydrINS 2 Mini flow meter
Programming of data logging with Winfluid
Sampling time: Period between the taking of two samples.
Battery life: This estimate is affected by the sampling parameters.
8.3.5 Calculation box
Flow direction: Direction of flow when the probe is oriented in the direction of flow.
Normal flow contact: This option lets you change the status of the direction contact for two-
way measurement:
o Closed: The direction contact is closed if the flow is positive, and open if the flow is
negative.
o Open: The direction contact is open if the flow is positive, and closed if the flow is
negative (default).
Smoothing type: Method for smoothing the measured values (Mean or Exponential).
Number of points: Number of measurements averaged in the case of Mean smoothing.
8.3.6 Calibration box
Gain: Correction of the slope by the user
Offset: Offset correction by the user
Flow zero cut off: Velocities less than or equal to this value are taken as zero.
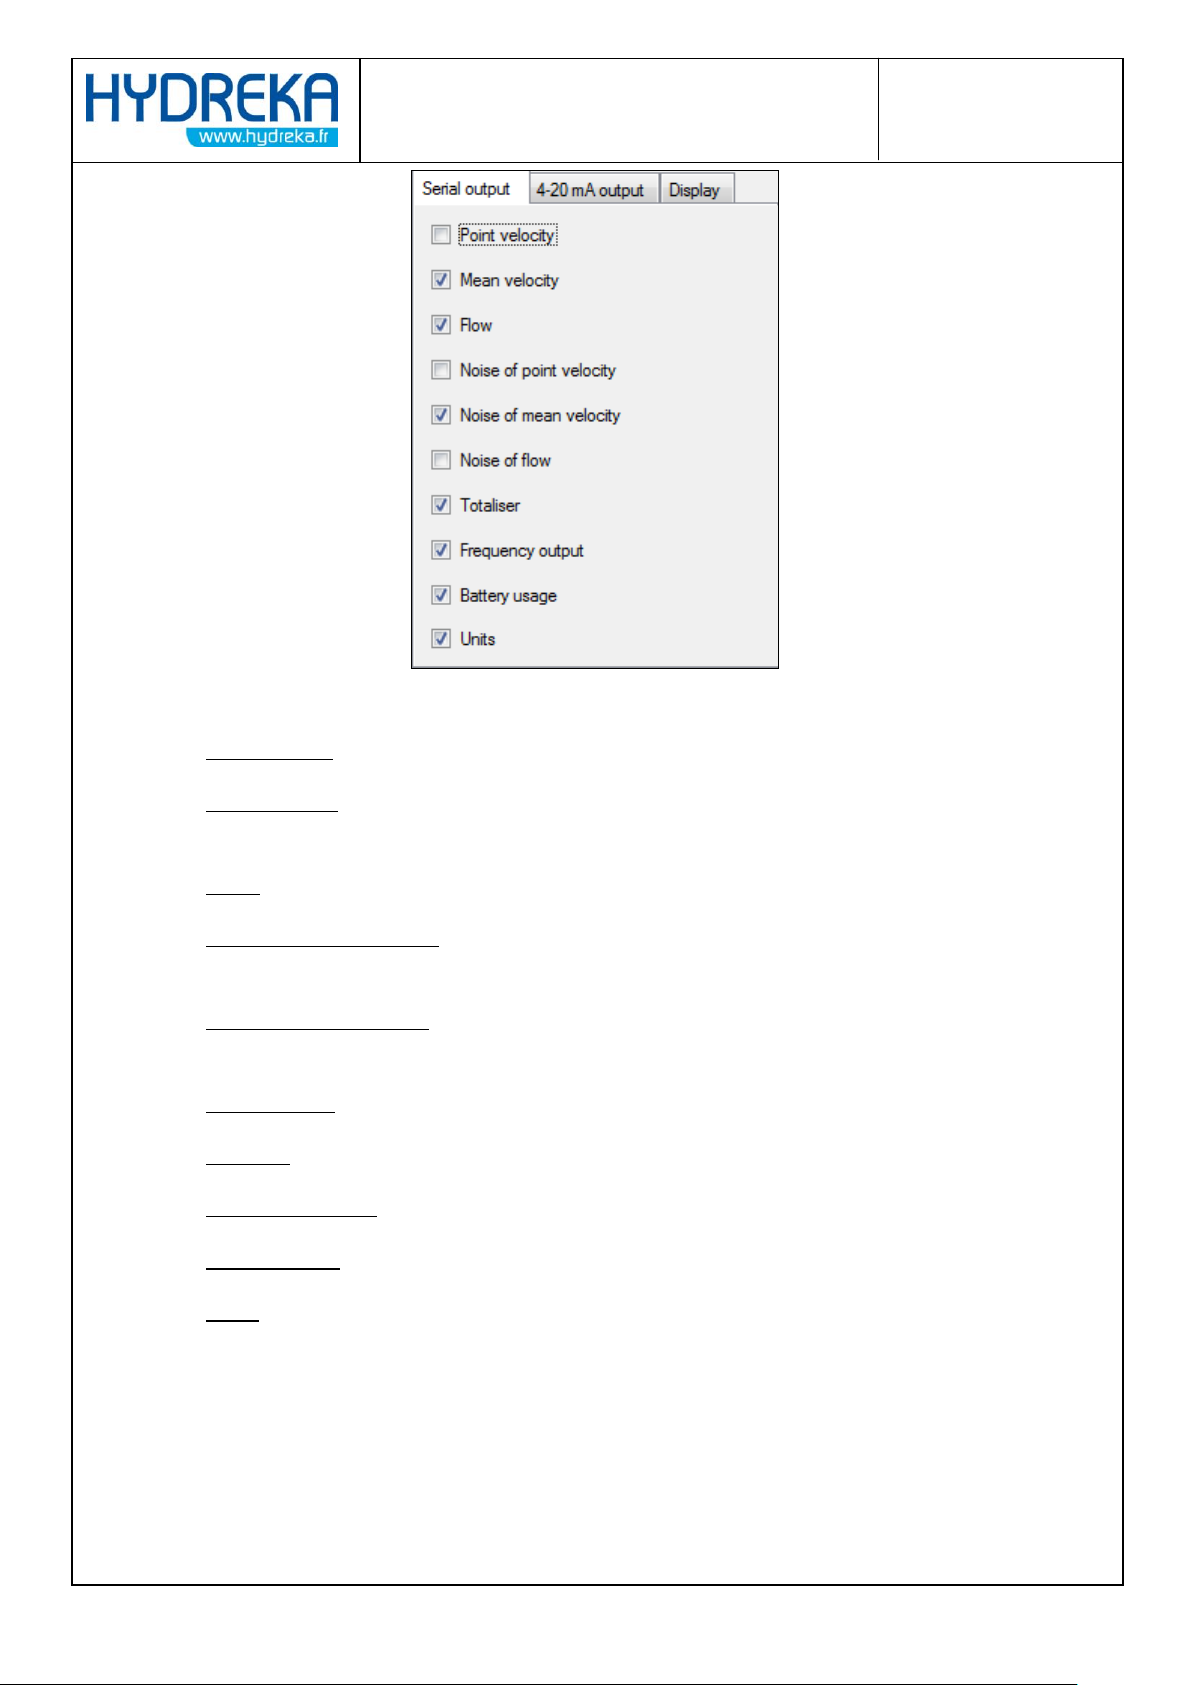
8.3.7 Serial Output Tab
This tab lets you select the parameters displayed in real time.
Page 66
Page 66/77
HydrINS 2 / HydrINS 2 Mini flow meter
Programming of data logging with Winfluid
Figure 86: HydrINS software - Serial Output Tab Window
Point velocity: Velocity measured by the probe. It is corrected by the insertion coefficient.
Mean velocity: Mean velocity measured by the probe (instantaneous velocity corrected by the
profile coefficient).
Flow: Flow rate calculated from the mean velocity.
Noise of point velocity: measured velocity deviation, calculated between the various
measured velocity samples.
Noise of mean velocity: mean velocity deviation, calculated between the various velocity
samples from the mean velocity noise.
Noise of flow: flow rate deviation calculated from the mean flow rate noise.
Totaliser: display of the normal direction, reverse direction, and net totals.
Frequency output: confirms or inhibits the pulse output.
Battery usage: available battery percentage.
Units: unit display.
Page 67
Page 67/77
HydrINS 2 / HydrINS 2 Mini flow meter
Programming of data logging with Winfluid
8.3.8 4-20 mA output tab
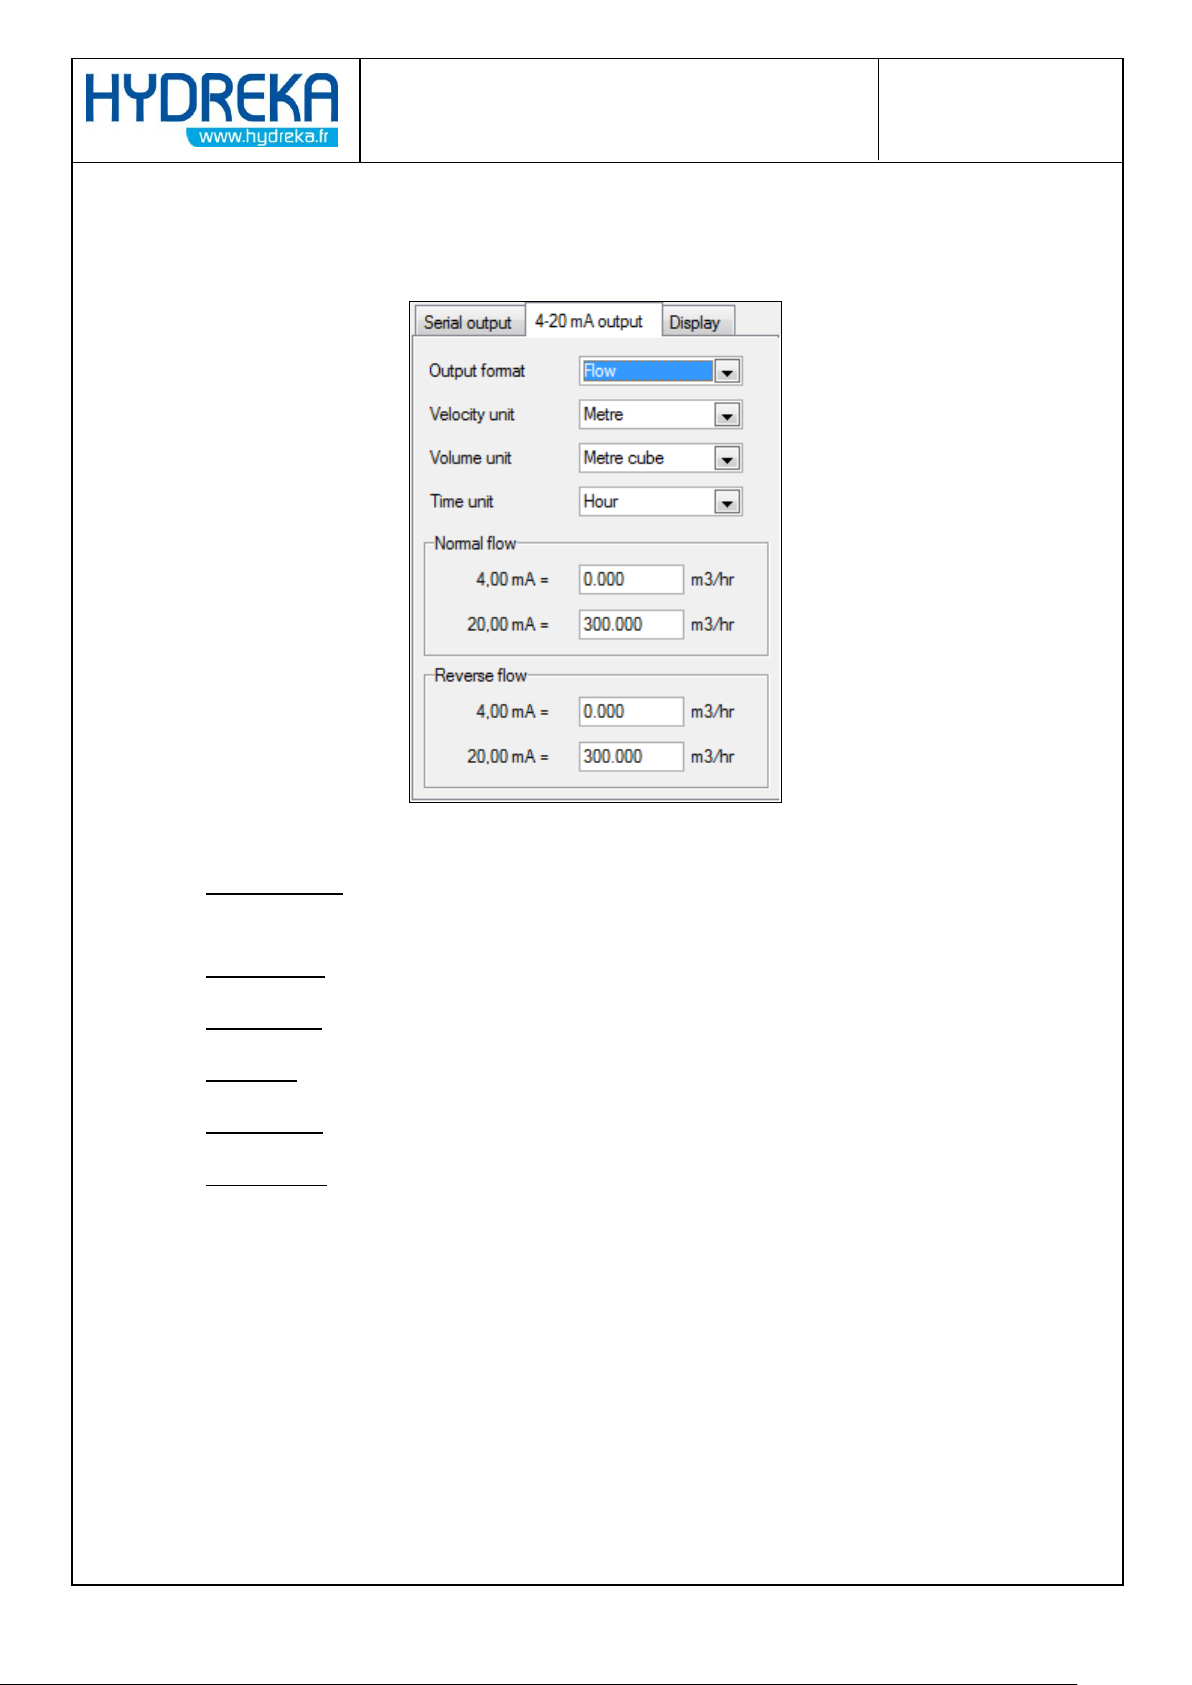
Figure 87: HydrINS software - 4-20 mA programming window
Output format: Type of data - Flow or Velocity. If the output format is set to 'None', the 4-20
mA outputs are disabled.
Velocity unit: Velocity unit selected if the output format is set to 'Velocity'.
Volume unit: Flow unit selected if the output format is set to 'Flow'.
Time unit: time for the selected output format
Normal flow: Programming of the 4-20 mA output range normal direction
Reverse flow: Programming of the 4-20 mA output range reverse direction
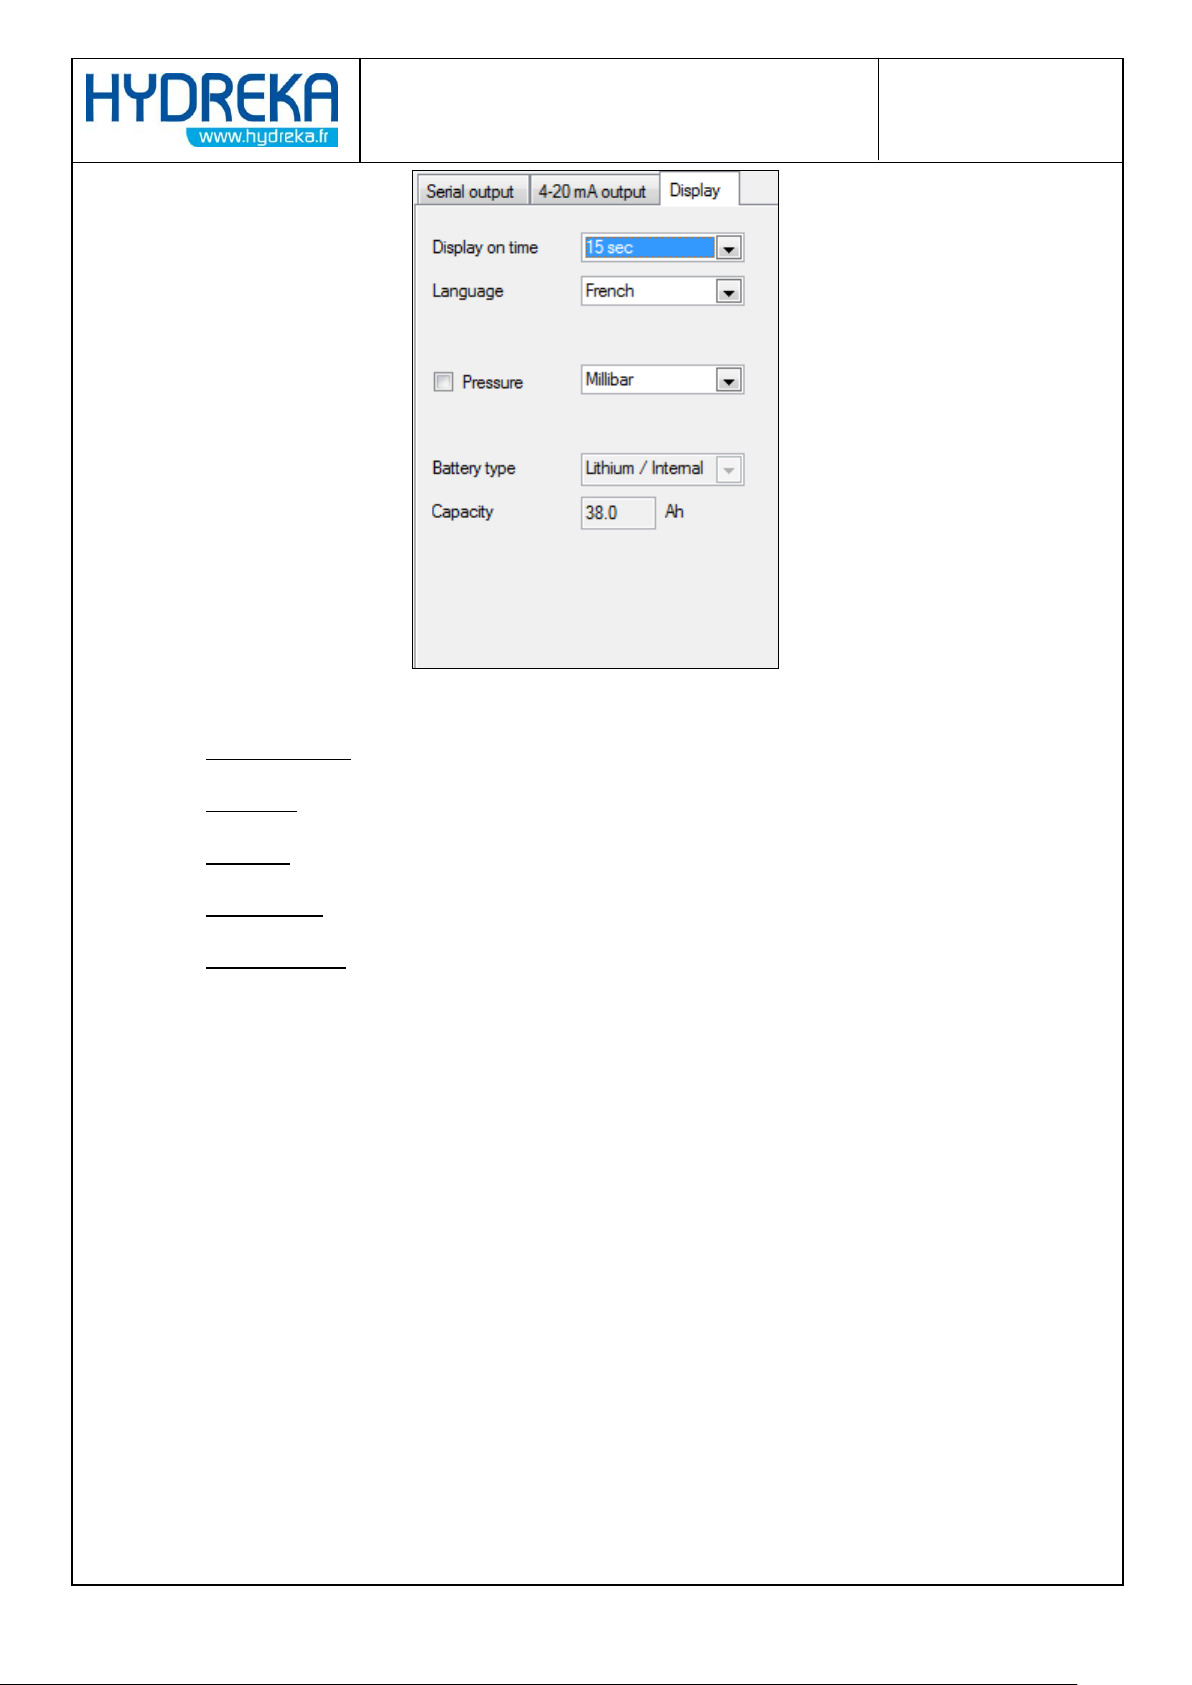
8.3.9 Display Tab
Use this tab only if the flow meter is connected to a Display.
Page 68
Page 68/77
HydrINS 2 / HydrINS 2 Mini flow meter
Programming of data logging with Winfluid
Figure 88: HydrINS software - Display Configuration Window
Display on time: Time during which the display remains lit
Language: Display language
Pressure: Select if the display is equipped with a pressure interface
Battery type: Selection of battery type used in the display
Data displayed: The data displayed will be those selected in the 'Serial Output' tab (Section
8.3.7).
Page 69
Page 69/77
HydrINS 2 / HydrINS 2 Mini flow meter
Programming of data logging with Winfluid
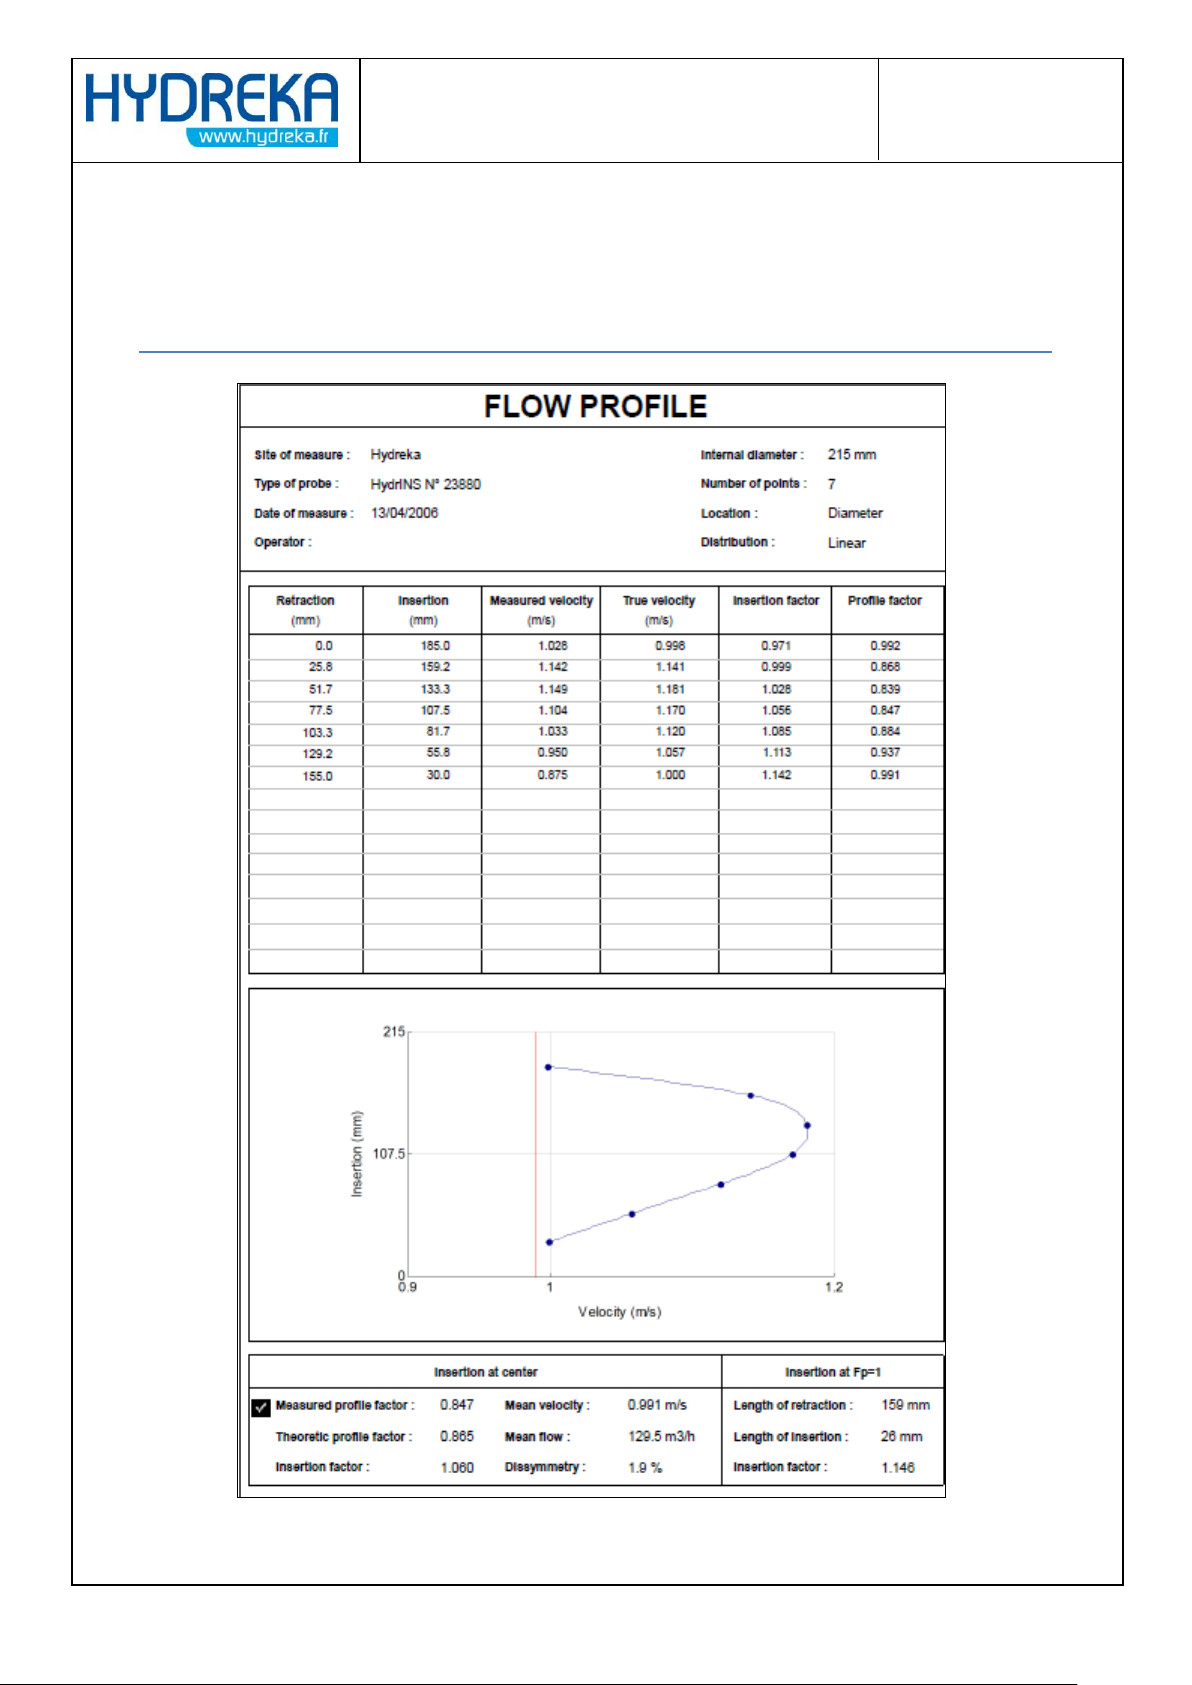
APPENDIX 1: Velocity profile printing
template
Page 70
Page 70/77
HydrINS 2 / HydrINS 2 Mini flow meter
Programming of data logging with Winfluid
LOGWINFLU
Software to download and process Winfluid data
LOGWINFLUMAJ
Winfluid update
LOGWINFLUA
Winfluid Mobile software for Pocket PC on SD
board
APPENDIX 1: Associated Hydreka
Catalogue Numbers
Table1: Hydreka Catalogue Numbers associated with the programming of the Mainstream IV
Page 71
Page 71/77
HydrINS 2 / HydrINS 2 Mini flow meter
Programming of data logging with Winfluid
TABLE OF ILLUSTRATIONS
Figure 1: General configuration of Winfluid – situation of the Parameters menu on the home screen 6
Figure 2: View of the Winfluid home screen ........................................................................................... 7
Figure 3: Overview of the sensor tab ...................................................................................................... 8
Figure 4: Programming window for the HydrINS 2 probe ....................................................................... 9
Figure 5: Overview of the HydrINS 2 probe programming window – General Tab ................................ 9
Figure 6: Overview of the HydrINS 2 probe programming window – General Tab – Maximum
allowable flow rate to be observed....................................................................................................... 10
Figure 7: Overview of the HydrINS 2 probe programming window ...................................................... 11
Figure 8: Connection of the CC_HYDA3 or CC_HYDA3S cable to the flow meter ................................. 12
Figure 9: Connection dialogues for programming ................................................................................ 12
Figure 10: Correct programming confirmation dialogues ..................................................................... 13
Figure 11: Programming dialogue ......................................................................................................... 14
Figure 12: Connection dialogues for flow meter programming ............................................................ 14
Figure 13: Correct programming confirmation dialogues ..................................................................... 14
Figure 14: Connection dialogue for programming ................................................................................ 15
Figure 15: Preview window before launching acquisition by the data logger ...................................... 15
Figure 16: Status acquisition window ................................................................................................... 16
Figure 17: Retrieval of the flow meter programming from the main Winfluid screen ......................... 17
Figure 18: Retrieval of the flow meter programming from the main Winfluid screen ......................... 18
Figure 19: Programming the flow meter from the main Winfluid screen ............................................ 18
Figure 20: Programming the flow meter from the main Winfluid screen ............................................ 19
Figure 21: Position of the Advanced button in the flow meter programming window ........................ 20
Figure 22: Password input window ....................................................................................................... 20
Figure 23: Advanced Mode – Conversion Tab ....................................................................................... 20
Page 72
Page 72/77
HydrINS 2 / HydrINS 2 Mini flow meter
Programming of data logging with Winfluid
Figure 24: Flow signal saturation warning window ............................................................................... 21
Figure 25: Advanced Mode – Sampling Tab .......................................................................................... 22
Figure 26: Advanced Mode – Calculation Tab ....................................................................................... 22
Figure 27: Advanced Mode – 4-20 mA Tab ........................................................................................... 23
Figure 28: Advanced Mode – Maintenance Tab ................................................................................... 24
Figure 29: Advanced Mode – Instrument Tab ....................................................................................... 25
Figure 30: Selecting the computer as data logger ................................................................................. 26
Figure 31: Winfluid home screen with the computer as data logger ................................................... 27
Figure 32: Real-time display in computer mode ................................................................................... 28
Figure 33: Flow curve ............................................................................................................................ 29
Figure 34: Enabling the 4-20 mA output of the display during programming ...................................... 30
Figure 35: Display C 4-20 mA output calibration icon ........................................................................... 30
Figure 36: Display C 4-20 mA output calibration icon ........................................................................... 31
Figure 37: Checking the 4-20 mA output using an ammeter ................................................................ 31
Figure 38: Velocity profile – maximum velocities for the creation of a velocity profile ....................... 32
Figure 39: Launching the velocity profile program from Advanced mode ........................................... 33
Figure 40: Launching the velocity profile program from the Winfluid home screen ............................ 33
Figure 41: Velocity profile editing window ........................................................................................... 34
Figure 42: Velocity profile editing window ........................................................................................... 34
Figure 43: Velocity profile measurement window ................................................................................ 35
Figure 44: Connection of the CC_HYDA3 or CC_HYDA3S cable to the flow meter ............................... 36
Figure 45: Probe routing for the velocity profile measurement ........................................................... 36
Figure 46: Velocity profile measurement window ................................................................................ 37
Figure 47: Measuring of probe raising for the creation of a velocity profile ........................................ 40
Figure 48: Measurement point confirmation window .......................................................................... 41
Figure 49: Velocity profile preview screen ............................................................................................ 43
Figure 50: Measurement opening window ........................................................................................... 44
Page 73
Page 73/77
HydrINS 2 / HydrINS 2 Mini flow meter
Programming of data logging with Winfluid
Figure 51: Selection window for measurements to be copied ............................................................. 44
Figure 52: Copy destination directory selection window ...................................................................... 45
Figure 53: Velocity profile measurement export window .................................................................... 46
Figure 54: Flow meter programming window with velocity profile ...................................................... 47
Figure 55: Programming the velocity profile ......................................................................................... 47
Figure 56: Sending the velocity profile programming to Winfluid ........................................................ 48
Figure 57: Window to send coefficients to Winfluid ............................................................................. 48
Figure 58: Pocket PC to PC synchronisation window ............................................................................ 49
Figure 59: Access to the HydrINS Display management window ......................................................... 50
Figure 60: HydrINS display tool – Access to configuration .................................................................... 50
Figure 61: HydrINS Display Tool – Configuration .................................................................................. 51
Figure 62: HydrINS Display Tool – Display configuration ...................................................................... 51
Figure 63: HydrINS Display Tool – Connection ...................................................................................... 52
Figure 64: HydrINS Display Tool – Real-time display ............................................................................. 52
Figure 65: HydrINS Display Tool – Reset totalisers ............................................................................... 53
Figure 66: HydrINS Display Tool – Reset totalisers – Confirmation ...................................................... 53
Figure 67: Launching remote assistance ............................................................................................... 54
Figure 68: Connection information for remote assistance ................................................................... 54
Figure 69: Checking the current version of Winfluid on the home screen ........................................... 55
Figure 70: Displaying the About Winfluid section ................................................................................. 56
Figure 71: Updating Winfluid from the main screen ............................................................................. 56
Figure 72: Winfluid update – selecting the update frequency .............................................................. 57
Figure 73: Winfluid update – Displaying the update information ........................................................ 57
Figure 74: HydrINS software – HydrINS software home screen ........................................................... 58
Figure 75: HydrINS software – Configuration of the workspace ........................................................... 59
Figure 76: HydrINS software - List of tasks available in the 'Sensor' menu .......................................... 59
Figure 77: HydrINS software - List of tasks available in the 'File' menu ................................................ 60
Page 74
Page 74/77
HydrINS 2 / HydrINS 2 Mini flow meter
Programming of data logging with Winfluid
Figure 78: HydrINS software - File opening window ............................................................................. 60
Figure 79: HydrINS software - File saving window ................................................................................ 60
Figure 80: HydrINS - software List of tasks available in the 'Maintenance' menu ................................ 61
Figure 81: Serial output test window .................................................................................................... 61
Figure 82: HydrINS software - Battery level display window ................................................................ 62
Figure 83: HydrINS software - 4-20 mA output calibration window ..................................................... 62
Figure 84: HydrINS software - Output value simulation window ......................................................... 63
Figure 85: HydrINS software – HydrINS software home window ......................................................... 63
Figure 86: HydrINS software - Serial Output Tab Window .................................................................... 66
Figure 87: HydrINS software - 4-20 mA programming window ............................................................ 67
Figure 88: HydrINS software - Display Configuration Window ............................................................. 68
Page 75
Page 75/77
HydrINS 2 / HydrINS 2 Mini flow meter
Programming of data logging with Winfluid
NOTES
Page 76
Page 76/77
HydrINS 2 / HydrINS 2 Mini flow meter
Programming of data logging with Winfluid
NOTES
Page 77
Page 77/77
HydrINS 2 / HydrINS 2 Mini flow meter
Programming of data logging with Winfluid
HYDREKA
34, route de Saint Romain – 69450 ST CYR AU MONT D’OR – France
Tel.: 33 4 72 53 11 53 – Fax: 33 4 78 83 44 37
E-mail: [email protected] or [email protected]
Customer Service: [email protected]
Rentals: [email protected]
Sales: [email protected]
Export: [email protected]
 Loading...