

Page 1
Copyright by Hukseflux | manual v1717 | www.hukseflux.com | info@hukseflux.com
USER MANUAL FTN02
Field Thermal Needle System for Thermal
Resistivity / Conductivity Measurement
Hukseflux
Thermal Sensors
Page 2
FTN02 manual v1717 2/49
Warning statements
The input voltage for charging should not exceed 5 VDC as
it may lead to overheating of the CRU02.
FTN02 is generally operated from its own 3.7 VDC battery.
This low voltage makes FTN02 safe to use in any
environment.
The TP09 needle is sharp and a potential risk to safety of
the operator. When not being used, it is recommended to
have a protective cover over the needle.
Putting more than 5 volt across the TP09 may result in
permanent damage to the sensor.
FTN02 requires a charged battery. With an empty battery,
approximately one hour of charging is required before
measurements can start. 11 hours of charging are preferred.
TP09 is robust but still vulnerable. In case of doubt if it can
penetrate the sample, the sample should be pre-drilled.
When calibrating in glycerol, the user is assumed to be
familiar with the glycerol safety data.
Like most measurement equipment, FTN02 is not suitable
for use in close proximity to high voltage cables when these
are in operation.
Page 3

FTN02 manual v1717 3/49
Contents
Warning stat e me nts 2
Contents 3
List of symbols 4
Introduction 5
Ordering and checking at delivery 9
Included items 9
1 Theory 10
1.1 General Non-Steady-State Probe Theory 10
1.2 Data analysis in the CRU02 11
1.3 Data review on PC 12
2 FTN02 design considerations 13
3 General Directions for Performing a Measurement 14
4 FTN02 Specifications 15
4.1 Specifications of FTN02 15
5 Arrival of a Ne w FTN02 17
5.1 Preparation before Arrival 17
5.2 Checking upon Arrival 17
6 Quick System Test 18
7 User Guide 20
7.1 Preparation 20
7.2 Cautionary Notes 20
7.3 Performing Measurements 20
7.4 Calibration 21
7.5 Menu Structure 22
7.6 Software 23
8 Data Transfer, Archiving and Review 24
8.1 Connecting CRU02 and PC, downloading data to a PC 24
8.2 Reviewing Data in the Hukseflux CRU02 Manager 25
8.3 Reviewing Data in Excel 29
9 Maintenance and Storage 31
10 Delivery and Spare Parts 32
11 Appendices 33
11.1 Appendix on modelling TP09 behaviour 33
11.2 Appendix on ASTM and IEEE standards 34
11.3 Appendix on insertion of the needle into hard soils 35
11.4 Appendix on typical soil thermal properties 36
11.5 Appendix on glycerol / glycerine 36
11.6 Appendix on electrical connection of TP-CRU02 37
11.7 Appendix on trouble shooting 38
11.8 Appendix on replacement of a TP 38
11.9 Appendix on battery charging 39
11.10 Appendix on downloading new software versions 39
11.11 Appendix on literature references 40
11.12 Glycerol Material Safety Data Sheet (93 / 112 EC) 41
11.13 Internationa l Chemical Safety Card fo r Glycerol 44
11.14 EC Declaration of Conformity 47
Page 4

FTN02 manual v1717 4/49
List of sy mbols
Quantities Symbol Unit
Thermal diffusivity a m
2
/s
Distance from the heating wire r m
Heating cycle time H s
Thermal conductivity λ W/(m·K)
Time t s
Temperature T K
Differential temperature, or temperature rise ∆T K
Electrical resistance R
e
Ω
Electrical resistance per meter R
em
Ω/m
Thermal resistivity R
th
m·K/W
Diameter D m
Volumetric heat capacity C
v
J/(K·m2)
Density ρ kg/m3
Current I A
Power P W
Power per meter Q W/m
Subscripts
Property of Pt 1000 sensor sen
Property of the heating wire heat
Property of the needle needle
Property, at t = 0, at t = 180, t =h seconds 0, 180, h
Page 5
FTN02 manual v1717 5/49
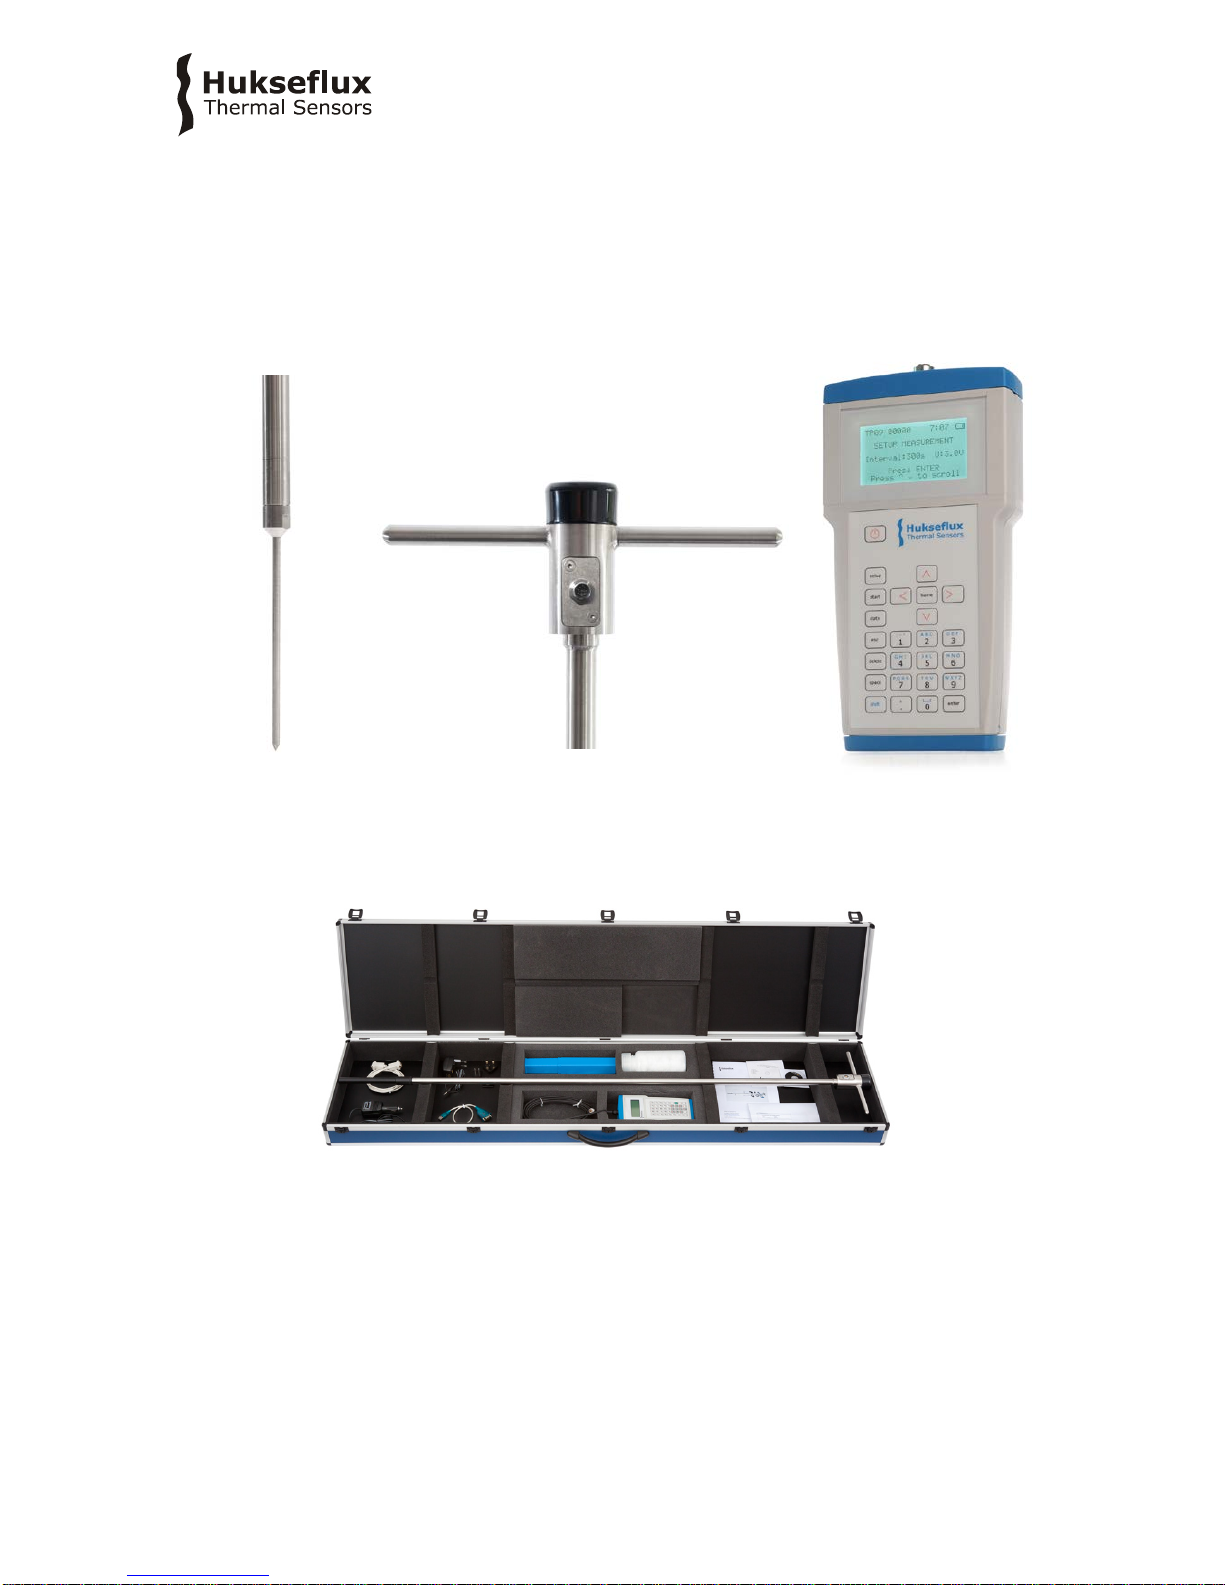
Introduction
The FTN02 Field Thermal Needle System allows performing fast, on-site measurements
of the thermal resistivity or conductivity of soils. The sensor is a Non-Steady-State Probe
(NSSP), TP09, which is mounted at the tip of a lance (LN02). The system is operated
using a hand-held Control and Readout Unit (CRU02).
Figure 0.1 Key components of FTN02 system: from left to right thermal properties
sensor TP09, lance LN02 and Control and Readout Unit CRU02.
Figure 0.2 FTN02 system as delivered in its TC01 transport casing
Hukseflux is specialised in NSSP design. Alternative models, for instance for laboratory
use, are available at Hukseflux.
The measurement method is based on the so-called Non-Steady-State Probe (NSSP)
technique, which uses a probe (also called thermal properties sensor or thermal needle)
in which both a heating wire and a temperature sensor are incorporated. The probe is
inserted into the soil. From the response to a heating step the thermal resistivity (or the
Page 6

FTN02 manual v1717 6/49
inverse value, the conductivity) of the soil can be calculated. The measurement with
FTN02 complies with the IEEE Guide for Soil Thermal Resistivity Measurements
IEEE Standard 442-1981(03) as well as with ASTM D5334-14 Standard Test Method for
Determination of Thermal Conductivity of Soil and S oft Rock. The main application of
FTN02 is route surveying for high voltage electric power cables and for heated pipelines.
In general an NSSP consists of a heating wire, representing a perfect line source, and a
temperature sensor capable of measuring the temperature at this source. The probe is
inserted into the soil that is investigated. The NSSP principle relies on a unique property
of a line source: after a short transient period the temperature rise, ∆T, only depends on
heater power, Q, and medium thermal conductivity, λ:
∆T = (Q / 4 π λ) (ln t + B)
With ∆T in K, Q in W/m, λ in W/(m·K), t the time in s and B a constant. By measuring the
heater power, and tracing the temperature in time (for FT N02 typically during 5
minutes), λ can be calculated.
Page 7
FTN02 manual v1717 7/49
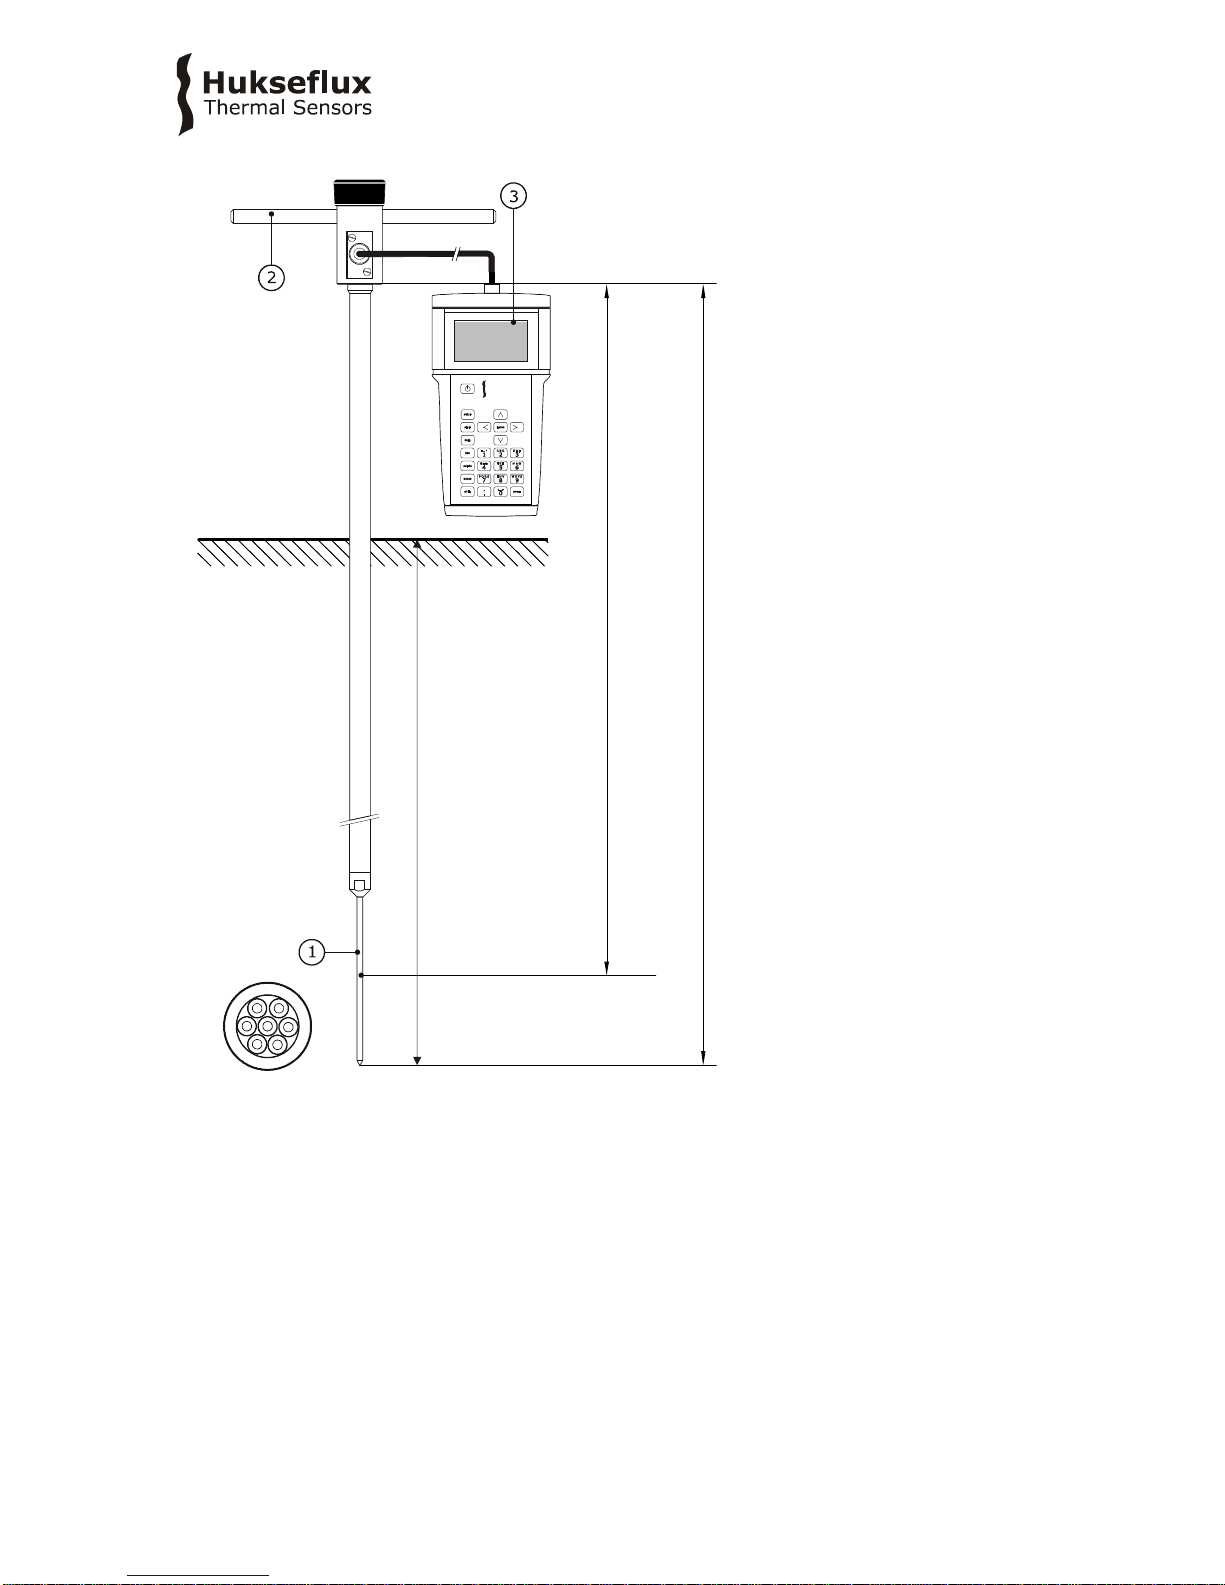
Figure 0.3 FTN02 in operation. The Non-Steady-State Probe TP09 (1), mounted at the
tip of the Lance, LN02 (2), is inserted into the soil. The user performs control and
readout of the experiment from the CRU02 (3), using its keyboard and LCD. The CRU02
also contains a rechargeable battery for powering the TP09. The measurement result is
immediately generated. The temperature sensor is located in the middle of the TP09
needle, 1.48 m from the top of lance LN02.
1.5 m max.
Hukseflux
Thermal Sensors
1.48 m
1.57 m
Page 8

FTN02 manual v1717 8/49
Figure 0.4 For additional quality insurance, the data of the measurements can be stored
and downloaded to the PC, and reviewed using the CRU02 software (1). The CRU02 (2)
can be connected to the PC by removing a cover (4) and connecting the USB cable on
both sides (3). Visual data review is required by ASTM.
Figure 0.5 The CRU02 (1) can be recharged: Remove the cap (2), plug in the wall
socket adapter WSA02 (3) or the car adapter CA02 (4).
Chapter 1 contains information about theory of the NSSP a nd da ta analy sis, chapter 2
summarises the design criteria and chapter 3 gives general directions for performing a
measurement. After chapter 4, the instrument specifications, the remaining chapters
contain information about testing the instrument on arrival, op eration in the field,
operation of the software, calibration and maintenance.
3
C
F3
B
F2
A
F1
D
F4
E
F5
H
F8
G
F7
F
F6
I
F9
J
F10
MLK N O
RQ
P S
T
W
VU
X
Y
7
Home
X 9
Pg Up
8
4 6
2 3
Pg Dn1End
5
0
Ins
SHIFT
START
ENTER
SPACE
.
:
DEL.
,
ESC
\
*
/
+
-
Hukseflux
Thermal Sensors
4
1
2
3
2
4
C
F3
BF2A
F1
DF4E
F5
H
F8
G
F7
FF6I
F9
J
F10
ML
K N O
RQP
S T
WVU X
Y
7
Home
X 9
Pg Up
8
4 6
2 3
Pg Dn1End
5
0
Ins
SHIFT
START
ENTERSPACE
.
:
DEL.,ESC
\
*
/
+
-
Hukseflux
Therm al Senso rs
1
Page 9

FTN02 manual v1717 9/49
Ordering and checking at delivery
Included items
FTN02 delivery includes the following items:
• Manual FTN02
• CRU02 Control and Readout Unit
• LN02 Lance
• TP09 Thermal Properties Sensor
• PT01 Protection tube
• TC01 Transport Casing
• JR01 Jar for glycerol, with polyester fibers
• Calibration certificate for TP09
• Factory Test Certificate for CRU02
• CRU02 Manager software on Hukseflux USB flash drive
• TP09 Thermal Properties Sensor (1 piece as spare)
• CA02 Car Adapter for 12 to 24 VDC
• WSA02 Wall Socket Adapter for 220 or 110 VAC
• USB Cable for CRU02 to PC connection
Figure 0.6 FTN02 system unpacked from its TC01 transport casing
Delive ry does NOT include glycerol fluid. This has to be locally obtained by the customer.
FTN02 software can be updated by the customer. New software versions are available on
a regular basis. For available software / firmware updates, please check:
http://www.hukseflux.com/page/downloads
Page 10

FTN02 manual v1717 10/49
1 Theory
1.1 General Non-Steady-State Probe Theory
For determining the thermal conductivity of materials various types of measurement
equipment can be used. In general one can make a distinction between steady-state
techniques in which the investigated sample is supposed to reach a perfect thermal
equilibrium, and non-steady-state techniques. In non-steady-state techniques the
material properties are determined while the sample temperature still changes.
The main advantage of steady-state techniques is the simplicity of the analysis of
stabilised constant sensor signals. The main adva nta ges of non-steady-state techniques
are the short measurement time and the fact that the sample dimens ions do not
necessarily enter the equation.
The only Non-Steady-State technique that has been standardised is the one using a
single needle probe (Non-Steady-State Probe or NSSP) like TP09.
ASTM D5334-14 and IEEE Std 442-1981(03) “Standard Test Methods" specify the use of
the NSSP in soil and soft rock. More information about these standards can be found in
the appendices.
In general a NSSP consist s of a heating wire, representing a perfect line source and a
temperature sensor capable of measuring the temperature at this source. The probe is
inserted into the soil that is investigated. The NSSP principle relies on a unique property
of a line source: after a short transient period the temperature rise, ∆T, only depends on
heater power, Q, and medium thermal conductivity, λ:
∆T = (Q / 4 π λ) (ln t + B) Formula 1.1.1
With ∆T in K, Q in W/m, λ in W/(m·K), t the time in s and B a constant.
The thermal conductivity can be calculated from two measurements at t
1
and t2. For TP09
(6.35 mm diameter) both t
1
and t2 are higher than 100 s, and typically 150 s apart. ∆T is
the temperature difference between the measurements at time t
1
and t2, taking t = 0 at
the moment that the heating starts.
λ = (Q / 4 π ∆T) ln(t
2
/ t1) Formula 1.1.2
The sample size is n ot critical, as long as a radius around needle is covered that is
roughly 50 times the needle radius, in case of TP09 (the needle of FTN02), which has a
3.175 mm radius: 160 mm. (please note that with low conductivity media like dry sand,
glycerol and Perspex, the sample diameter can be reduced to 100 mm)
Page 11
FTN02 manual v1717 11/49
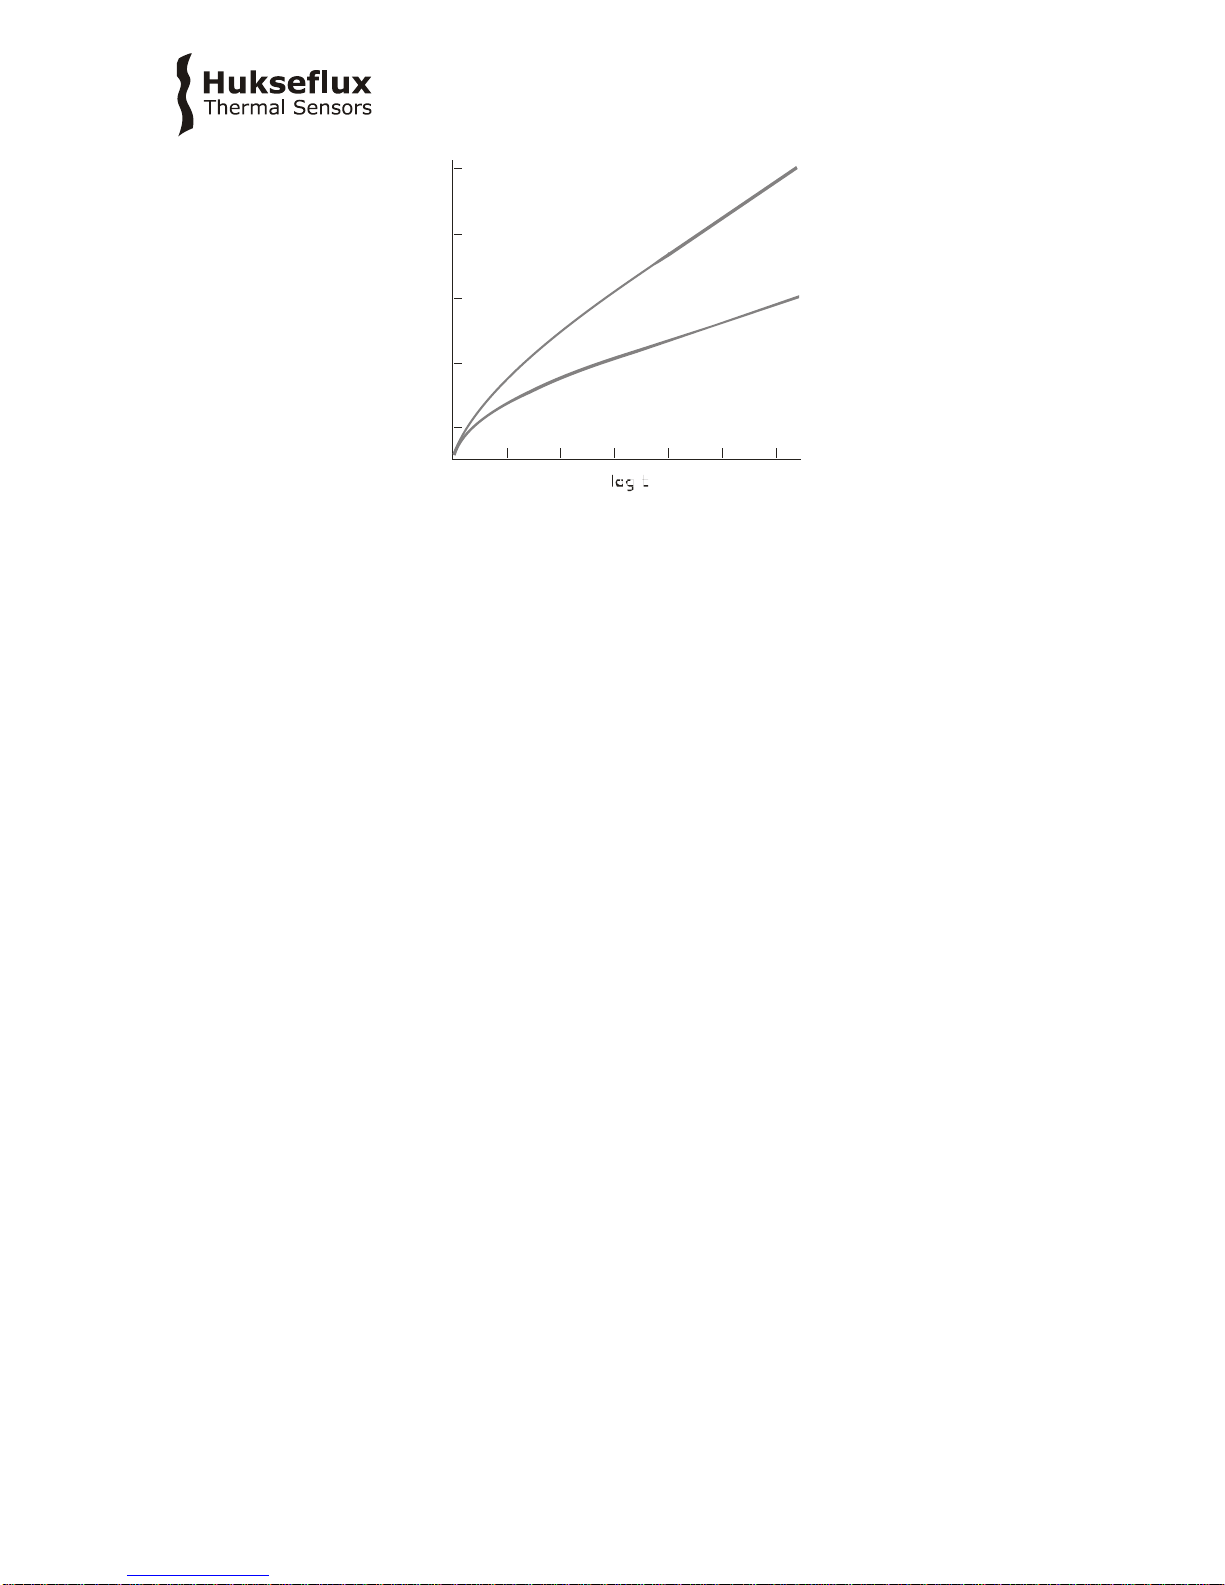
Figure 1.1.1 The signal of FTN02 as a function of the natural logarithm of time. After a
transient period the graphs show linear behaviour. In this phase the slope of the graph is
inversely proportional to the thermal conductivity
λ
.
The formula 1.1.2 is a first order approximation that is only valid under certain
conditions.
The most important conditions are that the medium has reasonable thermal contact with
the probe, that the probe is not moving and that the soil is thermally sta b le. More details
can be found in the specifications and the directions for performing a measurement. More
details on the mathematics and literature references can be found in the appendix.
Whether TP09 has passed the transient period is usually apparent from the standard
deviation of the measurement result on the CRU02 screen. Alternatively it can later be
checked by review of the data that are extracted from the CRU02.
The measurements of Q, t and ∆T are all direct measurements of power, time, and
temperature and are done without need of reference materials. The measurement with
FTN02 is absolute.
Apart from the term “thermal conductivity”, also the term "thermal resistivity" R
th
is
often used.
R
th
= 1/ λ Formula 1.1.3
In this manual only the term thermal conductivity is used.
1.2 Data analysis in the CRU02
Because of the variable conditions in fie ld measurements, data analysis of the
measurement results is hard to automate. In the CRU0 2 a firs t result is calculated by
analysis of the last half of the measurement cycle. Taking a heating time of H seconds
(typically 300 seconds), the last half is typically 150 seconds. Of this last half, the slope
is calculated over several intervals; 0.5H, 0.4H, 0.3H and 0.2H. Both the average and the
standard deviation, expressed as a percentage of the average, are calculated.
∆T
low λ
high λ
Page 12
FTN02 manual v1717 12/49
1.3 Data review on PC
The data review on PC can serve to increase the reliability of the measurement. The
general idea is that with automatic analysis, there still is the risk of wrong data being
accepted.
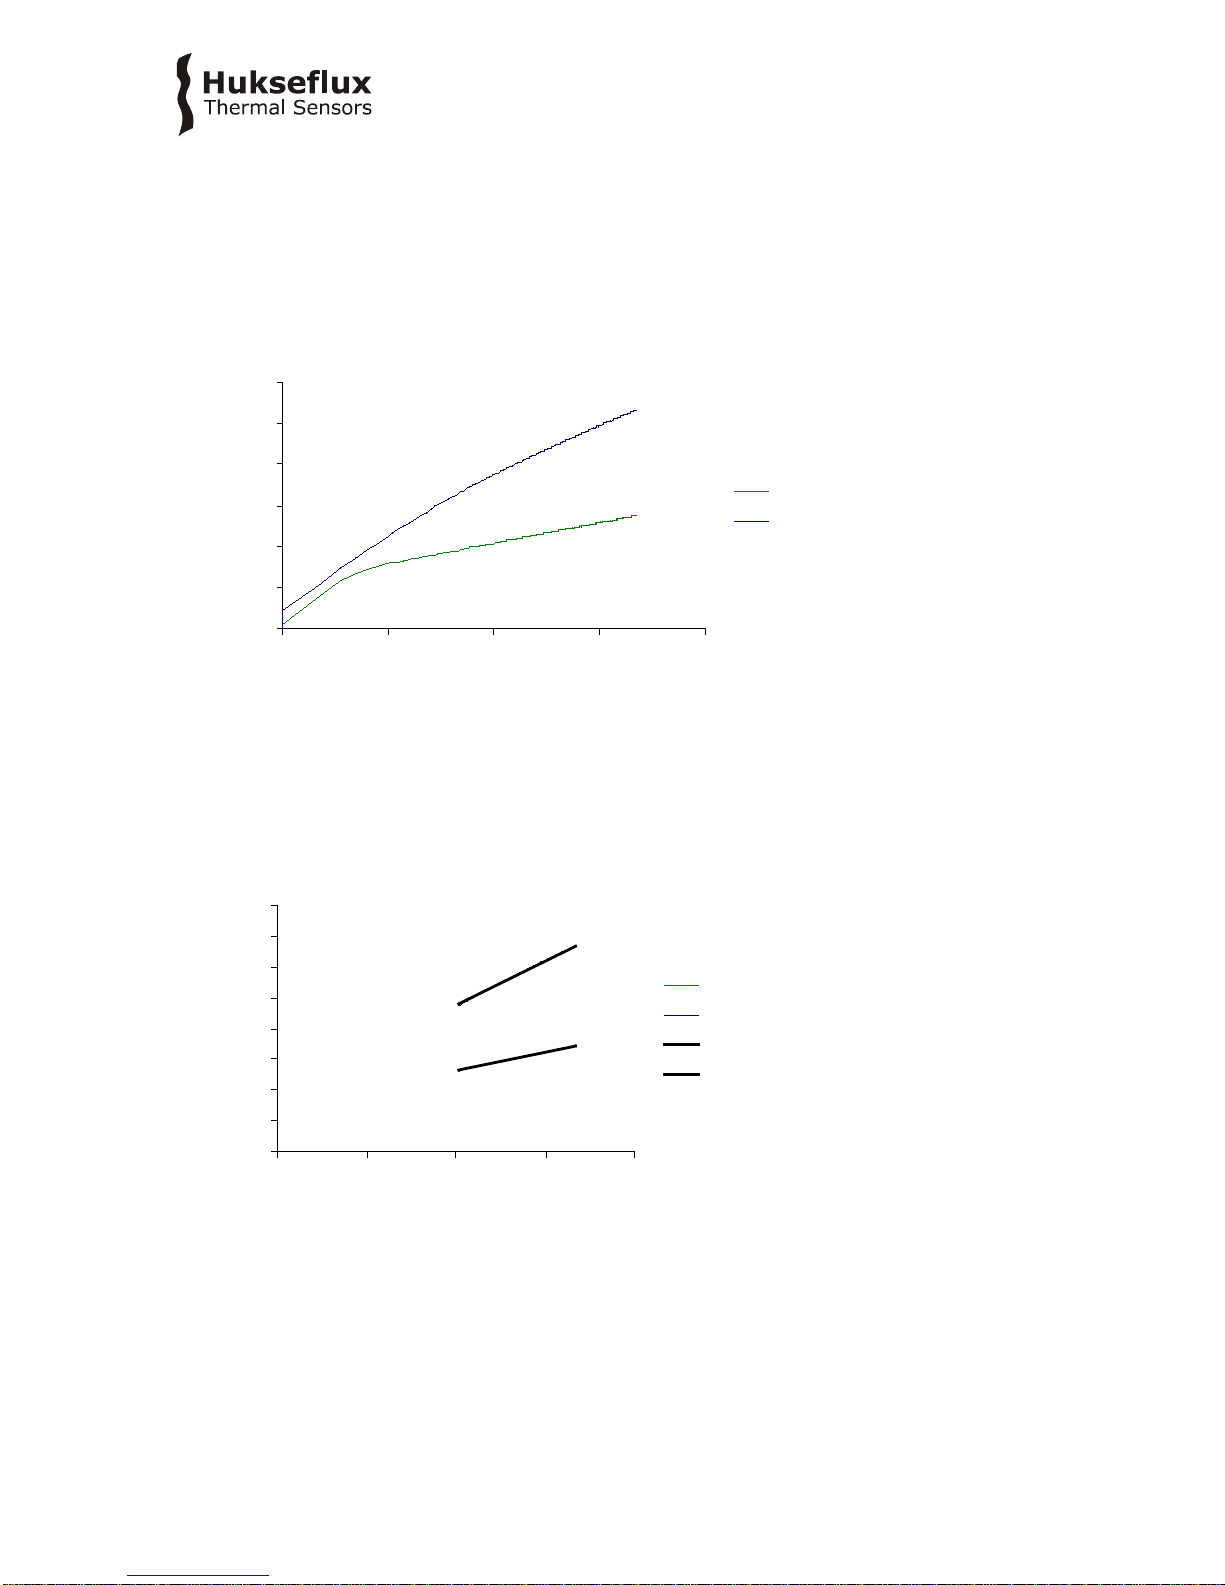
The figures below give an example of data analysis within Excel, using the measured
date that are downloaded from the CRU02 to the PC.
Figure 1.3.1 Typical measurement results in agar gel and dry sand. The thermal
conductivity's are 0.6 and 0.3 respectively. The linear portions of the graph have to be
selected by the user. The graph illustrates that the portion that is suitable for analysis
changes from one medium to the other.
Figure 1.3.2 Example of data analysis in Excel. See also formula 1.1.1. A linear portion
of the graph of the figure 1.3.1 has been selected. The temperature T has been
multiplied by 4
π
and divided by the heating power per meter. The Excel program can
automatically calculate the best linear fit. The end result for the thermal conductivity's is
1/3.608 and 1/1.559, which is 0.27 and 0.64 W/(m·K) respectively.
0
0.5
1
1.5
2
2.5
3
0 2 4 6 8
ln (t i me) s
Sensor Output mV m / W
agar
sand
y = 3.6082x + 9.3593
y = 1.5594x + 6.8217
0
5
10
15
20
25
30
35
40
0 2 4 6 8
ln (t i me) s
Sensor Output 4 pi T m / W
agar
sand
Lineair (s and)
Lineair (agar)
Page 13

FTN02 manual v1717 13/49
2 FTN02 design considerations
FTN02 has been designed:
1. To be suitable for field surveys for electric cable trajectories and trajectories of
heated oil pipelines.
FTN02's primary focus has been on the capability to perform field measurements.
This implies that it is able to perform measurements without external power
source and that the system is sufficiently robust to survive m anual insertion into
most common soils. The system runs as a stand-alone unit, powered by the
batteries in the CRU02. Recharging can be done by a 12V DC source or a car
battery using the CA02, or on 220/110 VAC using the WSA02 adapter.
2. To save costs and time.
Many cables and pipelines are buried at a depth of around 1.5 m. The long lance,
LN02, 1.5 m, serves to avoid the necessity to dig a large access hole. In general a
small-diameter hole (typically 30 mm in diameter) is drilled to a depth just above
the required depth of measurement (generally using a ground drill). After this the
lance LN02 is inserted. The probe TP09 itself (the 17 cm tip of LN02) is then
brought down (hammered or by manual force) into the undisturbed soil.
3. To be compliant with existing standards.
For institutes that prefer to work according to standardised procedures: The
measurement with FTN02 is compliant with the ASTM standards D5334-14 and
IEEE Std 442-1981(03).
4. To produce relatively simple measurement results, allowing on site automatic
measurement as well as subsequent review on PC using stored data.
Automatic processing and visual review: CRU02 automatically processes the
measurement data, and gives both an end-result and a q uality indication of the
measurement. The FTN02 has a fairly simple signal analysis, only involving the
conversion of the signal to a logarithmic scale, and establishing the slope of the
curve. CRU02 can archive 50 measurements. In case of review, the end result is
preferably checked and recalculated by analysis of the measured data in a
spreadsheet (like Excel) or a mathematical program. Note: Hukseflux as well as
ASTM recommend performing a visual data review, using the stored data.
5. To have a traceable calibration that can be repeated on site.
Local Calibration: the FTN02 measurement is absolute and traceable to the
measurement of the heater resistance and the Pt1000 properties. For all practical
calibration purposes however, it is recommended to use glycerol at 20
o
C which is
easily obtainable and has a well establis hed thermal conductivity. Verification of
the stability of the total system can be done by repeate d (half-yearly) testing in
glycerol. This test can also be performed in the field.
6. To be locally serviceable.
The FTN02 measurement is absolute and traceable to the measurement of the
heater resistance and the Pt1000 properties. For all practical calibration purposes
however, it is recommended to use glycerol at 20
o
C which is easily obtainable
and has a well established thermal conductivity. Verification of the stability of the
total system can be done by repeated (half-yearly) testing in glycerol. This test
can also be performed in the field.
7. To allow entering software updates by the user.
New software versions can be sent over internet and loaded into the CRU02 by
the user.
Page 14

FTN02 manual v1717 14/49
3 General Directions for Performing a
Measurement
The measurement must be performed conforming to the following procedures:
1. Make sure that the probe has good thermal contact to the soil.
In case of large air gaps between probe and soil, the soil should be compressed
again by hand to the original density. In case this is not possible filling material
(loose sand, silicone based thermal paste, toothpaste) can be used.
2. Verify that the probe is not moving before and during the measurement.
The measurement technique introduces a heat flow into the material. It is assumed
that this heat is transported by conduction and that ther e are no temperature
changes caused by other sources. The probe is supposed to be static before and
during the actual experiment.
3. Set up the correct power level.
The heating voltage of FTN02 can be adapted. In badly conducting soils, like dry
soil, there is less need for heating than in well conducting soils. If possible, do not
heat more than necessary.
4. Wait for thermal equilibrium.
After inserting the probe into the soil, wait for at least 5 m inutes before starting a
measurement. For example: when bringing a probe from a hot environment into a
relatively cold soil, the probe will need some time to adapt. The CRU02
automatically waits for sufficient equilibrium. This can be overruled, but it is
recommended not to do this.
5. Work at the highest possible level of reliability.
Replace bent probes as soon as practically possible.
6. Work at the highest level of quality assurance.
Whenever possible perform calibrations in glycerol as a check of good instrument
performance. This measurement can also be performed in the field.
7. Work at the highest level of quality assurance.
Optimal results are obtained when measurement results are critically reviewed
before final acceptance. First of all this should be done against common
experience. (see appendix about expected values). Also visual data review is
recommended if possible.
8. The procedures as recommended in the ASTM and IEEE standards offer a good
guideline, but do not need be followed under all conditions.
Page 15

FTN02 manual v1717 15/49
4 FTN02 Specifications
4.1 Specifications of FTN02
FTN02 Field Thermal Needle System for Thermal Conductivity / Resistivity Measurements
is used for determining the thermal conductivity or resistivity of the soil in which it is
inserted. It consists of a LN02 (Lance), which serves to support the TP09 (Non-SteadyState Probe), CRU02 (Control and Readout Unit), WSA02 and CA02 adapter s. FTN02 is
supplied with CRU02 Manager Software for the collection, archiving and review of data.
Table 4.1.1 Specifications of FTN02 (continued on next pages)
GENERAL SPECIFICATIONS
Measurement
method
Absolute measurement, according to the standards
ASTM D5334-14 and IEEE Std 442-1981(03).
Specified
measurements
Thermal conductivity of soils as specif ied under suitable soils.
Directions from the manual should be followed.
Suitable soils
Granular soils (grain size smaller than 3 mm), soils, slurries, mud
and soft rock in the thermal conductivity (λ) range of 0.1 to 6
W/(m·K). Essentially this includes all known soil types.
Soil requirements
Preferably the soil is in good conta ct with the TP09 needle. Hard
soil or soft rock may be pre-drilled. Filling material may be used
to promote contact. The soil must be thermally stable (dT/dt < 1
% of the heater induced change typically, 5 % max) and
reasonably homogeneous.
In case of soil samples: please consult Hukseflux about
alternative needles.
Duration of the
heating cycle H
H must be as short as medium and readout allow. 300 seconds
(typical). Empirically verified for each soil type.
Heating Power /
meter Q
Q must be as low as the medium and readout allow. Typically Q
is adjustable so that the temperature rise is no more tha n 3 °C.
Typically lower than 5 W/m.
Temperature ra n g e
-30 to +80 °C (TP09)
0 to +80 °C (CRU02 and Cable)
Protection class
IP68 (TP09 and LN02) IP64 (CRU02)
ISO requirem en ts
FTN02 is suitable for use by ISO certified laboratories
Shipment
Total we ig h t including all access ories & packing: 15 kg (net 12.2
kg)
Dimensions: incl. packaging 1800x500x200 mm (transport case
TC01 is 1750x400x125)
CE requirements
FTN02 complies with CE directives
MEASUREMENT SPECIFICATIONS
Data analysis
First automatic analysis: by CRU02
Second review: Using CRU02 software on the PC the stored data
can be transmitted from the CRU02 to the PC and be exported to
a spreadsheet (Excel) or a dedicated mathematical program.
Expected accuracy
Thermal conductivity: ± (6 % +0.04 W/(m·K) for homogeneous
soils with good contact to the probe.
Temperature reading: +/- 4 oC
Repeatability
Thermal Conductivity: ± 2 %
Temp. dependence
< ± 0.04 %/°C after correction of Pt1000 temperature
dependence
Page 16

FTN02 manual v1717 16/49
TP09 NON STEADY STATE PROBE SPECIFICATIONS
Heater Re
85 Ohm/m (nominal), specified for each individual sensor within
± 1.0 %
Temperature
Pt 1000 Class B, IEC 751:1983
Probe dimensions
Needle: 6.35 mm diameter, length 170 mm
CRU02 CONTROL AND READOUT UNIT SPECIFICATIONS
Measurement
specifications
Display of thermal conductivity and standard deviation of the
thermal conductivity
Variable heating level
Variable heating time
Data Storage
50 measurements can be stored. Including text comment.
Power supply
Battery Powered, rechargeable Lithium-Ion battery pack. When
empty: full charging from a 5 VDC, 1A source takes 11 hours.
Measurements after 1 hour.
Software
New firmware versions can be downloaded through the USB port
Connection
2 m cable to LN02, ending in a Binder connector.
Data transfer
USB
CA02 CAR ADAPTER SPECIFICATIONS
Connection
12 VDC or 24 VDC power supply through a car lighter connector
Output
5 VDC 1 A
Connector
DIN ISO 4165
LN02 LANCE SPECIFICTIONS
Length
1.4 m
Connector type
Serie 713/763 M12 Binder connector
WSA02 WALL SOCKET ADAPTER SPECIFICATIONS
Power supply
100-240 VAC 50/60 Hz
Output
5 VDC 1 A
Plug
Suitable for most international wall sockets (set of different plugs
is includ ed)
CRU02 SOFTWARE SPECIFICATIONS
Required PC
Windows XP or higher, one free USB port, 30 MB hard disk space
CALIBRATION
Calibration
traceability
Pt1000 according to IEC 751:1983
Recalibration
interval
Every 6 months using glycerol reference fluid or CRC cylinders
Recalibration
interval CRU02
Every 2 years by sending CRU02 to the factory for recalibration
(recommended)
Page 17

FTN02 manual v1717 17/49
5 Arrival of a New FTN02
5.1 Preparation before Arrival
As a preparation, preferably the operator should read the chapters 1 to 4.
Table 5.1.1 List of items that the operator should have available
ITEM
REMARKS
Glycerol Fluid
Consumer quality of at lease 96 % purity, 1 litre
PC (optional)
Running MS windows XP or higher, with one free USB port
Power
5 VDC power supply or car battery or 110-240 VAC
5.2 Checking upon Arrival
When the instrument arrives, it is recommended to check if the delivery is complete. The
list of delivered items can be found in the chapter on Order ing and Check ing at Delivery.
The most common overall system check is to perform a first measurement in glycerol.
For this see the next chapter.
Page 18

FTN02 manual v1717 18/49
6 Quick System Test
The CRU02 can be operated using the following buttons:
Table 6.1 Essential buttons on CRU02
BUTTON
FUNCTION
ON/OFF button
Switching ON and OFF
ENTER
For selecting menu’s or functions
ARROW Λ
SCROLLING UP in a menu
INCREASING values
ARROW V
SCROLLING DOWN in a menu
DECREASING values
ESC
ESCAPING, cancelling or going back
The FTN02 is shipped ready for use. In case the battery is empty one should recharge.
For recharging see the appendix (11.9) on recharging.
Table 6.2 Delivery of CRU02. Essentially it is shipped ready for use.
ITEM
ACTION
Batteries
Charged
Heating duration
Set up to 300 s
Heater Voltage
Set up to 3 V
Heater Resistance
In accordance with the TP t hat is mounted on the LN
The following table contains the procedure for a quick system test. By performing this
test, one will see how the system works. After this system test, it is suggested to read
the following chapters on the user guide and the data transfer and review.
Page 19

FTN02 manual v1717 19/49
Table 6.3 Procedures for a quick system test
PROCEDURE
1
Use CRC05 with glycerol to ensure good contact between TP09 a nd C RC05,
or fill the jar JR01 with glycerol. There now should be a mix of fibres and glycerol.
2
Put the TP09 into the CRC05 or glycerol
3
Connect CRU02 to the LN02
4
Press ON/OFF to start the CRU02. The end result should be a screen with title " CRU02- "
5
Press ARROW V to menu "Start Measurement"
6
Press ENTER
The system now ana lyses if the situation is sufficiently stable to perform a
measurement. There is a countdown for 60 seconds, and the temperature gradient
is shown on the display. After 60 seconds, the system either accepts, or waits for
the proper conditions.
After acceptance, the measurement is started.
During the next 300 s, the temperature and current reading is visible on-screen.
7
After the measurement, possible measurement warnings can be shown. If so, read
these and press ENTER
8
Now 4 different calculated values of the thermal conductivity appear, all determined
using a different part of the measured curve.
The value “λsd
" is the standard deviation as a percentage of the average value. This
value is a quality indicator, and should be less than 0.1 W/(m·K)
The value " λavg" is the average, which is the measurement end result in W/(m·K)
9
The value in glycerol should be between 0.25 and 0.35 W/(m·K).
The value of CRC05 should be between 0.16 and 0.25 W/(m·K).
The standard deviation should be less than 0.1 W/(m·K)
10
Press ENTER to continue
A graph of the performed measurement is shown
11
Press ENTER
To add measurement information, press ENTER
12
Press ARROW Λ or ARROW V to scroll between fields, press ENTER to select a
measurement information field. Text can be typed with the numerical pad. Press
ENTER to submit the measurement information.
When done with adding information, press ARROW < to go back
13
Press ARROW V to store data
14
The CRU shows in which slot the data will be stored. Press ENTER to store the data,
press ESC to discard the data
15
The system is ready for the next measurement
Page 20

FTN02 manual v1717 20/49
7 User Guide
7.1 Preparation
The user should be familiar with the previous chapters. The user should have performed
the quick system test. The user now knows how the system works.
The CRU02 batteries should be charged; this is simply done by putting CRU02 to the
charger for 11 hours before the measurement campaign. If this amount of time is not
available, after about one hour of charging the first measurements can be done.
It is recommended to verify that the probe resistance as entered into the CRU02 is
correct. Menu “Setup measurement” “Heater Ohm/m”.
It is recommended to verify date and time: “Setup measurement” “Date and time”.
Before a measurement campaign, it is recommended to clear the memory: “Data access”
“Clear all data”.
If possible, a jar with glycerol for field calibrations should be prepared.
Before and after any campaign the system should be checked according to the procedure
in the quick system test.
7.2 Cautionary Notes
The user should be familiar with the safety issues that are indicated on the initial pages
of this manual.
7.3 Performing Measurements
The general rules for performing a correct measurement are already laid down in an
earlier chapter.
For FTN02 one might add the following:
1 In case the measurement appears to have a standard deviation larger that 0.1
repeatedly, probably the heating level is too low. The problem can be solved by going to
menu “Setup measurement” “Heating voltage”. Increase the heating voltage with the
ARROW Λ.
2 In case there is need for battery saving, the backlight can be turned off. Go to “Setup
Measurement” “Backlight”.
3 After a measurement has been carried out, additional information can be entered with
each measurement. This can only be done direct after the measurement.
Page 21

FTN02 manual v1717 21/49
4 The decision about the exact tools to be taken on a measurement campaign is left to
the user; however, one should take a ground drill and in case of hard soils and some
filling material.
5. Power level of 3 V and heating time of 300 seconds are settings that works for the
most of the soils.
7.4 Calibration
Preferably calibrations are performed before and after the measurement campaign, using
glycerol gel or using CRC Calibration Reference Cylinders. If possible, these calibrations
can also be performed in the field for extra quality assurance.
The advised setting for a calibration is 300 s, 4 V.
One can perform a calibration by measuring specimen with known thermal properties.
This can be CRC05 or glycerol with fibres. Knowing the thermal properties of the
specimen, the deviation from perfect behaviour can be calculated.
If glycerol is used, make sure the glycerol gel and the polyester fibres are very well
mixed ensuring homogeneity of the fibres.
If CRC05 is used, perfect contact between TP09 and CRC05 is ensure d by putting glycerol
in CRC05.
When deviating within (12 % + 0.08 W/(m·K)), twice the accuracy, it is suggested not to
change the calibration information. If the deviation of the measurement is outside the
range mentioned above, it is recommended to adapt the c a libration of the heater
resistance accordingly.
If the calculated thermal conductivity is lower than exp ected by a certain percentage, the
apparent output is too high relative to the apparent heating power. This can be corrected
by assuming that a higher power has been applied, which is achieve d by increasing the
heater resistance in Ohm/m by the same percentage.
For information on factory r ecalibration of CRU02, see the chapter on maintenance and
storage.
Page 22

FTN02 manual v1717 22/49
7.5 Menu Structure
Table 7.5.1 Menu structure of the software running on the CRU02. The menu is largely self-
explanatory. Text can be entered using the numerical keyboard. Comments are in ita lics.
LEVEL 1
LEVEL 2
LEVEL 3
COMMENT
Setup
measurement
Needle model
TP09
TP07
Selects the type of
needle used
Needle serial
The serial number of the
needle
Heater Ohm/m
70 – 95 Ω
Resistance of the
heating wire in Ω/m
Heating voltage
1.0 – 4.5 V
Voltage for heating,
increased in steps of 0.5
volt
Interval
100 – 1000 s
Duration of the
measurement, increased
in steps of 100 seconds
Unit
λ W/(m·K)
λ BTU/(hr·ft·°F)
R m·K/W
R hr·ft·°F/BTU
Project name
Name of the
measurement campaign
Operator ID
Name of the operat o r
using the FTN system
Backlight
ON or OFF
Turns the LCD backlight
on or off
Date and time
HH:MM MM-DDYYYY
Date and time used by
the CRU module
Reset CRU to default
Reset the CRU to default
settings
Start
measurement
Measurement starts
immediately with
stabilizing
Add measurement
information
Depth
Depth of the needle in
tested material
Location
Location where the
measurement is
performed
Remark 1
Additional field for
information
Remark 2
Additional field for
information
Remark 3
Additional field for
information
Store data
ENTER
Store data
ESC
Discard data
Data access
Browse through data
01 - 50
Stored measurements
Clear all data
Power off
Power off
Page 23

FTN02 manual v1717 23/49
7.6 Software
First the CRU02 program should be installed on the PC, in order to make data transfer
possible from CRU02 to the PC.
1. Insert the USB flash drive in the computer
2. Select ‘setup_CRU02’
3. Run the software and install additional drivers
4. A shortcut will be placed on the desktop
5. The software is now installed and can be run from the computer
For available software / firmware updates, please check:
http://www.hukseflux.com/page/downloads
Page 24

FTN02 manual v1717 24/49
8 Data Transfer, Archivin g an d Review
8.1 Connecting CRU02 and PC, downloading data to a PC
The CRU02 and the PC can be connected using the USB port that is hidden behind the
bottom cover of the CRU02. The cover can be removed by pressing the two small buttons
at the sides of it.
Once software and drivers have been installed, user should connect the CRU02 unit to
the PC, open the CRU02 software on the PC and select the correct COM-port fo r
communication under the ‘Options’ tab (a virtual COM port will be made by the software
drivers).
Figure 8.1.1 For additional quality insurance, the data of the measurements can be
stored and downloaded to the PC, and reviewed using the CRU02 software (1). The
CRU02 (2) can be connected to the PC by removing a cover (4) and connecting the USB
cable on both sides (3). Visual data review is required by ASTM.
3
CF3B
F2
A
F1
D
F4
E
F5
H
F8
G
F7
F
F6
I
F9
J
F10
MLK N O
RQP S T
W
VU
X
Y
7
Home
X
9
Pg Up
8
4 6
2
3
Pg Dn1End
5
0
Ins
SHIFT
START
ENTER
SPACE
.
:
DEL.
,
ESC
\
*
/
+
-
Hukseflux
Thermal Sensors
4
1
2
Page 25

FTN02 manual v1717 25/49
8.2 Reviewing Data in the Hukseflux CRU02 Manager
For reviewing data and troubleshooting possible problems the Hukseflux CRU02 Manager
can be used.
Connect the CRU02 to the computer using a USB cable.
Press “Read memory”.
The menu consists of four windows:
1 Summary:
This window shows the value of all the important parameters, in particular thermal
conductivity and standard deviation. The value o f the standard deviation must be smaller
than 0.1 for quality assurance.
Figure 8.2.1 Main window in the CRU02 program, showing a summary of the
measurement, including all text that has been added
Page 26

FTN02 manual v1717 26/49
2 Leader:
This window shows the temperature during one minute before the measurement. The
temperature should be stable. A rule of thumb is that the temperature change in the
leader should be smalle r than 0.1 °C. In case the fluctuations are too high, you should
wait more time before starting the measurements so that the needle can stabilize in the
material and increasing the power level.
Figure 8.2.2 Leader window in the CRU02 program, showing the temperature during
one minute before the measurement
Page 27
FTN02 manual v1717 27/49
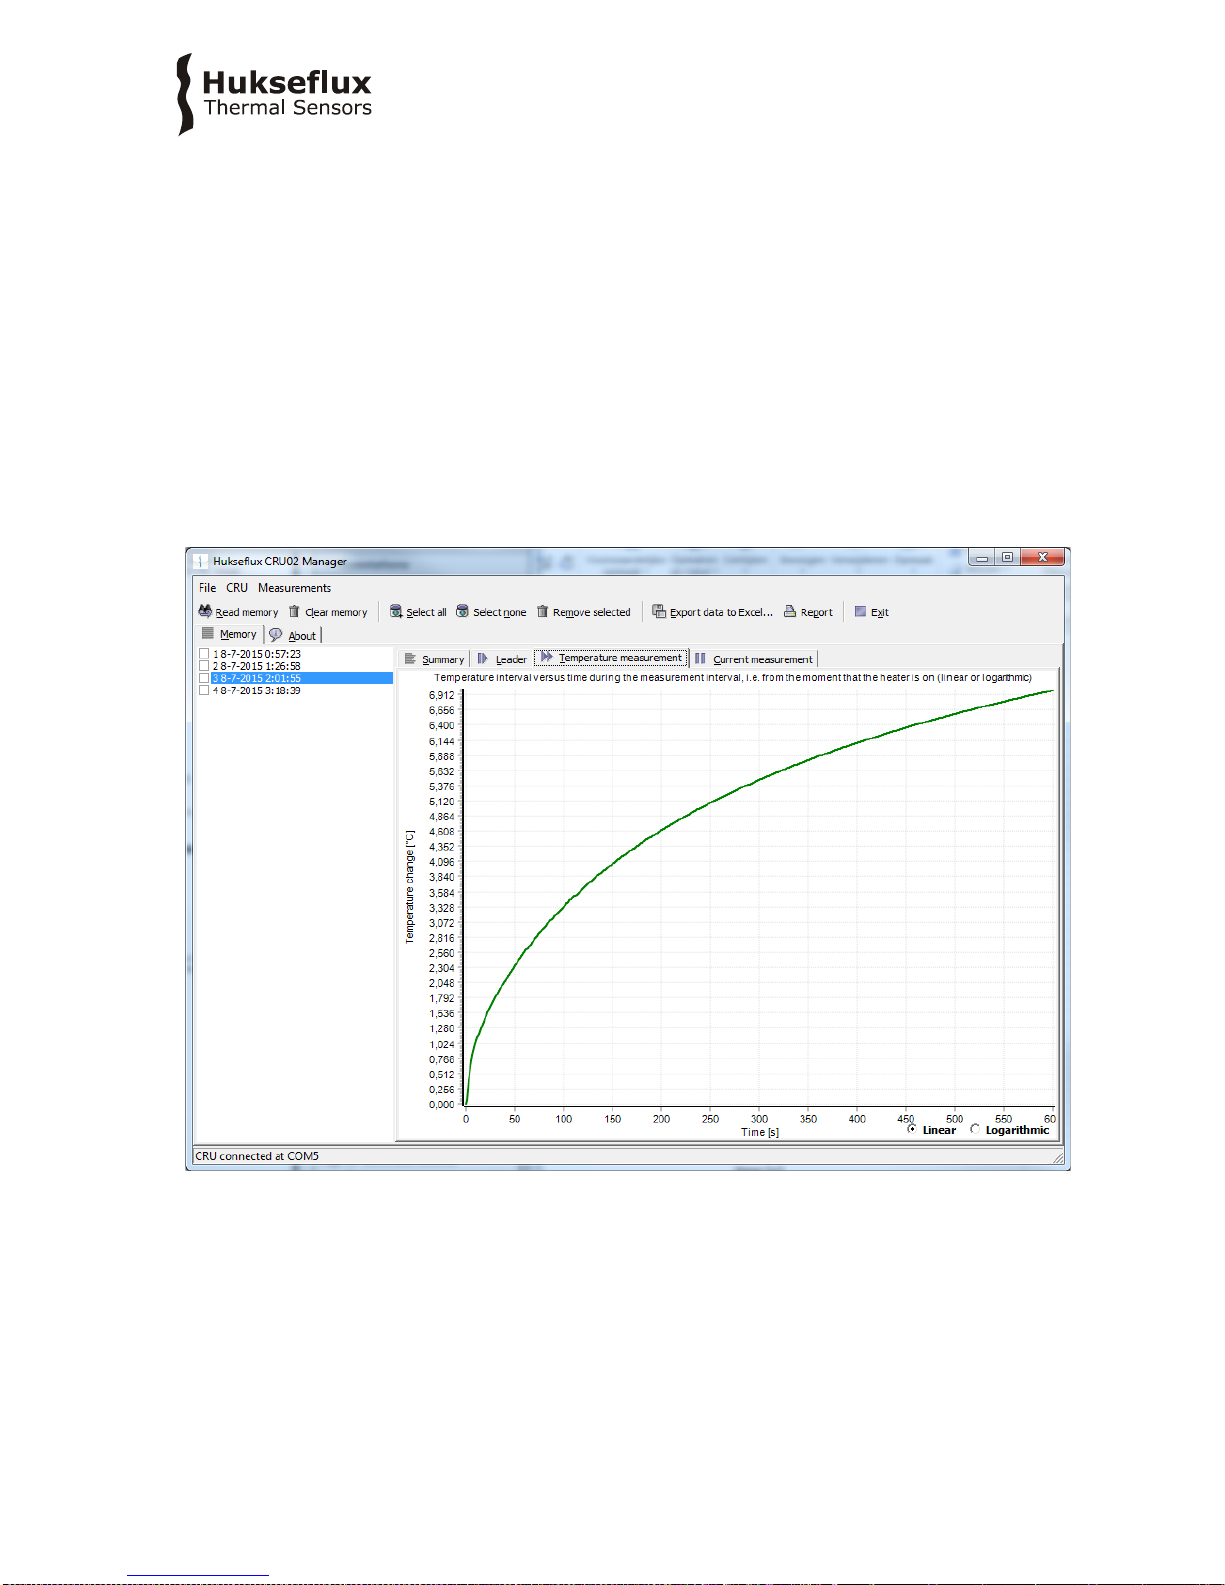
3 Measur e me nt window:
This represents the temperature versus time.
In the bottom of the screen either a linear of logarithmic time scale can be selected.
Temperature should increase and no t fluctuate. When the curve is fluctuating too much,
it means that there is not enough equilibrium with the medium or/and that the sensor is
moving. Wait longer before starting the measurements and/or apply higher power.
The last part of the temperature versus logarithmic time curve should be straight. When
the last part of this line is not straight, the calculated thermal conductivity value will be
wrong. This can indicate two different facts: the flux has reached the media container
and/ or, in case of wet soil, it can indicate that convection has started. In these cases,
reduce the heating time to 300 sec and/or increase the mass of the media to measure so
that it takes longer to reach the boundaries.
Figure 8.2.3 Measurement is the main review window in the CRU02 program. It shows
the temperature versus the logarithm of time. The last half of this line should be straight
Page 28

FTN02 manual v1717 28/49
4 Heater current:
Heater current should be constant; deviation <1 mA.
When heater current is no t constant, the battery has problems or need to be charged.
Figure 8.2.4 Heater current window, showing the value of the current going to the
heater of the needle
Page 29

FTN02 manual v1717 29/49
8.3 Reviewing Data in Excel
Hukseflux has an Excel template which can be used for detailed analysis of the
measurement data.
This template offers the possibility to select different time intervals for the thermal
conductivity calculations.
It also has the option to change the Re value of the probe used for data analysis.
The analysis sheet consists of three tabs. The “results” tab gives an overview of the
measurement results. Parameters in the yellow cells can be changed.
Data analysis step by step:
1. Export the data from Hukseflux CRU02 Manager to Excel using “Export data to
Excel…”
2. Copy the data of the measurement to be analysed to the “raw data” tab of
“FTN02 MTN02 calculation sheet vXXX.xlsx” (see figure 8.3.1)
Figure 8.3.1 Using the “Copy" button in the “Data" menu, the measurement data can be
copied to the analysis sheet using the “paste” function. Excel the user can make data
analysis and presentation of his o wn choice
3. View the graphs to check irragularities in the measurement
4. Input the time interval to be used in cell C4 and C5. The red diamond in the
measurement graph indicate the start and end of the interval visually. The linear
portion of the graph should be used. For an example see figure 8.3.2
Page 30
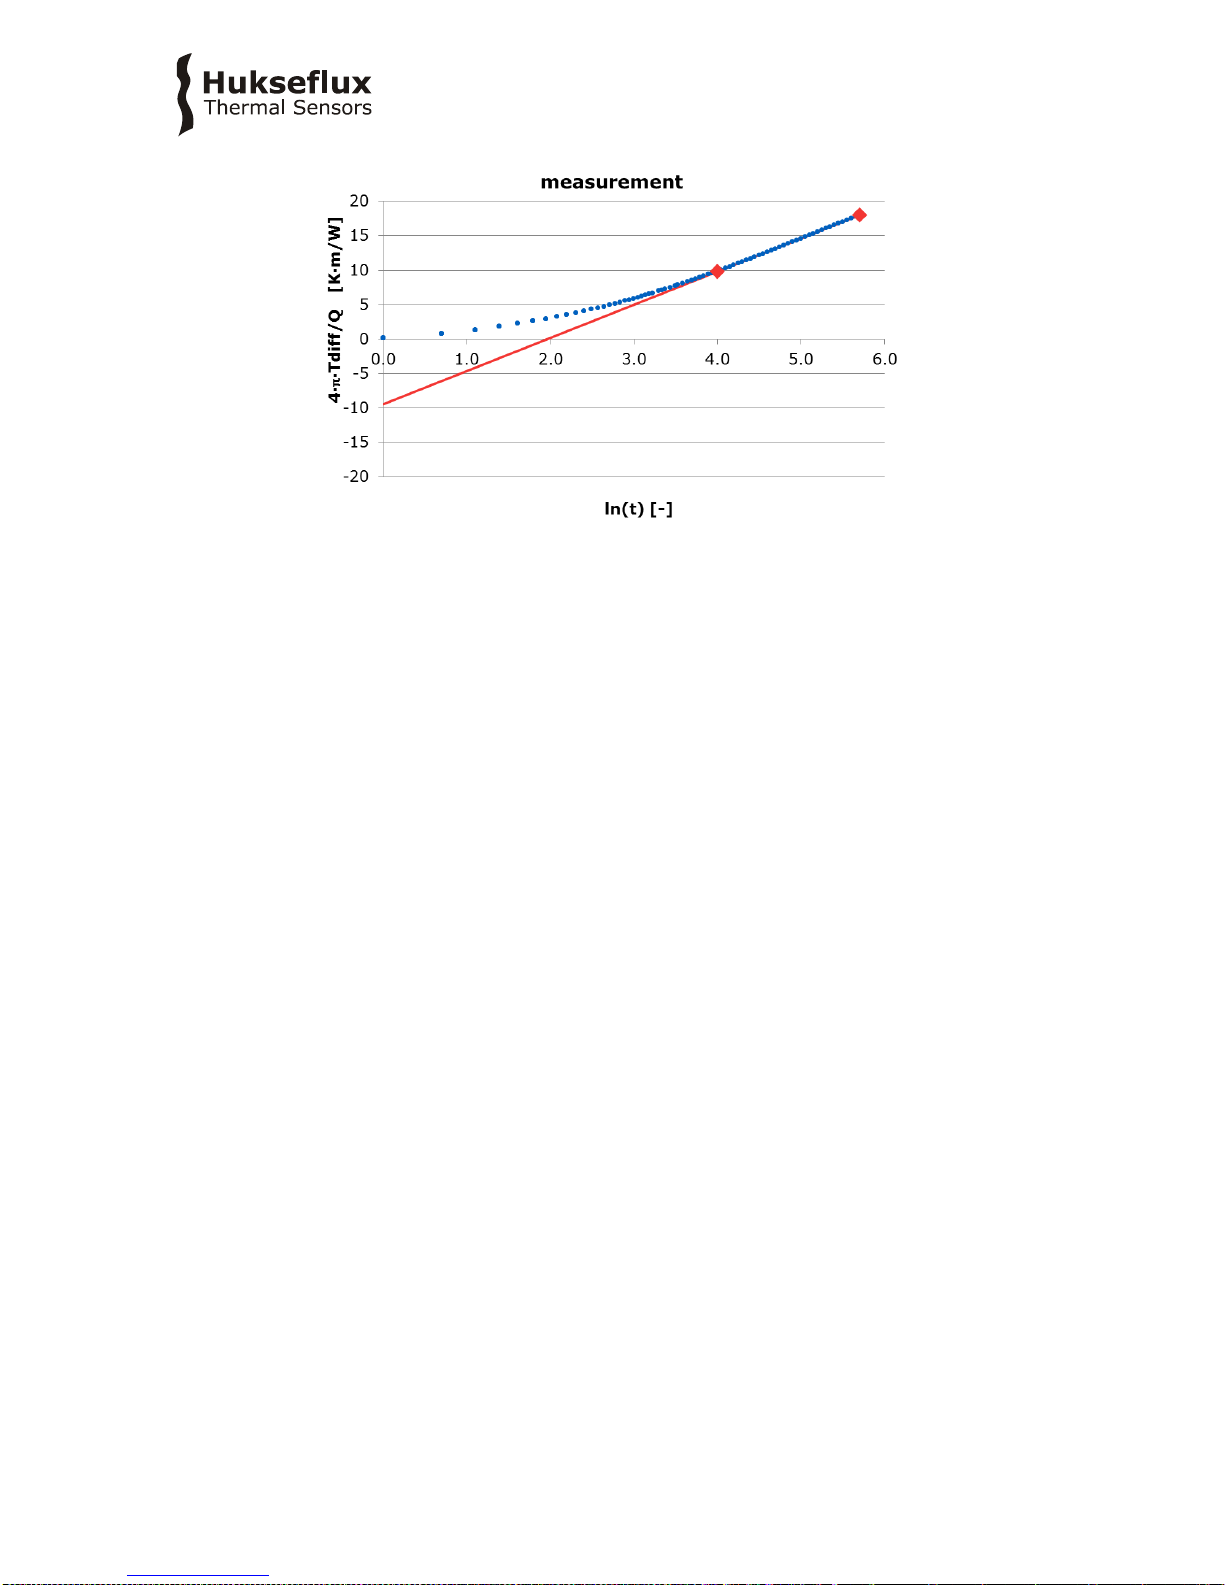
FTN02 manual v1717 30/49
Figure 8.3.2 Measurement graph with data interval ln(t_begin)=4.0 and ln(t_begin)=5.7.
5. The measurement results, used parameters, measurement details and remarks
regarding the measurement are shown in the results tab.
Page 31

FTN02 manual v1717 31/49
9 Maintenance and Storage
FTN02 does not need a lot of maintenance.
It is important to take care that the day before use the batte ry is c ha rged. See appendix
11.9 on charging.
After use the equipment can be cleaned using water.
CRU02 should be stored in a dry place.
Usually errors in functionality will appear as unreasonably large or small measured
values. As a general rule, this means that a critical review of the measured data is the
best form of preventive maintenance.
At regular intervals the quality of the cables and probe should be checked. On a regular
interval the calibration should be checked.
Table 9.1 Recommended schedule for calibration of FTN02
Every 6 months
Perform calibration of the entire system using glycerol with
fibre or CRC05
Every 2 years
Perform calibration of the FTN02 / CRU02 at Hukseflux
The functionality of FTN02 can be checked with a calibration of the entire system using
glycerol with fibre or CRC05. This procedure is explained in section 7.4.
The advice is to send CRU02 to Hukseflux for recalibration every 2 years. The date of the
last factory calibration is displayed for several seconds on the LCD screen of CRU02 after
starting up.
During factory recalibration the temperature, current and time measurement and the
voltage output are recalibrated. The CRU02 will be returned with a new calibration
certificate.
Page 32

FTN02 manual v1717 32/49
10 Delivery and Spare Parts
FTN02 delivery includes the following items:
Manual FTN02
CRU02 Control and Readout Unit
LN02 Lance
TP09 Thermal Properties Sensor
PT01 Protection tube
TC01 Transport Casing
JR01 Jar for glycerol, with polyester fibres
Calibration certificate for TP09
Factory Test Certificate for CRU02
CRU02 Manager Software on Hukseflux USB flash drive
TP09 Thermal Properties Sensor (1 piece as spare)
CA02 Car Adapter for 12 to 24 VDC
WSA02 Wall Socket Adapter for 220 or 110 VAC
USB Cable for CRU02 to PC connection
The following spare parts can be obtained at Hukseflux:
Fixing nut of LN02
Chassis part of LN02 (incl. 2 screws)
Connector (chassis part) for LN02
Connector for CRU02
Delive ry does NOT include glycerol fluid. This has to be locally obtained by the customer.
FTN02 software can be updated by the customer. New software versions are available on
a regular basis.
Page 33

FTN02 manual v1717 33/49
11 Appendices
11.1 Appendix on modelling TP09 behaviour
Modelling a finite line source is the subject of many scientific publications. Various efforts
have been made to estimate errors and to improve the model such that a more accurate
measurement can be attained.
The analytical solution to the problem is known. This involves t he fact that the probe has
a certain geometry, no significant conduction along the probe itself and has different
thermal properties than the medium. Also it assumes that there is a certain constant
contact resistance between the probe and medium. The equation is given in Kosky and
McVey.
On the other hand in most applications the ideal model, without considering probe
thermal properties and contact resistance is used:
∆T = (Q / 4 π λ) (ln t + B) Formula 11.1.1
It turns out that also if contact resistance and different thermal parameters are involved,
the long time solution of the analytical model and the ideal mode l lea d t o the same result
for λ. The only difference is that B is larger in the analytical model because of the contact
resistance. In other words, the effects of the probe thermal properties and contact
resistance are no longer visible some time after the heating has started. Because B
cancels from the equation for determination of λ, 12.1.1 is still applicable.
For the same reason the use of filling materials is allowed.
λ = (Q / 4 π ∆T) ln(t
2
/ t1) Formula 11.1.2
The normal transient period under ideal conditions is:
t
transient
= 10 D2/ a Formula 11.1.3
Under ideal conditions this means that the transient time is proportional to the soil
thermal diffusivity a, and the probe cross section (D is the diameter). The only
consequence of the addition of contact resistance and probe thermal properties is that
the transient period will take longer.
The remaining measurement error has been analysed by various a ut hors. Conclusions
are that the main parameters determining the transient period are R
cont
, the contact
resistance, and C
v needle
/C
v med
, the ratio of the volumetric heat capacities. The higher the
contact resistance and the lower the medium volumetric heat capacity, the longer the
transient time will be.
Theoretically, it would be best to take the measurement time of more than 10 minutes.
This is not possible because of three reasons:
Page 34

FTN02 manual v1717 34/49
1. the temperature rise becomes too small relative to the temperature changes induced
by outside sources.
2. there is a risk that the boundary conditions of the sample start playing a role.
3. there is a risk that the total energy that is released into the medium becomes so
large that the condition of the medium is affected.
Various attempts have been made to simplify the measurement procedure. There has
been limited success. The general recipe now is: take a look at the contact resistance. If
a large contact resistance is expected, and the medium allows the use of contact fluid or
grease (like toothpaste, agar gel, glycerol, silicone glue or Vaseline) can be considered.
This is often applied when analysing rock samples.
This means that for all practical purposes for the measurement of thermal conductivity's
the model of formula 1.2 can be used.
Regarding the accuracy of the measurement; the estimate o f ± (6 % + 0.04) W/(m·K)
for FTN02 is derived from various literature sources. For more details, see the list of
references.
11.2 Appendix on ASTM and IEEE standards
With FTN02 it is possible to perform measurements in accordance with the ASTM and
IEEE standards. These standards are:
ASTM D5334-14 Standard Test Method for Determination of Thermal Conductivity of Soil
and Soft Rock by Thermal Needle Probe Procedure
This standard can be obtained from ASTM. For information se e http://ww w .astm.org.
IEEE Std 442-1981(Reaffirmed 2003), IEEE Guide for soil Thermal Resistivity
Measurements.
Resistivity is the inverse of the conductivity. This parameter is not used in the text of this
manual.
The IEEE standard can be obtained from IEEE. For infor mation see http://w w w .ieee.org.
For full compliance with ASTM, it is necessary to follow the procedures described in the
standard. Hukseflux suggests allowing slightly modified procedures. The described
deviations are positively affecting the quality and practicality of the measurement, and
altogether compliance with the standards can be s ta ted w hen following the
recommendations in this manual in addition to those in the standards.
The IEEE standard is specifically written for application in the power industry, for
estimating thermal budgets of ele ctrical cables. Ther e is a clear distinction between field
measurements and laboratory measurements. In general FTN02 will be used in field
situations. Hukseflux can offer alternative needle designs for laboratory use.
Page 35

FTN02 manual v1717 35/49
11.3 Appendix on insertion of the needle into hard soils
During the measurement, the TP09 needle should be com pletely in contact with the
medium. It should be in a perfectly static position, with no possibility of movement.
Usually this is achieved by fixation of the needle.
In case of soft media the needle often can be inserted without any particular trouble. In
case of hard media like hard soil, a hole may be pre-drilled.
There are two possibilities for pre-drilling that are shown in table 11.3.1.
Table 11.3.1 Two possibilities for pre-drilling
In case of modestly hard media: 6 mm
diameter drills can be used to prepare the
path for the TP09 needle. Normally the
heating cycle time can remain unchanged.
The measurement accuracy will not be
affected.
To improve contact between needle and
medium, the medium around the TP09
needle is typically compressed manually.
The degree of compression should be no
more than that of the undisturbed
medium.
A hole diameter of up to 6 mm is
recommended, up to 1 cm is allowable in
extreme cases. The heating cycle time must
be increased. The measurement accuracy
can be maintained by reviewing the data.
In this case a hole is created that has a
significantly larger diameter than that o f
the TP09 needle. In this case the use of
contact material is necessary.
However, in order to make sure that the contents of the hole do not play a role in the
measurement, three measures need to be taken.
Table 11.3.2 Measures taken after pre-drilling with a larger diameter than the probe
After inserting the TP09 needle the hole
must be filled with contact material. This
can either be the original medium, now
loose, or a gel (solidified agar) or paste
(any white toothpaste or silicone glue). In
any case the presence of fluid materials
that might have thermal convection, in the
hole must be avoided.
Loose medium can be compressed as
much as possible around the TP09 probe
by hand. For dry or semi-moist media,
toothpaste is preferred over silicone based
thermal paste because of its relatively
high thermal conductivity.
The heating cycle duration is increased
from the usual 300 with the square of the
diameter to a maximum of approximately
600 s.
This is to make sure that the heat
generated by the TP09 extends well
beyond the diameter of the hole
Page 36

FTN02 manual v1717 36/49
11.4 Appendix on typical soil thermal properties
Table 11.4.1 A list of typical values of thermal properties of various materials. This list
is only indicative and can serve for estimating the medium thermal conductivity
Thermal
conductivity
@20 °C
W/(m·K)
Density
@20°C
Kg/m2
Volumetric
heat capacity
@20°C
106 J/m²
Thermal
diffusivity
@20°C
10-8 m2/s
Air
0.025
1.29
0.001
1938
Glycerol
0.29
1260
3.073
9
Water
0.6
1000
4.180
14
Quartz
3
2600
2.130
141
Concrete
1.28
2200
1.940
66
Marble
3
2700
2.376
126
Sand (dry)
0.35
1600
1.270
28
Sand (saturated)
2.7
2100
2.640
102
Glass pearls (dry)
0.18
1800
1.140
16
Glass pearls (saturated)
0.76
2100
2.710
28
Table 11.4.2 Reported values, as known to the author, of thermal conductivity in
different soil types in W/(m·K).
Range of all reported values for granular soils
0.15 to 4
Saturated soil
0.6 to 4
Sand perfectly dry
0.15 to 0.25
Sand moist
0.25 to 2
Sand saturated
2 to 4
Clay dry to moist
0.15 to 1.8
Clay saturated
0.6 to 2.5
Soil with organic matter
0.15 to 2
Solid Rocks
2 to 7
Tuff (porous volcanic rock)
0.5 to2.5
11.5 Appendix on glycerol / glycerine
The procedure for calibration relies on the use of glycerol. This substance is also known
under the name glycerine. Chemical datasheets can be found in separate appendices
(11.12 and 11.13).
Glycerol is safe. It can be bought in every pharmacy.
During calibration the glycerol is supposed to be static, in other words, not to flow. This
is why a t Hukseflux the glycerol is mixed with polyester fibres. This suppresses
convection. At the same time, the fraction of polyester fibres is so low (less than 1% by
mass) that the thermal conductivity of the glyce rol is not affected.
The properties of glycerol at 0 to 1 mass % plastic fibres closely resemble those of
glycerol:
Thermal conductivity: 0.29 W/(m·K), at 20 °C.
Page 37

FTN02 manual v1717 37/49
11.6 Appendix on electrical connection of TP-CRU02
Putting more than 5 Volt across the heater may result in permane nt damage
to the sensor. The input voltage for charging should not exceed 5 VDC as it
may lead to damage of the CRU02 battery.
In case the user chooses to replace a TP needle or makes other adjustments to FTN02, the
following wire colours need to correspond in order for the system to function properly:
Table 11.6.1 Connection and colour codes of CRU02, cable, connector and needle wires
CRU02
CABLE
TP / ADAPTER
Yellow (heater)
Yellow
TP Yellow
Brown (heater)
Brown
TP Yellow
White (1)
White
TP Red
Red (2)
Red
TP Red
Blue (3)
Blue
TP White
Green (4)
Green
TP White
In case the user chooses to replace a connector and / or cabling, the following applies:
The connectors that are used by Hukseflux for TP and CRU02 are manufactured by
Binder. In order to protect the cables, these are first covered by a sleeve. The sleeve is
installed by thermal shrinkage.
Table 11.6.2 Connectors for use with FTN02
TYPE
CODE
Normal male
connector to
CRU02 cable
S 104 A055-130 with internal part
E3 104.2/6.7 + B
Normal female
chassis part in
TN01
DEE 104 A055-130 with
with
104.551 spacer 6 mm (for attachment to a thin wall)
Page 38

FTN02 manual v1717 38/49
11.7 Appendix on trouble shooting
Table 11.7.1 Extensive checklist for trouble shooting
PROBLEM
CAUSE
SOLUTION
Startup a message `No
probe connected ´ appears
The probe is not connected
properly to the FTN02
Connect the probe properly
to the connector blocks,
check cables for breaches.
On startup a message
"battery voltage too low,
connect adapter" appears
The voltage of the batteries
is too low.
Recharge the batteries.
The results of my
measurements are
consistently too high or too
low
The FTN02 is not properly
calibrated.
Recalibrate the FTN02 see
chapter 7.4.
The probe resistance has
not been stored in the
CRU02.
Enter the probe resistance
as engraved in probe see
chapter 7.1
The duration of the
measurement is extremely
long (27680s)
The values for the presets
have to be confirmed.
In the ‘setup’ menu confirm
all preset values.
The standard deviation
often is more than 0.1
W/(m·K)
The heating power of the
probe is too low
Increase the vol t a g e of t h e
heater in the menu ‘setup’
The display is not readable
The contrast is set either
too high or too low.
Ambient light is
insufficient.
In menu ‘setup’ ‘display
options’ adjust contrast or
turn on the backlight
The USB cable is not
properly connected.
Check the connection of
the USB cable.
11.8 Appendix on replacement of a TP
A TP can be replaced by unscrewing the tip of the LN and removing the connector on top.
The inside connection of the wires from the TP to the connector on the LN, is made by a
connector block. The wires on the block can be disconnected. A new TP can be installed,
and the wires reconnected. See the chapter on electrical connections in the appendices.
Carry out the following steps to replace a TP09 needle:
• Unscrew the two hexagonal nuts of the connector plate on lance LN02 (key size 4 mm)
Inside the top part of LN02 is a connector block that connects the connector to TP09
• Disconnect the wires of the old needle from the connector block
• Use a wrench (19 mm) to unscrew the needle from the bottom of LN02
• Remove the old needle and its wires from LN02 and replace it with the new needle
Page 39

FTN02 manual v1717 39/49
• Guide the wires of the new needle through LN02 to the connector block. Do not
remove the tube around the wires of the new needle
• Connect the wires of the new needle to the connector block
• Put the connector plate back on and fasten the hexagonal nuts
• Fasten the new needle with the wrench
The resistance value of the new TP must be entered. If this value is not
known, one can work with the old value (somewhere between 70 and 95
Ohm/m). In case of doubt, choose 80 Ohm/m. The obtained values ca n
always be corrected afterwards.
11.9 Appendix on battery charging
The CRU02 operates with a 3.7 volt li-ion battery pack. The internal CRU02 charging
circuitry regulates the charging and makes sure the battery is not over-charged, which
can permanently damage the battery. A full recharge can be done in 11 hours with any
source that can supply 5 VDC and 1 A. This can be achieved using either the WSA02, as
well as CA02.
Measurements can be performed after one hour of charging.
11.10 Appendix on downloading new software versions
The CRU02 is designed such that new software can be installed at no cost. For available
software / firmware updates, please check:
http://www.hukseflux.com/page/downloads
Software can be downloaded from a PC to the CRU02. This can be done using the
“CRU02 Service” software.
Go to ‘Tools’ and press ‘Flash firmware…’. The new firmware can be selected and will be
uploaded to the CRU02.
Page 40

FTN02 manual v1717 40/49
11.11 Appendix on literature references
The following literature gives a good overview of the Non-Steady-Stat e Probe
measurement technique.
Application of Parameter Estimation Techniques to T hermal Conductivity Probe Data
Reduction, Koski, J. A., McVey, D. F., Thermal Conductivity 17, Plenum Press New York,
1986, pages 587-600.
Determination of the Thermal Conductivity of Moist Porous Materials near The Freezing
Point, Van Haneghem, I. A., Van Loon, W. K. P., Boshoven, H. P. A., High TemperaturesHigh Pressures, 1991, Volume 23, pages 157-162.
Error Analysis of the Heat Pulse Probe for Measuring Soil Volumetric Heat Capacity,
Kluitenberg , G. J., Ham, J. M., Bristow, K. L., 1993, Soil Science Society of America
Journal 57:1444-1451.
Standard Test Method for Determination of Ther m a l Conductivity of Soil and Soft Rock by
Thermal Needle Probe Procedure, American Society for Testing and Materials, D5334-14,
2014.
IEEE Guide for Soil Thermal Resistivity Measurements, The Institute of Electrical and
Electronics Engineers Inc, IEEE Std 442-1981(03), 2003.
Page 41

FTN02 manual v1717 41/49
11.12 Glycerol Material Safety Data Sheet (93 / 112 EC)
This safety sheet is a copy of the Material Safety Data Sheet Version according to 93/112
EC of 10-08-2000 of the company Ephuysen Chemie. The user is responsible for
obtaining the latest Version of this sheet from the manufacturer when purchasing
glycerol.
1 identification o f the subs tance / pr epara tion a nd o f the c ompany / under ta king
• Production details -
• Trade Name: Glycerine
• Article Number: 013311
• Manufacturer / Supplier:
Ephuysen Chemie N. V.
Noordeweg 3
3336 LH Zwijndrecht
The Netherlands
Tel: 00-31-78-612702 Fax: 00-78-6121129
e-mail ppelt@ephuysen.com
• Further information available from: environmentally Department
• Information in case of emergency: see above
2 Composition / information on the ingredients
• Chemical characterisation: Cas No Description: 56-81-5 Glycerol
• Identification numbe rs: -
• EINECS Number: 200-289-5
3 Hazards identification
• Information concerning to particular hazards to man and environment: Not
applicable
4 First-aid measures
• General information: No special measures required
• After inhalation: Supply fresh air; consult a doctor inn case of complaints
• After skin contact: Generally the product does not irritate the skin
• After eye contact: Rinse opened eye for several minutes under running water
• After swallowing: If symptoms persist consult a doctor
5 Fire fighting measures
• Suitable extinguishing agents: Use fire extinguis hing methods suitable to
surrounding conditions
• Protective equipment: No special measures required
6 Accidental release measures
• Person-related safety precautions: Not required
• Measures for environmental protection: Dilute with plenty of water
• Measures for cleaning / collecting: Absorb w ith liquid binding material (sand,
diatomite, acid binders, universal binders, sawdust).
• Additional information: No dangerous substances are released
7 Handling and storage
• Handling :-
• Information for safe handling: No special measures required
• Information about fire - and explosion protection: No special measures required
• Storage:
• Requirements to be met by storerooms and receptacles: No special requirements
• Information about storage in one common storage facility: Not required
• Further information about storage conditions: No ne
• Storage class: -
• Class according to regulation an flammable liquids: void
Page 42

FTN02 manual v1717 42/49
8 Exposure controls / personal protection
• Additional information about design of technical facilities: No further data; see item
7
• Ingredients with limit values that require monitoring at the workplace: 56-81-5
glycerol OEL: 10 m g/m
3
• Additional Occup ational Exposure Lim it Values for possible hazards during
processing: Glycerine is (almost) odourless. The MAC-value can exceed the limit
unnoticed.
• Additional information: The lists valid during the making were used as a basis
• Personal protective equipment: -
• General protective and hygienic measures: The usual precautionary measures are to
be adhered to when handling chemicals
• Respiratory protection: not required
• Protection of hands: not required
• Eye protection: Goggles recommended during refilling
9 Physical and chemical properties
• Form: viscous
• Colour: Colourless
• Odour: Odourless
• Change in condition: -
• Melting point / Melting range: 18.2 °C
• Boiling point / Boiling range: 290°C
• Flash point: 177 °C
• Ignition temperature: 400 °C
• Danger of explosion: the product does not present an explosion hazard
• Explosion limits:
• Lower: 0.9 Vol%
• Vapour pressure: at 50 °C 0.003 hPa
• Density: at 20 °C 1.26 g/ cm
3
• Solubility in / Miscibility with water: Fully miscible
• PH value; Not determined
• Viscosity:
• Dynamic: at 20 °C 106.9 mPas
10 Stability and reactivity
• Thermal decomposition / conditions to be avoided: No decomposition if used
according to specifications
• Dangerous reactions: No dangerous reactions known
• Dangerous decomposition products: No dangerous decomposition products known
11 Toxicological information
• Acute toxicity: LD/ Lc50 values relevant for classification: 56-81-5 glycerol Oral
LD50: 250 mg/kg(mus)
• Primary irritant effect:
• On the skin: It is not irritating
• On the eye: No irritating effect
• Sensitisation: No sensitisation effects known.
• Additional toxicological information: W hen used and handled according to
specifications, the product does not have any harmful effects to our experience and
the information provided to us. The substance is not subject to classification
according to the latest Version of the EU lists.
12 Ecological information
• Ecotoxical effects:
• Aquatic toxicity: 56-81-5 glycerol LC50/24 h: > 5000 ppm (fish)
• General notes: generally not hazardous for water
Page 43

FTN02 manual v1717 43/49
13 Disposal considerations
• Product
• Recommendation: Smaller quantities can be disposed with household waste
• Uncleaned packaging
• Recommendation: Disposal must be made according to official regulations
• Recommended cleansing agents: Water, if necessary together with cleansing
agents.
14 Transport information
• Land transport ARD / RID (cross border)
• UN-Number: -
• Hazard label: -
15 Regulatory information
• Labelling according to EU Guidelines: The substance is not subject to classification
according to EU lists and other sources of literature known to us. Observe the
general safety regulations when handling chemicals; the product is not subject to
identification regulations under EU Directives and the Ordinance on Hazardous
Materials (German GefStoffV).
• National regulations
• Classification according to VbF: Void
• Technical instructions ( air): Class Share in %: NK 100.0
• Waterhazard class: Generally not hazardous for water.
16 Other information
This information is based on present knowledge. However, this shal l not constitute a
guarantee for any specific product features and shall not establish a legally valid
contractual relationship.
• Department issuing MSDS: Environmentally Department
• Contact: P. van Pelt
Page 44

FTN02 manual v1717 44/49
11.13 International Chemical Safety Card for Glycerol
The following pages contain info rmation on the International Chemical Safety Card for
glycerol. The user is responsible for obtaining the latest Version of this card from the
glycerol manufacturer when purchasing glycerol.
International Chemical Safety Cards
GLYCEROL
ICSC: 0624
GLYCEROL
Glycerine
1,2,3
-Propanetriol
1,2,3
-Trihydroxypropane
C
3H8O3
/ CH2OH-CHOH-CH2OH
Molecular mass: 92.1
CAS # 56
-81-5
RTECS #
MA8050000
ICSC # 0624
TYPES OF
HAZARD/
EXPOSURE
ACUTE HAZARDS/
SYMPTOMS
PREVENTION
FIRST AID/
FIRE FIGHTING
FIRE
Combustible. Gives off
irritating or toxic
fumes (or gases) in a
fire.
NO open flames.
Powder, alcoholresistant foam, water
spray, carbon dioxide.
EXPLOSION
In case of fire: keep
drums, etc., cool by
spraying with water.
EXPOS
URE
PREVENT
GENERATION OF
MISTS!
INHALATION
Cough.
Ventilation.
Fresh air, rest.
SKIN
Dry skin.
Protective gloves.
Remove contaminated
clothes. Rinse skin with
plenty of water or
shower.
EYES
Redness. Pain.
Safety goggles.
First rinse with plenty
of water for several
minutes (remove
contact lenses if easily
possible), then tak
e to
a doctor.
INGESTION
Nausea. Vomiting.
Do not eat, drink, or
smoke during work.
Rinse mouth. Give
plenty of water to
drink.
Rest. Refer for
medical attention.
Page 45

FTN02 manual v1717 45/49
SPILLAGE DISPOSAL
STORAGE
PACKAGING &
LABELLING
Ventilation. Collect leaking liquid in
covered containers. Absorb rem a ining
liquid in sand or inert absorbent and
remove to safe place.
Separated from strong
oxidants.
Dry.
SEE IMPORTANT INFORMATION ON BACK
ICSC: 0624
Prepared in the context of cooperation between the
International Programme on Chemical Safety & the
Commission of the European Communities © IPCS CEC
1993
International Chemical Safety Cards
GLYCEROL
ICSC: 0624
IMPORTANT
DATA
PHYSICAL STATE; APPEARANCE:
HYGROSCOPIC, VISCOUS
COLOURLESS LIQUID.
PHYSICAL DANGERS:
CHEMICAL DANGERS:
The substance decomposes on heating
producing corrosive fumes of acrolein.
Reacts with strong oxidants causing
fire and explosion hazard.
Reacts
violently with acetic anhydrides in the
presence of a catalyst.
OCCUPATIONAL EXPOSURE LIMITS
(OELs):
TLV: ppm; 10 mg/m
3
mist
(ACGIH 1995
-1996).
ROUTES OF EXPOSURE:
The substance can be absorbed
into the body by inhalation of
its mist.
INHALATION RISK:
Evaporation at 20
°C is
negligible; a nuisanc
e-causing
concentration of airborne
particles can, however, be
reached quickly on spraying.
EFFECTS OF SHORT
-TERM
EXPOSURE:
The substance irritates the
eyes,
the skin and the
respiratory tra
ct.
EFFECTS OF LONG-TERM OR
REPEATED EXPOSURE:
PHYSICAL
PROPERTIES
Decomposes below boiling point at
171
°C
Melting point: 18.2
°C
Relative density (water = 1): 1.26
Solubility in water: miscible
Vapour pressure, Pa at 20
°C: <0.1
Relative vapour density
(air = 1): 3.17
Flash point: 177
°C.
Auto
-ignition temperature:
370
°C
Explosive limits , vol% in air:
0.9
-?
Octanol/water
partition
coefficient as log Pow:
-1.76
ENVIRONMENTAL DATA
N O T E S
Also consult ICSC # 0090, acrolein.
NFPA Code: H1; F1; R0
Page 46

FTN02 manual v1717 46/49
ADDITIONAL INFORMATION
GLYCEROL
ICSC: 0624
© IPCS, CEC, 1993
IMPORTANT
LEGAL
NOTICE:
Neither the CEC or the IPCS nor any person acting on behalf of the CEC
or the IPCS is responsible for the use which might be made of this
information. This card contains the collective views of the IPCS Peer
Review Committee and may not reflect in all case
s all the detailed
requirements included in national legislation on the subject. The user
should verify compliance of the cards wit h the relevant legislation in the
country of use.
Page 47

FTN02 manual v1717 47/49
11.14 EC Declaration of Conformity
We, Hukseflux Thermal Sensors B.V.
Delftechpark 31
2628 XJ Delft
The Netherlands
in accordance with the requirements of the following directive:
2004/108/EC The Electromagnetic Compatibility Directive
hereby declare under our sole responsibility that:
Product model: FTN02
Product type: Thermal needle system
has been designed to comply and is in conformity with the relev a nt sections and
applicable requirements of the following standards:
Emission:
EN 61326-1 (2013), class B
Immunity: EN 61326-1 (2013), industrial
Report:
15C01131RPT01, 19 August 2015
Eric HOEKSEMA
Director
Delft
03 September, 2015
Page 48

Page 49

© 2017, Hukseflux Thermal Sensors B.V.
www.hukseflux.com
Hukseflux Thermal Sensors B.V. reserves the rig ht to change spec ifications without notice.
 Loading...