

HP StorageWorks MSA 2/8, StorageWorks Advanced Performance Monitoring 3.1, StorageWorks Advanced Performance Monitoring 4.1 User Manual
Page 1

user guide
hp StorageWorks
advanced performance
monitoring version 3.1.x/4.1.x
Product Version: 3.1.x/4.1.x
Third Edition (June 2003)
Part Number: AA–RTS4C–TE
This user guide provides an overview of and installation instructions for Advanced Performance
Monitoring. In addition, this guide provides information on configuring and using the
Advanced Performance Monitoring telnet commands.
Page 2

© Copyright 1999-2003 Hewlett-Packard Development Company, L.P.
Hewlett-Packard Company makes no warranty of any kind with regard to this material, including, but not limited to,
the implied warranties of merchantability and fitness for a particular purpose. Hewlett-Packard shall not be liable for
errors contained herein or for incidental or consequential damages in connection with the furnishing, performance,
or use of this material.
This document contains proprietary information, which is protected by copyright. No part of this document may be
photocopied, reproduced, or translated into another language without the prior written consent of Hewlett-Packard.
The information contained in this document is subject to change without notice.
BROCADE, the Brocade B weave logo, Brocade: the Intelligent Platform for Networking Storage, SilkWorm, and
SilkWorm Express, are trademarks or registered trademarks of Brocade Communications Systems, Inc. or its
subsidiaries in the United States and/or in other countries.
Hewlett-Packard Company shall not be liable for technical or editorial errors or omissions contained herein. The
information is provided “as is” without warranty of any kind and is subject to change without notice. The warranties
for Hewlett-Packard Company products are set forth in the express limited warranty statements for such products.
Nothing herein should be construed as constituting an additional warranty.
Printed in the U.S.A.
Advanced Performance Monitoring Version 3.1.x/4.1.x User Guide
Third Edition (June 2003)
Part Number: AA–RTS4C–TE
Page 3

3Advanced Performance Monitoring Version 3.1.x/4.1.x User Guide
contents
Contents
About this Guide. . . . . . . . . . . . . . . . . . . . . . . . . . . . . . . . . . . . . . . . . . . . . . . . . . . .7
Overview. . . . . . . . . . . . . . . . . . . . . . . . . . . . . . . . . . . . . . . . . . . . . . . . . . . . . . . . . . . . . . . . . . 8
Intended Audience . . . . . . . . . . . . . . . . . . . . . . . . . . . . . . . . . . . . . . . . . . . . . . . . . . . . . . . 8
Related Documentation . . . . . . . . . . . . . . . . . . . . . . . . . . . . . . . . . . . . . . . . . . . . . . . . . . . 8
Conventions . . . . . . . . . . . . . . . . . . . . . . . . . . . . . . . . . . . . . . . . . . . . . . . . . . . . . . . . . . . . . . . 9
Document Conventions . . . . . . . . . . . . . . . . . . . . . . . . . . . . . . . . . . . . . . . . . . . . . . . . . . . 9
Text Symbols . . . . . . . . . . . . . . . . . . . . . . . . . . . . . . . . . . . . . . . . . . . . . . . . . . . . . . . . . . . 9
Getting Help . . . . . . . . . . . . . . . . . . . . . . . . . . . . . . . . . . . . . . . . . . . . . . . . . . . . . . . . . . . . . . 11
HP Technical Support . . . . . . . . . . . . . . . . . . . . . . . . . . . . . . . . . . . . . . . . . . . . . . . . . . . 11
HP Storage Website . . . . . . . . . . . . . . . . . . . . . . . . . . . . . . . . . . . . . . . . . . . . . . . . . . . . . 11
HP Authorized Reseller . . . . . . . . . . . . . . . . . . . . . . . . . . . . . . . . . . . . . . . . . . . . . . . . . . 11
1 Introducing Advanced Performance Monitoring . . . . . . . . . . . . . . . . . . . . . . . . . . . .13
Overview. . . . . . . . . . . . . . . . . . . . . . . . . . . . . . . . . . . . . . . . . . . . . . . . . . . . . . . . . . . . . . . . . 14
Terminology Used in this Document . . . . . . . . . . . . . . . . . . . . . . . . . . . . . . . . . . . . . . . . . . . 15
Features. . . . . . . . . . . . . . . . . . . . . . . . . . . . . . . . . . . . . . . . . . . . . . . . . . . . . . . . . . . . . . . . . . 16
2 Activating Advanced Performance Monitoring . . . . . . . . . . . . . . . . . . . . . . . . . . . . .17
Overview. . . . . . . . . . . . . . . . . . . . . . . . . . . . . . . . . . . . . . . . . . . . . . . . . . . . . . . . . . . . . . . . . 18
Verifying Activated Licenses . . . . . . . . . . . . . . . . . . . . . . . . . . . . . . . . . . . . . . . . . . . . . . . . . 19
Activating the License Using Telnet . . . . . . . . . . . . . . . . . . . . . . . . . . . . . . . . . . . . . . . . . . . 21
Activating the License Using Web Tools. . . . . . . . . . . . . . . . . . . . . . . . . . . . . . . . . . . . . . . . 22
3 Using Advanced Performance Monitoring . . . . . . . . . . . . . . . . . . . . . . . . . . . . . . . .23
Overview. . . . . . . . . . . . . . . . . . . . . . . . . . . . . . . . . . . . . . . . . . . . . . . . . . . . . . . . . . . . . . . . . 24
Managing Performance Monitoring Using Web Tools . . . . . . . . . . . . . . . . . . . . . . . . . . . . . 25
Accessing Performance Monitoring using Web Tools . . . . . . . . . . . . . . . . . . . . . . . . . . 25
Using Performance Graphs . . . . . . . . . . . . . . . . . . . . . . . . . . . . . . . . . . . . . . . . . . . . . . . 27
User-defined Graphs . . . . . . . . . . . . . . . . . . . . . . . . . . . . . . . . . . . . . . . . . . . . . . . . . . . . 29
Performance Graph Formats . . . . . . . . . . . . . . . . . . . . . . . . . . . . . . . . . . . . . . . . . . . . . . 30
Configuring a Performance Graph Canvas . . . . . . . . . . . . . . . . . . . . . . . . . . . . . . . . . . . 32
Page 4

Contents
4 Advanced Performance Monitoring Version 3.1.x/4.1.x User Guide
Adding Graphs to a Canvas. . . . . . . . . . . . . . . . . . . . . . . . . . . . . . . . . . . . . . . . . . . . 33
Saving Canvas Configurations . . . . . . . . . . . . . . . . . . . . . . . . . . . . . . . . . . . . . . . . . 34
Printing All Graphs on a Configuration . . . . . . . . . . . . . . . . . . . . . . . . . . . . . . . . . . 34
Managing Performance Monitoring with Telnet Commands. . . . . . . . . . . . . . . . . . . . . . . . . 35
AL_PA Error Performance Monitoring . . . . . . . . . . . . . . . . . . . . . . . . . . . . . . . . . . . . . . 35
End-to-end Monitoring. . . . . . . . . . . . . . . . . . . . . . . . . . . . . . . . . . . . . . . . . . . . . . . . . . . 35
Filter-based Monitoring . . . . . . . . . . . . . . . . . . . . . . . . . . . . . . . . . . . . . . . . . . . . . . . . . . 35
Telnet Commands. . . . . . . . . . . . . . . . . . . . . . . . . . . . . . . . . . . . . . . . . . . . . . . . . . . . . . . . . . 37
Using AL_PA Error Performance Monitoring. . . . . . . . . . . . . . . . . . . . . . . . . . . . . . . . . 37
Displaying the CRC Error Count. . . . . . . . . . . . . . . . . . . . . . . . . . . . . . . . . . . . . . . . 37
Clearing the CRC Error Count . . . . . . . . . . . . . . . . . . . . . . . . . . . . . . . . . . . . . . . . . 38
Using End-to-end Performance Monitoring. . . . . . . . . . . . . . . . . . . . . . . . . . . . . . . . . . . 38
Adding End-to-end Monitors. . . . . . . . . . . . . . . . . . . . . . . . . . . . . . . . . . . . . . . . . . . 39
Setting a Mask for End-to-end Monitors. . . . . . . . . . . . . . . . . . . . . . . . . . . . . . . . . . 41
Displaying the End-to-end Mask of a Port . . . . . . . . . . . . . . . . . . . . . . . . . . . . . . . . 42
Displaying End-to-end Monitors. . . . . . . . . . . . . . . . . . . . . . . . . . . . . . . . . . . . . . . . 43
Deleting End-to-end Monitors. . . . . . . . . . . . . . . . . . . . . . . . . . . . . . . . . . . . . . . . . . 44
Clearing End-to-end Monitor Counters. . . . . . . . . . . . . . . . . . . . . . . . . . . . . . . . . . . 45
Using Filter-based Performance Monitoring . . . . . . . . . . . . . . . . . . . . . . . . . . . . . . . . . . 45
Adding Standard Filter-Based Monitors . . . . . . . . . . . . . . . . . . . . . . . . . . . . . . . . . . 46
Adding User-Defined Filter-Based Monitors . . . . . . . . . . . . . . . . . . . . . . . . . . . . . . 47
Displaying Filter-Based Monitors . . . . . . . . . . . . . . . . . . . . . . . . . . . . . . . . . . . . . . . 48
Deleting Filter-Based Monitors. . . . . . . . . . . . . . . . . . . . . . . . . . . . . . . . . . . . . . . . . 50
Clearing Filter-Based Monitor Counters. . . . . . . . . . . . . . . . . . . . . . . . . . . . . . . . . . 50
Saving and Restoring Monitor Configuration . . . . . . . . . . . . . . . . . . . . . . . . . . . . . . . . . 51
Resource Usage for End-to-end and Filter-based monitoring . . . . . . . . . . . . . . . . . . . . . 52
Glossary. . . . . . . . . . . . . . . . . . . . . . . . . . . . . . . . . . . . . . . . . . . . . . . . . . . . . . . . .53
Index . . . . . . . . . . . . . . . . . . . . . . . . . . . . . . . . . . . . . . . . . . . . . . . . . . . . . . . . . . .85
Figures
1 Switch View in Web Tools . . . . . . . . . . . . . . . . . . . . . . . . . . . . . . . . . . . . . . . . . . . . . . . 26
2 Performance Monitor window . . . . . . . . . . . . . . . . . . . . . . . . . . . . . . . . . . . . . . . . . . . . . 27
3 Accessing pre-defined performance graphs. . . . . . . . . . . . . . . . . . . . . . . . . . . . . . . . . . . 29
4 User-defined graphs . . . . . . . . . . . . . . . . . . . . . . . . . . . . . . . . . . . . . . . . . . . . . . . . . . . . . 30
5 Types of performance graphs. . . . . . . . . . . . . . . . . . . . . . . . . . . . . . . . . . . . . . . . . . . . . . 31
6 Advanced Performance Monitoring resource usage display . . . . . . . . . . . . . . . . . . . . . . 32
Page 5

Contents
5Advanced Performance Monitoring Version 3.1.x/4.1.x User Guide
7 Canvas of eight performance monitoring graphs. . . . . . . . . . . . . . . . . . . . . . . . . . . . . . . 33
8 Saved canvas configurations . . . . . . . . . . . . . . . . . . . . . . . . . . . . . . . . . . . . . . . . . . . . . . 34
9 Setting end-to-end monitors on a port . . . . . . . . . . . . . . . . . . . . . . . . . . . . . . . . . . . . . . . 39
10 Proper placement of end-to-end performance monitors. . . . . . . . . . . . . . . . . . . . . . . . . . 40
11 Mask positions for end-to-end monitors . . . . . . . . . . . . . . . . . . . . . . . . . . . . . . . . . . . . . 42
Tables
1 Document Conventions . . . . . . . . . . . . . . . . . . . . . . . . . . . . . . . . . . . . . . . . . . . . . . . . . . . 9
2 Terminology. . . . . . . . . . . . . . . . . . . . . . . . . . . . . . . . . . . . . . . . . . . . . . . . . . . . . . . . . . . 15
3 Pre-defined Performance Graphs . . . . . . . . . . . . . . . . . . . . . . . . . . . . . . . . . . . . . . . . . . . 28
4 Telnet Commands to Add Filter-based Monitors. . . . . . . . . . . . . . . . . . . . . . . . . . . . . . . 46
Page 6

Contents
6 Advanced Performance Monitoring Version 3.1.x/4.1.x User Guide
Page 7

7Advanced Performance Monitoring Version 3.1.x/4.1.x User Guide
about this
guide
About this Guide
About this Guide
This user guide provides information to help you:
■ Understand and install Advanced Performance Monitoring
■ Configure and use the Advanced Performance Monitoring telnet commands
■ Contact technical support for additional assistance
“About this Guide” topics include:
■ Overview, page 8
■ Conventions, page 9
■ Getting Help, page 11
Page 8

About this Guide
8 Advanced Performance Monitoring Version 3.1.x/4.1.x User Guide
Overview
This section covers the following topics:
■ Intended Audience
■ Related Documentation
Intended Audience
This book is intended for use by system administrators who are experienced with
the following:
■ HP StorageWorks Fibre Channel SAN switches
■ Fabric Operating System (FOS) V3.1.x or later
Related Documentation
For a list of related documents included with this product, see the Related
Documents section of the Release Notes that came with your switch.
For the latest information, documentation, and firmware releases, please visit the
following StorageWorks website:
http://www.hp.com/country/us/eng /
prodserv/storage.html
For information about Fibre Channel standards, visit the Fibre Channel
Association website, located at:
http://www.fibrec h annel.org
.
Page 9
About this Guide
Advanced Performance Monitoring Version 3.1.x/4.1.x User Guide
9
Conventions
Conventions consist of the following:
■ Document Conventions
■ Text Symbols
Document Conventions
The document conventions included in Tabl e 1 apply in most cases.
Text Symbols
The following symbols may be found in the text of this guide. They have the
following meanings.
WARNING: Text set off in this manner indicates that failure to follow
directions in the warning could result in bodily harm or death.
Caution: Text set off in this manner indicates that failure to follow directions
could result in damage to equipment or data.
Table 1: Document Conventions
Element Convention
Cross-reference links Blue text: Figure 1
Key and field names, menu items,
buttons, and dialog box titles
Bold
File names, application names, and text
emphasis
Italics
User input, command and directory
names, and system responses (output
and messages)
Monospace font
COMMAND NAMES are uppercase
monospace font unless they are
case-sensitive
Variables <monospace, italic font>
Website addresses Blue, underlined sans serif font text:
http://www.hp.com
Page 10

About this Guide
10 Advanced Performance Monitoring Version 3.1.x/4.1.x User Guide
Note: Text set off in this manner presents commentary, sidelights, or interesting points
of information.
Page 11

About this Guide
Advanced Performance Monitoring Version 3.1.x/4.1.x User Guide
11
Getting Help
If you still have a question after reading this guide, contact an HP authorized
service provider or access our website:
http://www .hp.com
.
HP Technical Support
Telephone numbers for worldwide technical support are listed on the following
HP website:
http://www .hp.com/support/
. From this website, select the country
of origin.
Note: For continuous quality improvement, calls may be recorded or monitored.
Be sure to have the following information available before calling:
■ Technical support registration number (if applicable)
■ Product serial numbers
■ Product model names and numbers
■ Applicable error messages
■ Operating system type and revision level
■ Detailed, specific questions
HP Storage Website
The HP website has the latest information on this product, as well as the latest
drivers. Access storage at:
http://www .hp.com/country/us/eng/prodserv/
storage .html
. From this website, select the appropriate product or solution.
HP Authorized Reseller
For the name of your nearest HP authorized reseller:
■ In the United States, call 1-800-345-1518
■ In Canada, call 1-800-263-5868
■ Elsewhere, see the HP website for locations and telephone numbers:
http://www .hp .com
.
Page 12

About this Guide
12 Advanced Performance Monitoring Version 3.1.x/4.1.x User Guide
Page 13

13Advanced Performance Monitoring Version 3.1.x/4.1.x User Guide
1
Introducing Advanced
Performance Monitoring
This chapter provides the following information:
■ Overview, page 14
■ Terminology Used in this Document, page 15
■ Features, page 16
Page 14

Introducing Advanced Performance Monitoring
14 Advanced Performance Monitoring Version 3.1.x/4.1.x User Guide
Overview
Advanced Performance Monitoring is a comprehensive tool for monitoring the
performance of networked storage resources. This tool helps reduce thea total cost
of ownership and over-provisioning while enabling SAN performance tuning,
reporting of service level agreements, and greater administrator productivity.
Advanced Performance Monitoring provides SAN performance management
through an end-to-end monitoring system that provides:
■ Increased end-to-end visibility into the fabric
■ More accurate reporting for service level agreements and charged access
applications
■ Improved performance tuning and resource optimization
■ Shortened troubleshooting time
■ Better capacity planning
■ Increased productivity with pre-formatted and customizable screens and
reports
Advanced Performance Monitoring is an optionally licensed product that runs on
HP StorageWorks Core Switch 2/64 (Core Switch 2/64) and StorageWorks 2 Gb
SAN switches (StorageWorks SAN Switch 2/16, 2/16 power pak, 2/8-EL, 2/8
power pak, and 2/32). If you have a fabric that includes StorageWorks 1 Gb SAN
switches, you can take advantage of the end-to-end performance monitoring
features by installing a Core Switch 2/64 or StorageWorks 2 Gb SAN switch
anywhere in the path between the Source ID and the Destination ID.
You can administer performance monitoring through either telnet commands or
Web Tools.
Page 15
Introducing Advanced Performance Monitoring
15Advanced Performance Monitoring Version 3.1.x/4.1.x User Guide
Terminology Used in this Document
Tabl e 2 shows the terminology used in this book.
Table 2: Terminology
Term Definition
AL_PA Arbitrated Loop Physical Address. An 8-bit value used to uniquely
identify an individual port within a loop. A loop may have one or
multiple AL_PAs.
SID 3-byte Source ID of the originator device, in the
“0xDomainAreaALPA” (0xDDAAPP) format.
DID 3-byte Destination ID of the destination device, in the
“0xDomainAreaALPA” (0xDDAAPP) format.
CRC Cyclic redundancy check; an error detection method. The CRC is
32-bits in the frame, after the data field, and before the EOF (end of
frame).
FILTER A pattern of values in the frame header to be matched for the Fibre
Channel frames being transmitted and received by the port.
MASK A field made up of hexadecimal values that are used to include or
exclude portions of a frame header for a possible match.
Page 16

Introducing Advanced Performance Monitoring
16 Advanced Performance Monitoring Version 3.1.x/4.1.x User Guide
Features
The Advanced Performance Monitoring product:
■ Measures the bandwidth consumed by individual routes (host-target pairs)
■ Provides device performance measurements by port, AL_PA, and LUN
■ Reports CRC error measurement statistics
■ Measures Trunking performance
■ Compares IP versus SCSI traffic on each port
■ Includes a wide range of pre-defined reports
■ Allows you to create customized user-defined reports
Page 17

17Advanced Performance Monitoring Version 3.1.x/4.1.x User Guide
2
Activating Advanced
Performance Monitoring
This chapter provides the following information:
■ Overview, page 18
■ Verifying Activated Licenses, page 19
■ Activating the License Using Telnet, page 21
■ Activating the License Using Web Tools, page 22
Page 18

Activating Advanced Performance Monitoring
18 Advanced Performance Monitoring Version 3.1.x/4.1.x User Guide
Overview
To enable Advanced Performance Monitoring, you must install a license on each
switch that will use this feature. Contact your switch supplier to obtain a license.
You can install an Advanced Performance Monitoring license through telnet
commands or through Web Tools.
Page 19

Activating Advanced Performance Monitoring
19Advanced Performance Monitoring Version 3.1.x/4.1.x User Guide
Verifying Activated Licenses
You can display the current licenses using the licenseshow command. To
verify activated licenses:
1. Open a telnet or serial connection to the switch.
2. Log into the switch as Admin. The default password is “password”.
3. Enter the licenseshow command.
A list of the activated licenses displays.
Page 20

Activating Advanced Performance Monitoring
20 Advanced Performance Monitoring Version 3.1.x/4.1.x User Guide
4. If the Advanced Performance Monitoring license has not yet been activated,
use one of the following procedures to activate the license:
■ Activating the License Using Telnet on page 21
■ Activating the License Using Web Tools on page 22
switch:admin> licenseshow
SdcReRcbSbjedSfa:
Web license
SdcReRcbSbjedSfb:
Zoning license
SdcReRcbSbjedSfc:
QuickLoop license
SdcReRcbSbjedSfe:
Fabric license
SdcReRcbSbjedSff:
Remote Switch license
SdcReRcbSbjedSfg:
Remote Fabric license
SdcReRcbSbjedSfh:
Extended Fabric license
SdcReRcbSbjedSfj:
Entry Fabric license
SdcReRcbSbVedSfM:
Fabric Watch license
SdcReRcbSbXedSfO:
Performance Monitor license
SdcReRcbSbbedSfS:
Trunking license
SdcReRcbSbjedSfy:
Security license
switch:admin>
Page 21

Activating Advanced Performance Monitoring
21Advanced Performance Monitoring Version 3.1.x/4.1.x User Guide
Activating the License Using Telnet
Activate licenses using the licenseadd command. To activate an Advanced
Performance Monitoring license using the CLI:
1. Open a telnet or serial connection to the switch.
2. Log into the switch as Admin. The default password is “password”.
3. Contact the switch supplier for an Advanced Performance Monitoring license
key.
4. Enter the following:
licenseadd “key”
where”key” is the license key exactly as provided by the switch supplier. The
license key is case-sensitive.
switch:admin> licenseadd "aAaaaaAaAaAaAaA"
adding license key "aAaaaaAaAaAaAaA"
done.
switch:admin>
5. Verify the license was added by entering the licenseshow command, as
described in Verifying Activated Licenses on page 19.
Page 22

Activating Advanced Performance Monitoring
22 Advanced Performance Monitoring Version 3.1.x/4.1.x User Guide
Activating the License Using Web Tools
To activate an Advanced Performance Monitoring license using Web Tools:
1. Launch a web browser by entering the switch name or IP address in the
Location/Address field of the browser and click Enter.
Web Tools launches, displaying the Fabric View.
2. Click the Admin button on the relevant switch panel.
The logon window displays.
3. Enter a login name and password with administrative privileges. The
administrator account user name and default password is “admin” and
“password”.
4. Click Enter.
The Administration View displays.
5. Select the License tab.
6. Enter the license key in the License Key field exactly as provided by your
switch supplier, and click Add.
The Advanced Performance Monitoring features are available as soon as the
license is added.
For more information about Web Tools, refer to the HP StorageWorks Web
Tools Version 3.1.x/4.1.x User Guide.
Page 23

23Advanced Performance Monitoring Version 3.1.x/4.1.x User Guide
3
Using Advanced Performance
Monitoring
This chapter provides the following information:
■ Overview, page 24
■ Managing Performance Monitoring Using Web Tools, page 25
— Using Performance Graphs, page 27
— User-defined Graphs, page 29
— Performance Graph Formats, page 30
— Configuring a Performance Graph Canvas, page 32
■ Telnet Commands, page 37
— Using AL_PA Error Performance Monitoring, page 37
— Using End-to-end Performance Monitoring, page 38
— Using Filter-based Performance Monitoring, page 45
— Saving and Restoring Monitor Configuration, page 51
— Resource Usage for End-to-end and Filter-based monitoring, page 52
Page 24

Using Advanced Performance Monitoring
24 Advanced Performance Monitoring Version 3.1.x/4.1.x User Guide
Overview
You can administer Advanced Performance Monitoring through telnet commands
or through Web Tools. This chapter provides a brief description of performance
monitoring through Web Tools. It also describes how to fully administer
Advanced Performance Monitoring through telnet commands.
For additional information about performance monitoring through Web Tools,
refer to the HP StorageWorks Web Tools Version 3.1.x/4.1.x User Guide.
Page 25

Using Advanced Performance Monitoring
25Advanced Performance Monitoring Version 3.1.x/4.1.x User Guide
Managing Performance Monitoring Using Web Tools
Use Web Tools to do the following:
■ View pre-defined reports for AL_PA, end-to-end, and filter-based
performance monitoring
■ Create user-definable reports
■ View performance canvas for application level or fabric level views
■ Access configuration editor (save, copy, edit, and remove multiple
configurations)
■ Save persistent graphs across reboots (saves parameter data across reboots)
Accessing Performance Monitoring using Web Tools
Switch performance can be monitored from the Switch View of Web Tools. To
access Performance Monitor through Web Tools, perform the following steps:
1. Launch Web Tools to display the Fabric view.
2. Click on the Switch icon of the switch you want to monitor. This will launch
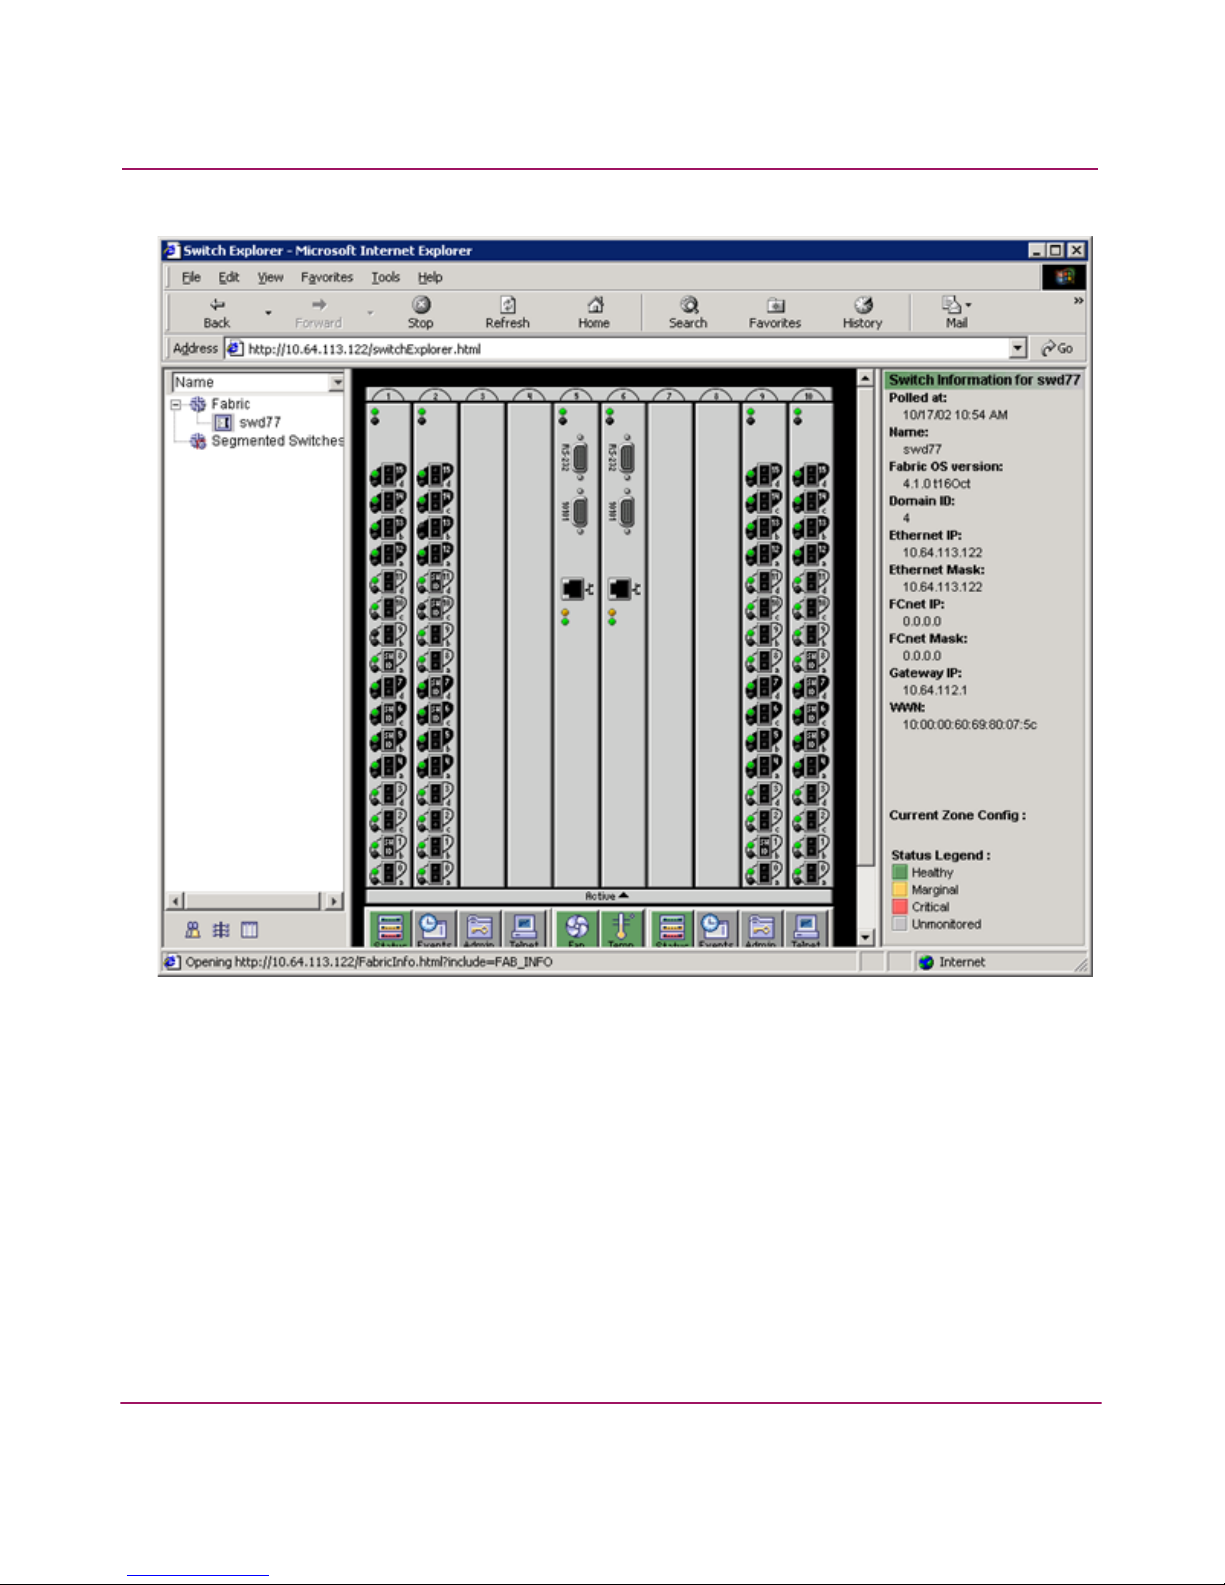
the Switch View. See Figure 1.
Note: The Switch View will vary depending upon the type of switch being monitored.
Page 26
Using Advanced Performance Monitoring
26 Advanced Performance Monitoring Version 3.1.x/4.1.x User Guide
Figure 1: Switch View in Web Tools
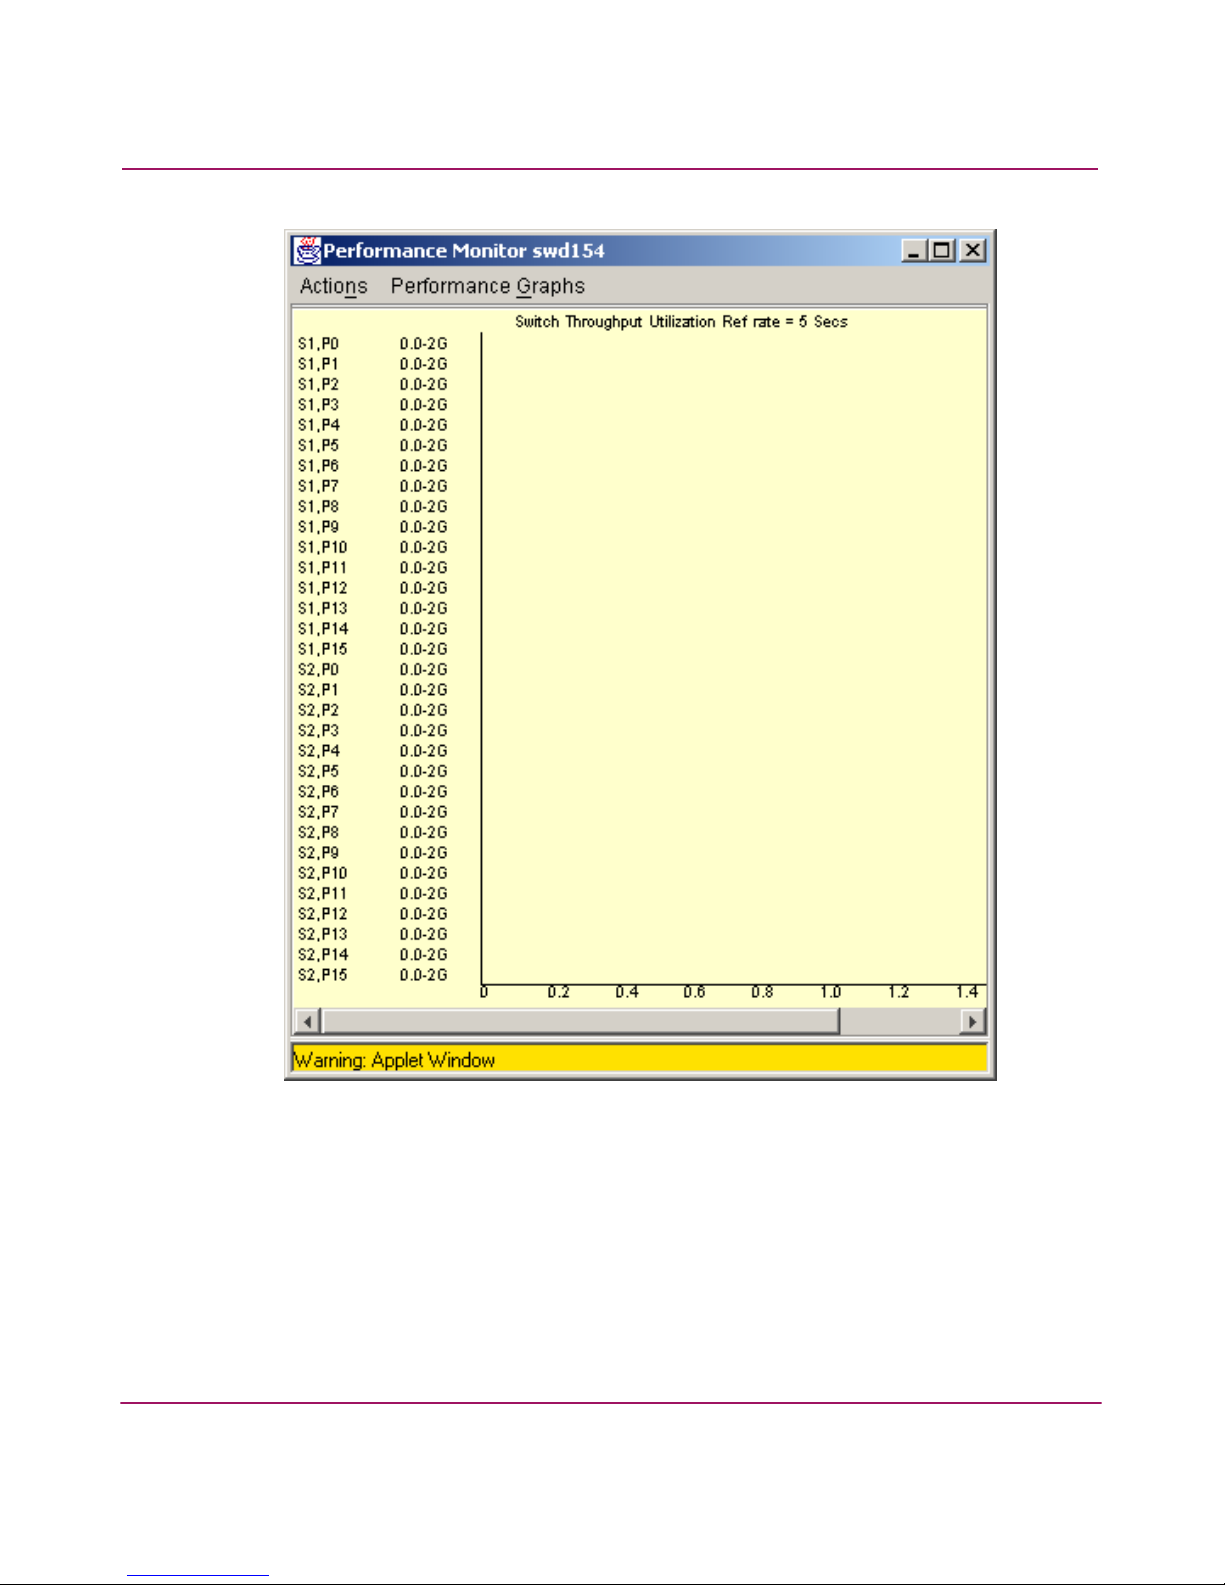
3. Click on the Perf icon in the Switch View to launch the Performance Monitor
window.
Figure 2 shows the Performance Monitor window.
Page 27
Using Advanced Performance Monitoring
27Advanced Performance Monitoring Version 3.1.x/4.1.x User Guide
Figure 2: Performance Monitor window
Using Performance Graphs
Graphs are provided to simplify performance monitoring. A wide range of
end-to-end fabric, LUN, device, and port metrics graphs are included. Figure 3
lists the performance graphs available. Basic Monitoring graphs are accessible on
Page 28
Using Advanced Performance Monitoring
28 Advanced Performance Monitoring Version 3.1.x/4.1.x User Guide
switches that do not have a Performance Monitoring license activated. The
Advanced Monitoring graphs give more detailed performance information to aid
with fabric management.
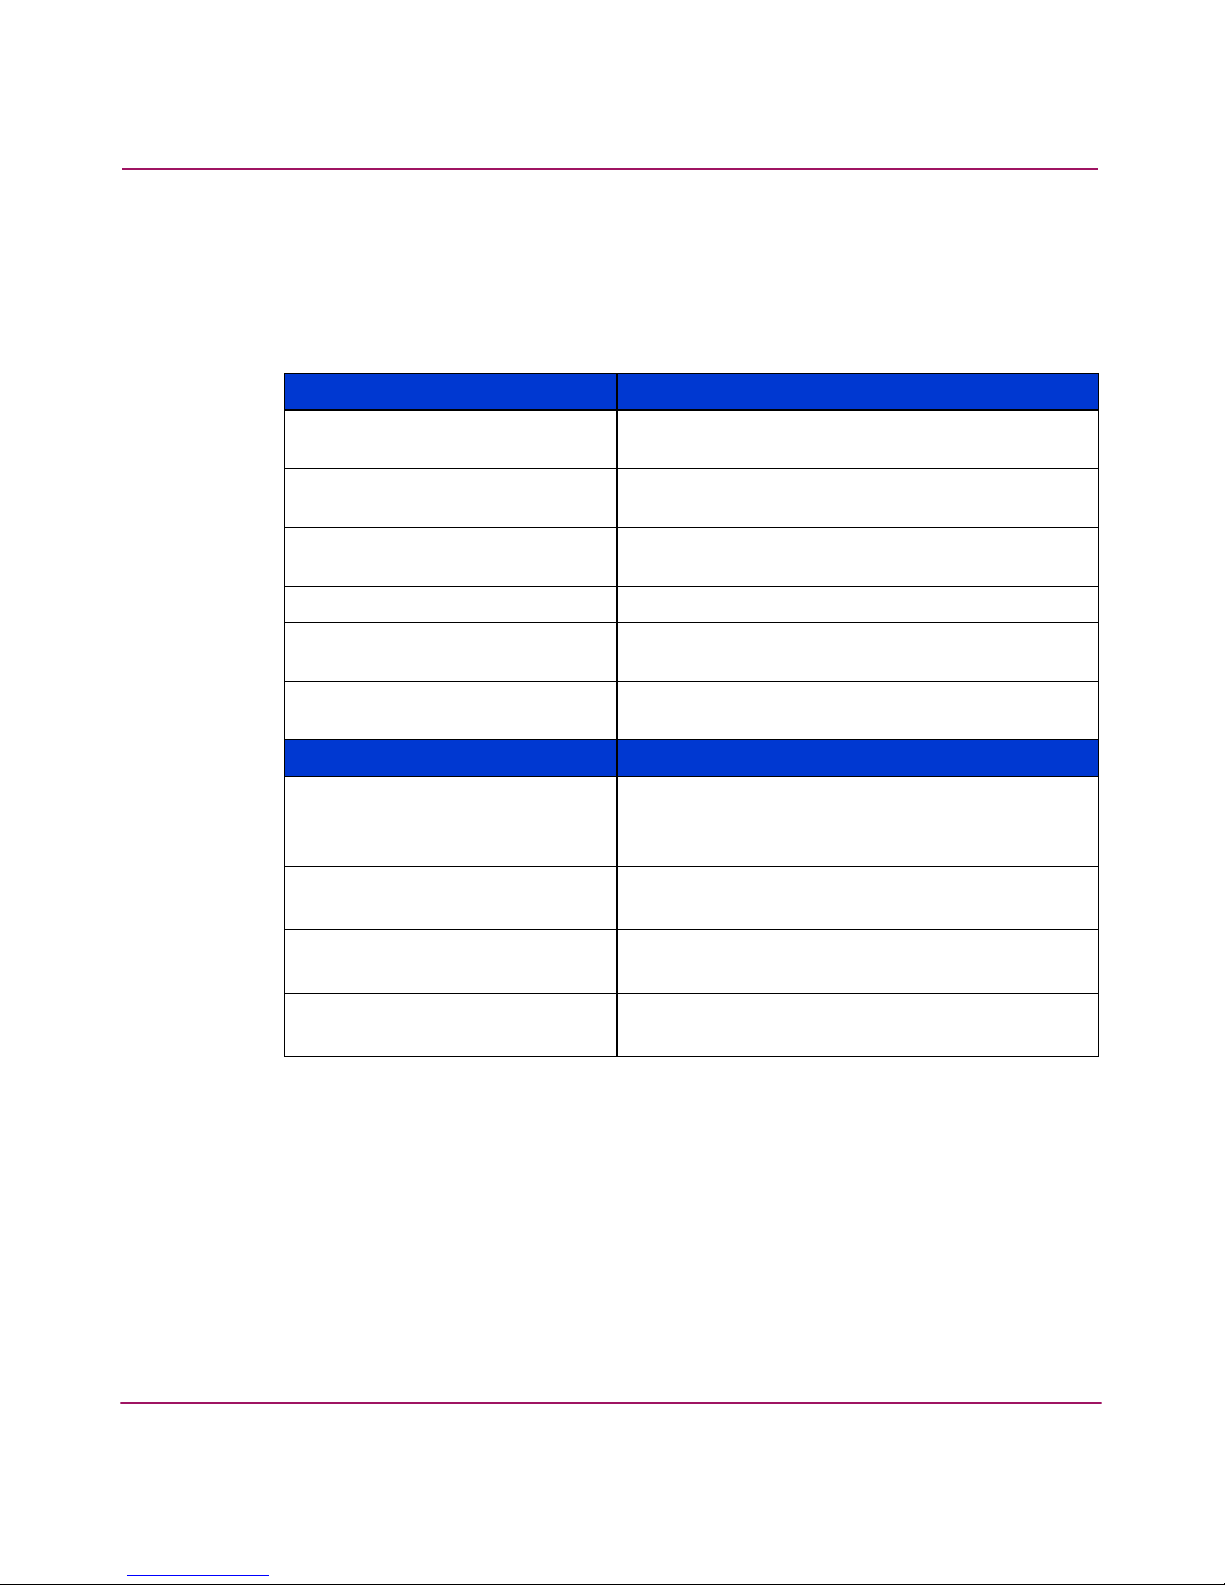
Table 3: Pre-defined Performance Graphs
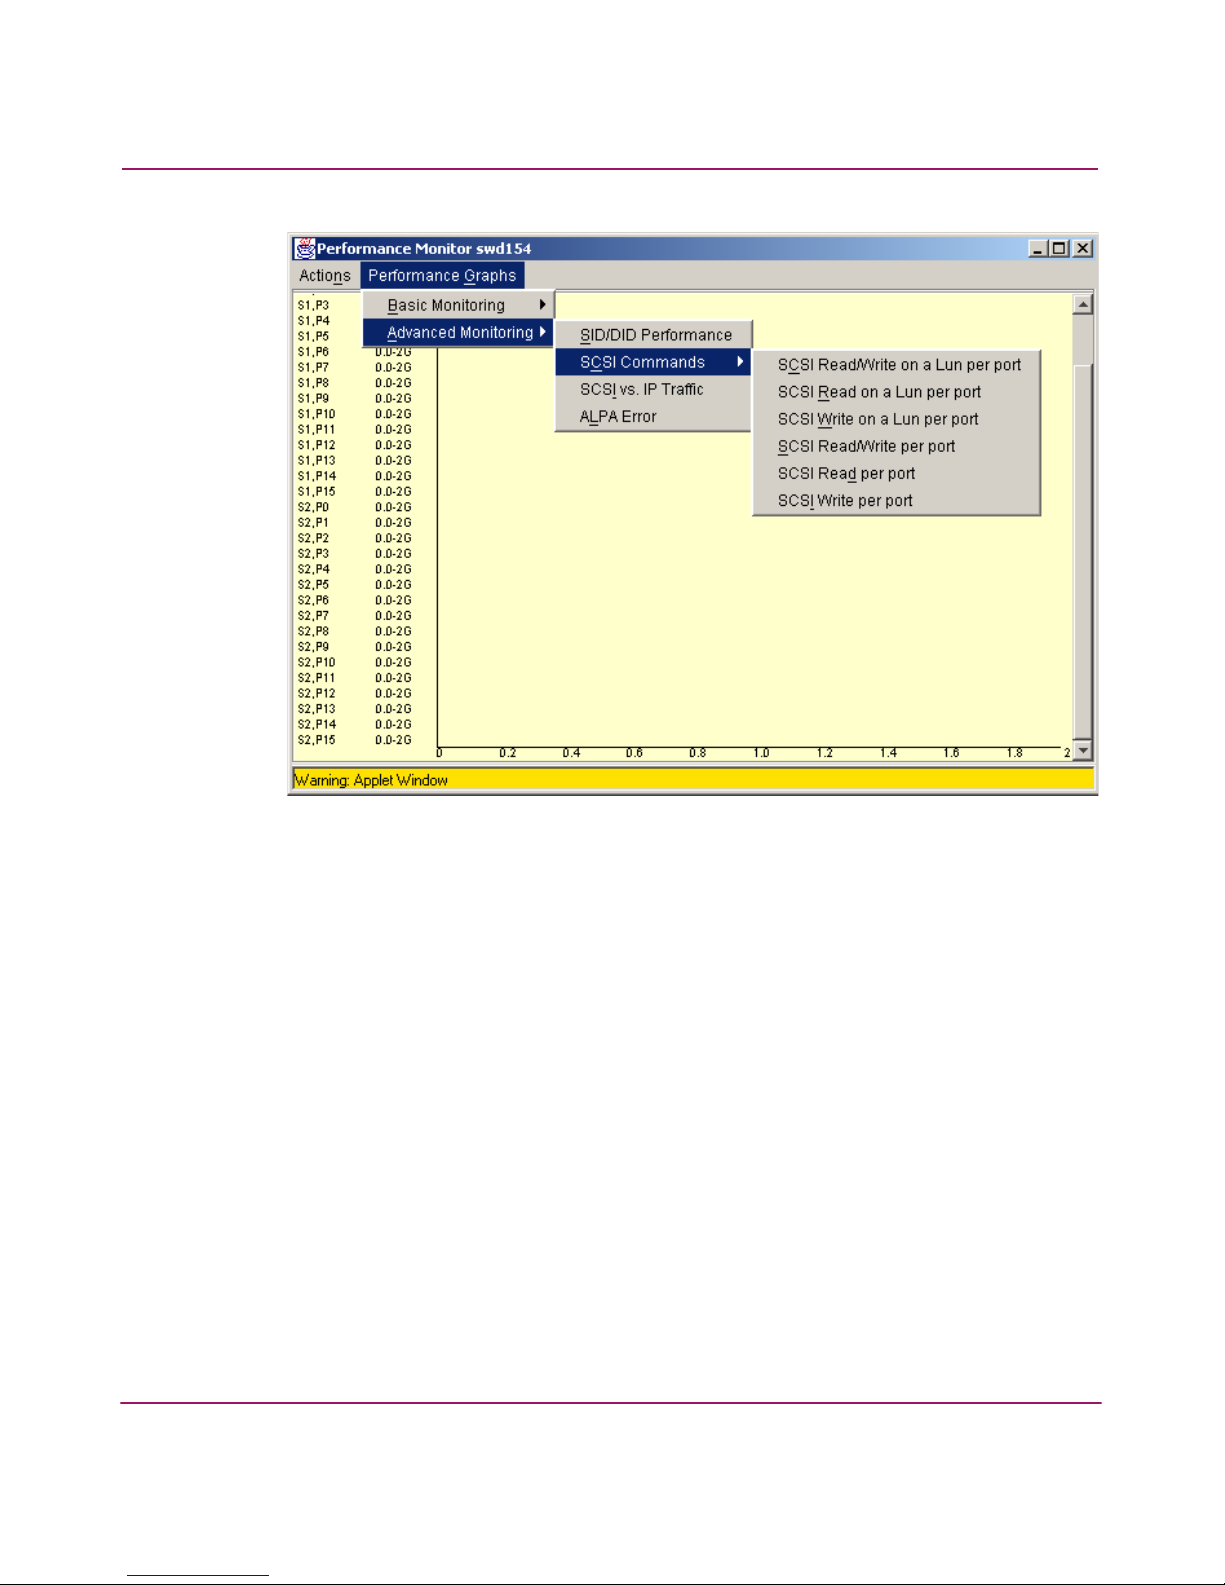
Figure 3 shows how to access the list of pre-defined Advanced Performance
Monitoring graphs in Web Tools.
Basic Monitoring Description
Port Throughput Displays the performance of a port based in
four-byte frames received and transmitted.
Switch Aggregate Throughput Displays the aggregate performance of all ports
of a switch.
Switch Throughput Utilization Displays the port throughput at the time the
sample is taken.
Port Error Displays a line of CRC errors for a given port.
Switch Percent Utilization Displays the percentage of usage of a chosen
switch at the time the sample is taken.
Port Snapshot Error Displays the CRC error count between sampling
periods for all the ports on a switch.
Advanced Monitoring
1
1. These graphs are available only when a Advanced Performance Monitoring license is
installed.
Description
SID/DID Performance Displays the traffic between a SID (or WWN)
and a DID (or WWN) pair on the switch being
managed.
SCSI vs. IP Traffic Displays percentage of SCSI versus IP frame
traffic on each individual port.
AL_PA Errors Displays CRC errors for a given port and a given
AL_PA.
SCSI Commands by port and
LUN (R, W, R/W)
Displays the total number of Read/Write
commands on a given port to a specific LUN.
Page 29
Using Advanced Performance Monitoring
29Advanced Performance Monitoring Version 3.1.x/4.1.x User Guide
Figure 3: Accessing pre-defined performance graphs
User-defined Graphs
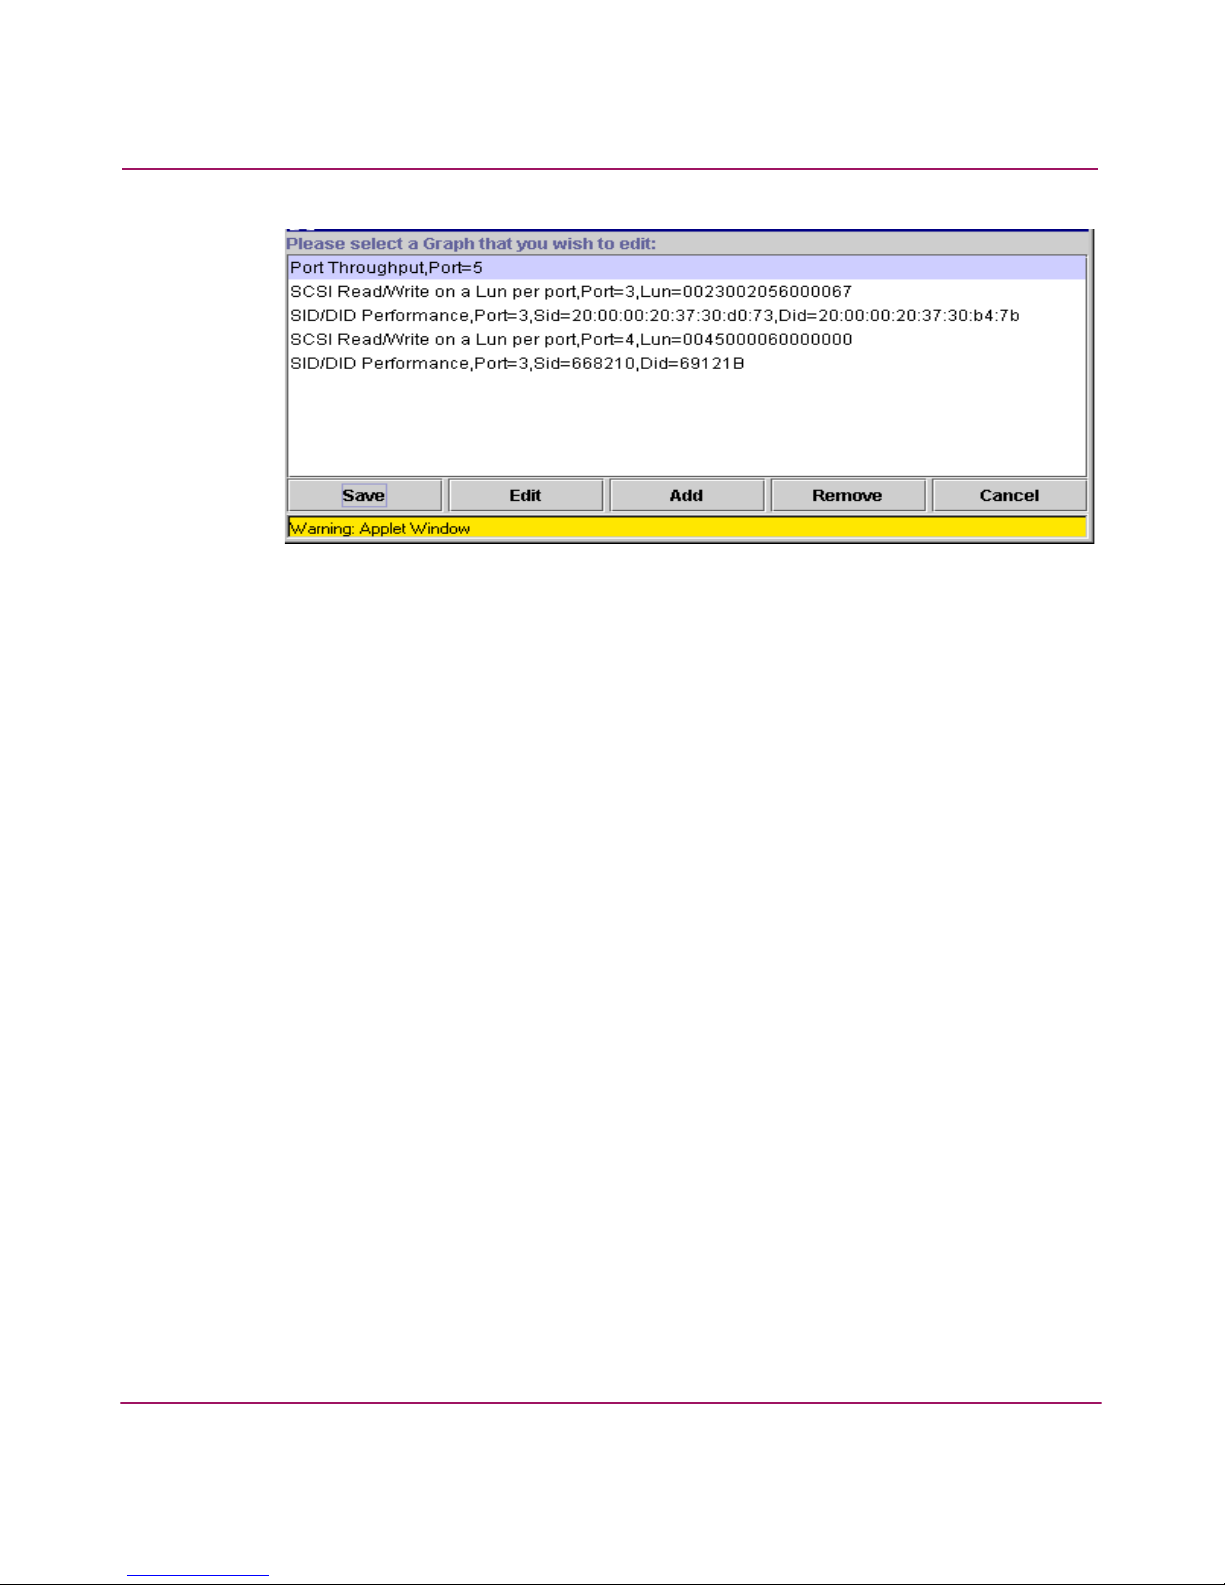
The pre-defined graphs can be modified based on parameter fields such as
SID/DID, LUN, AL_PA, and port. These user-defined graphs can be added and
saved to canvas configurations. Figure 4 shows a list of user-defined graphs
defined in a canvas.
Page 30
Using Advanced Performance Monitoring
30 Advanced Performance Monitoring Version 3.1.x/4.1.x User Guide
Figure 4: User-defined graphs
Performance Graph Formats
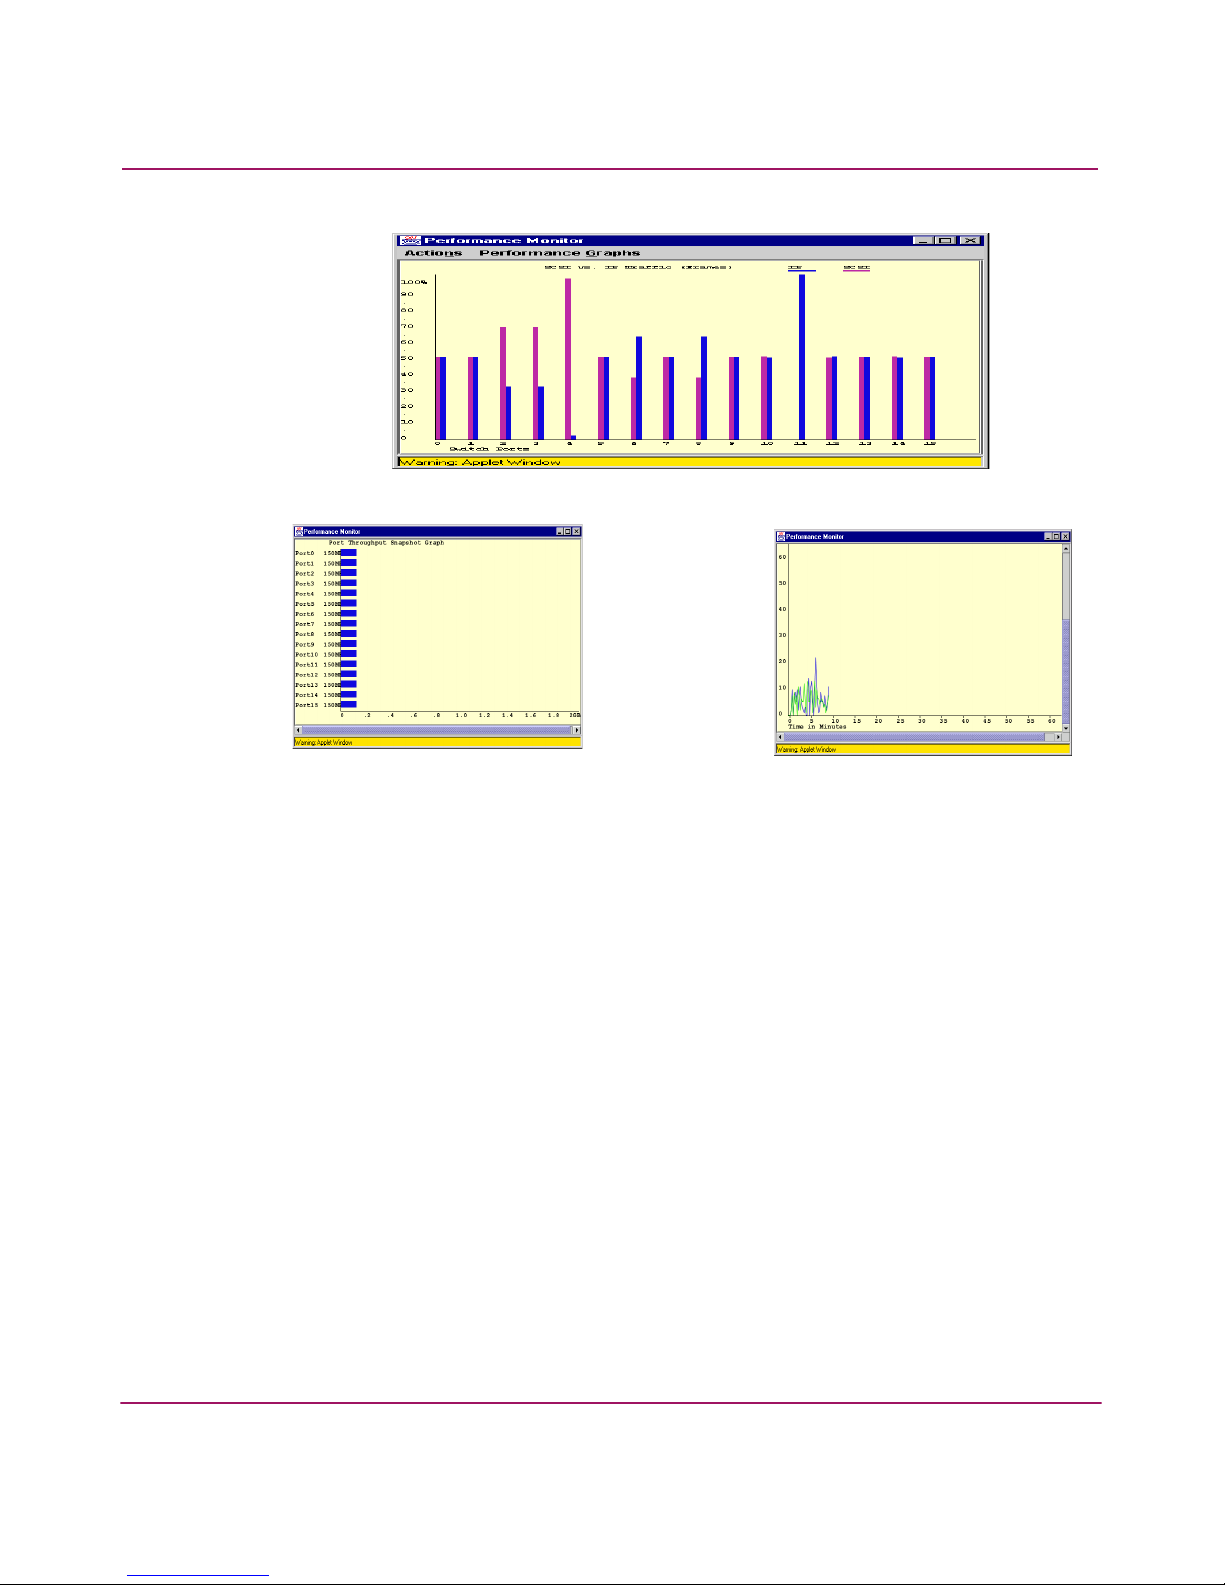
Performance graphs can be displayed as vertical bar charts, horizontal bar charts,
and line charts, as shown in Figure 5.
Page 31
Using Advanced Performance Monitoring
31Advanced Performance Monitoring Version 3.1.x/4.1.x User Guide
Figure 5: Types of performance graphs
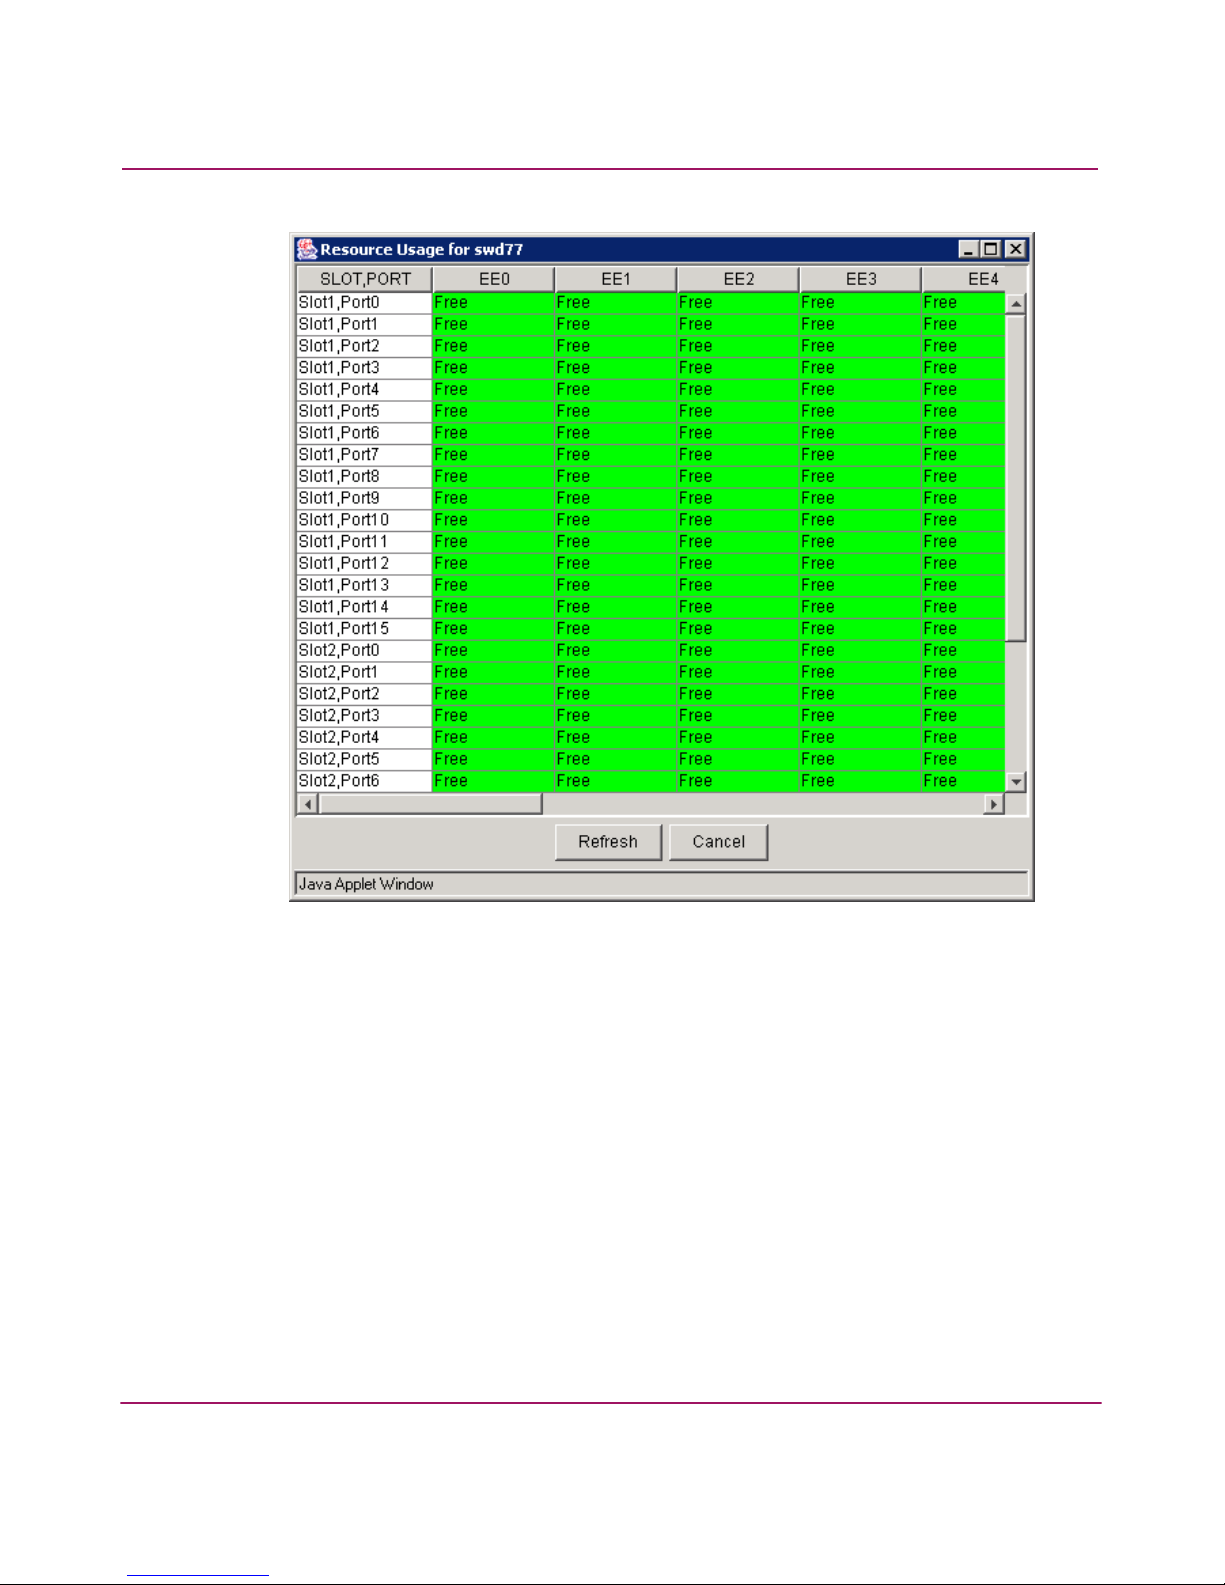
In addition to the charts, the Advanced Performance Monitoring Resource Usage
Display (shown in Figure 6) shows which filter slots have been used for each port,
and which are available. The color-coded interface makes troubleshooting easier.
Line Charts
Horizontal Bar Charts
Vertical Bar Charts
Page 32
Using Advanced Performance Monitoring
32 Advanced Performance Monitoring Version 3.1.x/4.1.x User Guide
Figure 6: Advanced Performance Monitoring resource usage display
Configuring a Performance Graph Canvas
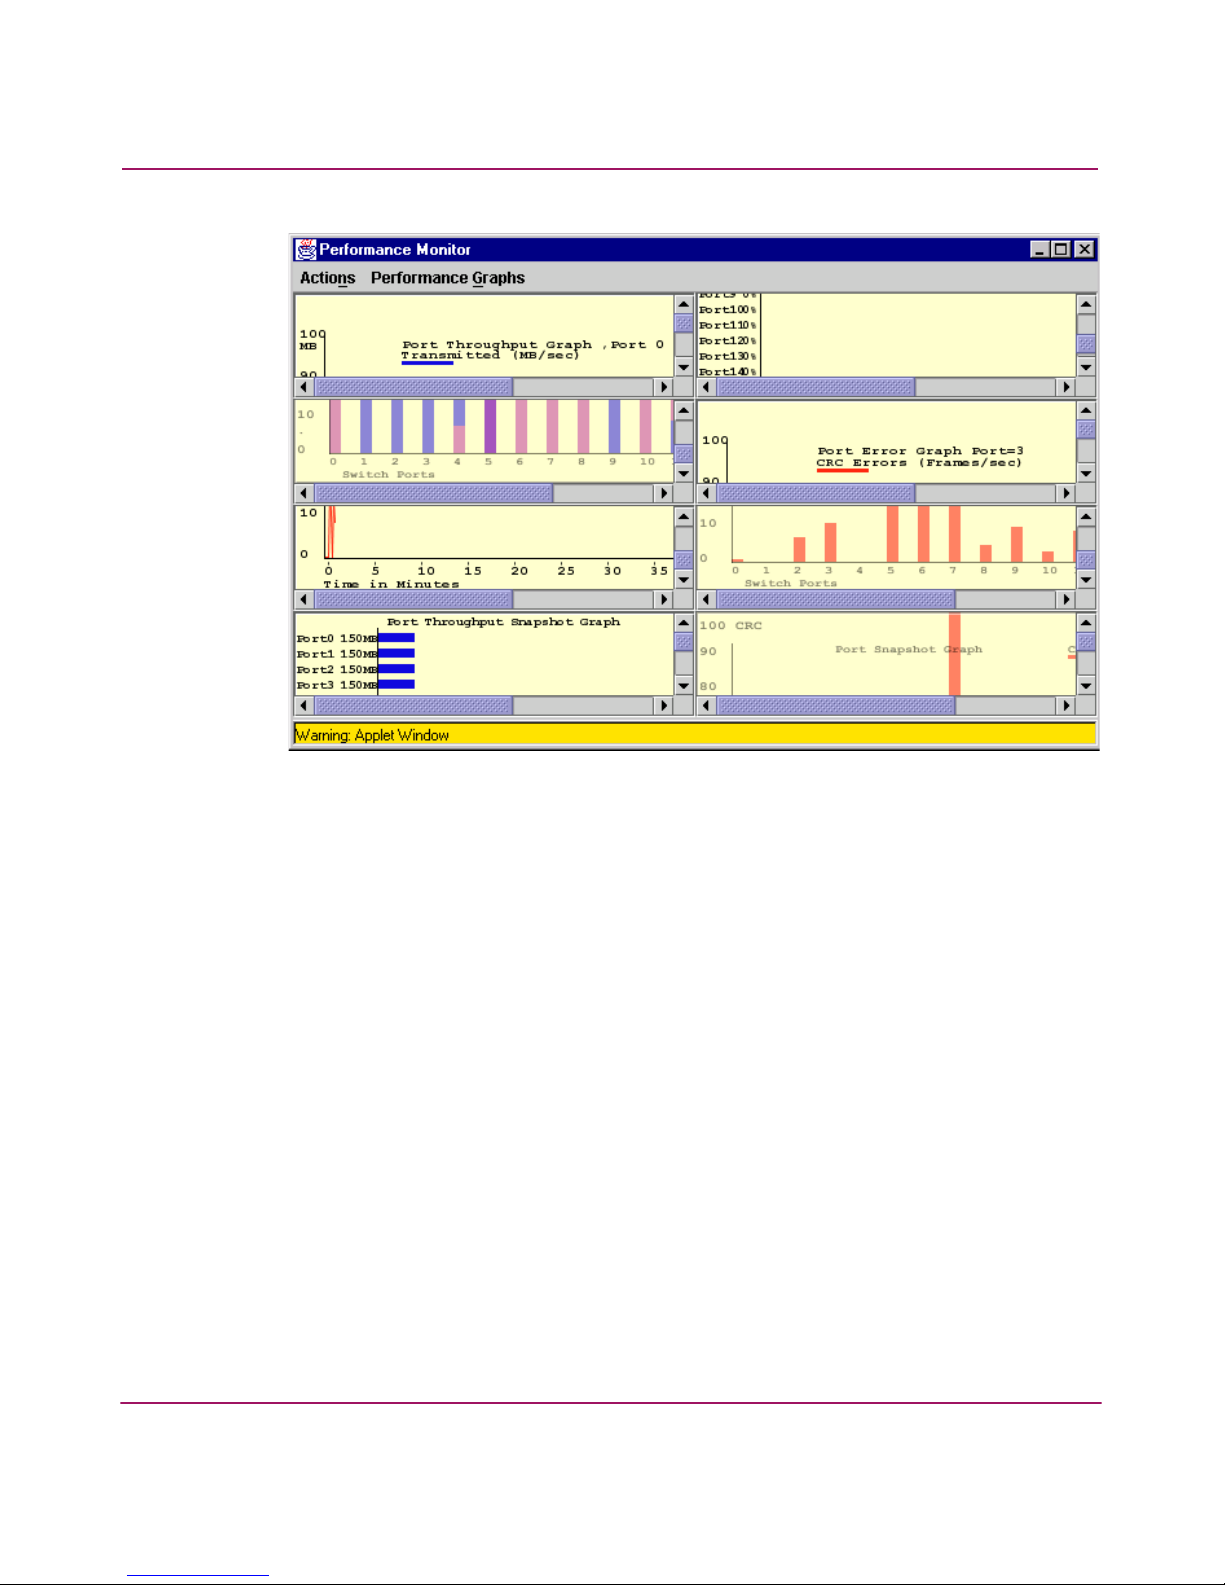
Use the enhanced performance monitoring in Web Tools to set up a canvas of
performance graphs. Multiple canvasses can be created for different users or
different scenarios. The canvas can hold up to eight graphs per window, as shown
in Figure 7.
Page 33
Using Advanced Performance Monitoring
33Advanced Performance Monitoring Version 3.1.x/4.1.x User Guide
Figure 7: Canvas of eight performance monitoring graphs
Adding Graphs to a Canvas
You can add graphs to a canvas by using the Performance Graphs menu on the
Performance Monitor window. Select the graph you wish to add to the canvas
from either the Basic or Advanced Monitoring submenus. For a description of
each of the graphs available, refer to Table 3.
You can then use the Actions menu on the Performance Monitor window to:
■ Save current canvas configuration
■ Display canvas configuration
■ Display current canvas configuration
■ Print all graphs
For a detailed description of the options available in the Actions menu, refer to the
HP StorageWorks Web Tools Version 3.1.x/4.1.x User Guide.
Page 34
Using Advanced Performance Monitoring
34 Advanced Performance Monitoring Version 3.1.x/4.1.x User Guide
Saving Canvas Configurations
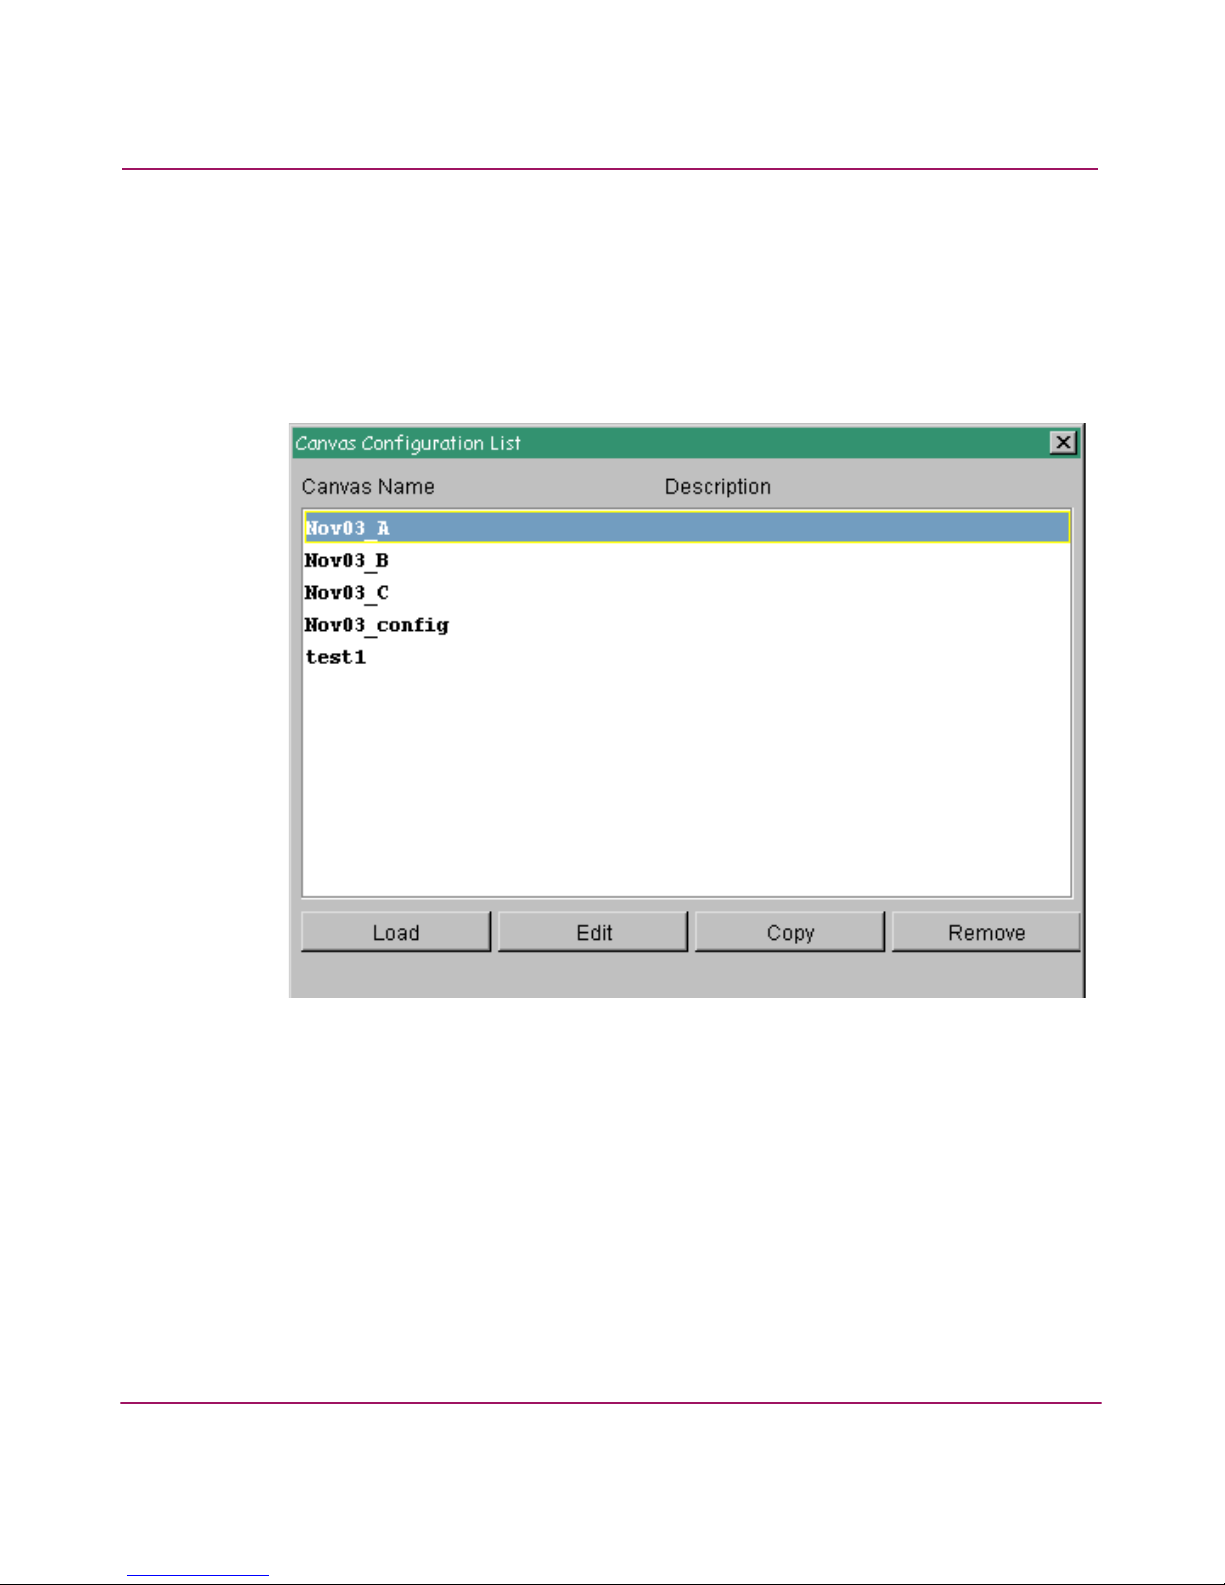
You can save up to 20 individual canvasses, each with up to 8 graphs each. Save
each canvas with a name and an optional brief description. To save a current
canvas configuration, select the Actions menu on the Performance Monitor
window. Select the Save Current Canvas Configuration option. Figure 8 shows
an example of saved canvasses.
Figure 8: Saved canvas configurations
Printing All Graphs on a Configuration
You can print all the graphs on a selected canvas. Select the Print All Graphs
option from the Actions menu on the Performance Monitor window. Select print
options such as printer choice, print to file, and number of pages to print.
Page 35

Using Advanced Performance Monitoring
35Advanced Performance Monitoring Version 3.1.x/4.1.x User Guide
Managing Performance Monitoring with Telnet Commands
Telnet commands provide three different types of performance monitoring:
■ AL_PA monitoring
■ End-to-end monitoring
■ Filter-based monitoring
Note: For backward compatibility, set the environment variable FABOS_SLOTNO to a
slot number. If this environment variable is set and the slot option is not specified, the
value of this environment variable is used as the default slot number for the command.
AL_PA Error Performance Monitoring
AL_PA error performance monitoring provides information regarding the number
of CRC errors in Fibre Channel frames in a loop configuration. AL_PA error
performance monitoring collects CRC error counts for each AL_PA attached to a
specific port.
End-to-end Monitoring
End-to-end monitoring provides information regarding performance between the
source (SID) and destination (DID) on a fabric or a loop. Up to eight SID-DID
pairs can be specified per port. For each of the SID-DID pairs, the following
information is available:
■ CRC error count on the frames for the SID-DID pair
■ Fibre Channel words that have been transmitted through the port for the
SID-DID pair
■ Fibre Channel words that have been received by the port for the SID-DID pair
Filter-based Monitoring
Filter-based monitoring provides information about a filter’s hit count. All
user-defined filters are matched for all Fibre Channel (FC) frames being
transmitted from a port.
A filter consists of a set of elements in the following format:
Page 36

Using Advanced Performance Monitoring
36 Advanced Performance Monitoring Version 3.1.x/4.1.x User Guide
In the previous example, offset (A) is the byte offset value in the header of the FC
frame and value 0[, value 1, ..., value 3] (B) is a user-defined value, or a set of
user-defined values. At least one value must be specified (value 0), but you can
specify up to four values.
For a filter to be matched, all the elements specified in the filter must provide a
match.
For an element to produce a match, the value at offset (A) in the frame being
transmitted must match at least one of the user-defined values (B).
The range of offsets that can be matched using filters is 0 to 63. Examples of FC
Frame statistics that can be measured using filters are:
■ SCSI Read, Write, or Read/Write commands
■ IP versus SCSI traffic comparison
{offset, value 0[, value 1, ..., value 3]}
B
A
Page 37

Using Advanced Performance Monitoring
37Advanced Performance Monitoring Version 3.1.x/4.1.x User Guide
Telnet Commands
The telnet commands for Advanced Performance Monitoring become available
through the shell “admin” account when the Advanced Performance Monitoring
license key is installed. To use a telnet command, log into the relevant switch with
administrative privileges, enter the command along with any required arguments,
and press Enter.
Using telnet commands, you can track the following:
■ Number of CRC errors for AL_PA devices
■ Number of words received and transmitted in Fibre Channel frames with a
defined SID/DID pair
■ Number of frames with CRC errors with a defined SID/DID pair
■ Number of times a particular filter pattern in a frame is received by a port
For a description of all the telnet commands provided for performance
monitoring, refer to the HP StorageWorks Fabric OS Version 3.1.x/4.1.x
Reference Guide.
Using AL_PA Error Performance Monitoring
AL_PA error performance monitoring tracks and displays the number of CRC
errors that have occurred on frames sent to each AL_PA on a specific port.
AL_PA-based error performance monitoring does not require an explicit
configuration. The switch hardware and firmware automatically monitor CRC
errors for all valid AL_PAs.
Displaying the CRC Error Count
Use the perfShowAlpaCrc command to display the CRC error count for all
AL_PA devices for a single AL_PA on a specific port. The port must be an active
L_Port.
Example 1. This command displays the CRC error count for all AL_PA devices
on port 3:
sw1:admin> perfShowAlpaCrc 3
AL_PA CRC count
-------------------0x01 2
0x02 0
0x04 1
Page 38

Using Advanced Performance Monitoring
38 Advanced Performance Monitoring Version 3.1.x/4.1.x User Guide
Example 2. The following command displays the CRC error count for AL_PA
0x01 on port 3:
Clearing the CRC Error Count
Use the perfClrAlpaCrc command to clear the CRC error count for AL_PA
devices on a specific port. You can clear the error counts for all the AL_PA
devices on a port or for a specific AL_PA.
Example 1. The following command clears the CRC error count for all AL_PA
devices on port 3:
Example 2. The following command clears the CRC error count for AL_PA 1 on
port 3:
Using End-to-end Performance Monitoring
End-to-end performance monitoring counts the number of words and CRC errors
in Fibre Channel frames for a specified Source ID (SID) and Destination ID (DID)
pair. An end-to-end performance monitor counts the number of:
■ Words in frames received at the port (RX_COUNT)
■ Words in frames transmitted from the port (TX_COUNT)
■ CRC errors in frames received at the port (CRC_COUNT)
To enable end-to-end performance monitoring, you must configure an end-to-end
monitor on a port, specifying the SID-DID pair. The monitor counts only those
frames with matching SID and DID.
Each SID or DID has three fields, listed in the following order:
■ Domain ID (DD)
sw1:admin> perfShowAlpaCrc 3, 0x01
The CRC count at ALPA 0x1 on port 3 is 0x000000002.
sw1:admin> perfClrAlpaCrc 3
No ALPA value is specified. This will clear all ALPA CRC
counts on port 3. Do you want to continue? (yes, y, no, n):
[no]
Please wait ...
All alpa CRC counts are cleared on port 3.
admin> perfClrAlpaCrc 3, 0x01
CRC error count at ALPA 0x1 on port 3 is cleared.
Page 39

Using Advanced Performance Monitoring
39Advanced Performance Monitoring Version 3.1.x/4.1.x User Guide
■ Area ID (AA)
■ AL_PA (PP)
For example, the SID 0x118a0f has Domain ID 0x11, Area ID 0x8a, and AL_PA
0x0f. (The prefix “0x” denotes a hexadecimal number.)
Adding End-to-end Monitors
Use the perfAddEEMonitor command to add an end-to-end monitor to a
port. The monitor counts the number of words received, number of words
transmitted, and number of CRC errors detected in frames qualified using either of
the following two conditions:
■ for frames received at the port (with End-to-End monitor installed), the frame
SID is the same as “SourceID” and frame DID is the same as “DestID”. Both
RX_COUNT and CRC_COUNT will be updated accordingly.
■ for frames transmitted from the port (with End-to-End monitor installed), the
frame DID is the same as “SourceID” and frame SID is the same as “DestID”.
TX_COUNT will be updated accordingly.
Depending on the application, any port along the routing path can be selected for
such monitoring.
Example. Figure 9 shows two devices: Host A, which is connected to domain 5,
switch area port 18 (AL_PA 0x00) on Switch X, and Dev B, which is connected to
domain 17, switch area port 30 (AL_PA 0xef) on Switch Y.
Figure 9: Setting end-to-end monitors on a port
To monitor the traffic from Host A to Dev B, add a monitor to slot 1, port 2,
specifying 0x051200 as the SID and 0x111eef as the DID. To monitor the traffic
from Dev B to Host A, add a monitor to slot 2, port 15, specifying 0x111eef as the
SID and 0x051200 as the DID. Use the following commands:
. . .
0x051200
0x111eef
Host
A
DID
SID
. . .
Dev
B
Switch x Switch y
Monitor 0
domain 5, switch area port 18
AL_PA 0x00
Monitor 1
domain 17, switch area port 30
AL_PA 0xef
Page 40
Using Advanced Performance Monitoring
40 Advanced Performance Monitoring Version 3.1.x/4.1.x User Guide
Monitor 0 counts the frames that have an SID of 0x051200 and a DID of
0x111eef. For monitor 0, RX_COUNT is the number of words from Host A to
Dev B, CRC_COUNT is the number of frames in both directions with CRC
errors, and TX_COUNT is the number of words from Dev B to Host A.
Monitor 1 counts the frames that have an SID of 0x111eef and a DID of
0x051200. For monitor 1, RX_COUNT is the number of words from Dev B to
Host A, CRC_COUNT is the number of frames in both directions with CRC
errors, and TX_COUNT is the number of words from Host A to Dev B.
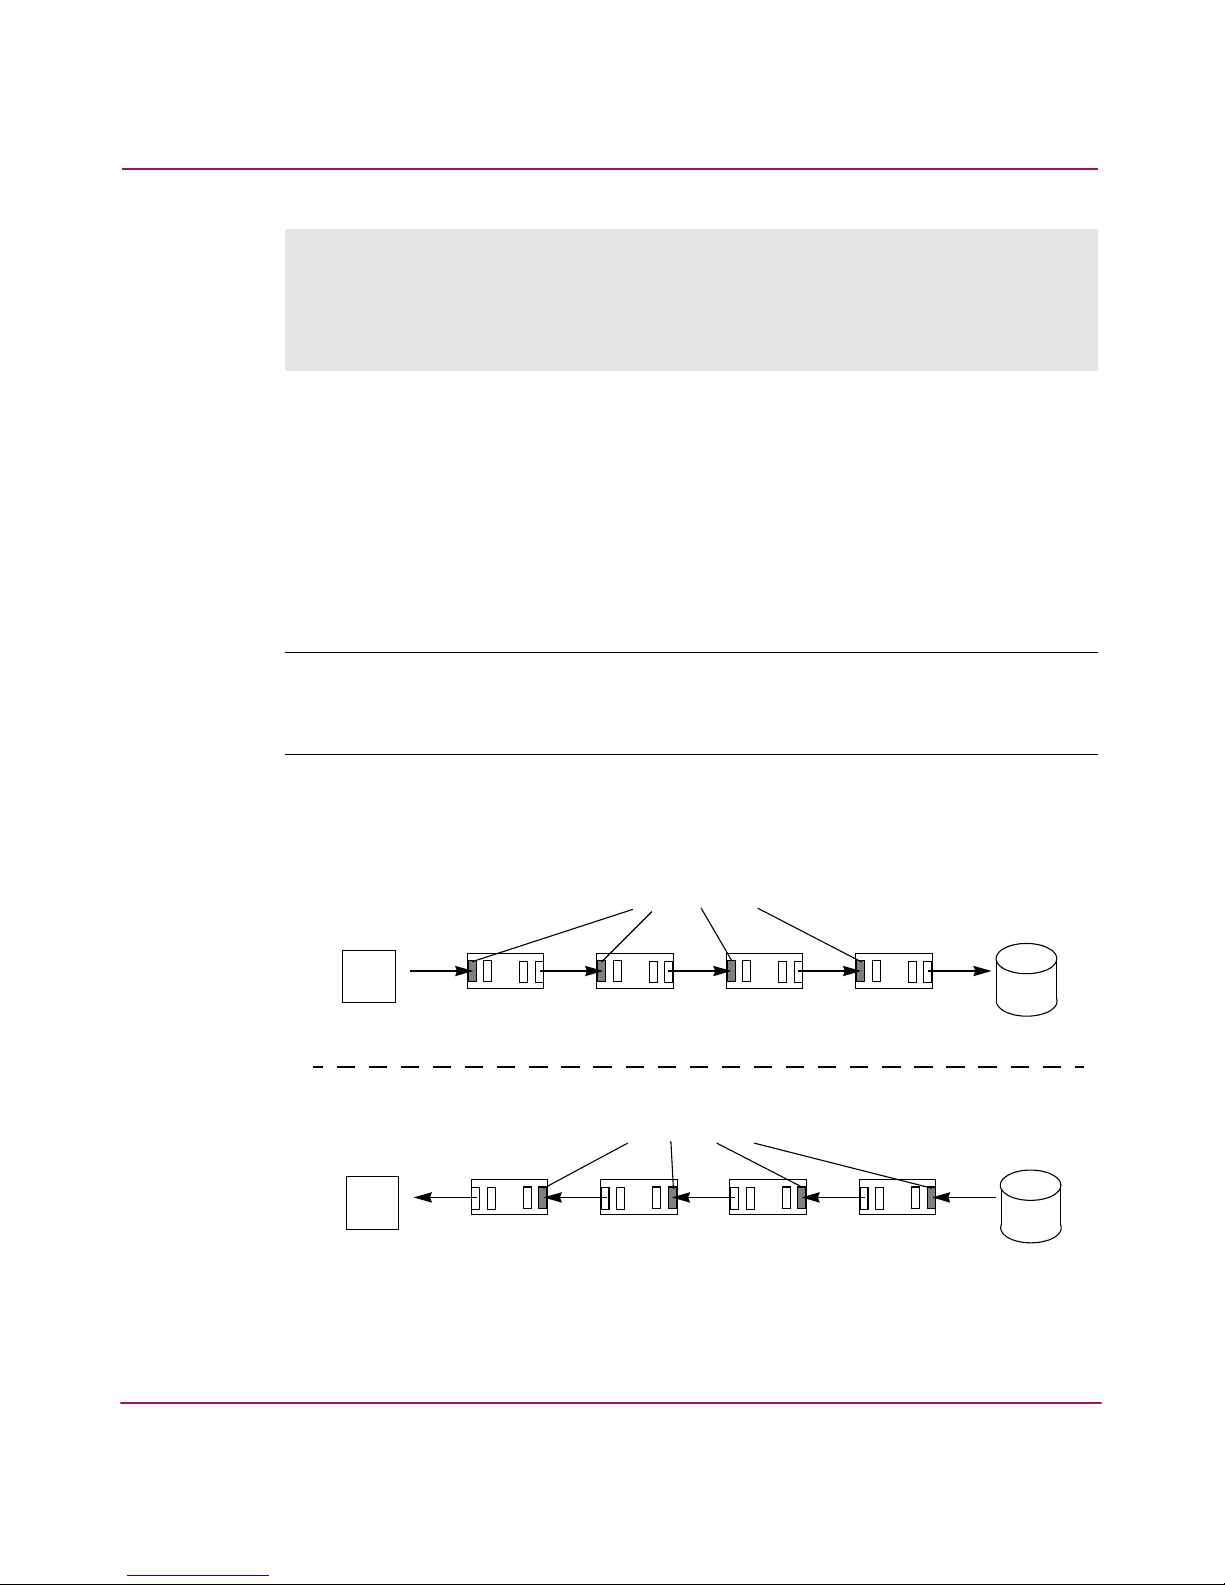
Note: End-to-end performance monitoring monitors traffic on the receiving port
respective to the SID only. Using Figure 9 as an example, if you add a monitor to slot 1,
port 2 specifying Dev B as the SID and Host A as the DID, no counters are incremented.
Figure 10 shows several switches and the proper ports on which to add
performance monitors for a specified SID-DID pair.
Figure 10: Proper placement of end-to-end performance monitors
sw1:admin> perfAddEEMonitor 1,2, "0x051200" "0x111eef"
End-to-End monitor number 0 added.
-----------------------------------------------------
sw2:admin> perfAddEEMonitor 2,15, "0x111eef" "0x051200"
End-to-End monitor number 1 added.
. . .
0x051200
0x111eef
Host
A
DID
SID
. . .. . . . . .
. . .
0x051200
0x111eef
Host
A
Dev
B
SID
DID
. . . . . .. . .
Add monitors here
Add monitors here
Dev
B
Page 41

Using Advanced Performance Monitoring
41Advanced Performance Monitoring Version 3.1.x/4.1.x User Guide
Setting a Mask for End-to-end Monitors
End-to-end monitors count the number of words in Fibre Channel frames that
match a specific SID/DID pair. If you want to match only part of the SID or DID,
you can set a mask on the port to compare only certain parts of the SID or DID.
With no mask set, the frame must match the entire SID and DID to trigger the
monitor. By setting a mask, you can choose to have the frame match only one or
two of the three fields (Domain ID, Area ID, AL_PA) to trigger the monitor.
Note: You can set only one mask per port. When setting a mask, all existing
end-to-end monitors will be deleted.
The mask is specified in the form "dd:aa:pp," where dd is the Domain ID mask,
aa is the Area ID mask, and pp is the AL_PA mask. The values for dd, aa, and pp
are either ff (the field must match) or 00 (the field is ignored).
Use the perfSetPortEEMask command to set a mask for end-to-end
monitors. This command sets the mask for all end-to-end monitors of a port.
If any end-to-end monitors are programmed on a port when you issue the
perfSetPortEEMask command, a message will display indicating the
existing End-to-end monitors will be deleted.
Example. The following message will be displayed when you issue the
perfSetPortEEMask command on a port with the existing end-to-end
monitors configured.
The perfSetPortEEMask command sets a mask for the Domain ID, Area
ID, and AL_PA of the SIDs and DIDs for frames transmitted from and received by
the port. Figure 11 shows the mask positions in the command.
‘< n > EE monitors are currently programmed on this port.
Changing EE mask for this port will cause these EE monitors to
be deleted.
Do you want to continue? (yes, y, no, n): [no]
EE mask on port <port-number> is set and ‘<n>’ EE monitors
were deleted
Page 42

Using Advanced Performance Monitoring
42 Advanced Performance Monitoring Version 3.1.x/4.1.x User Guide
Figure 11: Mask positions for end-to-end monitors
In Figure 11, a mask (“ff”) is set on slot 1, port 2 to compare the AL_PA fields on
the SID and DID in all frames (transmitted and received) on port 2. The frame SID
and DID must match only the AL_PA portion of the specified SID-DID pair. Each
port can have only one EE mask. The mask is applied to all end-to-end monitors
on the port. Individual masks for each monitor on the port cannot be specified.
The default EE mask value upon power-on is “ff:ff:ff” for everything—SID and
DID on all transmitted and received frames.
Example. If the monitor on a port is set as in this example, then the frame SID
must be “0x051200” and the frame DID must be “0x111eef” to trigger the
monitor.
Displaying the End-to-end Mask of a Port
Use the perfShowPortEEMask command to display the current end-to-end
mask of a port.
The end-to-end mask has 12 fields, with each field having a value of on or off.
Example. The following commands set an end-to-end mask on port 11 and
display the mask:
perfAddEEMonitor 2, "0x051200" "0x111eef"
perfSetPortEEMask 1/2, "00:00:ff" "00:00:ff" "00:00:ff" "00:00:ff"
SID mask DID mask
Transmitted from port
Received by port
AL_PA mask
Area ID mask
Domain ID mask
SID mask DID mask
Page 43

Using Advanced Performance Monitoring
43Advanced Performance Monitoring Version 3.1.x/4.1.x User Guide
Displaying End-to-end Monitors
Use the perfShowEEMonitor command to display all the end-to-end
monitors defined on a port. You can display cumulative counters or a rolling table
of counters at specified intervals. This command displays the following
information on all end-to-end monitors:
■ Monitor number (KEY)
■ SID
■ DID
■ CRC error count (CRC_COUNT)
■ Number of Fibre Channel words transmitted (TX_COUNT)
■ Number of Fibre Channel words received (RX_COUNT)
■ Creator application (OWNER_APP)
■ IP address of the creator, if known (OWNER_IP_ADDR)
If you specify an interval number in the perfShowEEMonitor command, the
command displays a rolling table of CRC error, Tx, and Rx counters on a
per-interval basis for all the valid monitors on the port. The counter values are the
number of bytes, in decimal format.
If you omit the interval number, the command displays the cumulative transmit
counter (TX_COUNT), receive counter (RX_COUNT), and CRC error counter.
These cumulative counters are 64-bit values in hexadecimal format.
sw1:admin> perfSetPortEEMask 11, "00:00:ff" "00:00:ff"
"00:00:ff" "00:00:ff"
The EE mask on port 26 is set and EE counters are reset.
sw1:admin> perfShowPortEEMask 11
The EE mask on port 26 is set by application TELNET
TxSID Domain: off
TxSID Area: off
TxSID ALPA: on
TxDID Domain: off
TxDID Area: off
TxDID ALPA: on
RxSID Domain: off
RxSID Area: off
RxSID ALPA: on
RxDID Domain: off
RxDID Area: off
RxDID ALPA: on
Page 44

Using Advanced Performance Monitoring
44 Advanced Performance Monitoring Version 3.1.x/4.1.x User Guide
Example 1. The following command displays all of the end-to-end monitors on
port 3 at an interval of every 6 seconds. (In this example, there are three monitors
on port 3, numbered 0, 1, and 2.)
Note: In the example above, “m” stands for megabytes. You may also see “g” which
stands for gigabytes, or “k” which stands for kilobytes.
Example 2. The following command displays the cumulative counters on all
end-to-end monitors defined on port 3. The KEY column contains the monitor
number.
Deleting End-to-end Monitors
Use the perfDelEEMonitor command to delete an end-to-end monitor on a
port. Indicate which monitor to delete by specifying the monitor number that was
returned by a previous perfDelEEMonitor command.
sw1:admin> perfShowEEMonitor 3, 5
perfShowEEMonitor 3, 5: Tx/Rx are # of bytes and crc is
# of crc errors
012
------------ ------------ -----------crc Tx Rx crc Tx Rx crc Tx Rx
============ ============ ============
00 0000000
0 53m 4.9m 0 53m 4.9m 0 53m 4.9m
0 53m 4.4m 0 53m 4.4m 0 53m 4.4m
0 53m 4.8m 0 53m 4.8m 0 53m 4.8m
0 53m 4.6m 0 53m 4.6m 0 53m 4.6m
0 53m 5.0m 0 53m 5.0m 0 53m 5.0m
0 52m 4.6m 0 52m 4.6m 0 52m 4.6m
switch:admin> perfShowEEMonitor 3
There are 3 end-to-end monitor(s) defined on port 3.
KEY SID DID OWNER_APP OWNER_IP_ADDR TX_COUNT ...
-----------------------------------------------------------------------...
0 0xb1300 0xb23ef TELNET N/A 0x00000004d0ba9915 ...
1 0xb1200 0xb22ef TELNET N/A 0x00000004d0baa754 ...
2 0x58e0f 0x1182ef WEB_TOOLS 192.168.169.40 0x00000004d0bade54 ...
Page 45

Using Advanced Performance Monitoring
45Advanced Performance Monitoring Version 3.1.x/4.1.x User Guide
Example. The following command deletes the end-to-end monitor number 0 on
port 2:
Clearing End-to-end Monitor Counters
Use the perfClearEEMonitor command to clear statistics for all
end-to-end monitors on a port, or on a specified end-to-end monitor on a port.
Once the command has been executed, the telnet shell will confirm that the
monitor counters have been cleared. Prior to issuing this command, use the
perfShowEEMonitor command to verify all of the valid end-to-end monitor
numbers on a specific port to ensure the correct monitor counters will be cleared.
Example. The following command clears the end-to-end monitor number 5 on
slot 1, port 2:
Using Filter-based Performance Monitoring
Filter-based monitoring counts the number of times a frame with a particular
pattern in its header is received by a port. Filter-based monitoring is achieved by
configuring a filter for a particular purpose. The filter can be a standard filter (for
example, a read command filter that counts the number of read commands that
have been received by the port) or a user-defined filter that you customize for your
particular use.
The maximum number of filters is eight per port, in any combination of standard
filters and user-defined filters.
sw1:admin> perfDelEEMonitor 2, 0
End-to-End monitor number 0 deleted
sw1:admin> perfClearEEMonitor 2, 5
End-to-End monitor number 5 counters are cleared
Page 46
Using Advanced Performance Monitoring
46 Advanced Performance Monitoring Version 3.1.x/4.1.x User Guide
Adding Standard Filter-Based Monitors
This section describes how to add standard filter-based monitors to a port. Use the
telnet commands listed in Tab le 4 to define filter-based monitors on a port.
Example. These commands add several filter-based monitors to port 2 and display
the results.
Table 4: Telnet Commands to Add Filter-based Monitors
Telnet Command Description
perfAddReadMonitor Count the number of SCSI Read
commands
perfAddWriteMonitor Count the number of SCSI Write
commands
perfAddRWMonitor Count the number of SCSI Read and
Write commands
perfAddSCSIMonitor Count the number of SCSI traffic frames
perfAddIPMonitor Count the number of IP traffic frames
sw1:admin> perfAddReadMonitor 2
SCSI Read filter monitor #0 added
sw1:admin> perfAddWriteMonitor 2
SCSI Write filter monitor #1 added
sw1:admin> perfAddRWMonitor 2
SCSI Read/Write filter monitor #2 added
sw1:admin> perfAddSCSIMonitor 2
SCSI traffic frame monitor #3 added
sw1:admin> perfAddIPMonitor 2
IP traffic frame monitor #4 added
sw1:admin> perfShowFilterMonitor 2
There are 5 filter-based monitors defined on port 2.
KEY ALIAS OWNER_APP OWNER_IP_ADDR FRAME_COUNT
------------------------------------------------------------0 SCSI Read TELNET N/A 0x0000000000000000
1 SCSI Write TELNET N/A 0x0000000000000000
2 SCSI R/W TELNET N/A 0x0000000000000000
3 SCSI Frame TELNET N/A 0x0000000000000000
4 IP Frame TELNET N/A 0x0000000000000000
Page 47

Using Advanced Performance Monitoring
47Advanced Performance Monitoring Version 3.1.x/4.1.x User Guide
Adding User-Defined Filter-Based Monitors
In addition to the standard filters (read, write, read/write, and frame count), you
can create custom filters to qualify frames for statistics gathering to fit your own
special needs.
To define a custom filter, use the perfAddUserMonitor telnet command.
With this command, you must specify a series of offsets, masks, and values. The
following actions are performed. For all incoming frames, the switch:
■ locates the byte found in the frame at the specified offset
■ applies the mask to the byte found in the frame
■ compares the value with the given values in the perfAddUserMonitor
command
■ increments the filter counter if a match is found
You can specify up to six different offsets for each port, and up to four values to
compare against each offset.
If more than one offset is required to properly define a filter, the bytes found at
each offset must match one of the given values for the filter to increment its
counter. If one or more of the given offsets does not match any of the given values,
the counter does not increment.
The value of the offset must be between 0 and 63, in decimal format. Byte 0
indicates the first byte of the Start of Frame (SOF), byte 4 is the first byte of the
frame header, and byte 28 is the first byte of the payload. Thus only the SOF,
frame header, and first 36 bytes of payload may be selected as part of a filter
definition.
Offset 0 is a special case, which can be used to monitor the first 4 bytes of the
frame (SOF). When the offset is 0, the values are from 0–7, indicating the
following:
0 SOFf
1 SOFc1
2 SOFi1
3 SOFn1
4 SOFi2
5 SOFn2
6 SOFi3
7 SOFn3
Page 48

Using Advanced Performance Monitoring
48 Advanced Performance Monitoring Version 3.1.x/4.1.x User Guide
The hardware can manage only a limited number of unique offsets and values. If
the switch does not have enough resources to create a given filter, then other filters
may have to be deleted to free up resources.
Example 1. This command adds a filter-based monitor to count all FCP and IP
frames received from domain 0x02 for port 2.
The FCP and IP protocols are selected by monitoring offset 12, mask 0xff, and
matching values of 0x05 or 0x08. Domain 2 is selected by monitoring offset 9,
mask 0xff, and matching a value of 0x02.
The monitor counter is incremented for all incoming frames where byte 9 is 0x02
and byte 12 is 0x05 or 0x08.
Example 2. The following command adds a special case filter-based monitor for
SOFi3 on slot 1, port 2.
Displaying Filter-Based Monitors
Use the perfShowFilterMonitor command to display all of the filter-based
monitors on a specified port. You can display a cumulative count of the traffic
detected by the monitors, or you can display a snapshot of the traffic at specified
intervals.
Note: Intervals must be specified in multiples of 5 seconds, for example, 5, 10, 15, 20,
25, etc., because registers are scanned every 5 seconds.
sw1:admin> perfAddUserMonitor 2,
"12, 0xff, 0x05, 0x08; 9, 0xff, 0x02" "FCP/IP"
User monitor #5 added
sw1:admin> perfAddUserMonitor 2, "0, 0xff, 6"
User Monitor #6 added
Page 49

Using Advanced Performance Monitoring
49Advanced Performance Monitoring Version 3.1.x/4.1.x User Guide
Example 1. The following command displays filter monitor traffic on port 2 at an
interval of once every 5 seconds. In the command output, “#CMDs” refers to the
read, write, and read-write counters, and “#Frames” refers to SCSI frame, IP
frame, and user-defined counters.
Example 2. The following command displays the cumulative frame count of all
filter-based monitors defined on port 2. The KEY column lists the monitor
numbers.
sw1:admin> perfShowFilterMonitor 2, 5
0123456
#CMDs #CMDs #CMDs #Frames #Frames #Frames #CMDs
------------------------------------------------------------0000000
26k 187 681 682 682 494 187
26k 177 711 710 710 534 176
26k 184 734 734 734 550 184
26k 182 649 649 649 467 182
26k 188 754 755 755 567 184
sw1:admin> perfShowFilterMonitor 2
There are 7 filter-based monitors defined on port 2.
KEY ALIAS OWNER_APP OWNER_IP_ADDR FRAME_COUNT
-------------------------------------------------------------
0 SCSI Read TELNET N/A 0x0000000000002208
1 SCSI Write TELNET N/A 0x000000000000464a
2 SCSI R/W TELNET N/A 0x000000000000fd8c
3 SCSI Frame WEB_TOOLS 192.168.169.40 0x00000000002c2229
4 IP Frame WEB_TOOLS 192.168.169.40 0x0000000000000492
5 FCP/IP WEB_TOOLS 192.168.169.40 0x0000000000000009
6 SCSI_RD WEB_TOOLS 192.168.161.140 0x000000000000023a
Page 50

Using Advanced Performance Monitoring
50 Advanced Performance Monitoring Version 3.1.x/4.1.x User Guide
Deleting Filter-Based Monitors
To delete a filter-based monitor, first list the valid monitor numbers using the
perfShowFilterMonitor command, then use the
perfShowFilterMonitor command to delete a specific monitor. If you do
not specify which monitor number to delete, you will be asked if you want to
delete all entries.
Example. The following commands display the monitors on port 4 (the monitor
numbers are listed in the KEY column), and then delete monitor number 1 on port
4.
Clearing Filter-Based Monitor Counters
Prior to clearing statistics counters, verify all of the valid monitor numbers with
user-defined aliases on a specific port using the perfShowFilterMonitor
command to make sure the correct monitor counters are cleared.
To clear statistics counters for all or a specified filter-based monitor, use the
perfClearFilterMonitor command. Once the command has been
executed, the telnet shell will confirm that the counters on the monitor have been
cleared.
Example. The following command clears the statistics counters for a filter-based
monitor 4 on port 2 in slot 1.
sw1:admin> perfShowFilterMonitor 4
There are 4 filter-based monitors defined on port 4.
KEY ALIAS OWNER_APP OWNER_IP_ADDR FRAME_COUNT
-------------------------------------------------------------
0 SCSI Read TELNET N/A 0x0000000000002208
1 SCSI Write TELNET N/A 0x000000000000464a
2 SCSI R/W TELNET N/A 0x000000000000fd8c
3 SCSI Frame WEB_TOOLS 192.168.169.40 0x00000000002c2229
sw1:admin> perfDelFilterMonitor 4, 1
The specified filter-based monitor is deleted.
sw1:admin> perfClearFilterMonitor 1/2,4
Filter-based monitor number 4 counters are cleared
Page 51

Using Advanced Performance Monitoring
51Advanced Performance Monitoring Version 3.1.x/4.1.x User Guide
Saving and Restoring Monitor Configuration
You can use the perfCfgSave command to save the current end-to-end and
filter monitor configuration settings into flash memory. This command enables the
performance monitoring configuration to be saved over power cycles. You can use
the perfCfgRestore command to restore the saved monitor configuration
from flash memory.
For example, if you power cycle the switch, and you want to use the same
end-to-end and filter monitoring configuration that was in effect prior to the power
cycle, do the following:
1. Use the perfCfgSave command to save the monitor configuration
settings.
2. Power cycle the switch.
3. Use the perfCfgRestore command to restore the saved monitor
configuration.
Example 1.
Use the perfCfgClear command to clear the previously saved performance
monitoring configuration settings from flash memory.
Example 2.
sw1:admin> perfCfgSave
This will overwrite previously saved Performance Monitoring
settings in FLASH ROM. Do you want to continue? [y|n]y
Please wait ...
Committing configuration...done.
Performance monitoring configuration saved in FLASH ROM.
sw1:admin> perfCfgRestore
This will overwrite current Performance Monitoring
settings in RAM. Do you want to continue? [y|n]y
Please wait ...
Performance monitoring configuration restored from FLASH ROM.
sw1:admin> perfCfgClear
This will clear Performance Monitoring settings in FLASH ROM.
The RAM settings won’t change. Do you want to continue?
[y|n]y
Please wait ...
Committing configuration...done.
Performance Monitoring configuration cleared from FLASH.
Page 52

Using Advanced Performance Monitoring
52 Advanced Performance Monitoring Version 3.1.x/4.1.x User Guide
Resource Usage for End-to-end and Filter-based monitoring
The following list presents limits on the use of end-to-end and filter-based
monitors due to their memory and CPU cycle requirements.
■ End-to-end monitors use resources that are separate from filter-based
monitors and zoning. There can be a maximum of eight end-to-end monitors.
■ Filter-based monitors use the same filter resources as zoning. There are 32
filters per port, with 24 allocated to zoning and eight allocated to Performance
Monitoring. These are statically allocated, so no matter how many filter-based
monitors you have added to Performance Monitoring, you are always using a
maximum of eight filters.
■ In addition, there is a maximum of six offset/values that are shared among
zoning and Performance Monitoring. These are dynamically allocated.
Page 53

53Advanced Performance Monitoring Version 3.1.x/4.1.x User Guide
glossary
Glossary
Glossary
This glossary defines terms used in this guide or related to this product and is not
a comprehensive glossary of computer terms.
16-port card
The Fibre Channel port card provided with the StorageWorks Core switch. Contains 16 Fibre
Channel ports and the corresponding LEDs indicating port status and speed.
See also port card.
8b/10b Encoding
An encoding scheme that converts each 8-bit byte into 10 bits. Used to balance ones and zeros in
high-speed transports.
Access Control List
Enables an organization to bind a specific WWN to a specific switch port or set of ports, preventing
a port in another physical location from assuming the identity of a real WWN. May also refer to a
list of the Read/Write access of a particular community string.
See also device connection controls.
Account Level Switches
Refers to switches that have four login accounts into the operating system (in descending order):
root, factory, admin, and user.
See also root account, factory account, admin account, and user account.
Address Identifier
A 24-bit or 8-bit value used to identify the source or destination of a frame.
Admin Account
A login account intended for use by the customer to control switch operation.
See also account level switches.
AL_PA
Arbitrated Loop Physical Address. A unique 8-bit value assigned during loop initialization to a
port in an arbitrated loop.
Page 54

Glossary
54 Advanced Performance Monitoring Version 3.1.x/4.1.x User Guide
Alias
An alternate name for an element or group of elements in the fabric. Aliases can be used to
simplify the entry of port numbers and WWNs when creating zones.
Alias Address Identifier
An address identifier recognized by a port in addition to its standard identifier. An alias address
identifier may be shared by multiple ports.
See also alias.
Alias AL_PA
An AL_PA value recognized by an L_Port in addition to the AL_PA assigned to the port.
See also AL_PA.
Alias Server
A fabric software facility that supports multicast group management.
ANSI
American National Standards Institute. The governing body for Fibre Channel standards in the
U.S.A.
API
Application Programming Interface. Defined protocol that allows applications to interface with a
set of services.
Arbitrated Loop
A shared 100 or 200 MBps Fibre Channel transport structured as a loop. Can support up to 126
devices and one fabric attachment.
See also topology.
Arbitrating State
The state in which a port has become the loop master. This state is only available from the Open
state.
Area Number
A number assigned to each potential port location in the StorageWorks Core switch. Used to
distinguish StorageWorks Core switch ports that have the same port number but are on different
port blades.
ASIC
Application Specific Integrated Circuit.
Page 55

Glossary
55Advanced Performance Monitoring Version 3.1.x/4.1.x User Guide
ATM
Asynchronous Transfer Mode. A transport used for transmitting data over LANs or WANs that
transmit fixed-length units of data. Provides any-to-any connectivity, and allows nodes to transmit
simultaneously.
Auto-negotiate Speed
Process that allows two devices at either end of a link segment to negotiate common features, speed
(e.g., 1 or 2 Gbps) and functions.
Autosense
Process during which a network device automatically senses the speed of another device.
AW_TOV
Arbitration Wait Time-out Value. The minimum time an arbitrating L_Port waits for a response
before beginning loop initialization.
Backup FCS Switch
Backup fabric configuration server switch. The switch or switches assigned as backup in case the
primary FCS switch fails.
See also FCS switch, primary FCS switch.
Bandwidth
The total transmission capacity of a cable, link, or system. Usually measured in bps (bits per
second). May also refer to the range of transmission frequencies available to a network.
See also throughput.
BB_Credit
Buffer-to-buffer credit. The number of frames that can be transmitted to a directly connected
recipient or within an arbitrated loop. Determined by the number of receive buffers available.
See also Buffer-to-buffer Flow Control, EE_Credit.
Beacon
When all the port LEDs on a switch are set to flash from one side of the switch to the other, to
enable identification of an individual switch in a large fabric. A switch can be set to beacon by
telnet command or through Web Tools.
Beaconing
The state of the switches LEDs when the switch is set to Beacon.
See also Beacon.
Page 56

Glossary
56 Advanced Performance Monitoring Version 3.1.x/4.1.x User Guide
Beginning Running Disparity
The disparity at the transmitter or receiver when the special character associated with an ordered
set is encoded or decoded.
See also disparity.
BER
Bit Error Rate. The rate at which bits are expected to be received in error. Expressed as the ratio of
error bits to total bits transmitted.
See also error.
BISR
Built-In Self Repair. Refers to the range of algorithms and circuit techniques to replace fault
elements in a VLSI circuit with redundant fault-free ones.
See also BIST, CMBISR.
BIST
Built-In Self Test. The technique of designing circuits with additional logic which can be used to
test proper operation of the primary (functional) logic.
See also BISR, CMBISR.
Bit Synchronization
See BER.
Blade
See 16-port card.
Blind-mate Connector
A two-way connector used in some switches to provide a connection between the motherboard and
the power supply.
Block
As applies to Fibre Channel, upper-level application data that is transferred in a single sequence.
Blower Assembly
A fan that prevents a switch (or individual elements within a switch) from overheating.
Boot Flash
Flash memory that stores the boot code and boot parameters. The processor executes its first
instructions from boot flash. Data is cached in RAM.
Page 57

Glossary
57Advanced Performance Monitoring Version 3.1.x/4.1.x User Guide
Boot Monitor
Code used to initialize the CP (control processor) environment after powering on. Identifies the
amount of memory available and how to access it, and retrieves information about system buses.
Broadcast
The transmission of data from a single source to all devices in the fabric, regardless of zoning.
See also multicast, unicast.
Buffer
-to-buffer Flow Control
Management of the frame transmission rate in either a point-to-point topology or in an arbitrated
loop.
See also BB_Credit.
Cascade
Two or more interconnected Fibre Channel switches. StorageWorks 1 Gb SAN switches (running
Fabric OS V2) and later can be cascaded up to 239 switches, with a recommended maximum of
seven interswitch links (no path longer than eight switches).
See also fabric, ISL.
Chassis
The metal frame in which the switch and switch components are mounted.
Circuit
An established communication path between two ports. Consists of two virtual circuits capable of
transmitting in opposite directions.
See also link.
Class 1
Service that provides a dedicated connection between two ports (also called connection-oriented
service), with notification of delivery or non-delivery.
Class 2
Service that provides multiplex and connectionless frame switching service between two ports,
with notification of delivery or non-delivery.
Class 3
Service that provides a connectionless frame switching service between two ports, without
notification of delivery or non-delivery of data. This service can also be used to provide a multicast
connection between the originator and recipients, with notification of delivery or non-delivery.
Page 58

Glossary
58 Advanced Performance Monitoring Version 3.1.x/4.1.x User Guide
Class F
Connectionless service for control traffic between switches, with notification of delivery or
non-delivery of data between the E_Ports.
Class of Service
A specified set of delivery characteristics and attributes for frame delivery.
CLI
Command line interface. Interface that depends entirely on the use of commands, such as through
telnet or SNMP, and does not involve a Graphic User Interface (GUI).
CLS
Close Primitive Signal. Only in an Arbitrated Loop; sent by an L_Port that is currently
communicating on the loop, to close communication to an other L_Port.
CMBISR
Central Memory Built-In Self Repair. Test and repair bad cells in the central memory. If a "fail" is
reported, inform Tech Support and replace the board.
See also BIST, BISR.
Comma
A unique pattern (either 1100000 or 0011111) used in 8b/10b encoding to specify character
alignment within a data stream.
See also K28.5.
Community (SNMP)
A relationship between a group of SNMP managers and an SNMP agent, in which authentication,
access control, and proxy characteristics are defined.
See also SNMP.
Compact Flash
Flash memory that stores the run-time operating system and is used like hard disk storage. Not
visible within the processor's memory space. Data is stored in file system format.
Page 59

Glossary
59Advanced Performance Monitoring Version 3.1.x/4.1.x User Guide
Configuration
How a system is set up. May refer to hardware or software.
■ Hardware: The number, type, and arrangement of components that make up a system or
network.
■ Software: The set of parameters that guide switch operation. May include general system
parameters, IP address information, Domain ID, and other information. Modifiable by any
login with administrative privileges.
May also refer to a set of zones.
See also zone configuration.
Connection Initiator
A port that has originated a Class 1 dedicated connection and received a response from the
recipient.
Connection Recipient
A port that has received a Class 1 dedicated connection request and transmitted a response to the
originator.
Control Panel
Refers to the left-side panel of Web Tools, which accesses fabric-wide functions such as Zoning
and Events.
Core Switch
A switch whose main task is to interconnect other switches.
See also SAN switch.
CP Card
Control Processor Card. The central processing unit of the StorageWorks Core switch, which
contains two CP Card slots to provide redundancy. Provides Ethernet, serial, and modem ports with
the corresponding LEDs.
CRC
Cyclic Redundancy Check. A check for transmission errors included in every data frame.
Credit
As applies to Fibre Channel, the number of receive buffers available for transmission of frames
between ports.
See also BB_Credit, EE_Credit.
Page 60

Glossary
60 Advanced Performance Monitoring Version 3.1.x/4.1.x User Guide
CT_HDR
Common Transport Header. A header that conforms to the Fibre Channel Common Transport
(FC_CT) protocol.
CT_IU
Common Transport Information Unit. An information unit that conforms to the Fibre Channel
Common Transport (FC_CT) protocol.
Current Fill Word
The fill word currently selected by the LPSM.
See also fill word, LPSM.
Cut-through
A switching technique that allows the route for a frame to be selected as soon as the destination
address is received.
See also route.
Data Word
Type of transmission word that occurs within frames. The frame header, data field, and CRC all
consist of data words.
See also frame, ordered set, transmission word.
DB-9 connector
A 9-pin version of the RS-232C port interface. May be either the male of female interface.
See also RS-232 port.
dBm
Logarithmic unit of power used in electronics. Indicates signal strength in decibels above the
reference level, which is 1 milliwatt for dBm. An increase of 10 dBm or represents a 10-fold
increase in power.
DCE port
A data communications equipment port capable of interfacing between a DTE (data terminal
equipment) port and a transmission circuit. DTE devices with an RS-232 (or EIA-232) port
interface transmit on pin 3, and receive on pin 2.
See also DTE port, RS-232 port.
Defined Zone Configuration
The set of all zone objects defined in the fabric. May include multiple zone configurations.
See also enabled zone configuration, zone configuration.
Page 61

Glossary
61Advanced Performance Monitoring Version 3.1.x/4.1.x User Guide
Device Connection Controls
Enables organizations to bind an individual device port to a set of one or more switch ports. Device
ports are specified by a WWN and typically represent HBAs (servers).
See also access control lists.
Device
A disk, a RAID, or an HBA.
Disparity
The relationship of ones and zeros in an encoded character. “Neutral disparity” means an equal
number of each, “positive disparity” means a majority of ones, and “negative disparity” means a
majority of zeros.
DLS
Dynamic Load Sharing. Dynamic distribution of traffic over available paths. Allows for
recomputing of routes when an Fx_Port or E_Port changes status.
Domain ID
As applies to HP StorageWorks switches, a unique number between 1 and 239 that identifies the
switch to the fabric and is used in routing frames. Usually automatically assigned by the switch, but
can be manually assigned.
DTE port
A data terminal equipment port capable of interfacing to a transmission circuit through a
connection to a DCE (data communications equipment) port. DTE devices with an RS-232 (or
EIA-232) port interface transmit on pin 3, and receive on pin 2 in a 9-pin connector (reversed in
25-pin connectors).
See also DCE port, RS-232 port.
DWDM
Dense Wavelength Multiplexing. A means to concurrently transmit more than one stream of data
through a single fiber by modulating each stream of data onto a different wavelength of light.
E_D_TOV
Error Detect Time-out Value. The minimum amount of time a target waits for a sequence to
complete before initiating recovery. Can also be defined as the maximum time allowed for a
round-trip transmission before an error condition is declared.
See also R_A_TOV, RR_TOV.
Page 62

Glossary
62 Advanced Performance Monitoring Version 3.1.x/4.1.x User Guide
E_Port
Expansion Port. A type of switch port that can be connected to an E_Port on another switch to
create an ISL.
See also ISL.
EE_Credit
End-to-end Credit. The number of receive buffers allocated by a recipient port to an originating
port. Used by Class 1 and 2 services to manage the exchange of frames across the fabric between
source and destination.
See also End-to-end Flow Control, BB_Credit.
EIA Rack
A storage rack that meets the standards set by the Electronics Industry Association.
ELWL
Extra Long Wavelength. Laser light with a periodic length greater than 1300 nm (e.g., 1420 or
1550). ELWL lasers are used to transmit Fibre Channel data over distances greater than 10 Km.
Also known as XLWL.
Enabled Zone Configuration
The currently enabled zone configuration. Only one configuration can be enabled at a time.
See also defined zone configuration, zone configuration.
End-to-end Flow Control
Governs flow of class 1 and 2 frames between N_Ports.
See also EE_Credit.
Entry Fabric
Basic HP license that allows one E_Port per switch. Not supported by StorageWorks Core
switches.
Error
As applies to Fibre Channel, a missing or corrupted frame, time-out, loss of synchronization, or
loss of signal (link errors).
See also loop failure.
ESD
Electrostatic Discharge.
Page 63

Glossary
63Advanced Performance Monitoring Version 3.1.x/4.1.x User Guide
Exchange
The highest level Fibre Channel mechanism used for communication between N_Ports. Composed
of one or more related sequences, and can work in either one or both directions.
Extended Fabric
An HP product that runs on Fabric OS and allows creation of a Fibre Channel fabric interconnected
over distances of up to 100 kilometers.
Extended Fabric is a means of allowing the implementation and management of SANs over
extended distances. This is achieved by adjusting the Buffer-to-Buffer Credits to guaranteed
allocation of buffers to specific ports.
F_Port
Fabric Port. A port that is able to transmit under fabric protocol and interface over links. Can be
used to connect an N_Port to a switch.
See also FL_Port, Fx_Port.
Fabric
A Fibre Channel network containing two or more interconnected switches in addition to hosts and
devices. May also be referred to as a switched fabric.
See also topology, SAN, cascade.
Fabric Access
An HP product that consists of a set of APIs that allow third party applications to interface with
Fabric OS.
Fabric Access allows the application to control the fabric directly for functions such as discovery,
access (zoning), management, performance, and switch control. Consists of a host-based library
that interfaces the application to switches in the fabric over an out-of-band TCP/IP connection or
in-band using an IP-capable Host Bus Adapter (HBA).
Fabric Assist
An HP feature that enables private and public hosts to access public targets anywhere on the fabric,
provided they are in the same Fabric Assist zone. This feature is available only when both
QuickLoop and Zoning are installed on the switch.
Fabric Assist is a means of allowing private hosts to communicate with public targets across a
switched fabric. Fabric Assist also allows private hosts to communicate with private targets that are
not resident on the same switch across a switched fabric.
See also QuickLoop.
Page 64

Glossary
64 Advanced Performance Monitoring Version 3.1.x/4.1.x User Guide
Fabric Configuration Server
One or more designated HP switches that store and manage the configuration and security
parameters for all other switches in the fabric. These switches are designated by WWN, and the list
of designated switches is known fabric-wide.
Fabric Manager
An HP product that works in conjunction with Web Tools to provide a graphical user interface for
managing switch groups (such as the SAN Switch Integrated/32) as a single unit, instead of as
separate switches. Fabric Manager is installed on and run from a computer workstation.
Fabric Name
The unique identifier assigned to a fabric and communicated during login and port discovery.
Fabric OS
The proprietary operating system on HP StorageWorks switches.
Fabric Watch
An HP product that runs on Fabric OS and allows monitoring and configuration of fabric and
switch elements.
Allows the SAN manager to monitor key fabric and switch elements, making it easy to quickly
identify and escalate potential problems. It monitors each element for out-of-boundary values or
counters and provides notification when defined boundaries are exceeded. The SAN manager can
configure which elements, such as error, status, and performance counters, are monitored within an
HP switch.
See also Fabric Manager.
Factory Account
A login used during manufacturing to initialize and test a switch and is not intended for customer
use.
See also account level switches.
Failover
The act that causes control to pass from one redundant unit to another. In the StorageWorks Core
switch one may failover from the currently Active Control Processor (CP) to the Standby CP.
FAN
Fabric access notification. Retains the AL_PA and fabric address when loop re-initializes (if the
switch supports FAN).
FC-AL-3
The Fibre Channel Arbitrated Loop standard defined by ANSI. Defined on top of the FC-PH
standards.
Page 65

Glossary
65Advanced Performance Monitoring Version 3.1.x/4.1.x User Guide
FC-FLA
The Fibre Channel Fabric Loop Attach standard defined by ANSI.
FCIA
Fibre Channel Industry Association. An international organization of Fibre Channel industry
professionals. Among other things, provides oversight of ANSI and industry developed standards.
FCP
Fibre Channel Protocol. Mapping of protocols onto the Fibre Channel standard protocols. For
example, SCSI FCP maps SCSI-3 onto Fibre Channel.
FC-PH-1, 2, 3
The Fibre Channel Physical and Signaling Interface standards defined by ANSI.
FC-PI
The Fibre Channel Physical Interface standard defined by ANSI.
FC-PLDA
The Fibre Channel Private Loop Direct Attach standard defined by ANSI. Applies to the operation
of peripheral devices on a private loop.
FCS switch
Fabric configuration server switch. One or more designated HP switches that store and manage the
configuration and security parameters for all switches in the fabric. FCS switches are designated by
WWN, and the list of designated switches is communicated fabric-wide.
See also backup FCS switch, primary FCS switch.
FC-SW-2
The second generation of the Fibre Channel Switch Fabric standard defined by ANSI. Specifies
tools and algorithms for the interconnection and initialization of Fibre Channel switches in order to
create a multi-switch Fibre Channel fabric.
Fibre Channel Transport
A protocol service that supports communication between Fibre Channel service providers.
See also FSP.
FIFO
First In, First Out. May also refer to a data buffer that follows the first in, first out rule.
Fill Word
An IDLE or ARB ordered set that is transmitted during breaks between data frames to keep the
Fibre Channel link active.
Page 66

Glossary
66 Advanced Performance Monitoring Version 3.1.x/4.1.x User Guide
Firmware Download
Loading firmware down from a server into a switch.
Firmware
The basic operating system provided with the hardware.
FL_Port
Fabric Loop Port. A port that is able to transmit under fabric protocol and also has arbitrated loop
capabilities. Can be used to connect an NL_Port to a switch.
See also F_Port, Fx_Port.
Flash Partition
Two redundant usable areas, called “partitions,” into which firmware can be downloaded in the
StorageWorks Core switch.
Flash
Programmable NVRAM memory that maintains its contents.
FLOGI
Fabric Login. The process by which an N_Port determines whether a fabric is present, and if so,
exchanges service parameters with it.
See also PLOGI.
Frame
The Fibre Channel structure used to transmit data between ports. Consists of a start-of-frame
delimiter, header, any optional headers, the data payload, a cyclic redundancy check (CRC), and an
end-of-frame delimiter. There are two types of frames: Link control frames (transmission
acknowledgements, etc.) and data frames.
See also Data Word.
FRU
Field Replaceable Unit. A component that can be replaced on site.
FS_ACC
Fibre Channel Services Accept. The information unit used to indicate acceptance of a request for a
Fibre Channel service.
FS_IU
Fibre Channel Services Information Unit. An information unit that has been defined by a Fibre
Channel service.
Page 67

Glossary
67Advanced Performance Monitoring Version 3.1.x/4.1.x User Guide
FS_REQ
Fibre Channel Services Request. A request for a Fibre Channel services function, or notification of
a fabric condition or event.
FS_RJT
Fibre Channel Services Reject. An indication that a request for Fibre Channel services could not be
processed.
FS
Fibre Channel Service. A service that is defined by Fibre Channel standards and exists at a
well-known address. For example, the Simple Name Server is a Fibre Channel service.
See also FSP.
FSPF
Fabric Shortest Path First. HP routing protocol for Fibre Channel switches.
FSP
Fibre Channel Service Protocol. The common protocol for all fabric services, transparent to the
fabric type or topology.
See also FS.
Full Fabric
The HP license that allows multiple E_Ports on a switch, making it possible to create multiple ISL
links.
Full-duplex
A mode of communication that allows the same port to simultaneously transmit and receive
frames.
See also half-duplex.
Fx_Port
A fabric port that can operate as either an F_Port or FL_Port.
See also F_Port, FL_Port.
G_Port
Generic Port. A port that can operate as either an E_Port or F_Port. A port is defined as a G_Port
when it is not yet connected or has not yet assumed a specific function in the fabric.
Gateway
Hardware that connects incompatible networks by providing translation for both hardware and
software. For example, an ATM gateway can be used to connect a Fibre Channel link to an ATM
connection.
Page 68

Glossary
68 Advanced Performance Monitoring Version 3.1.x/4.1.x User Guide
GBIC
Gigabit interface converter. A removable serial transceiver module that allows gigabaud
physical-level transport for Fibre Channel and gigabit Ethernet. Typically refers only to the
SC-form factor transceivers.
See also SFP.
Gbps
Gigabits per second (1,062,500,000 bits/second).
GBps
Gigabytes per second (1,062,500,000 bytes/second).
Half-duplex
A mode of communication that allows a port to either transmit or receive frames at any time, but
not simultaneously (with the exception of link control frames, which can be transmitted at any
time).
See also full-duplex.
Hard Address
The AL_PA that an NL_Port attempts to acquire during loop initialization.
Hardware Translative Mode
A method for achieving address translation. The following two hardware translative modes are
available to a QuickLoop-enabled switch:
■ Standard Translative Mode: Allows public devices to communicate with private devices that
are directly connected to the fabric.
■ QuickLoop Mode: Allows initiator devices to communicate with private or public devices that
are not in the same loop.
HBA
Host Bus Adapter. The interface card between a server or workstation bus and the Fibre Channel
network.
High Availability
An attribute of equipment that identifies it as being capable of conducting customer operations well
in excess of 99% of the time. Typically High Availability is identified by the number of nines in
that percentage. “Five Nines” means the equipment is rated as being capable of conducting
customer operations 99.999% of the time without failure.
Page 69

Glossary
69Advanced Performance Monitoring Version 3.1.x/4.1.x User Guide
Host
A computer that accesses storage devices over the fabric. May also be referred to as a server.
See also workstation.
Hot Pluggable
A FRU capability that indicates it may be extracted or installed while customer data is otherwise
flowing in the chassis.
Hub
A Fibre Channel wiring concentrator that collapses a loop topology into a physical star topology.
Nodes are automatically added to the loop when active and removed when inactive.
IBTA
The InfiniBand Trade Association (IBTA). The IBTA is an industry consortium of more than 200
companies working together to develop a new common I/O specification designed to bring greater
scalability and performance to server I/O. InfiniBand defines a new channel based, switched-fabric
technology for server-to-server and server-to-I/O interconnection that is expected to improve
scalability and performance over existing PCI Bus technologies.
Idle
Continuous transmission of an ordered set over a Fibre Channel link when no data is being
transmitted, to keep the link active and maintain bit, byte, and word synchronization.
InfiniBand
See IBTA.
Initiator
A server or workstation on a Fibre Channel network that initiates communications with storage
devices.
See also Target.
Integrated Fabric
The fabric created by a SAN Switch Integrated/32 and SAN Switch Integrated/64, consisting of six
SAN Switch 16-EL switches cabled together and configured to handle traffic as a seamless group.
IOD
In-order Delivery. A parameter that, when set, guarantees that frames are either delivered in order
or dropped.
IPA
Initial Process Associator. An identifier associated with a process at an N_Port.
Page 70

Glossary
70 Advanced Performance Monitoring Version 3.1.x/4.1.x User Guide
Isolated E_Port
An E_Port that is online but not operational due to overlapping Domain IDs or nonidentical
parameters (such as E_D_TOVs).
See also E_Port.
ISL
Interswitch Link. a Fibre Channel link from the E_Port of one switch to the E_Port of another.
See also E_Port, cascade, ISL Trunking.
ISL Trunking
An HP feature that enables distribution of traffic over the combined bandwidth of up to four ISLs
(between adjacent switches), while preserving in-order delivery. A set of trunked ISLs is called a
trunking group; each port employed in a trunking group is called a trunking port.
See also Master Port.
IU
Information Unit. A set of information as defined by either upper-level process protocol definition
or upper-level protocol mapping.
JBOD
Just a Bunch Of Disks. Indicates a number of disks connected in a single chassis to one or more
controllers.
See also RAID.
K28.5
A special 10-bit character used to indicate the beginning of a transmission word that performs
Fibre Channel control and signaling functions. The first seven bits of the character are the comma
pattern.
See also comma.
Kernel Flash
Flash memory that stores the bootable kernel code and is visible within the processor's memory
space. Data is stored as raw bits.
Key Pair
In public key cryptography, a pair of keys consisting of an entity's public and private key. The
public key can be publicized, but the private key must be kept secret.
Page 71

Glossary
71Advanced Performance Monitoring Version 3.1.x/4.1.x User Guide
L_Port
Loop Port. A node port (NL_Port) or fabric port (FL_Port) that has arbitrated loop capabilities. An
L_Port can be in one of two modes:
■ Fabric mode: Connected to a port that is not loop capable, and using fabric protocol.
■ Loop mode: In an arbitrated loop and using loop protocol. An L_Port in loop mode can also be
in participating mode or non-participating mode.
See also Non-participating Mode, Participating Mode.
Latency
The period of time required to transmit a frame, from the time it is sent until it arrives. Together,
latency and bandwidth define the speed and capacity of a link or system.
LED
Light Emitting Diode. Used on HP switches to indicate the status of various switch elements.
Link Services
A protocol for link-related actions.
Link
As applies to Fibre Channel, a physical connection between two ports, consisting of both transmit
and receive fibers.
See also Circuit.
LIP
Loop Initialization Primitive. The signal used to begin initialization in a loop. Indicates either loop
failure or resetting of a node.
LIS_HOLD_TIME
Loop Initialization Sequence Hold Time. The maximum period of time for a node to forward a
loop initialization sequence.
LM_TOV
Loop Master Time-out Value. The minimum time that the loop master waits for a loop initialization
sequence to return.
Login BB_Credit
The number of receive buffers a receiving L_Port has available when a circuit is first established.
See also BB_Credit.
Loop Circuit
A temporary bidirectional communication path established between L_Ports.
Page 72

Glossary
72 Advanced Performance Monitoring Version 3.1.x/4.1.x User Guide
Loop Failure
Loss of signal within a loop for any period of time, or loss of synchronization for longer than the
time-out value.
See also error.
Loop Initialization
The logical procedure used by an L_Port to discover its environment. Can be used to assign AL_PA
addresses, detect loop failure, or reset a node.
Loop_ID
A hex value representing one of the 127 possible AL_PA values in an arbitrated loop.
Looplet
A set of devices connected in a loop to a port that is a member of another loop.
LPSM
Loop Port State Machine. The logical entity that performs arbitrated loop protocols and defines the
behavior of L_Ports when they require access to an arbitrated loop.
LWL
Long Wavelength. A type of fiber optic cabling that is based on 1300-mm lasers and supports link
speeds of 1.0625 Gbps. May also refer to the type of GBIC or SFP.
See also SWL.
Master Port
As relates to trunking, the port that determines the routing paths for all traffic flowing through the
trunking group. One of the ports in the first ISL in the trunking group is designated as the master
port for that group.
See also ISL Trunking.
Media
See transceiver.
MIB
Management Information Base. An SNMP structure to help with device management, providing
configuration and device information.
Page 73

Glossary
73Advanced Performance Monitoring Version 3.1.x/4.1.x User Guide
Modem Serial Port
The upper serial port on the CP Card of the StorageWorks Core switch. Can be used to connect the
CP Card to a modem with a standard 9-pin modem cable. Consists of a DB-9 connector wired as a
RS-232 device, and can be connected by serial cable to a DCE device. A Hayes-compatible modem
or Hayes-emulation is required. The device name is ttyS1.
See also DB-9 connector, DCE port, terminal serial port.
Monitoring State
The state in which a port is monitoring the flow of information for data relevant to the port.
Multicast
The transmission of data from a single source to multiple specified N_Ports (as opposed to all the
ports on the network).
See also broadcast, unicast.
Multimode
A fiber optic cabling specification that allows up to 500 meters between devices for 1 Gb, or 300
meters between devices for 2 Gb.
N_Port
Node Port. A port on a node that can connect to a Fibre Channel port or to another N_Port in a
point-to-point connection.
See also NL_Port, Nx_Port.
NAA
Network Address Authority. An identifier that indicates the format of a network address.
Name Server
Frequently used to indicate Simple Name Server.
See also SNS.
Native Address Identifier
A unique, 64-bit address is assigned to each port, and is referred to as its World-Wide Name
(WWN). If a port connects to an arbitrated loop, it will also be assigned a dynamic 8-bit address,
referred to as its arbitrated loop physical address, or AL_PA. If it connects to a fabric, it will be
assigned a dynamic 24-bit address, referred to as its Native Address Identifier.
Negotiate
See auto-negotiate speed and autosense.
Page 74

Glossary
74 Advanced Performance Monitoring Version 3.1.x/4.1.x User Guide
NL_Port
Node Loop Port. A node port that has arbitrated loop capabilities. Used to connect an equipment
port to the fabric in a loop configuration through an FL_Port.
See also N_Port, Nx_Port.
Node Name
The unique identifier for a node, communicated during login and port discovery.
Node
A Fibre Channel device that contains an N_Port or NL_Port.
Non-participating Mode
A mode in which an L_Port in a loop is inactive and cannot arbitrate or send frames, but can
retransmit any received transmissions. This mode is entered if there are more than 127 devices in a
loop and an AL_PA cannot be acquired.
See also L_Port, Participating Mode.
Nx_Port
A node port that can operate as either an N_Port or NL_Port.
Open Originator
The L_Port that wins arbitration in an arbitrated loop and sends an OPN ordered set to the
destination port, then enters the Open state.
Open Recipient
The L_Port that receives the OPN ordered set from the open originator, and then enters the Open
state.
Open State
The state in which a port can establish a circuit with another port. A port must be in the Open state
before it can arbitrate.
OPN
Open Primitive Signal.
Page 75

Glossary
75Advanced Performance Monitoring Version 3.1.x/4.1.x User Guide
Ordered Set
A transmission word that uses 8B/10B mapping and begins with the K28.5 character. Ordered sets
occur outside of frames, and include the following items:
■ Frame delimiters: Mark frame boundaries and describe frame contents.
■ Primitive signals: Indicate events.
■ Primitive sequences: Indicate or initiate port states.
Ordered sets are used to differentiate Fibre Channel control information from data frames and to
manage the transport of frames.
Packet
A set of information transmitted across a network.
See also Frame.
Participating Mode
A mode in which an L_Port in a loop has a valid AL_PA and can arbitrate, send frames, and
retransmit received transmissions.
See also L_Port, Non-participating Mode.
Path Selection
The selection of a transmission path through the fabric. HP StorageWorks switches use the FSPF
protocol.
Performance Monitor
Comprehensive HP tool for monitoring the performance of networked storage resources.
Performance Monitoring
An HP product that provides error and performance information to the administrator and end user
for use in storage management.
Phantom Address
An AL_PA value that is assigned to an device that is not physically in the loop.
Also known as phantom AL_PA.
Phantom Device
A device that is not physically in an arbitrated loop, but is logically included through the use of a
phantom address.
PLOGI
Port Login. The port-to-port login process by which initiators establish sessions with targets.
See also FLOGI.
Page 76

Glossary
76 Advanced Performance Monitoring Version 3.1.x/4.1.x User Guide
Point-to-point
A Fibre Channel topology that employs direct links between each pair of communicating entities.
See also topology.
Port Cage
The metal casing extending out of the optical port on the switch, and in which the SFP can be
inserted.
Port Card
A Fibre Channel card that contains optical or copper port interfaces, and acts like a switch module.
See also 16-port card.
Port Module
A collection of ports in a switch.
Port_Name
The unique identifier assigned to a Fibre Channel port. Communicated during login and port
discovery.
POST
Power On Self-Test. A series of tests run by a switch after it is turned on.
Primary FCS Switch
Primary fabric configuration server switch. The switch that actively manages the configuration and
security parameters for all switches in the fabric.
See also backup FCS switch, FCS switch.
Private Device
A device that supports arbitrated loop protocol and can interpret 8-bit addresses, but cannot log
into the fabric.
Private Loop
An arbitrated loop that does not include a participating FL_Port.
Private NL_Port
An NL_Port that communicates only with other private NL_Ports in the same loop and does not
log into the fabric.
Protocol
A defined method and a set of standards for communication.
PSU
Power Supply Unit.
Page 77

Glossary
77Advanced Performance Monitoring Version 3.1.x/4.1.x User Guide
Public Device
A device that supports arbitrated loop protocol, can interpret 8-bit addresses, and can log into the
fabric.
Public Loop
An arbitrated loop that includes a participating FL_Port, and may contain both public and private
NL_Ports.
Public NL_Port
An NL_Port that logs into the fabric, can function within either a public or a private loop, and can
communicate with either private or public NL_Ports.
Quad
A group of four adjacent ports that share a common pool of frame buffers.
QuickLoop
An HP StorageWorks product that makes it possible to allow private devices within loops to
communicate with public and private devices across the fabric through the creation of a larger loop.
May also refer to the arbitrated loop created using this software. A QuickLoop can contain a
number of devices or looplets; all devices in the same QuickLoop share a single AL_PA space.
A means of allowing private hosts to communicate with private targets across a switched fabric.
The QuickLoop/Fabric Assist feature also allows:
■ Private hosts to communicate with public targets across a switched fabric
■ Private hosts to communicate with private targets that are not resident on the same switch
across a switched fabric
See also Fabric Access, fabric assist, and translative mode.
QuickLoop Zoning
Protects devices from disruption by unrelated devices during critical processes; for example,
during a tape backup session.
R_A_TOV
Resource Allocation Time-out Value. The maximum time a frame can be delayed in the fabric and
still be delivered.
See also E_D_TOV, RR_TOV.
R_RDY
Receiver ready. A primitive signal indicating that the port is ready to receive a frame.
Page 78

Glossary
78 Advanced Performance Monitoring Version 3.1.x/4.1.x User Guide
RAID
Redundant Array of Independent Disks. A collection of disk drives that appear as a single volume
to the server and are fault tolerant through mirroring or parity checking.
See also JBOD.
Remote Fabric
A fabric that spans across WANs by using protocol translation (a process also known as tunneling)
such as Fibre Channel over ATM or Fibre Channel over IP.
Remote Switch
Bridges two switches into a SAN as large as 3000KM or more through protocol encapsulation in
ATM networks via the Computer Network Technologies (CNT) UltraNet Open Systems Gateway.
Request Rate
The rate at which requests arrive at a servicing entity.
See also service rate.
RLS Probing
Read link status of the AL_PAs.
Root Account
A login used for debugging purposes by HP engineers and is not intended for customer use.
See also account level switches.
Route
As applies to a fabric, the communication path between two switches. May also apply to the
specific path taken by an individual frame, from source to destination.
See also FSPF.
Routing
The assignment of frames to specific switch ports, according to frame destination.
RR_TOV
Resource Recovery Time-out Value. The minimum time a target device in a loop waits after a LIP
before logging out a SCSI initiator.
See also E_D_TOV, R_A_TOV.
RS-232 port
A port that conforms to a set of Electrical Industries Association (EIA) standards. Used to connect
DTE and DCE devices for communication between computers, terminals, and modems.
See also DCE port, DTE port.
Page 79

Glossary
79Advanced Performance Monitoring Version 3.1.x/4.1.x User Guide
RSCN
Registered State Change Notification. A switch function that allows notification of fabric changes
to be sent from the switch to specified nodes.
RX_ID
Responder Exchange Identifier. A 2-byte field in the frame header used by the responder of the
Exchange to identify frames as being part of a particular exchange.
SAN
Storage Area Network. A network of systems and storage devices that communicate using Fibre
Channel protocols.
See also fabric.
SAN Switch
A switch whose main task is to connect nodes into the fabric.
See also core switch.
SCSI
Small Computer Systems Interface. A parallel bus architecture and protocol for transmitting large
data blocks to a distance of 15 - 25 meters.
SDRAM
Synchronous Dynamic Random Access Memory. The main memory for the switch. Used for
volatile storage during switch operation.
See also flash.
Sequence
A group of related frames transmitted in the same direction between two N_Ports.
Service Rate
The rate at which an entity can service requests.
See also request rate.
SFF
Small Form Factor.
SFP Cable
The latest innovation in high-speed copper cabling for Fibre Channel and InfiniBand. It
incorporates the SFP module directly onto the cable assembly, eliminating the need for a separate
SFP copper module and an HSSDC2 cable assembly.
Page 80

Glossary
80 Advanced Performance Monitoring Version 3.1.x/4.1.x User Guide
SFP
Small form factor pluggable. A transceiver used on 2 Gbps switches that replaces the GBIC. Refers
to the LC-form factor transceiver.
See also GBIC.
SID/DID
Source identifier/Destination identifier. S_ID is a 3-byte field in the frame header that is used to
indicate the address identifier of the N_Port from which the frame was sent.
Single Mode
The fiber optic cabling standard that, when used in conjunction with a 1300 nm laser light, can
transfer data up to 10 km between devices. When used in conjunction with a 1550 nm laser light,
single mode cabling can transfer data over 10 km.
See also multimode, LWL, ELWL, and XLWL.
SI
Sequence Initiative.
SNMP
Simple Network Management Protocol. An internet management protocol that uses either IP for
network-level functions and UDP for transport-level functions, or TCP/IP for both. Can be made
available over other protocols, such as UDP/IP, because it does not rely on the underlying
communication protocols.
See also Community (SNMP).
SNMPv1
The original SNMP, now labeled v1.
SNS
Simple Name Server. A switch service that stores names, addresses, and attributes for up to 15
minutes, and provides them as required to other devices in the fabric. SNS is defined by Fibre
Channel standards and exists at a well-known address. May also be referred to as directory service.
See also FS.
StorageWorks SAN switch
The brand name for the HP family of switches.
Switch Name
The arbitrary name assigned to a switch.
Switch Port
A port on a switch. Switch ports can be E_Ports, F_Ports, or FL_Ports.
Page 81

Glossary
81Advanced Performance Monitoring Version 3.1.x/4.1.x User Guide
Switch
Hardware that routes frames according to Fibre Channel protocol and is controlled by software.
SWL
Short Wavelength. A type of fiber optic cabling that is based on 850-mm lasers and supports
1.0625-Gbps link speeds. May also refer to the type of GBIC or SFP.
See also LWL.
Tachyon
A chip developed by Hewlett-Packard, and used in various devices. This chip has FC-0 through
FC-2 on one chip.
Target
A storage device on a Fibre Channel network.
See also Initiator.
Tenancy
The time from when a port wins arbitration in a loop until the same port returns to the monitoring
state. Also referred to as loop tenancy.
Terminal Serial Port
May also be referred to as the console port. The lower serial port on the CP Card of the
StorageWorks Core switch. This port sends switch information messages and can receive
commands. Can be used to connect the CP Card to a computer terminal. Has an RS-232 connector
wired as a DTE device, and can be connected by serial cable to a DCE device. The connector pins
two and three are swapped so that a straight-through cable can be used to connect to a terminal.
The device name is ttyS0.
See also DCE port, modem serial port.
Throughput
The rate of data flow achieved within a cable, link, or system. Usually measured in bps (bits per
second).
See also bandwidth.
Topology
As applies to Fibre Channel, the configuration of the Fibre Channel network and the resulting
communication paths allowed. There are three possible topologies:
■ Point to point: A direct link between two communication ports.
■ Switched fabric: Multiple N_Ports linked to a switch by F_Ports.
■ Arbitrated loop: Multiple NL_Ports connected in a loop.
Page 82

Glossary
82 Advanced Performance Monitoring Version 3.1.x/4.1.x User Guide
Transceiver
Device that converts one form of signaling to another for transmission and reception; in fiber
optics, it refers to optical and electrical.
Transfer State
The state in which a port can establish circuits with multiple ports without reentering the
arbitration cycle for each circuit. This state can only be accessed by an L_Port in the Open state.
Translative Mode
A mode in which private devices can communicate with public devices across the fabric.
Transmission Character
A 10-bit character encoded according to the rules of the 8B/10B algorithm.
Transmission Word
A group of four transmission characters.
See also data word.
Trap (SNMP)
The message sent by an SNMP agent to inform the SNMP management station of a critical error.
See also SNMP.
Trunking
See ISL Trunking.
Tunneling
A technique for enabling two networks to communicate when the source and destination hosts are
both on the same type of network, but are connected by a different type of network.
U_Port
Universal Port. A switch port that can operate as a G_Port, E_Port, F_Port, or FL_Port. A port is
defined as a U_Port when it is not connected or has not yet assumed a specific function in the
fabric.
UDP
User Datagram Protocol. A protocol that runs on top of IP and provides port multiplexing for
upper-level protocols.
ULP_TOV
Upper-level Time-out Value. The minimum time that a SCSI ULP process waits for SCSI status
before initiating ULP recovery.
Page 83

Glossary
83Advanced Performance Monitoring Version 3.1.x/4.1.x User Guide
ULP
Upper-level Protocol. The protocol that runs on top of Fibre Channel. Typical upper-level protocols
are SCSI, IP, HIPPI, and IPI.
Unicast
The transmission of data from a single source to a single destination.
See also broadcast, multicast.
user account
A login intended for use by the customer to monitor, but not control, switch operation.
See also account level switches.
VC
Virtual circuit. A one-way path between N_Ports that allows fractional bandwidth.
Web Tools
An HP product that runs on Fabric OS and provides a graphical interface to allow monitoring and
management of individual switches or entire fabrics from a standard workstation running a
browser.
Well-known Address
As pertaining to Fibre Channel, a logical address defined by the Fibre Channel standards as
assigned to a specific function, and stored on the switch.
Workstation
A computer used to access and manage the fabric. May also be referred to as a management station
or host.
WWN
World-Wide Name. An identifier that is unique worldwide. Each entity in a fabric has a separate
WWN.
XLWL
Xtra Long Wave Length. Laser light with a periodic length greater than 1300 nm (e.g., 1420 or
1550). XLWL lasers are used to transmit Fibre Channel data over distances greater than 10 Km.
Also known as ELWL.
Xmitted Close State
The state in which an L_Port cannot send messages, but can retransmit messages within the loop.
A port in the XMITTED CLOSE state cannot attempt to arbitrate.
Page 84

Glossary
84 Advanced Performance Monitoring Version 3.1.x/4.1.x User Guide
Zone
A set of devices and hosts attached to the same fabric and configured as being in the same zone.
Devices and hosts within the same zone have access permission to others in the zone, but are not
visible to any outside the zone.
See also Zoning.
Zone Alias
A name assigned to a device or group of devices in a zone. Aliases can greatly simplify the zone
administrative process.
See also alias.
Zone Configuration
A specified set of zones. Enabling a configuration enables all zones in that configuration.
See also defined zone configuration, enabled zone configuration.
Zone Member
A port, node, WWN, or alias, which is part of a zone.
Zone Schemes
The level of zoning granularity selected. For example, zoning may be done by switch/port, WWN,
AL_PA, or a mixture.
See also zone configuration.
Zone Set
See zone configuration.
Zoning
An HP product that runs on Fabric OS and allows partitioning of the fabric into logical groupings
of devices. Devices in a zone can only access and be accessed by devices in the same zone.
See also zone.
Page 85

85Advanced Performance Monitoring Version 3.1.x/4.1.x User Guide
index
Index
Index
A
adding
end-to-end monitors 39
filter-based monitors 46
AL_PA monitoring 35, 37
audience 8
authorized reseller, HP 11
C
clearing
CRC error count 38
end-to-end monitor counters 45
filter-based monitor counters 50
conventions
document 9
text symbols 9
CRC errors, displaying 37
D
definitions 15
deleting
end-to-end monitors 44
filter-based monitors 50
displaying
CRC error count 37
end-to-end mask 42
end-to-end monitors 43
filter-based monitors 48
document
conventions 9
related documentation 8
E
end-to-end monitoring 35, 38
end-to-end monitors
adding 39
clearing counters 45
deleting 44
displaying 43
displaying the mask 42
restoring configuration 51
saving configuration 51
setting a mask 41
F
filter-based monitoring 35, 45
filter-based monitors
adding 46
clearing counters 50
deleting 50
displaying 48
restoring configuration 51
saving configuration 51
G
getting help 11
graphs 27
H
help, obtaining 11
HP
authorized reseller 11
storage website 11
technical support 11
Page 86

Index
86 Advanced Performance Monitoring Version 3.1.x/4.1.x User Guide
L
license installation 17
M
mask for end-to-end monitors
displaying 42
setting 41
P
perfAddEEMonitor command 39
perfAddIPMonitor command 46
perfAddUserMonitor command 47
perfCfgRestore command 51
perfCfgSave command 51
perfClrAlpaCrc command 38
perfDelEEMonitor command 44
perfDelFilterMonitor command 50
performance graphs 27
perfSetPortEEMask command 41
perfShowAlpaCRC command 37
perfShowEEMonitor command 43
perfShowFilterMonitor command 48
perfShowPortEEMask command 42
R
related documentation 8
removing
end-to-end monitors 44
filter-based monitors 50
restoring monitor configuration 51
S
saving monitor configuration 51
setting mask for end-to-end monitors 41
standard filter-based monitors 46
supported switches 14
symbols in text 9
T
technical support, HP 11
terminology 15
text symbols 9
U
user-defined filter-based monitors 47
W
websites
HP storage 11
 Loading...