

Page 1

PolyServe MxS Oracle Database
Solution Pack Advanced I/O
Monitoring User’s Guide
February 2004
Page 2

Copyright © 2004 PolyServe, Inc.
Use, reproduction and distribution of this document and the software it describes are
subject to the terms of the software license agreement distributed with the product (“License
Agreement”). Any use, reproduction, or distribution of this document or the described
software not explicitly permitted pursuant to the License Agreement is strictly prohibited
unless prior written permission from PolyServe has been received. Information in this
document is not guaranteed to be accurate, is subject to change without notice, and does not
represent a commitment on the part of PolyServe.
PolyServe and the PolyServe logo are registered trademarks of PolyServe, Inc.
Oracle is a registered trademark of Oracle Corporation.
All other company, brand, and product names are trademarks or registered trademarks
of their respective companies and are hereby recognized.
Page 3

Contents
Advanced I/O Monitoring
Introduction . . . . . . . . . . . . . . . . . . . . . . . . . . . . . . . . . . . . . . . . . . . . . . . . . . .1
MxODM I/O Monitoring: Features at a Glance . . . . . . . . . . . . . . . . . . . . .2
Core Reporting Elements . . . . . . . . . . . . . . . . . . . . . . . . . . . . . . . . . . . . .2
Reporting Levels . . . . . . . . . . . . . . . . . . . . . . . . . . . . . . . . . . . . . . . . . . . .3
Special Reports. . . . . . . . . . . . . . . . . . . . . . . . . . . . . . . . . . . . . . . . . . . . . .3
MxODM I/O Monitoring: Configuration. . . . . . . . . . . . . . . . . . . . . . . . . . .4
MxODM I/O Monitoring: Practical Examples. . . . . . . . . . . . . . . . . . . . . . .6
Example 1 . . . . . . . . . . . . . . . . . . . . . . . . . . . . . . . . . . . . . . . . . . . . . . . . . .6
Example 2 . . . . . . . . . . . . . . . . . . . . . . . . . . . . . . . . . . . . . . . . . . . . . . . . . .7
Example 3 . . . . . . . . . . . . . . . . . . . . . . . . . . . . . . . . . . . . . . . . . . . . . . . . . .8
Example 4 . . . . . . . . . . . . . . . . . . . . . . . . . . . . . . . . . . . . . . . . . . . . . . . . . .8
Example 5 . . . . . . . . . . . . . . . . . . . . . . . . . . . . . . . . . . . . . . . . . . . . . . . . . .9
Example 6 . . . . . . . . . . . . . . . . . . . . . . . . . . . . . . . . . . . . . . . . . . . . . . . . .10
iii
Page 4

Advanced I/O Monitoring
Introduction
Oracle Database Administrators routinely include operating-system level
performance monitoring tools such as vmstat(8) and iostat(1) in their tuning
efforts. Combining Oracle-provided monitoring tools with these operatingsystem tools is usually sufficient in SMP environments hosting single, or very few,
database instances.
With the advent of Real Application Clusters (RAC) and powerful Intel-based
clustered servers, DBAs need I/O performance monitoring tools that are more
“cluster-aware.” With RAC, it is common to find large numbers of clustered
nodes hosting several different databases, each with several different instances
running on the various nodes—all sharing the Storage Area Network.
The thought of monitoring I/O performance of a many-database, many-instance,
many-node clustered environment is rightfully troublesome. Indeed, equipped
with only Oracle Enterprise Manager, Statspack, and GV$ tables and aided by
node-local I/O stats, today's DBAs are lacking for information. I/O information is
important in real-time, not only in periodic reports. Moreover, reports can be
overwhelming. Consider the fact that an 8-node cluster with six instances
accessing the
require eight separate Statspack reports to monitor fully.
PROD database and two instances accessing the DEV database will
While Statspack reports provide invaluable information, they are not sufficient to
monitor the real-time activity of several instances throughout a cluster. Although
GV$tables and Oracle Enterprise Manager help to round out the performance
monitoring stack from Oracle, there is much information missing in a clustered
environment.
1
Page 5

Advanced I/O Monitoring 2
The PolyServe MxS Oracle Database Solution Pack (MxODM) with the
mxodmstat(8) command is the perfect compliment to the performance
monitoring tools provided by Oracle Corporation.
MxODM I/O Monitoring: Features at a Glance
PolyServe has implemented the Oracle Disk Manager specification in the
MxODM product. Not only is MxODM a complete implementation of the ODM
specification with such features as asynchronous I/O, cluster keys, and atomic file
creation, it also contains a powerful advanced I/O performance monitoring
infrastructure that accumulates very rich, informative I/O statistics.
While typical system-level I/O tools such as iostat offer little more data than the
count of device read and write operations, blocks read and written, and response
times, MxODM offers information the DBA needs. In today's complex clustered
environments, information is much more valuable than raw data when it comes
to performance monitoring.
Core Reporting Elements
The MxODM I/O monitoring package provides the following basic I/O
performance information. These reported items are referred to as the Core
Reporting Elements:
• Number of File Read and Write Operations
• Read and Write throughput per second in Kilobytes
• Count of synchronous and asynchronous I/O operations
•I/O service times
•Percentages
Page 6

Advanced I/O Monitoring 3
Reporting Levels
The Core Reporting Elements can be provided at the following levels:
• Cluster-Wide Level
Provides aggregate information for all database instances on all nodes.
• Database Global Level
Limits information to a named database (e.g.,
PROD, DEV, FIN, DSS).
• Instance Level
Limits information to a named instance (e.g., P
).
DSS_6
ROD1, PROD8, DEV1, FIN4,
• Node Level
Limits information to a named node (e.g., rac1.acme.com, rac6.acme.com).
This information is the aggregate of all instance activity on the named node. In
the case where a node hosts instances accessing different databases (e.g.,
$ORACLE_SID=PROD1, $ORACLE_SID=DEV1), the Core Reporting Elements will
reflect the combined information for all instances on the named node.
Special Reports
Because MxODM has intimate understanding of Oracle file, process, and I/O
types, the mxodmstat(8) command offers very specialized reporting capabilities.
On complex clustered systems, it is nearly impossible to take a quick look at the
cluster-wide or per-instance activity for a given subsystem of the Oracle Server.
For instance, on an 8-node cluster with six
and Parallel Query Slaves (PQO) active on only nodes 1 through 4 on the
database, a DBA will find it extremely difficult to associate cluster-wide impact to
the PQO activity. Likewise, quickly determining the
PROD instances on nodes 1 through 6 is nearly impossible—without MxODM.
PROD instances, two Dev instances,
PROD
DBWR activity for only the
MxODM offers “canned” reporting that focuses on the following key Oracle
“subsystems:”
• Parallel Query Option (PQO). This query returns the Core Reporting Elements
for only the Parallel Query Option slaves (e.g., ora_p000_PROD1,
ora_p001_PROD3, etc.). This is an extremely beneficial set of information as it
Page 7

Advanced I/O Monitoring 4
allows DBAs to get a top-level view of the impact PQO is having on the
cluster, either as a whole or at the node level.
• Log Writer. This query focuses on only the lgwr processes and their activity at
the cluster level, database level, or node level. Because all of the Core
Reporting Elements can be returned in this query, it is very beneficial for DBAs
to maintain streaming output of this query showing lgwr activity at either the
cluster level or broken down by database, instance, or node.
• Database Writer. This query is also very helpful. It too can return all Core
Reporting Elements at all Reporting Levels. The special value it adds is to limit
reporting to only dbwr process activity. DBAs can glance at mxodmstat(8)
output and easily determine the average dbwr I/O service times for all
databases cluster-wide, or focus on specific databases, nodes, or instances.
MxODM I/O Monitoring: Configuration
To configure MxODM for Advanced I/O Statistics, you will need to set the
MxODM environment variables.
The MxODM I/O Monitoring feature relies on the proper configuration of the
$MXODM_DBNAME
statistics, this variable needs to be set in the environment of all processes
accessing the database, including SQL*Plus processes prior to starting a database
instance and processes that connect through Net Services listener processes.
1
environment variable. To provide accurate database-level
If the
$MXODM_DBNAME environment variable is not set, MxODM presumes
that the database name is a component of the
For example, if the values of
and
MXODM_DBNAME is NULL clusterwide, summary I/O statistics for both
ORACLE_SID in the matrix are “PROD1” and PROD2”
instances will be reportable via the default database name “
names in the matrix do not follow the typical convention of
ORACLE_SID environment variable.
PROD.” If Instance
DBNAMEn, where n is
the logical node number in the cluster, this default scheme will not be correct for
database-wide I/O monitoring. In this case, the $
MXODM_DBNAME variable must
be set.
1. MxODM I/O statistics are collected regardless of environment variable settings. It is crucial,
however, that these variables be set for proper attribution of statistics to the various reporting
categories (node-level, instance-level, database-level, and so on).
Page 8

Advanced I/O Monitoring 5
Environment variables are passed through the lsnrctl process to the listener
daemons. Hence, before starting a listener for the
set the
$ORACLE_SID and $MXODM_DBNAME environment variables. The
PROD database on a given node,
following example depicts a session starting a listener process that will accept a
connect request to access the
PROD database through the PROD1 instance. All
activity by server processes begat of this listener will be accounted for
accordingly.
Note that this requirement insists that specific listeners be configured to service
connects to each database on a given node. Instances started with the srvctl
command need to use the built-in method for passing environment variables.
That is, if a database Instance is not started with sqlplus (where
MXODM_DBNAME is set in the environment), and instead srvctl is used, the
MXODM_DBNAME environment variable can be passed to the Instance
background processes using the -t option of the srvctl command. For instance, the
following example will cause
Instance accessing the
PROD database. As such, this is a central point for setting
MXODM_DBNAME to be set to “PROD” in any
the environment for all nodes in the cluster.
$ srvctl setenv database -d PROD -t MXODM_DBNAME=PROD
You may also want to set the MxODM enviroment variable MXODM_APPNAME.
This environment variable offers additional monitoring functionality. It must be
passed to Oracle processes in the same manner as
$MXODM_APPNAME is essentially a free-form variable. An example of its use
$MXODM_DBNAME.
would be to facilitate the monitoring of a specific application module as opposed
to all of the activity within a database. For instance, prior to executing a program
that performs General Ledger activity,
$MXODM_DBNAME might be FIN. Other sessions accessing the FIN
while
database using an Accounts Payable program might set $
$MXODM_APPNAME could be set to GL,
MXODM_APPNAME to
AP. As such, monitoring I/O with the -D option set to FIN will report the
aggregate activity of all processes acessing FIN, but using mxodmstat with the -A
option set to GL will report the portion of FIN activity that is specific to the
processes that have
MXODM_APPNAME set to GL.
Page 9

Advanced I/O Monitoring 6
MxODM I/O Monitoring: Practical Examples
This section offers several practical examples of the powerful I/O monitoring
capability of the mxodmstat(8) command. The examples use a question and
answer format, where the answer includes an mxodmstat(8) command and its
output.
The system used for these examples was a six-node, dual-processor, Intel-based
cluster with PolyServe Matrix Server 2.1 and Oracle9i Real Application Clusters
version 9.2.0.4. There were two main databases on the cluster:
• BENCH. This database is a stress-testing environment used at PolyServe. It is
an
OLTP workload that exhibits realworld characteristics. The BENCH database
has four instances executing on nodes 1 through 4.
• DEV. This database contains a small application under development that
simulates capturing stock trading events. For this set of examples, there were
two instances accessing the
node 5 of the cluster and the
Having two databases, one with four instances and another with two instances, is
a good case for demonstrating the invaluable information that DBAs can obtain
with the mxodmstat(8) command.
DEV database. The DEV1 instance was executing on
DEV2 instance was on node 6.
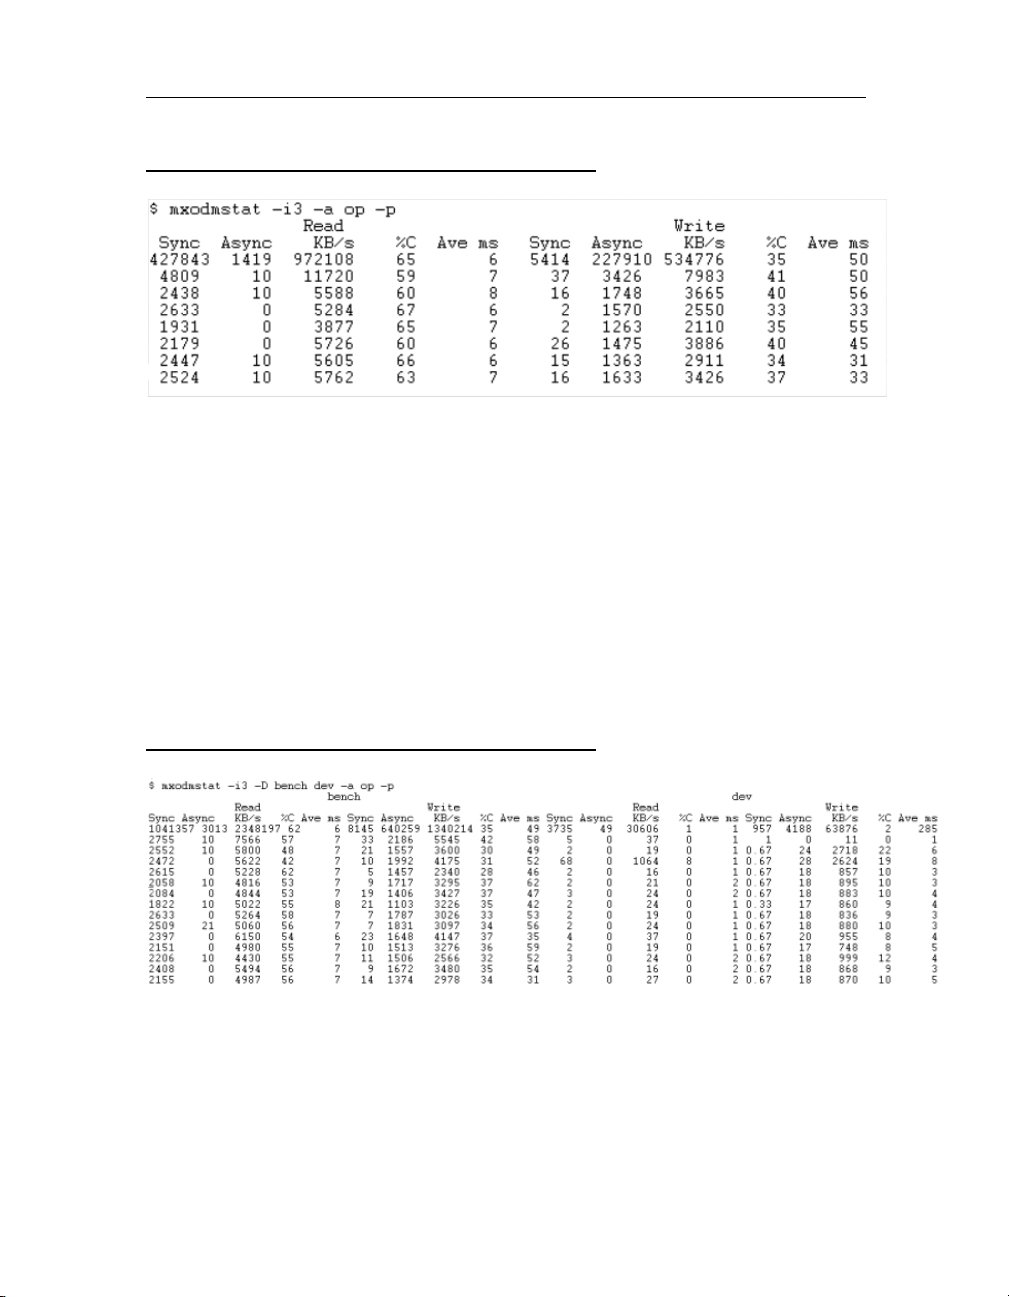
Example 1
Question: What is the cluster-wide read and write count, I/O throughput (Kbytes),
and average I/O response times with 3-second granularity? How about the readto-write ratio?
Answer: This information can be monitored with the -a and -p options of
mxodmstat(8). The op argument directs mxodmstat(8) to break out reads and
writes. When the -p option is supplied, the dataset is enhanced to show I/O
percentages. The I/O service times are also displayed in Millisecond units. Figure
1 shows an example.
Page 10
Advanced I/O Monitoring 7
Figure 1
Example 2
Question: How can I display the Core Reporting Elements broken out by database
with 3-second granularity?
Answer: The -D option supports monitoring a list of databases. In Figure 2, the
BENCH and DEV databases are being monitored as cluster-wide entities. As such,
the data under the “bench” column represents activity from all of the instances
accessing the “bench” database—in this case, four instances. For example, the last
line of output in Figure 2 shows that during a 3-second period, all instances
accessing the “bench” database performed a total of 2155 synchronous reads and
1374 asynchronous writes.
Figure 2
Page 11

Advanced I/O Monitoring 8
Example 3
Question: I have a very complex Oracle9i RAC environment. How can I get a
“birds-eye” view of cluster-wide Database Writer activity such as I/O response
times and what percentage is that of cluster-wide I/O?
Answer: Monitoring particular database “subsystems” such as Database Writer,
Log Writer, or PQO processes as entities is possible with the -Q option. In
Figure 3, -Q is specified without an accompanying -D option. Therefore, all
cluster-wide Database Writer activity is reported.
In this example case, the output represents the aggregate dbwr activity from four
BENCH instances and two DEV instances. This output is particularly helpful as it
allows a quick view into what percentage of all Oracle I/O is accounted for in
dbwr flushing activity, as well as what percentage of cluster-wide I/O that might
be. Troublesome I/O completion times for DBWR are also easily monitored.
Figure 3
Example 4
Question: It would be very convenient to have a breakout of cluster-wide single
and multi-block reads, Online Redo Log transfers, and Archive Log activity, but
only for the
Answer: This information can be obtained with the file argument to the -s option.
The columns reported with this set of mxodmstat(8) options are:
• SmallData. These are Oracle single-block transfers to/from datafiles. On Linux,
Oracle9i block sizes are limited to 16K. I/O reported under this column are
generally OLTP transfers (e.g., db file sequential read).
BENCH database. How can I do this?
Page 12

Advanced I/O Monitoring 9
• Large Data. I/O transfers of sizes greater than 16K are reported under this
column. Generally, these will be full table scan driven (e.g., db file scattered
read or direct path read,direct path write).
• OLG. This column is for Online Redo Log I/O activity (e.g.,
• ALG. This column is for Archived log activity (e.g.,
ARCH).
LGWR).
• Sort. This column tracks I/O operations to/from temporary tablespaces (e.g.,
sorting).
• Other. All activity not fitting the other types is tracked under this column (e.g.,
control file writes, etc.).
Figure 4 contains an example of the -s file option/argument pair.
Figure 4
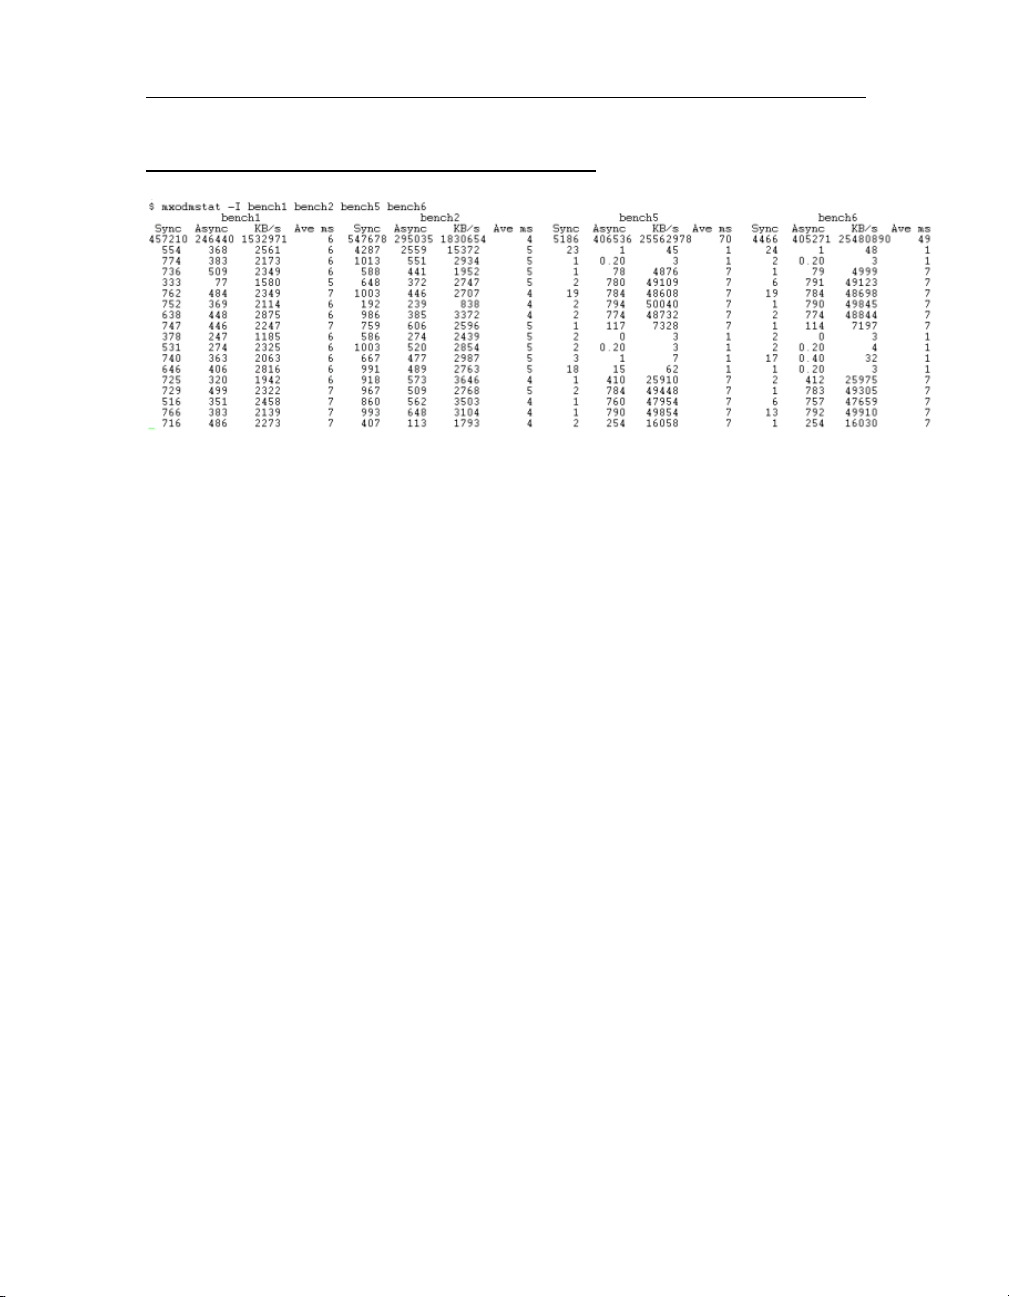
Example 5
Question: At fixed times during the week, the majority of my OLTP users are
limited to nodes 1 and 2. Nodes 5 and 6 have much more memory and are
configured for most of the large DSS and reporting activity. How can I monitor to
ensure that the very heavy I/O workload intended to run on nodes 5 and 6 is not
impacting I/O service times on the OLTP nodes?
Answer. Once again, the -I option should be used. Figure 5 depicts a perfect
example of this usage. The
performing a burst of asynchronous I/O up to 50MB/sec, yet the
BENCH2 instances are not showing substantial increase in I/O service times.
BENCH5 and BENCH6 instances are periodically
BENCH1 and
Page 13
Advanced I/O Monitoring 10
Figure 5
Example 6
Question: I have started a script on node 5 of the cluster which adds a large
amount of space to the
active on node 6. I'd like to monitor I/O activity of these two instances specifically
but they are instances from two different databases. How can I monitor this
activity?
Answer: The -I option returns instance-level information regardless of what
database is being accessed. Figure 6 show an example of reporting I/O activity on
two instances that access different databases.
BENCH database. There is also a DEV database instance
Page 14

Advanced I/O Monitoring 11
Figure 6
 Loading...