

T-1 (3 mm) High Intensity
LED Lamps
Technical Data
H
HLMP-132X Series
HLMP-142X Series
HLMP-152X Series
Features
• High Intensity
• Choice of 3 Bright Colors
High Efficiency Red
Yellow
High Performance Green
• Popular T-1 Diameter
Package
• Selected Minimum
Intensities
• Narrow Viewing Angle
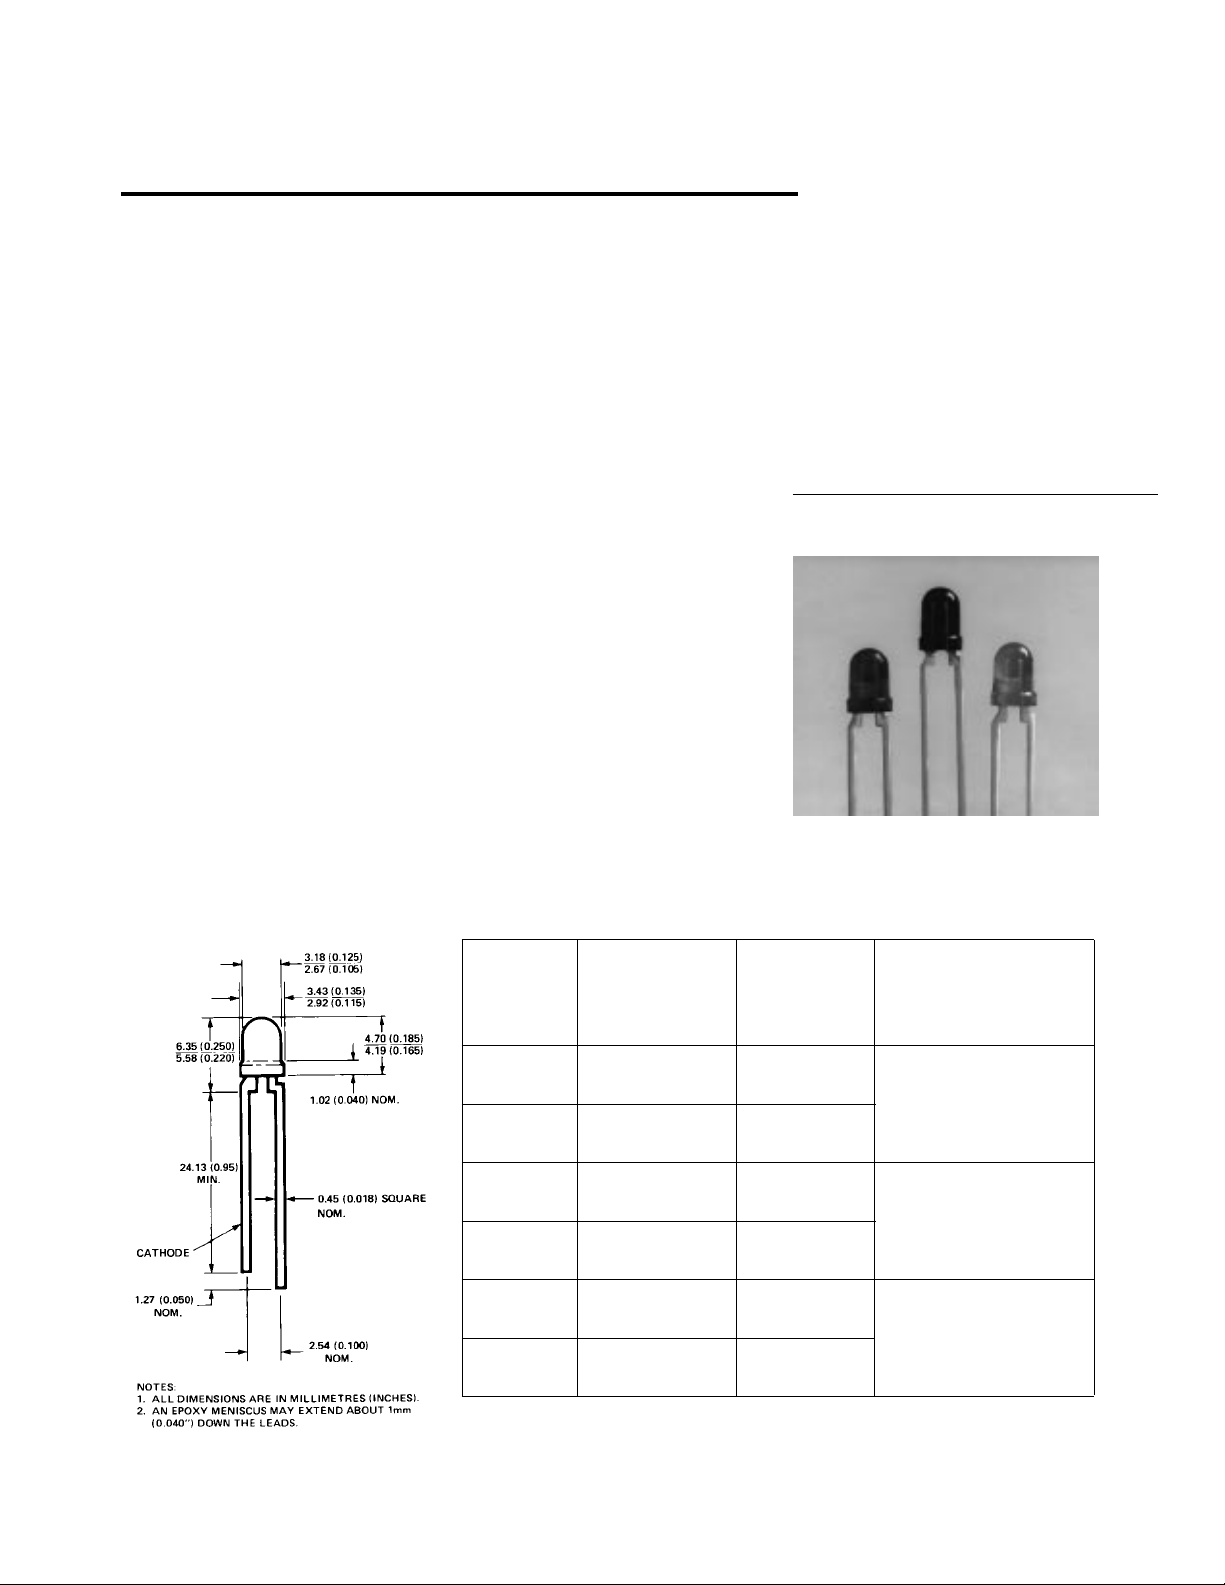
Package Dimensions
• General Purpose Leads
• Reliable and Rugged
• Available on Tape and Reel
Description
This family of T-1 lamps is
specially designed for applications requiring higher on-axis
intensity than is achievable with a
standard lamp. The light
generated is focused to a narrow
beam to achieve this effect.
Selection Guide
Minimum
Part Intensity
Number (mcd) at Color
HLMP- Description 10 mA (Material)
1320 Untinted 8.6 High Efficiency Red
Nondiffused (GaAsP on GaP)
1321 Tinted 8.6
Nondiffused
1-128
1420 Untinted 9.2 Yellow
Nondiffused (GaAsP on GaP)
1421 Tinted 9.2
Nondiffused
1520 Untinted 6.7 Green (GaP)
Nondiffused
1521 Tinted 6.7
Nondiffused
5964-9373E
Absolute Maximum Ratings at T
= 25°C
A
Parameter Red Yellow Green Units
Peak Forward Current 90 60 90 mA
Average Forward Current
DC Current
Power Dissipation
[2]
[3]
[1]
25 20 25 mA
30 20 30 mA
135 85 135 mW
Reverse Voltage (IR = 100 µA) 5 5 5 V
Transient Forward Current
[4]
500 500 500 mA
(10 µsec Pulse)
LED Junction Temperature 110 110 110 °C
Operating Temperature Range -55 to +100 -55 to +100 -20 to +100 °C
Storage Temperature Range -55 to +100
Lead Soldering Temperature 260°C for 5 seconds
[1.6 mm (0.063 in.) from body]
Notes:
1. See Figure 5 (Red), 10 (Yellow), or 15 (Green) to establish pulsed operating conditions.
2. For Red and Green series derate linearly from 50°C at 0.5 mA/°C. For Yellow series derate linearly from 50°C at 0.2 mA/°C.
3. For Red and Green series derate power linearly from 25°C at 1.8 mW/°C. For Yellow series derate power linearly from 50°C at
1.6 mW/°C.
4. The transient peak current is the maximum non-recurring peak current that can be applied to the device without damaging the LED
die and wirebond. It is not recommended that the device be operated at peak currents beyond the peak forward current listed in the
Absolute Maximum Ratings.
1-129

Electrical Characteristics at T
= 25°C
A
Device Test
Symbol Description HLMP- Min. Typ. Max. Units Conditions
I
Luminous Intensity 1320 8.6 30 mcd IF = 10 mA
V
1321 8.6 30 (Figure 3)
1420 9.2 15 mcd IF = 10 mA
1421 9.2 15 (Figure 8)
1520 6.7 22 mcd IF = 10 mA
1521 6.7 22 (Figure 3)
2θ1/2 Including Angle Between All 45 Deg. IF = 10 mA
Half Luminous Intensity See Note 1
Points (Figures 6, 11, 16, 21)
λ
PEAK
Peak Wavelength 132X 635 nm Measurement
142X 583 at Peak (Figure 1)
152X 565
∆λ
Spectral Line Halfwidth 132X 40 nm
1/2
142X 36
152X 28
λ
Dominant Wavelength 132X 626 nm See Note 2
d
142X 585 (Figure 1)
152X 569
τ
Speed of Response 132X 90 ns
s
142X 90
152X 500
C Capacitance 132X 11 pF VF = 0; f = 1 MHz
142X 15
152X 18
Rθ
Thermal Resistance All 290 °C/W Junction to
J-PIN
Cathode Lead
V
Forward Voltage 132X 1.9 2.4 V IF = 10 mA
F
142X 2.0 2.4
152X 2.1 2.7
V
Reverse Breakdown All 5.0 V IR = 100 µA
R
Voltage
η
Luminous Efficacy 132X 145 lumens See Note 3
V
142X 500 Watt
152X 595
Notes:
1. θ1/2 is the off-axis angle at which the luminous intensity is half the axial luminous intensity.
2. The dominant wavelength, λd, is derived from the CIE chromaticity diagram and represents the single wavelength which defines the
color of the device.
3. Radiant intensity, Ie, in watts/steradian, may be found from the equation Ie = lv/ηv, where lv is the luminous intensity in candelas and
ηv is the luminous efficacy in lumens/watt.
1-130
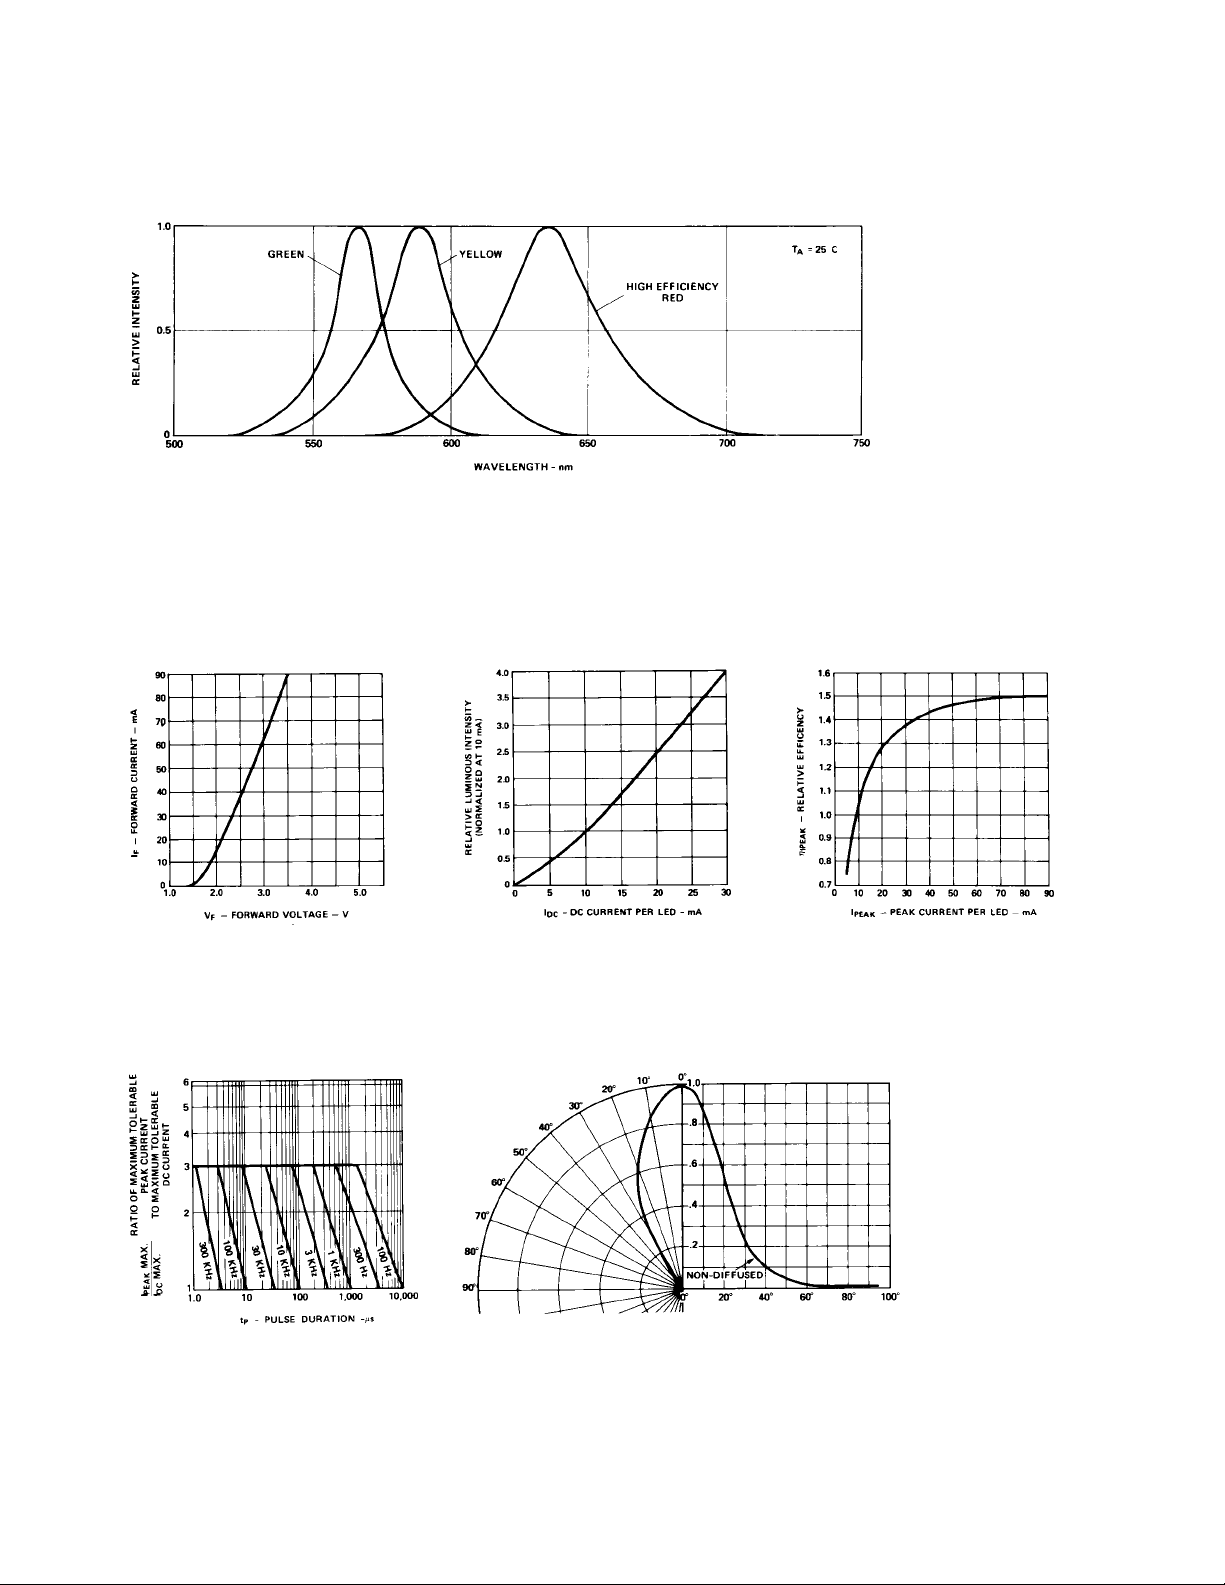
Figure 1. Relative Intensity vs. Wavelength.
T-1 High Efficiency Red Non-Diffused
Figure 2. Forward Current vs.
Forward Voltage Characteristics.
Figure 5. Maximum Tolerable Peak
Current vs. Pulse Duration. (IDC MAX
as per MAX Ratings).
Figure 3. Relative Luminous Intensity
vs. DC Forward Current.
Figure 6. Relative Luminous Intensity vs. Angular Displacement.
Figure 4. Relative Efficiency
(Luminous Intensity per Unit Current)
vs. Peak LED Current.
1-131

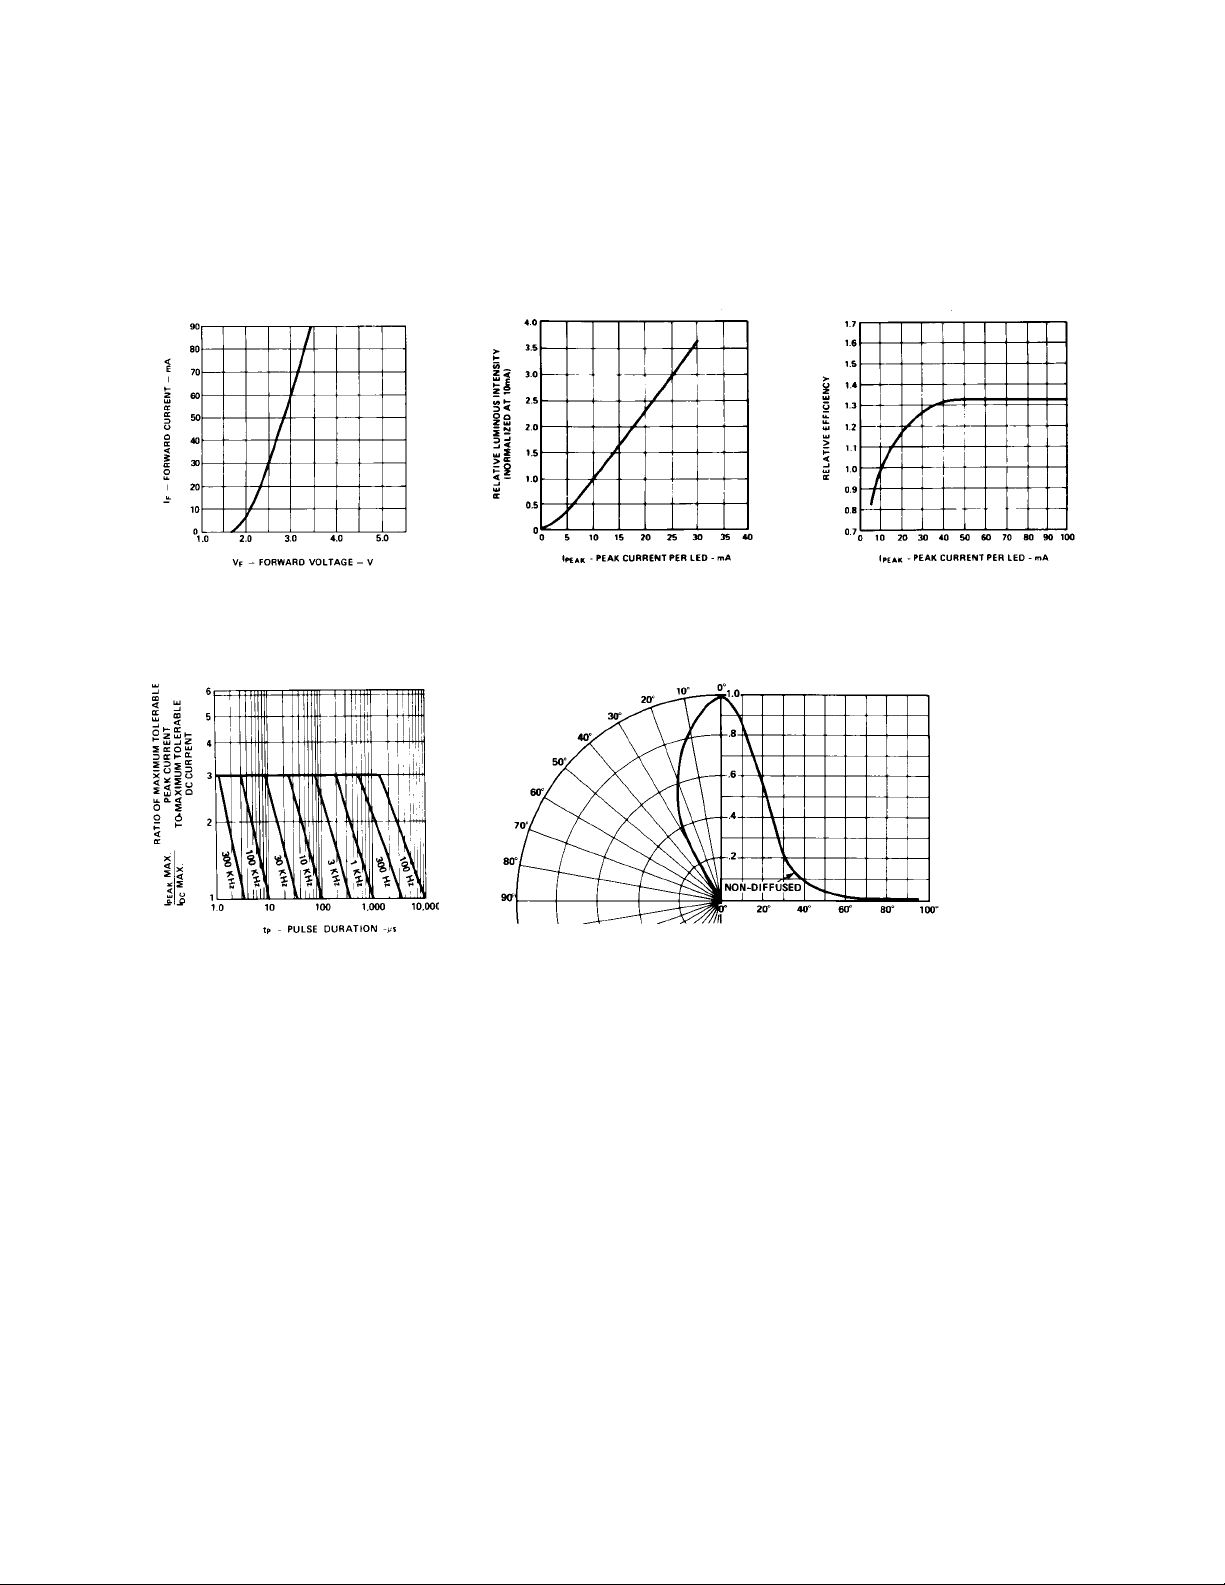
T-1 Yellow Non-Diffused
Figure 7. Forward Current vs.
Forward Voltage Characteristics.
Figure 10. Maximum Tolerable Peak
Current vs. Pulse Duration. (IDCMAX
as per MAX Ratings).
Figure 8. Relative Luminous Intensity
vs. Forward Current.
Figure 11. Relative Luminous Intensity vs. Angular Displacement.
Figure 9. Relative Efficiency
(Luminous Intensity per Unit Current)
vs. Peak Current.
1-132
T-1 Green Non-Diffused
Figure 12. Forward Current vs.
Forward Voltage Characteristics.
Figure 15. Maximum Tolerable Peak
Current vs. Pulse Duration. (I
per MAX Ratings).
DCMAX
Figure 13. Relative Luminous
Intensity vs. Forward Current.
Figure 16. Relative Luminous Intensity vs. Angular Displacement.
as
Figure 14. Relative Efficiency
(Luminous Intensity per Unit Current)
vs. Peak LED Current.
1-133
 Loading...