

Page 1

Java™ Troubleshooting Guide for HP-UX Systems
HP Part Number: 5992-1918
Published: July 2007
Edition: 3
Page 2

© Copyright 2007 Hewlett-Packard Development Company
Confidential computer software. Valid license from HP required for possession, use or copying. Consistent with FAR 12.211 and 12.212, Commercial
Computer Software, Computer Software Documentation, and Technical Data for Commercial Items are licensed to the U.S. Government under
vendor's standard commercial license. The information contained herein is subject to change without notice. The only warranties for HP products
and services are set forth in the express warranty statements accompanying such products and services. Nothing herein should be construed as
constituting an additional warranty. HP shall not be liable for technical or editorial errors or omissions contained herein. UNIX is a registered
trademark of The Open Group.
Page 3

Table of Contents
About This Document.......................................................................................................11
1 Diagnostic and Monitoring Tools and Options........................................................13
1.1 HP-UX Java Tools and Options Tables............................................................................................13
1.1.1 Crash Analysis Tools...............................................................................................................13
1.1.2 Hung and Deadlocked Processes............................................................................................13
1.1.3 Fatal Error Handling...............................................................................................................14
1.1.4 Monitoring Memory Use.........................................................................................................14
1.1.5 Performance Tools...................................................................................................................15
1.1.6 Miscellaneous Tools and Options...........................................................................................15
1.1.7 JDK Tools Not Available on HP-UX........................................................................................16
1.2 Ctrl-Break Handler..........................................................................................................................16
1.3 Fatal Error Log (hs_err_pid<pid>.log).............................................................................................17
1.4 gcore................................................................................................................................................18
1.5 gdb...................................................................................................................................................18
1.5.1 Java Stack Unwind Features....................................................................................................19
1.5.2 gdb Subcommands for Java VM Debugging..........................................................................19
1.6 HPjconfig ........................................................................................................................................21
1.7 HPjmeter .........................................................................................................................................24
1.7.1 Static Data Analysis.................................................................................................................26
1.7.1.1 Using HPjmeter to Analyze Profiling Data.....................................................................26
1.7.1.2 Using HPjmeter to Analyze Garbage Collection Data....................................................28
1.7.2 Dynamic Data Analysis...........................................................................................................28
1.7.2.1 Using HPjmeter to Monitor Applications.......................................................................28
1.7.2.2 Connect to the Node Agent From the HPjmeter Console...............................................29
1.7.2.3 Set Session Preferences....................................................................................................30
1.7.2.4 Viewing Monitoring Metrics During Your Open Session...............................................32
1.7.2.5 Running the HPjmeter Sample Programs.......................................................................32
1.7.2.5.1 Sample Memory Leak Application.........................................................................33
1.7.2.5.2 Sample Thread Deadlock Application....................................................................34
1.8 HPjtune............................................................................................................................................35
1.9 hat....................................................................................................................................................36
1.10 hprof..............................................................................................................................................36
1.11 java.security.debug System Property............................................................................................37
1.12 JAVA_TOOL_OPTIONS Environment Variable............................................................................37
1.13 jconsole (1.5+ only)........................................................................................................................38
1.14 jdb..................................................................................................................................................39
1.15 jhat.................................................................................................................................................39
1.16 jps (1.5+ only).................................................................................................................................40
1.17 jstat (1.5+ only)...............................................................................................................................40
1.18 jstatd (1.5+ only).............................................................................................................................41
1.19 jvmstat Tools..................................................................................................................................41
1.20 -verbose:class.................................................................................................................................42
1.21 -verbose:gc.....................................................................................................................................42
1.22 -verbose:jni.....................................................................................................................................42
1.23 visualgc..........................................................................................................................................42
1.24 -Xcheck:jni .....................................................................................................................................45
1.25 -Xverbosegc....................................................................................................................................46
1.26 -XX:ErrorFile..................................................................................................................................47
1.27 -XX:+HeapDump and _JAVA_HEAPDUMP Environment Variable............................................48
Table of Contents 3
Page 4

1.27.1 Other HeapDump Options....................................................................................................48
1.27.2 -XX:+HeapDumpOnCtrlBreak ..............................................................................................48
1.27.3 -XX:+HeapDumpOnOutOfMemoryError.............................................................................49
1.27.4 -XX:+HeapDumpOnly...........................................................................................................49
1.27.5 Using Heap Dumps to Monitor Memory Usage...................................................................49
1.28 -XX:OnError...................................................................................................................................49
1.29 -XX:+ShowMessageBoxOnError....................................................................................................50
2 Useful System Tools for Java Troubleshooting...........................................................51
2.1 GlancePlus.......................................................................................................................................51
2.2 tusc...................................................................................................................................................51
2.3 Prospect...........................................................................................................................................51
2.4 HP Caliper.......................................................................................................................................51
2.5 sar....................................................................................................................................................51
2.6 vmstat..............................................................................................................................................51
2.7 iostat................................................................................................................................................51
2.8 swapinfo..........................................................................................................................................52
2.9 top....................................................................................................................................................52
2.10 netstat.............................................................................................................................................52
2.11 Other Tools....................................................................................................................................52
3 Getting Help from Hewlett-Packard............................................................................53
3.1 Problem Report Checklist................................................................................................................53
3.2 Collecting Problem Data.................................................................................................................54
3.2.1 Collecting Core File Information.............................................................................................54
3.2.1.1 Core File Checklist..........................................................................................................54
3.2.1.1.1 Estimate Core File Size............................................................................................54
3.2.1.1.2 Ensure Process Can Write Large Core Files............................................................54
3.2.1.1.3 Verify Amount of Disk Space..................................................................................55
3.2.1.1.4 Check If Directory Supports Large File Systems....................................................55
3.2.1.1.5 Ensure Permissions Allow Core Files.....................................................................56
3.2.1.2 Generating a Core File.....................................................................................................56
3.2.1.3 Verifying a Core File........................................................................................................56
3.2.2 Collecting Fatal Error Log Information...................................................................................56
3.2.3 Collecting Stack Trace Information.........................................................................................57
3.3 Collecting System Information........................................................................................................58
3.4 Collecting Java Environment Information......................................................................................58
3.4.1 Environment Variables............................................................................................................58
3.4.2 Libraries...................................................................................................................................59
3.5 Packaging Files................................................................................................................................60
4 Core File Analysis........................................................................................................61
4.1 Sample Java Application.................................................................................................................61
4.1.1 StackTraceJob...........................................................................................................................61
4.1.2 StackTrace.java........................................................................................................................62
4.1.3 stacktrace.c...............................................................................................................................63
4.2 Building the Application.................................................................................................................64
4.3 Verify Core File................................................................................................................................65
4.4 Debugging On Same System...........................................................................................................65
4.5 Packaging Files For Debugging On Different System.....................................................................65
4.6 Unpacking Files On Debugging System.........................................................................................66
4.7 Example gdb Session.......................................................................................................................68
4.8 Summary.........................................................................................................................................73
4 Table of Contents
Page 5

Glossary............................................................................................................................75
Index.................................................................................................................................77
Table of Contents 5
Page 6

6
Page 7

List of Figures
1-1 HPjconfig - System Tab..................................................................................................................22
1-2 HPjconfig - Application Tab..........................................................................................................22
1-3 HPjconfig - Patches Tab.................................................................................................................23
1-4 HPjconfig - Tunables Tab...............................................................................................................23
1-5 HPjmeter - Profile Data.................................................................................................................27
1-6 HPjmeter - Threads/Locks Metrics................................................................................................27
1-7 HPjmeter - Garbage Collection Analysis.......................................................................................28
1-8 HPjmeter - Connecting to Server...................................................................................................30
1-9 HPjmeter - Setting Session Preferences.........................................................................................31
1-10 HPjmeter - Collecting Metrics.......................................................................................................31
1-11 HPjmeter - Choosing Metrics to Monitor......................................................................................32
1-12 HPjmeter - Memory Leak Alert.....................................................................................................33
1-13 HPjmeter - Heap Monitor Display................................................................................................34
1-14 HPjmeter - Thread Histogram.......................................................................................................35
1-15 HPjtune Screen..............................................................................................................................36
1-16 jconsole Screen...............................................................................................................................39
1-17 visualgc Application Information Window..................................................................................43
1-18 visualgc Graph Window...............................................................................................................44
1-19 visualgc Survivor Age Histogram Window..................................................................................45
7
Page 8

8
Page 9

List of Tables
1-1 Tools and Options for Crash Analysis...........................................................................................13
1-2 Tools and Options for Debugging Hung and Deadlocked Processes...........................................14
1-3 Options for Fatal Error Handling..................................................................................................14
1-4 Tools and Options for Monitoring Memory Use...........................................................................14
1-5 Performance Tools.........................................................................................................................15
1-6 Miscellaneous Tools and Options..................................................................................................15
1-7 JDK Tools Not Available on HP-UX..............................................................................................16
1-8 Java Version Information for gdb Java VM Debugging Features.................................................18
1-9 Java VM Debugging Commands...................................................................................................20
1-10 Java Subcommands.......................................................................................................................20
1-11 HPjmeter 3.0 Features....................................................................................................................25
1-12 Java SDKs and JDKs Supported by HPjmeter 3.0.........................................................................25
1-13 Options to the jstat Command......................................................................................................40
1-14 jstat — New Generation Statistics.................................................................................................41
1-15 Garbage Collection Field Information ..........................................................................................46
1-16 Overview of HeapDump Options.................................................................................................48
3-1 Libjunwind Library Location for PA-RISC Systems.....................................................................60
3-2 Libjunwind Library Location for Integrity Systems.....................................................................60
9
Page 10

10
Page 11

About This Document
The information in this document will help application developers and support engineers debug
their Java applications on HP-UX systems.
Intended Audience
This document is intended for application developers and support engineers who are debugging
Java applications on HP-UX systems. Note that some features described in this document are
only available on HP-UX systems.
New and Changed Information in This Edition
This is the third version of this document. It contains fixes to the second version as well as a new
chapter, which is a tutorial about analyzing core files.
Document Organization
This document contains four chapters:
Chapter 1: Diagnostic and Monitoring Tools and Options—This chapter provides information
on tools and options useful for Java troubleshooting on HP-UX.
Chapter 2: Useful System Tools for Java Troubleshooting—This chapter provides information
about HP-UX system tools to aide in Java troubleshooting.
Chapter 3: Getting Help from Hewlett-Packard—This chapter contains information about
collecting necessary data before opening a Java-related support call.
Chapter 4: Core File Analysis—This chapter contains a step by step tutorial for performing
core file analysis.
Typographic Conventions
This document uses the following typographical conventions:
%, $, or #
audit(5) A manpage. The manpage name is audit, and it is located in
Command
Computer output
Ctrl+x A key sequence. A sequence such as Ctrl+x indicates that you
ENVIRONMENT VARIABLE The name of an environment variable, for example, PATH.
[ERROR NAME]
Key The name of a keyboard key. Return and Enter both refer to the
Term The defined use of an important word or phrase.
User input
Variable
[] The contents are optional in syntax. If the contents are a list
A percent sign represents the C shell system prompt. A dollar
sign represents the system prompt for the Bourne, Korn, and
POSIX shells. A number sign represents the superuser prompt.
Section 5.
A command name or qualified command phrase.
Text displayed by the computer.
must hold down the key labeled Ctrl while you press another
key or mouse button.
The name of an error, usually returned in the errno variable.
same key.
Commands and other text that you type.
The name of a placeholder in a command, function, or other
syntax display that you replace with an actual value.
separated by |, you must choose one of the items.
11
Page 12

{} The contents are required in syntax. If the contents are a list
separated by |, you must choose one of the items.
... The previous element can be repeated an arbitrary number of
times.
Indicates the continuation of a code example.
| Separates items in a list of choices.
WARNING A warning calls attention to important information that if not
understood or followed will result in personal injury or
nonrecoverable system problems.
CAUTION A caution calls attention to important information that if not
understood or followed will result in data loss, data corruption,
or damage to hardware or software.
IMPORTANT This alert provides essential information to explain a concept or
to complete a task.
NOTE A note contains additional information to emphasize or
supplement important points of the main text.
Related Information
This document contains information specific to troubleshooting Java problems on HP-UX systems.
More information can also be found in the HP-UX Programmer's Guide for Java™ 2. In addition,
the Trouble-Shooting and Diagnostic Guide for Java 2 Platform, Standard Edition 5.0 and the
Troubleshooting Guide for Java SE 6 with HotSpot VMfrom Sun Microsystems also contain some
information that may be useful.
Publishing History
The document printing date and part number indicate the document’s current edition. The
printing date will change when a new edition is printed. Minor changes may be made at reprint
without changing the printing date. The document part number will change when extensive
changes are made. Document updates may be issued between editions to correct errors or
document product changes. To ensure that you receive the updated or new editions, you should
subscribe to the appropriate product support service. See your HP sales representative for details.
The latest version of this document is available online at:
http://www.docs.hp.com
Manufacturing Part
Number
Systems
Publication DateEdition NumberSupported VersionsSupported Operating
December 2006Edition 1Versions 1 and 2HP-UX 11i5991-7463
February 2007Edition 2Versions 1 and 2HP-UX 11i5992-0551
July 2007Edition 3Versions 1, 2, and 3HP-UX 11i5992-1918
HP Encourages Your Comments
HP encourages your comments concerning this document. We are committed to providing
documentation that meets your needs. Send any errors found, suggestions for improvement, or
compliments to:
feedback@fc.hp.com
Include the document title, manufacturing part number, and any comment, error found, or
suggestion for improvement you have concerning this document.
12 About This Document
Page 13

1 Diagnostic and Monitoring Tools and Options
This chapter describes the tools and options available for postmortem diagnostics, analysis of
hung/deadlocked processes, monitoring memory usage, and performance monitoring.
The tools and options are listed in tables by their respective functions in the first section of this
chapter. Many of them are listed in multiple tables since they can be used for multiple functions.
The tools and options are described in detail with examples, where applicable, in the remaining
sections of this chapter. All the tools and options described in this chapter are either included in
the Java 2 Platform Standard Edition Development Kit (JDK 1.5+), are included with
Hewlett-Packard's Java product, or are available for download at the Go Java! website:
http://www.hp.com/products1/unix/java
1.1 HP-UX Java Tools and Options Tables
The tools and options are categorized into the following table groupings:
• Crash Analysis Tools
• Hung and Deadlocked Processes
• Fatal Error Handling
• Monitoring Memory Use
• Performance Tools
• Miscellaneous Tools and Options
• JDK Tools Not Available on HP-UX
1.1.1 Crash Analysis Tools
Several of the options and tools described in this chapter are designed for postmortem diagnostics.
These are the options and tools that can be used to obtain additional information if an application
crashes. This analysis may either be done at the time of the crash or at a later time using
information from the core file. In addition to these tools, many other tools have features useful
for crash analysis.
Table 1-1 Tools and Options for Crash Analysis
wdb/gdb
Fatal Error Log (hs_err_pid<pid>.log)
-XX:OnError
-XX:+ShowMessageBoxOnError
Description and UsageTool or Option
An HP-supported implementation of the gdb debugger
that has Java support. For simplicity, this document will
refer to wdb/gdb as gdb from this point forward. gdb can
be used to attach to a running process.
Contains information obtained at the time of the crash.
Often one of the first pieces of data to examine when a
crash occurs.
Specify filename to use for the fatal error log.-XX:ErrorFile
Specify a sequence of user-supplied scripts or commands
to be executed when a crash occurs.
Suspend the process when a crash occurs. Depending on
the user response, it can launch the gdbgdb debugger to
attach to the Java VM.
1.1.2 Hung and Deadlocked Processes
The following options and tools can help you debug a hung or deadlocked process:
Java language debugger.jdb
1.1 HP-UX Java Tools and Options Tables 13
Page 14

Table 1-2 Tools and Options for Debugging Hung and Deadlocked Processes
Description and UsageTool or Option
wdb/gdb
HPjmeter
Ctrl-Break Handler
-XX:+HeapDump and _JAVA_HEAPDUMPEnvironment
Variable, starting with JDK 1.5.0.03 and SDK 1.4.2.10
1.1.3 Fatal Error Handling
The following options are useful for retrieving more information when fatal errors occur:
An HP-supported implementation of the gdb debugger
that has Java support. For simplicity, this document refers
to wdb/gdb as gdb from this point forward. gdb can be
used to attach to a running process.
Used to identify and diagnose performance problems in
Java applications running on HP-UX. It can also be used
to debug thread and heap issues.
Used to retrieve thread dump information. It also executes
a deadlock detection algorithm and reports any deadlocks
detected involving synchronized code. Heap dumps are
also generated beginning with JDK 1.5.0.05 and SDK
1.4.2.11 when the -XX:+HeapDumpOnCtrlBreak option
is specified.
Used to observe memory allocation in a running Java
application by taking snapshots of the heap over time. It
can be set by providing the -XX:+HeapDump option or
setting the _JAVA_HEAPDUMP environment variable.
Creates a core image of a running process.gcore (11.31 only)
Java language debugger.jdb
Table 1-3 Options for Fatal Error Handling
-XX:OnError
-XX:+ShowMessageBoxOnError
-XX:+HeapDumpOnOutOfMemoryError, starting with
SDK 1.4.2.11 and JDK 1.5.0.04
1.1.4 Monitoring Memory Use
The following options and tools are useful for monitoring memory usage of running applications:
Table 1-4 Tools and Options for Monitoring Memory Use
HPjmeter
HPjtune
Description and UsageOption
Used to specify a sequence of user-supplied scripts or
commands to be executed when a crash occurs.
Used to suspend the process when a crash occurs. After
the process is suspended, the user can use gdb to attach
to the Java VM.
Enables dumping of the heap when an out of memory
error condition occurs in the Java VM.
Description and UsageTool
Used to identify and diagnose performance problems in
Java applications by examining and monitoring the heap
and threads.
HP's garbage collection (GC) visualization tool for
analyzing garbage collection activity in a Java program.
-XX:+HeapDump and _JAVA_HEAPDUMPEnvironment
Variable, starting with JDK 1.5.0.03 and SDK 1.4.2.10
14 Diagnostic and Monitoring Tools and Options
Used to observe memory allocation in a running Java
application by taking snapshots of the heap over time. It
can be set by providing the -XX:+HeapDump option or
setting the _JAVA_HEAPDUMP environment variable.
Page 15

Table 1-4 Tools and Options for Monitoring Memory Use (continued)
Description and UsageTool
-Xverbosegc (HP only) and -verbose:gc
hat
jconsole (1.5+ only)
1.1.5 Performance Tools
The following tools are useful for identifying where the application spends its time. Some tools
allow you to monitor performance in real time (dynamic analysis) and other tools allow you to
analyze captured profiling data (static analysis):
Table 1-5 Performance Tools
HPjmeter
HPjtune
Used to enable logging of garbage collection information.
The HP-only -Xverbosegc option generates additional
GC information that is used by HPjtune. It is preferable
to use -Xverbosegc instead of -verbose:gc.
This third-party tool may be used to perform Java heap
analysis.
Used to monitor and manage an application launched
with a management agent on a local or remote machine.
Description and UsageTool
Use statically collected eprof data to understand where
the application is spending time. Use dynamic real-time
monitoring to identify performance issues.
HP's GC visualization tool for analyzing garbage
collection activity statically collected in a Java program.
jstat (1.5+ only)
jconsole (1.5+ only)
hprof
1.1.6 Miscellaneous Tools and Options
The following tools and options do not fall into any of the previous categories:
Table 1-6 Miscellaneous Tools and Options
JAVA_TOOL_OPTIONS Environment Variable
jvmstat Tools
visualgc
Attaches to the Java VM and collects and logs performance
statistics dynamically.
Launches a simple console tool enabling you to
dynamically monitor and manage an application launched
with a management agent on a local or remote machine.
Simple static profiler agent used for heap and CPU
profiling.
Description and UsageTool or Option
Used to augment the options specified in the Java
command line.
Tools include jps, jstat, and jstatd. These tools are
included with JDK 1.5+.
Uses jvmstat technology to provide visualization of
garbage collection activity in the Java VM.
Enables logging of class loading and unloading.-verbose:class
-Xcheck:jni
Enables logging of JNI (Java Native Interface).-verbose:jni
Performs additional validation on the arguments passed
to JNI functions.
1.1 HP-UX Java Tools and Options Tables 15
Page 16

1.1.7 JDK Tools Not Available on HP-UX
Some JDK tools are not available on HP-UX, so they are not described in this document. They
are provided in JavaSoft JDK as unsupported tools. Equivalent functionality is available via gdb
Java support, HPjmeter, and the HeapDump options.
Table 1-7 JDK Tools Not Available on HP-UX
Description and HP-UX AlternativeTool
jinfo
jmap
jstack
1.2 Ctrl-Break Handler
A thread dump is printed if the Java process receives a SIGQUIT signal. Therefore, issuing the
command kill -3 <pid> causes the process with id <pid> to print a thread dump to its
standard output. The application continues processing after the thread information is printed.
In addition to the thread stacks, the ctrl-break handler also executes a deadlock detection
algorithm. If any deadlocks are detected, the ctrl-break handler also prints out additional
information on each deadlocked thread. The SIGQUIT signal can also be used to print heap dump
information when using the -XX:+HeapDump or -XX:+HeapDumpOnCtrlBreak options
described further on in this chapter.
Following is an example of output generated when SIGQUIT is sent to a running Java process:
Full thread dump [Thu Oct 12 14:00:56 PDT 2006] (Java HotSpot(TM) Server
VM 1.5.0.03 jinteg:02.13.06-21:25 IA64 mixed mode):
"Thread-3" prio=10 tid=00a78480 nid=24 lwp_id=2669798 runnable [0bfc0000..0bfc0ae0]
at java.lang.Math.log(Native Method)
at spec.jbb.JBButil.negativeExpDistribution(JBButil.java:795)
at spec.jbb.TransactionManager.go(TransactionManager.java:234)
at spec.jbb.JBBmain.run(JBBmain.java:258)
at java.lang.Thread.run(Thread.java:595)
"Thread-2" prio=2 tid=009fb7a0 nid=23 lwp_id=2669797 runnable [0c1c0000..0c1c0b60]
at spec.jbb.Order.dateOrderlines(Order.java:341)
- waiting to lock <444ba618> (a spec.jbb.Order)
at spec.jbb.DeliveryTransaction.process(DeliveryTransaction.java:213)
at spec.jbb.DeliveryHandler.handleDelivery(DeliveryHandler.java:103)
at spec.jbb.DeliveryTransaction.queue(DeliveryTransaction.java:363)
- locked <154927e8> (a spec.jbb.DeliveryTransaction)
at spec.jbb.TransactionManager.go(TransactionManager.java:431)
at spec.jbb.JBBmain.run(JBBmain.java:258)
at java.lang.Thread.run(Thread.java:595)
"Thread-1" prio=10 tid=008ffa80 nid=22 lwp_id=2669796 runnable [0c3c0000..0c3c0de0]
at spec.jbb.infra.Collections.longStaticBTree.get(longStaticBTree.java:1346)
at spec.jbb.Warehouse.retrieveStock(Warehouse.java:307)
at spec.jbb.Orderline.validateAndProcess(Orderline.java:341)
- locked <48563610> (a spec.jbb.Orderline)
at spec.jbb.Order.processLines(Order.java:289)
- locked <48563128> (a spec.jbb.Order)
at spec.jbb.NewOrderTransaction.process(NewOrderTransaction.java:282)
at spec.jbb.TransactionManager.go(TransactionManager.java:278)
at spec.jbb.JBBmain.run(JBBmain.java:258)
at java.lang.Thread.run(Thread.java:595)
"Thread-0" prio=2 tid=00781240 nid=21 lwp_id=2669795 runnable [0c5c0000..0c5c0e60]
at spec.jbb.infra.Util.DisplayScreen.privIntLeadingZeros(DisplayScreen.java:448)
at spec.jbb.infra.Util.DisplayScreen.putDollars(DisplayScreen.java:1214)
at spec.jbb.NewOrderTransaction.secondDisplay(NewOrderTransaction.java:416)
- locked <154d4828> (a spec.jbb.NewOrderTransaction)
at spec.jbb.TransactionManager.go(TransactionManager.java:279)
at spec.jbb.JBBmain.run(JBBmain.java:258)
Prints Java configuration information for a given Java
process, core file, or remote debug server.
Prints shared object memory maps or Java heap memory
details of a given process, core file, or remote debug
server. Use the HeapDump options or gdb heap dump
functionality instead.
Prints a Java stack trace of Java threads for a given Java
process, core file, or remote debug server. Use gdb stack
trace back functionality instead.
Not yet ported to HP-UX.Serviceability Agent (SA)
16 Diagnostic and Monitoring Tools and Options
Page 17

at java.lang.Thread.run(Thread.java:595)
"Low Memory Detector" daemon prio=10 tid=00778b80 nid=19 lwp_id=2669774 runnable [00000000..00000000]
"CompilerThread1" daemon prio=10 tid=00772c30 nid=17 lwp_id=2669772 waiting on condition [00000000..0a7ff728]
"CompilerThread0" daemon prio=10 tid=007703f0 nid=16 lwp_id=2669771 waiting on condition [00000000..0afff5b8]
"AdapterThread" daemon prio=10 tid=0076c8d0 nid=15 lwp_id=2669770 waiting on condition [00000000..00000000]
"Signal Dispatcher" daemon prio=10 tid=0076a2e0 nid=14 lwp_id=2669769 waiting on condition [00000000..00000000]
"Finalizer" daemon prio=10 tid=00530a60 nid=13 lwp_id=2669768 in Object.wait() [750c0000..750c0e60]
at java.lang.Object.wait(Native Method)
- waiting on <11000100> (a java.lang.ref.ReferenceQueue$Lock)
at java.lang.ref.ReferenceQueue.remove(ReferenceQueue.java:133)
- locked <11000100> (a java.lang.ref.ReferenceQueue$Lock)
at java.lang.ref.ReferenceQueue.remove(ReferenceQueue.java:149)
at java.lang.ref.Finalizer$FinalizerThread.run(Finalizer.java:197)
"Reference Handler" daemon prio=10 tid=0052de80 nid=12 lwp_id=2669767 in Object.wait() [752c0000..752c0ce0]
at java.lang.Object.wait(Native Method)
- waiting on <11003dc8> (a java.lang.ref.Reference$Lock)
at java.lang.Object.wait(Object.java:474)
at java.lang.ref.Reference$ReferenceHandler.run(Reference.java:123)
- locked <11003dc8> (a java.lang.ref.Reference$Lock)
"main" prio=8 tid=0047dc90 nid=1 lwp_id=-1 waiting on condition [7fffd000..7fffe398]
at java.lang.Thread.sleep(Native Method)
at spec.jbb.JBButil.SecondsToSleep(JBButil.java:740)
at spec.jbb.Company.displayResultTotals(Company.java:942)
at spec.jbb.JBBmain.DoARun(JBBmain.java:387)
at spec.jbb.JBBmain.DOIT(JBBmain.java:1137)
at spec.jbb.JBBmain.main(JBBmain.java:1490)
"VM Thread" prio=10 tid=004ff510 nid=11 lwp_id=2669766 runnable
"GC task thread#0 (ParallelGC)" prio=10 tid=004d0520 nid=3 lwp_id=2669758 runnable
"GC task thread#1 (ParallelGC)" prio=10 tid=004d0600 nid=4 lwp_id=2669759 runnable
"GC task thread#2 (ParallelGC)" prio=10 tid=004d06e0 nid=5 lwp_id=2669760 runnable
"GC task thread#3 (ParallelGC)" prio=10 tid=004d07c0 nid=6 lwp_id=2669761 runnable
"GC task thread#4 (ParallelGC)" prio=10 tid=004d08a0 nid=7 lwp_id=2669762 runnable
"GC task thread#5 (ParallelGC)" prio=10 tid=004d0980 nid=8 lwp_id=2669763 runnable
"GC task thread#6 (ParallelGC)" prio=10 tid=004d0a60 nid=9 lwp_id=2669764 runnable
"GC task thread#7 (ParallelGC)" prio=10 tid=004d0b40 nid=10 lwp_id=2669765 runnable
"VM Periodic Task Thread" prio=8 tid=00500ad0 nid=18 lwp_id=2669773 waiting on condition
1.3 Fatal Error Log (hs_err_pid<pid>.log)
When a fatal error occurs, an error log is created in the file hs_err_pid<pid>.log, where
<pid> is the process id of the process. The file is created in the working directory of the process,
if possible. In the event that the file cannot be created in the working directory (for example, if
there is insufficient space, a permission problem, or another issue), then the file is created in the
temporary directory,/tmp. The error log contains information obtained at the time of the fatal
error. This includes :
• Operating exception or signal that provoked the fatal error
• Version and configuration information
• Details on the thread that provoked the fatal error and its stack trace
• List of running threads and their states
• Summary information about the heap
• List of native libraries loaded
• Command-line arguments
• Environment variables
• Details about the operating system and CPU
In some cases, only a subset of this information is output to the error log. This happens when a
fatal error is so severe that the error handler is unable to recover and report all details.
1.3 Fatal Error Log (hs_err_pid<pid>.log) 17
Page 18

1.4 gcore
The gcore command creates a core image of a running process. By default, the name of the core
file for a process-id will be core.process-id. The process information in the core image can be
obtained by using gdb or other debuggers.
When gcore creates a core image of each specified process, the process is temporarily stopped.
When the creation of the core image is complete, the process continues to execute.
This command is only available on HP-UX 11.31.
1.5 gdb
Java stack unwind enhancements have been added to gdb to enable it to support unwinding
across Java frames and provide an effective way to examine stack traces containing mixed
language frames (Java and C/C++) of both live Java processes and core files. This has been
implemented by adding subcommands for Java VM debugging to gdb.
The following table shows which Java versions on PA-RISC and Integrity systems have the stack
unwind and the gdb Java subcommands features. These features are available in gdb version
4.5 and later versions.
Table 1-8 Java Version Information for gdb Java VM Debugging Features
Platform
Enhancements
-pa11 (PA_RISC)
(PA_RISC2.0)
(PA_RISC2.0W)
(IA64N)
(IA64W)
(IA64N), 64-bit
(IA64W)
(IA64N), 64-bit
(IA64W)
GDB VersionJava SubcommandsStack Unwind
4.5+SDK 1.4.1.05+SDK 1.3.1.02+PA-RISC 32-bit
4.5+SDK 1.4.1.05+SDK 1.3.1.02+PA-RISC 32-bit
4.5+SDK 1.4.1.05+SDK 1.4.1.01+PA-RISC 64-bit
4.5–5.2SDK 1.4.1.05+SDK 1.3.1.06+Integrity 32-bit
4.5–5.2SDK 1.4.1.05+SDK 1.4.0.01+Integrity 64-bit
*5.3+SDK 1.4.2.10+SDK 1.4.2.10+Integrity 32
*5.3+JDK 1.5.0.03+JDK 1.5.0.03+Integrity 32
*gdb version 5.3 requires SDK 1.4.2.10 and later versions or JDK 1.5.0.03 and later versions in
order to use the Java VM debugging features.
In order to use this functionality, the GDB_JAVA_UNWINDLIB environment variable must be set
to the path name of the Java unwind library. The default location of the Java unwind library on
various systems is shown following. The examples are for SDK 1.4; if you are using JDK 1.5,
substitute /opt/java1.5 for /opt/java1.4.
/opt/java1.4/jre/lib/PA_RISC/server/libjunwind.sl
/opt/java1.4/jre/lib/PA_RISC2.0/server/libjunwind.sl
/opt/java1.4/jre/lib/PA_RISC2.0W/server/libjunwind.sl
/opt/java1.4/jre/lib/IA64N/server/libjunwind.so
/opt/java1.4/jre/lib/IA64W/server/libjunwind.so
Following are a few examples. If you are using ksh on a PA-RISC machine, this is how you set
the environment variable for a 32–bit Java application:
export GDB_JAVA_UNWINDLIB=/opt/java1.4/jre/lib/PA_RISC2.0/server/libjunwind.sl
18 Diagnostic and Monitoring Tools and Options
Page 19

Additionally, this is how you set the environment variable on an Integrity machine for a 32–bit
Java application:
export GDB_JAVA_UNWINDLIB=/opt/java1.4/jre/lib/IA64N/server/libjunwind.so
If the SDK is installed in a location other than the default, substitute the non-default location for
/opt/java1.4 in the previous commands.
1.5.1 Java Stack Unwind Features
The Java stack unwind features are useful for troubleshooting problems in the Java VM. Following
is a list of the Java stack unwind features:
• View mixed language frames information, including Java frames and C/C++ native frames,
in a gdb backtrace.
• Distinguish various Java frame types including interpreted, compiled, and adapter frames.
• View Java method name, signature, and class package name for Java method frames.
Additional stack unwind features are available starting with SDK 1.4.2. These features fall into
three categories: Java stack unwind enhancements, Java heap support, and Java threads support.
These additional features are available as part of the Java stack unwind enhancements:
• View Java compiled frame inlined methods.
• View Java interpreted or compiled frame specific information.
• View Java interpreted or compiled frame arguments and local variables.
• Disassemble Java method bytecodes.
• Print out the Java unwind table.
These additional features are available as part of the Java heap support:
• View Java heap parameters.
• Dump Java object.
• Print Java heap histogram.
• Find all the instances of a given Java class.
• Find all the references to a given object in the Java heap.
• Find out the object OOP (object-oriented pointer) of the given field address.
These additional features are available as part of Java threads support:
• View Java threads state information.
• View current Java thread information.
• View Java interpreted frame monitors information.
1.5.2 gdb Subcommands for Java VM Debugging
To view the gdb commands that support Java VM debugging, type help java at the gdb
prompt.
(gdb) help java
Java and JVM debugging commands.
List of java subcommands:
java args -- Show the current or specified Java frame arguments info
java bytecodes -- Disassemble the given Java method's bytecodes
java heap-histogram -- Show the Java heap object histogram
java instances -- Find all the instances of the given klassOop in the Java heap
java jvm-state -- Show Java virtual machine's current internal states
java locals -- Show the current or specified Java frame locals info
java mutex-info -- Print out details of the static mutexes
java object -- Print out the given Java object's fields info
java oop -- Find the Java object oop of the given Java heap address
java references -- Find all the references to the given Java object in the Java heap
java unwind-info -- Show the unwind info of the code where the given pc is located
java unwind-table -- Print out the dynamically generated Java Unwind Table
1.5 gdb 19
Page 20

Type "help java" followed by java subcommand name for full documentation.
Command name abbreviations are allowed if unambiguous.
The following two tables list Java VM debugging commands and Java subcommands:
Table 1-9 Java VM Debugging Commands
backtrace
info frame
info threads
thread
Print backtrace of mixed Java and native frames
Print Java frame specific information if this is a Java frame
Print state information for all threads
Print detailed state information for the current thread
Table 1-10 Java Subcommands
java args
java bytecodes
java heap-histogram
java instances
java jvm-state
java locals
java object
java oop
java references
java unwind-info
Show the current or specified Java frame arguments information
Disassemble the given Java method's bytecodes
Show the Java heap object histogram
Find all the instances of the given klassOop in the Java heap
Show the current internal state of the Java VM
Show the current or specified Java frame locals information
Print the given Java object's fields information
Find the Java object OOP of the given Java heap address
Find all the references to the given Java object in the Java heap
Show the unwind information of the code where the given pc is located
java unwind-table
Print the dynamically generated Java unwind table
Type help java followed by the subcommand name for full documentation. Command name
abbreviations are allowed if they are unambiguous.
Following are examples that illustrate the gdb command-line options for invoking gdb on a core
file and on a hung process.
The first set of examples illustrate how to invoke gdb on a core file:
• Invoke gdb on a core file generated when running a 32-bit Java application on an Integrity
system with /opt/java1.4/bin/java:
$ gdb /opt/java1.4/bin/IA64N/java core.java
• Invoke gdb on a core file generated when running a 64-bit Java application on an Integrity
system with /opt/java1.4/bin/java -d64:
$ gdb /opt/java1.4/bin/IA64W/java core.java
• Invoke gdb on a core file generated when running a 32-bit Java application on PA-RISC
using /opt/java1.4/bin/java:
$ gdb /opt/java1.4/bin/PA_RISC2.0/java core.java
• Invoke gdb on a core file generated when running a 64-bit Java application on PA-RISC
using /opt/java1.4/bin/java:
$ gdb /opt/java1.4/bin/PA_RISC2.0W/java core.java
When debugging a core file, it is good practice to rename the file from core to another name to
avoid accidentally overwriting it.
20 Diagnostic and Monitoring Tools and Options
Page 21

If the Java and system libraries used by the failed application reside in non-standard locations,
then the GDB_SHLIB_PATH environment variable must be set to specify the location of the
libraries.
The following example illustrate how to invoke gdb on a hung process:
• Determine the process id:
$ ps -u user1 | grep java
23989 pts/9 8:52 java
• Attach gdb to the running process:
$ gdb -p 23989
HP gdb 5.0 for HP Itanium (32 or 64 bit) and target HP-UX 11.2x.
Copyright 1986 - 2001 Free Software Foundation, Inc.
Hewlett-Packard Wildebeest 5.0 (based on GDB) is covered by the
GNU General Public License.Type "show copying" to see the conditions to
change it and/or distribute copies. Type "show warranty" for
warranty/support.
Reading symbols from /opt/java1.4/bin/IA64N/java...
(no debugging symbols found)...done.
Attaching to program: /opt/java1.4/bin/IA64N/java, process 23989
(no debugging symbols found)...
Reading symbols from /usr/lib/hpux32/libpthread.so.1...
(no debugging symbols found)...done.
Reading symbols from /usr/lib/hpux32/libdl.so.1...
...
NOTE: If the version of gdb on the system is older than version 4.5, it will be necessary to
specify the full path of the Java executable in order to use the gdb subcommands. For example:
gdb /opt/java1.4/bin/PA_RISC2.0/java –p 23989
A tutorial on gdb may be found at the following website:
http://h21007.www2.hp.com/dspp/tech/tech_TechDocumentDetailPage_IDX/1,1701,1677,00.html
1.6 HPjconfig
HPjconfig is a configuration tool for tuning your HP-UX 11i system to match the characteristics
of your application. It provides kernel parameter recommendations tailored to your HP-UX
hardware platform and application characteristics. HPjconfig has features for saving and
restoring configurations so you can distribute customized recommendations across your customer
base.
HPjconfig can also be used to verify that your systems has all the necessary patches required
for Java. The patches required for Java can be found at the following website:
http://www.hp.com/products1/unix/java/patches
HPjconfig runs on SDK 1.3.1 and later versions, SDK 1.4.x, and JDK 1.5.0.x. HP-UX 11.00 or
later versions is required. All HP-UX 11i HP Integrity and HP 9000 PA-RISC systems are
supported.
For more information about HPjconfig including the download, go to:
http://www.hp.com/products1/unix/java/java2/hpjconfig/index.html
HPjconfig can be run in either graphical user interface (GUI) mode or non-GUI (command-line)
mode. In either mode, it generates a summary of the configuration information in the log file
named HPjconfig_<hostname>_<date>_<timestamp>.log. This log file name can be
specified using the -logfile option.
Following is usage information for the HPjconfig command:
usage:
HPjconfig [ options ] -gui
1.6 HPjconfig 21
Page 22
HPjconfig [ options ] <object> <action>
objects: -patches &| -tunables
actions: -listreq | -listmis | -listpres | -apply
options:
-patches operate on java-specific patches
-tunables operate on java-specific tunables
-listreq list all java required patches or tunables that are applicable to this system
-listmis list missing java-specific patches or tunables on the system
-listpres list applied (installed) java-specific patches or tunables on the system
-apply apply (install) missing java-specific patches or tunables on the system
-javavers s java versions for selecting patches e.g 1.2, 1.3, 1.4, 5.0
-[no]gui run in GUI mode
-logfile s name of log file
-proxyhost s HTTP proxy host name for accessing live data
-proxyport s HTTP proxy port for accessing live data
-help show help string and exit
-version show version string
Following are examples of invoking HPjconfig in GUI mode from the csh and the ksh:
(csh) $ setenv DISPLAY <Display's IP Address>:0.0
$ setenv PATH $PATH:/usr/sbin
$ java -jar HPjconfig.jar
(ksh) $ export DISPLAY=<Display's IP Address>:0.0
$ export PATH=$PATH:/usr/sbin
$ java -jar HPjconfig.jar
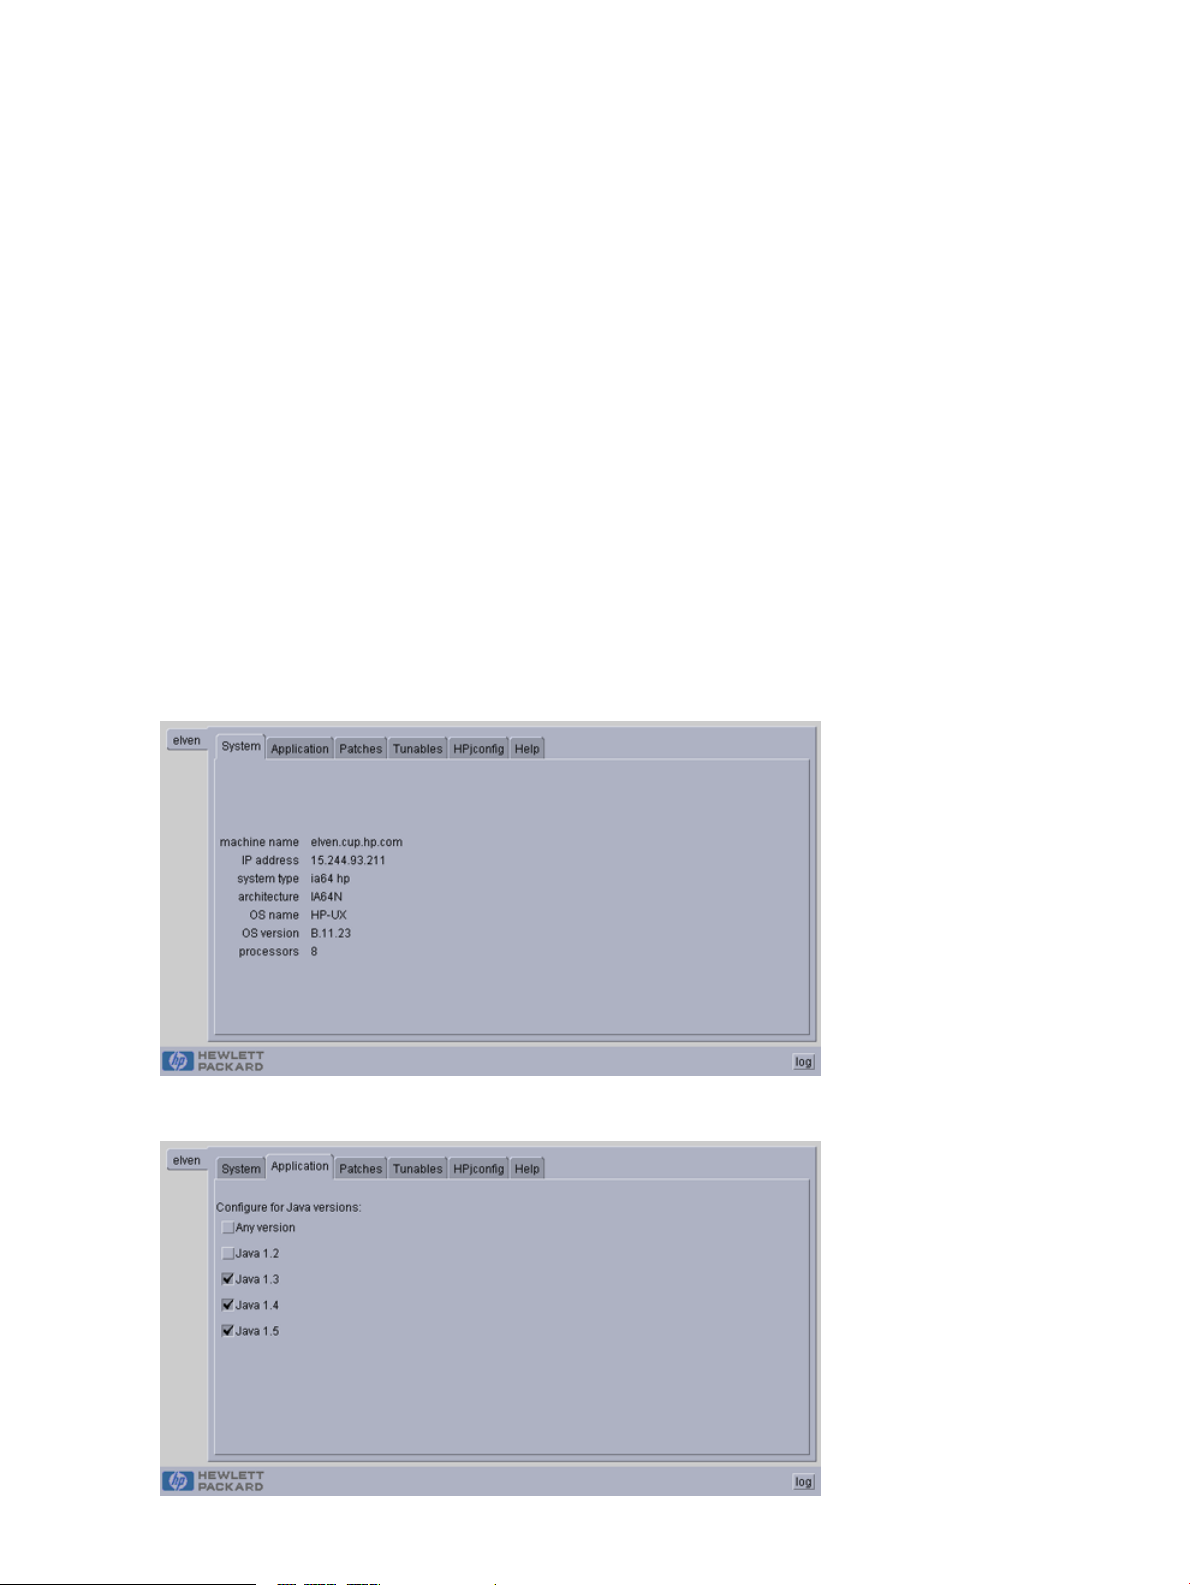
The following four figures show the System, Application, Patches, and Tunables tabs for the
HPjconfig tool:
Figure 1-1 HPjconfig - System Tab
Figure 1-2 HPjconfig - Application Tab
22 Diagnostic and Monitoring Tools and Options
Page 23
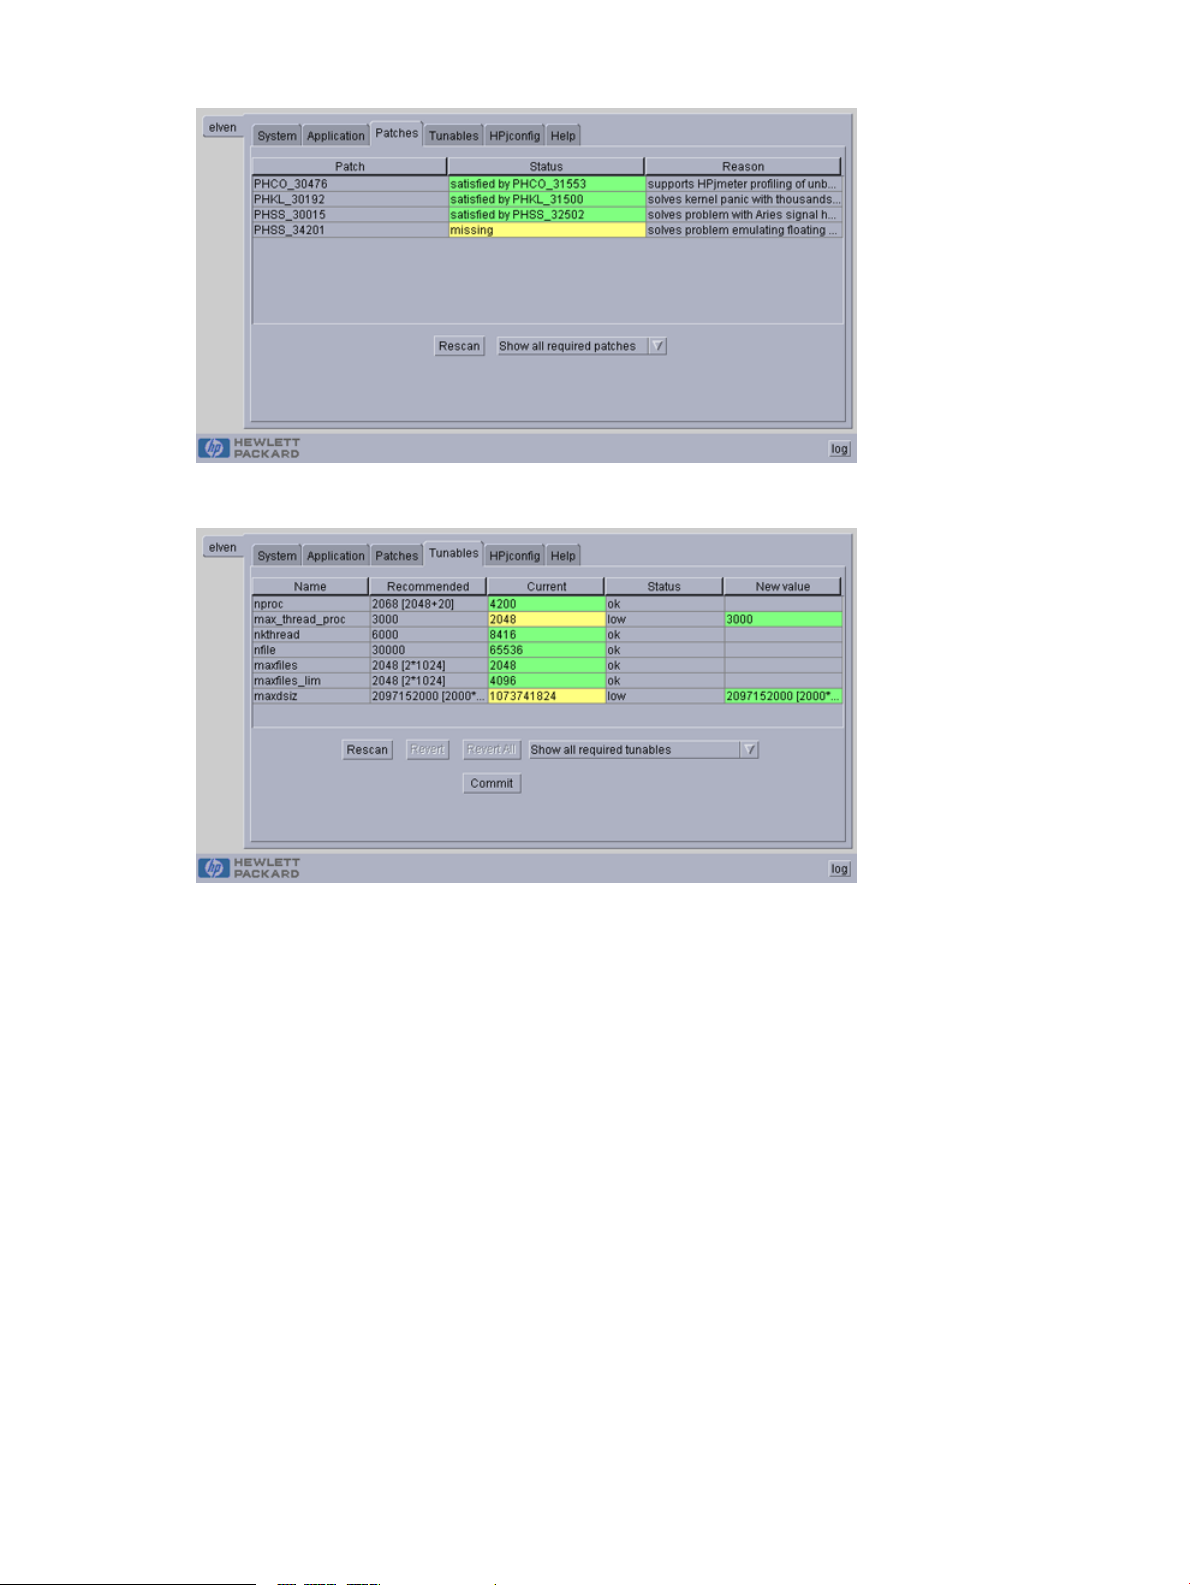
Figure 1-3 HPjconfig - Patches Tab
Figure 1-4 HPjconfig - Tunables Tab
Following are the commands for invoking HPjconfig in non-GUI mode. The -help option
lists options you can use in this mode.
$ cd <hpjconfig_installation_dir>
$ java -jar ./HPjconfig.jar -nogui -help
Following is an example using HPjconfig in non-GUI mode to list missing patches for Java
SDK 1.4:
$ java -jar HPjconfig.jar -nogui -patches -listmis -javavers 1.4
Log written to HPjconfig_mutant_20060915_040458.log
List of missing patches:
PHSS_34201 solves problem emulating floating point conversion when running
PA2.0 Java on an IPF system.. solves problem with Aries signal
handling that overlaps Java signal handling. solves problem emulating
floating point conversion when running PA2.0 Java on an IPF system..
solves problem with Aries signal handling that overlaps Java signal
handling.
Following is an example using HPjconfig to show the values for HP-UX tunables required by
Java:
$ java -jar HPjconfig.jar -nogui -tunables -listreq
Log written to HPjconfig_mutant_20060915_040934.log
List of required tunables:
Name Recommended value
nproc 2048+20
max_thread_proc 3000
nkthread 6000
nfile 30000
1.6 HPjconfig 23
Page 24

maxfiles 2*1024
maxfiles_lim 2*1024
maxdsiz 2000*1024*1024
Following is an example of using HPjconfig to display tunables that are set to values less than
those recommended:
$ java -jar HPjconfig.jar -nogui -tunables -listmis
Log written to HPjconfig_mutant_20060915_040955.log
List of tunables whose values are less than the recommended values:
Name Recommended value
max_thread_proc 3000
maxdsiz 2000*1024*1024
Following is an example log file produced by HPjconfig:
$ more HPjconfig_server1_20060915_042600.log
Fri Sep 15 16:26:00 PDT 2006
HPjconfig 3.0.01 (Thu Jul 21 14:52:47 2005)
Machine name: server1
IP address: 15.244.94.25
System type: ia64 hp server rx5670
Architecture: IA64N
OS name: HP-UX
OS version: B.11.23
Processors: 4
Java version: 1.4
Reading required patches/tunables information from /tmp/HPjconfig.xml
Read required patches/tunables information
Reading patch list from system
Read patch list from system
List of required patches:
PHCO_30476 supports HPjmeter profiling of unbound (MxN) threads.
PHKL_30192 solves kernel panic with thousands of MxN threads.
PHSS_30015 solves problem with Aries signal handling that overlaps Java sig
nal handling.
PHSS_34201 solves problem emulating floating point conversion when running
PA2.0 Java on an IPF system.. solves problem with Aries signal handling that ove
rlaps Java signal handling. solves problem emulating floating point conversion w
hen running PA2.0 Java on an IPF system.. solves problem with Aries signal handl
ing that overlaps Java signal handling.
1.7 HPjmeter
With the release of HPjmeter 3.0, all previous versions of HPjmeter (1.x, 2.x) are no longer
available for download and are no longer supported by HP.
If you have an old version of HPjmeter, please download HPjmeter 3.0 from:
http://www.hp.com/products1/unix/java/hpjmeter/index.html
HPjmeter can be used to identify and diagnose performance problems in Java applications
running on HP-UX. It can be used for both static and dynamic data analysis. For example, for
static data analysis it can be used to analyze profiling data generated by the following
command-line options: -Xrunhprof:heap=dump, -Xeprof, -Xverbosegc, -Xloggc, and
–XX:+HeapDump. Additionally, when using JDK 1.5.04 or later releases, HPjmeter can capture
profiling data with zero preparation (that is, without pre-planning). HPjmeter can also be used
for dynamic data analysis by monitoring live Java applications.
The following table lists the features of HPjmeter 3.0. The first two rows are static features and
the remaining four rows are dynamic features.
24 Diagnostic and Monitoring Tools and Options
Page 25

Table 1-11 HPjmeter 3.0 Features
Drill down into application profile metrics
• Graphic display of profiling data
• Call graphs with call count, or with CPU or clock time
• Per thread display of time spent
• Per thread or per process display
Integrated HPjtune functions with concurrent improvements in tool and help usability
Ability to examine Java Management Extension management beans (Mbeans) content and the Java VM internal
memory configuration
Automatic problem detection and alerts
• Memory leak detection alerts with leak rate
• Thread deadlock detection
• Abnormal thread termination detection
• Expected out of memory error
• Excessive method compilation
Dynamic real-time display of application behavior
• Java heap size
• Garbage collection events and percentage time spent in garbage collection
• CPU usage per method for hottest methods
Object allocation percentage by method
• Object allocation percentage by object type
• Method compilation count in the Java VM dynamic compiler
• Number of classes loaded by the Java VM
• Thrown exception statistics
• Multi-application, multi-node monitoring from a single console
HPjmeter can display data generated by the following Java product versions, on the specified
architectures, with the specified HP-UX operating system, as detailed in the following table:
Table 1-12 Java SDKs and JDKs Supported by HPjmeter 3.0
HP-UX VersionsArchitectureJava Version
11.11, 11.23PA-RISC 1.1, PA-RISC 2.0SDK 1.4.2.02 or later
11.11, 11.23PA-RISC 2.0JDK 1.5 or later
11.22, 11.23IntegritySDK 1.4.2.02 or later
11.22, 11.23IntegrityJDK 1.5.x
The HPjmeter console can be run on:
• PA-RISC HP-UX 11.11, 11.23
• Integrity HP-UX 11.22, 11.23
• Windows XP/2000/NT
• Linux
The user's guide for HPjmeter may be found at:
http://www.hp.com/products1/unix/java/hpjmeter/infolibrary/user_guide.pdf
More information on HPjmeter may be found at:
http://www.hp.com/products1/unix/java/hpjmeter/index.html
1.7 HPjmeter 25
Page 26

1.7.1 Static Data Analysis
1.7.1.1 Using HPjmeter to Analyze Profiling Data
The following steps summarize how to use HPjmeter to save and view profiling information
from your applications.
1. Change the command line of your Java application to use -Xeprof, -agentlib:hprof,
or -Xrunhprof options to capture profiling data. For examples how to use the
-agentlib:hprof and -Xrunhprof options, refer to the hprof section. This section's
examples use the -Xeprof option.
If you are using a Java release prior to JDK 1.5.0.04, you will need to add the -Xeprof
command-line option. This option will gather the eprof data during the entire execution of
the launched Java application. An example using this option follows:
$ java -Xeprof yourApp
You can send the eprof output to a specified file using the file= keyword as follows:
$ java -Xeprof:file=yourApp_pid<pid>.eprof yourApp
NOTE: If you are running JDK 1.5.0.04 or later, the command-line option is not required
in order to capture eprof data. Instead you can toggle eprof data gathering on and off by
sending signals to the currently running Java VM. One log file is produced per sample
period; the name for the log file is java<pid>_<startTime>.eprof.
The SIGUSR2 signal toggles the recording of eprof data. Use the following process to gather
eprof data for specific periods:
• Send SIGUSR2 to the Java VM process. The Java VM will begin recording eprof data.
• Send SIGUSR2 to the Java VM process. The Java VM will flush eprof data and close the
log file.
See Profiling with Zero Preparation in the HPjmeter User's Guide for more information.
2. Run the application to create a data file.
3. Start the console from a local installation on your client workstation.
4. Click File—>Open File to browse for and open the data file.
5. A profile analysis window will open displaying a set of tabs containing summary and
graphical metric data. The following screen shows an example:
26 Diagnostic and Monitoring Tools and Options
Page 27

Figure 1-5 HPjmeter - Profile Data
6. Click among the tabs to view available metrics. Use the Metrics or Estimate menus to select
additional metrics to view. Each metric you select opens in a new tab. Mousing over each
category in the cascading menu will reveal the relevant metrics for that category. The
following screen shows the available metrics for the threads/locks category:
Figure 1-6 HPjmeter - Threads/Locks Metrics
1.7 HPjmeter 27
Page 28

1.7.1.2 Using HPjmeter to Analyze Garbage Collection Data
The following steps summarize how to use HPjmeter to save and view garbage collection
information from your applications:
1. Change the command line of your Java application to use -Xverbosegc or -Xloggc to
capture garbage collection data.
2. Run the application to create a data file.
3. Start the console from a local installation on your client workstation.
4. Click File—>Open File to browse for and open the data file.
5. A GC viewer window opens and displays a set of tabs containing metric data. Following is
an example garbage collection analysis screen:
Figure 1-7 HPjmeter - Garbage Collection Analysis
1.7.2 Dynamic Data Analysis
1.7.2.1 Using HPjmeter to Monitor Applications
The following steps show how to start the monitoring agent when launching the HPjmeter
console. For most Java installations, linkage to the appropriate libraries is completed automatically
as part of the installation process, and, therefore, the first step is not needed. Begin with the
second step if you have a standard installation of the Java Runtime Environment.
1. Set the SHLIB_PATH environment variable to include the location of the HPjmeter agent
library as appropriate for 32 or 64-bit Java VM.
Following are examples that show how to set this variable in both the csh and the ksh for
the different libraries.
To select the PA-RISC 32-bit library:
(csh) setenv SHLIB_PATH /opt/hpjmeter/lib/PA_RISC2.0
(ksh) export SHLIB_PATH=/opt/hpjmeter/lib/PA_RISC2.0
To select the PA-RISC 64-bit library:
(csh) setenv SHLIB_PATH /opt/hpjmeter/lib/PA_RISC2.0W
(ksh) export SHLIB_PATH=/opt/hpjmeter/lib/PA_RISC2.0W
To select the Integrity 32-bit library:
28 Diagnostic and Monitoring Tools and Options
Page 29

(csh) setenv SHLIB_PATH /opt/hpjmeter/lib/IA64N
(ksh) export SHLIB_PATH=/opt/hpjmeter/lib/IA64N
To select the Integrity 64-bit library:
(csh) setenv SHLIB_PATH /opt/hpjmeter/lib/IA64W
(ksh) export SHLIB_PATH=/opt/hpjmeter/lib/IA64W
2. Confirm that the node agent is running. With a standard installation, the node agent should
be running as a daemon on the system where it was installed. A node agent must be running
before the console can connect to a managed node to discover applications and open
monitoring sessions.
To verify that the node agent is running, use the following ps command:
% ps -ef | grep node
The last output column (the args column) from ps should show the following:
$JMETER_HOME/bin/nodeagent -daemon
where JMETER_HOME=/opt/hpjmeter. The -daemon flag indicates that the node agent
is running as a daemon.
If the node agent is not running, follow these steps to enable it:
a. Verify that you are logged in with root permissions.
b. Check that the following files exist:
• /sbin/init.d/HPjmeter_NodeAgent
• /sbin/rc3.d/S999HPjmeter_NodeAgent
c. Issue the following command to start the node agent daemon manually. Note: substitute
start with stop to stop the node agent.
$ /sbin/init.d/HPjmeter_NodeAgent start
If you cannot use the node agent as a daemon or you need to set up access restrictions, start
the node agent manually by issuing the following command (no root access needed):
$ /opt/hpjmeter/bin/nodeagent
By default, the node agent listens for console connections on port 9505. Use the -port
port_number option to specify an alternate port number.
3. Start the Java application with the Java VM agent. For example, to start the myapp application
on JDK 1.5 enter:
/opt/java1.5/bin/java -Xms256m -Xmx512m -agentlib:jmeter myapp
On SDK 1.4.2 versions enter:
/opt/java1.4/bin/java -Xms256m -Xmx512m \
-Xbootclasspath/a:$JMETER_HOME/lib/agent.jar -Xrunjmeter myapp
This enables the myapp process to be dynamically monitored with the console.
4. Start the HPjmeter console by entering the command:
/opt/hpjmeter/bin/hpjmeter
1.7.2.2 Connect to the Node Agent From the HPjmeter Console
1. Choose Connect from the File Menu or select the Connect to Server icon [ ]. The following
screen displays:
1.7 HPjmeter 29
Page 30

Figure 1-8 HPjmeter - Connecting to Server
2. In the Connect to Server dialog box, type the host name where the Java application and
corresponding node agent are running.
3. If the node agent was started on a nonstandard port, specify the port number in the Optional
Port box.
4. Select Connect. The running Java VM for each application should appear in the console
main window pane marked with the symbol.
NOTE: If there is a connection failure, the symbol will not be displayed. Instead the
symbol will be displayed next to the server name to indicate the server connection failure.
If this happens, verify the node agent is running on the specified server.
5. If you want to connect to several node agents, repeat the previous steps.
1.7.2.3 Set Session Preferences
1. Double-click the Java VM icon in the data pane for the application that you want to monitor.
This opens the Session Preferences dialog box shown in the following screen:
30 Diagnostic and Monitoring Tools and Options
Page 31

Figure 1-9 HPjmeter - Setting Session Preferences
2. Check the default settings for metrics, filters, and alerts, and enable the settings you want
to activate.
3. Click OK. The Session Preferences window will close and the newly Open Session will be
visible, marked by the icon. Refer to the following screen for an example:
Figure 1-10 HPjmeter - Collecting Metrics
4. Wait for the console to collect metrics. The length of time depends on the application size,
the load imposed on the application, and the selected preferences. Typically, the wait will
be from 5 to 30 minutes. Longer collection time gives you greater accuracy in the results.
1.7 HPjmeter 31
Page 32
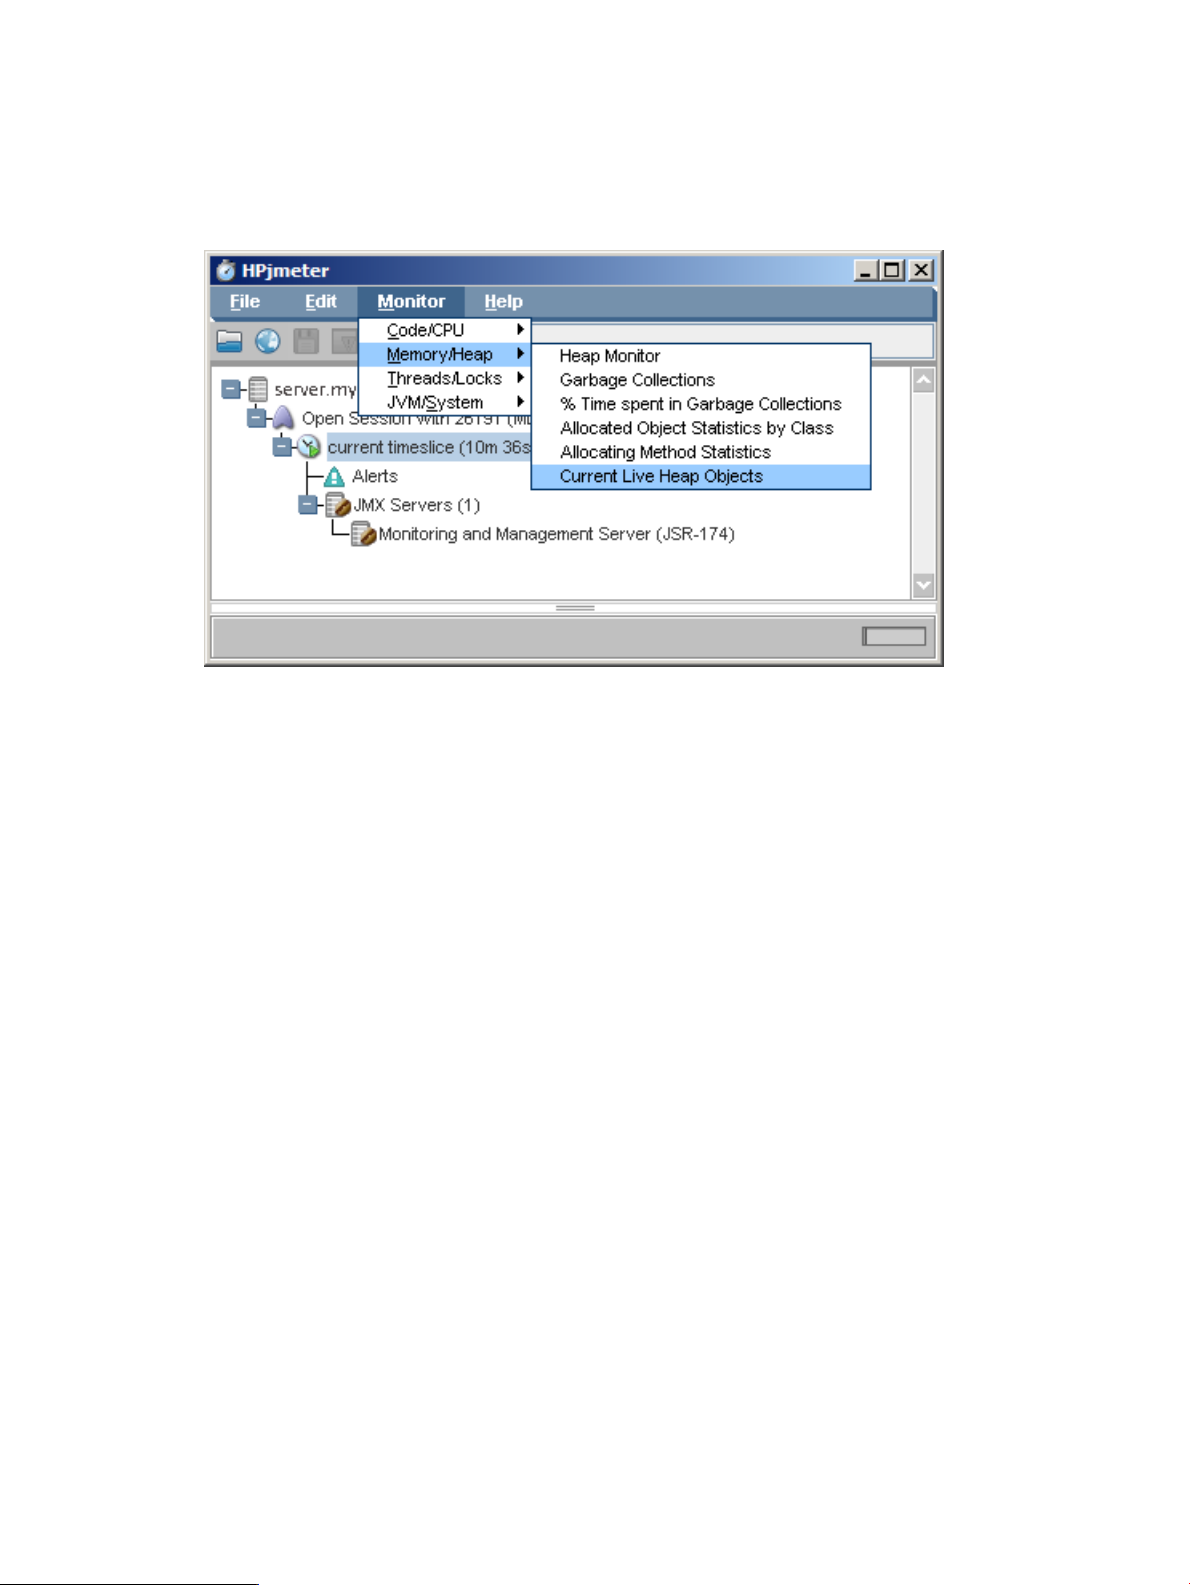
1.7.2.4 Viewing Monitoring Metrics During Your Open Session
1. Click the open session or time slice to highlight the data to be viewed.
2. Use the Monitor menu on the console main window to select the desired metrics. Refer to
the following screen for an example:
Figure 1-11 HPjmeter - Choosing Metrics to Monitor
3. Select a metric. A metric visualizer displaying the chosen data will open. Refer to the
HPjmeter User’s Guide for details on individual metrics and how to interpret the data.
1.7.2.5 Running the HPjmeter Sample Programs
HPjmeter includes two sample applications you can run to see live examples of a memory leak
and a thread deadlock situation. You can use the visualizers to examine data during the
demonstration session.
Following are the general steps for running the sample applications:
1. Start the console.
2. Start the node agent if it is not running as a daemon.
3. Start the sample application from the command line:
$ cd $JMETER_HOME/demo
$ export LD_LIBRARY_PATH=$JMETER_HOME/lib
$ java -agentlib:jmeter agent.jar -jar ML1.jar
As a convenience, HPjmeter includes a script that sets up the library path and bootclasspath
using the Java VM found at installation time. Following are instructions for using this script:
$ cd $JMETER_HOME/demo
$ ../bin/run_simple_jvmagent -jar sample_program
Use the file name of the specific sample you want to run in place of sample_program.
4. In the console main window, select Connect and type in the host name of the machine
running the sample application. If you specified a port number when starting the node agent,
use the same port number. Otherwise, leave the port number box empty.
5. An icon representing the host appears in the main window. After a few moments, the console
also shows the sample application as a child node of the host.
6. Double-click the application node to open a monitoring session with the application.
7. Click OK to accept the default settings for metrics, filters, and alerts.
32 Diagnostic and Monitoring Tools and Options
Page 33
1.7.2.5.1 Sample Memory Leak Application
This application demonstrates how memory leak alerts work in HPjmeter. It uses a simple
program which allocates some objects. The program uses a java.util.Vector object to retain
references to some of the objects. This application is configured to leak memory at the rate of
about 10 MB per hour. It is available from the HPjmeter installation directory:
Source: $JMETER_HOME/demo/ML1.java
Binary: $JMETER_HOME/demo/ML1.jar
Use the class name ML1 with the run_simple_jvmagent script to start the sample. When
measuring the sample application, allow considerable time for the heap to mature and stabilize,
and for the Java VM agent to collect memory leak data. Eventually, you will see the following
two alerts:
• Expected OutOfMemory Error Alert with the leaking rate
• Memory Leak Locations Alert with the leak location
When using the default garbage collectors and heap size for SDK 1.4.2, the detection of a memory
leak for this demonstration program occurs after about 20 minutes. This time may be substantially
longer when using a different Java VM or nonstandard garbage collector or heap settings. In real
situations, the detection time depends on the maximum heap size, the size of the leak, the
application running time, and the application and load characteristics. Typically, the detection
will occur in about one hour.
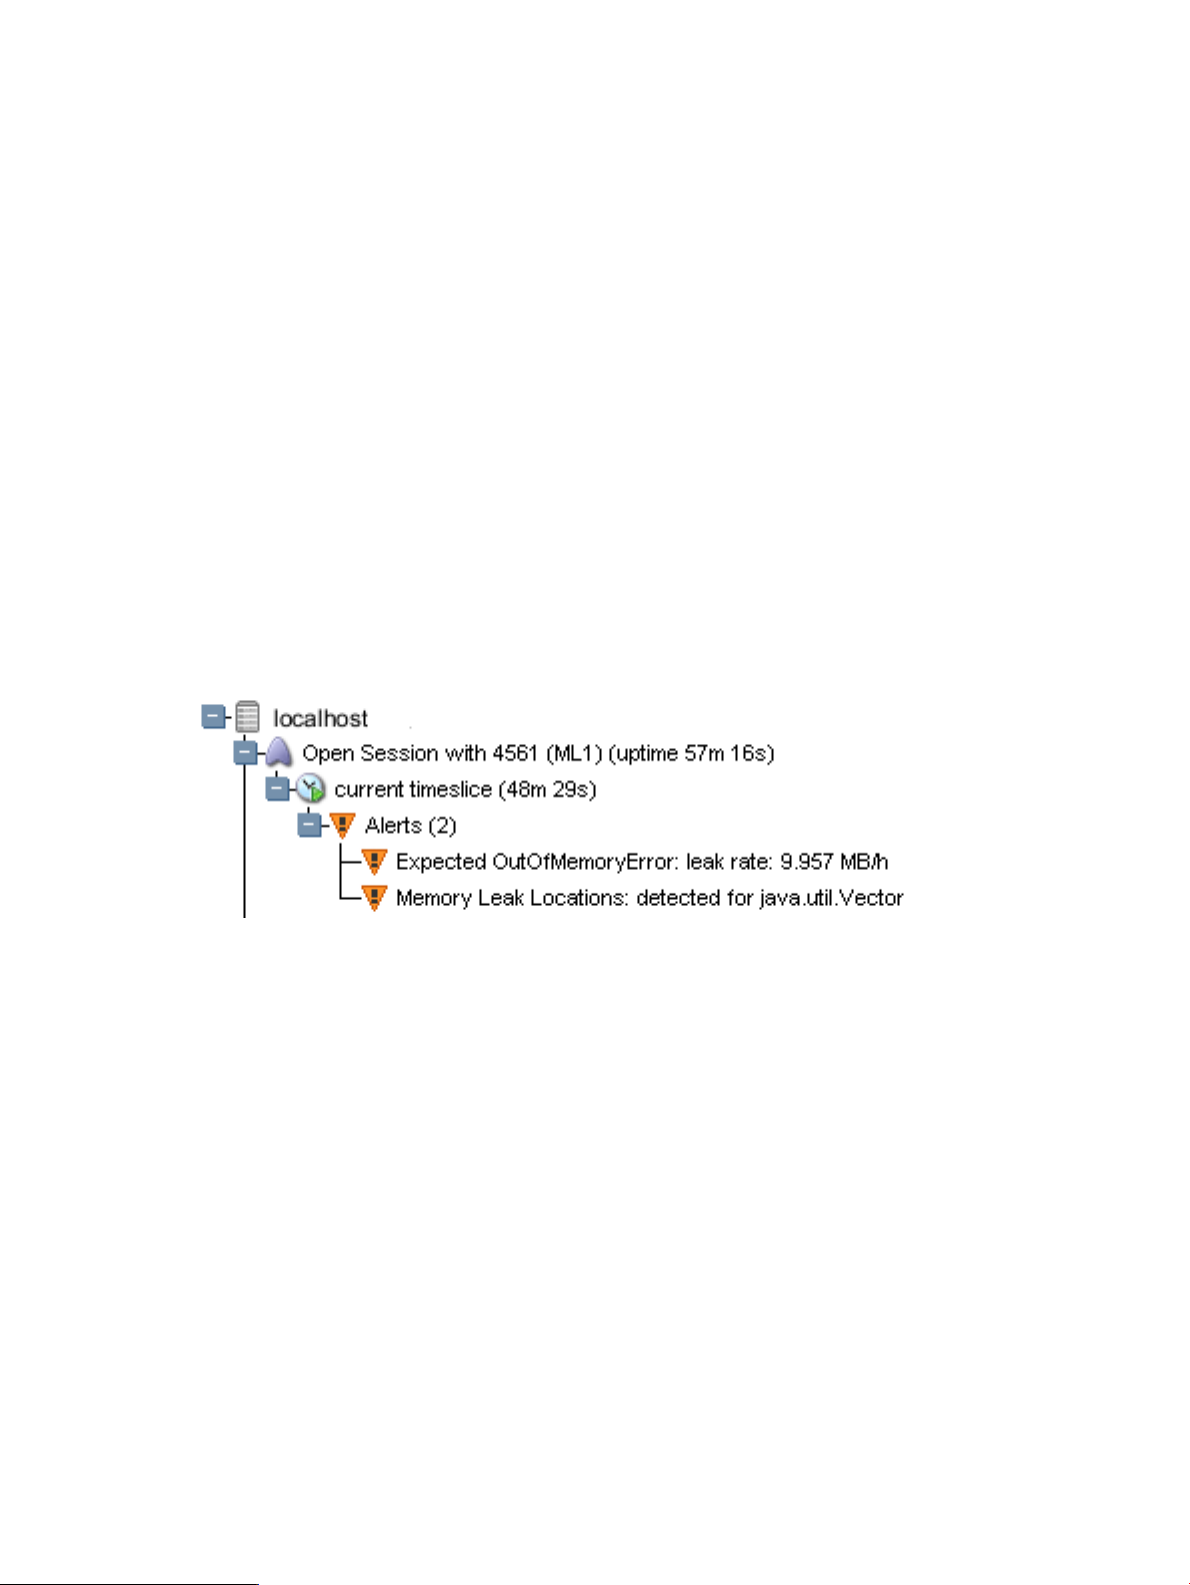
Following is a memory leak alert for the sample program:
Figure 1-12 HPjmeter - Memory Leak Alert
Following is the heap display:
1.7 HPjmeter 33
Page 34
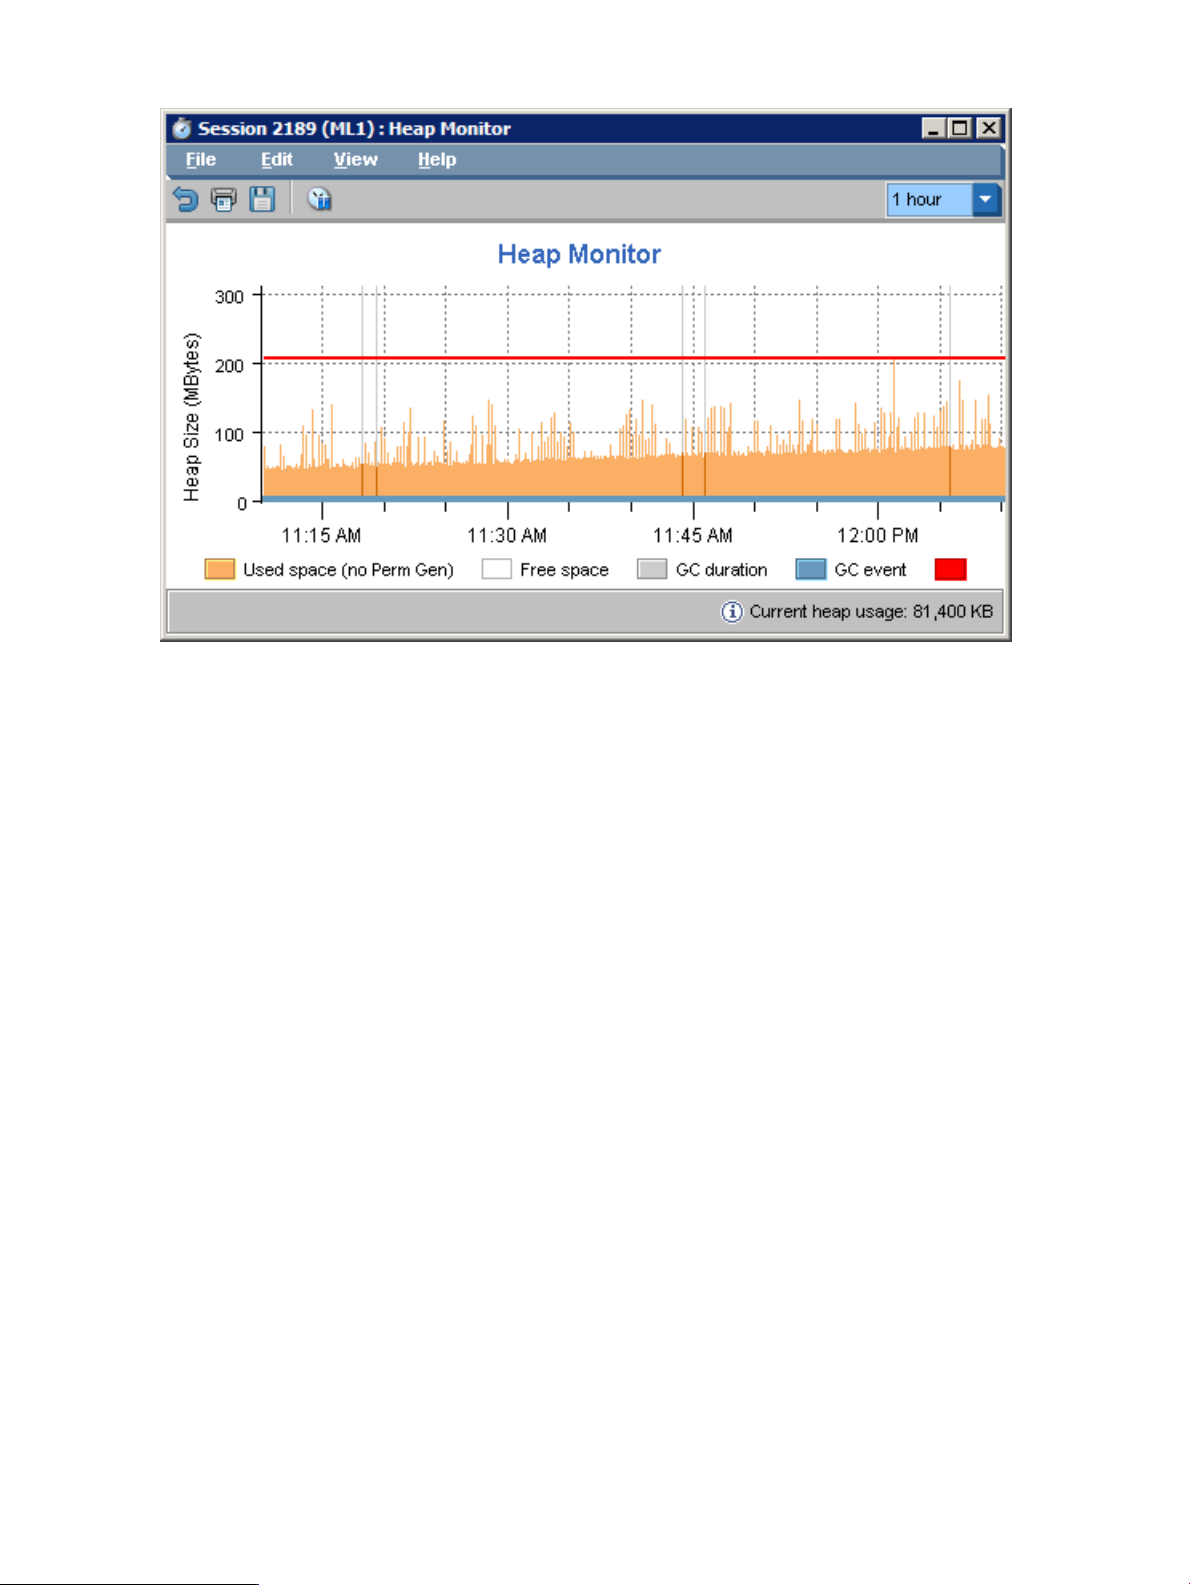
Figure 1-13 HPjmeter - Heap Monitor Display
1.7.2.5.2 Sample Thread Deadlock Application
This application demonstrates how HPjmeter detects deadlocked threads. It creates pairs of
threads every 30 seconds, stopping at 50 threads, which synchronize work using shared locks.
Occasionally, the program reverses the order on which locks are taken, eventually causing a
deadlock, which generates a Thread Deadlock Alert.
The sample application is available from the HPjmeter installation directory:
Source: $JMETER_HOME/demo/DL1.java
Binary: $JMETER_HOME/demo/DL1.jar
Use the class name DL1 with the run_simple_jvmagent script to start the sample. Use the
Thread Histogram display to view the thread activity. Deadlocked threads show a solid red bar.
Following is an example thread histogram display:
34 Diagnostic and Monitoring Tools and Options
Page 35
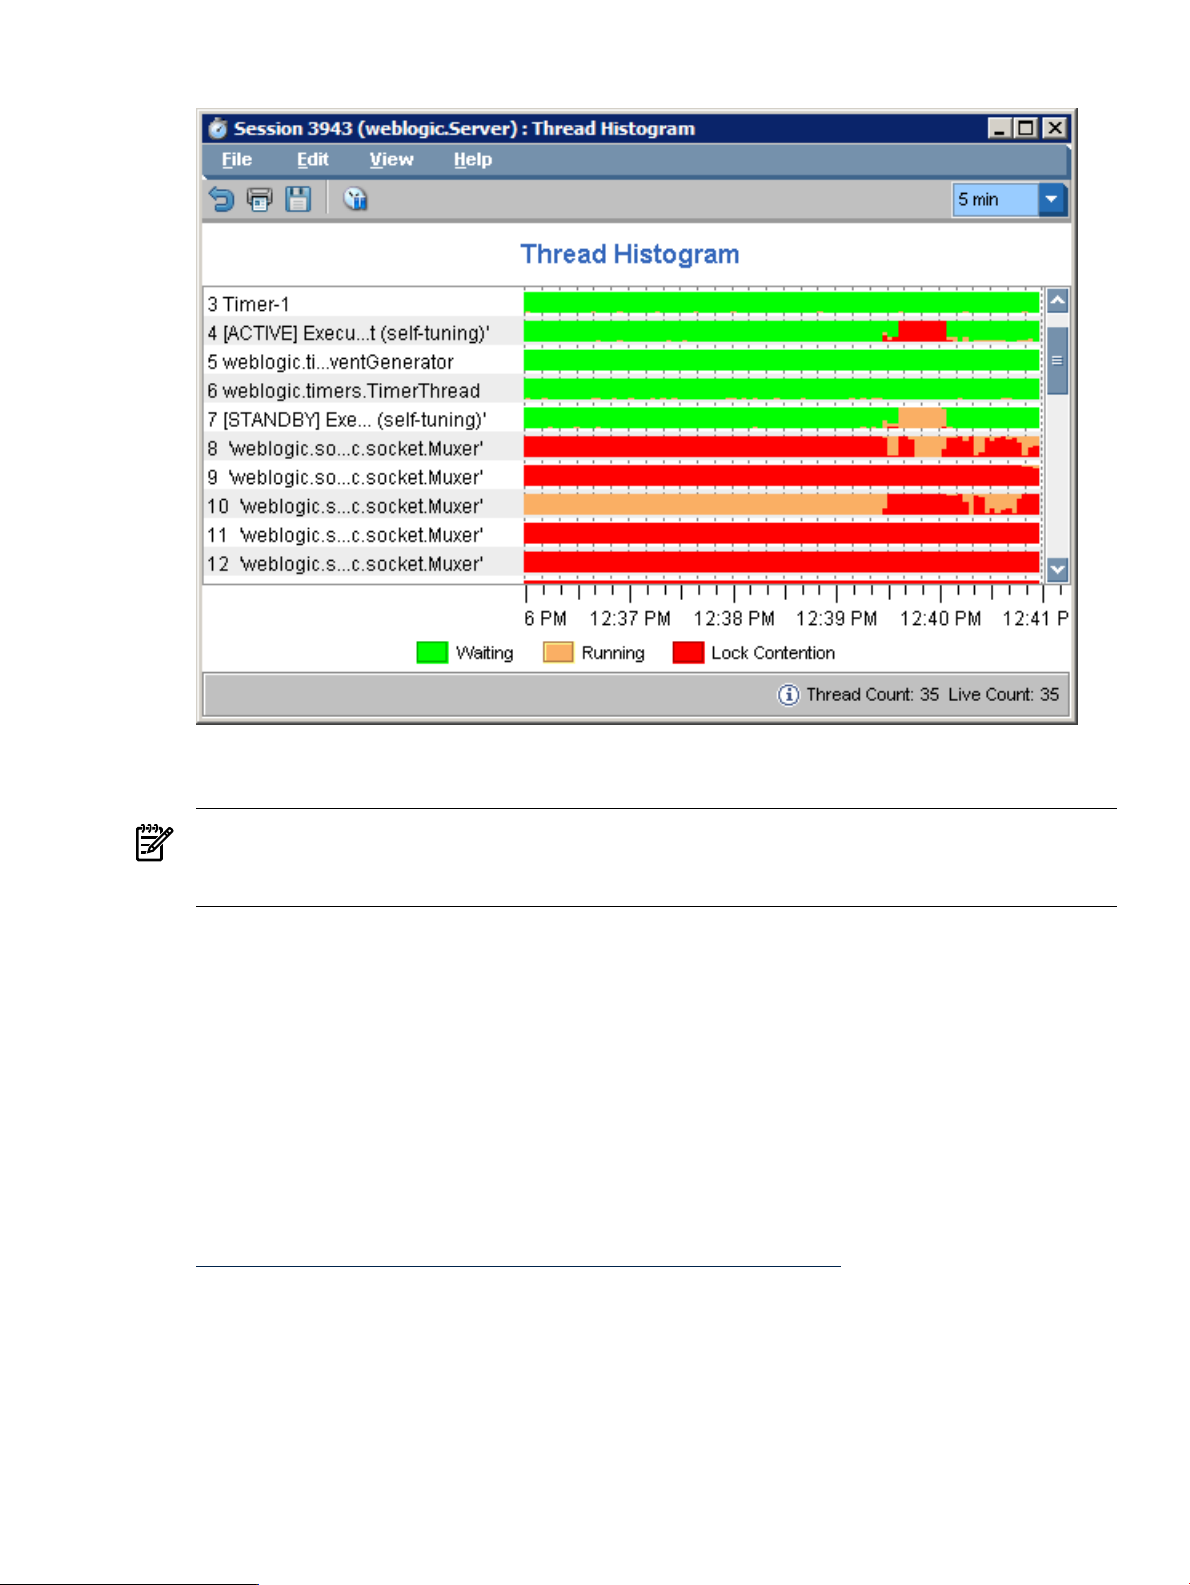
Figure 1-14 HPjmeter - Thread Histogram
1.8 HPjtune
NOTE: The HPjtune product has reached end of life. HP has integrated HPjtune functionality
into HPjmeter 3.0 and recommends migrating to HPjmeter for the latest in bug fixes,
enhancements, and support.
HPjtune is a garbage collection visualization tool for analyzing garbage collection activity in a
Java program. Data files for HPjtune can be generated using -Xverbosegc or -verbose:gc. HPjtune
lets you view this data in the following ways:
• Predefined graphs, which show the utilization of garbage collector resources and the impact
of the garbage collector on application performance.
• User-configurable graphs, which access selected GC metrics.
• Other predefined graphs, which show GC behavior pertaining to threads.
HPjtune also includes a unique feature which allows you to use the data collected with the
-Xverbosegc option to predict the effect of new garbage collector parameters on future application
runs.
For more information about HPjtune and to download the tool, go to:
http://www.hp.com/products1/unix/java/java2/hpjtune/index.html
Following is an example of running Java with the -Xverbosegc option to generate a data file to
be used by HPjtune:
$ /opt/java1.5/bin/java -Xverbosegc:file=java2d_gc.out -jar Java2Demo.jar
The -Xverbosegc option causes a data file containing garbage collection data to be generated into
file java2d_gc.out.<pid>. This is how to invoke HPjtune on that file:
$ /opt/java1.5/bin/java -jar <HPjtune_insdir>/hpjtune/HPjtune.jar java2d_gc.out.15878
where <HPjtune_insdir> is the location of the HPjtune installation.
1.8 HPjtune 35
Page 36
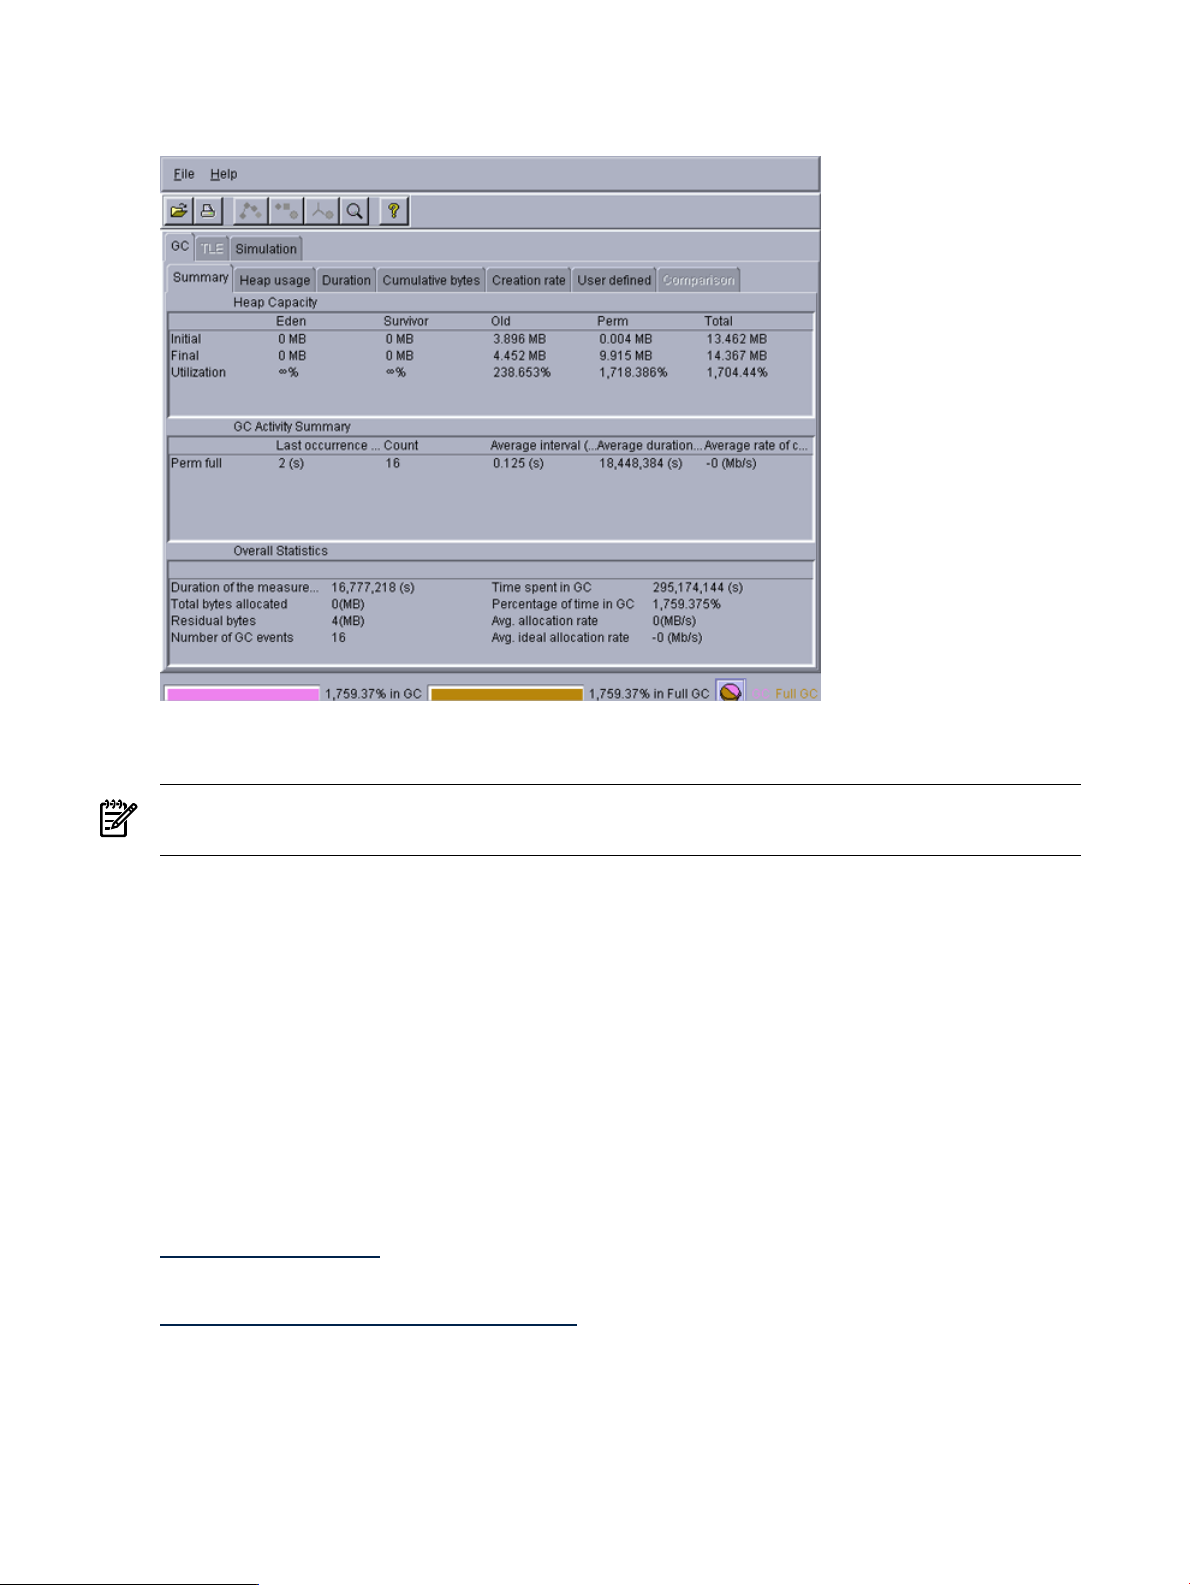
Following is an example screen shot to illustrate HPjtune's output:
Figure 1-15 HPjtune Screen
1.9 hat
NOTE: Beginning with JDK 6.0, hat is replaced with jhat. For information on jhat, refer to
the jhat section in this document.
The hat tool is a third-party tool that can be used for heap analysis. It starts a web server on a
binary-format heap dump file produced by one of the heap dump options such as
-XX:+HeapDumpOnCtrlBreak or -Xrunhprof:heap=dump,format=b.
Following in an example using hat. The first command generates a binary heap dump file. The
second command invokes hat on the binary heap profile.
$ java -Xrunhprof:heap=dump,format=b MyApp
$ hat -port=7002 java.hprof
The hat tool sets up an http server on the specified port. It can then be accessed by bringing up
the default page in a web browser, for example, http://<hostname.domain>:7002. If you
run hat on the same system as the browser, the server can be accessed by navigating to the URL
http://<hostname.domain>:7002.
For more information on hat, refer to the following website:
https://hat.dev.java.net
For invocation details, refer to:
https://hat.dev.java.net/doc/README.html
1.10 hprof
hprof is a simple tool used for heap and CPU profiling. To start hprof, use one of the following
Java command lines:
36 Diagnostic and Monitoring Tools and Options
Page 37

$ java -agentlib:hprof[=options] appl_to_profile (JDK 1.5+)
$ java -Xrunhprof[:options] appl_to_profile (SDK 1.4.2.0+)
hprof supports a number of profiling options. Use java -Xrunhprof:help to display the
available options.
Following is an example hprof command to capture object data:
$ java -Xrunhprof:heap=dump Hello
Load the resulting text file into HPjmeter, jhat, hat, or any editor for analysis.
Following is an example using hprof to produce a text file with summarized statistical samples
taken every ten seconds during the execution of a Hello.java sample program:
$ java -Xrunhprof:cpu=samples Hello
For information about this tool on SDK 1.4 releases, refer to:
http://java.sun.com/j2se/1.4.2/docs/guide/jvmpi/jvmpi.html#hprof
For information about the updated version of this tool available on JDK 1.5+ releases refer to:
http://java.sun.com/developer/technicalArticles/Programming/HPROF.html
1.11 java.security.debug System Property
The java.security.debug system property controls whether the security checks in the JRE
(Java Runtime Environment) print trace messages during execution. This option can be useful
when trying to determine why a SecurityException is thrown by a security manager. This
system property can be set to one of the following values:
• access —print all checkPermission results
• jar —print jar verification information
• policy —print policy information
• scl —print permissions assigned by the SecureClassLoader
The access option has the following sub-options:
• stack —include stack trace
• domain —dump all domains in context
• failure —dump the stack and domain that did not have permission before throwing the
exception
For example, to print all checkPermission results and trace all domains in context, set
java.security.debug to access,stack. To trace access failures, set it to access,failure.
Following is an example showing the output of a checkPermission failure:
$ java -Djava.security.debug=”access,failure” Application
access denied (java.net.SocketPermission server.foobar.com resolve
)
java.lang.Exception: Stack trace
at java.lang.Thread.dumpStack(Thread.java:1158)
at java.security.AccessControlContext.checkPermission(AccessControlContext.java:253)
at java.security.AccessController.checkPermission(AccessController.java:427)
at java.lang.SecurityManager.checkPermission(SecurityManager.java:532)
at java.lang.SecurityManager.checkConnect(SecurityManager.java:1031)
at java.net.InetAddress.getAllByName0(InetAddress.java:1117)
at java.net.InetAddress.getAllByName0(InetAddress.java:1098)
at java.net.InetAddress.getAllByName(InetAddress.java:1061)
at java.net.InetAddress.getByName(InetAddress.java:958)
at java.net.InetSocketAddress.<init>(InetSocketAddress.java:124)
at java.net.Socket.<init>(Socket.java:178)
at Test.main(Test.java:7)
1.12 JAVA_TOOL_OPTIONS Environment Variable
The command line used to start an application is not always readily accessible in many
environments. This is especially true with applications that use embedded Java VMs or ones
where the startup is deeply nested in scripts. In these environments, the JAVA_TOOL_OPTIONS
1.11 java.security.debug System Property 37
Page 38

environment variable may be useful to add options to the command line when the application
is run. This environment variable is primarily intended to support the initialization of tools,
specifically the launching of native or Java agents using the -agentlib or -javaagent options.
The JAVA_TOOL_OPTIONS environment variable is processed at the time of the invocation of
the Java VM. When this environment variable is set, the JNI_CreateJavaVM() function
prepends the value of the environment variable to the options supplied in its JavaVMInitArgs
argument. For security reasons this option is disabled in setuid processes; that is, processes where
the effective user or group ID differs from the real user or group ID.
In the following example, the environment variable is set to launch the hprof profiler when the
application is started:
export JAVA_TOOL_OPTIONS=”-agentlib:hprof”
Although this environment variable is intended to support the initialization of tools, it is also
useful for augmenting the command line with options for diagnostics purposes. For example,
you could use it to add the -XX:OnError option to the command line when it would be helpful
for a script or command to be executed when a fatal error occurred.
Since this environment variable is processed when JNI_CreateJavaVM() is called, it cannot
be used to augment the Java launcher options. Some examples of these launcher options are the
following VM selection options:
• java -d64
• java -client
• java -server
To pass arguments to the Java launcher, set the JAVA_LAUNCHER_OPTIONS environment variable
to a string containing the desired arguments.
This environment variable is fully described in the JVMTI specification at:
http://java.sun.com/j2se/1.5.0/docs/guide/jvmti/jvmti.html#tooloptions
1.13 jconsole (1.5+ only)
The jconsole command launches a graphical console tool that enables you to monitor and
manage Java applications on a local or remote machine.
jconsole can attach to any application that is started with the Java Management Extensions
(JMX) agent. A system property defined on the command line enables the JMX agent. Once
attached, jconsole can be used to display useful information such as thread usage, memory
consumption, and details about class loading, runtime compilation, and the operating system.
In addition to monitoring, jconsole can be used to dynamically change several parameters in
the running system. For example, the setting of the -verbose:gc option can be changed so that
garbage collection trace output can be dynamically enabled or disabled for a running application.
To use jconsole:
1. Start the application with the -Dcom.sun.management.jmxremote option. This option
sets the com.sun.management.jmxremote system property, which enables the JMX
agent.
2. Start jconsole with the jconsole command.
3. When jconsole starts, it shows a window listing the managed Java VMs on the machine.
The process id (pid) and command line arguments for each Java VM are displayed. Select
one of the Java VMs, and jconsole attaches to it.
Following is an example invocation of jconsole. First the Java application must be started with
the JMX agent enabled:
$ java -Dcom.sun.management.jmxremote -jar Java2Demo.jar &
[1] 13028
Now the jconsole tool can be started on the managed Java VM:
38 Diagnostic and Monitoring Tools and Options
Page 39
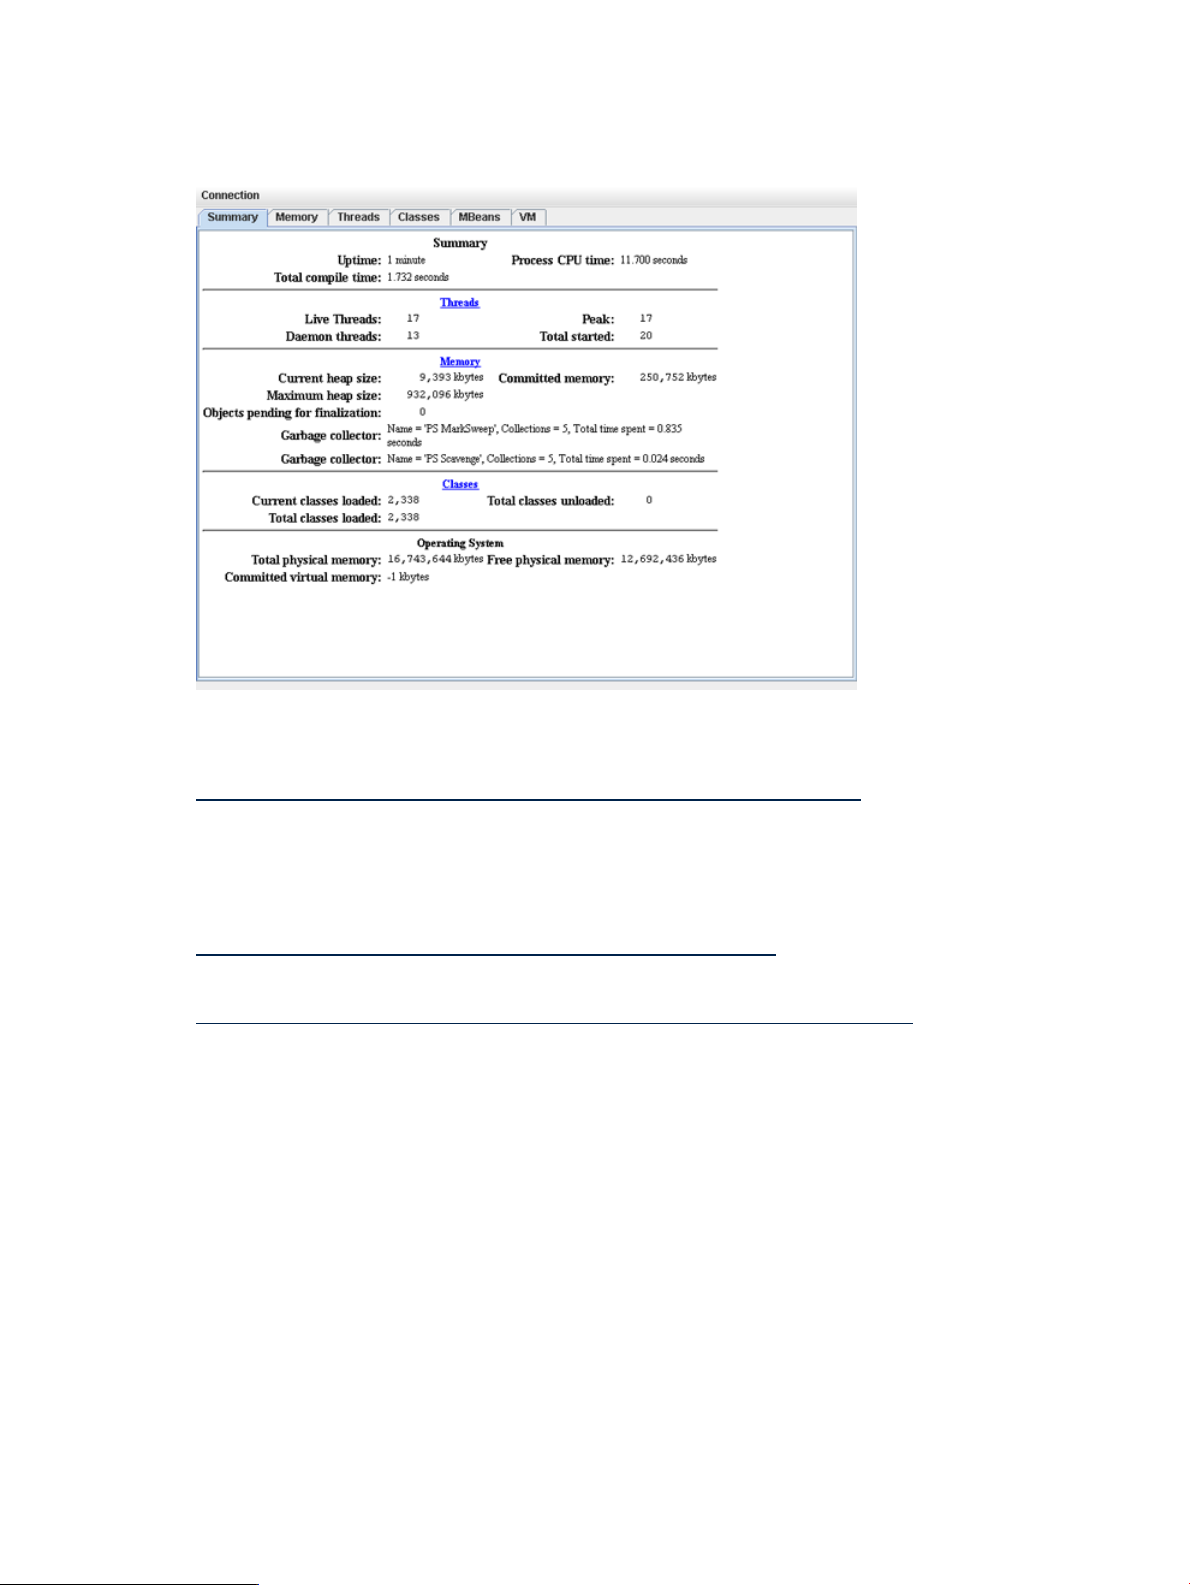
$ /opt/java1.5/bin/jconsole 13028
The following figure shows a jconsole screen shot:
Figure 1-16 jconsole Screen
jconsole can also be run remotely.To learn more about jconsole, including remote invocation,
refer to the following website:
http://java.sun.com/j2se/1.5.0/docs/guide/management/jconsole.html
1.14 jdb
The SDK includes a command-line debugger, jdb, to help you find and fix bugs in Java programs
running on a local or remote Java machine. Refer to the following website for more information:
http://java.sun.com/j2se/1.5.0/docs/tooldocs/solaris/jdb.html
A jdb tutorial may be found at:
http://www.javaworld.com/javaworld/javaqa/2000-06/04-qa-0623-jdb.html
1.15 jhat
Beginning with JDK 6.0, jhat is included with the standard JDK distribution. This tool can be
used for heap analysis; it is an improved version of hat. It starts a web server on a binary-format
heap dump file produced by one of the heap dump options such as -XX:+HeapDumpOnCtrlBreak
or -Xrunhprof:heap=dump,format=b.
Following in an example using jhat. The first command generates a binary heap dump file. The
second command invokes jhat on the binary heap profile.
$ java -Xrunhprof:heap=dump,format=b MyApp
$ jhat -port=7002 java.hprof
The jhat tool sets up an http server on the specified port. It can then be accessed by bringing
up the default page in a web browser, for example, http://<hostname.domain>:7002. If
you run hat on the same system as the browser, the server can be accessed by navigating to the
URL http://<hostname.domain>:7002.
For more information on jhat, refer to the following website:
1.14 jdb 39
Page 40

http://java.sun.com/javase/6/docs/technotes/tools/share/jhat.html
1.16 jps (1.5+ only)
The jps tool lists the Java VMs on the target system. The tool is limited to reporting information
on Java VMs that the user has access rights to, as determined by HP-UX specific access control
mechanisms. For example, if a non-root user executes the jps command, a listing of all virtual
machines started with that user's uid is given by the operating system.
Following is the usage information for the jps command:
Usage: jps [-help]
jps [-q] [-mlvV] [<hostname>[:<port>]]
Description of options:
-q Suppress the output of the class name, JAR file name, and arguments
passed to the main method, producing only a list of local JVM pids
-m Show the arguments passed to the main method. This output may be null
for embedded JVMs.
-l Show the full package name for the application's main class or the
full path name of the application's JAR file.
-v Show the arguments passed to the JVM.
-V Show the arguments passed to the JVM through the flags file
(the .hotspotrc file or the file specified by -XX:Flags=<filename>).
Note: These options are subject to change or removal in the future.
Following is an example using jps:
$ /opt/java1.5/bin/jps -lmv
16666 sun.tools.jps.Jps -lmv
-Denv.class.path=.:/opt/java1.5/lib/classes.zip -Dapplication.home=/opt/java1.5 -Xms8m
16665 MyObjectWaiterApp -Xverbosegc
16641 spec.jbb.JBBmain -propfile S.pr.8 -Xmx1600m -Xms1600m -Xmn1500m
For more information about jps, refer to the following document:
http://java.sun.com/j2se/1.5.0/docs/tooldocs/share/jps.html
1.17 jstat (1.5+ only)
The jstat utility is a statistics monitoring tool. It attaches to a Java VM and collects and logs
performance statistics as specified by the command-line options. The target Java VM is identified
by its virtual machine identifier.
The jstat utility does not require the Java VM to be started with any special options. This utility
is included in the JDK download.
The following table lists the jstat command options:
Table 1-13 Options to the jstat Command
-class
-compiler
-gc
-gccapacity
-gccause
-gcnew
-gcnewcapacity
Prints statistics on the behavior of the class loader
Prints statistics on the behavior of the Java compiler
Prints statistics on the behavior of the garbage collected heap
Prints statistics of the capacities of the generations and their
corresponding spaces
Prints the summary of garbage collection statistics with the cause of the
last and current (if applicable) garbage collection events
Prints statistics of the behavior of the new generation
Prints statistics of the sizes of the new generations and their
corresponding spaces
-gcold
40 Diagnostic and Monitoring Tools and Options
Prints statistics of the behavior of the old and permanent generations
Page 41

Table 1-13 Options to the jstat Command (continued)
-gcoldcapacity
-gcpermcapacity
-gcutil
-printcompilation
Prints statistics of the sizes of the old generation
Prints statistics of the sizes of the permanent generation
Prints a summary of garbage collection statistics
Prints Java compilation method statistics
A complete description of the jstat tool, including examples, can be found at:
http://java.sun.com/j2se/1.5.0/docs/tooldocs/share/jstat.html
Following is an example jstat command which attaches to pid 27395 and takes five samples
at 250 millisecond intervals. The -gcnew option specifies that statistics of the behavior of the
new generation is output.
$ jstat -gcnew 27395 250 5
S0C S1C S0U S1U TT MTT DSS EC EU YGC YGCT
64.0 64.0 0.0 31.7 31 31 32.0 512.0 178.6 249 0.203
64.0 64.0 0.0 31.7 31 31 32.0 512.0 355.5 249 0.203
64.0 64.0 35.4 0.0 2 31 32.0 512.0 21.9 250 0.204
64.0 64.0 35.4 0.0 2 31 32.0 512.0 245.9 250 0.204
64.0 64.0 35.4 0.0 2 31 32.0 512.0 421.1 250 0.204
Following is a description of the column headings in the example:
Table 1-14 jstat — New Generation Statistics
DescriptionColumn
Current survivor space 0 capacity (KB)S0C
Current survivor space 1 capacity (KB)S1C
Survivor space 0 utilization (KB)S0U
Survivor space 1 utilization (KB)S1U
Tenuring thresholdTT
Maximum tenuring thresholdMTT
Desired survivor size (KB)DSS
Current Eden space capacity (KB)EC
Eden space utilization (KB)EU
Number of young generation GC eventsYGC
Young generation garbage collection timeYGCT
1.18 jstatd (1.5+ only)
The jstatd tool launches an RMI (remote method invocation) server that monitors the creation
and termination of Java VMs and provides an interface to allow remote monitoring tools to attach
to Java VMs running on the local host.
For more information, refer to the following website:
http://java.sun.com/j2se/1.5.0/docs/tooldocs/share/jstatd.html
1.19 jvmstat Tools
The Java VM shipped with SDK 1.4.2 and later provides always-on instrumentation needed to
support monitoring tools and utilities.
1.18 jstatd (1.5+ only) 41
Page 42

As of JDK 1.5, the following subset of jvmstat tools is included with the JDK: jps (formerly
jvmps) , jstat (formerly jvmstat), and jstatd (formerly perfagent). The visualgc tool
is not included with JDK 1.5+, but is instead provided in the unbundled jvmstat 3.0 distribution.
For more details, refer to the following website:
http://java.sun.com/performance/jvmstat
1.20 -verbose:class
The -verbose:class option displays information about each loaded class. It enables logging
of class loading and unloading.
1.21 -verbose:gc
The -verbose:gc option enables logging of garbage collection (GC) information. It can be
combined with other Java VM specific options such as -XX:+PrintGCDetails and
-XX:+PrintGCTimeStamps to retrieve more information about the GC. The information output
includes the size of the generations before and after each GC, total size of the heap, the size of
objects promoted, and the time taken.
These options along with detailed information about GC analysis and tuning, are described at
Sun's GC portal site:
http://java.sun.com/developer/technicalArticles/Programming/GCPortal
The -verbose:gc option can be dynamically enabled at runtime using the management API
or JVMTI. The jconsole monitoring and management tool can also enable or disable this option
when attached to a management Java VM.
For other GC logging options, see -Xverbosegc.
1.22 -verbose:jni
The -verbose:jni option enables logging of Java Native Interface (JNI). Specifically, when a
JNI native method is resolved, the Java VM prints a trace message to the application console
(standard output). It also prints a trace message when a native method is registered using the
JNI RegisterNative() function. The -verbose:jni option may be useful when trying to
diagnose issues with applications that use native libraries.
1.23 visualgc
The visualgc tool uses jvmstat technology to provide visualization of garbage collection activity
in the Java VM. The Java VM shipped with JDK 1.4.2 and later releases provides the always-on
instrumentation needed to support monitoring tools and utilities such as visualgc.
As of JDK 1.5+, the following subset of the jvmstat tools is included with the Java VM: jps
(formerly jvmps), jstat (formerly jvmstat), and jstatd (formerly perfagent). visualgc
is not included in this set, but is instead provided in the unbundled jvmstat 3.0 distribution. The
download for jvmstat 3.0 may be found at:
http://java.sun.com/performance/jvmstat
visualgc attaches to a running Java VM processs to collect and graphically display garbage
collection, class loader, and Java compiler performance data.
The target Java VM is identified by its virtual machine identifier, or vmid. On HP-UX, the vmid
is the process id of the running Java application.
For details on visualgc usage refer to:
http://java.sun.com/performance/jvmstat/visualgc.html
When visualgc is attached to a running Java VM it opens the following windows:
42 Diagnostic and Monitoring Tools and Options
Page 43

1. Application Information window
2. Graph window
3. Survivor Age Histogram window (optional)
The Survivor Age Histogram window is only available when Parallel Scavenge is in use
(-XX:+UseParallelGC or -XX:+AggressiveHeap options).
Following is an example visualgc Application Information window and a description of the
different window areas:
Figure 1-17 visualgc
Application Information
Window
The top panel of this window is labelled Application Information . This panel has an Alive/Dead
indicator and the elapsed time since the start of the Java application. Following this panel there
is a scrollable text area that lists miscellaneous information about the configuration of the target
Java application and the Java VM. This section includes main class or jar file name, the arguments
to the class's main method, arguments passed to the Java VM, and the values of certain Java
properties exported as instrumentation objects.
The bottom panel shows a graphical view of the spaces that make up the generational garbage
collection system. This panel is divided into three vertical sections, one for each of the generations:
the Perm generation, the Old (or Tenured) generation, and the Young generation. The Young
generation is comprised of three separate spaces, the Eden space, and two Survivor spaces, S0
and S1.
The screen areas representing the various spaces are sized in proportion to the maximum capacities
of the spaces. The screen areas for the three GC generations are of fixed size and do not vary
over time. Each space is filled with a unique color indicating the current utilization of the space
relative to its maximum capacity. The unique color for each space is used consistently among
this window and the other two visualgc windows (Graph and Survivor Age Histogram).
The Graph window displays the values of various statistics as a function of time. The resolution
of the horizontal axis of the graph is determined by the interval command-line argument,
1.23 visualgc 43
Page 44

where each sample occupies two pixels of screen area. The height of each display depends on
the metric being plotted. Following is an example Graph window:
Figure 1-18 visualgc
Graph
Window
Each of the GC space graphs can be displayed in one of two modes: reserved mode or committed
mode; committed mode is the default. In reserved mode, the data is scaled according to the
maximum capacity of the space. The background grid is painted in dark gray to represent the
uncommitted portion and in green to represent the committed portion of reserved memory. In
committed mode, the data is scaled according to the current capacity of the space. The mode can
be toggled by right-clicking over the space and checking or unchecking the "Show Reserved
Space" check box.
The Survivor Age Histogram window consist of two panels, the Parameters panel and the Histogram
panel. The Parameters panel displays the size of the survivor spaces and the parameters that
control the promotion behavior of the young generation. The Histogram panel displays a snapshot
of the age distribution of objects in the active survivor space after the last Young generation
collection. The display is comprised of 32 identically sized regions, one for each possible object
age. Each region represents 100% of the active Survivor Space and is filled with a colored area
that indicates the percentage of the survivor space occupied by objects of the given age.
Following is an example Survivor Age Histogram window:
44 Diagnostic and Monitoring Tools and Options
Page 45

Figure 1-19 visualgc
When the Java VM is started with the Parallel Young GC option (-XX:+UseParallelGC), the
Survivor Age Histogram window is not displayed because the Parallel Young collector does not
maintain a survivor age histogram since it applies a different policy for maintaining objects in
the survivor spaces.
1.24 -Xcheck:jni
The -Xcheck:jni option is useful when trying to diagnose problems with applications that
use the Java Native Interface (JNI). Sometimes there are bugs in the native code that cause the
Java VM to crash or behave incorrectly. Add the -Xcheck:jni option to the command line
when starting the application. For example:
java -Xcheck:jni MyApplication
The -Xcheck:jni tells the Java VM to do additional validation on the arguments passed to JNI
functions. This option may not find all invalid arguments or diagnose logic bugs in the application
code; however, it can help diagnose these types of problems.
When an invalid argument is detected, the Java VM prints a message to the application console
(standard output), prints the stack trace of the offending thread, and aborts the Java VM. Following
is an example where a NULL is incorrectly passed to a JNI function that does not allow NULL:
FATAL ERROR in native method: Null object passed to JNI
at java.net.PlainSocketImpl.socketAccept(Native Method)
at java.net.PlainSocketImpl.accept(PlainSocketImpl.java:343)
- locked <0x450b9f70> (a java.net.PlainSocketImpl)
at java.net.ServerSocket.implAccept(ServerSocket.java:439)
at java.net.ServerSocket.accept(ServerSocket.java:410)
at org.apache.tomcat.service.PoolTcpEndpoint.acceptSocket(PoolTcpEndpoint.java:286)
at org.apache.tomcat.service.TcpWorkerThread.runIt(PoolTcpEndpoint.java:402)
at org.apache.tomcat.util.ThreadPool$ControlRunnable.run(ThreadPool.java:498)
at java.lang.Thread.run(Thread.java:536)
Following is another example of output that is displayed when something other than a jfieldID
is provided to a JNI function that expects a jfieldID:
FATAL ERROR in native method: Instance field not found in JNI get/set field operations
at java.net.PlainSocketImpl.socketBind(Native Method)
at java.net.PlainSocketImpl.bind(PlainSocketImpl.java:359)
- locked <0xf082f290> (a java.net.PlainSocketImpl)
at java.net.ServerSocket.bind(ServerSocket.java:318)
at java.net.ServerSocket.<init>(ServerSocket.java:185)
at jvm003a.<init>(jvm003.java:190)
at jvm003a.<init>(jvm003.java:151)
at jvm003.run(jvm003.java:51)
at jvm003.main(jvm003.java:30)
Following are some types of problems that -Xcheck:jni can help diagnose:
• The JNI environment for the wrong thread is used
• An invalid JNI reference is used
• A reference to a non-array type is provided to a function that requires an array type
• A non-static field ID is provided to a function that expects a static field ID
• A JNI call is made with an exception pending
Survivor Age Histogram
Window
1.24 -Xcheck:jni 45
Page 46

In general, all errors detected by -Xcheck:jni are fatal; the error is printed and the Java VM
is aborted. One exception to this is a non-fatal warning that is printed when a JNI call is made
within a JNI critical region. This is the warning that is displayed when this happens:
Warning: Calling other JNI functions in the scope of
Get/ReleasePrimitiveArrayCritical or Get/ReleaseStringCritical
A JNI critical region arises when native code uses the JNI GetPrimitiveArrayCritical()
or GetStringCritical() functions to obtain a reference to an array or string in the Java heap.
The reference is held until the native code calls the corresponding release function. The time
between the get and release is called a JNI critical section, and during that time the Java VM
cannot reach a state that allows garbage collection to occur. The general recommendation is that
other JNI functions should not be used when in a JNI critical section, and in particular any JNI
function that blocks could potentially cause a deadlock. The warning printed by -Xcheck:jni
is an indication of a potential issue; it does not always indicate an application bug.
1.25 -Xverbosegc
The -Xverbosegc option prints out detailed information about the Java heap before and after
garbage collection. The syntax is:
-Xverbosegc [:help] | [0 | 1] [:file = [stdout | stderr | <filename>]]
The “:help” option prints a description of the verbosegc output format.
The “0 | 1” option controls the printing of help information. Specifying value “0” will cause
the heap information to be printed after every Old Generation GC or Full GC. Specifying value
“1” (the default) will cause the heap information to be printed after every GC.
The “file = [stdout | stderr | <filename>]” option specifies the output file. The
default is stderr, which directs the output to the standard error stream. Alternative choices for
the output file are stdout and a user-specified filename.
-Xverbosegc sends log information to stderr by default. It is preferable to send the output
to a specific logfile instead since runtime errors may also send output to stderr. The following
command line sends -Xverbosegc output to a text file named yourApp_pid<pid>.vgc:
java -Xverbosegc:file=yourApp_pid<pid>.vgc yourApp
At every garbage collection 20 fields are printed as follows:
GC: %1 %2 %3 %4 %5 %6 %7 %8 %9 %10 %11 %12 %13 %14 %15 %16 %17 %18 %19 %20
The following table contains brief descriptions of these 20 fields:
Table 1-15 Garbage Collection Field Information
Information in FieldField
1
Type of GC:
• 1: Scavenge (GC of New Generation only)
• 2: Old Generation GC or a Full GC
• 3: Complete background CMS GC
• 4: Incomplete background CMS GC
• 11: Ongoing CMS GC
Additional information based on GC type in field 1.2
Program time at the beginning of the GC, in seconds.3
GC invocation. Counts of background CMS GCs and other GCs are maintained separately.4
Size of the object allocation request that forced the GC, in bytes.5
Tenuring threshold—determines how long the newborn object remains in the New Generation.6
Eden Sub-space (within the New Generation) occupied before GC.7
46 Diagnostic and Monitoring Tools and Options
Page 47

Table 1-15 Garbage Collection Field Information (continued)
Information in FieldField
Eden Sub-space (within the New Generation) occupied after GC.8
Eden Sub-space (within the New Generation) current capacity.9
Survivor Sub-space (within the New Generation) occupied before GC.10
Survivor Sub-space (within the New Generation) occupied after GC.11
Survivor Sub-space (within the New Generation) current capacity.12
Old Generation occupied before GC.13
Old Generation occupied after GC.14
Old Generation current capacity.15
Permanent Generation (storage of Reflective Objects) occupied before GC.16
Permanent Generation (storage of Reflective Objects) occupied after GC.17
Permanent Generation (storage of Reflective Objects) current capacity.18
The total stop-the-world duration, in seconds.19
The total time used in collection, in seconds.20
For more details about these fields, use the :help option or refer to the Java Programmers Guide
at the following website:
http://www.hp.com/products1/unix/java/infolibrary/prog_guide/index.html
To better understand how garbage collection works in the Java VM, read the article "Improving
Java Application Performance and Scalability by Reducing Garbage Collection Times and Sizing
Memory Using JDK 1.4.1" (November 2002) by Nagendra Nagarajayya and J. Steven Mayer at
the following website:
http://developers.sun.com/techtopics/mobility/midp/articles/garbagecollection2/#17.1
Additionally, HP recommends using the HPjtune tool, which can display graphically the
information contained in a -Xverbosegc log. Refer to the HPjtune command for more information.
1.26 -XX:ErrorFile
The JDK 6.0 release contains a new option, -XX:ErrorFile=<errfilename>. This option can
be used to replace the default filename (hs_err_pid<pid>.log) for the fatal error log.
If this option is used with the JAVA_CORE_DESTINATION environment variable, errfilename
can specify an absolute path, a relative path, or a filename placed in the
JAVA_CORE_DESTINATION directory. The following list explains how the combination of the
errfilename with the JAVA_CORE_DESTINATION environment variable can be used to do
this:
1. If the errfilename begins with the file separator character (“/”), it specifies an absolute
path. The JAVA_CORE_DESTINATION environment variable is not used for the
errfilename.
2. If the errfilename contains the file separator character (“/”), but does not begin with one,
it specifies a relative path ($JAVA_CORE_DESTINATION/errfilename).
3. If no file separator is found in errfilename, the fatal error log is placed in the
JAVA_CORE_DESTINATION directory.
1.26 -XX:ErrorFile 47
Page 48
1.27 -XX:+HeapDump and _JAVA_HEAPDUMP Environment Variable
The -XX:+HeapDump option can be used to observe memory allocation in a running Java
application by taking snapshots of the heap over time. Another way to get heap dumps is to use
the _JAVA_HEAPDUMP environment variable; setting this environment variable allows memory
snapshots to be taken without making any modifications to the Java command line. In order to
enable this functionality, either use the command-line option or set the environment variable
(for example, export _JAVA_HEAPDUMP=1) before starting the Java application. This option
is available beginning with SDK 1.4.2.10 and JDK 1.5.0.03.
The output is similar to that produced by the -Xrunhprof:heap=dump option except that the
thread and trace information is not printed to the output file.
With the -XX:+HeapDump option enabled, each time the process is sent a SIGQUIT signal, the
Java VM produces a snapshot of the Java heap in hprof ASCII format. The name of the file has
the following format: java_<pid>_<date>_<time>_heapDump.hprof.txt.
If _JAVA_HEAPDUMP_ONLY is set, then heap dumps are triggered by SIGVTALRM instead of
SIGQUIT for this option. Only the heap dump is produced; that is, the thread and trace dump
of the application to stdout is suppressed. Setting the _JAVA_BINARY_HEAPDUMP environment
variable along with _JAVA_HEAPDUMP_ONLY produces a binary format heap dump when the
SIGVTALRM is sent to the process instead of an ASCII one.
NOTE: A full GC is executed prior to taking the heap snapshot.
1.27.1 Other HeapDump Options
In addition to -XX:+HeapDump, there are three other HeapDump options available:
-XX:+HeapDumpOnCtrlBreak , -XX:+HeapDumpOnOutOfMemoryError, and
-XX:+HeapDumpOnly. Following is a table describing the four heap dump options. Additional
information on these three heap dump options is provided following the table.
Table 1-16 Overview of HeapDump Options
-XX:+HeapDump
-XX:+HeapDumpOnOutOfMemoryError
SIGQUIT
Memory
SIGVTALRM-XX:+HeapDumpOnly
1.27.2 -XX:+HeapDumpOnCtrlBreak
ASCII; set the
_JAVA_BINARY_HEAPDUMP
environment variable to
get binary
BinarySIGQUIT-XX:+HeapDumpOnCtrlBreak
BinaryOut of
ASCII; set the
_JAVA_BINARY_HEAPDUMP
environment variable to
get binary
Filenamehprof FormatTriggerOption
java_<pid>_<date>_<time>_heapDump.hprof.txt
java_<pid>.hprof.<millitime>
java_<pid>.hprof or the file specified
by -XX:HeapDumpPath=file
java_<pid>_<date>_<time>_heapDump.hprof.txt
The -XX:+HeapDumpOnCtrlBreak option is available beginning with SDK 1.4.2.11 and JDK
1.5.0.05. It enables the ability to take snapshots of the Java heap when a SIGQUIT signal is sent
to the Java process without using the JVMTI-based -Xrunhprof:heap=dump option. This
option is similar to -XX:+HeapDump except the output format is in binary hprof format and the
output is placed into a filename with the following naming convention:
java_<pid>.hprof.<millitime>.
If the HP environment variable _JAVA_HEAPDUMP is set and this option is specified, then both
hprof ASCII and binary dump files are created when a SIGQUIT is sent to the process. For
48 Diagnostic and Monitoring Tools and Options
Page 49

example, the following file names are created: java_27298.hprof.1152743593943 and
java_27298_060712_153313_heapDump.hprof.txt.
If JAVA_BINARY_HEAPDUMP is set and the -Xrunhprof:heap=dump command is given, then
both hprof ASCII and binary files are produced for this option.
1.27.3 -XX:+HeapDumpOnOutOfMemoryError
The-XX:+HeapDumpOnOutOfMemoryError option is available beginning with SDK 1.4.2.11
and JDK 1.5.0.04. This option enables dumping of the Java heap when an “Out Of Memory” error
condition occurs in the Java VM. The heap dump file name defaults to java_pid<pid>.hprof
in the current working directory. The option -XX:HeapDumpPath=file may be used to specify
the heap dump file name or a directory where the heap dump file should be created. The only
heap dump format generated by the -XX:+HeapDumpOnOutOfMemoryError option is the
hprof binary format.
One known issue exists: the-XX:+HeapDumpOnOutOfMemoryError option does not work with
the low-pause collector (option -XX:+UseConcMarkSweepGC).
1.27.4 -XX:+HeapDumpOnly
Starting with SDK 1.4.2.11 and JDK 1.5.0.05, the -XX:+HeapDumpOnly option or the
_JAVA_HEAPDUMP_ONLY environment variable can be used to enable heap dumps using the
SIGVTALRM signal (signal 20). This interface is provided to separate the generation of thread
and trace information triggered via SIGQUIT from the heap dump information. If
the-XX:+HeapDumpOnly option is specified or the _JAVA_HEAPDUMP_ONLY environment
variable is set, then the heap dump functionality is triggered by sending SIGVTALRM to the
process. The printing of thread and trace information to stdout is suppressed.
The heap dump is written to a file with the following filename format:
java_<pid>_<date>_<time>_heapDump.hprof.txt.
The default output format is ASCII. The output format can be changed to hprof binary format
by setting the _JAVA_BINARY_HEAPDUMP environment variable. This environment variable can
also be used with the -XX:+HeapDump option to generate hprof binary format with the SIGQUIT
signal.
1.27.5 Using Heap Dumps to Monitor Memory Usage
By creating a series of heap dump snapshots, you can see how the number and size of objects
varies over time. It is a good idea to collect at least three snapshots. The first one serves as a
baseline. It should be taken after the application has finished initializing and has been running
for a short time. The second snapshot should be taken after the residual heap size has grown
significantly. Monitor this using -Xverbosegc and HPjtune. Try to take the last snapshot just
before the heap has grown to a point where it causes problems resulting in the application
spending the majority of its time doing full GCs. If you take other snapshots, spread them out
evenly based on residual heap size throughout the running of the application.
Once you have collected the snapshots, read them into HPjmeter (run with -Xverbosegc to
monitor memory usage). Use small heap sizes so that the analysis with HPjmeter requires less
memory. Read two files in and compare them using the File->Compare option. You should
be able to find out the types of objects that are accumulating in the Java heap. Select a type using
the Mark to Find option and go back to a view of one of the snapshots. Go to the
Metric->Call Graph Tree option and do a Find. You should be able to see the context of
the object retention.
1.28 -XX:OnError
When a fatal error occurs, the Java VM can optionally execute a user-supplied script or command.
The script or command is specified using the -XX:OnError:<string> command-line option,
1.28 -XX:OnError 49
Page 50

where <string> is a single command or a list of commands each separated by a semicolon.
Within <string> all occurrences of “%p” are replaced with the current process id (pid), and
all occurrences of “%%” are replaced by a single “%”.
Following is an example showing how the fatal error report can be mailed to a support alias
when a fatal error is encountered:
java -XX:OnError=”cat hs_err_pid%p.log|mail support@acme.com” MyApplication
Following is an example that launches gdb when an unexpected error is encountered. Once
launched, gdb attaches to the Java VM process:
java -XX:OnError=”gdb - %p” MyApplication
1.29 -XX:+ShowMessageBoxOnError
In addition to the-XX:OnError option, the Java VM can also be provided with the
option-XX:+ShowMessageBoxOnError . When this option is set and a fatal error is encountered,
the Java VM outputs information about the fatal error and ask the user if the debugger should
be launched. The output and prompt are sent to the application console (standard input and
standard output). Following is an example:
==============================================================================
Unexpected Error -----------------------------------------------------------------------------SIGSEGV (0xb) at pc=0x2000000001164db1, pid=10791, tid=1026
Do you want to debug the problem?
To debug, run 'gdb /proc/10791/exe 10791'; then switch to thread 1026
Enter 'yes' to launch gdb automatically (PATH must include gdb)
Otherwise, press RETURN to abort...
==============================================================================
In this case, a SIGSEGV has occurred and the user is prompted whether to launch the debugger
to attach to the process. If the user enters “y” or “yes” then gdb is launched.
In the previous example, the output includes the process id (10791) and also the thread id (1026).
If the debugger is launched then one of the initial steps taken in the debugger should be to select
the thread and obtain its stack trace.
While waiting for a response from the process, it is possible to use other tools to obtain a crash
dump or query the state of the process.
Generally, -XX:+ShowMessageBoxOnError option is more useful in a development
environment where debugger tools are available. The -XX:OnError option is more suitable for
production environments where a fixed sequence of commands or scripts are executed when a
fatal error is encountered.
50 Diagnostic and Monitoring Tools and Options
Page 51

2 Useful System Tools for Java Troubleshooting
This chapter contains information about some system tools available on HP-UX that are useful
when troubleshooting Java application problems. The tools discussed include: GlancePlus, tusc,
Prospect, HP Caliper, sar, vmstat, iostat, swapinfo, top, netstat, and others.
2.1 GlancePlus
GlancePlus is a system performance monitoring and diagnostic tool. It lets you easily examine
system activities, identify and resolve performance bottlenecks, and tune your system for more
efficient operation. For more information on GlancePlus, refer to the following website:
http://www.managementsoftware.hp.com/products/gplus/index.html
2.2 tusc
tusc gives you another view into the system activity, in addition to Java stack traces, GlancePlus,
and HPjmeter . It has many options, which you can display by entering the command tusc
-help. For more information on tusc, refer to the following website:
http://h21007.www2.hp.com/dspp/tech/tech_TechDocumentDetailPage_IDX/1,1701,2894,00.html?jumpid=reg_R1002_USEN
2.3 Prospect
Prospect is a performance analysis tool. Beginning with Prospect revision 2.2.0, you can use
Prospect to retrieve a profile of the compiled Java methods that the Java VM compiler creates in
data space. In order to activate this functionality, you must have SDK 1.3.1.02 or following
releases. For more information on the Prospect performance analysis tool, refer to the following
website:
http://h21007.www2.hp.com/dspp/tech/tech_TechSoftwareDetailPage_IDX/1,1703,3282,00.html
2.4 HP Caliper
HP Caliper is a general-purpose performance analysis tool for applications running on Integrity
systems. It helps you understand the execution of your applications and identify ways to improve
their performance. For more information on the HP Caliper tool, refer to the following website:
http://h21007.www2.hp.com/dspp/tech/tech_TechSoftwareDetailPage_IDX/1,1703,1174,00.html?jumpid=reg_R1002_USEN
2.5 sar
The sar command is a tool to report various system activities, such as CPU, I/O, context switches,
interrupts, page faults, and other kernel actions. For more information on this command, refer
to the following website:
http://docs.hp.com/en/B2355-60127/sar.1M.html
2.6 vmstat
The vmstat command reports statistics about the process, virtual memory, trap, and CPU
activity. For more information on this command, refer to the following website:
http://docs.hp.com/en/B2355-60127/vmstat.1.html
2.7 iostat
The iostat command iteratively reports I/O statistics for each active disk on the system. For
more information on this command, refer to the following website:
http://docs.hp.com/en/B2355-60127/iostat.1.html
2.1 GlancePlus 51
Page 52

2.8 swapinfo
The swapinfo command displays information about device and file system paging space. For
more information on this command, refer to the following website:
http://docs.hp.com/en/B2355-60127/swapinfo.1M.html
2.9 top
The top command displays the top processes on the system, periodically updating the
information; raw CPU percentage is used to rank the processes. For more information on this
command, refer to the following website:
http://docs.hp.com/en/B2355-60127/top.1.html
2.10 netstat
The netstat command displays statistics for network interfaces and protocols as well as the
contents of various network-related data structures. It can show packet traffic, connections, error
rates, and more. For more information on this command, refer to the following website:
http://docs.hp.com/en/B2355-60127/netstat.1.html
2.11 Other Tools
The Developer and Solution Partner Program's (DSPP) technical information website contains
links to debugging information. There are links from this page to other websites containing
technical papers, tips, tutorials, and more. To review this information, refer to the following
website:
http://h21007.www2.hp.com/dspp/topic/topic_DetailSubHeadPage_IDX/1,4946,0-10301-TECHDOCUMENT,00.html
52 Useful System Tools for Java Troubleshooting
Page 53

3 Getting Help from Hewlett-Packard
Sometimes you need help troubleshooting your Java application problems. Before opening a
support call, search for information that may help you by referring to the Go Java! website:
http://www.hp.com/go/java
This site contains much information about Java, including known issues, release notes, patches,
downloads, documentation, and more. If you still need troubleshooting help after looking at this
website and you have a support contract with Hewlett-Packard (HP), follow the instructions
outlined in this chapter to collect the necessary information before opening a support call.
3.1 Problem Report Checklist
Use this checklist to collect information before you request support. Providing more information
when you initiate your support call reduces the time it takes for support engineers to start working
on your problem.
NOTE: More details about collecting problem data, system data, and Java environment data
may be found in the sections following this checklist.
1. Problem Description
a. Did this Java application ever work?
b. What is the problem (abort, hang, performance, and so on)?
c. What messages are written to stdout or stderr relating to the problem?
d. Does the problem occur every time the application is run or intermittently?
e. What are the application details? Include the following:
• Name of the application.
• What the application does.
• The command line and options used to start the application.
• Description of the expected behavior.
• Description of the actual behavior.
• The application stack that you are running—for example, the webserver name or
the application server name.
f. How do you reproduce the problem? If possible, provide source code and step-by-step
instructions.
g. Do you have a workaround for the problem? If so, describe it.
2. Problem Data (refer to Section 3.2 for details)
a. Core file, best collected with gdb's packcore command
b. Fatal error log (hs_err_pid<pid>.log)
c. Stack trace
3. System Information (refer to Section 3.3 for details)
a. What version of HP-UX is on the system? Provide the output from the uname -a
command.
b. What patches are installed on the system? This can be determined with HPjconfig or
swlist.
c. What window manager is being used? For example, Reflections X or X Windows. Or
is the application running inside a browser? If so, which one?
4. Java Environment (refer to Section 3.4 for details)
3.1 Problem Report Checklist 53
Page 54

a. What is the version of the Java VM that is having the problem? Run the command java
-version to retrieve this information.
b. What are the values of the environment variables used by Java?
c. What libraries are being loaded? This information is best collected with gdb's packcore
command.
5. Contact Information
a. Contact name
b. Company name
c. Phone number
d. E-mail address
The following subsections provide instructions for collecting the necessary problem, system, and
Java environment information. The final subsection contains instructions for packaging the files
you need to send to Hewlett-Packard.
3.2 Collecting Problem Data
Three pieces of information are essential for analyzing most problems—the core file, the fatal
error log, and the stack trace. Following are instructions for how to collect this information.
3.2.1 Collecting Core File Information
This section begins with a checklist to follow to make sure you can collect useful core files. It
then reviews how you can generate a core file if one is not generated for you. Finally, there is a
discussion about how to verify that your core file is valid.
3.2.1.1 Core File Checklist
Core files contain useful information, if they are complete. Sometimes you need to configure
your system to make sure you can save complete core files. Consider the following items to
ensure you can create complete core files.
1. Estimate the core file size.
2. Ensure your process can write large core files.
3. Verify you have enough free disk space.
4. Make sure the directory where the core file will reside supports a large file system. If not,
write the core file to a directory that does.
5. Make sure you have the correct permissions to write core files.
Following are additional details on each of these steps.
3.2.1.1.1 Estimate Core File Size
The size of the-Xmx option affects the core file size. Use these rules to estimate the size of the
Java core file:
• -Xmx is less than 1,500 MB. The core file will be less than or equal to 2 GB.
• -Xmx is between 1,500 and 2,400 MB. The core file will be less than or equal to 3 GB.
• -Xmx is greater than 2,400 MB. The core file will be less than or equal to 4 GB.
3.2.1.1.2 Ensure Process Can Write Large Core Files
Check your coredump block size to make sure it is set to unlimited using the ulimit -a
command:
$ ulimit -a
time(seconds) unlimited
file(blocks) unlimited
data(kbytes) 4292870144
stack(kbytes) 8192
54 Getting Help from Hewlett-Packard
Page 55

memory(kbytes) unlimited
coredump(blocks) 4194303
If coredump is not set to unlimited, set it to unlimited using the ulimit -c command:
$ ulimit -c unlimited
$ ulimit -a
time(seconds) unlimited
file(blocks) unlimited
data(kbytes) 4292870144
stack(kbytes) 8192
memory(kbytes) unlimited
coredump(blocks) unlimited
3.2.1.1.3 Verify Amount of Disk Space
Check the amount of disk space available in the current working directory using the df -kP
command:
$ df -kP /home/mycurrentdir
Filesystem 1024-blocks Used Available Capacity Mounted on
/dev/vg00/lvol5 1022152 563712 458440 56% /home
3.2.1.1.4 Check If Directory Supports Large File Systems
Use the fsadm command as root to check if your directory supports large file systems. If you do
not execute this command as root, you may not retrieve meaningful results. Following is an
example:
<root>$ /usr/sbin/fsadm <mount_point>
Following is example output when the file system is set up to support large files and when it is
not set up to support large files:
<root>$ /usr/sbin/fsadm /extra
fsadm: /etc/default/fs is used for determining the file system type
largefiles
<root>$ /usr/sbin/fsadm /stand
fsadm: /etc/default/fs is used for determining the file system type
nolargefiles
You can use the /usr/sbin/fsadm command to set the directory to support large files. For
example, to convert a hfs file system from nolargefiles to largefiles, issue the following command:
$ fsadm -f hfs -o largefiles /dev/vg02/lvol1
Alternatively, if the directory does not support large file systems, you can write the core file to
a different directory. Do this by setting the JAVA_CORE_DESTINATION environment variable
(available starting with SDK 1.4.2) to the name of the directory and create the directory. For
example:
$ export JAVA_CORE_DESTINATION=<alt_dir>
$ mkdir $JAVA_CORE_DESTINATION
Java creates a directory named core under the JAVA_CORE_DESTINATION directory where the
core and hs_err_pid<pid>.log files are written. For example:
$ cd $JAVA_CORE_DESTINATION
$ ls
core.29757
$ ll core.29757
total 429296
-rw------- 1 test users 219781020 Aug 29 12:33 core
-rw-rw-rw- 1 test users 2191 Aug 29 12:33 hs_err_pid29757.log
3.2 Collecting Problem Data 55
Page 56

3.2.1.1.5 Ensure Permissions Allow Core Files
Some Java processes run setuid; that is, a process where the effective uid or gid differs from the
real uid or gid. On HP–UX 11.11 and later versions a kernel security feature prevents core file
creation for these processes. Use the following command when you are logged in as the root
user to enable core dumps of setuid Java processes:
$ echo "dump_all/W 1" | adb -w /stand/vmunix /dev/kmem
This capability is turned on only for the current boot.
3.2.1.2 Generating a Core File
Analyzing the core file is essential for troubleshooting problems. Core files are automatically
generated for application aborts. For hung processes and performance issues, you need to generate
them using gdb's dumpcore command.
The gdb dumpcore command forces the generation of a core file without killing a running
process. This command causes a core file named core.<pid> to be created. The current process
state is not modified when this command is issued.
Following is an example for a Java application running on an Integrity system:
$ echo "dumpcore\nq" > gdb_cmds
$ ps -u myuser | grep java
12290 pts/6 12:58 java
$ gdb --command=gdb_cmds -batch /opt/java1.4/bin/IA64N/java 12290
This generates a core file in the current directory with the name core.12290.
On HP-UX 11.31, another way to generate a core file is by using the gcore command. Following
is an example invocation of gcore to dump the core image of process 11050. The core image
will be written to file core.11050 by default:
$ gcore 11050
3.2.1.3 Verifying a Core File
Once you have successfully collected your core file, you should verify that it is complete and
valid with the following two steps.
First, open the core file in gdb and check the error and warning messages. If the message
“<corefilename> is not a core dump: File format not recognized“ is displayed when you open
the file, your core file is invalid. Following is an example of verifying a core file produced by a
32-bit application on a PA-RISC. In this example, the core file is valid.
$ gdb /opt/java1.4/jre/lib/PA_RISC2.0/server/libjunwind.sl core
HP gdb 5.5.7 for PA-RISC 1.1 or 2.0 (narrow), HP-UX 11.00 and target hppa1.1-hp-hpux11.00.
Copyright 1986 - 2001 Free Software Foundation, Inc.
Hewlett-Packard Wildebeest 5.5.7 (based on GDB) is covered by the GNU General Public License. Type "show copying"
to see the conditions to change it and/or distribute copies. Type "show warranty" for warranty/support.
..
Core was generated by `java'.
Program terminated with signal 6, Aborted.
#0 0xc0214db0 in kill+0x10 () from ./libc.2
Second, check to make sure that the core file was not trucated by issuing the “what core”
command. If you do not see the dld.sl version at the bottom of the what output, then the core
file is truncated and is not usable. In the following example, the dld.sl version exists at the
bottom of the what output, so you know the core file is not truncated:
$ what core
core:
some other library names and version information ...
92453-07 dld dld dld.sl B.11.48 EXP 051121
3.2.2 Collecting Fatal Error Log Information
When a Java application aborts, the fatal error log file (hs_err_pid<pid>.log) is generated.
The contents of this file vary depending on the architecture and the Java version (for example,
56 Getting Help from Hewlett-Packard
Page 57

early Java versions generate less information in the fatal error log). Following is a summary of
the type of information contained in this file:
1. The error causing the Java VM to abort, including the pc, process id, and thread id at which
the error occurred. For example:
# An unexpected error has been detected by HotSpot Virtual Machine:
#
# SIGSEGV (11) at pc=7541df20, pid=25675, tid=1
2. The Java version and problematic frame. For example:
# Java VM: Java HotSpot(TM) Server VM (1.4.2
# 1.4.2.10-060112-19:42-IA64N IA64 mixed mode)
# Problematic frame:
# j spin.main([Ljava/lang/String;)V+5
3. Information about the current thread, including:
a. the executing thread
b. siginfo at the point of failure
c. stack pointer and hex dump of the top of memory stack
d. hex dump at the location of the current pc
e. stack range and stack free space
4. Process information, including:
a. a dump of all active threads at the time of the abort (SDK 1.4.2.04+)
b. Java VM state (whether at safepoint or not) (SDK 1.4.2.10+)
c. mutex state (SDK 1.4.2.10+)
d. a summary of heap status; for example:
Heap
def new generation total 5632K, used 144K [6d400000, 6da10000, 6e950000)
eden space 5056K, 2% used [6d400000, 6d424040, 6d8f0000)
from space 576K, 0% used [6d8f0000, 6d8f0000, 6d980000)
to space 576K, 0% used [6d980000, 6d980000, 6da10000)
tenured generation total 12480K, used 0K [6e950000, 6f580000, 71400000)
the space 12480K, 0% used [6e950000, 6e950000, 6e950200, 6f580000)
compacting perm gen total 16384K, used 1118K [71400000, 72400000, 75400000)
the space 16384K, 6% used [71400000, 71517860, 71517a00, 72400000)
e. dynamic libraries loaded by the process (SDK 1.4.2.04+)
f. Java VM arguments (SDK 1.4.2.04+)
g. Java-related environment variables
5. System Information. This includes operating system name, version, CPU, memory, and
system load. For example:
OS: HPUX
uname:HP-UX B.11.23 U ia64
rlimit: STACK 98252k, CORE 2097151k, NOFILE 4096, AS infinity
load average:0.12 0.19 0.22
CPU:total 8 Processor = McKinley
Processor features = branchlong
Memory: 4k page, physical 16743644k
vm_info: Java HotSpot(TM) Server VM (1.4.2.10-060112-19:42-IA64N)
for hp-ux-ia64 built on Jan 12 2006 20:09:37 by jinteg with aCC
3.2.3 Collecting Stack Trace Information
On PA-RISC systems, a stack trace is printed to stderr when the application aborts. On Integrity
systems, branch and general register contents are printed to stderr when an application aborts.
The stack trace (PA-RISC systems) and register contents (Integrity systems) are not printed to
the hs_err_pid<pid>.log file; therefore, the contents of stderr should be captured into a
file and sent to HP along with the hs_err_pid<pid>.log, core file, and libraries.
3.2 Collecting Problem Data 57
Page 58

3.3 Collecting System Information
Along with HP-UX version information and information about which window manager is being
used, it is also useful to know which patches are installed on the system. This information can
be gathered either with swlist or HPjconfig.
Following is an example using the swlist command to retrieve this list:
$ /usr/sbin/swlist
# Initializing...
# Contacting target "mutant"...
#
# Target: mutant:/
#
#
# Bundle(s):
#
B3701AA C.04.50.00 HP GlancePlus/UX Pak For HP-UX 11.23 (s800)
B3901BA C.11.23.03 HP C/ANSI C Developer's Bundle (S800)
B3913DB C.11.23.03 HP aC++ Compiler (S800)
B6848BA 1.4.gm.46.9 Ximian GNOME 1.4 GTK+ Libraries for HP-UX
B8465BA A.02.00.08 HP WBEM Services for HP-UX
B9073BA B.11.23.07.00.00.03 HP-UX iCOD (Instant Capacity)
BUNDLE11i B.11.23.0409.3 Required Patch Bundle for HP-UX 11i v2 (B.11.23),
September 2004
Base-VXVM B.04.10.011 Base VERITAS Volume Manager Bundle 4.1 for HP-UX
CDE-ChineseS B.11.23 Simplified Chinese CDE Environment
CDE-ChineseT B.11.23 Traditional Chinese CDE Environment
CDE-English B.11.23.0409 English CDE Environment
CDE-French B.11.23 French CDE Environment
CDE-German B.11.23 German CDE Environment
CDE-Italian B.11.23 Italian CDE Environment
CDE-Japanese B.11.23 Japanese CDE Environment
CDE-Korean B.11.23 Korean CDE Environment
CDE-Spanish B.11.23 Spanish CDE Environment
CDE-Swedish B.11.23 Swedish CDE Environment
...
HPUXBaseAux B.11.23.0512 HP-UX Base OS Auxiliary
HPUXBaseOS B.11.23 HP-UX Base OS
...
Java15JDK 1.5.0.03.00 Java 1.5 JDK for HP-UX
Following is an example using HPjconfig to collect this information:
$ java -jar HPjconfig.jar -nogui -patches -listreq -tunables -listreq
Log written to HPjconfig_miriel_20070330_033831.log
List of required patches:
PHKL_35029 ksleep patch, required by Java 5.0 runtime (Integrity & PA-RISC).
List of required tunables:
Name Recommended value
nproc 2048
max_thread_proc 3000
nkthread 6000
maxfiles 2*1024
maxfiles_lim 2*1024
maxdsiz 2063835136
More information about HPjconfig may be found in the HPjconfig section of this manual.
3.4 Collecting Java Environment Information
In order to perform core file analysis, you need to collect information about some environment
variables and libraries used by the failed application. The following subsections describe how
to do this.
3.4.1 Environment Variables
To facilitate troubleshooting, it is important to know the value of the environment variables that
can affect the behavior of Java applications (for example, CLASSPATH). To collect these application
58 Getting Help from Hewlett-Packard
Page 59

runtime environment variable values, run the following command under the same environment
(that is, the same user) that the Java application was executed:
(ksh)$ env > app_environment.txt
(csh)$ getenv > app_environment.txt
Include the app_environment.txt file when you send in your collected data files to
Hewlett-Packard.
3.4.2 Libraries
In order to perform core file analysis, you must have access to libraries used by the failed
application. The method used for determining which libraries were used depends on whether
or not gdb is available on the system.
If gdb is not available, then locate files by either examining the stdout of the failed application
or the hs_err_pid<pid>.log file. Either of these should list all the libraries used. Using this
list, manually copy the files.
If gdb is available on the system where the failure occurred, issue gdb's packcore command:
(gdb) packcore
This command creates a compressed tar file called packcore.tar.Z under the current directory.
packcore.tar.Z contains the following:
• modules.tar–a tar file containing all the libraries used by the application. Following is
a listing of an example modules.tar file:
$ tar -tvf modules.tar
-r-xr-xr-x root/sys 130744 2006-04-14 12:01 java
-r-xr-xr-x bin/bin 249856 2005-07-01 01:54 dld.sl
-r-xr-xr-x root/sys 15581184 2006-04-14 12:02 libjvm.sl
-r-xr-xr-x bin/bin 360448 2004-08-30 11:23 libpthread.1
-r-xr-xr-x bin/bin 282624 2004-07-09 14:00 libm.2
-r-xr-xr-x bin/bin 32768 2004-08-26 18:53 librt.2
-r-xr-xr-x bin/bin 1261568 2004-03-26 00:00 libcl.2
-r-xr-xr-x bin/bin 12288 2003-09-03 00:00 libisamstub.1
-r-xr-xr-x bin/bin 217088 2004-12-23 09:36 libCsup.2
-r-xr-xr-x bin/bin 1933312 2005-08-31 22:01 libc.2
-r-xr-xr-x bin/bin 24576 2005-07-01 01:54 libdld.2
-r-xr-xr-x bin/bin 77024 2004-07-27 16:29 libogltls.sl
-r-xr-xr-x root/sys 110592 2006-04-14 12:02 libhpi.sl
-r-xr-xr-x root/sys 86016 2006-04-14 12:02 libverify.sl
-r-xr-xr-x root/sys 266240 2006-04-14 12:02 libjava.sl
-r-xr-xr-x root/sys 110592 2006-04-14 12:02 libzip.sl
-rwxr-xr-x user1/lang 12288 2007-03-02 14:31 libstacktrace.sl
• progname.txt–the name of the program that core dumped; in this case, it is java,
• core–the core file.
In some situations, only a core file can be obtained. In this case limited troubleshooting can take
place since some crucial pieces of information are missing
There is one additional library that should be collected: libjunwind. This library is used by
gdb to unwind Java bytecode frames; its routines help make stack traces more readable and
understandable. Since this library is only used during debugging, it is not included in the tar
file generated by packcore.
The following table shows the location of the libjunwind library for PA-RISC applications:
3.4 Collecting Java Environment Information 59
Page 60

Table 3-1 Libjunwind Library Location for PA-RISC Systems
libjunwind LocationApplication Type
/opt/<java_vers>/jre/lib/PA_RISC/server/libjunwind.slPA1.1 applications (java -pa11)
PA2.0 32–bit applications (default
PA-RISC)
-d64)
On Integrity systems, beginning with SDK 1.4.0.10 and JDK 1.5.0.03, there are two libjunwind
libraries for each Java VM, libjunwind64.so and libunwind.so. The following table shows
the location of these libraries for both 32–bit and 64–bit applications:
Table 3-2 Libjunwind Library Location for Integrity Systems
32–bit applications
64–bit applications
3.5 Packaging Files
The packcore command produced the packcore.tar.Z archive, which contains the core file,
core, and the modules.tar file. You now need to package packcore.tar.Z with the other
files needed for troubleshooting. One method for packaging is to use the Java archive tool, jar.
This tool is included with all Java installations.
For example, to collect all files needed for core file analysis into file debug.jar, including
packcore.tar.Z, hs_err_pid7145.log, app_environment.txt, and libjunwind.sl,
issue the following command:
jar cvf debug.jar packcore.tar.Z hp_err_pid7145.log \
app_environment.txt libjunwind.sl
/opt/<java_vers>/jre/lib/PA_RISC2.0/server/libjunwind.sl
/opt/<java_vers>/jre/lib/PA_RISC2.0W/server/libjunwind.slPA2.0 64–bit applications (java
libjunwind LocationApplication Type
/opt/<java_vers>/jre/lib/IA64N/server/libjunwind*.so
/opt/<java_vers>/jre/lib/IA64W/server/libjunwind*.so
60 Getting Help from Hewlett-Packard
Page 61

4 Core File Analysis
The previous chapter described how to collect necessary information before opening a call to
HP Support to get help troubleshooting Java applications. Sometimes it is possible to at least
attempt the core file analysis on your own. This chapter walks through an example core file
analysis step by step. By studying this example, you will learn some skills needed to analyze
your own core file.
HP-UX writes a file containing a core image of a process when certain signals are received. The
most common reasons a core file is generated are:
• Memory violations
• Illegal instructions
• Floating-point exceptions
• Bus errors
• User-generated quit signals
• User-requested core generation
Generally the core image file is called core and is written in the current working directory.
A core file is a dump of the process state at the time of the problem. The file contains sufficient
information to determine what the process was doing when it failed. This information includes:
• Threads
• Register values
• Contents of attached data memory regions
• Kernel version
• Command name
4.1 Sample Java Application
The sample application contains native code (C) and Java code. This particular application aborts
in native code since this code contains a defect. The defect causes a runtime failure, which results
in a core dump.
The example consists of three files for an application calledStackTrace:
• StackTraceJob — the script to create the core file
• StackTrace.java — the Java source code
• stacktrace.c — the C source code
These three files should be placed in a directory called StackTrace.
The following subsections contain listings of each of these three files. This example is run on a
PA-RISC system. It can be tested on any PA or Integrity system though, as long as some changes
are made to the StackTraceJob script.
4.1.1 StackTraceJob
#!/bin/ksh
# set JAVA_HOME
export JAVA_HOME=/opt/java1.4
# set PATH
export PATH=$JAVA_HOME/bin:$PATH
# Compile java bytecode
/usr/bin/echo "Compile java code"
javac StackTrace.java
# create header file
4.1 Sample Java Application 61
Page 62

/usr/bin/echo "Create header file"
javah -verbose -jni StackTrace
# compile jni code
/usr/bin/echo "Compile c code"
/usr/bin/cc +z -c -I $JAVA_HOME/include \
-I $JAVA_HOME/include/hp-ux stacktrace.c
# create shared library
/usr/bin/echo "Create shared library"
/usr/bin/ld -b -o libstacktrace.sl stacktrace.o
/usr/bin/echo "Run StackTrace program"
export SHLIB_PATH=.
export LD_LIBRARY_PATH=.
java StackTrace
NOTE: If this script is run on an Integrity system, change it from:
# create shared library
/usr/bin/echo "Create shared library"
/usr/bin/ld -b -o libstacktrace.sl stacktrace.o
to:
# create shared library
/usr/bin/echo "Create shared library"
/usr/bin/ld -b -o libstacktrace.so stacktrace.o
4.1.2 StackTrace.java
// File StackTrace.java
public class StackTrace {
native static String dumpCore(int i);
//**************************************************
public static void method1(int ci) {
System.out.println("Calling method2()");
StackTrace.method2(ci);
} // end method1
//**************************************************
public static void method2(int ci) {
System.out.println("Calling method3()");
StackTrace.method3(ci);
} // end method2
//**************************************************
public static void method3(int ci) {
System.out.println("Calling methodMakeCall()");
StackTrace.methodMakeCall(ci);
} // end method3
//**************************************************
public static void methodMakeCall(int ci) {
try {
System.loadLibrary("stacktrace");
}
catch (UnsatisfiedLinkError Err) {
System.out.println("error: " + Err);
System.exit(1);
}
62 Core File Analysis
Page 63

System.out.println("Call dumpCore to convert " + ci +
" to a binary string!");
System.out.println("The binary String: " + StackTrace.dumpCore(ci));
} // end methodMakeCall
//**************************************************
public static void main(String args[]) {
int convertInt;
System.out.println();
if(args.length == 1) {
convertInt = Integer.parseInt(args[0]);
}
else {
convertInt = 757;
}
System.out.println("Calling method1()");
StackTrace.method1(convertInt);
System.out.println("Back in main, all done!");
} // end main
} // end StackTrace
4.1.3 stacktrace.c
// File stacktrace.c
#include "StackTrace.h"
#include <stdio.h>
JNIEXPORT jstring JNICALL
Java_StackTrace_dumpCore(JNIEnv *env, jclass class, jint intarg) {
jclass classid;
jmethodID methodid;
printf("In dumpCore\n");
// Problem code. The Class: java.lang.IntegerX does not exist,
// but the exception is cleared and the program continues.
// Ultimately, failing and dumping core when getting the methodid.
// To fix, comment out the following 2 lines.
// /*
classid = (*env)->FindClass(env, "java/lang/IntegerX");
(*env)->ExceptionClear(env);
// */
// Working code. The Class: java.lang.Integer exists. The lines
// following the FindClass manage printing out of a stack trace,
// clearing an exception, and returning to the java main when
// FindClass fails.
//
// Uncomment the following 6 lines and rebuild to see the program work!
/*
classid = (*env)->FindClass(env, "java/lang/Integer");
(*env)->ExceptionDescribe(env);
(*env)->ExceptionClear(env);
if(classid == NULL) {
return (*env)->NewStringUTF(env, "JNI FindClass failed!");
}
*/
methodid = (*env)->GetStaticMethodID(env, classid, "toBinaryString",
4.1 Sample Java Application 63
Page 64

"(I)Ljava/lang/String;");
(*env)->ExceptionDescribe(env);
(*env)->ExceptionClear(env);
if(methodid == NULL) {
return (*env)->NewStringUTF(env, "JNI GetStaticMethodID failed!");
}
return (*env)->CallStaticObjectMethod(env, classid, methodid, intarg);
}
4.2 Building the Application
The StackTraceJob script can be used on PA-RISC systems to compile, build, and execute the
application resulting in a core dump. Before executing this script, review the Core File Checklist
in the previous chapter to make sure your system is correctly configured to save complete core
files.
This script can be used on an Integrity system if you make the changes described in the Note in
the “StackTraceJob” section; that is, rename libstacktrace.sl to libstacktrace.so.
NOTE: There are instructions in stacktrace.c describing how to eliminate the errors so you
can see how the corrected application will run.
Execute theStackTraceJob script. You will see output similar to the following:
$ StackTraceJob
Compile java code
Create header file
[Search path = /opt/java1.4/jre/lib/rt.jar:/opt/java1.4/jre/lib/i18n.jar:
/opt/java1.4/jre/lib/sunrsasign.jar:/opt/java1.4/jre/lib/jsse.jar:
/opt/java1.4/jre/lib/jce.jar:/opt/java1.4/jre/lib/charsets.jar:
/opt/java1.4/jre/classes:.]
[Loaded ./StackTrace.class]
[Loaded /opt/java1.4/jre/lib/rt.jar(java/lang/Object.class)]
[Creating file StackTrace.h]
Compile c code
Create shared library
Run StackTrace program
Calling method1()
Calling method2()
Calling method3()
Calling methodMakeCall()
Call dumpCore to convert 757 to a binary string!
In dumpCore
Stack_Trace: error while unwinding stack
( 0) 0xc41452ac report_and_die__7VMErrorFv + 0x4c
[/opt/java1.4/jre/lib/PA_RISC2.0/server/libjvm.sl]
( 1) 0xc40463e4 JVM_handle_hpux_signal__Q2_2os4HpuxSFiP9__siginfoPvT1 + 0x2bc
[/opt/java1.4/jre/lib/PA_RISC2.0/server/libjvm.sl]
( 2) 0xc40419dc signalHandler__Q2_2os4HpuxSFiP9__siginfoPv + 0x4c
[/opt/java1.4/jre/lib/PA_RISC2.0/server/libjvm.sl]
( 3) 0xc0213f90 _sigreturn [/usr/lib/libc.2]
#
# An unexpected error has been detected by HotSpot Virtual Machine:
#
# SIGSEGV (11) at pc=c3ed2ec8, pid=28973, tid=1 # # Java VM: Java HotSpot(TM) Server VM
# (1.4.2 1.4.2.10-060112-16:07-PA_RISC2.0 PA2.0 (aCC_AP) mixed mode)
# Problematic frame:
# V [libjvm.sl+0x6d2ec8]
#
# An error report file with more information is saved as hs_err_pid28973.log
# Please report this error to HP customer support.
#
The following files are created as a result of running this script:
• StackTrace.class—the class file
• StackTrace.h—the header file for class StackTrace
• core—the core file
• hs_err_pid28973.log—the error log file
64 Core File Analysis
Page 65

• libstacktrace.sl—the runtime library
• stacktrace.o—the object file
4.3 Verify Core File
Before you proceed further, verify that the core file, core, is complete and valid. You can do this
in two steps.
First, open the file in gdb and check the error and warning messages.
$ gdb /opt/java1.4/bin/PA_RISC2.0/java core
HP gdb 5.5.7 for PA-RISC 1.1 or 2.0 (narrow), HP-UX 11.00
and target hppa1.1-hp-hpux11.00.
Copyright 1986 - 2001 Free Software Foundation, Inc.
Hewlett-Packard Wildebeest 5.5.7 (based on GDB) is covered by the
GNU General Public License. Type "show copying" to see the conditions to
change it and/or distribute copies. Type "show warranty" for warranty/support.
..
Core was generated by 'java'.
Program terminated with signal 6, Aborted.
#0 0xc0214db0 in kill+0x10() from ./libc.2
From the output above, you can tell that core file is valid.
Second, check that the core file was not truncated by issuing the “what core” command and
searching for the existence of the dld.sl version at the bottom of the output:
$ what core
core:
1.4.2.10-060112-16:07-PA_RISC2.0 (java) Built: 06/01/12-16:52 View:
jinteg_h1.4.2.10.rc4b1
1.4.2.10-060112-16:07-PA_RISC2.0 (libzip.sl) Built: 06/01/12-16:53 View:
jinteg_h1.4.2.10.rc4b1
1.4.2.10-060112-16:07-PA_RISC2.0 (libjava.sl) Built: 06/01/12-16:51 View:
jinteg_h1.4.2.10.rc4b1
1.4.2.10-060112-16:07-PA_RISC2.0 (libverify.sl) Built: 06/01/12-16:48 View:
jinteg_h1.4.2.10.rc4b1
1.4.2.10-060112-16:07-PA_RISC2.0 (libhpi.sl) Built: 06/01/12-16:47 View:
jinteg_h1.4.2.10.rc4b1
$Revision: libpthread.1: B11.23.0409LR
HP-UX libm shared PA1.1 C Math Library 20040526 (142440) UX11.23
fs_amod.s $Revision: 1.9.1.1 $
libcl.sl version B.11.01.18 - Jul 9 2003
$ B.11.23 Aug 7 2004 10:28:46 $
1.4.2.10-060112-16:07-PA_RISC2.0 (libjvm.sl) Built: 06/01/12-16:16 View:
jinteg_h1.4.2.10.rc4b1
HP-UX libisamstub.sl B3907DB/B3909DB B.11.23 (PA RISC) Fri Apr 25 21:19:01 CDT 2003
$ PATCH_11.23/PATCH_ID Aug 31 2005 10:11:57 $
OpenGL 1.1 Revision 1.41 on HP-UX 11.00 $Date: 27-Jul-04.15:39:45 $
$Revision: 20040727.29209 $ libogltls.2 SMART_BIND
92453-07 dld dld dld.sl B.11.44.05 050701
If the dld version is displayed at the bottom of the output, the core file is valid.
4.4 Debugging On Same System
If you are debugging the core file on the same system where it was created, you do not need to
perform the steps outlined in the “Packaging Files For Debugging On Different System” and
“Unpacking Files On Debugging System” sections. Instead, proceed to the “Example gdb Session”
section.
4.5 Packaging Files For Debugging On Different System
If you will debug the core file on a different system than the one where it was created, you need
to collect problem data essential for analyzing the core file.
Collect the following items:
4.3 Verify Core File 65
Page 66

• All source files (.java, .h, .c).
• All .class files.
• The command line used to run the application program. In this example, the StackTraceJob
script.
Now, use gdb to pack the core file.
$ gdb /opt/java1.4/bin/PA_RISC2.0/java core
HP gdb 5.5.7 for PA-RISC 1.1 or 2.0 (narrow), HP-UX 11.00 and target hppa1.1-hp-hpux11.00.
Copyright 1986 - 2001 Free Software Foundation, Inc.
Hewlett-Packard Wildebeest 5.5.7 (based on GDB) is covered by the GNU General Public License. Type
"show copying" to see the conditions to change it and/or distribute copies. Type "show warranty"
for warranty/support.
..
warning: core file may not match specified executable file.
Core was generated by `java'.
Program terminated with signal 6, Aborted.
#0 0xc0214db0 in kill+0x10
warning: No debug info available - Trying to print as integer
() from /usr/lib/libc.2
(gdb) packcore
The core file has been added to packcore.tar and the core file has been removed.
(gdb) quit
The packcore command creates a compressed tar file named packcore.tar.Z. This file
contains the core file and a tar file that has all the libraries used in the application. Refer to
Section 3.4.2 for more details about the contents of the packcore.tar.Z file.
Now bundle all the files needed for debugging using jar. This also includes application files,
if any. Before bundling the files, copy the correct libjunwind library (see Section 3.4.2) to the
directory since this library needs to be included in the bundle.
$ cp /opt/java1.4/jre/lib/PA_RISC2.0/server/libjunwind.sl libjunwind.sl
$ jar cvf bundleit.jar packcore.tar.Z hs_err_pid28973.log \
libjunwind.sl
added manifest
adding: packcore.tar.Z(in = 12323556) (out= 11532742)(deflated 6%)
adding: hs_err_pid28973.log(in = 5328) (out= 2195)(deflated 58%)
adding: libjunwind.sl(in = 217088) (out= 58863)(deflated 72%)
$ ll bundleit.jar
-rw-rw-r-- 1 user1 lang 11595348 Mar 30 14:29 bundleit.jar
The following section shows the contents of the bundleit.jar file.
You can now delete packcore.tar.Z, hs_err_pid28973.log, and libjunwind.sl since
all these files are included in the bundleit.jar file.
4.6 Unpacking Files On Debugging System
Skip this section if you are debugging the core file on the same system where it was created.
Move the bundleit.jar file to the system where you will be analyzing the core file, and use
jar to extract the files.
$ jar xvf bundleit.jar
created: META-INF/
extracted: META-INF/MANIFEST.MF
extracted: core
extracted: modules.tar
extracted: hs_err_pid28973.log
extracted: libjunwind.sl
$
$ ll
drwxrwxr-x 2 user1 lang 4096 Mar 30 14:37 META-INF
-rw-rw-r-- 1 user1 lang 11595348 Mar 30 14:29 bundleit.jar
-rw-rw-r-- 1 user1 lang 5328 Mar 30 14:37 hs_err_pid28973.log
-rw-rw-r-- 1 user1 lang 217088 Mar 30 14:37 libjunwind.sl
66 Core File Analysis
Page 67

-rw-rw-r-- 1 user1 lang 12323556 Mar 30 14:37 packcore.tar.Z
$
Uncompress and extract the files from the packcore.tar.Z file:
$ uncompress packcore.tar.Z
$ tar -xvf packcore.tar
packcore/
packcore/modules.tar
packcore/progname.txt
packcore/core
Delete the packcore.tar file since you have extracted the files. Next, move the modules.tar
and core files back to the current directory so all the files needed for debugging are together.
Finally, unpack the modules.tar file.
$ rm packcore.tar
$ mv packcore/core .
$ mv packcore/modules.tar .
$ tar -xvf modules.tar
java
dld.sl
libjvm.sl
libpthread.1
libm.2
librt.2
libcl.2
libisamstub.1
libCsup.2
libc.2
libdld.2
libogltls.sl
libhpi.sl
libverify.sl
libjava.sl
libzip.sl
libstacktrace.sl
Remove the modules.tar file since you no longer need it.
$ rm modules.tar
Following is a listing of the files in the directory:
$ ll
total 63800
drwxrwxr-x 2 user1 lang 4096 Mar 30 14:37 META-INF
-rw-rw-r-- 1 user1 lang 11595348 Mar 30 14:29 bundleit.jar
-rw------- 1 user1 lang 191551228 Mar 30 14:14 core
-r-xr-xr-x 1 user1 lang 249856 Jul 1 2005 dld.sl
-rw-rw-r-- 1 user1 lang 5328 Mar 30 14:37 hs_err_pid28973.log
-r-xr-xr-x 1 user1 lang 130744 Apr 14 2006 java
-r-xr-xr-x 1 user1 lang 217088 Dec 23 2004 libCsup.2
-r-xr-xr-x 1 user1 lang 1933312 Aug 31 2005 libc.2
-r-xr-xr-x 1 user1 lang 1261568 Mar 26 2004 libcl.2
-r-xr-xr-x 1 user1 lang 24576 Jul 1 2005 libdld.2
-r-xr-xr-x 1 user1 lang 110592 Apr 14 2006 libhpi.sl
-r-xr-xr-x 1 user1 lang 12288 Sep 3 2003 libisamstub.1
-r-xr-xr-x 1 user1 lang 266240 Apr 14 2006 libjava.sl
-rw-rw-r-- 1 user1 lang 217088 Mar 30 14:37 libjunwind.sl
-r-xr-xr-x 1 user1 lang 15581184 Apr 14 2006 libjvm.sl
-r-xr-xr-x 1 user1 lang 282624 Jul 9 2004 libm.2
-r-xr-xr-x 1 user1 lang 77024 Jul 27 2004 libogltls.sl
-r-xr-xr-x 1 user1 lang 360448 Aug 30 2004 libpthread.1
-r-xr-xr-x 1 user1 lang 32768 Aug 26 2004 librt.2
-rwxr-xr-x 1 user1 lang 12288 Mar 30 14:14 libstacktrace.sl
-r-xr-xr-x 1 user1 lang 86016 Apr 14 2006 libverify.sl
-r-xr-xr-x 1 user1 lang 110592 Apr 14 2006 libzip.sl
drwxrwxr-x 2 user1 lang 4096 Mar 30 14:44 packcore
4.6 Unpacking Files On Debugging System 67
Page 68

4.7 Example gdb Session
Before beginning core file analysis, examine the fatal error log file, hs_err_pid<pid>.log.
This file contains useful information that will help you troubleshoot the problem. For more
information about the contents of the hs_err_pid<pid>.log file, refer to Section 3.2.2.,
Collecting Fatal Error Log Information .
You are now ready to examine the core file.
This document assumes the reader understands HP-UX procedure calling conventions. For more
information about these conventions, refer to the following webpages and documents:
• HP-UX Development Tools:
http://docs.hp.com/en/dev.html
• Precision Architecture Runtime Architecture:
http://devresource.hp.com/drc/STK/docs/archive/rad_11_0_32.pdf?jumpid=reg_R1002_USEN
• PA-RISC 64-bit Supplement:
http://devresource.hp.com/drc/STK/docs/archive/pa64supp.pdf?jumpid=reg_R1002_USEN
• Assembler Reference:
http://docs.hp.com/en/92432-90012/index.html
• IA64-Runtime Architecture Conventions (if debugging on Integrity systems):
http://devresource.hp.com/drc/resources/conventions.pdf?jumpid=reg_R1002_USEN
Before you invoke gdb on the core file, you need to set some gdb environment variables to
facilitate debugging. If you are debugging on a different system than the one where the core file
was created, set GDB_SHLIB_PATH to your current directory; otherwise, it should not be set.
You need to set GDB_JAVA_UNWINDLIB, and how you set it depends on whether you are
debugging on the same system or a different one. If you are debugging on the same system, set
it to the full path of the Java unwind library for the Java release (see Section 3.4.2). If you are
debugging on a different system, set it to point to the libjunwind.sl file included in your
bundle. The screen below illustrates the setting of these environment variables:
# Debugging on the same system
$ export GDB_JAVA_UNWINDLIB=/opt/java1.4/jre/lib/PA_RISC2.0/server/libjunwind.sl
# Debugging on a different system
#
$ export GDB_SHLIB_PATH=.
$ export GDB_JAVA_UNWINDLIB=./libjunwind.sl
After setting the environment variable(s), you are ready to invoke gdb on the core file. For
simplicity, you have placed all the files you need in the same directory. If you are debugging on
a different system than the one where the core dump was created, invoke gdb using java as
the program name since the java binary was included in the bundle you moved to the debugging
system. However, if you are debugging on the same system where the core dump occurred,
invoke gdb using the correct version of java for the executable. In this example, the executable
is a 32-bit PA-RISC file, so use /opt/java1.4/bin/PA_RISC2.0/java in place of java in
the following gdb command:
NOTE: Refer to the first set of examples in Section 1.5.2 to determine the complete java path
when debugging on the same system where the core file was created.
$ gdb java core
HP gdb 5.5.7 for PA-RISC 1.1 or 2.0 (narrow), HP-UX 11.00 and target hppa1.1-hp-hpux11.00.
Copyright 1986 - 2001 Free Software Foundation, Inc.
Hewlett-Packard Wildebeest 5.5.7 (based on GDB) is covered by the GNU General Public License.
Type "show copying" to see the conditions to change it and/or distribute copies.
Type "show warranty" for warranty/support.
..
Core was generated by `java'.
68 Core File Analysis
Page 69

Program terminated with signal 6, Aborted.
#0 0xc0214db0 in kill+0x10 () from ./libc.2
The first step is to look at the stack trace of the failing thread. Do this by issuing gdb's backtrace
command. Following is the backtrace which has been annotated with the comment “FAILED
HERE” at the point of failure:
(gdb) backtrace
#0 0xc0214db0 in kill+0x10 () from ./libc.2
#1 0xc01ab554 in raise+0x24 () from ./libc.2
#2 0xc01f1a78 in abort_C+0x160 () from ./libc.2
#3 0xc01f1ad4 in abort+0x1c () from ./libc.2
#4 0xc4042590 in os::abort+0x98 () from ./libjvm.sl
#5 0xc4145f24 in VMError::report_and_die+0xcc4 () from ./libjvm.sl
#6 0xc40463e4 in os::Hpux::JVM_handle_hpux_signal+0x2bc () from ./libjvm.sl
#7 0xc40419dc in os::Hpux::signalHandler+0x4c () from ./libjvm.sl
#8 <signal handler called>
*** FAILED HERE ***
#9 0xc3ed2ec8 in get_method_id+0x128 () from ./libjvm.sl
#10 0xc3ed34d0 in jni_GetStaticMethodID+0xf0 () from ./libjvm.sl
#11 0xc00bf398 in Java_StackTrace_dumpCore+0xf8 () from ./libstacktrace.sl
#12 0x77c09e54 in interpreted frame: StackTrace::dumpCore (int) ->java.lang.String
#13 0x77c02e08 in interpreted frame: StackTrace::methodMakeCall (int) ->void
#14 0x77c02ee4 in interpreted frame: StackTrace::method3 (int) ->void
#15 0x77c02ee4 in interpreted frame: StackTrace::method2 (int) ->void
#16 0x77c02ee4 in interpreted frame: StackTrace::method1 (int) ->void
#17 0x77c02ee4 in interpreted frame: StackTrace::main (java.lang.String[]) ->void
#18 0x77c00100 in Java entry frame
#19 0xc3ec1f08 in JavaCalls::call_helper+0x1d8 () from ./libjvm.sl
#20 0xc403d664 in os::os_exception_wrapper+0x34 () from ./libjvm.sl
#21 0xc3ec1d04 in JavaCalls::call+0x8c () from ./libjvm.sl
#22 0xc3ed0ad0 in jni_invoke_static+0x1d8 () from ./libjvm.sl
#23 0xc3ee8214 in jni_CallStaticVoidMethod+0x15c () from ./libjvm.sl
#24 0x581c in main+0xb14 ()
From the backtrace output, you see that the signal handler was called in frame 8. That means
that the failure was in frame 9. Following is the address where the failure took place in frame 9:
#9 0xc3ed2ec8 in get_method_id+0x128 () from ./libjvm.sl
Print out the instruction at this address by using the following gdb command:
(gdb) x/i 0xc3ed2ec8
0xc3ed2ec8 <get_method_id()+0x128>: ldw 0(%r6),%r26
This instruction loads the value pointed to by R6+0 into R26. Print out the value of R6:
(gdb) frame 9
#9 0xc46d2ec8 in get_method_id+0x128 () from ./libjvm.sl
(gdb) p/x $r6
$1 = 0x0
R6 contains zero, which is an invalid address.
To discover the root of the problem, you need to examine the instructions that lead up to the
failure. Start by obtaining information about the get_method_id() function:
(gdb) info functions get_method_id
All functions matching regular expression "get_method_id":
Non-debugging symbols:
0xc3ed2da0 get_method_id(JNIEnv_ *, _jclass *, char *, char *, bool, Thread *)
This output shows that the get_method_id() function has six parameters and it begins at
address 0xc3ed2da0. You now want to list the instructions from the beginning of
get_method_id() to the point of failure, which is get_method_id()+0x128 (see frame 9 in
the backtrace output). Before you do this, determine how many instructions to display. Compute
this by subtracting the address at the point of failure from the address of the start of
get_method_id(), dividing by 4 (since there are 4 bytes per 32–bit address), and adding 1:
(gdb) print (0xc3ed2ec8-0xc3ed2da0)/4 + 1
$7 = 75
4.7 Example gdb Session 69
Page 70

You want to display 75 instructions from the beginning of the get_method_id() function to
the point of failure for frame 9. Since this is a substantial number of instructions, redirect the
output to a file:
(gdb) set redirect-file frame9instrs
(gdb) set redirect on
Redirecting output to frame9instrs.
(gdb) x /75i 0xc3ed2da0
(gdb) set redirect off
You would probably print out this file to examine it in detail.
Let's examine the listing of the redirect file, frame9instrs. The parameters to the
get_method_id() function have been removed from the listing to improve readability. They
are set to the following values for all calls to get_method_id() in this listing:
(JNIEnv_ *, _jclass *, char *, char *, bool, Thread *)
A quick recap of PA-RISC calling conventions is in order before examining these 75 instructions
because you are going to be looking at the parameters passed into the function. When PA-RISC
applications pass parameters, they use general registers 26, 25, 24, and 23. Parameter 1 is passed
in general register 26, parameter 2 in general register 25, parameter 3 in general register 24, and
parameter 4 in general register 23. If there are more than four parameters to pass, the additional
ones are stored in the calling frame and picked up in the called frame.
Details about the assembly code follow the listing. The listing has been annotated with comments
for purposes of discussion:
$ more frame9instrs
0xc3ed2da0 <get_method_id()>: stw %rp,-0x14(%sp)
0xc3ed2da4 <get_method_id()+0x4>: depd %r5,31,32,%r6
0xc3ed2da8 <get_method_id()+0x8>: depd %r7,31,32,%r8
0xc3ed2dac <get_method_id()+0xc>: stw,ma %r3,0xc0(%sp)
0xc3ed2db0 <get_method_id()+0x10>: depd %r9,31,32,%r10
0xc3ed2db4 <get_method_id()+0x14>: ldw -0xf8(%sp),%r3
0xc3ed2db8 <get_method_id()+0x18>: stw %r4,-0xbc(%sp)
0xc3ed2dbc <get_method_id()+0x1c>: mfia %r4
0xc3ed2dc0 <get_method_id()+0x20>: addil L'-0x800,%r4,%r1
0xc3ed2dc4 <get_method_id()+0x24>: std %r6,-0xb8(%sp)
0xc3ed2dc8 <get_method_id()+0x28>: ldo 0x7e4(%r1),%r4
*** COPY PARAMETER 4 IN R23 TO R7
0xc3ed2dcc <get_method_id()+0x2c>: copy %r23,%r7
0xc3ed2dd0 <get_method_id()+0x30>: std %r8,-0xb0(%sp)
*** COPY PARAMETER 2 in R25 to R6 ***
0xc3ed2dd4 <get_method_id()+0x34>: copy %r25,%r6
*** COPY PARAMETER 3 IN R24 TO R5
0xc3ed2dd8 <get_method_id()+0x38>: copy %r24,%r5
0xc3ed2ddc <get_method_id()+0x3c>: std %r10,-0xa8(%sp)
0xc3ed2de0 <get_method_id()+0x40>: copy %r23,%r26
0xc3ed2de4 <get_method_id()+0x44>: call 0xc3eaeebc <strlen>
0xc3ed2de8 <get_method_id()+0x48>: stw %r19,-0x20(%sp)
0xc3ed2dec <get_method_id()+0x4c>: ldw -0x20(%sp),%r19
0xc3ed2df0 <get_method_id()+0x50>: copy %ret0,%r25
0xc3ed2df4 <get_method_id()+0x54>: copy %r7,%r26
0xc3ed2df8 <get_method_id()+0x58>: call 0xc40370d8 <oopFactory::new_symbol(char const *, int, Thread *)>
0xc3ed2dfc <get_method_id()+0x5c>: copy %r3,%r24
0xc3ed2e00 <get_method_id()+0x60>: ldw -0x20(%sp),%r19
*** COMPARE AND BRANCH TO GET_METHOD_ID()+0XE0 ***
0xc3ed2e04 <get_method_id()+0x64>: cmpb,<> %ret0,%r0,0xc3ed2e80 <get_method_id()+0xe0>
0xc3ed2e08 <get_method_id()+0x68>: copy %ret0,%r7
0xc3ed2e0c <get_method_id()+0x6c>: stw %r0,-0x7c(%sp)
0xc3ed2e10 <get_method_id()+0x70>: b 0xc3ed2ea4 <get_method_id()+0x104>
0xc3ed2e14 <get_method_id()+0x74>: ldw 4(%r3),%rp
0xc3ed2e18 <get_method_id()+0x78>: call 0xc3e7f230 <instanceKlass::
lookup_method_in_all_interfaces(symbolOopDesc *, symbolOopDesc *) const>
0xc3ed2e1c <get_method_id()+0x7c>: ldo 8(%r31),%r26
0xc3ed2e20 <get_method_id()+0x80>: ldw -0x20(%sp),%r19
0xc3ed2e24 <get_method_id()+0x84>: copy %ret0,%r9
0xc3ed2e28 <get_method_id()+0x88>: cmpb,=,n %r0,%r9,0xc3ed30dc <get_method_id()+0x33c>
0xc3ed2e2c <get_method_id()+0x8c>: ldw 0x28(%r9),%ret1
0xc3ed2e30 <get_method_id()+0x90>: stw %ret1,-0x40(%sp)
0xc3ed2e34 <get_method_id()+0x94>: ldo -0x40(%sp),%r20
70 Core File Analysis
Page 71

0xc3ed2e38 <get_method_id()+0x98>: ldw,o 0(%r20),%r31
0xc3ed2e3c <get_method_id()+0x9c>: ldb -0xf1(%sp),%r7
0xc3ed2e40 <get_method_id()+0xa0>: extrw,u %r31,28,1,%r23
0xc3ed2e44 <get_method_id()+0xa4>: cmpb,od,n %r7,%r23,0xc3ed30dc <get_method_id()+0x33c>
0xc3ed2e48 <get_method_id()+0xa8>: call 0xc400c248 <methodOopDesc::jni_id(void)>
0xc3ed2e4c <get_method_id()+0xac>: copy %r9,%r26
0xc3ed2e50 <get_method_id()+0xb0>: ldw -0x20(%sp),%r19
0xc3ed2e54 <get_method_id()+0xb4>: ldw -0xd4(%sp),%rp
0xc3ed2e58 <get_method_id()+0xb8>: ldd -0xa8(%sp),%r10
0xc3ed2e5c <get_method_id()+0xbc>: extrd,u %r10,31,32,%r9
0xc3ed2e60 <get_method_id()+0xc0>: ldd -0xb0(%sp),%r8
0xc3ed2e64 <get_method_id()+0xc4>: ldd -0xb8(%sp),%r6
0xc3ed2e68 <get_method_id()+0xc8>: extrd,u %r8,31,32,%r7
0xc3ed2e6c <get_method_id()+0xcc>: extrd,u %r6,31,32,%r5
0xc3ed2e70 <get_method_id()+0xd0>: ldw -0xbc(%sp),%r4
0xc3ed2e74 <get_method_id()+0xd4>: ret
0xc3ed2e78 <get_method_id()+0xd8>: ldw,mb -0xc0(%sp),%r3
0xc3ed2e7c <get_method_id()+0xdc>: b,n 0xc3ed2e7c <get_method_id()+0xdc>
*** TARGET OF THE BRANCH AT OFFSET 0X64 ***
0xc3ed2e80 <get_method_id()+0xe0>: ldw 0x70(%r3),%r26
0xc3ed2e84 <get_method_id()+0xe4>: ldw 8(%r26),%ret0
0xc3ed2e88 <get_method_id()+0xe8>: ldo 4(%ret0),%r31
0xc3ed2e8c <get_method_id()+0xec>: ldw 0xc(%r26),%r21
0xc3ed2e90 <get_method_id()+0xf0>: cmpb,<<,n %r21,%r31,0xc3ed2f9c <get_method_id()+0x1fc>
0xc3ed2e94 <get_method_id()+0xf4>: stw %r31,8(%r26)
0xc3ed2e98 <get_method_id()+0xf8>: stw %r7,0(%ret0)
0xc3ed2e9c <get_method_id()+0xfc>: ldw 4(%r3),%rp
0xc3ed2ea0 <get_method_id()+0x100>: stw %ret0,-0x7c(%sp)
0xc3ed2ea4 <get_method_id()+0x104>: cmpb,<>,n %r0,%rp,0xc3ed2fb0 <get_method_id()+0x210>
0xc3ed2ea8 <get_method_id()+0x108>: cmpb,<> %r5,%r0,0xc3ed2fb8 <get_method_id()+0x218>
0xc3ed2eac <get_method_id()+0x10c>: stw %r0,-0x70(%sp)
0xc3ed2eb0 <get_method_id()+0x110>: addil L'-0xf000,%r19,%r1
0xc3ed2eb4 <get_method_id()+0x114>: ldw 0x360(%r1),%r7
0xc3ed2eb8 <get_method_id()+0x118>: ldo 0x3c4(%r7),%r22
0xc3ed2ebc <get_method_id()+0x11c>: stw %r22,-0x6c(%sp)
0xc3ed2ec0 <get_method_id()+0x120>: stw %r22,-0x70(%sp)
0xc3ed2ec4 <get_method_id()+0x124>: call 0xc3ec3ac8 <java_lang_Class::is_primitive(oopDesc *)>
*** POINT OF FAILURE; R6 IS 0 ***
0xc3ed2ec8 <get_method_id()+0x128>: ldw 0(%r6),%r26
Now let's examine specific instructions that pertain to the failure. You know that at the point of
the failure, R6 is equal to 0. You need to find out why. Do this by looking at the code to examine
where R6 is set. The first place R6 is set is at instruction get_method_id()+0x34:
0xc3ed2dd4 <get_method_id()+0x34>: copy %r25,%r6
In this instruction, general register R25, which holds the value for _jclass (the second parameter
passed to get_method_id()) is copied into general register R6.
Now trace the value passed into frame 9 by examining frame 10 and the contents of general
register R25. Look at the backtrace again. It reveals that the address for frame 10 is:
#10 0xc3ed34d0 in jni_GetStaticMethodID+0xf0 () from ./libjvm.sl
This address is the instruction at offset 0xf0 in the jni_GetStaticMethodID() function. This
is where the program returned from jni_GetStaticMethodID() to get_method_id().
Take this offset, which is a hexadecimal byte offset of the return point, divide it by 4, and add 1
in order to figure out the number of instructions from the beginning of the method to the return
instruction. Do this in gdb as follows:
(gdb) p 0xf0/4+1
$1 = 61
You can get the address of the start of the jni_GetStaticMethodID() function from frame
10. The address of jni_GetStaticMethodID()+0xf0 is 0xc3ed34d0 , so the start of
jni_GetStaticMethodID() is:
(gdb) p/x (0xc3ed34d0-0xf0)
$2 = 0xc3ed33e0
Now display the instructions for frame 10. Since there are 61 instructions to display, redirect the
output to a file:
(gdb) set redirect-file frame10instrs
(gdb) set redirect on
Redirecting output to frame10instrs.
4.7 Example gdb Session 71
Page 72

(gdb) x /61i 0xc3ed33e0
(gdb) set redirect off
Following is the annotated listing of the redirected output file, frame10instrs. Note that the
parameters to the jni_GetStaticMethodID() function have been removed to simplify the
listing. The parameters to this function are:
(JNIEnv_ *, _jclass *, char const *, char const *)
0xc3ed33e0 <jni_GetStaticMethodID()>: stw %rp,-0x14(%sp)
*** COMBINE 32-BIT R25 AND 32-BIT R24 INTO 64-BIT R24 ***
0xc3ed33e4 <jni_GetStaticMethodID()+0x4>: depd %r25,31,32,%r24
0xc3ed33e8 <jni_GetStaticMethodID()+0x8>: stw,ma %r3,0xc0(%sp)
0xc3ed33ec <jni_GetStaticMethodID()+0xc>: stw %r19,-0x20(%sp)
0xc3ed33f0 <jni_GetStaticMethodID()+0x10>: ldw 0x38(%r26),%r31
0xc3ed33f4 <jni_GetStaticMethodID()+0x14>: stw %r23,-0xa8(%sp)
0xc3ed33f8 <jni_GetStaticMethodID()+0x18>: ldil L'0xe000,%r23
0xc3ed33fc <jni_GetStaticMethodID()+0x1c>: ldo -0x155(%r23),%r21
0xc3ed3400 <jni_GetStaticMethodID()+0x20>: stw %r4,-0xbc(%sp)
0xc3ed3404 <jni_GetStaticMethodID()+0x24>: ldo -0xa0(%r26),%r4
0xc3ed3408 <jni_GetStaticMethodID()+0x28>: stw %r5,-0xb8(%sp)
0xc3ed340c <jni_GetStaticMethodID()+0x2c>: copy %r26,%r5
0xc3ed3410 <jni_GetStaticMethodID()+0x30>: cmpb,= %r31,%r21,0xc3ed3430 <jni_GetStaticMethodID()+0x50>
*** STORE R24 AND R25 (PARAMETERS 3 AND 2) ONTO THE STACK ***
0xc3ed3414 <jni_GetStaticMethodID()+0x34>: std %r24,-0xb0(%sp)
0xc3ed3418 <jni_GetStaticMethodID()+0x38>: ldo -0x154(%r23),%r22
0xc3ed341c <jni_GetStaticMethodID()+0x3c>: cmpb,=,n %r31,%r22,0xc3ed3430 <jni_GetStaticMethodID()+0x50>
0xc3ed3420 <jni_GetStaticMethodID()+0x40>: call 0xc410cac0 <JavaThread::block_if_vm_exited(void)>
0xc3ed3424 <jni_GetStaticMethodID()+0x44>: copy %r4,%r26
0xc3ed3428 <jni_GetStaticMethodID()+0x48>: ldw -0x20(%sp),%r19
0xc3ed342c <jni_GetStaticMethodID()+0x4c>: ldi 0,%r4
0xc3ed3430 <jni_GetStaticMethodID()+0x50>: stw %r4,-0x60(%sp)
0xc3ed3434 <jni_GetStaticMethodID()+0x54>: copy %r4,%r26
0xc3ed3438 <jni_GetStaticMethodID()+0x58>: ldo 0xcc(%r4),%r24
0xc3ed343c <jni_GetStaticMethodID()+0x5c>: ldi 5,%r25
0xc3ed3440 <jni_GetStaticMethodID()+0x60>: stw,o %r25,0(%r24)
0xc3ed3444 <jni_GetStaticMethodID()+0x64>: addil L'-0x10800,%r19,%r1
0xc3ed3448 <jni_GetStaticMethodID()+0x68>: ldw 0x6a4(%r1),%r21
0xc3ed344c <jni_GetStaticMethodID()+0x6c>: stw %r21,-0x94(%sp)
0xc3ed3450 <jni_GetStaticMethodID()+0x70>: ldw 0(%r21),%r25
0xc3ed3454 <jni_GetStaticMethodID()+0x74>: cmpib,>= 1,%r25,0xc3ed346c <jni_GetStaticMethodID()+0x8c>
0xc3ed3458 <jni_GetStaticMethodID()+0x78>: nop
0xc3ed345c <jni_GetStaticMethodID()+0x7c>: addil L'-0xd000,%r19,%r1
0xc3ed3460 <jni_GetStaticMethodID()+0x80>: ldw 0x430(%r1),%r20
0xc3ed3464 <jni_GetStaticMethodID()+0x84>: ldw 0(%r20),%ret1
0xc3ed3468 <jni_GetStaticMethodID()+0x88>: stb,o %r0,0(%ret1)
0xc3ed346c <jni_GetStaticMethodID()+0x8c>: addil L'-0xc000,%r19,%r1
0xc3ed3470 <jni_GetStaticMethodID()+0x90>: ldw 0x78(%r1),%r3
0xc3ed3474 <jni_GetStaticMethodID()+0x94>: ldw,o 0(%r3),%ret0
0xc3ed3478 <jni_GetStaticMethodID()+0x98>: cmpb,<>,n %ret0,%r0,0xc3ed3490 <jni_GetStaticMethodID()+0xb0>
0xc3ed347c <jni_GetStaticMethodID()+0x9c>: ldo 0x1c(%r26),%r31
0xc3ed3480 <jni_GetStaticMethodID()+0xa0>: ldw,o 0(%r31),%r31
0xc3ed3484 <jni_GetStaticMethodID()+0xa4>: ldil L'-0x7fff0000,%ret1
0xc3ed3488 <jni_GetStaticMethodID()+0xa8>: and %ret1,%r31,%r1
0xc3ed348c <jni_GetStaticMethodID()+0xac>: cmpb,=,n %r1,%r0,0xc3ed349c <jni_GetStaticMethodID()+0xbc>
0xc3ed3490 <jni_GetStaticMethodID()+0xb0>: call 0xc410e858 <JavaThread::
check_safepoint_and_suspend_for_native_trans(JavaThread *)>
0xc3ed3494 <jni_GetStaticMethodID()+0xb4>: nop
0xc3ed3498 <jni_GetStaticMethodID()+0xb8>: ldw -0x20(%sp),%r19
0xc3ed349c <jni_GetStaticMethodID()+0xbc>: ldo 0xcc(%r4),%rp
0xc3ed34a0 <jni_GetStaticMethodID()+0xc0>: ldi 6,%r23
0xc3ed34a4 <jni_GetStaticMethodID()+0xc4>: stw,o %r23,0(%rp)
0xc3ed34a8 <jni_GetStaticMethodID()+0xc8>: ldi 1,%rp
*** LOAD R25 WITH SP-0XB0 ***
0xc3ed34ac <jni_GetStaticMethodID()+0xcc>: ldw -0xb0(%sp),%r25
0xc3ed34b0 <jni_GetStaticMethodID()+0xd0>: stw %r4,-0x5c(%sp)
0xc3ed34b4 <jni_GetStaticMethodID()+0xd4>: depd %r4,31,32,%rp
0xc3ed34b8 <jni_GetStaticMethodID()+0xd8>: ldw -0xac(%sp),%r24
0xc3ed34bc <jni_GetStaticMethodID()+0xdc>: copy %r5,%r26
0xc3ed34c0 <jni_GetStaticMethodID()+0xe0>: std %rp,-0x38(%sp)
0xc3ed34c4 <jni_GetStaticMethodID()+0xe4>: ldw -0xa8(%sp),%r23
*** CALL GET_METHOD_ID() ***
0xc3ed34c8 <jni_GetStaticMethodID()+0xe8>: call 0xc3ed2da0
<get_method_id(JNIEnv_ *, _jclass *, char *, char *, bool, Thread *)>
0xc3ed34cc <jni_GetStaticMethodID()+0xec>: ldo -0x5c(%sp),%r5
0xc3ed34d0 <jni_GetStaticMethodID()+0xf0>: ldw -0x20(%sp),%r19
72 Core File Analysis
Page 73

Trace through the instructions to see where R25 was loaded with a value. The first place this
happens is at offset 0xcc:
0xc3ed34ac <jni_GetStaticMethodID()+0xcc>: ldw -0xb0(%sp),%r25
In this instruction, R25 is loaded with the value at sp-0xb0. Use gdb to examine the memory at
sp-0xb0, displaying the output as an address:
(gdb) x /2x $sp-0xb0
0x59a00: 0x00000000 0x00000000
The value of R25 is 0, and it is carried through to frame 9 leading to the abort.
R25 is loaded with sp-0xb0 in frame 10. The address at b0 bytes off of the sp is the combination
of R24 and R25, which are the third and second parameters passed into
jni_GetStaticMethodID(). Refer to the instruction at offset 0x34 in the listing to see where
sp-b0 is set with these values.
The R25 zero value was passed into jni_GetStaticMethodID() from frame 11, which is the
native C routine Java_StackTrace_dumpCore().
Look at selected sections of the C source code (see Section 4.1.3) to find out where that parameter
was set:
...
Java_StackTrace_dumpCore(JNIEnv *env, jclass class, jint intarg) {
jclass classid;
jmethodID methodid;
...
classid = (*env)->FindClass(env, "java/lang/IntegerX");
...
methodid = (*env)->GetStaticMethodID(env, classid, "toBinaryString",
...
}
You see the statement where GetStaticMethodID() is called. The second parameter to this
function is classid, which was set previously by calling the FindClass() method, and the
value of classid is zero since the call to FindClass() returned an invalid value. Examining
the code, you see that a literal class name was passed to the FindClass() method. This literal
contains a typographical error. It should read “java/lang/Integer” instead of “java/lang/IntegerX”.
4.8 Summary
Java applications abort and generate core files for a variety of reasons. There are several useful
tools on HP-UX systems that may be helpful in core file analysis. The primary tool used is gdb.
There are some environmental issues to take into account to make sure that core files are created
completely. Other files, such as the executable and the shared libraries used by the executable
also should be collected before analyzing the core file.
In most cases, core file analysis is quite involved and the core file will need to be forwarded to
HP Support for detailed analysis. However, there are times when users can attempt their own
core file analysis. If they are successful, they will speed up the time it takes to resolve their
programming problems.
Many times programs core dump because of bugs in user code. Occasionally, programs core
dump because of bugs in the Java VM. If you suspect the problem is due to a bug in the Java
VM, you may want to research whether the problem has been reported and if there is a
workaround. Useful websites for finding information are the Go Java! website:
http://www.hp.com/products1/unix/java
and the Sun bug database:
http://bugs.sun.com/bugdatabase/index.jsp
4.8 Summary 73
Page 74

74
Page 75

Glossary
GC Garbage collection.
gid Group id.
HotSpot VM The JDK comes with a virtual machine implementation called the Java HotSpot VM.
Java VM On HP implementations this is the same as the HotSpot VM.
JDK The Java Developer's Kit is the set of Java development tools consisting of the API classes, a
Java compiler, and the Java virtual machine.
JMX Java Management Extensions technology provides the tools for building distributed, web-based,
modular and dynamic solutions for managing and monitoring devices, applications, and
service-driven networks.
JNI The JNI is the native programming interface for Java that is part of the JDK. It allows Java code
to operate with applications and libraries written in other languages, such as C, C++, and
assembly.
JRE The Java Runtime Environment provides the libraries, the Java Virtual Machine, and other
components to run applets and applications written in the Java programming language.
JVMTI The Java Virtual Machine Tool Interface provides both a way to inspect the state and to control
the execution of applications running in the Java VM.
RMI Java Remote Invocation lets Java applications communicate across a network.
SDK The Java Software Developer's Kit is the set of Java development tools consisting of the API
classes, a Java compiler, and the Java virtual machine.
setuid process A process where the effective uid or gid differs from the real uid or gid.
uid User id.
75
Page 76

76
Page 77

Index
Symbols
-verbose:class, 42
-verbose:gc, 42
-verbose:jni, 42
-Xcheck:jni , 45
-Xverbosegc, 46
-XX:+HeapDump, 48
-XX:+HeapDumpOnCtrlBreak, 48
-XX:+HeapDumpOnly, 49
-XX:+HeapDumpOnOutOfMemoryError, 49
-XX:+ShowMessageBoxOnError, 50
-XX:ErrorFile, 47
-XX:OnError, 49
_JAVA_HEAPDUMP environment variable, 48
C
core file checklist, 54
crash analysis tools, 13
ctrl-break handler, 16
example output, 16
D
deadlocked process
tools and options for debugging, 13
Developer and Solution Partner Program (DSPP), 52
dumpcore, 56
F
fatal error handling
options, 14
fatal error log, 17
information contained in, 56
G
gcore, 18
gdb
dumpcore, 56
invoking on a core file, 20
invoking on a hung process, 21
Java stack unwind features, 19
packcore, 59
subcommands for Java VM debugging, 19
support for Java, 18
GDB_JAVA_UNWINDLIB environment variable, 18
generating core files, 56
GlancePlus, 51
Go Java! website, 53
H
hat, 36
heap dump
monitoring memory usage, 49
options, 48
HP Caliper, 51
HPjconfig, 21
GUI mode, 22
non-GUI mode, 23
usage, 21
HPjmeter, 24
analyzing garbage collection data, 28
analyzing profiling data , 26
connecting to node agent, 29
monitoring applications, 28
monitoring metrics, 32
sample programs, 32
session preferences, 30
HPjtune, 35
hprof, 36
hs_err_pid<pid>.log, 17
hung process
tools and options for debugging, 13
I
iostat, 51
J
jar, 60
Java archive tool, 60
java.security.debug system property, 37
JAVA_CORE_DESTINATION environment variable, 55
JAVA_LAUNCHER_OPTIONS environment variable, 38
JAVA_TOOL_OPTIONS environment variable, 37
jconsole, 38
jdb, 39
jhat, 39
jinfo, 16
jmap, 16
jps, 40
example, 40
usage, 40
jstack, 16
jstat, 40
jstatd, 41
jvmstat tools, 41
L
libjunwind, 59
location on Integrity systems, 60
location on PA-RISC systems, 59
M
memory monitoring
tools and options, 14
miscellaneous troubleshooting tools and options, 15
N
netstat, 52
P
packcore, 59
performance tools, 15
77
Page 78

problem report checklist, 53
Prospect, 51
S
sar, 51
Serviceability Agent, 16
stack trace information, 57
swapinfo, 52
system information, 58
system tools, 51
T
top, 52
tusc, 51
V
visualgc, 42
vmstat, 51
78 Index
 Loading...