

Page 1

HP 5820X & 5800 Switch Series
Network Management and Monitoring
Configuration Guide
Abstract
This document describes the software features for the HP 5820X & 5800 Series products and guides
you through the software configuration procedures. These configuration guides also provide
configuration examples to help you apply software features to different network scenarios.
This documentation is intended for network planners, field technical support and servicing engineers,
and network administrators working with the HP 5820X & 5800 Series products.
Part number: 5998-1636
Software version: Release 1211
Document version: 6W101-20121123
Page 2

Legal and notice information
© Copyright 2012 Hewlett-Packard Development Company, L.P.
No part of this documentation may be reproduced or transmitted in any form or by any means without
prior written consent of Hewlett-Packard Development Company, L.P.
The information contained herein is subject to change without notice.
HEWLETT-PACKARD COMPANY MAKES NO WARRANTY OF ANY KIND WITH REGARD TO THIS
MATERIAL, INCLUDING, BUT NOT LIMITED TO, THE IMPLIED WARRANTIES OF MERCHANTABILITY
AND FITNESS FOR A PARTICULAR PURPOSE. Hewlett-Packard shall not be liable for errors contained
herein or for incidental or consequential damages in connection with the furnishing, performance, or
use of this material.
The only warranties for HP products and services are set forth in the express warranty statements
accompanying such products and services. Nothing herein should be construed as constituting an
additional warranty. HP shall not be liable for technical or editorial errors or omissions contained
herein.
Page 3

Contents
System maintenance and debugging ························································································································· 1
Configuring ping·······························································································································································1
Configuring ping example ······································································································································1
Tracert ················································································································································································3
Configuring tracert ···················································································································································4
System debugging ····························································································································································5
Configuring system debugging·······························································································································6
Configuring ping and tracert example ···························································································································7
Configuring NQA························································································································································ 9
NQA benefits····························································································································································9
Basic NQA concepts ············································································································································ 11
NQA probe operation procedure ······················································································································· 12
NQA configuration task list ·········································································································································· 12
Configuring the NQA server ········································································································································ 13
Enabling the NQA client··············································································································································· 14
Creating an NQA test group········································································································································ 14
Configuring an NQA test group ·································································································································· 14
Configuring ICMP echo tests································································································································ 14
Configuring DHCP tests ········································································································································ 15
Configuring DNS tests ·········································································································································· 16
Configuring FTP tests············································································································································· 17
Configuring HTTP tests·········································································································································· 18
Configuring UDP jitter tests ·································································································································· 19
Configuring SNMP tests ······································································································································· 21
Configuring TCP tests············································································································································ 22
Configuring UDP echo tests·································································································································· 23
Configuring voice tests ········································································································································· 24
Configuring DLSw tests ········································································································································· 26
Configuring the collaboration function ························································································································ 27
Configuring threshold monitoring ································································································································ 28
Configuring the NQA statistics collection function····································································································· 29
Configuring the history records saving function ········································································································· 30
Configuring optional parameters for an NQA test group························································································· 31
Scheduling an NQA test group···································································································································· 32
Displaying and maintaining NQA ······························································································································· 33
Configuring NQA examples········································································································································· 33
Configuring ICMP echo test example ················································································································· 33
Configuring DHCP test example·························································································································· 35
Configuring DNS test example ···························································································································· 36
Configuring FTP test example ······························································································································ 37
iii
Page 4

Configuring HTTP test example···························································································································· 38
Configuring UDP jitter test example ···················································································································· 40
Configuring SNMP test example ························································································································· 43
Configuring TCP test example······························································································································ 44
Configuring UDP echo test example ··················································································································· 45
Configuring voice test example ··························································································································· 47
Configuring DLSw test example··························································································································· 50
Configuring NQA collaboration example·········································································································· 51
Configuring NTP ························································································································································54
NTP applications ··················································································································································· 54
NTP advantages ···················································································································································· 54
How NTP works····················································································································································· 55
NTP message format············································································································································· 56
NTP operation modes ··········································································································································· 57
Multiple instances of NTP····································································································································· 59
NTP configuration task list············································································································································· 60
Configuring the operation modes of NTP ··················································································································· 60
Configuring NTP client/server mode ·················································································································· 60
Configuring the NTP symmetric peers mode ······································································································ 61
Configuring NTP broadcast mode ······················································································································ 62
Configuring NTP multicast mode ························································································································· 63
Configuring optional parameters of NTP ···················································································································· 63
Specifying the source interface for NTP messages···························································································· 63
Disabling an interface from receiving NTP messages······················································································· 64
Configuring the maximum number of dynamic sessions allowed···································································· 64
Configuring access-control rights ································································································································· 65
Configuration prerequisites ·································································································································· 65
Configuration procedure ······································································································································ 65
Configuring NTP authentication ··································································································································· 65
Configuration prerequisites ·································································································································· 66
Configuration procedure ······································································································································ 66
Displaying and maintaining NTP ································································································································· 67
Configuring NTP examples ··········································································································································· 68
Configuring NTP client/server mode example ·································································································· 68
Configuring the NTP symmetric mode example································································································· 69
Configuring NTP broadcast mode example······································································································· 71
Configuring NTP multicast mode example ········································································································· 72
Configuring NTP client/server mode with authentication example································································· 75
Configuring NTP broadcast mode with authentication example ····································································· 76
Configuring MPLS VPN time synchronization in client/server mode example··············································· 78
Configuring MPLS VPN time synchronization in symmetric peers mode example ········································ 80
Configuring IPC··························································································································································82
Enabling IPC performance statistics ····························································································································· 83
Displaying and maintaining IPC··································································································································· 84
iv
Page 5

Configuring PoE·························································································································································85
Protocol specification ············································································································································ 86
PoE configuration task list ············································································································································· 86
Enabling PoE ·································································································································································· 87
Enabling PoE for a PoE interface························································································································· 87
Detecting PDs·································································································································································· 88
Enabling the PSE to detect nonstandard PDs ····································································································· 88
Configuring a PD disconnection detection mode ······························································································ 88
Configuring the PoE power··········································································································································· 89
Configuring the maximum PoE interface power ································································································ 89
Configuring PoE power management·························································································································· 89
Configuring PoE interface power management ································································································· 89
Configuring the PoE monitoring function····················································································································· 90
Configuring PSE power monitoring····················································································································· 90
Monitoring PD························································································································································ 90
Configuring PoE interface through PoE profile ··········································································································· 91
Configuring PoE profile ········································································································································ 91
Applying PoE profile ············································································································································· 91
Upgrading PSE processing software in service ·········································································································· 92
Displaying and maintaining PoE ·································································································································· 93
Configuring PoE example ············································································································································· 93
Troubleshooting PoE ······················································································································································ 94
Configuring SNMP·····················································································································································96
SNMP mechanism ················································································································································· 96
SNMP protocol version········································································································································· 96
MIB overview························································································································································· 97
Configuring SNMP ························································································································································ 97
Configuring network management-specific interface index ····················································································100
Switching the format of an NM-specific ifindex·······························································································100
Configuring SNMP logging ········································································································································101
Enabling SNMP logging·····································································································································101
Configuring SNMP trap ··············································································································································102
Enabling the trap function ··································································································································102
Configuring trap parameters······························································································································103
Displaying and maintaining SNMP ···························································································································104
Configuring SNMPv1/SNMPv2c example ···············································································································105
Configuring SNMPv3 example ··································································································································106
Configuring SNMP logging example ························································································································107
Configuring RMON ················································································································································ 109
Working mechanism···········································································································································109
RMON groups·····················································································································································110
Configuring the RMON statistics function ·················································································································111
Configuring the RMON Ethernet statistics function·························································································· 113
Configuring the RMON history statistics function ····························································································113
v
Page 6

Configuring the RMON alarm function ·····················································································································114
Configuration prerequisites ································································································································114
Configuration procedure ····································································································································114
Displaying and maintaining RMON ··························································································································115
Configuring Ethernet statistics group example·········································································································· 116
Configuring history group example ···························································································································117
Configuring alarm group example ····························································································································119
Configuring CWMP················································································································································ 121
CWMP network framework ·······························································································································121
CWMP basic functions ················································································································································122
Automatic configuration file deployment ··········································································································122
CPE system file management ·····························································································································122
CPE status and performance monitoring···········································································································122
CWMP mechanism ······················································································································································123
Auto-connection between the ACS and a CPE ································································································123
Configuration parameter deployment ···············································································································124
RPC methods························································································································································124
Active and standby ACS switchover ·················································································································125
CWMP configuration tasks ·········································································································································126
Configuring the DHCP server·····························································································································126
Configuring the DNS server·······························································································································127
Configuring the ACS server ······························································································································· 127
Configuring CPEs ················································································································································ 127
Enabling CWMP ··························································································································································128
Configuring the ACS server ········································································································································128
Configuring the ACS URL ···································································································································128
Configuring the ACS username and password ·······························································································128
Configuring CPE attributes··········································································································································129
Configuring the CPE username and password ································································································129
Configuring the CWMP connection interface ··································································································130
Sending Inform messages··································································································································· 130
Configuring the maximum number of attempts made to retry a connection················································· 131
Configuring the close-wait timer of the CPE ·····································································································131
Displaying and maintaining CWMP··························································································································132
Configuring CWMP example ·····································································································································132
Network requirements·········································································································································132
Configuration procedure ····································································································································133
Configuring cluster management··························································································································· 141
Roles in a cluster··················································································································································141
How a cluster works············································································································································142
Cluster configuration task list ······································································································································145
Configuring the management device·························································································································147
Enabling NDP globally and for specific ports··································································································147
Configuring NDP parameters ····························································································································147
vi
Page 7

Enabling NTDP globally and for specific ports································································································148
Configuring NTDP parameters···························································································································148
Manually collecting topology information ········································································································149
Enabling the cluster function ······························································································································149
Establishing a cluster··········································································································································· 149
Enabling management VLAN auto-negotiation································································································150
Configuring communication between the management device and the member devices within a cluster151
Configuring cluster management protocol packets ·························································································151
Cluster member management ····························································································································152
Configuring the member devices ·······························································································································153
Enabling NDP ······················································································································································153
Enabling NTDP ····················································································································································153
Manually collecting topology information ········································································································153
Enabling the cluster function ······························································································································153
Deleting a member device from a cluster ·········································································································153
Configuring access between the management device and its member devices···················································154
Adding a candidate device to a cluster ····················································································································155
Configuring advanced cluster functions ····················································································································155
Configuring topology management ··················································································································155
Configuring interaction for a cluster··················································································································156
SNMP configuration synchronization function································································································· 157
Configuring web user accounts in batches ······································································································158
Displaying and maintaining cluster management ····································································································158
Configuring cluster management example················································································································ 159
Configuring a sampler············································································································································ 163
Creating a sampler ······················································································································································163
Displaying and maintaining sampler ·························································································································163
Configuring sampler examples··································································································································· 164
Configuring port mirroring····································································································································· 165
Port mirroring types·············································································································································165
Implementing port mirroring······························································································································· 165
Configuring local port mirroring ································································································································168
Local port mirroring configuration task list ·······································································································168
Creating a local mirroring group ······················································································································ 168
Configuring mirroring ports for the local mirroring group·············································································· 169
Configuring mirroring CPUs for the local mirroring group·············································································169
Configuring the monitor port for the local mirroring group············································································170
Configuring layer 2 remote port mirroring················································································································170
Layer 2 remote port mirroring configuration task list ······················································································170
Configuration prerequisites ································································································································172
Configuring a remote source mirroring group (on the source device) ··························································172
Configuring a remote destination mirroring group (on the destination device) ··········································· 174
Using the remote probe VLAN to enable local mirroring to support multiple destination ports ················· 176
Configuring layer 3 remote port mirroring················································································································178
vii
Page 8

Layer 3 remote port mirroring configuration task list ······················································································178
Configuration prerequisites ································································································································179
Configuring local mirroring groups···················································································································179
Configuring mirroring ports for a local mirroring group ················································································179
Configuring mirroring CPUs for a local mirroring group················································································180
Configuring the monitor port for a local mirroring group ··············································································180
Displaying and maintaining port mirroring···············································································································181
Configuring port mirroring examples ························································································································181
Configuring local port mirroring example········································································································181
Configuring Layer 2 remote port mirroring example ······················································································182
Configuring local port mirroring with multiple monitor ports example ·························································184
Configuring Layer 3 remote port mirroring example ······················································································186
Configuring traffic mirroring ·································································································································· 189
Mirroring traffic to an interface ·························································································································189
Mirroring traffic to the CPU································································································································190
Applying a QoS policy······································································································································· 191
Displaying and maintaining traffic mirroring············································································································ 192
Configuring traffic mirroring examples······················································································································192
Mirroring traffic to an interface example ·········································································································192
Configuration procedure ····································································································································192
Configuring NetStream··········································································································································· 194
NetStream basic concepts ··········································································································································194
What is a flow·····················································································································································194
How NetStream works········································································································································ 194
NetStream key technologies ·······································································································································195
Flow aging ···························································································································································195
NetStream data export ·······································································································································196
NetStream export formats ··································································································································197
Introduction to NetStream sampling and filtering·····································································································198
NetStream sampling ···········································································································································198
NetStream filtering ··············································································································································198
NetStream configuration task list································································································································ 198
Enabling NetStream·····················································································································································200
Enabling NetStream on an interface·················································································································200
Configuring NetStream filtering and sampling·········································································································200
Configuring NetStream filtering························································································································· 200
Configuring NetStream sampling ······················································································································ 202
Configuring NetStream data export ··························································································································202
Configuring NetStream traditional data export ·······························································································202
Configuring NetStream aggregation data export ···························································································203
Configuring attributes of NetStream export data ·····································································································204
Configuring NetStream export format ··············································································································204
Configuring refresh rate for NetStream version 9 templates ·········································································· 206
Configuring NetStream flow aging····························································································································207
viii
Page 9

Flow aging approaches······································································································································207
Configuring NetStream flow aging ···················································································································207
Displaying and maintaining NetStream ····················································································································208
Configuring NetStream examples ······························································································································ 208
Configuring NetStream traditional data export example ··············································································· 208
Configuring NetStream aggregation data export example ···········································································209
Configuring IPv6 NetStream ·································································································································· 211
IPv6 NetStream basic concepts ··································································································································211
What is an IPv6 flow ··········································································································································211
How IPv6 NetStream works ······························································································································· 211
IPv6 NetStream key technologies·······························································································································212
Flow aging ···························································································································································212
IPv6 NetStream data export······························································································································· 212
IPv6 NetStream export format····························································································································213
IPv6 NetStream configuration task list ······················································································································· 213
Enabling NetStream·····················································································································································214
Enabling NetStream on an interface·················································································································214
Configuring IPv6 NetStream data export··················································································································214
Configuring IPv6 NetStream traditional data export·······················································································214
Configuring IPv6 NetStream aggregation data export···················································································215
Configuring attributes of IPv6 NetStream data export·····························································································217
Configuring IPv6 NetStream export format ······································································································217
Configuring refresh rate for IPv6 NetStream version 9 templates ·································································217
Displaying and maintaining IPv6 NetStream············································································································218
Configuring IPv6 NetStream examples······················································································································218
Configuring IPv6 NetStream traditional data export example·······································································218
Configuring IPv6 NetStream aggregation data export example ···································································219
Configuring sFlow··················································································································································· 221
sFlow operation ···················································································································································221
Configuring sFlow························································································································································222
Configuring the sFlow agent and sFlow collector···························································································· 222
Configuring flow sampling·································································································································223
Configuring counter sampling ···························································································································223
Displaying and maintaining sFlow·····························································································································223
Configuring sFlow example ········································································································································224
Troubleshooting sFlow configuration ·························································································································225
The remote sFlow collector cannot receive sFlow packets ·············································································· 225
Configuring information center······························································································································ 226
System information types····································································································································227
Eight levels of system information······················································································································227
Output destinations and channels of system information················································································227
Outputting system information by source module····························································································228
Default output rules of system information ········································································································228
System information format··································································································································229
ix
Page 10

Configuring information center···································································································································232
Information center configuration task list ·········································································································· 232
Outputting system information to the console ··································································································233
Outputting system information to a monitor terminal ······················································································234
Outputting system information to a log host·····································································································235
Outputting system information to the trap buffer ·····························································································236
Outputting system information to the log buffer······························································································· 236
Outputting system information to the SNMP module······················································································· 237
Outputting system information to the web interface ························································································238
Saving system information to a log file·············································································································239
Saving security logs into the security log file····································································································240
Configuring synchronous information output ···································································································243
Disabling a port from generating link up/down logging information···························································243
Displaying and maintaining information center ·······································································································244
Configuring information center examples ················································································································· 245
Outputting log information to a Unix log host ·································································································245
Outputting log information to a Linux log host·································································································246
Outputting log information to the console ········································································································ 248
Saving security logs into the security log file····································································································249
Support and other resources·································································································································· 253
Contacting HP ······························································································································································253
Subscription service ············································································································································253
Related information······················································································································································253
Documents····························································································································································253
Websites ······························································································································································253
Conventions ··································································································································································254
Index ········································································································································································ 256
x
Page 11

System maintenance and debugging
g
You can use the ping command and the tracert command to verify the current network connectivity, and
use the debug command to enable debugging and to diagnose system faults based on the debugging
information.
Configuring ping
The ping command allows you to verify whether a device with a specified address is reachable, and to
examine network connectivity.
The ping function is implemented through the ICMP using the following workflow:
1. The source device sends an ICMP echo request to the destination device.
2. The source device determines whether the destination is reachable based on whether it receives an
ICMP echo reply; if the destination is reachable, the source device determines the link quality
based on the numbers of ICMP echo requests sent and replies received, determines the distance
between the source and destination based on the round trip time of ping packets.
To configure the ping function:
To do… Use the command… Remarks
ping [ ip ] [ -a source-ip | -c count | -f | h ttl | -i interface-type interface-number | -
Check whether a specified
address in an IP network is
reachable.
NOTE:
• For a low-speed network, set a larger value for the timeout timer—indicated by the -t parameter in
the command—when configuring the ping command.
• Only the directly connected se
the -i argument
• For more information about the ping lsp command, see MPLS basics commands
Command Reference
m interval | -n | -p pad | -q | -r | -s
packet-size | -t timeout | -tos tos | -v | -
vpn-instance vpn-instance-name ] * host
ping ipv6 [ -a source-ipv6 | -c count | -m
interval | -s packet-size | -t timeout ] *
host [ -i interface-type interface-number ]
ment address can be pinged if the outgoing interface is specified with
.
Configuring ping example
Required.
Use either approach.
The ping command is
applicable in an IPv4 network;
the ping ipv6 command is
applicable in an IPv6 network.
Available in any view.
in the
MPLS
Network requirements
As shown in Figure 1, check whether Device A and Device C can reach each other. If they can reach
each other, get the detailed information of routes from Device A to Device C.
1
Page 12
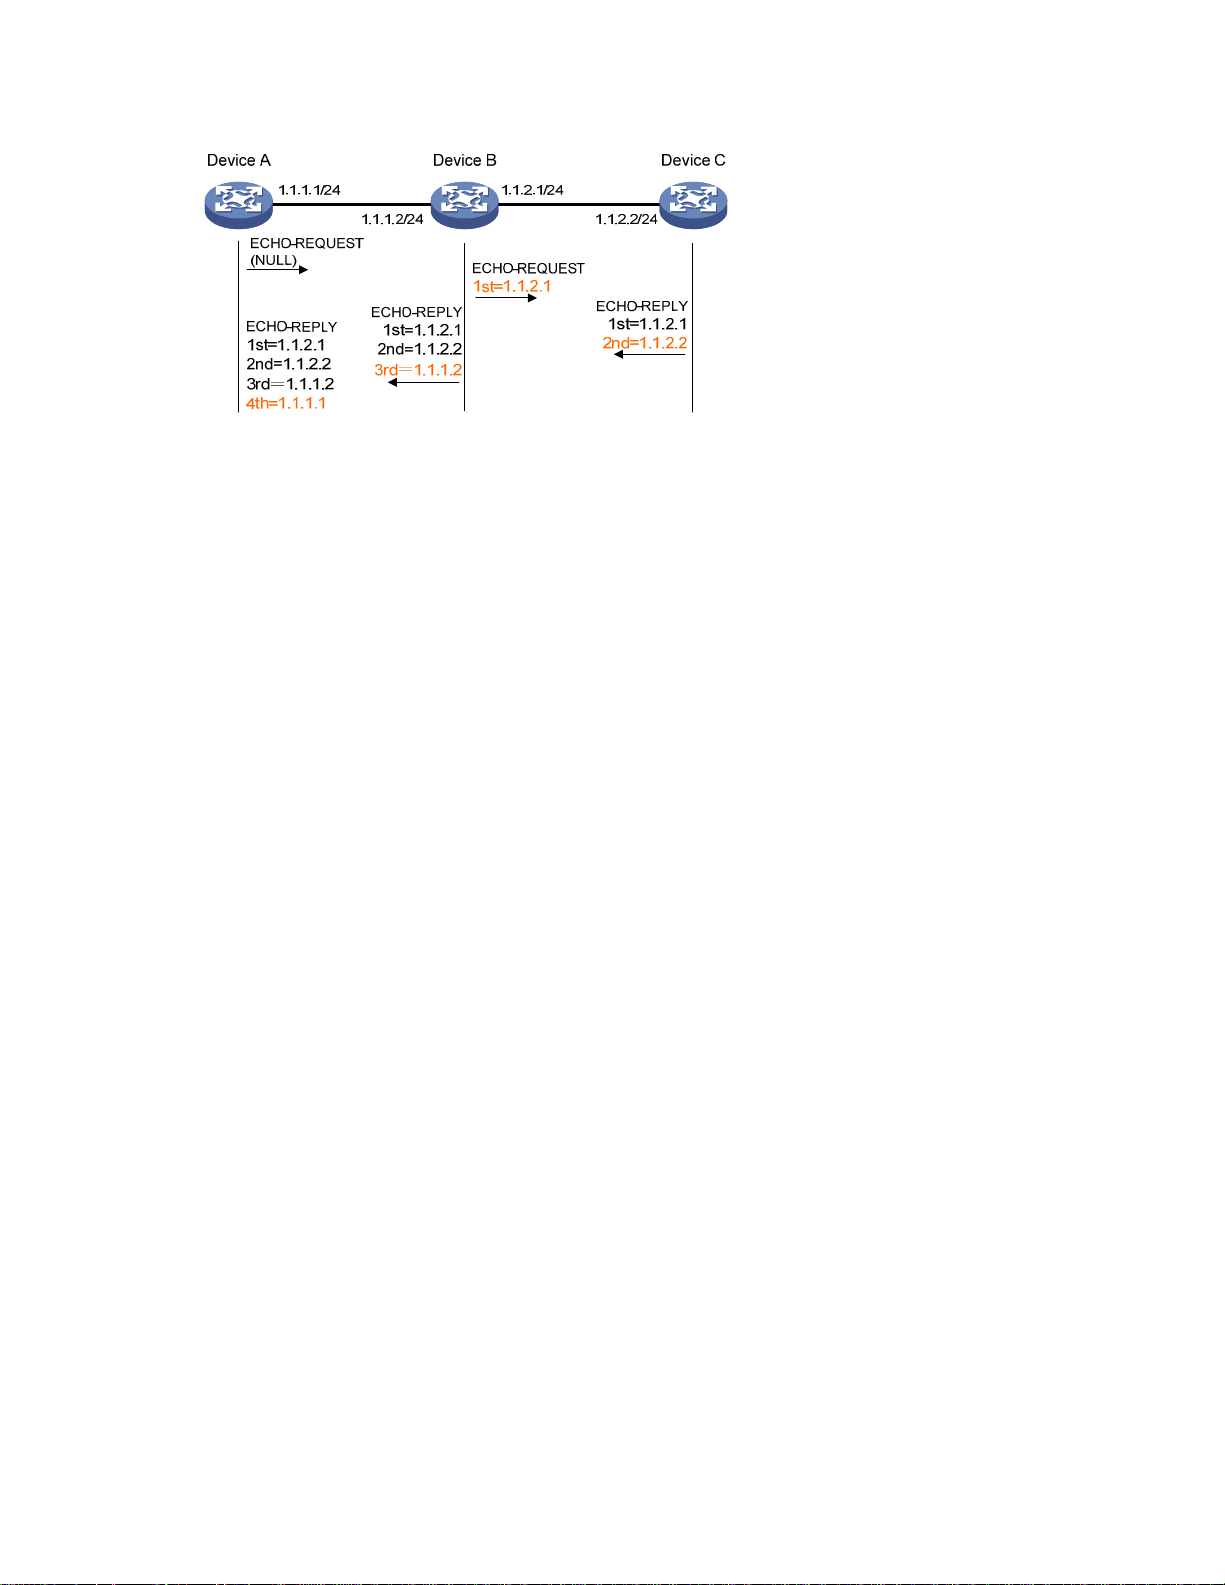
Figure 1 Ping network diagram
Configuration procedure
# Use the ping command to display whether Device A and Device C can reach each other.
<DeviceA> ping 1.1.2.2
PING 1.1.2.2: 56 data bytes, press CTRL_C to break
Reply from 1.1.2.2: bytes=56 Sequence=1 ttl=254 time=205 ms
Reply from 1.1.2.2: bytes=56 Sequence=2 ttl=254 time=1 ms
Reply from 1.1.2.2: bytes=56 Sequence=3 ttl=254 time=1 ms
Reply from 1.1.2.2: bytes=56 Sequence=4 ttl=254 time=1 ms
Reply from 1.1.2.2: bytes=56 Sequence=5 ttl=254 time=1 ms
--- 1.1.2.2 ping statistics -- 5 packet(s) transmitted
5 packet(s) received
0.00% packet loss
round-trip min/avg/max = 1/41/205 ms
# Get the detailed information of routes from Device A to Device C.
<DeviceA> ping -r 1.1.2.2
PING 1.1.2.2: 56 data bytes, press CTRL_C to break
Reply from 1.1.2.2: bytes=56 Sequence=1 ttl=254 time=53 ms
Record Route:
1.1.2.1
1.1.2.2
1.1.1.2
1.1.1.1
Reply from 1.1.2.2: bytes=56 Sequence=2 ttl=254 time=1 ms
Record Route:
1.1.2.1
1.1.2.2
1.1.1.2
1.1.1.1
Reply from 1.1.2.2: bytes=56 Sequence=3 ttl=254 time=1 ms
Record Route:
1.1.2.1
1.1.2.2
1.1.1.2
2
Page 13

1.1.1.1
Reply from 1.1.2.2: bytes=56 Sequence=4 ttl=254 time=1 ms
Record Route:
1.1.2.1
1.1.2.2
1.1.1.2
1.1.1.1
Reply from 1.1.2.2: bytes=56 Sequence=5 ttl=254 time=1 ms
Record Route:
1.1.2.1
1.1.2.2
1.1.1.2
1.1.1.1
--- 1.1.2.2 ping statistics -- 5 packet(s) transmitted
5 packet(s) received
0.00% packet loss
round-trip min/avg/max = 1/11/53 ms
The principle of ping –r is as shown in Figure 1.
1. The source (Device A) sends an ICMP echo request with the RR option being empty to the
destination (Device C).
2. The intermediate device (Device B) adds the IP address (1.1.2.1) of its outbound interface to the RR
option of the ICMP echo request and forwards the packet.
3. Upon receiving the request, the destination device copies the RR option in the request and adds the
IP address (1.1.2.2) of its outbound interface to the RR option. Then the destination device sends an
ICMP echo reply.
4. The intermediate device adds the IP address (1.1.1.2) of its outbound interface to the RR option in
the ICMP echo reply, and then forwards the reply.
5. Upon receiving the reply, the source device adds the IP address (1.1.1.1) of its inbound interface
to the RR option. Finally, get the detailed information of routes from Device A to Device C: 1.1.1.1
<-> {1.1.1.2; 1.1.2.1} <-> 1.1.2.2.
Tracert
By using the tracert command, you can trace the Layer 3 devices involved in delivering an IP packet from
source to destination to check whether a network is available. This is useful for identification of failed
nodes in the event of network failure.
3
Page 14
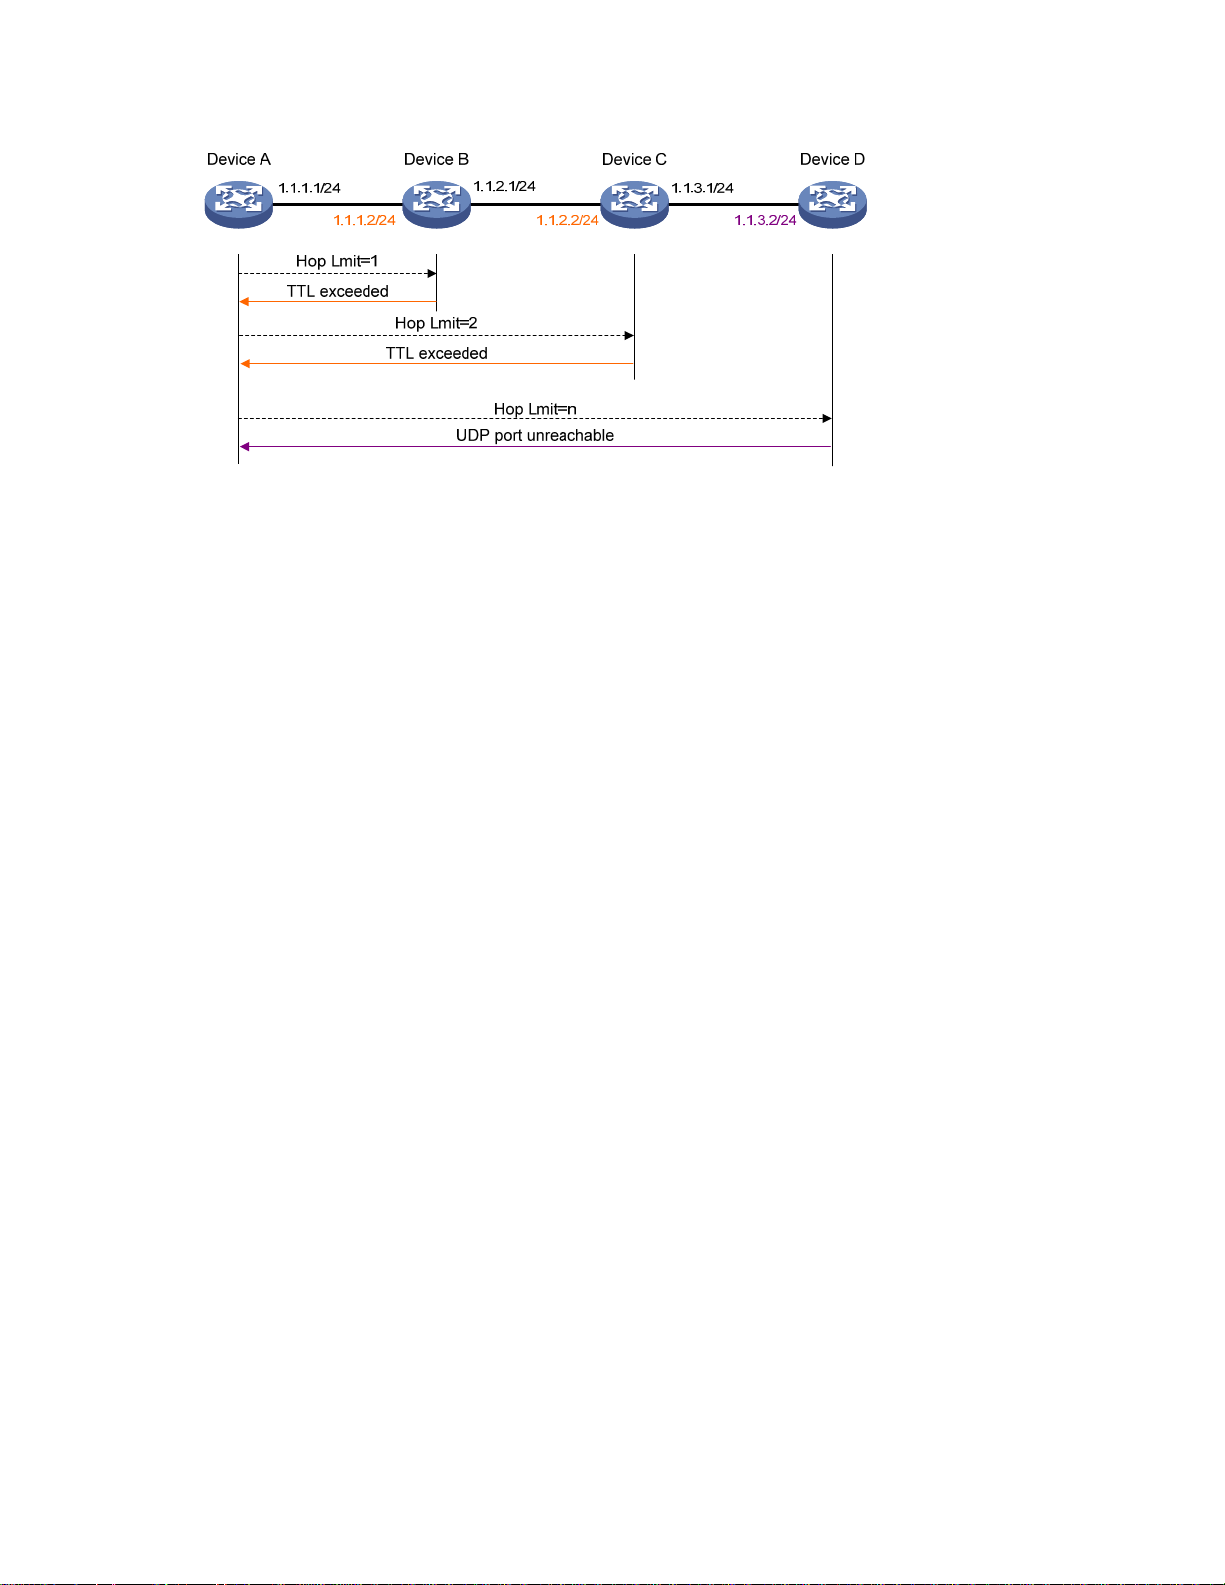
Figure 2 Tracert diagram
The tracert function is implemented through ICMP, as shown in Figure 2:
1. The source (Device A) sends a packet with a TTL value of 1 to the destination (Device D). The UDP
port of the packet is a port number that will not be used by any application of the destination.
2. The first hop (Device B) (the Layer 3 device that first receives the packet) responds by sending a TTL-
expired ICMP error message to the source, with its IP address 1.1.1.2 encapsulated. In this way,
the source device can get the address (1.1.1.2) of the first Layer 3 device.
3. The source device sends a packet with a TTL value of 2 to the destination device.
4. The second hop (Device C) responds with a TTL-expired ICMP error message, which gives the
source device the address (1.1.2.2) of the second Layer 3 device.
5. The process continues until the ultimate destination device is reached. No application of the
destination uses this UDP port. The destination replies a port unreachable ICMP error message with
the destination IP address 1.1.3.2.
6. When the source device receives the port unreachable ICMP error message, it knows that the
packet has reached the destination, and it can get the addresses of all Layer 3 devices involved to
get to the destination device (1.1.1.2, 1.1.2.2, 1.1.3.2).
Configuring tracert
Configuration prerequisites
Before you configure tracert, complete the following tasks:
• Enable sending of ICMP timeout packets on the intermediate device (the device between the source
and destination devices). If the intermediate device is an HP device, execute the ip ttl-expires enable
command on the device. For more information about this command, see IP performance
optimization commands in the Layer 3 - IP Services Command Reference.
• Enable sending of ICMP destination unreachable packets on the destination device. If the
destination device is an HP device, execute the ip unreachables enable command. For more
information about this command, see IP performance optimization commands in the Layer 3 - IP
Services Command Reference.
4
Page 15

Tracert configuration
To configure tracert:
To do… Use the command… Remarks
1. Enter system view.
2. Display the routes from
source to destination.
NOTE:
For more information about the tracert lsp command, see MPLS basics commands
Command Reference
.
System debugging
The device provides various debugging functions. For the majority of protocols and features supported,
the system provides debugging information to help users diagnose errors.
The following switches control the display of debugging information:
• Protocol debugging switch, which controls protocol-specific debugging information.
system-view —
tracert [ -a source-ip | -f first-ttl | -m
max-ttl | -p port | -q packet-number | vpn-instance vpn-instance-name | -w
timeout ] * host
tracert ipv6 [ -f first-ttl | -m max-ttl | -p
port | -q packet-number | -w timeout ]
* host
Required.
Use either approach.
The tracert command is
applicable in an IPv4 network;
the tracert ipv6 command is
applicable in an IPv6 network.
Available in any view.
in the
MPLS
• Screen output switch, which controls whether to display the debugging information on a certain
screen.
As Figure 3 illu
strates, assume the device can provide debugging for the three modules 1, 2, and 3. The
debugging information can only be output on a terminal when both the protocol debugging switch and
the screen output switch are turned on.
5
Page 16
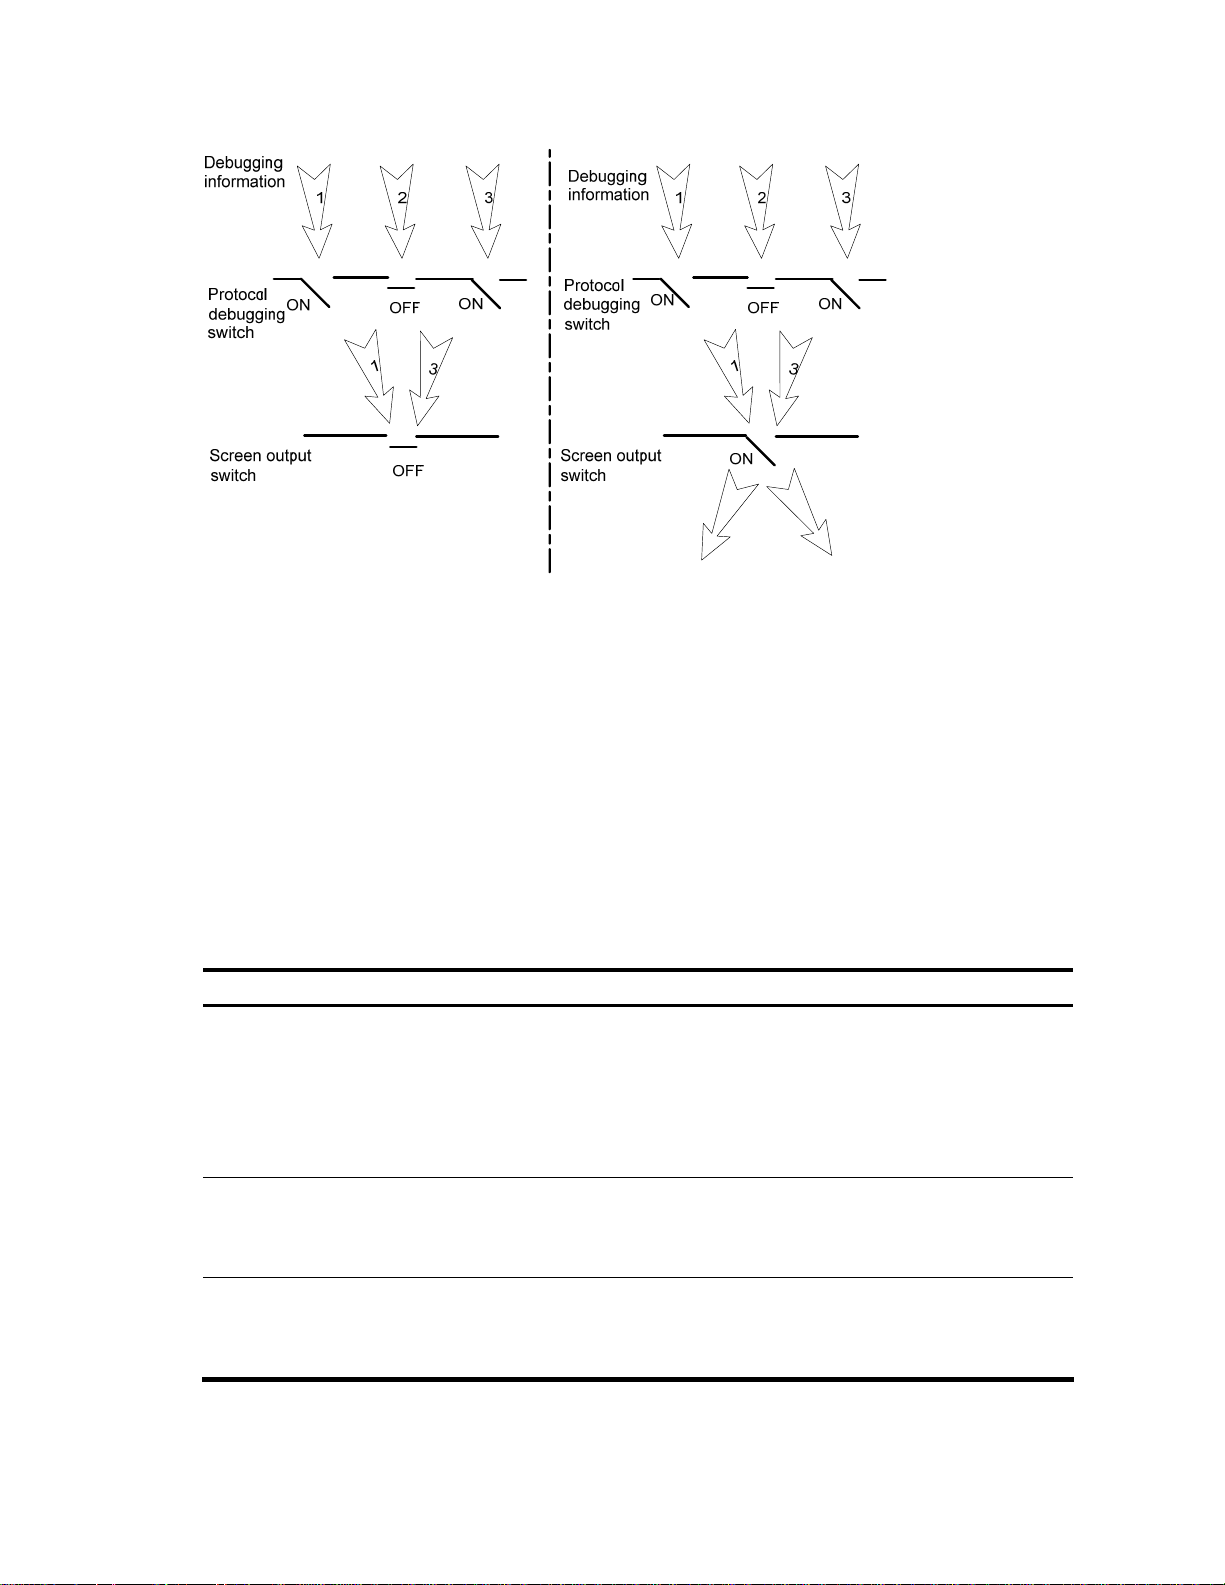
Figure 3 The relationship between the protocol and screen output switch
Configuring system debugging
Output of the debugging information may reduce system efficiency. Administrators usually use the
debugging commands to diagnose network failure. After completing the debugging, disable the
corresponding debugging function, or use the undo debugging all command to disable all debugging
functions.
Output of debugging information depends on the configurations of the information center and the
debugging commands of each protocol and functional module. Displaying the debugging information on
a terminal—including console or VTY—is a common way to output debugging information. You can also
output debugging information to other destinations. For more information, see Information center
commands in the Network Management and Monitoring Command Reference. By default, you can output
debugging information to a terminal by following these steps:
To do…
1. Enable the terminal
Use the command… Remarks
monitoring of system
information.
terminal monitor
1
3
Optional.
The terminal monitoring on the
console is enabled by default and
that on the monitoring terminal is
disabled by default.
Available in user view.
2. Enable the terminal display of
debugging information.
3. Enable debugging for a
specified module.
terminal debugging
debugging { all [ timeout time ] |
module-name [ option ] }
6
Required.
Disabled by default.
Available in user view.
Required.
Disabled by default.
Available in user view.
Page 17

To do… Use the command… Remarks
display debugging [ interface
4. Display the enabled
debugging functions.
interface-type interface-number ]
[ module-name ] [ | { begin |
exclude | include } regular-
expression ]
Optional.
Available in any view.
NOTE:
To display the detailed debugging information on the terminal, configure the debugging, terminal
debugging and terminal monitor commands. For more information about the terminal debugging
terminal monitor commands, see Information center commands
Monitoring Command Reference
.
in the
Network Management and
Configuring ping and tracert example
Network requirements
As shown in Figure 4, Device A failed to Telnet Device C. Determine whether Device A and Device C can
reach each other. If they cannot reach each other, locate the failed nodes in the network.
Figure 4 Ping and tracert network diagram
and
Configuration procedure
# Use the ping command to display whether Device A and Device C can reach each other.
<DeviceA> ping 1.1.2.2
PING 1.1.2.2: 56 data bytes, press CTRL_C to break
Request time out
Request time out
Request time out
Request time out
Request time out
--- 1.1.2.2 ping statistics -- 5 packet(s) transmitted
0 packet(s) received
100.00% packet loss
# Device A and Device C cannot reach each other. Use the tracert command to determine failed nodes.
<DeviceA> system-view
[DeviceA] ip ttl-expires enable
[DeviceA] ip unreachables enable
[DeviceA] tracert 1.1.2.2
traceroute to 1.1.2.2(1.1.2.2) 30 hops max,40 bytes packet, press CTRL_C to bre
ak
1 1.1.1.2 14 ms 10 ms 20 ms
7
Page 18

2 * * *
3 * * *
4 * * *
5
<DeviceA>
The output shows that Device A and Device C cannot reach other, Device A and Device B can reach each
other, and an error occurred on the connection between Device B and Device C. Use the debugging ip
icmp command to enable ICMP debugging on Device A and Device C to check whether the devices send
or receive the specified ICMP packets, or use the display ip routing-table command to display whether
Device A and Device C can reach each other.
8
Page 19
Configuring NQA
NQA can perform various types of tests and collect network performance and service quality parameters
such as delay jitter, time for establishing a TCP connection, time for establishing an FTP connection, and
file transfer rate.
With the NQA test results, you can diagnose and locate network faults, know network performance in
time and take proper actions.
NQA benefits
Supporting multiple test types
Ping can only use the ICMP to test the reachability of the destination host and the round-trip time. As an
enhancement to Ping, NQA provides more test types and functions.
NQA supports 11 test types: ICMP echo, DHCP, DNS, FTP, HTTP, UDP jitter, SNMP, TCP, UDP echo, voice
and DLSw.
NQA enables the client to send probe packets of different test types to detect the protocol availability and
response time of the peer. The test result helps you understand network performance.
Supporting the collaboration function
Collaboration is implemented by establishing reaction entries to monitor the detection results of NQA
probes. If the number of consecutive probe failures reaches a limit, NQA informs the track module of the
detection result, and the track module triggers other application modules to take predefined.
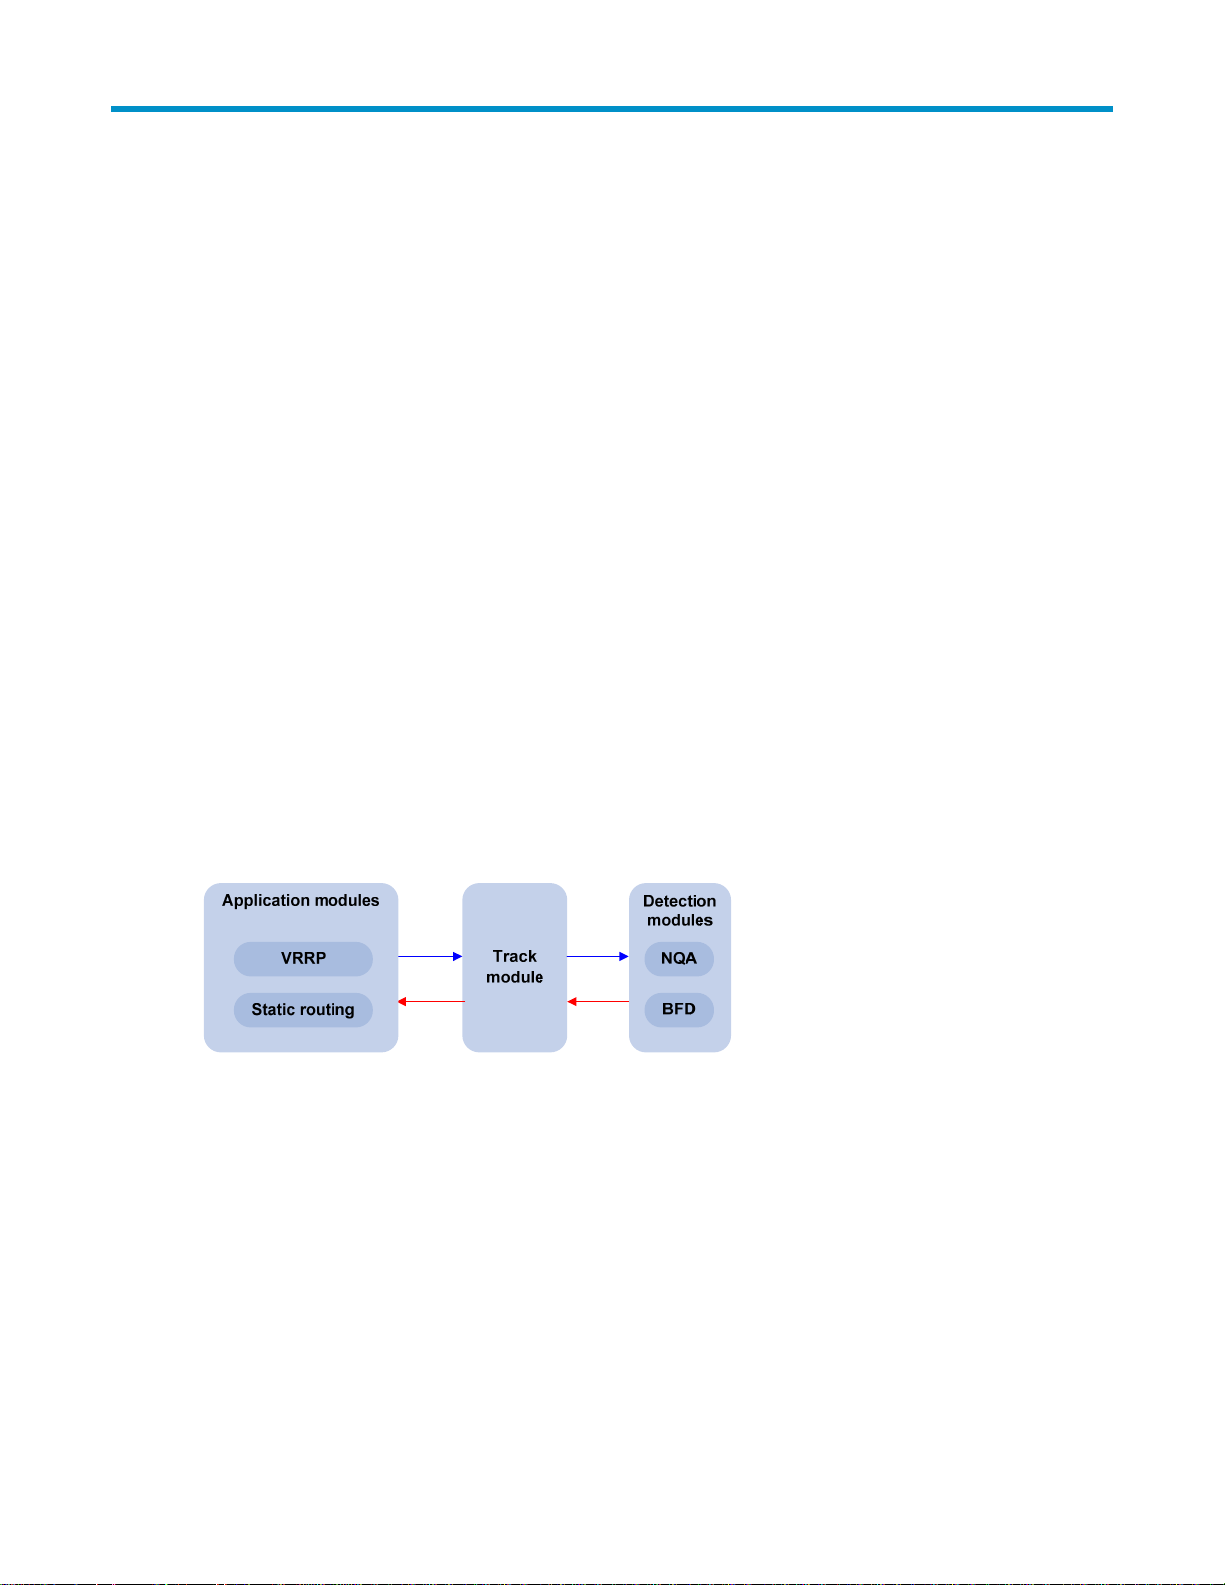
Figure 5 Implement collaboration
The collaboration comprises the following parts: the application modules, the track module, and the
detection modules.
• A detection module monitors specific objects, such as the link status, and network performance, and
informs the track module of detection results.
• Upon the detection results, the track module changes the status of the track entry and informs the
associated application module. The track module works between the application modules and the
detection modules. It hides the differences among detection modules from application modules.
• The application module takes actions when the tracked object changes its state.
The following describes how a static route is monitored through collaboration.
1. NQA monitors the reachability to 192.168.0.88.
2. When 192.168.0.88 becomes unreachable, NQA notifies it to the track module.
9
Page 20

NOTE:
3. The track module notifies the state change to the static routing module
4. The static routing module sets the static route as invalid.
For more information about the collaboration and the track module, see
Configuration Guide
.
Supporting threshold monitoring
NQA supports threshold monitoring for performance parameters such as average delay jitter and packet
round-trip time. The performance parameters to be monitored are monitored elements. NQA monitors
threshold violations for a monitored element, and reacts to certain measurement conditions, for example,
sending trap messages to the network management server. This helps network administrators understand
the network service quality and network performance.
1. Monitored elements
Table 1 de
monitored.
Table 1 Monitored elements and NQA test types
Monitored elements
Probe duration
Count of probe failures
Packet round-trip time UDP jitter test and voice test
scribes the monitored elements and the NQA test types in which the elements can be
Test type supported
High Availability
Tests excluding UDP jitter test and voice
test
Tests excluding UDP jitter test and voice
test
Count of discarded packets UDP jitter test and voice test
One-way delay jitter (source-to-destination and destination-tosource)
One-way delay (source-to-destination and destination-to-source) UDP jitter test and voice test
ICPIF (see “Configuring voice tests”) Voice test
MOS (see “Configuring voice tests”) Voice test
2. Threshold types
UDP jitter test and voice test
The following threshold types are supported:
• average—Monitors the average value of monitored data in a test. If the average value in a test
exceeds the upper threshold or goes below the lower threshold, a threshold violation occurs. For
example, you can monitor the average probe duration in a test.
• accumulate—Monitors total number of times the monitored data violates the threshold in a test. If the
total number of times reaches or exceeds a specified value, a threshold violation occurs.
• consecutive—Monitors the number of consecutive times the monitored data violates the threshold
since the test group starts. If the monitored data violates the threshold consecutively for a specified
number of times, a threshold violation occurs.
10
Page 21

NOTE:
NOTE:
The counting for the average or accumulate threshold type is performed per test, but that for the
consecutive type is performed since the test group is started.
3. Triggered actions
The following actions may be triggered:
• none—NQA only records events for terminal display; it does not send trap information to the
network management server.
• trap-only—NQA records events and sends trap messages to the network management server.
NQA DNS tests do not support the action of sending trap messages. The action to be triggered in DNS
tests can only be the default one, none.
4. Reaction entry
In a reaction entry, a monitored element, a threshold type, and the action to be triggered are configured
to implement threshold monitoring.
The state of a reaction entry can be invalid, over-threshold, or below-threshold. Before an NQA test group
starts, the reaction entry is in the state of invalid. After each test or probe, threshold violations are counted
according to the threshold type and range configured in the entry. If the threshold is violated
consecutively or accumulatively for a specified number of times, the state of the entry is set to overthreshold; otherwise, the state of the entry is set to below-threshold.
If the action to be triggered is configured as trap-only for a reaction entry, when the state of the entry
changes, a trap message is generated and sent to the network management server.
Basic NQA concepts
Test group
An NQA test group specifies test parameters including the test type, destination address, and destination
port. Each test group is uniquely identified by an administrator name and operation tag. You can
configure and schedule multiple NQA test groups to test different objects.
Test and probe
After the NQA test group starts, tests are performed at a specified interval. During each test, a specified
number of probe operations are performed. Both the test interval and the number of probe operations per
test are configurable. But only one probe operation is performed during one voice test.
Probe operations vary with NQA test types.
• During a TCP or DLSw test, one probe operation means setting up one connection.
• During a UDP jitter or a voice test, one probe operation means continuously sending a specified
number of probe packets. The number of probe packets is configurable.
• During an FTP, HTTP, DHCP or DNS test, one probe operation means uploading or downloading a
file, obtaining a web page, obtaining an IP address through DHCP, or translating a domain name
to an IP address.
• During an ICMP echo or UDP echo test, one probe operation means sending an ICMP echo request
or a UDP packet.
11
Page 22
• During an SNMP test, one probe operation means sending one SNMPv1 packet, one SNMPv2C
packet, and one SNMPv3 packet.
NQA client and server
A device with NQA test groups configured is an NQA client and the NQA client initiates NQA tests. An
NQA server makes responses to probe packets destined to the specified destination address and port
number.
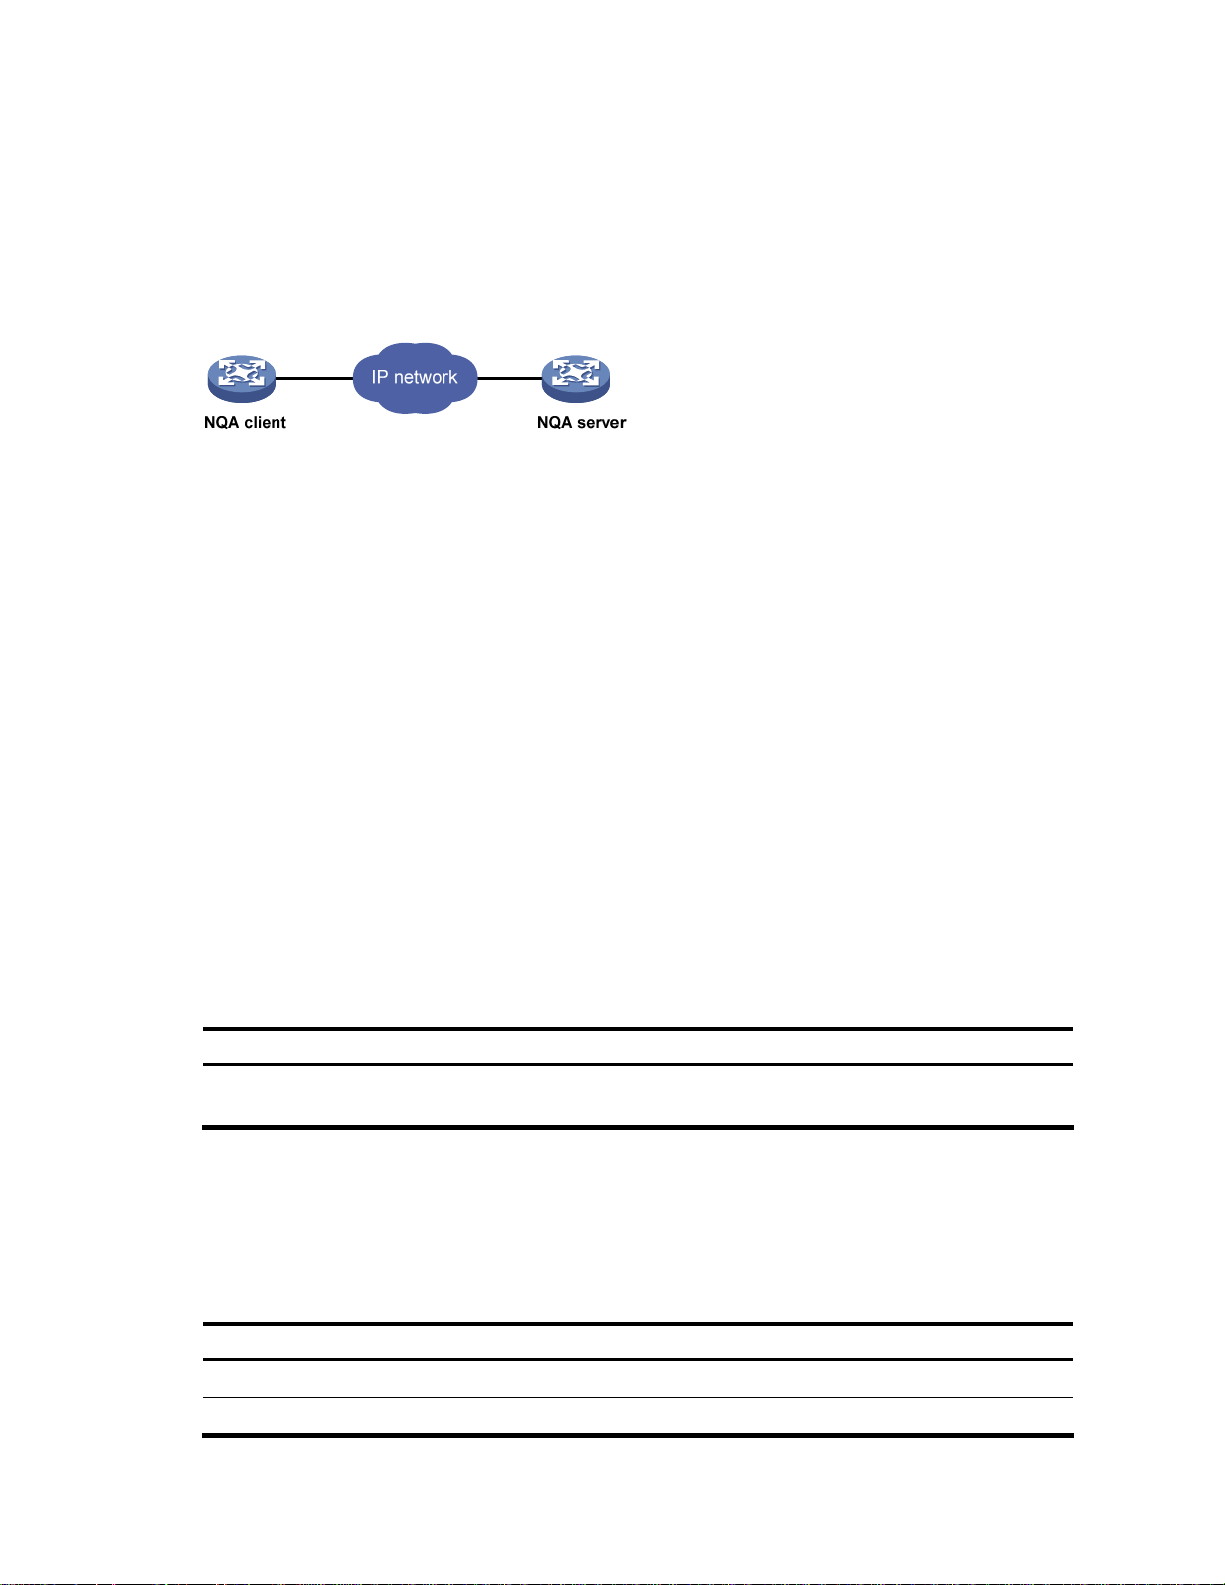
Figure 6 Relationship between the NQA client and NQA server
Not all test types require the NQA server. Only the TCP, UDP echo, UDP jitter, or voice test requires both
the NQA client and server, as shown in Figure 6.
Y
ou can create multiple TCP or UDP listening services on the NQA server. Each listens to a specific
destination address and port number. Make sure the destination IP address and port number for a
listening service on the server are the same as those configured for the test group on the NQA client.
Each listening service must be unique on the NQA server.
NQA probe operation procedure
An NQA probe operation involves the following steps:
1. The NQA client constructs probe packets for the specified type of NQA test, and sends them to the
peer device.
2. Upon receiving the probe packets, the peer sends back responses with timestamps.
3. The NQA client computes the network performance and service quality parameters, such as the
packet loss rate and round-trip time based on the received responses.
NQA configuration task list
To enable the NQA server:
Task Remarks
Configuring the NQA server
To perform NQA tests successfully, make the following configurations on the NQA client:
1. Enable the NQA client.
2. Create a test group and configure test parameters. The test parameters may vary with test types.
3. Schedule the NQA test group.
Required for TCP, UDP echo, UDP jitter and voice
tests
To configure NQA client:
Task Remarks
Enabling the NQA client Required
Creating an NQA test group Required
12
Page 23

Task Remarks
Configuring ICMP echo tests
Configuring DHCP tests
Configuring DNS tests
Configuring FTP tests
Configuring HTTP tests
Configuring an NQA test group
Configuring the collaboration function Optional
Configuring threshold monitoring Optional
Configuring the NQA statistics collection function Optional
Configuring the history records saving function Optional
Configuring optional parameters for an NQA test group Optional
Scheduling an NQA test group Required
Configuring UDP jitter tests
Configuring SNMP tests
Configuring TCP tests
Configuring UDP echo tests
Configuring voice tests
Configuring DLSw tests
Configuring the NQA server
Required
Use any of the approac
hes
To perform TCP, UDP echo, UDP jitter, or voice tests, configure the NQA server on the peer device. The
NQA server responses to the probe packets sent from the NQA client by listening to the specified
destination address and port number.
To configure the NQA server:
To do… Use the command… Remarks
1. Enter system view.
2. Enable the NQA server.
3. Configure the listening
service.
system-view —
nqa server enable
nqa server { tcp-connect | udpecho } ip-address port-number
13
Required.
Disabled by default.
Required.
The destination IP address and port
number must be the same as those
configured on the NQA client. A
listening service must be unique on
the NQA server.
Page 24

Enabling the NQA client
Configurations on the NQA client only take effect when the NQA client is enabled.
To enable the NQA client:
To do… Use the command… Remarks
1. Enter system view.
system-view —
2. Enable the NQA client.
nqa agent enable
Creating an NQA test group
Create an NQA test group before you configure NQA tests.
To do… Use the command… Remarks
1. Enter system view.
2. Create an NQA test group
and enter the NQA test group
view.
system-view —
nqa entry admin-name operation-
tag
Configuring an NQA test group
Optional.
Enabled by default.
Required.
In the NQA test group view, you
can specify the test type.
You can use the nqa entry
command to enter the test type
view of an NQA test group with
test type configured.
Configuring ICMP echo tests
ICMP echo tests of an NQA test group are used to test reachability of a destination host according to the
ICMP echo response information. An ICMP echo test has the same function as the ping command but
provides more output information. In addition, you can specify the next hop for ICMP echo tests. ICMP
echo tests are used to locate connectivity problems in a network.
To configure ICMP echo tests:
To do… Use the command… Remarks
1. Enter system view.
2. Enter NQA test group view.
3. Configure the test type as
ICMP echo and enter test type
view.
4. Configure the destination
address of ICMP echo
requests.
system-view —
nqa entry admin-name operation-
tag
type icmp-echo Required.
destination ip ip-address
14
—
Required.
By default, no destination IP
address is configured.
Page 25

To do… Use the command… Remarks
5. Configure the size of the data
field in each ICMP echo
request.
data-size size
Optional.
100 bytes by default.
6. Configure the string to be
filled in the data field of each
ICMP echo request.
7. Apply ICMP echo tests to the
specified VPN.
8. Configure the source interface
for ICMP echo requests. The
requests take the IP address of
the source interface as their
source IP address when no
source IP address is specified.
9. Configure the source IP
address of ICMP echo
requests.
data-fill string
vpn-instance vpn-instance-name
source interface interface-type
interface-number
source ip ip-address
Optional.
By default, the string is the
hexadecimal number
00010203040506070809.
Optional.
By default, ICMP echo tests apply
to the public network.
Optional.
By default, no source interface is
configured for probe packets.
The specified source interface
must be up; otherwise, no ICMP
echo requests can be sent out.
Optional
By default, no source IP address is
configured.
If you configure both the source ip
command and the source
interface command, the source ip
command takes effect.
The source IP address must be the
IP address of a local interface.
The local interface must be up;
otherwise, no ICMP echo requests
can be sent out.
10. Configure the next hop IP
address of ICMP echo
requests.
11. Configure optional
parameters.
next-hop ip-address
See “Configuring optional
parameters for an NQA test
group”
NOTE:
NQA ICMP echo tests are not supported in IPv6 networks. To test the reachability of an IPv6 address,
use the ping ipv6 command. For more information about the command, see “System maintenance and
debugging.”
Configuring DHCP tests
DHCP tests of an NQA test group are used to test if a DHCP server is on the network, and how long it
takes for the DHCP server to respond to a client request and assign an IP address to the client.
15
Optional.
By default, no next hop IP address
is configured.
Optional.
Page 26

Configuration prerequisites
Before you start DHCP tests, configure the DHCP server. If the NQA (DHCP client) and the DHCP server
are not in the same network segment, configure a DHCP relay. For the configuration of DHCP server and
DHCP relay, see Layer 3
Configuring DHCP tests
To configure DHCP tests:
To do… Use the command… Remarks
1. Enter system view.
—
IP Services Configuration Guide.
system-view —
2. Enter NQA test group view.
3. Configure the test type as
DHCP and enter test type
view.
4. Specify an interface to
perform DHCP tests.
5. Configure optional
parameters.
nqa entry admin-name operationtag
type dhcp Required.
operation interface interface-type
interface-number
See “Configuring optional
parameters for an NQA test
group”
—
Required.
By default, no interface is
configured to perform DHCP tests.
The specified interface must be
up; otherwise, no probe packets
can be sent out.
Optional.
NOTE:
• The interface that performs DHCP tests does not change its IP address. A DHCP test only simulates
address allocation in DHCP.
• When a DHCP test completes, the NQA client sends a DHCP-RELEASE packet to release the obtained
IP address.
Configuring DNS tests
DNS tests of an NQA test group are used to test whether the NQA client can translate a domain name
into an IP address through a DNS server and test the time required for resolution.
Configuration prerequisites
Before you start DNS tests, configure the mapping between a domain name and an IP address on a DNS
server.
Configuring DNS tests
To configure DNS tests:
To do… Use the command… Remarks
1. Enter system view.
2. Enter NQA test group view.
3. Configure the test type as
DNS and enter test type view.
system-view —
nqa entry admin-name operation-tag
type dns Required.
16
—
Page 27

To do… Use the command… Remarks
4. Specify the IP address of the
DNS server as the destination
address of DNS packets.
5. Configure the domain name
that needs to be translated.
6. Configure optional
parameters.
NOTE:
A DNS test simulates the domain name resolution. It does not save the mapping between the domain
name and the IP address.
Configuring FTP tests
FTP tests of an NQA test group are used to test the connection between the NQA client and an FTP server
and the time necessary for the FTP client to transfer a file to or download a file from the FTP server.
Configuration prerequisites
Before you start FTP tests, configure the FTP server. For example, configure the username and password
that are used to log in to the FTP server. For more information about FTP server configuration, see
Fundamentals Configuration Guide.
destination ip ip-address
resolve-target domain-name
See “Configuring optional
parameters for an NQA test group”
Required.
By default, no destination IP
address is configured.
Required.
By default, no domain name is
configured.
Optional.
Configuring FTP tests
To configure FTP tests:
To do… Use the command… Remarks
1. Enter system view.
2. Enter NQA test group view.
3. Configure the test type as FTP
and enter test type view.
4. Specify the IP address of the
FTP server as the destination
address of FTP request
packets.
5. Configure the source IP
address of FTP request
packets.
system-view —
nqa entry admin-name operation-
tag
type ftp Required.
destination ip ip-address
source ip ip-address
—
Required.
By default, no destination IP
address is configured.
Required.
By default, no source IP address is
specified.
The source IP address must be the
IP address of a local interface.
The local interface must be up;
otherwise, no FTP requests can be
sent out.
17
Page 28

To do… Use the command… Remarks
Optional.
6. Configure the operation type.
7. Configure a login username.
8. Configure a login password.
9. Specify a file to be transferred
between the FTP server and
the FTP client.
operation { get | put }
username name
password password
filename file-name
By default, the operation type for
the FTP is get, which means
obtaining files from the FTP server.
Required.
By default, no login username is
configured.
Required.
By default, no login password is
configured.
Required.
By default, no file is specified.
10. Set the data transmission
mode for FTP tests.
11. Configure optional
parameters.
NOTE:
• When you execute the put command, a file
FTP server. When you execute the get command, the device does not save the files obtained from the
FTP server.
• When you download a file that does not exist on the FTP server, FTP tests fail.
• When you execute the get command, use a file with a small size. A big file may result in test failure
due to timeout, or may affect other services for occupying too much network bandwidth.
Configuring HTTP tests
HTTP tests of an NQA test group are used to test the connection between the NQA client and an HTTP
server and the time required to obtain data from the HTTP server. HTTP tests enable you to detect the
connectivity and performance of the HTTP server.
Configuration prerequisites
mode { active | passive }
See “Configuring optional
parameters for an NQA test
group”
file-name
with fixed size and content is created on the
Optional.
active by default.
Optional.
Before you start HTTP tests, configure the HTTP server.
Configuring HTTP tests
To configure HTTP tests:
To do… Use the command… Remarks
1. Enter system view.
2. Enter NQA test group view.
3. Configure the test type as
HTTP and enter test type view.
system-view —
nqa entry admin-name operation-
tag
type http Required.
18
—
Page 29

To do… Use the command… Remarks
4. Configure the IP address of
the HTTP server as the
destination address of HTTP
request packets.
5. Configure the source IP
address of request packets.
6. Configure the operation type.
7. Configure the website that an
HTTP test visits.
destination ip ip-address
source ip ip-address
operation { get | post }
url url Required.
Required.
By default, no destination IP
address is configured.
Optional.
By default, no source IP address is
specified.
The source IP address must be the
IP address of a local interface.
The local interface must be up;
otherwise, no probe packets can
be sent out.
Optional.
By default, the operation type for
the HTTP is get, which means
obtaining data from the HTTP
server.
8. Configure the HTTP version
used in HTTP tests.
9. Configure optional
parameters.
http-version v1.0
See “Configuring optional
parameters for an NQA test
group”
NOTE:
The TCP port must be port 80 on the HTTP server for NQA HTTP tests.
Configuring UDP jitter tests
Do not perform NQA UDP jitter tests on known ports, ports from 1 to 1023. Otherwise, UDP jitter tests
might fail or the corresponding services of this port might be unavailable.
Real-time services such as voice and video have high requirements on delay jitters. UDP jitter tests of an
NQA test group obtain uni/bi-directional delay jitters. The test results help you verify whether a network
can carry real-time services.
A UDP jitter test takes the following procedure:
1. The source sends packets at regular intervals to the destination port.
2. The destination affixes a time stamp to each packet that it receives, and then sends it back to the
source.
Optional.
By default, HTTP 1.0 is used.
Optional.
3. Upon receiving the response, the source calculates the delay jitter, which reflects network
performance. Delay refers to the amount of time it takes a packet to be transmitted from source to
destination or from destination to source. Delay jitter is the delay variation over time.
19
Page 30

Configuration prerequisites
UDP jitter tests require cooperation between the NQA server and the NQA client. Before you start UDP
jitter tests, configure UDP listening services on the NQA server. For more information about UDP listening
service configuration, see “Configuring the NQA server.”
Configuring UDP jitter tests
To configure UDP jitter tests:
To do… Use the command… Remarks
1. Enter system view.
system-view —
2. Enter NQA test group view.
3. Configure the test type as UDP
jitter and enter test type view.
4. Configure the destination
address of UDP packets.
5. Configure the destination port
of UDP packets.
6. Specify the source port
number of UDP packets.
7. Configure the size of the data
field in each UDP packet.
nqa entry admin-name operationtag
type udp-jitter Required.
destination ip ip-address
destination port port-number
source port port-number
data-size size
—
Required.
By default, no destination IP
address is configured.
The destination IP address must be
the same as that of the listening
service on the NQA server.
Required.
By default, no destination port
number is configured.
The destination port must be the
same as that of the listening
service on the NQA server.
Optional.
By default, no source port number
is specified.
Optional.
100 bytes by default.
8. Configure the string to be
filled in the data field of each
probe packet.
9. Configure the number of
probe packets to be sent
during each UDP jitter probe
operation.
10. Configure the interval for
sending probe packets during
each UDP jitter probe
operation.
11. Configure the interval the
NQA client must wait for a
response from the server
before it regards the response
is timed out.
data-fill string
probe packet-number
packet-number
probe packet-interval packet-
interval
probe packet-timeout packet-
timeout
20
Optional.
By default, the string is the
hexadecimal number
00010203040506070809.
Optional.
10 by default.
Optional.
20 milliseconds by default.
Optional.
3000 milliseconds by default.
Page 31

To do… Use the command… Remarks
Optional.
By default, no source IP address is
specified.
12. Configure the source IP
address for UDP jitter packets.
source ip ip-address
The source IP address must be the
IP address of a local interface.
The local interface must be up;
otherwise, no probe packets can
be sent out.
13. Configure optional
parameters.
NOTE:
The probe count command specifies the number of probe operations during one UDP jitter test. The
probe packet-number command specifies the number of probe packets sent in each UDP jitter probe
operation.
Configuring SNMP tests
SNMP tests of an NQA test group are used to test the time the NQA client takes to send an SNMP packet
to the SNMP agent and receive a response.
Configuration prerequisites
Before you start SNMP tests, enable the SNMP agent function on the device that serves as an SNMP
agent. For more information about SNMP agent configuration, see “Configuring SNMP.”
Configuring SNMP tests
To configure SNMP tests:
To do… Use the command… Remarks
1. Enter system view.
See “Configuring optional
parameters for an NQA test
group”
system-view —
Optional.
2. Enter NQA test group view.
3. Configure the test type as
SNMP and enter test type
view.
4. Configure the destination
address of SNMP packets.
5. Specify the source port of
SNMP packets.
nqa entry admin-name operationtag
type snmp Required.
destination ip ip-address
source port port-number
21
—
Required.
By default, no destination IP
address is configured.
Optional.
By default, no source port number
is specified.
Page 32

To do… Use the command… Remarks
Optional.
By default, no source IP address is
specified.
6. Configure the source IP
address of SNMP packets.
source ip ip-address
The source IP address must be the
IP address of a local interface.
The local interface must be up;
otherwise, no probe packets can
be sent out.
7. Configure optional
parameters.
Configuring TCP tests
TCP tests of an NQA test group are used to test the TCP connection between the NQA client and a port
on the NQA server and the time for setting up a connection. The test result helps you understand the
availability and performance of the services provided by the port on the server.
Configuration prerequisites
TCP tests require cooperation between the NQA server and the NQA client. Before you start TCP tests,
configure a TCP listening service on the NQA server. For more information about the TCP listening service
configuration, see “Configuring the NQA server.”
Configuring TCP tests
To configure TCP tests:
To do… Use the command… Remarks
1. Enter system view.
2. Enter NQA test group view.
3. Configure the test type as TCP
and enter test type view.
See “Configuring optional
parameters for an NQA test
group”
Optional.
system-view —
nqa entry admin-name operation-
tag
type tcp Required.
—
4. Configure the destination
address of TCP probe packets.
5. Configure the destination port
of TCP probe packets.
destination ip ip-address
destination port port-number
22
Required.
By default, no destination IP
address is configured.
The destination address must be
the same as the IP address of the
listening service configured on the
NQA server.
Required.
By default, no destination port
number is configured.
The destination port number must
be the same as that of the
listening service on the NQA
server.
Page 33

To do… Use the command… Remarks
Optional.
By default, no source IP address is
specified.
6. Configure the source IP
address of TCP probe packets.
source ip ip-address
The source IP address must be the
IP address of a local interface.
The local interface must be up;
otherwise, no probe packets can
be sent out.
7. Configure optional
parameters.
See “Configuring optional
parameters for an NQA test
group”
Configuring UDP echo tests
UDP echo tests of an NQA test group tests the connectivity and round-trip time of a UDP packet from the
client to the specified UDP port on the NQA server.
Configuration prerequisites
UDP echo tests require cooperation between the NQA server and the NQA client. Before you start UDP
echo tests, configure a UDP listening service on the NQA server. For more information about the UDP
listening service configuration, see “Configuring the NQA server.”
Configuring UDP echo tests
To configure UDP echo tests:
To do… Use the command… Remarks
1. Enter system view.
2. Enter NQA test group view.
3. Configure the test type as UDP
echo and enter test type view.
system-view —
nqa entry admin-name operation-
tag
type udp-echo Required.
Optional.
—
4. Configure the destination
address of UDP packets.
5. Configure the destination port
of UDP packets.
destination ip ip-address
destination port port-number
23
Required.
By default, no destination IP
address is configured.
The destination address must be
the same as the IP address of the
listening service configured on the
NQA server.
Required.
By default, no destination port
number is configured.
The destination port number must
be the same as that of the
listening service on the NQA
server.
Page 34

or
To do… Use the command… Remarks
6. Configure the size of the data
field in each UDP packet.
7. Configure the string to be
filled in the data field of each
UDP packet.
8. Specify the source port of UDP
packets.
9. Configure the source IP
address of UDP packets.
10. Configure optional
parameters.
data-size size
data-fill string
source port port-number
source ip ip-address
See “Configuring optional
parameters for an NQA test
group”
Optional.
100 bytes by default.
Optional.
By default, the string is the
hexadecimal number
00010203040506070809.
Optional.
By default, no source port number
is specified.
Optional.
By default, no source IP address is
specified.
The source IP address must be that
of an interface on the device and
the interface must be up;
otherwise, no probe packets can
be sent out.
Optional.
Configuring voice tests
Voice tests of an NQA test group are used to test VoIP network status, and collect VoIP network
parameters so that users can adjust the network.
NOTE:
Do not perform voice tests on known ports, ports from 1 to 1023. Otherwise, the NQA test might fail
the corresponding services of these ports might be unavailable.
A voice test takes the following procedure:
1. The source (NQA client) sends voice packets of G.711 A-law, G.711 μ-law or G.729 A-law codec
type at regular intervals to the destination (NQA server).
2. The destination affixes a time stamp to each voice packet that it receives and then sends it back to
the source.
3. Upon receiving the packet, the source calculates results, such as the delay jitter and one-way delay
based on the packet time stamps. The statistics reflect network performance.
Voice test result also includes the following parameters that reflect VoIP network performance:
• ICPIF—Measures impairment to voice quality in a VoIP network. It is decided by packet loss and
delay. A higher value represents a lower service quality.
• MOS—Value can be evaluated by using the ICPIF value, ranging from 1 to 5. A higher value
represents a higher quality of a VoIP network.
The evaluation of voice quality depends on users’ tolerance to voice quality, which should be taken into
consideration. For users with higher tolerance to voice quality, use the advantage-factor command to
24
Page 35

configure the advantage factor. When the system calculates the ICPIF value, this advantage factor is
subtracted to modify ICPIF and MOS values and both the objective and subjective factors are considered
when you evaluate the voice quality.
Configuration prerequisites
Voice tests require cooperation between the NQA server and the NQA client. Before you start voice tests,
configure a UDP listening service on the NQA server. For more information about UDP listening service
configuration, see “Configuring the NQA server.”
Configuring voice tests
To configure voice tests:
To do… Use the command… Remarks
1. Enter system view.
system-view —
2. Enter NQA test group view.
3. Configure the test type as
voice and enter test type view.
4. Configure the destination
address of voice probe
packets.
5. Configure the destination port
of voice probe packets.
6. Configure the codec type.
7. Configure the advantage
factor for calculating MOS
and ICPIF values.
nqa entry admin-name operation-
tag
type voice Required.
destination ip ip-address
destination port port-number
codec-type { g711a | g711u |
g729a }
advantage-factor factor
—
Required.
By default, no destination IP
address is configured for a test
operation.
The destination IP address must be
the same as that of the listening
service on the NQA server.
Required.
By default, no destination port
number is configured.
The destination port must be the
same as that of the listening
service on the NQA server.
Optional.
By default, the codec type is
G.711 A-law.
Optional.
By default, the advantage factor is
0.
8. Specify the source IP address
of probe packets.
9. Specify the source port
number of probe packets.
source ip ip-address
source port port-number
25
Optional.
By default, no source IP address is
specified.
The source IP address must be the
IP address of a local interface.
The local interface must be up;
otherwise, no probe packets can
be sent out.
Optional.
By default, no source port number
is specified.
Page 36

To do… Use the command… Remarks
Optional.
By default, the probe packet size
10. Configure the size of the data
field in each probe packet.
data-size size
depends on the codec type. The
default packet size is 172 bytes
for G.711A-law and G.711 μ-law
codec type, and is 32 bytes for
G.729 A-law codec type.
11. Configure the string to be
filled in the data field of each
probe packet.
12. Configure the number of
probe packets to be sent
during each voice probe
operation.
13. Configure the interval for
sending probe packets during
each voice probe operation.
14. Configure the interval the
NQA client must wait for a
response from the server
before it regards the response
times out.
15. Configure optional
parameters.
data-fill string
probe packet-number
packet-number
probe packet-interval packetinterval
probe packet-timeout packet-
timeout
See “Configuring optional
parameters for an NQA test
group"
NOTE:
Only one probe operation is performed in one voice test.
Optional
By default, the string is the
hexadecimal number
00010203040506070809.
Optional.
1000 by default.
Optional.
20 milliseconds by default.
Optional.
5000 milliseconds by default.
Optional.
Configuring DLSw tests
DLSw tests of an NQA test group are used to test the response time of a DLSw device.
Configuration prerequisites
Before you start DLSw tests, enable the DLSw function on the peer device.
Configuring a DLSw test
To configure DLSw tests:
To do… Use the command… Remarks
1. Enter system view.
2. Enter NQA test group view.
3. Configure the test type as
DLSw and enter test type view.
system-view —
nqa entry admin-name operation-
tag
type dlsw Required.
26
—
Page 37

To do… Use the command… Remarks
4. Configure the destination
address of probe packets.
5. Configure the source IP
address of probe packets.
6. Configure optional
parameters.
destination ip ip-address
source ip ip-address
See “Configuring optional
parameters for an NQA test
group”
Required.
By default, no destination IP
address is configured.
Optional.
By default, no source IP address is
specified.
The source IP address must be the
IP address of a local interface.
The local interface must be up;
otherwise, no probe packets can
be sent out.
Optional.
Configuring the collaboration function
Collaboration is implemented by establishing reaction entries to monitor the detection results of a test
group. If the number of consecutive probe failures reaches the threshold, the configured action is
triggered.
To configure the collaboration function:
To do… Use the command… Remarks
1. Enter system view.
2. Enter NQA test group view.
3. Enter test type view of the test
group.
4. Configure a reaction entry.
5. Exit to system view.
6. Configure a track entry and
associate it with the reaction
entry of the NQA test group.
system-view —
nqa entry admin-name operation-
tag
type { dhcp | dlsw | dns | ftp |
http | icmp-echo | snmp | tcp |
udp-echo }
reaction item-number checkedelement probe-fail threshold-type
consecutive consecutive-
occurrences action-type triggeronly
quit —
track entry-number nqa entry
admin-name operation-tag
reaction item-number
—
The collaboration function is not
supported in UDP jitter and voice
tests.
Required.
Not created by default.
You cannot modify the content of
an existing reaction entry.
Required.
Not created by default.
27
Page 38

Configuring threshold monitoring
Configuration prerequisites
Before you configure threshold monitoring, complete the following tasks:
• Configure the destination address of the trap message by using the snmp-agent target-host
command. For more information about the snmp-agent target-host command, see “SNMP
configuration commands.”
• Create an NQA test group and configure related parameters.
Configuring threshold monitoring
To configure threshold monitoring:
To do… Use the command… Remarks
1. Enter system view.
system-view —
2. Enter NQA test group view.
3. Enter test type view of the test
group.
• Configure the device to send
traps to the network
management server under
specified conditions.
• Configure a reaction entry for
monitoring the probe duration
of a test (not supported in UDP
jitter and voice tests)
• Configure a reaction entry for
monitoring the probe failure
times (not supported in UDP
jitter and voice tests)
• Configure a reaction entry for
monitoring packet round-trip
time (only supported in UDP
jitter and voice tests)
• Configure a reaction entry for
monitoring the packet loss in
each test (only supported in
UDP jitter and voice tests)
nqa entry admin-name operation-tag —
type { dhcp | dlsw | dns | ftp | http | icmpecho | snmp | tcp | udp-echo | udp-jitter |
voice }
reaction trap { probe-failure consecutive-probe-
failures | test-complete | test-failure cumulateprobe-failures }
reaction item-number checked-element probeduration threshold-type { accumulate
accumulate-occurrences | average |
consecutive consecutive-occurrences } thresholdvalue upper-threshold lower-threshold [ actiontype { none | trap-only } ]
reaction item-number checked-element probefail threshold-type { accumulate accumulate-
occurrences | consecutive consecutiveoccurrences } [ action-type { none | trap-
only } ]
reaction item-number checked-element rtt
threshold-type { accumulate accumulate-
occurrences | average } threshold-value upperthreshold lower-threshold [ action-type { none |
trap-only } ]
reaction item-number checked-element packetloss threshold-type accumulate accumulate-
occurrences [ action-type { none | trap-only } ]
—
Required.
Configure the device
to send traps.
No traps are sent to
the network
management server
by default.
• Configure a reaction entry for
monitoring one-way delay
jitter (only supported in UDP
jitter and voice tests)
reaction item-number checked-element { jitter-ds
| jitter-sd } threshold-type { accumulate
accumulate-occurrences | average } threshold-
value upper-threshold lower-threshold [ actiontype { none | trap-only } ]
28
Page 39

To do… Use the command… Remarks
• Configure a reaction entry for
monitoring the one-way delay
(only supported in UDP jitter
and voice tests)
reaction item-number checked-element { owd-ds
| owd-sd } threshold-value upper-threshold
lower-threshold
• Configure a reaction entry for
monitoring the ICPIF value
(only supported in voice tests)
• Configure a reaction entry for
monitoring the MOS value
(only supported in voice tests)
reaction item-number checked-element icpif
threshold-value upper-threshold lower-threshold
[ action-type { none | trap-only } ]
reaction item-number checked-element mos
threshold-value upper-threshold lower-threshold
[ action-type { none | trap-only } ]
NOTE:
• NQA DNS tests do not support the action of sending trap messages. The action to be triggered in
DNS tests can only be the default one, none.
• Only the test-complete keyword is supported for the reaction trap command in a voice test.
Configuring the NQA statistics collection function
NQA groups tests completed in a time period for a test group, and calculates the test result statistics. The
statistics form a statistics group. To view information about the statistics groups, use the display nqa
statistics command. To set the interval for collecting statistics, use the statistics interval command.
When the number of statistics groups kept reaches the upper limit and a new statistics group is to be
saved, the earliest statistics group is deleted. To set the maximum number of statistics groups that can be
kept, use the statistics max-group command.
A statistics group is formed after the last test is completed within the specified interval. When its hold time
expires, the statistics group is deleted. To set the hold time of statistics groups for a test group, use the
statistics hold-time command.
To configure the NQA statistics collection function:
To do… Use the command… Remarks
1. Enter system view.
2. Enter NQA test group view.
3. Enter test type view of the test
group.
4. Configure the interval for
collecting the statistics of test
results.
5. Configure the maximum
number of statistics groups
that can be kept.
system-view —
nqa entry admin-name operation-
tag
type { dlsw | dns | ftp | http |
icmp-echo | snmp | tcp | udpecho | udp-jitter | voice }
statistics interval interval
statistics max-group number
—
—
Optional.
60 minutes by default.
Optional.
2 by default.
To disable collecting NQA
statistics, set the maximum number
to 0.
29
Page 40

To do… Use the command… Remarks
6. Configure the hold time of
statistics groups.
statistics hold-time hold-time
Optional.
120 minutes by default.
NOTE:
• The NQA statistics collection function is not supported in DHCP tests.
• If you use the frequency command to set the frequency between two consecutive tests to 0, only one
test is performed, and no statistics group information is collected.
Configuring the history records saving function
The history records saving function enables the system to save the history records of NQA tests. To view
the history records of a test group, use the display nqa history command.
In addition, you can configure the following elements:
• Lifetime of the history records—Records are removed when the lifetime is reached.
• The maximum number of history records that can be saved in a test group—If the number of history
records in a test group exceeds the maximum number, the earliest history records are removed.
To configure the history records saving function of an NQA test group:
To do… Use the command… Remarks
1. Enter system view.
2. Enter NQA test group
view.
system-view —
nqa entry admin-name operation-tag —
3. Enter NQA test type
view.
4. Enable the saving of the
history records of the
NQA test group.
5. Set the lifetime of the
history records in an
NQA test group.
6. Configure the maximum
number of history
records that can be
saved for a test group.
type { dhcp | dlsw | dns | ftp | http |
icmp-echo | snmp | tcp | udp-echo | udpjitter | voice }
history-record enable
history-record keep-time keep-time
history-record number number
—
Required.
By default, history records of
the NQA test group are not
saved.
Optional.
By default, the history records
in the NQA test group are kept
for 120 minutes.
Optional.
By default, the maximum
number of records that can be
saved for a test group is 50
30
Page 41

Configuring optional parameters for an NQA test group
Optional parameters for an NQA test group are only valid for tests in this test group.
Unless otherwise specified, the following optional parameters are applicable to all test types.
To configure optional parameters for an NQA test group:
To do… Use the command… Remarks
1. Enter system view.
system-view —
2. Enter NQA test group view.
3. Enter test type view of a test
group.
4. Configure the description for a
test group.
5. Configure the interval
between two consecutive tests
for a test group.
6. Configure the number of
probe operations to be
performed in one test.
nqa entry admin-name operation-
tag
type { dhcp | dlsw | dns | ftp |
http | icmp-echo | snmp | tcp |
udp-echo | udp-jitter | voice }
description text
frequency interval
probe count times
—
—
Optional.
By default, no description is
available for a test group.
Optional.
By default, the interval between
two consecutive tests for a test
group is 0 milliseconds. Only one
test is performed.
If the last test is not completed
when the interval specified by the
frequency command is reached, a
new test does not start.
Optional.
By default, one probe operation is
performed in one test.
Not available for voice tests. Only
one probe operation can be
performed in one voice test.
7. Configure the NQA probe
timeout time.
8. Configure the maximum
number of hops a probe
packet traverses in the
network.
9. Configure the ToS field in an
IP packet header in an NQA
probe packet.
probe timeout timeout
ttl value
tos value
31
Optional.
By default, the timeout time is
3000 milliseconds.
Not available for UDP jitter tests.
Optional.
20 by default.
Not available for DHCP tests.
Optional.
0 by default.
Not available for DHCP tests.
Page 42

To do… Use the command… Remarks
10. Enable the routing table
bypass function.
route-option bypass-route
Scheduling an NQA test group
You can schedule an NQA test group by setting the start time and test duration for a test group.
A test group performs tests between the scheduled start time and the end time (the start time plus test
duration). If the scheduled start time is ahead of the system time, the test group starts testing immediately.
If both the scheduled start and end time are behind the system time, no test will start. To view the current
system time, use the display clock command.
Configuration prerequisites
Before you schedule an NQA test group, complete the following tasks:
• Configure test parameters required for the test type.
• Configure the NQA server for tests that require cooperation with the NQA server.
Scheduling an NQA test group
To schedule an NQA test group:
Optional.
Disabled by default.
Not available for DHCP tests.
To do… Use the command… Remarks
1. Enter system view.
2. Schedule an NQA test group.
3. Configure the maximum
number of tests that the NQA
client can simultaneously
perform.
system-view —
Required.
nqa schedule admin-name
operation-tag start-time
{ hh:mm:ss [ yyyy/mm/dd ] |
now } lifetime { lifetime | forever }
nqa agent max-concurrent
number
now specifies the test group starts
testing immediately.
forever specifies that the tests do
not stop unless you use the undo
nqa schedule command.
Optional.
By default, an NQA client can
simultaneously perform two tests
at most.
NOTE:
• After an NQA test group is scheduled, you cannot enter the test group view or test type view.
• System adjustment does not affect started or completed test groups. It only affects test groups that
have not started.
32
Page 43

Displaying and maintaining NQA
To do… Use the command… Remarks
Display history records of NQA
test groups
Display the current monitoring
results of reaction entries
Display the results of the last
NQA test
Display statistics of test results for
the specified or all test groups
Display NQA server status
display nqa history [ admin-name operationtag ] [ | { begin | exclude | include }
regular-expression ]
display nqa reaction counters [ admin-name
operation-tag [ item-number ] ] [ | { begin |
exclude | include } regular-expression ]
display nqa result [ admin-name operation-
tag ] [ | { begin | exclude | include }
regular-expression ]
display nqa statistics [ admin-name
operation-tag ] [ | { begin | exclude |
include } regular-expression ]
display nqa server status [ | { begin |
exclude | include } regular-expression ]
Configuring NQA examples
Configuring ICMP echo test example
Network requirements
Available in any view
As shown in Figure 7, configure NQA ICMP echo tests to test whether the NQA client (Device A) can
send packets through a specified next hop to a specified destination (Device B) and test the round-trip
time of the packets.
Figure 7 Network diagram for ICMP echo tests
Device C
10.1.1.2/24
NQA client
10.1.1.1/24 10.2.2.2/24
10.3.1.1/24
10.3.1.2/24
10.2.2.1/24
10.4.1.2/24
Device BDevice A
10.4.1.1/24
Device D
33
Page 44

Configuration procedure
NOTE:
Before you make the configuration, make sure the devices can reach each other.
# Create an ICMP echo test group and specify 10.2.2.2 as the destination IP address for ICMP echo
requests to be sent.
<DeviceA> system-view
[DeviceA] nqa entry admin test
[DeviceA-nqa-admin-test] type icmp-echo
[DeviceA-nqa-admin-test-icmp-echo] destination ip 10.2.2.2
# Configure 10.1.1.2 as the next hop IP address for ICMP echo requests. The ICMP echo requests are sent
to Device C to Device B (the destination).
[DeviceA-nqa-admin-test-icmp-echo] next-hop 10.1.1.2
# Configure the device to perform 10 probe operations per test, perform tests at an interval of 5000
milliseconds. Set the NQA probe timeout time as 500 milliseconds.
[DeviceA-nqa-admin-test-icmp-echo] probe count 10
[DeviceA-nqa-admin-test-icmp-echo] probe timeout 500
[DeviceA-nqa-admin-test-icmp-echo] frequency 5000
# Enable the saving of history records and configure the maximum number of history records that can be
saved for a test group.
[DeviceA-nqa-admin-test-icmp-echo] history-record enable
[DeviceA-nqa-admin-test-icmp-echo] history-record number 10
[DeviceA-nqa-admin-test-icmp-echo] quit
# Start ICMP echo tests.
[DeviceA] nqa schedule admin test start-time now lifetime forever
# Stop the ICMP echo tests after a period of time.
[DeviceA] undo nqa schedule admin test
# Display the results of the last ICMP echo test.
[DeviceA] display nqa result admin test
NQA entry (admin admin, tag test) test results:
Destination IP address: 10.2.2.2
Send operation times: 10 Receive response times: 10
Min/Max/Average round trip time: 2/5/3
Square-Sum of round trip time: 96
Last succeeded probe time: 2007-08-23 15:00:01.2
Extended results:
Packet loss in test: 0%
Failures due to timeout: 0
Failures due to disconnect: 0
Failures due to no connection: 0
Failures due to sequence error: 0
Failures due to internal error: 0
Failures due to other errors: 0
Packet(s) arrived late: 0
34
Page 45

# Display the history of ICMP echo tests.
[DeviceA] display nqa history admin test
NQA entry (admin admin, tag test) history record(s):
Index Response Status Time
370 3 Succeeded 2007-08-23 15:00:01.2
369 3 Succeeded 2007-08-23 15:00:01.2
368 3 Succeeded 2007-08-23 15:00:01.2
367 5 Succeeded 2007-08-23 15:00:01.2
366 3 Succeeded 2007-08-23 15:00:01.2
365 3 Succeeded 2007-08-23 15:00:01.2
364 3 Succeeded 2007-08-23 15:00:01.1
363 2 Succeeded 2007-08-23 15:00:01.1
362 3 Succeeded 2007-08-23 15:00:01.1
361 2 Succeeded 2007-08-23 15:00:01.1
Configuring DHCP test example
Network requirements
As shown in Figure 8, configure NQA DHCP tests to test the time required for Device A to obtain an IP
address from the DHCP server (Device B).
Figure 8 Network diagram for DHCP test
Configuration procedure
# Create a DHCP test group and specify interface VLAN-interface 2 to perform NQA DHCP tests.
<DeviceA> system-view
[DeviceA] nqa entry admin test
[DeviceA-nqa-admin-test] type dhcp
[DeviceA-nqa-admin-test-dhcp] operation interface vlan-interface 2
# Enable the saving of history records.
[DeviceA-nqa-admin-test-dhcp] history-record enable
[DeviceA-nqa-admin-test-dhcp] quit
# Start DHCP tests.
[DeviceA] nqa schedule admin test start-time now lifetime forever
# Stop DHCP tests after a period of time.
[DeviceA] undo nqa schedule admin test
# Display the result of the last DHCP test.
[DeviceA] display nqa result admin test
NQA entry (admin admin, tag test) test results:
Send operation times: 1 Receive response times: 1
Min/Max/Average round trip time: 624/624/624
Square-Sum of round trip time: 389376
35
Page 46

Last succeeded probe time: 2007-11-22 09:56:03.2
Extended results:
Packet loss in test: 0%
Failures due to timeout: 0
Failures due to disconnect: 0
Failures due to no connection: 0
Failures due to sequence error: 0
Failures due to internal error: 0
Failures due to other errors: 0
Packet(s) arrived late: 0
# Display the history of DHCP tests.
[DeviceA] display nqa history admin test
NQA entry (admin admin, tag test) history record(s):
Index Response Status Time
1 624 Succeeded 2007-11-22 09:56:03.2
Configuring DNS test example
Network requirements
As shown in Figure 9, configure NQA DNS tests to test whether Device A can translate the domain name
host.com into an IP address through the DNS server and test the time required for resolution.
Figure 9 Network diagram for DNS tests
Configuration procedure
NOTE:
Before you make the configuration, make sure the devices can reach each other.
# Create a DNS test group.
<DeviceA> system-view
[DeviceA] nqa entry admin test
[DeviceA-nqa-admin-test] type dns
# Specify the IP address of the DNS server 10.2.2.2 as the destination address for DNS tests, and specify
the domain name that needs to be translated as host.com.
[DeviceA-nqa-admin-test-dns] destination ip 10.2.2.2
[DeviceA-nqa-admin-test-dns] resolve-target host.com
# Enable the saving of history records.
[DeviceA-nqa-admin-test-dns] history-record enable
[DeviceA-nqa-admin-test-dns] quit
# Start DNS tests.
[DeviceA] nqa schedule admin test start-time now lifetime forever
36
Page 47

# Stop the DNS tests after a period of time.
[DeviceA] undo nqa schedule admin test
# Display the results of the last DNS test.
[DeviceA] display nqa result admin test
NQA entry (admin admin, tag test) test results:
Destination IP address: 10.2.2.2
Send operation times: 1 Receive response times: 1
Min/Max/Average round trip time: 62/62/62
Square-Sum of round trip time: 3844
Last succeeded probe time: 2008-11-10 10:49:37.3
Extended results:
Packet loss in test: 0%
Failures due to timeout: 0
Failures due to disconnect: 0
Failures due to no connection: 0
Failures due to sequence error: 0
Failures due to internal error: 0
Failures due to other errors: 0
Packet(s) arrived late: 0
# Display the history of DNS tests.
[DeviceA] display nqa history admin test
NQA entry (admin admin, tag test) history record(s):
Index Response Status Time
1 62 Succeeded 2008-11-10 10:49:37.3
Configuring FTP test example
Network requirements
As shown in Figure 10, configure NQA FTP tests to test the connection with a specified FTP server and the
time required for Device A to upload a file to the FTP server. The login username is admin, the login
password is systemtest, and the file to be transferred to the FTP server is config.txt.
Figure 10 Network diagram for FTP tests
Configuration procedure
NOTE:
Before you make the configuration, make sure the devices can reach each other.
# Create an FTP test group.
<DeviceA> system-view
[DeviceA] nqa entry admin test
[DeviceA-nqa-admin-test] type ftp
37
Page 48

# Specify the IP address of the FTP server 10.2.2.2 as the destination IP address for FTP tests.
[DeviceA-nqa-admin-test-ftp] destination ip 10.2.2.2
# Specify 10.1.1.1 as the source IP address for probe packets.
[DeviceA-nqa-admin-test-ftp] source ip 10.1.1.1
# Set the FTP username to admin, and password to systemtest.
[DeviceA-nqa-admin-test-ftp] username admin
[DeviceA-nqa-admin-test-ftp] password systemtest
# Configure the device to upload file config.txt to the FTP server for each probe operation.
[DeviceA-nqa-admin-test-ftp] operation put
[DeviceA-nqa-admin-test-ftp] filename config.txt
# Enable the saving of history records.
[DeviceA-nqa-admin-test-ftp] history-record enable
[DeviceA-nqa-admin-test-ftp] quit
# Start FTP tests.
[DeviceA] nqa schedule admin test start-time now lifetime forever
# Stop the FTP tests after a period of time.
[DeviceA] undo nqa schedule admin test
# Display the results of the last FTP test.
[DeviceA] display nqa result admin test
NQA entry (admin admin, tag test) test results:
Destination IP address: 10.2.2.2
Send operation times: 1 Receive response times: 1
Min/Max/Average round trip time: 173/173/173
Square-Sum of round trip time: 29929
Last succeeded probe time: 2007-11-22 10:07:28.6
Extended results:
Packet loss in test: 0%
Failures due to timeout: 0
Failures due to disconnect: 0
Failures due to no connection: 0
Failures due to sequence error: 0
Failures due to internal error: 0
Failures due to other errors: 0
Packet(s) arrived late: 0
# Display the history of FTP tests.
[DeviceA] display nqa history admin test
NQA entry (admin admin, tag test) history record(s):
Index Response Status Time
1 173 Succeeded 2007-11-22 10:07:28.6
Configuring HTTP test example
Network requirements
As shown in Figure 11, configure NQA HTTP tests to test the connection with a specified HTTP server and
the time required to obtain data from the HTTP server.
38
Page 49

Figure 11 Network diagram for the HTTP tests
Configuration procedure
NOTE:
Before you make the configuration, make sure the devices can reach each other.
# Create an HTTP test group.
<DeviceA> system-view
[DeviceA] nqa entry admin test
[DeviceA-nqa-admin-test] type http
# Specify the IP address of the HTTP server 10.2.2.2 as the destination IP address for HTTP tests.
[DeviceA-nqa-admin-test-http] destination ip 10.2.2.2
# Configure the device to get data from the HTTP server for each HTTP probe operation. (get is the
default HTTP operation type, and this step can be omitted.)
[DeviceA-nqa-admin-test-http] operation get
# Configure HTTP tests to visit website /index.htm.
[DeviceA-nqa-admin-test-http] url /index.htm
# configure the HTTP version 1.0 to be used in HTTP tests. (Version 1.0 is the default version, and this step
can be omitted.)
[DeviceA-nqa-admin-test-http] http-version v1.0
# Enable the saving of history records.
[DeviceA-nqa-admin-test-http] history-record enable
[DeviceA-nqa-admin-test-http] quit
# Start HTTP tests.
[DeviceA] nqa schedule admin test start-time now lifetime forever
# Stop HTTP tests after a period of time.
[DeviceA] undo nqa schedule admin test
# Display results of the last HTTP test.
[DeviceA] display nqa result admin test
NQA entry (admin admin, tag test) test results:
Destination IP address: 10.2.2.2
Send operation times: 1 Receive response times: 1
Min/Max/Average round trip time: 64/64/64
Square-Sum of round trip time: 4096
Last succeeded probe time: 2007-11-22 10:12:47.9
Extended results:
Packet loss in test: 0%
Failures due to timeout: 0
Failures due to disconnect: 0
39
Page 50

Failures due to no connection: 0
Failures due to sequence error: 0
Failures due to internal error: 0
Failures due to other errors:
Packet(s) arrived late: 0
# Display the history of HTTP tests.
[DeviceA] display nqa history admin test
NQA entry (admin admin, tag test) history record(s):
Index Response Status Time
1 64 Succeeded 2007-11-22 10:12:47.9
Configuring UDP jitter test example
Network requirements
As shown in Figure 12, configure NQA UDP jitter tests to test the delay jitter of packet transmission
between Device A and Device B.
Figure 12 Network diagram for UDP jitter tests
Configuration procedure
NOTE:
Before you make the configuration, make sure the devices can reach each other.
1. Configure Device B
# Enable the NQA server and configure a listening service to listen to IP address 10.2.2.2 and UDP port
9000.
<DeviceB> system-view
[DeviceB] nqa server enable
[DeviceB] nqa server udp-echo 10.2.2.2 9000
2. Configure Device A
# Create a UDP jitter test group.
<DeviceA> system-view
[DeviceA] nqa entry admin test
[DeviceA-nqa-admin-test] type udp-jitter
# Configure UDP jitter packets to use 10.2.2.2 as the destination IP address and port 9000 as the
destination port.
[DeviceA-nqa-admin-test-udp-jitter] destination ip 10.2.2.2
[DeviceA-nqa-admin-test-udp-jitter] destination port 9000
# Configure the device to perform UDP jitter tests at an interval of 1000 milliseconds.
[DeviceA-nqa-admin-test-udp-jitter] frequency 1000
[DeviceA-nqa-admin-test-udp-jitter] quit
40
Page 51

# Start UDP jitter tests.
[DeviceA] nqa schedule admin test start-time now lifetime forever
# Stop UDP jitter tests after a period of time.
[DeviceA] undo nqa schedule admin test
# Display the result of the last UDP jitter test.
[DeviceA] display nqa result admin test
NQA entry (admin admin, tag test) test results:
Destination IP address: 10.2.2.2
Send operation times: 10 Receive response times: 10
Min/Max/Average round trip time: 15/32/17
Square-Sum of round trip time: 3235
Last succeeded probe time: 2008-05-29 13:56:17.6
Extended results:
Packet loss in test: 0%
Failures due to timeout: 0
Failures due to disconnect: 0
Failures due to no connection: 0
Failures due to sequence error: 0
Failures due to internal error: 0
Failures due to other errors: 0
Packet(s) arrived late: 0
UDP-jitter results:
RTT number: 10
Min positive SD: 4 Min positive DS: 1
Max positive SD: 21 Max positive DS: 28
Positive SD number: 5 Positive DS number: 4
Positive SD sum: 52 Positive DS sum: 38
Positive SD average: 10 Positive DS average: 10
Positive SD square sum: 754 Positive DS square sum: 460
Min negative SD: 1 Min negative DS: 6
Max negative SD: 13 Max negative DS: 22
Negative SD number: 4 Negative DS number: 5
Negative SD sum: 38 Negative DS sum: 52
Negative SD average: 10 Negative DS average: 10
Negative SD square sum: 460 Negative DS square sum: 754
One way results:
Max SD delay: 15 Max DS delay: 16
Min SD delay: 7 Min DS delay: 7
Number of SD delay: 10 Number of DS delay: 10
Sum of SD delay: 78 Sum of DS delay: 85
Square sum of SD delay: 666 Square sum of DS delay: 787
SD lost packet(s): 0 DS lost packet(s): 0
Lost packet(s) for unknown reason: 0
# Display the statistics of UDP jitter tests.
[DeviceA] display nqa statistics admin test
NQA entry (admin admin, tag test) test statistics:
NO. : 1
41
Page 52

Destination IP address: 10.2.2.2
Start time: 2008-05-29 13:56:14.0
Life time: 47 seconds
Send operation times: 410 Receive response times: 410
Min/Max/Average round trip time: 1/93/19
Square-Sum of round trip time: 206176
Extended results:
Packet loss in test: 0%
Failures due to timeout: 0
Failures due to disconnect: 0
Failures due to no connection: 0
Failures due to sequence error: 0
Failures due to internal error: 0
Failures due to other errors: 0
Packet(s) arrived late: 0
UDP-jitter results:
RTT number: 410
Min positive SD: 3 Min positive DS: 1
Max positive SD: 30 Max positive DS: 79
Positive SD number: 186 Positive DS number: 158
Positive SD sum: 2602 Positive DS sum: 1928
Positive SD average: 13 Positive DS average: 12
Positive SD square sum: 45304 Positive DS square sum: 31682
Min negative SD: 1 Min negative DS: 1
Max negative SD: 30 Max negative DS: 78
Negative SD number: 181 Negative DS number: 209
Negative SD sum: 181 Negative DS sum: 209
Negative SD average: 13 Negative DS average: 14
Negative SD square sum: 46994 Negative DS square sum: 3030
One way results:
Max SD delay: 46 Max DS delay: 46
Min SD delay: 7 Min DS delay: 7
Number of SD delay: 410 Number of DS delay: 410
Sum of SD delay: 3705 Sum of DS delay: 3891
Square sum of SD delay: 45987 Square sum of DS delay: 49393
SD lost packet(s): 0 DS lost packet(s): 0
Lost packet(s) for unknown reason: 0
NOTE:
The display nqa history command does not show the results of UDP jitter tests. To know the result of a
UDP jitter test, use the display nqa result command to view the probe results of the latest NQA test, or
use the display nqa statistics command to view the statistics of NQA tests.
42
Page 53

Configuring SNMP test example
Network requirements
As shown in Figure 13, configure NQA SNMP tests to test the time it takes for Device A to send an SNMP
query packet to the SNMP agent and receive a response packet.
Figure 13 Network diagram for SNMP tests
Configuration procedure
NOTE:
Before you make the configuration, make sure the devices can reach each other.
1. Configurations on SNMP agent (Device B)
# Enable the SNMP agent service and set the SNMP version to all, the read community to public, and the
write community to private.
<DeviceB> system-view
[DeviceB] snmp-agent sys-info version all
[DeviceB] snmp-agent community read public
[DeviceB] snmp-agent community write private
2. Configurations on Device A
# Create an SNMP test group and configure SNMP packets to use 10.2.2.2 as their destination IP
address.
<DeviceA> system-view
[DeviceA] nqa entry admin test
[DeviceA-nqa-admin-test] type snmp
[DeviceA-nqa-admin-test-snmp] destination ip 10.2.2.2
# Enable the saving of history records.
[DeviceA-nqa-admin-test-snmp] history-record enable
[DeviceA-nqa-admin-test-snmp] quit
# Start SNMP tests.
[DeviceA] nqa schedule admin test start-time now lifetime forever
# Stop the SNMP tests after a period of time.
[DeviceA] undo nqa schedule admin test
# Display the results of the last SNMP test.
[DeviceA] display nqa result admin test
NQA entry (admin admin, tag test) test results:
Destination IP address: 10.2.2.2
Send operation times: 1 Receive response times: 1
Min/Max/Average round trip time: 50/50/50
Square-Sum of round trip time: 2500
43
Page 54

Last succeeded probe time: 2007-11-22 10:24:41.1
Extended results:
Packet loss in test: 0%
Failures due to timeout: 0
Failures due to disconnect: 0
Failures due to no connection: 0
Failures due to sequence error: 0
Failures due to internal error: 0
Failures due to other errors: 0
Packet(s) arrived late: 0
# Display the history of SNMP tests.
[DeviceA] display nqa history admin test
NQA entry (admin admin, tag test) history record(s):
Index Response Status Time
1 50 Timeout 2007-11-22 10:24:41.1
Configuring TCP test example
Network requirements
As shown in Figure 14, configure NQA TCP tests to test the time for establishing a TCP connection
between Device A and Device B.
Figure 14 Network diagram for TCP tests
Configuration procedure
NOTE:
Before you make the configuration, make sure the devices can reach each other.
1. Configure Device B
# Enable the NQA server and configure a listening service to listen to IP address 10.2.2.2 and TCP port
9000.
<DeviceB> system-view
[DeviceB] nqa server enable
[DeviceB] nqa server tcp-connect 10.2.2.2 9000
2. Configure Device A
# Create a TCP test group.
<DeviceA> system-view
[DeviceA] nqa entry admin test
[DeviceA-nqa-admin-test] type tcp
# Configure TCP probe packets to use 10.2.2.2 as the destination IP address and port 9000 as the
destination port.
44
Page 55

[DeviceA-nqa-admin-test-tcp] destination ip 10.2.2.2
[DeviceA-nqa-admin-test-tcp] destination port 9000
# Enable the saving of history records.
[DeviceA-nqa-admin-test-tcp] history-record enable
[DeviceA-nqa-admin-test-tcp] quit
# Start TCP tests.
[DeviceA] nqa schedule admin test start-time now lifetime forever
# Stop the TCP tests after a period of time.
[DeviceA] undo nqa schedule admin test
# Display the results of the last TCP test.
[DeviceA] display nqa result admin test
NQA entry (admin admin, tag test) test results:
Destination IP address: 10.2.2.2
Send operation times: 1 Receive response times: 1
Min/Max/Average round trip time: 13/13/13
Square-Sum of round trip time: 169
Last succeeded probe time: 2007-11-22 10:27:25.1
Extended results:
Packet loss in test: 0%
Failures due to timeout: 0
Failures due to disconnect: 0
Failures due to no connection: 0
Failures due to sequence error: 0
Failures due to internal error: 0
Failures due to other errors: 0
Packet(s) arrived late: 0
# Display the history of TCP tests.
[DeviceA] display nqa history admin test
NQA entry (admin admin, tag test) history record(s):
Index Response Status Time
1 13 Succeeded 2007-11-22 10:27:25.1
Configuring UDP echo test example
Network requirements
As shown in Figure 15, configure NQA UDP echo tests to test the round-trip time between Device A and
Device B. The destination port number is 8000.
Figure 15 Network diagram for the UDP echo tests
45
Page 56

Configuration procedure
NOTE:
Before you make the configuration, make sure the devices can reach each other.
1. Configure Device B
# Enable the NQA server and configure a listening service to listen to IP address 10.2.2.2 and UDP port
8000.
<DeviceB> system-view
[DeviceB] nqa server enable
[DeviceB] nqa server udp-echo 10.2.2.2 8000
2. Configure Device A
# Create a UDP echo test group.
<DeviceA> system-view
[DeviceA] nqa entry admin test
[DeviceA-nqa-admin-test] type udp-echo
# Configure UDP packets to use 10.2.2.2 as the destination IP address and port 8000 as the destination
port.
[DeviceA-nqa-admin-test-udp-echo] destination ip 10.2.2.2
[DeviceA-nqa-admin-test-udp-echo] destination port 8000
# Enable the saving of history records.
[DeviceA-nqa-admin-test-udp-echo] history-record enable
[DeviceA-nqa-admin-test-udp-echo] quit
# Start UDP echo tests.
[DeviceA] nqa schedule admin test start-time now lifetime forever
# Stop UDP echo tests after a period of time.
[DeviceA] undo nqa schedule admin test
# Display the results of the last UDP echo test.
[DeviceA] display nqa result admin test
NQA entry (admin admin, tag test) test results:
Destination IP address: 10.2.2.2
Send operation times: 1 Receive response times: 1
Min/Max/Average round trip time: 25/25/25
Square-Sum of round trip time: 625
Last succeeded probe time: 2007-11-22 10:36:17.9
Extended results:
Packet loss in test: 0%
Failures due to timeout: 0
Failures due to disconnect: 0
Failures due to no connection: 0
Failures due to sequence error: 0
Failures due to internal error: 0
Failures due to other errors: 0
Packet(s) arrived late: 0
46
Page 57

# Display the history of UDP echo tests.
[DeviceA] display nqa history admin test
NQA entry (admin admin, tag test) history record(s):
Index Response Status Time
1 25 Succeeded 2007-11-22 10:36:17.9
Configuring voice test example
Network requirements
As shown in Figure 16, configure NQA voice tests to test the delay jitter of voice packet transmission and
voice quality between Device A and Device B.
Figure 16 Network diagram for voice tests
Configuration procedure
NOTE:
Before you make the configuration, make sure the devices can reach each other.
1. Configure Device B
# Enable the NQA server and configure a listening service to listen to IP address 10.2.2.2 and UDP port
9000.
<DeviceB> system-view
[DeviceB] nqa server enable
2. [DeviceB] nqa server udp-echo 10.2.2.2 9000
3. Configure Device A
# Create a voice test group.
<DeviceA> system-view
[DeviceA] nqa entry admin test
[DeviceA-nqa-admin-test] type voice
# Configure voice probe packets to use 10.2.2.2 as the destination IP address and port 9000 as the
destination port.
[DeviceA-nqa-admin-test-voice] destination ip 10.2.2.2
[DeviceA-nqa-admin-test-voice] destination port 9000
[DeviceA-nqa-admin-test-voice] quit
# Start voice tests.
[DeviceA] nqa schedule admin test start-time now lifetime forever
# Stop the voice tests after a period of time.
[DeviceA] undo nqa schedule admin test
# Display the result of the last voice test.
[DeviceA] display nqa result admin test
47
Page 58

NQA entry (admin admin, tag test) test results:
Destination IP address: 10.2.2.2
Send operation times: 1000 Receive response times: 1000
Min/Max/Average round trip time: 31/1328/33
Square-Sum of round trip time: 2844813
Last succeeded probe time: 2008-06-13 09:49:31.1
Extended results:
Packet loss in test: 0%
Failures due to timeout: 0
Failures due to disconnect: 0
Failures due to no connection: 0
Failures due to sequence error: 0
Failures due to internal error: 0
Failures due to other errors: 0
Packet(s) arrived late: 0
Voice results:
RTT number: 1000
Min positive SD: 1 Min positive DS: 1
Max positive SD: 204 Max positive DS: 1297
Positive SD number: 257 Positive DS number: 259
Positive SD sum: 759 Positive DS sum: 1797
Positive SD average: 2 Positive DS average: 6
Positive SD square sum: 54127 Positive DS square sum: 1691967
Min negative SD: 1 Min negative DS: 1
Max negative SD: 203 Max negative DS: 1297
Negative SD number: 255 Negative DS number: 259
Negative SD sum: 759 Negative DS sum: 1796
Negative SD average: 2 Negative DS average: 6
Negative SD square sum: 53655 Negative DS square sum: 1691776
One way results:
Max SD delay: 343 Max DS delay: 985
Min SD delay: 343 Min DS delay: 985
Number of SD delay: 1 Number of DS delay: 1
Sum of SD delay: 343 Sum of DS delay: 985
Square sum of SD delay: 117649 Square sum of DS delay: 970225
SD lost packet(s): 0 DS lost packet(s): 0
Lost packet(s) for unknown reason: 0
Voice scores:
MOS value: 4.38 ICPIF value: 0
# Display the statistics of voice tests.
[DeviceA] display nqa statistics admin test
NQA entry (admin admin, tag test) test statistics:
NO. : 1
Destination IP address: 10.2.2.2
Start time: 2008-06-13 09:45:37.8
Life time: 331 seconds
Send operation times: 4000 Receive response times: 4000
Min/Max/Average round trip time: 15/1328/32
48
Page 59

Square-Sum of round trip time: 7160528
Extended results:
Packet loss in test: 0%
Failures due to timeout: 0
Failures due to disconnect: 0
Failures due to no connection: 0
Failures due to sequence error: 0
Failures due to internal error: 0
Failures due to other errors: 0
Packet(s) arrived late: 0
Voice results:
RTT number: 4000
Min positive SD: 1 Min positive DS: 1
Max positive SD: 360 Max positive DS: 1297
Positive SD number: 1030 Positive DS number: 1024
Positive SD sum: 4363 Positive DS sum: 5423
Positive SD average: 4 Positive DS average: 5
Positive SD square sum: 497725 Positive DS square sum: 2254957
Min negative SD: 1 Min negative DS: 1
Max negative SD: 360 Max negative DS: 1297
Negative SD number: 1028 Negative DS number: 1022
Negative SD sum: 1028 Negative DS sum: 1022
Negative SD average: 4 Negative DS average: 5
Negative SD square sum: 495901 Negative DS square sum: 5419
One way results:
Max SD delay: 359 Max DS delay: 985
Min SD delay: 0 Min DS delay: 0
Number of SD delay: 4 Number of DS delay: 4
Sum of SD delay: 1390 Sum of DS delay: 1079
Square sum of SD delay: 483202 Square sum of DS delay: 973651
SD lost packet(s): 0 DS lost packet(s): 0
Lost packet(s) for unknown reason: 0
Voice scores:
Max MOS value: 4.38 Min MOS value: 4.38
Max ICPIF value: 0 Min ICPIF value: 0
NOTE:
The display nqa history command cannot show you the results of voice tests. To know the result of a
voice test, use the display nqa result command to view the probe results of the latest NQA test, or use
the display nqa statistics command to view the statistics of NQA tests.
49
Page 60

Configuring DLSw test example
Network requirements
As shown in Figure 17, configure NQA DLSw tests to check the response time of the DLSw device.
Figure 17 Network diagram for the DLSw tests
Configuration procedure
NOTE:
Before you make the configuration, make sure the devices can reach each other.
# Create a DLSw test group and configure DLSw probe packets to use 10.2.2.2 as the destination IP
address.
<DeviceA> system-view
[DeviceA] nqa entry admin test
[DeviceA-nqa-admin-test] type dlsw
[DeviceA-nqa-admin-test-dlsw] destination ip 10.2.2.2
# Enable the saving of history records.
[DeviceA-nqa-admin-test-dlsw] history-record enable
[DeviceA-nqa-admin-test-dlsw] quit
# Start DLSw tests.
[DeviceA] nqa schedule admin test start-time now lifetime forever
# Stop the DLSw tests after a period of time.
[DeviceA] undo nqa schedule admin test
# Display the result of the last DLSw test.
[DeviceA] display nqa result admin test
NQA entry (admin admin, tag test) test results:
Destination IP address: 10.2.2.2
Send operation times: 1 Receive response times: 1
Min/Max/Average round trip time: 19/19/19
Square-Sum of round trip time: 361
Last succeeded probe time: 2007-11-22 10:40:27.7
Extended results:
Packet loss in test: 0%
Failures due to timeout: 0
Failures due to disconnect: 0
Failures due to no connection: 0
Failures due to sequence error: 0
Failures due to internal error: 0
Failures due to other errors: 0
50
Page 61

Packet(s) arrived late: 0
# Display the history of DLSw tests.
[DeviceA] display nqa history admin test
NQA entry (admin admin, tag test) history record(s):
Index Response Status Time
1 19 Succeeded 2007-11-22 10:40:27.7
Configuring NQA collaboration example
Network requirements
As shown in Figure 18, configure a static route to Device C on Device A, with Device B as the next hop.
Associate the static route, track entry, and NQA test group to verify whether static route is active in real
time.
Figure 18 Network diagram for NQA collaboration configuration example
Vlan-int3
10.2.1.1/24
Vlan-int3
10.2.1.2/24
Device A
Configuration procedure
1. Assign each interface an IP address. (Omitted)
2. On Device A, configure a unicast static route and associate the static route with a track entry.
# Configure a static route, whose destination address is 10.2.1.1, and associate the static route with track
entry 1.
<DeviceA> system-view
[DeviceA] ip route-static 10.1.1.2 24 10.2.1.1 track 1
3. On Device A, create an NQA test group.
# Create an NQA test group with the administrator name being admin and operation tag being test.
[DeviceA] nqa entry admin test
Device B
Vlan-int2
10.1.1.1/24
Vlan-int2
10.1.1.2/24
Device C
# Configure the test type of the NQA test group as ICMP echo.
[DeviceA-nqa-admin-test] type icmp-echo
# Configure ICMP echo requests to use 10.2.1.1 as their destination IP address.
[DeviceA-nqa-admin-test-icmp-echo] destination ip 10.2.1.1
# Configure the device to perform tests at an interval of 100 milliseconds.
[DeviceA-nqa-admin-test-icmp-echo] frequency 100
# Create reaction entry 1. If the number of consecutive probe failures reaches 5, collaboration with other
modules is triggered.
[DeviceA-nqa-admin-test-icmp-echo] reaction 1 checked-element probe-fail threshold-type
consecutive 5 action-type trigger-only
51
Page 62

[DeviceA-nqa-admin-test-icmp-echo] quit
# Configure the test start time and test duration for the test group.
[DeviceA] nqa schedule admin test start-time now lifetime forever
4. On Device A, create the track entry.
# Create track entry 1 to associate it with Reaction entry 1 of the NQA test group (admin-test).
[DeviceA] track 1 nqa entry admin test reaction 1
5. Verify the configuration.
# On Device A, display information about all track entries.
[DeviceA] display track all
Track ID: 1
Status: Positive
Notification delay: Positive 0, Negative 0 (in seconds)
Reference object:
NQA entry: admin test
Reaction: 1
# Display brief information about active routes in the routing table on Device A.
[DeviceA] display ip routing-table
[DeviceA] display ip routing-table
Routing Tables: Public
Destinations : 5 Routes : 5
Destination/Mask Proto Pre Cost NextHop Interface
10.1.1.0/24 Static 60 0 10.2.1.1 Vlan3
10.2.1.0/24 Direct 0 0 10.2.1.2 Vlan3
10.2.1.2/32 Direct 0 0 127.0.0.1 InLoop0
127.0.0.0/8 Direct 0 0 127.0.0.1 InLoop0
127.0.0.1/32 Direct 0 0 127.0.0.1 InLoop0
The output shows that the static route with the next hop 10.2.1.1 is active, and the status of the track entry
is positive. The static route configuration works.
# Remove the IP address of VLAN-interface 3 on Device B.
<DeviceB> system-view
[DeviceB] interface vlan-interface 3
[DeviceB-Vlan-interface3] undo ip address
# On Device A, display information about all track entries.
[DeviceA] display track all
Track ID: 1
Status: Negative
Notification delay: Positive 0, Negative 0 (in seconds)
Reference object:
NQA entry: admin test
Reaction: 1
# Display brief information about active routes in the routing table on Device A.
[DeviceA] display ip routing-table
Routing Tables: Public
Destinations : 4 Routes : 4
52
Page 63

Destination/Mask Proto Pre Cost NextHop Interface
10.2.1.0/24 Direct 0 0 10.2.1.2 Vlan3
10.2.1.2/32 Direct 0 0 127.0.0.1 InLoop0
127.0.0.0/8 Direct 0 0 127.0.0.1 InLoop0
127.0.0.1/32 Direct 0 0 127.0.0.1 InLoop0
The output shows that the next hop 10.2.1.1 of the static route is not reachable, and the status of the track
entry is negative. The static route does not work.
53
Page 64

Configuring NTP
Defined in RFC 1305, the NTP synchronizes timekeeping among distributed time servers and clients. NTP
runs over the UDP, using UDP port 123.
The purpose of using NTP is to keep consistent timekeeping among all clock-dependent devices within a
network so that the devices can provide diverse applications based on the consistent time.
For a local system that runs NTP, its time can be synchronized by other reference sources and can be
used as a reference source to synchronize other clocks.
NTP applications
An administrator is unable to keep time synchronized among all devices within a network by changing
the system clock on each station, because this is a huge amount of workload and cannot guarantee the
clock precision. NTP, however, allows quick clock synchronization within the entire network and it ensures
a high clock precision.
Use NTP when all devices within the network must be consistent in timekeeping, for example:
• In analysis of the log information and debugging information collected from different devices in
network management, time must be used as reference basis.
• All devices must use the same reference clock in a charging system.
• To implement certain functions, such as scheduled restart of all devices within the network, all
devices must be consistent in timekeeping.
• When multiple systems process a complex event in cooperation, these systems must use that same
reference clock to ensure the correct execution sequence.
• For incremental backup between a backup server and clients, timekeeping must be synchronized
between the backup server and all clients.
NOTE:
• Clock stratum determines the accuracy of a server, ranging from 1 to 16. The stratum of a reference
clock ranges from 1 to 15. The clock accuracy decreases as the stratum number increases. A stratum
16 clock is in the unsynchronized state and cannot serve as a reference clock.
• The local clock of an switch cannot operate as a reference clock. It can only serve as an NTP server
after being synchronized.
NTP advantages
• NTP uses a stratum to describe the clock precision, and is able to synchronize time among all
devices within the network.
• NTP supports access control and MD5 authentication.
• NTP can unicast, multicast, or broadcast protocol messages.
54
Page 65

How NTP works
Figure 19 shows the basic workflow of NTP. Device A and Device B are connected over a network. They
have their own independent system clocks, which must be automatically synchronized through NTP. For an
easy understanding, assume the following conditions:
• Prior to system clock synchronization between Device A and Device B, the clock of Device A is set to
10:00:00 am while that of Device B is set to 11:00:00 am.
• Device B is used as the NTP time server, and Device A synchronizes its clock to that of Device B.
• It takes 1 second for an NTP message to travel from one device to the other.
Figure 19 Basic work flow of NTP
System clock synchronization includes the following process:
• Device A sends Device B an NTP message, which is time stamped when it leaves Device A. The time
stamp is 10:00:00 am (T1).
• When this NTP message arrives at Device B, it is time stamped by Device B. The timestamp is
11:00:01 am (T2).
• When the NTP message leaves Device B, Device B timestamps it. The timestamp is 11:00:02 am (T3).
• When Device A receives the NTP message, the local time of Device A is 10:00:03 am (T4).
Up to now, Device A has sufficient information to calculate the following important parameters:
• The roundtrip delay of NTP message: Delay = (T4–T1) – (T3-T2) = 2 seconds.
• Time difference between Device A and Device B: Offset = ((T2-T1) + (T3-T4))/2 = 1 hour.
Based on these parameters, Device A can synchronize its own clock to the clock of Device B.
This is only a rough description of the work mechanism of NTP. For more information, see RFC 1305.
55
Page 66

NTP message format
NTP uses two types of messages, clock synchronization message and NTP control message. An NTP
control message is used in environments where network management is needed. Because it is not a must
for clock synchronization, it is not described in this document.
NOTE:
All NTP messages mentioned in this document refer to NTP clock synchronization messages.
A clock synchronization message is encapsulated in a UDP message, in the format shown in Figure 20.
Figure 20 Clock synchronization message format
The following main fields are described below:
• LI (Leap Indicator)—2-bit leap indicator. When set to 11, it warns of an alarm condition (clock
unsynchronized); when set to any other value, it is not to be processed by NTP.
• VN (Version Number)—3-bit version number that indicates the version of NTP. The latest version is
version 3.
• Mode—3-bit code that indicates the work mode of NTP. This field can be set to these values: 0 –
reserved; 1 – symmetric active; 2 – symmetric passive; 3 – client; 4 – server; 5 – broadcast or
multicast; 6 – NTP control message; 7 – reserved for private use.
• Stratum—8-bit integer that indicates the stratum level of the local clock, with the value ranging from
1 to 16. The clock precision decreases from stratum 1 through stratum 16. A stratum 1 clock has the
highest precision, and a stratum 16 clock is not synchronized and cannot be used as a reference
clock.
• Poll—8-bit signed integer that indicates the poll interval, namely the maximum interval between
successive messages.
• Precision—8-bit signed integer that indicates the precision of the local clock.
56
Page 67

• Root Delay—Roundtrip delay to the primary reference source.
• Root Dispersion—Maximum error of the local clock relative to the primary reference source.
• Reference Identifier—Identifier of the particular reference source.
• Reference Timestamp—Local time at which the local clock was last set or corrected.
• Originate Timestamp—Local time at which the request departed from the client for the service host.
• Receive Timestamp—Local time at which the request arrived at the service host.
• Transmit Timestamp—Local time at which the reply departed from the service host for the client.
• Authenticator—Authentication information.
NTP operation modes
Devices that run NTP can implement clock synchronization in one of the following modes:
• Client/server mode
• Symmetric peers mode
• Broadcast mode
• Multicast mode
You can select operation modes of NTP as needed. If the IP address of the NTP server or peer is unknown
and many devices in the network must be synchronized, adopt the broadcast or multicast mode; while in
the client/server and symmetric peer modes, a device is synchronized from the specified server or peer,
and clock reliability is enhanced.
Client/server mode
Figure 21 Client/server mode
Performs clock filtering and
selection, and synchronizes its
local clock to that of the
optimal reference source
When working in client/server mode, a client sends a clock synchronization message to servers, with the
mode field in the message set to 3 (client mode). Upon receiving the message, the servers automatically
work in server mode and send a reply, with the Mode field in the messages set to 4 (server mode). Upon
receiving the replies from the servers, the client performs clock filtering and selection, and synchronizes its
local clock to that of the optimal reference source.
In client/server mode, a client can be synchronized to a server, but not vice versa.
Network
Clock
synchronization
message
Reply ( Mode 4)
(Mode3)
ServerClient
Automatically works in
client/server mode and
sends a reply
57
Page 68

Symmetric peers mode
Figure 22 Symmetric peers mode
Performs clock filtering and
selection, and synchronizes its
local clock to that of the
optimal reference source
In symmetric peers mode, devices that work in symmetric active mode and symmetric passive mode
exchange NTP messages with the Mode field 3 (client mode) and 4 (server mode). Then the device that
works in symmetric active mode periodically sends clock synchronization messages, with the Mode field
in the messages set to 1 (symmetric active); the device that receives the messages automatically enters
symmetric passive mode and sends a reply, with the Mode field in the message set to 2 (symmetric
passive). By exchanging messages, the symmetric peer mode is established between the two devices.
Then, the two devices can synchronize, or be synchronized by each other. If the clocks of both devices
have been synchronized, the device whose local clock has a lower stratum level synchronizes the clock of
the other device.
Network
Clock
synchronization
message
Reply ( Mode 4)
(Mode3)
ServerClient
Automatically works in
client/server mode and
sends a reply
Broadcast mode
Figure 23 Broadcast mode
In broadcast mode, a server periodically sends clock synchronization messages to broadcast address
255.255.255.255, with the Mode field in the messages set to 5 (broadcast mode). Clients listen to the
broadcast messages from servers. When a client receives the first broadcast message, the client and the
server start to exchange messages, with the Mode field set to 3 (client mode) and 4 (server mode) to
calculate the network delay between client and the server. Then, the client enters the broadcast client
mode and continues listening to broadcast messages, and synchronizes its local clock based on the
received broadcast messages.
58
Page 69

g
Multicast mode
Figure 24 Multicast mode
In multicast mode, a server periodically sends clock synchronization messages to the user-configured
multicast address, or, if no multicast address is configured, to the default NTP multicast address 224.0.1.1,
with the Mode field in the messages set to 5 (multicast mode). Clients listen to the multicast messages
from servers. When a client receives the first multicast message, the client and the server start to exchange
messages, with the Mode field set to 3 (client mode) and 4 (server mode) to calculate the network delay
between client and the server. Then, the client enters multicast client mode and continues listening to
multicast messages, and synchronizes its local clock based on the received multicast messages.
NOTE:
In symmetric peers mode, broadcast mode and multicast mode, the client (the symmetric active peer)
and the server (the symmetric passive peer) can only work in the specified NTP workin
exchange NTP messages with the Mode field being 3 (client mode) and the Mode field being 4 (server
mode). During this message exchange process, NTP clock synchronization can be implemented.
Multiple instances of NTP
The client/server mode and symmetric mode support multiple instances of NTP and support clock
synchronization within an MPLS VPN network. Network devices—CEs and PEs—at different physical
location can get their clocks synchronized through NTP, as long as they are in the same VPN. The
following functions are available:
• NTP client on a CE can be synchronized to the NTP server on another CE.
• NTP client on a CE can be synchronized to the NTP server on a PE.
• NTP client on a PE can be synchronized to the NTP server on a CE through a designated VPN
instance.
• NTP client on a PE can be synchronized to the NTP server on another PE through a designated VPN
instance.
• NTP server on a PE can synchronize the NTP clients on multiple CEs in different VPNs.
mode after they
59
Page 70

g
g
NOTE:
• A CE is a device that has an interface directly connecting to the SP. A CE is not “aware of” the
presence of the VPN.
• A PE is a device directly connecting to CEs. In an MPLS network, all events related to VPN processin
occur on the PE.
NTP configuration task list
Complete the following tasks to configure NTP:
Task Remarks
Configuring the operation modes of NTP Required
Configuring optional parameters of NTP Optional
Configuring access-control rights Optional
Configuring NTP authentication Optional
Configuring the operation modes of NTP
Devices can implement clock synchronization in one of the following modes:
• Client/server mode
• Symmetric mode
• Broadcast mode
• Multicast mode
For the client/server mode or symmetric mode, you must configure only clients or symmetric-active peers;
for the broadcast or multicast mode, you must configure both servers and clients.
NOTE:
A single device can have a maximum of 128 associations at the same time, including static
associations and dynamic associations.
• A static association refers to an association that a user has manually created by using an NTP
command.
• A dynamic association is a temporary association created by the system durin
association is removed if the system fails to receive messages from it over a specific long time.
In client/server mode, for example, when you execute a command to synchronize the time to a server,
the system creates a static association, and the server just responds passively upon the receipt of a
message, rather than creating an association (static or dynamic). In symmetric mode, static associations
are created at the symmetric-active peer side, and dynamic associations are created at the symmetricpassive peer side. In broadcast or multicast mode, static associations are
dynamic associations are created at the client side.
created at the server side, and
operation. A dynamic
Configuring NTP client/server mode
For devices working in client/server mode, make configurations on the clients, but not on the servers.
60
Page 71

To configure an NTP client:
To do…
1. Enter system view.
2. Specify an NTP server for the
Use the command… Remarks
system-view —
ntp-service unicast-server [ vpninstance vpn-instance-name ] { ip-
address | server-name }
device.
[ authentication-keyid keyid |
priority | source-interface
interface-type interface-number |
version number ] *
Required.
No NTP server is specified by
default.
NOTE:
• In the ntp-service unicast-server command,
ip-address
must be a unicast address, rather than a
broadcast address, a multicast address or the IP address of the local clock.
• When the source interface for NTP messages is specified by the source-interface argument, the
source IP address of the NTP messages is configured as the primary IP address of the specified
interface.
• A device can only act as a server to synchronize the clock of other devices after its clock has been
synchronized. If the clock of a server has a stratum level higher than or equal to that of a client’s
clock, the client will not synchronize its clock to the server’s.
• You can configure multiple servers by repeating the ntp-service unicast-server command. The clients
will select the optimal reference source.
Configuring the NTP symmetric peers mode
For devices working in the symmetric mode, specify a symmetric-passive peer on a symmetric-active peer.
To configure a symmetric-active device:
To do…
1. Enter system view.
2. Specify a symmetric-passive
Use the command… Remarks
system-view —
ntp-service unicast-peer [ vpninstance vpn-instance-name ] { ip-
address | peer-name }
peer for the device.
[ authentication-keyid keyid |
priority | source-interface
interface-type interface-number |
version number ] *
Required.
No symmetric-passive peer is
specified by default.
61
Page 72

NOTE:
• In symmetric mode, use any NTP configuration command in Configuring the operation modes of
o enable NTP; otherwise, a symmetric-passive peer will not process NTP messages from a
NTP t
symmetric-active peer.
• In the ntp-service unicast-peer command,
ip-address
broadcast address, a multicast address or the IP address of the local clock.
• When the source interface for NTP messages is specified by the source-interface argument, the
source IP address of the NTP messages is configured as the primary IP address of the specified
interface.
• Typically, at least one of the symmetric-active and symmetric-passive peers has been synchronized;
otherwise, the clock synchronization will not proceed.
• You can configure multiple symmetric-passive peers by repeating the ntp-service unicast-peer
command.
Configuring NTP broadcast mode
The broadcast server periodically sends NTP broadcast messages to the broadcast address
255.255.255.255. After receiving the messages, the device working in NTP broadcast client mode sends
a reply and synchronizes its local clock.
For devices working in broadcast mode, configure both the server and clients. Because an interface
needs to be specified on the broadcast server for sending NTP broadcast messages and an interface also
needs to be specified on each broadcast client for receiving broadcast messages, the NTP broadcast
mode can only be configured in the specific interface view.
Configuring a broadcast client
must be a unicast address, rather than a
To do… Use the command… Remarks
1. Enter system view.
2. Enter Layer 3 Ethernet
interface view or VLAN
interface view.
3. Configure the device to work
in NTP broadcast client mode.
Configuring the broadcast server
To do… Use the command… Remarks
1. Enter system view.
2. Enter Layer 3 Ethernet
interface view or VLAN
interface view.
3. Configure the device to work
in NTP broadcast server
mode.
system-view —
interface interface-type interface-
number
ntp-service broadcast-client Required.
system-view —
interface interface-type interface-
number
ntp-service broadcast-server
[ authentication-keyid keyid |
version number ] *
Required.
Enter the interface used to receive
NTP broadcast messages.
Enter the interface used to send
NTP broadcast messages.
Required.
62
Page 73

NOTE:
A broadcast server can only synchronize broadcast clients when its clock has been synchronized.
Configuring NTP multicast mode
The multicast server periodically sends NTP multicast messages to multicast clients, which send replies
after receiving the messages and synchronize their local clocks.
For devices working in multicast mode, configure both the server and clients. The NTP multicast mode
must be configured in the specific interface view.
Configuring a multicast client
To do… Use the command… Remarks
1. Enter system view.
2. Enter Layer 3 Ethernet
interface view or VLAN
interface view.
system-view —
interface interface-type interface-
number
Enter the interface used to receive
NTP multicast messages.
3. Configure the device to work
in NTP multicast client mode.
ntp-service multicast-client [ ip-
address ]
Required.
Configuring the multicast server
To do… Use the command… Remarks
1. Enter system view.
2. Enter Layer 3 Ethernet
interface view or VLAN
interface view.
3. Configure the device to work
in NTP multicast server mode.
system-view —
interface interface-type interface-
number
ntp-service multicast-server [ ip-
address ] [ authentication-keyid
keyid | ttl ttl-number | version
number ] *
Enter the interface used to send
NTP multicast message.
Required.
NOTE:
• A multicast server can only synchronize broadcast clients when its clock has been synchronized.
• You can configure up to 1024 multicast clients, among which 128 can take effect at the same time.
Configuring optional parameters of NTP
Specifying the source interface for NTP messages
If you specify the source interface for NTP messages, the device sets the source IP address of the NTP
messages as the primary IP address of the specified interface when sending the NTP messages.
When the device responds to an NTP request received, the source IP address of the NTP response is
always the IP address of the interface that received the NTP request.
63
Page 74

ge
To specify the source interface for NTP messages:
To do… Use the command… Remarks
1. Enter system view.
2. Specify the source interface
for NTP messages.
CAUTION:
system-view —
Required.
By default, no source interface is
ntp-service source-interface
interface-type interface-number
specified for NTP messages, and
the system uses the IP address of
the interface determined by the
matching route as the source IP
address of NTP messages.
• If you have specified the source interface for NTP messages in the ntp-service unicast-server or ntp-
service unicast-peer command, the interface specified in the ntp-service unicast-server or ntp-
service unicast-peer command serves as the source interface of NTP messages.
• If you have configured the ntp-service broadcast-server or ntp-service multicast-server command,
the source interface of the broadcast or multicast NTP messages is the interface configured with the
respective command.
• If the specified source interface for NTP messages is down, the source IP address for an NTP messa
that is sent out is the primary IP address of the outgoing interface of the NTP message.
Disabling an interface from receiving NTP messages
When NTP is enabled, NTP messages can be received from all interfaces by default, and you can
disable an interface from receiving NTP messages through the following configuration.
To do…
1. Enter system view.
2. Enter interface view.
3. Disable the interface from
Use the command… Remarks
system-view —
interface interface-type interface-
number
receiving NTP messages.
ntp-service in-interface disable
—
Required.
An interface is enabled to receive
NTP messages by default.
Configuring the maximum number of dynamic sessions allowed
To do… Use the command… Remarks
1. Enter system view.
2. Configure the maximum
number of dynamic sessions
allowed to be established
locally.
system-view —
ntp-service max-dynamic-sessions
number
Required.
100 by default.
64
Page 75

Configuring access-control rights
You can configure the NTP service access-control right to the local device. The following access control
rights are available:
• query—Control query permitted. Permits the peer devices to perform control query to the NTP
service on the local device but does not permit a peer device to synchronize its clock to that of the
local device. The “control query” refers to query of some states of the NTP service, including alarm
information, authentication status, clock source information, and so on.
• synchronization—Server access only. Permits a peer device to synchronize its clock to that of the
local device but does not permit the peer devices to perform control query.
• server—Server access and query permitted. Permits the peer devices to perform synchronization and
control query to the local device but does not permit the local device to synchronize its clock to that
of a peer device.
• peer—Full access. Permits the peer devices to perform synchronization and control query to the local
device and also permits the local device to synchronize its clock to that of a peer device.
From the highest NTP service access-control right to the lowest one are peer, server, synchronization, and
query. When a device receives an NTP request, it performs an access-control right match and uses the
first matched right.
Configuration prerequisites
Before you configure the NTP service access-control right to the local device, create and configure an ACL
associated with the access-control right. For more information about ACLs, see ACL and QoS
Configuration Guide.
Configuration procedure
To configure the NTP service access-control right to the local device:
To do…
1. Enter system view.
2. Configure the NTP service
NOTE:
The access-control right mechanism only provides a minimum degree of security protection for the
system running NTP. A more secure method is identity authentication.
Use the command… Remarks
system-view —
access-control right for a peer
device to access the local
device.
ntp-service access { peer | query
| server | synchronization } acl-
number
Required.
peer by default
Configuring NTP authentication
NTP authentication should be enabled for a system running NTP in a network where there is a high
security demand. It enhances the network security by means of client-server key authentication, which
prohibits a client from synchronizing with a device that has failed authentication.
65
Page 76

Configuration prerequisites
The configuration of NTP authentication involves configuration tasks to be implemented on the client and
on the server.
When configuring NTP authentication:
• For all synchronization modes, when you enable the NTP authentication feature, configure an
authentication key and specify it as a trusted key. The ntp-service authentication enable command
must work together with the ntp-service authentication-keyid command and the ntp-service reliable
authentication-keyid command. Otherwise, the NTP authentication function cannot be normally
enabled.
• For the client/server mode or symmetric mode, associate the specified authentication key on the
client (symmetric-active peer if in the symmetric peer mode) with the NTP server (symmetric-passive
peer if in the symmetric peer mode). Otherwise, the NTP authentication feature cannot be normally
enabled.
• For the broadcast server mode or multicast server mode, associate the specified authentication key
on the broadcast server or multicast server with the NTP server. Otherwise, the NTP authentication
feature cannot be normally enabled.
• For the client/server mode, if the NTP authentication feature has not been enabled for the client, the
client can synchronize with the server regardless of whether the NTP authentication feature has been
enabled for the server or not. If the NTP authentication is enabled on a client, the client can only be
synchronized to a server that can provide a trusted authentication key.
• For all synchronization modes, the server side and the client side must be consistently configured.
Configuration procedure
Configuring NTP authentication for a client
To do… Use the command… Remarks
1. Enter system view.
2. Enable NTP authentication.
3. Configure an NTP
authentication key.
4. Configure the key as a trusted
key.
5. Associate the specified key
with an NTP server.
system-view —
ntp-service authentication enable
ntp-service authentication-keyid
keyid authentication-mode md5
value
ntp-service reliable authenticationkeyid keyid
Client/server mode:
ntp-service unicast-server { ip-
address | server-name }
authentication-keyid keyid
Symmetric peers mode:
ntp-service unicast-peer { ip-
address | peer-name }
authentication-keyid keyid
Required.
Disabled by default.
Required.
No NTP authentication key by
default.
Required.
By default, no authentication key
is configured to be trusted.
Required.
You can associate a non-existing
key with an NTP server. To enable
NTP authentication, you must
configure the key and specify it as
a trusted key after associating the
key with the NTP server.
66
Page 77

NOTE:
After you enable the NTP authentication feature for the client, make sure that you configure for the
client an authentication key that is the same as on the server and specify that the authentication key is
trusted. Otherwise, the client cannot be synchronized to the server.
Configuring NTP authentication for a server
To do… Use the command… Remarks
1. Enter system view.
system-view —
2. Enable NTP authentication.
3. Configure an NTP
authentication key.
4. Configure the key as a trusted
key.
5. Enter interface view.
6. Associate the specified key
with an NTP server.
ntp-service authentication enable
ntp-service authentication-keyid
keyid authentication-mode md5
value
ntp-service reliable authenticationkeyid keyid
interface interface-type interface-
number
Broadcast server mode:
ntp-service broadcast-server
authentication-keyid keyid
Multicast server mode:
ntp-service multicast-server
authentication-keyid keyid
Required.
Disabled by default.
Required.
No NTP authentication key by
default.
Required.
By default, no authentication key
is configured to be trusted.
—
Required.
You can associate a non-existing
key with an NTP server. To enable
NTP authentication, you must
configure the key and specify it as
a trusted key after associating the
key with the NTP server.
NOTE:
The procedure of configuring NTP authentication on a server is the same as that on a client, and the
same authentication key must be configured on both the server and client sides.
Displaying and maintaining NTP
To do… Use the command… Remarks
Display information about NTP
service status
Display information about NTP
sessions
Display the brief information
about the NTP servers from the
local device back to the primary
reference source
display ntp-service status [ |
{ begin | exclude | include }
regular-expression ]
display ntp-service sessions
[ verbose ] [ | { begin | exclude |
include } regular-expression ]
display ntp-service trace [ |
{ begin | exclude | include }
regular-expression ]
67
Available in any view
Available in any view
Available in any view
Page 78

Configuring NTP examples
Configuring NTP client/server mode example
Network requirements
Perform the following configurations to synchronize the time between Switch B and Switch A:
• As shown in Figure 25,
stratum level of 2.
• Switch B works in client/server mode and Switch A is to be used as the NTP server of Switch B.
Figure 25 Network diagram for NTP client/server mode configuration
Configuration procedure
1. Set the IP address for each interface as shown in Figure 25. The configuration procedure is omitted.
2. Configuration on Switch B:
# View the NTP status of Switch B before clock synchronization.
<SwitchB> display ntp-service status
Clock status: unsynchronized
Clock stratum: 16
Reference clock ID: none
Nominal frequency: 64.0000 Hz
Actual frequency: 64.0000 Hz
Clock precision: 2^7
Clock offset: 0.0000 ms
Root delay: 0.00 ms
Root dispersion: 0.00 ms
Peer dispersion: 0.00 ms
Reference time: 00:00:00.000 UTC Jan 1 1900 (00000000.00000000)
the local clock of Switch A is to be used as a reference source, with the
# Specify Switch A as the NTP server of Switch B so that Switch B is synchronized to Switch A.
<SwitchB> system-view
[SwitchB] ntp-service unicast-server 1.0.1.11
# View the NTP status of Switch B after clock synchronization.
[SwitchB] display ntp-service status
Clock status: synchronized
Clock stratum: 3
Reference clock ID: 1.0.1.11
Nominal frequency: 64.0000 Hz
Actual frequency: 64.0000 Hz
Clock precision: 2^7
Clock offset: 0.0000 ms
Root delay: 31.00 ms
68
Page 79

Root dispersion: 1.05 ms
Peer dispersion: 7.81 ms
Reference time: 14:53:27.371 UTC Sep 19 2005 (C6D94F67.5EF9DB22)
The output shows that Switch B has been synchronized to Switch A, and the clock stratum level of Switch B
is 3, while that of Switch A is 2.
# View the NTP session information of Switch B, which shows that an association has been set up
between Switch B and Switch A.
[SwitchB] display ntp-service sessions
source reference stra reach poll now offset delay disper
**************************************************************************
[12345] 1.0.1.11 127.127.1.0 2 63 64 3 -75.5 31.0 16.5
note: 1 source(master),2 source(peer),3 selected,4 candidate,5 configured
Total associations : 1
Configuring the NTP symmetric mode example
Network requirements
Perform the following configurations to synchronize time among devices:
• The local clock of Switch A is to be configured as a reference source, with the stratum level of 2.
• Switch B works in the client mode and Switch A is to be used as the NTP server of Switch B.
• After Switch B is synchronized to Switch A , Switch C works in the symmetric-active mode and Switch
B will act as peer of Switch C. Switch C is the symmetric-active peer while Switch B is the symmetricpassive peer.
Figure 26 Network diagram for NTP symmetric peers mode configuration
Configuration procedure
1. Configure IP addresses for interfaces (omitted)
2. Configuration on Switch B:
# Specify Switch A as the NTP server of Switch B.
<SwitchB> system-view
[SwitchB] ntp-service unicast-server 3.0.1.31
3. View the NTP status of Switch B after clock synchronization.
[SwitchB] display ntp-service status
69
Page 80

Clock status: synchronized
Clock stratum: 3
Reference clock ID: 3.0.1.31
Nominal frequency: 100.0000 Hz
Actual frequency: 100.0000 Hz
Clock precision: 2^18
Clock offset: -21.1982 ms
Root delay: 15.00 ms
Root dispersion: 775.15 ms
Peer dispersion: 34.29 ms
Reference time: 15:22:47.083 UTC Sep 19 2005 (C6D95647.153F7CED)
The output shows that Switch B has been synchronized to Switch A, and the clock stratum level of Switch B
is 3.
4. Configuration on Switch C (after Switch B is synchronized to Switch A):
# Configure Switch C as a symmetric peer after local synchronization.
[SwitchC] ntp-service unicast-peer 3.0.1.32
The output shows that Switch B and Switch C are configured as symmetric peers, with Switch C in the
symmetric-active mode and Switch B in the symmetric-passive mode. Because the stratus level of Switch C
is 16 while that of Switch B is 3, Switch B is synchronized to Switch C.
# View the NTP status of Switch C after clock synchronization.
[SwitchC] display ntp-service status
Clock status: synchronized
Clock stratum: 4
Reference clock ID: 3.0.1.32
Nominal frequency: 100.0000 Hz
Actual frequency: 100.0000 Hz
Clock precision: 2^18
Clock offset: -21.1982 ms
Root delay: 15.00 ms
Root dispersion: 775.15 ms
Peer dispersion: 34.29 ms
Reference time: 15:22:47.083 UTC Sep 19 2005 (C6D95647.153F7CED)
The output shows that Switch C has been synchronized to Switch B and the clock stratum level of Switch C
is 4.
# View the NTP session information of Switch C, which shows that an association has been set up
between Switch B and Switch C.
[SwitchC] display ntp-service sessions
source reference stra reach poll now offset delay disper
********************************************************************************
[12345] 3.0.1.32 3.0.1.31 3 3 64 16 -6.4 4.8 1.0
note: 1 source(master),2 source(peer),3 selected,4 candidate,5 configured
Total associations : 1
70
Page 81

Configuring NTP broadcast mode example
Network requirements
As shown in Figure 27, Switch C functions as the NTP server for multiple devices on a network segment
and synchronizes the time among multiple devices.
• Switch C’s local clock is to be used as a reference source, with the stratum level of 2.
• Switch C works in broadcast server mode and sends out broadcast messages from VLAN-interface 2.
• Switch A and Switch B work in broadcast client mode, and listen to broadcast messages through
their VLAN-interface 2 respectively.
Figure 27 Network diagram for NTP broadcast mode configuration
Configuration procedure
1. Set the IP address for each interface as shown in Figure 27. The configuration procedure is omitted.
2. Configuration on Switch C:
# Configure Switch C to work in broadcast server mode and send broadcast messages through VLANinterface 2.
[SwitchC] interface vlan-interface 2
[SwitchC-Vlan-interface2] ntp-service broadcast-server
3. Configuration on Switch A:
# Configure Switch A to work in broadcast client mode and receive broadcast messages on VLANinterface 2.
<SwitchA> system-view
[SwitchA] interface vlan-interface 2
[SwitchA-Vlan-interface2] ntp-service broadcast-client
4. Configuration on Switch B:
# Configure Switch B to work in broadcast client mode and receive broadcast messages on VLANinterface 2.
<SwitchB> system-view
[SwitchB] interface vlan-interface 2
[SwitchB-Vlan-interface2] ntp-service broadcast-client
Switch A and Switch B get synchronized upon receiving a broadcast message from Switch C.
71
Page 82

# Take Switch A as an example. View the NTP status of Switch A after clock synchronization.
[SwitchA-Vlan-interface2] display ntp-service status
Clock status: synchronized
Clock stratum: 3
Reference clock ID: 3.0.1.31
Nominal frequency: 64.0000 Hz
Actual frequency: 64.0000 Hz
Clock precision: 2^7
Clock offset: 0.0000 ms
Root delay: 31.00 ms
Root dispersion: 8.31 ms
Peer dispersion: 34.30 ms
Reference time: 16:01:51.713 UTC Sep 19 2005 (C6D95F6F.B6872B02)
The output shows that Switch A has been synchronized to Switch C, and the clock stratum level of Switch
A is 3, while that of Switch C is 2.
# View the NTP session information of Switch A, which shows that an association has been set up
between Switch A and Switch C.
[SwitchA-Vlan-interface2] display ntp-service sessions
source reference stra reach poll now offset delay disper
**************************************************************************
[1234] 3.0.1.31 127.127.1.0 2 254 64 62 -16.0 32.0 16.6
note: 1 source(master),2 source(peer),3 selected,4 candidate,5 configured
Total associations : 1
Configuring NTP multicast mode example
Network requirements
As shown in Figure 28, Switch C functions as the NTP server for multiple devices on different network
segments and synchronizes the time among multiple devices.
• Switch C’s local clock is to be used as a reference source, with the stratum level of 2.
• Switch C works in multicast server mode and sends out multicast messages from VLAN-interface 2.
• Switch A and Switch D work in multicast client mode and receive multicast messages through VLAN-
interface 3 and VLAN-interface 2 respectively.
NOTE:
In this example, Switch B must be a Layer 3 switch supporting multicast routing.
72
Page 83

Figure 28 Network diagram for NTP multicast mode configuration
Configuration procedure
1. Set the IP address for each interface as shown in Figure 28. The configuration procedure is omitted.
2. Configuration on Switch C:
# Configure Switch C to work in multicast server mode and send multicast messages through VLANinterface 2.
[SwitchC] interface vlan-interface 2
[SwitchC-Vlan-interface2] ntp-service multicast-server
3. Configuration on Switch D:
# Configure Switch D to work in multicast client mode and receive multicast messages on VLAN-interface
2.
<SwitchD> system-view
[SwitchD] interface vlan-interface 2
[SwitchD-Vlan-interface2] ntp-service multicast-client
Because Switch D and Switch C are on the same subnet, Switch D can receive the multicast messages
from Switch C without being enabled with the multicast functions and can be synchronized to Switch C.
# View the NTP status of Switch D after clock synchronization.
[SwitchD-Vlan-interface2] display ntp-service status
Clock status: synchronized
Clock stratum: 3
Reference clock ID: 3.0.1.31
Nominal frequency: 64.0000 Hz
Actual frequency: 64.0000 Hz
Clock precision: 2^7
Clock offset: 0.0000 ms
Root delay: 31.00 ms
Root dispersion: 8.31 ms
Peer dispersion: 34.30 ms
Reference time: 16:01:51.713 UTC Sep 19 2005 (C6D95F6F.B6872B02)
The output shows that Switch D has been synchronized to Switch C, and the clock stratum level of Switch
D is 3, while that of Switch C is 2.
73
Page 84

# View the NTP session information of Switch D, which shows that an association has been set up
between Switch D and Switch C.
[SwitchD-Vlan-interface2] display ntp-service sessions
source reference stra reach poll now offset delay disper
**************************************************************************
[1234] 3.0.1.31 127.127.1.0 2 254 64 62 -16.0 31.0 16.6
note: 1 source(master),2 source(peer),3 selected,4 candidate,5 configured
Total associations : 1
4. Configuration on Switch B:
Because Switch A and Switch C are on different subnets, you must enable the multicast functions on
Switch B before Switch A can receive multicast messages from Switch C.
# Enable IP multicast routing and IGMP.
<SwitchB> system-view
[SwitchB] multicast routing-enable
[SwitchB] interface vlan-interface 2
[SwitchB-Vlan-interface2] pim dm
[SwitchB-Vlan-interface2] quit
[SwitchB] vlan 3
[SwitchB-vlan3] port gigabitethernet 1/0/1
[SwitchB-vlan3] quit
[SwitchB] interface vlan-interface 3
[SwitchB-Vlan-interface3] igmp enable
[SwitchB-Vlan-interface3] igmp static-group 224.0.1.1
[SwitchB-Vlan-interface3] quit
[SwitchB] interface gigabitethernet 1/0/1
[SwitchB-GigabitEthernet1/0/1] igmp-snooping static-group 224.0.1.1 vlan 3
5. Configuration on Switch A:
<SwitchA> system-view
[SwitchA] interface vlan-interface 3
# Configure Switch A to work in multicast client mode and receive multicast messages on VLAN-interface
3.
[SwitchA-Vlan-interface3] ntp-service multicast-client
# View the NTP status of Switch A after clock synchronization.
[SwitchA-Vlan-interface3] display ntp-service status
Clock status: synchronized
Clock stratum: 3
Reference clock ID: 3.0.1.31
Nominal frequency: 64.0000 Hz
Actual frequency: 64.0000 Hz
Clock precision: 2^7
Clock offset: 0.0000 ms
Root delay: 40.00 ms
Root dispersion: 10.83 ms
Peer dispersion: 34.30 ms
Reference time: 16:02:49.713 UTC Sep 19 2005 (C6D95F6F.B6872B02)
74
Page 85

NOTE:
The output shows that Switch A has been synchronized to Switch C, and the clock stratum level of Switch
A is 3, while that of Switch C is 2.
# View the NTP session information of Switch A, which shows that an association has been set up
between Switch A and Switch C.
[SwitchA-Vlan-interface3] display ntp-service sessions
source reference stra reach poll now offset delay disper
**************************************************************************
[1234] 3.0.1.31 127.127.1.0 2 255 64 26 -16.0 40.0 16.6
note: 1 source(master),2 source(peer),3 selected,4 candidate,5 configured
Total associations : 1
For more information about how to configure IGMP and PIM, see
IP Multicast Configuration Guide
Configuring NTP client/server mode with authentication example
Network requirements
As shown in Figure 29, perform the following configurations to synchronize the time between Switch B
and Switch A and ensure network security.
• The local clock of Switch A is to be configured as a reference source, with the stratum level of 2.
• Switch B works in client mode and Switch A is to be used as the NTP server of Switch B, with Switch
B as the client.
• NTP authentication is to be enabled on both Switch A and Switch B.
Figure 29 Network diagram for configuration of NTP client/server mode with authentication
Configuration procedure
.
1. Set the IP address for each interface as shown in Figure 29. The configuration procedure is omitted.
2. Configuration on Switch B:
<SwitchB> system-view
# Enable NTP authentication on Switch B.
[SwitchB] ntp-service authentication enable
# Set an authentication key.
[SwitchB] ntp-service authentication-keyid 42 authentication-mode md5 aNiceKey
# Specify the key as a trusted key.
[SwitchB] ntp-service reliable authentication-keyid 42
# Specify Switch A as the NTP server of Switch B.
[SwitchB] ntp-service unicast-server 1.0.1.11 authentication-keyid 42
Before Switch B can synchronize its clock to that of Switch A, enable NTP authentication for Switch A.
75
Page 86

Perform the following configuration on Switch A:
# Enable NTP authentication.
[SwitchA] ntp-service authentication enable
# Set an authentication key.
[SwitchA] ntp-service authentication-keyid 42 authentication-mode md5 aNiceKey
# Specify the key as a trusted key.
[SwitchA] ntp-service reliable authentication-keyid 42
# View the NTP status of Switch B after clock synchronization.
[SwitchB] display ntp-service status
Clock status: synchronized
Clock stratum: 3
Reference clock ID: 1.0.1.11
Nominal frequency: 64.0000 Hz
Actual frequency: 64.0000 Hz
Clock precision: 2^7
Clock offset: 0.0000 ms
Root delay: 31.00 ms
Root dispersion: 1.05 ms
Peer dispersion: 7.81 ms
Reference time: 14:53:27.371 UTC Sep 19 2005 (C6D94F67.5EF9DB22)
The output shows that Switch B has been synchronized to Switch A, and the clock stratum level of Switch B
is 3, while that of Switch A is 2.
# View the NTP session information of Switch B, which shows that an association has been set up Switch
B and Switch A.
[SwitchB] display ntp-service sessions
source reference stra reach poll now offset delay disper
**************************************************************************
[12345] 1.0.1.11 127.127.1.0 2 63 64 3 -75.5 31.0 16.5
note: 1 source(master),2 source(peer),3 selected,4 candidate,5 configured
Total associations : 1
Total associations : 1
Configuring NTP broadcast mode with authentication example
Network requirements
As shown in Figure 30, Switch C functions as the NTP server for multiple devices on different network
segments and synchronizes the time among multiple devices.
• Switch C’s local clock is to be used as a reference source, with the stratum level of 3.
• Switch C works in broadcast server mode and sends out broadcast messages from VLAN-interface 2.
• Switch D works in broadcast client mode and receives broadcast messages through VLAN-interface
2.
• NTP authentication is enabled on both Switch C and Switch D.
76
Page 87

Figure 30 Network diagram for configuration of NTP broadcast mode with authentication
Configuration procedure
1. Set the IP address for each interface as shown in Figure 30. The configuration procedure is omitted.
2. Configuration on Switch C:
# Configure NTP authentication.
[SwitchC] ntp-service authentication enable
[SwitchC] ntp-service authentication-keyid 88 authentication-mode md5 123456
[SwitchC] ntp-service reliable authentication-keyid 88
# Specify Switch C as an NTP broadcast server, and specify an authentication key.
[SwitchC] interface vlan-interface 2
[SwitchC-Vlan-interface2] ntp-service broadcast-server authentication-keyid 88
3. Configuration on Switch D:
# Configure NTP authentication.
<SwitchD> system-view
[SwitchD] ntp-service authentication enable
[SwitchD] ntp-service authentication-keyid 88 authentication-mode md5 123456
[SwitchD] ntp-service reliable authentication-keyid 88
# Configure Switch D to work in the NTP broadcast client mode.
[SwitchD] interface vlan-interface 2
[SwitchD-Vlan-interface2] ntp-service broadcast-client
Now, Switch D can receive broadcast messages through VLAN-interface 2, and Switch C can send
broadcast messages through VLAN-interface 2. Upon receiving a broadcast message from Switch C,
Switch D synchronizes its clock to that of Switch C.
# View the NTP status of Switch D after clock synchronization.
[SwitchD-Vlan-interface2] display ntp-service status
Clock status: synchronized
Clock stratum: 4
Reference clock ID: 3.0.1.31
Nominal frequency: 64.0000 Hz
Actual frequency: 64.0000 Hz
Clock precision: 2^7
77
Page 88

Clock offset: 0.0000 ms
Root delay: 31.00 ms
Root dispersion: 8.31 ms
Peer dispersion: 34.30 ms
Reference time: 16:01:51.713 UTC Sep 19 2005 (C6D95F6F.B6872B02)
The output shows that Switch D has been synchronized to Switch C, and the clock stratum level of Switch
D is 4, while that of Switch C is 3.
# View the NTP session information of Switch D, which shows that an association has been set up
between Switch D and Switch C.
[SwitchD-Vlan-interface2] display ntp-service sessions
source reference stra reach poll now offset delay disper
**************************************************************************
[1234] 3.0.1.31 127.127.1.0 3 254 64 62 -16.0 32.0 16.6
note: 1 source(master),2 source(peer),3 selected,4 candidate,5 configured
Total associations : 1
Configuring MPLS VPN time synchronization in client/server mode example
Network requirements
As shown in Figure 31, two VPNs are present on PE 1 and PE 2: VPN 1 and VPN 2. CE 1 and CE 3 are
devices in VPN 1. To synchronize the time between CE 1 and CE 3 in VPN 1, perform the following
configurations:
• CE 1’s local clock is to be used as a reference source, with the stratum level of 1.
• CE 3 is synchronized to CE 1 in the client/server mode.
NOTE:
MPLS VPN time synchronization can only be implemented in the unicast mode (client/server mode or
symmetric peers mode), but not in the multicast or broadcast mode.
78
Page 89

Figure 31 Network diagram for MPLS VPN time synchronization configuration
Device Interface IP address Device Interface IP address
CE 1 Vlan-int 10 10.1.1.1/24 PE 1 Vlan-int 10 10.1.1.2/24
CE 2 Vlan-int 20 10.2.1.1/24 Vlan-int 30 172.1.1.1/24
CE 3 Vlan-int 50 10.3.1.1/24 Vlan-int 20 10.2.1.2/24
CE 4 Vlan-int 60 10.4.1.1/24 PE 2 Vlan-int 50 10.3.1.2/24
P Vlan-int 30 172.1.1.2/24 Vlan-int 40 172.2.1.2/24
Vlan-int 40 172.2.1.1/24 Vlan-int 60 10.4.1.2/24
Configuration procedure
NOTE:
Prior to performing the following configuration, be sure you have completed MPLS VPN-related
configurations and make sure of the reachability between CE 1 and PE 1, between PE 1 and PE 2, and
between PE 2 and CE 3. For information about configuring MPLS VPN, see
1. Set the IP address for each interface as shown in Figure 31. The configuration procedure is omitted.
2. Configuration on CE 3:
# Specify CE 1 in VPN 1 as the NTP server of CE 3.
<CE3> system-view
[CE3] ntp-service unicast-server 10.1.1.1
# View the NTP session information and status information on CE 3 a certain period of time later. The
information should show that CE 3 has been synchronized to CE 1, with the clock stratum level of 2.
[CE3] display ntp-service status
Clock status: synchronized
Clock stratum: 2
Reference clock ID: 10.1.1.1
Nominal frequency: 63.9100 Hz
Actual frequency: 63.9100 Hz
Clock precision: 2^7
MPLS Configuration Guide
.
79
Page 90

Clock offset: 0.0000 ms
Root delay: 47.00 ms
Root dispersion: 0.18 ms
Peer dispersion: 34.29 ms
Reference time: 02:36:23.119 UTC Jan 1 2001(BDFA6BA7.1E76C8B4)
[CE3] display ntp-service sessions
source reference stra reach poll now offset delay disper
**************************************************************************
[12345]10.1.1.1 LOCL 1 7 64 15 0.0 47.0 7.8
note: 1 source(master),2 source(peer),3 selected,4 candidate,5 configured
Total associations : 1
[CE3] display ntp-service trace
server 127.0.0.1,stratum 2, offset -0.013500, synch distance 0.03154
server 10.1.1.1,stratum 1, offset -0.506500, synch distance 0.03429
refid 127.127.1.0
Configuring MPLS VPN time synchronization in symmetric peers mode example
Network requirements
As shown in Figure 31, two VPNs are present on PE 1 and PE 2: VPN 1 and VPN 2. To synchronize the
time between PE 1 and PE 2 in VPN 1, perform the following configurations:
• PE 1’s local clock is to be used as a reference source, with the stratum level of 1.
• PE 2 is synchronized to PE 1 in the symmetric peer mode, and specifies that the VPN instance is
VPN 1.
Configuration procedure
1. Set the IP address for each interface as shown in Figure 31. The configuration procedure is omitted.
2. Configuration on PE 2:
# Specify PE 1 in VPN 1 as the symmetric-passive peer of PE 2.
<PE2> system-view
[PE2] ntp-service unicast-peer vpn-instance vpn1 10.1.1.2
# View the NTP session information and status information on PE 2 a certain period of time later. The
information should show that PE 2 has been synchronized to PE 1, with the clock stratum level of 2.
[PE2] display ntp-service status
Clock status: synchronized
Clock stratum: 2
Reference clock ID: 10.1.1.2
Nominal frequency: 63.9100 Hz
Actual frequency: 63.9100 Hz
Clock precision: 2^7
Clock offset: 0.0000 ms
Root delay: 32.00 ms
Root dispersion: 0.60 ms
Peer dispersion: 7.81 ms
Reference time: 02:44:01.200 UTC Jan 1 2001(BDFA6D71.33333333)
80
Page 91

[PE2] display ntp-service sessions
source reference stra reach poll now offset delay disper
**************************************************************************
[12345]10.1.1.2 LOCL 1 1 64 29 -12.0 32.0 15.6
note: 1 source(master),2 source(peer),3 selected,4 candidate,5 configured
Total associations : 1
[PE2] display ntp-service trace
server 127.0.0.1,stratum 2, offset -0.012000, synch distance 0.02448
server 10.1.1.2,stratum 1, offset 0.003500, synch distance 0.00781
refid 127.127.1.0
81
Page 92

Configuring IPC
IPC is a reliable communication mechanism among different nodes. The following are the basic concepts
in IPC.
Node
An IPC node is an entity supporting IPC; it is an independent processing unit. In actual application, an
IPC node corresponds to one CPU. The following guidelines apply:
• One centralized device only has one CPU, corresponding to one node.
• Typically, a distributed device is available with multiple boards, each having one CPU. Some, for
example, service CPU and OAM CPU and are available with multiple CPUs. A distributed device
corresponds to multiple nodes.
• An IRF virtual device is an interconnection of several devices, with each member device
corresponding to one or more nodes. An IRF virtual device corresponds to multiple nodes.
In actual application, IPC is mainly applied on an IRF virtual device or distributed device; it provides a
reliable transmission mechanism between different devices and boards.
Link
Channel
An IPC link is a connection between any two IPC nodes. There is one and only one link between any two
nodes for packet sending and receiving. All IPC nodes are fully connected.
IPC links are created when the system is initialized: When a node starts up, it sends handshake packets
to other nodes; a connection is established between them if the handshake succeeds.
The system identifies the link connectivity between two nodes using link status. An IPC node can have
multiple links, each having its own status.
A channel is a communication interface for an upper layer application module of a node to communicate
with an application module of a peer node. Each node assigns a locally unique channel number to each
upper layer application module to identify this module.
Data of an upper layer application module is sent to the IPC module through a channel, and the IPC
module sends the data to a peer node through the link.
82
Page 93

Figure 32 Relationship between a node, link and channel
Packet sending modes
IPC supports three packet sending modes: unicast, multicast (broadcast is considered as a special
multicast), and mixcast, each having a queue. The upper layer application modules can select one as
needed.
• Unicast—Packet sending between two single nodes.
• Multicast—Packet sending between a single node and multiple nodes. To use the multicast mode, a
multicast group needs to be created first. Multicasts will be sent to all nodes in the multicast group.
An application can create multiple multicast groups. The creation and deletion of a multicast group
and multicast group members depend on the application module.
C
ha
nnel
1
Link
Chan
2
l
e
n
• Mixcast—Both unicast and multicast are supported.
Enabling IPC performance statistics
When IPC performance statistics is enabled, the system collects statistics for packet sending and receiving
of a node in a specified time range, for example, in the past 10 seconds, or in the past 1 minute. When
IPC performance statistics is disabled, statistics collection is stopped. At this time, if you execute the
display command, the system displays the statistics information at the time when IPC performance
statistics was disabled.
To enable IPC performance statistics:
To do… Use the command… Remarks
ipc performance enable { node
Enable IPC performance statistics
node-id | self-node } [ channel
channel-id ]
83
Required
Disabled by default
Available in user view
Page 94

Displaying and maintaining IPC
To do… Use the command… Remarks
display ipc node [ | { begin |
Display IPC node information
Display channel information of a
node
exclude | include } regularexpression ]
display ipc channel { node node-
id | self-node } [ | { begin |
exclude | include } regularexpression ]
Display queue information of a
node
Display multicast group
information of a node
Display packet information of a
node
Display link status information of
a node
Display IPC performance statistics
information of a node
Clear IPC performance statistics
information of a node
display ipc queue { node node-id
| self-node } [ | { begin | exclude
| include } regular-expression ]
display ipc multicast-group { node
node-id | self-node } [ | { begin |
exclude | include } regular-
expression ]
display ipc packet { node node-id
| self-node } [ | { begin | exclude
| include } regular-expression ]
display ipc link { node node-id |
self-node } [ | { begin | exclude |
include } regular-expression ]
display ipc performance { node
node-id | self-node } [ channel
channel-id ] [ | { begin | exclude
| include } regular-expression ]
reset ipc performance [ node
node-id | self-node ] [ channel
channel-id ]
Available in any view
Available in user view
84
Page 95

Configuring PoE
PoE enables a PSE to supply power to PDs from Ethernet interfaces through straight-through twisted pair
cables.
Advantages
• Reliable—Power is supplied in a centralized way so that it is convenient to provide a backup power
supply.
• Easy to connect—A network terminal requires no external power supply except an Ethernet cable.
• Standard—It is in compliance with IEEE 802.3af, and adopts a globally uniform power interface.
• Promising—It can be applied to IP telephones, wireless LAN access points (APs), portable chargers,
card readers, web cameras, and data collectors.
Composition
As shown in Figure 33, a PoE system comprises PoE power, PSE, PI, and PD.
• PoE power—The whole PoE system is powered by the PoE power.
• PSE—A PSE supplies power for PDs. A PSE can be built-in (Endpoint) or external (Midspan). A built-
in PSE is integrated in a switch, and an external PSE is independent from a switch. HP PSEs are built
in. The system uses PSE IDs to identify different PSEs. To display the mapping between a PSE ID and
the member ID of a switch, execute the display poe device command.
NOTE:
The PSE ID is the switch member ID multiplies 3 and then plus 1. For example, if the member ID of the
device is 3, the PSE ID of the device is 3 × 3 + 1 = 10.
A PSE can examine the Ethernet cables connected to PoE interfaces, search for PDs, classify them, and
supply power to them. When detecting that a PD is unplugged, the PSE stops supplying power to the PD.
• PI—An Ethernet interface with the PoE capability is a PoE interface. A PoE interface can be an FE or
GE interface.
• PD—A PD accepts power from the PSE, including IP phones, wireless APs, chargers of portable
devices, POS, and web cameras.
• The PD that is being powered by the PSE can be connected to another power supply unit for
redundancy power backup.
Figure 33 PoE system diagram
85
Page 96

Protocol specification
The protocol specification related to PoE is IEEE 802.3af.
PoE configuration task list
You can configure a PoE interface by using either of the following methods:
• At the CLI.
• Through configuring the PoE profile and applying the PoE profile to the PoE interface.
To configure a single PoE interface, configure it at the CLI; to configure PoE interfaces in batches, use the
PoE profile. For a PoE configuration parameter of a PoE interface, you can only select one mode
(including modification and removal of a PoE interface).
Complete these tasks to configure PoE:
Task Remarks
Enabling PoE
Detecting PDs
Configuring the PoE power
Configuring PoE power
management
Configuring the PoE monitoring
function
Enabling PoE for a PoE
interface
Enabling the PSE to detect
nonstandard PDs
Configuring a PD disconnection
detection mode
Configuring the maximum PoE
interfac
e power
Configuring PoE interface
power management
Configuring PSE power
monitoring
Monitoring PD
Required
Optional
Optional
Optional
Optional
Optional
Optional
The device automatically mon
when supplying power to them, so no
configuration is required.
itors PDs
Configuring PoE profile Optional
Configuring PoE interface
through PoE profile
Applying PoE profile Optional
Upgrading PSE processing software in service Optional
86
Page 97

CAUTION:
• Before configuring PoE, make sure that the PoE power supply and PSE are operating properly;
otherwise, you cannot configure PoE or the configured PoE function does not take effect.
• Turning off the PoE power supply during the startup of the device might cause the PoE configuration
in the PoE profile invalid.
Enabling PoE
Enabling PoE for a PoE interface
The system does not supply power to or reserve power for the PDs connected to a PoE interface if the PoE
interface is not enabled with the PoE function.
You are allowed to enable PoE for a PoE interface if the PoE interface will not result in PoE power
overload; otherwise, whether you can enable PoE for the PoE interface depends on whether the PoE
interface is enabled with the PoE power management function (for more information about the PoE
interface power management function, see “Configuring PoE interface power management.”
• If the PoE interface is not enabled with the PoE power management function, you are not allowed to
enable PoE for the PoE interface.
).
• If the PoE interface is enabled with the PoE power management function, you are allowed to enable
PoE for the PoE interface (whether the PDs can be powered depends on other factors, for example,
the power supply priority of the PoE interface).
The PSE supplies power for a PoE interface in the following modes:
• Over signal wires: The PSE uses the pairs (1, 2, 3, and 6) for transmitting data in category 3/5
twisted pair cables to supply DC power while transmitting data to PDs.
• Over spare wires: The PSE uses the pairs (4, 5, 7, and 8) not transmitting data in category 3/5
twisted pair cables to supply DC power to PDs.
NOTE:
• When the sum of the power consumption of all powered PoE interfaces on a PSE exceeds the
maximum power of the PSE, the system considers the PSE overloaded (The maximum PSE power is
decided by the user configuration).
• A PSE can only supply power to a PD when the selected power supply mode is supported by both the
PSE and PD. If the PSE and PD support different power supply modes (for example, the PSE does not
support power over spare wires, but the PD supports power over spare wires), you have to change
the order of the lines in the twisted pair cable to supply power to the PD.
• The HP 5820X&5800 Switch Series only supports the signal mode.
To enable PoE for a PoE interface:
To do… Use the command… Remarks
1. Enter system view.
2. Enter PoE interface view.
system-view —
interface interface-type interface-
number
87
—
Page 98

To do… Use the command… Remarks
3. Enable PoE for the PoE
interface.
4. Configure a description for the
PD connected to the PoE
interface.
poe enable
poe pd-description text
Detecting PDs
Enabling the PSE to detect nonstandard PDs
Two types of PDs are available: standard PDs and nonstandard PDs. The PSE can only detect standard
PDs and supply power to them. The PSE can only detect nonstandard PDs and supply power to them after
the PSE is enabled to detect nonstandard PDs.
To enable the PSE to detect nonstandard PDs:
To do…
1. Enter system view.
2. Enable the PSE to detect
Use the command… Remarks
system-view —
nonstandard PDs.
poe legacy enable pse pse-id
Required.
Disabled by default.
Optional.
By default, no description for the
PD connected to the PoE interface
is available.
Required.
By default, the PSE can detect
standard PDs rather than non
standard PDs.
Configuring a PD disconnection detection mode
To detect the PD connection with PSE, PoE provides two detection modes: AC detection and DC detection.
The AC detection mode is energy saving relative to the DC detection mode.
To configure a PD disconnection detection mode:
To do…
1. Enter system view.
2. Configure a PD disconnection
CAUTION:
If you change the PD disconnection detection mode when the device is running, the connected PDs will
be powered off. Be cautious to do so.
Use the command… Remarks
system-view —
detection mode.
poe disconnect { ac | dc }
88
Optional.
The default PD disconnection
detection mode is ac.
Page 99

Configuring the PoE power
Configuring the maximum PoE interface power
The maximum PoE interface power is the maximum power that the PoE interface can provide to the
connected PD. If the power required by the PD is larger than the maximum PoE interface power, the PoE
interface will not supply power to the PD.
To configure the maximum PSE power:
To do…
1. Enter system view.
2. Enter PoE interface view.
3. Configure the maximum
Use the command… Remarks
system-view —
interface interface-type interface-
number
power for the PoE interface.
poe max-power max-power
—
Optional.
30000 milliwatts by default.
Configuring PoE power management
PoE power management involves PSE power management and PoE interface power management.
Configuring PoE interface power management
The power supply priority of a PD depends on the priority of the PoE interface. The priority levels of PoE
interfaces are critical, high and low in descending order. Power supply to a PD is subject to PoE interface
power management policies.
All PSEs implement the same PoE interface power management policies. When a PSE supplies power to a
PD, the following actions occur:
• If the PoE interface power management is not enabled, no power will be supplied to a new PD
when the PSE power is overloaded.
• If the PoE interface power management priority policy is enabled, the PD with a lower priority is first
powered off to guarantee the power supply to the PD with a higher priority when the PSE power is
overloaded.
NOTE:
• 19 watts guard band is reserved for each PoE interface on the device to prevent a PD from being
powered off because of a sudden increase of the PD power. When the remaining power of the PSE
where the PoE interface resides is lower than 19 watts and no priority is configured for the PoE
interface, the PSE does not supply power to the new PD; when the remaining power of the PSE where
the PoE interface resides is lower than 19 watts, but priority is configured for the PoE interface, the
interface with a higher priority can preempt the power of the interface with a lower priority to ensure
the normal working of the higher priority interface.
• If the sudden increase of the PD power results in PSE power overload, power supply to the PD on the
PoE interface with a lower priority will be stopped
priority.
to ensure the power supply to the PD with a higher
89
Page 100

If the guaranteed remaining PSE power (the maximum PSE power minus the power allocated to the
critical PoE interface, regardless of whether PoE is enabled for the PoE interface) is lower than the
maximum power of the PoE interface, you will fail to set the priority of the PoE interface to critical.
Otherwise, you can succeed in setting the priority to critical, and this PoE interface will preempt the
power of other PoE interfaces with a lower priority level. In the latter case, the PoE interfaces whose
power is preempted will be powered off, but their configurations will remain unchanged. When you
change the priority of a PoE interface from critical to a lower level, the PDs connecting to other PoE
interfaces will have an opportunity of being powered.
Configuration prerequisites
Enable PoE for PoE interfaces.
Configuration procedure
To configure PoE interface power management:
To do…
1. Enter system view.
2. Configure PoE interface power
3. Enter PoE interface view.
4. Configure the power supply
Use the command… Remarks
system-view —
management priority policy.
priority for a PoE interface.
poe pd-policy priority
interface interface-type interface-
number
poe priority { critical | high |
low }
Required.
Not configured by default.
—
Optional.
low by default.
Configuring the PoE monitoring function
With the PoE monitoring function enabled, the system monitors the parameter values related to PoE power
supply, PSE, PD, and device temperature in real time. When a specific value exceeds the limited range,
the system automatically takes some measures to protect itself.
Configuring PSE power monitoring
When the PSE power exceeds or drops below the specified threshold, the system sends trap messages.
To configure a power alarm threshold for the PSE:
To do… Use the command… Remarks
1. Enter system view.
2. Configure a power alarm
threshold for the PSE.
Monitoring PD
When a PSE starts or ends power supply to a PD, the system sends a trap message.
system-view —
poe utilization-threshold
utilization-threshold-value pse pseid
90
Optional.
80% by default.
 Loading...