

Page 1
i
OPERATORS GUIDE
MODEL 1610A
LOGIC STATE ANALYZER
*
-7
L.’ ;
‘I
”
@COPYRIGHT
1900 GARDEN OF THE GODS ROAD, COLORADO SPRINGS, COLORADO, U.S.A.
-.
,.
,.’
”
/
_
F’
Manual Part Number 0161 o-90903
Microfiche Part Number 0161 o-90803
HEWLETT-PACKARD COMPANY/COLORADO SPRINGS DIVISION
ALL RIGHTS RESERVED
PRINTED: AUG 1977
1977
Page 2
SAFETY SUMMARY
The following general
and repair of this instrument. Failure to comply with these precautions or with specific warnings
elsewhere in this manual vioiafes safety standards of design, manufacture, and intended use of the
instrument. Hewlett-Packard Company assumes no i/ability
with these requirements.
GROUND THE INSTRUMENT.
To
mrnrmrze
ground The
rnust
to two-contact adapter
(safety
lnternarronal Elt:lctrotechnrcal Commrssion
shock hazard, the instrument chassis and cabinet must be connected to an electrical
tnstrument
etther
be plugged
groundi
at the power outlet, The power jack and
satefy
precautions must be observed during all phases of operation, service,
for
the customer’s failure to comply
IS equipped
Into
an approved three-contact
with
the grounding wire (green) firmly connected to an electrical ground
with
a three-conductor ac power cable. The power cable
elEctrical
(IEC) safety standards.
outlet or used with a three-contact
mating
plug of the power cable meet
7
t
i
P
-I
r
.J
-.
DO NOT OPERATE IN AN EXPLOSIVE ATMOSPHERE.
Do not operate the instrument in the presence of flammable gases or fumes. Operation of any
electrrcal
KEEP AWAY FROM LIVE CIRCUITS.
OperatIn!]
adjustments must be made by qualified maintenance personnel.
power cable connected. Under certain conditions, dangerous voltages may exist even with the
power cable removed To avoid Injuries,
touching them
DO NOT SERVICE OR ADJUST ALONE.
Do not attempt internal service or adjustment unless another person,
and
USE CAUTION WHEN EXPOSING OR HANDLING THE CRT.
Breakage of
To prevent CRT Implosion,
be done only by qualified maintenance personnel using approved safety mask and gloves.
DO NOT SUBSTITUTE PARTS OR MODIFY INSTRUMENT.
Because of the danger of introducing additional hazards, do not install
any
Sales and
instrument In such an environment constitutes a definite safety hazard.
personnel must not remove instrument covers. Component replacement and internal
Do not replace components with
always disconnect power and discharge circuits before
capable of rendering first aid
resu:;cttation
unauthorized modifrcatron
IS present.
the
Cathode-ray Tube (CRT) causes a high-velocity scattering of glass fragments (implosion).
avoid
rough handling or jarring of the instrument. Handling of the CRT shall
Service
substrtute
to the instrument. Return the instrument to a Hewlett-Packard
Office for service and repair to ensure that safety features are maintained.
parts or perform
I.
“I
I;
.I
‘1
I
I
DANGEROUS PROCEDURE WARNINGS.
Warnings
manual Instructions contained In the
such as the example below, precede potentially dangerous procedures throughout this
warntngs
Dangerous voltages, capable of causing death, are present in this instrument.
Use ex’treme caution when handling, testing, and adjusting.
must be followed
pzz--l
ss-2-l f76
,
1:
i
i’
i,
i:
Page 3
TABLE OF CONTENTS
PAGE
PREFACE
CHAPTER I:
General
The Keyboard
.....................................................................
tNTRODUCTlON
TO HP MODEL 1610A LOGIC ANALYZER
..................
.....................................................................
................................................................
Current
/Measurement
Display Group ............................................
Entry Group ...............................................................
Edit
Group ................................................................
Execute
Group
ProbeThreshold
The
Front
Probe Pod Cable Connectors
The
Rear
P,anel.........
.............................................................
..............................................................
Panel
............................................................
.................................................
......................................................
Basic Information About Menu Displays ...........................................
Menu
Title
and Machine Status
................................................
Error, Warning, and Information Messages ......................................
Muftrple--choice
Entry
Fields
The Cursor
...............................................................
Fields
..............................................................
......................................................
Menu Display Sections ......................................................
CHAPTER II:
Preparing for
OPERATING
YOUR
1610A
...........................................
Operation .......................................................
Quick Run-through Procedure .................................................
Now What? ................................................................
CHAPTER
Introduction
III:
DETAILED
MENU DESCRIPTIONS
................................................................
....................................
Format Specification Menu ..................................................
Trace Specification Menu., ..................................................
Trace
List
Menu..
.........................................................
Trace Graph Menu .........................................................
Trace
Cornpare
CHAPTER IV: POSITIONING THE TRACE WINDOW IN DATA FLOW.
Example 1:
Menu .......................................................
....................
:Simple
Single-state Trace
............................................
Example 2: Single-state Trace with Delay .........................................
Example 3: Tracing Specific Data Path in a Branching Program
Example 4: Tracing Specific Path in Multiple-branch Program
Example 5: Multiple-branch Path Completed in a Single Pass
.......................
........................
.........................
Example 6: Tracing a Direct Jump in a Multiple-branch Program ......................
Example 7: Tracing Program Flow in Nested Loops
CHAPTER V: PERFORMANCE VERIFICATION
.................................
......................................
Introduction.. ..............................................................
Initiation of Performance Verification ............................................
Display Test
..............................................................
Keyboard Test ............................................................
Trace Test ...............................................................
Interrupt-rest .............................................................
Printer Test ..............................................................
APPENDIX
APPENDIX B: MESSAGES
A:
GLOSSARY.
.....................................................
......................................................
iv
1
1
1
2
3
4
5
6
6
6
8
9
9
10
10
10
11
11
13
13
14
18
19
19
21
23
25
27
29
31
32
32
33
34
35
36
37
39
39
39
40
41
42
43
43
A-l
B-l
. . .
III
Page 4
PREFACE
------- HOW TO USE THIS BOOK -------
How you use this book is largely a matter of your experience with Logic State
Analyzers.
An experienced Logic State Analyzer operator can begin using the Hewlett-Packard
1610A after getting acquainted with it in Chapter I and II.
If this
page by page so you thoroughly understand your instrument and how it works.
You may want to try something you’re not sure of, or that is not described in the
book. TRY IT! You won’t damage the 161 OA. If what you try is not acceptable to the
instrument, it will tell you why on the display.
IS,
your first opportunity to use a Logic State Analyzer, go through the book
------- WHEN TO USE THIS BOOK -------
f ’
I ,
!
i.
I *
I”7.I
?
1;
I,i
Whatever your experience level, use selected portions of the book the first time you
operate your 161 OA.
Study the material presented here whenever you have a few minutes. Some of the
machine capabilities are rather subtle; thorough understanding of them will put you
in a position of being ready when that new, complex measurement problem presents
itself.
iV
i;
I.
Page 5
Chapter I
INTRODUCTION TO YOUR
HP MODEL
Your Hewlett-Packard Model
1610A
-mm____
1610A
LOGIC STATE ANALYZER
GENERAL
Logic State Analyzer (called simply
m______
1610A
in
this book) is a general-purpose instrument which extends measurement capabilities
in the Data Domain beyond the capabilities of any previous machine.
Analysis of the most advanced state machines, and the most complex software, is
possible using the 161 OA. Yet Operating simplicity has been achieved by user-oriented
engineering design; the 161 OA performs many routine “house-keeping” chores that
the operator used to do.
As you go through this book, you may find some unfamiliar terms generated by the
unique characteristics of the 161 OA. A glossary of these terms is included in the back
of the book as Appendix A.
---THE
KEYBOARD
-------
The 1610A keyboard contains 39 keys divided into four functional groups. A fold-
out illustration of the keyboard is at the back of this book for easy reference as you
work.
1
Page 6
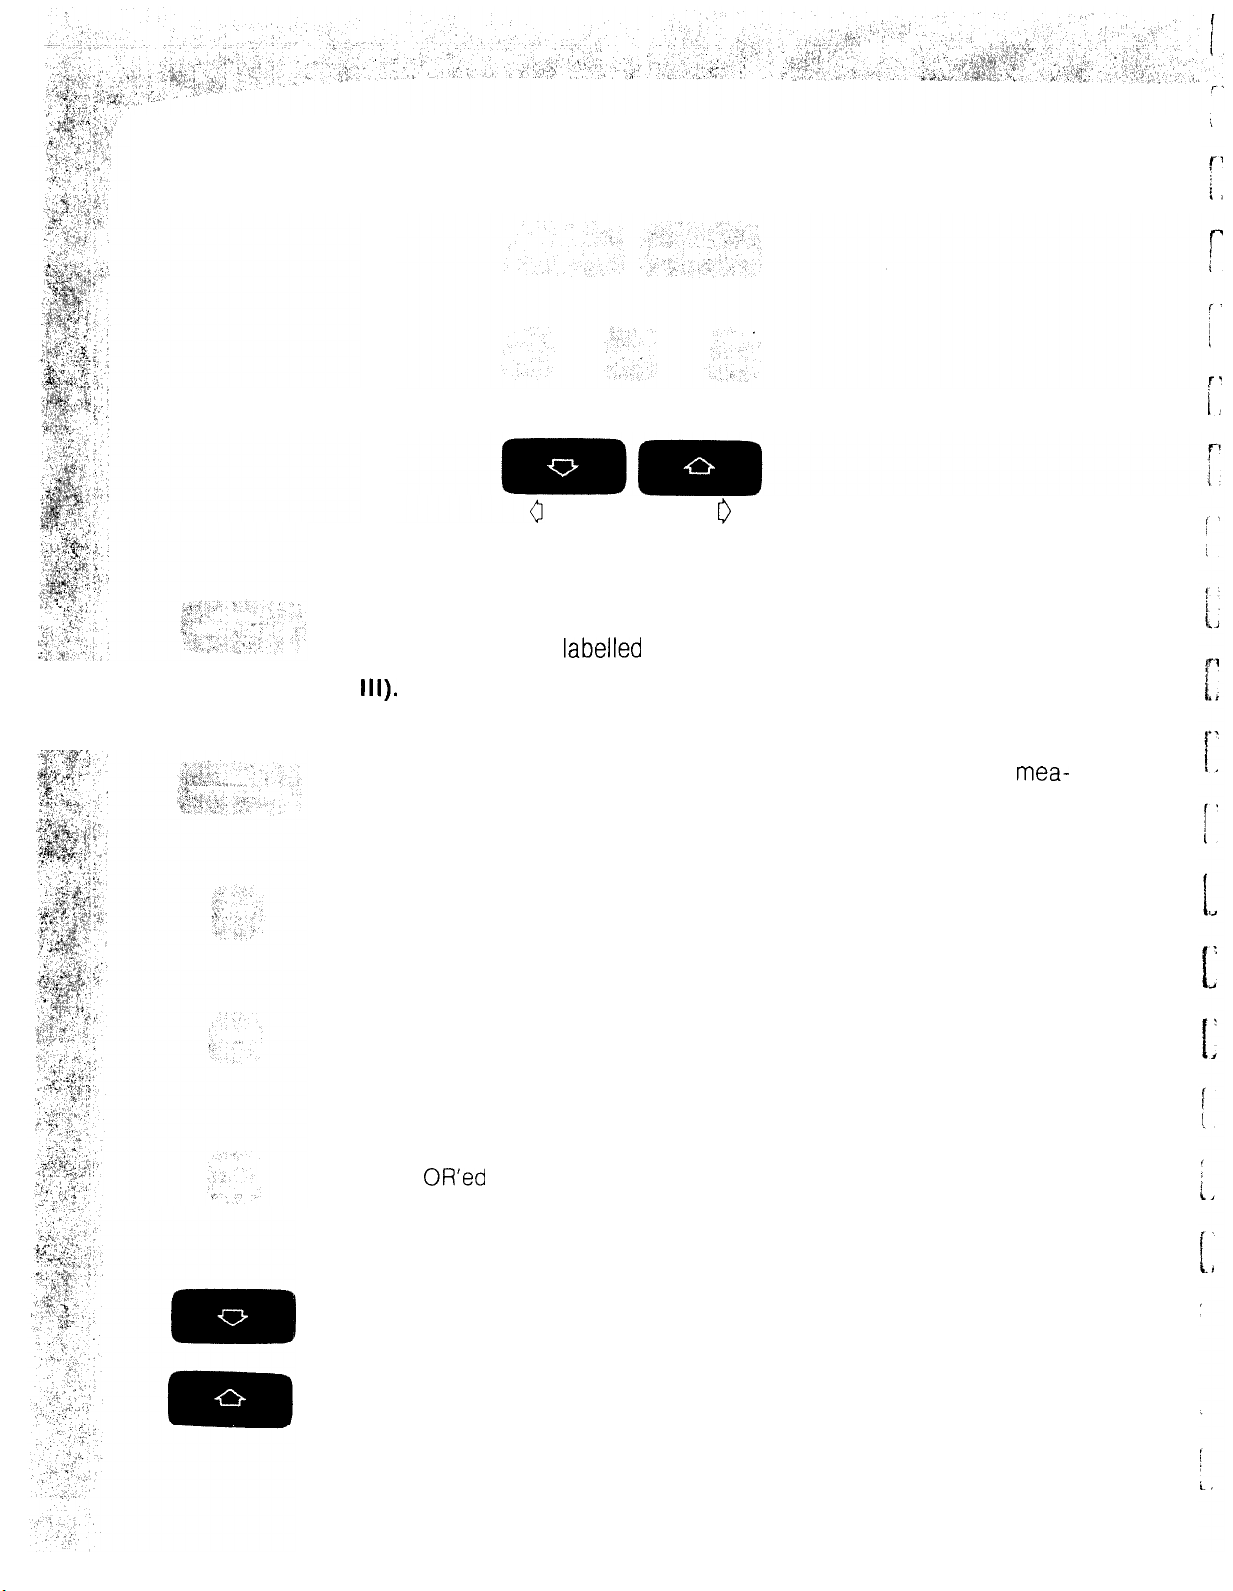
Current Measurement Display Group:
CURRENT MEASUREMENT
DISPLAY
ROLL DISPLAY
GRAPH GRAPH
0
Calls up a display menu which allows you to select clock slope, logic
polarity, and number base parameters. Also permits formatting 32
input channels into
labelled
groups (see FORMAT MENU, Chapter
III).
Calls up a display menu in which you specify state and count
mea-
surements (see TRACE SPECIFICATION MENU, Chapter Ill).
Calls up display menu in which current measurement and count data
are displayed (see TRACE LIST MENU, Chapter Ill).
Calls up graphed display of current measurement data for any speci-
fied label (see GRAPH MENU, Chapter Ill).
Calls up display menu in which current measurement data is EXCLU-
SIVE
OR’ed
with valid stored data; also selection of COMPARED
TRACE mode (see COMPARED TRACE MENU, Chapter Ill).
Rolls trace display in the indicated direction to view all 64 memory
states. The 20 states displayed are represented by intensified dots
in GRAPH MENU. Intensified dots on the graph shift left or right as
the trace is rolled,
Page 7
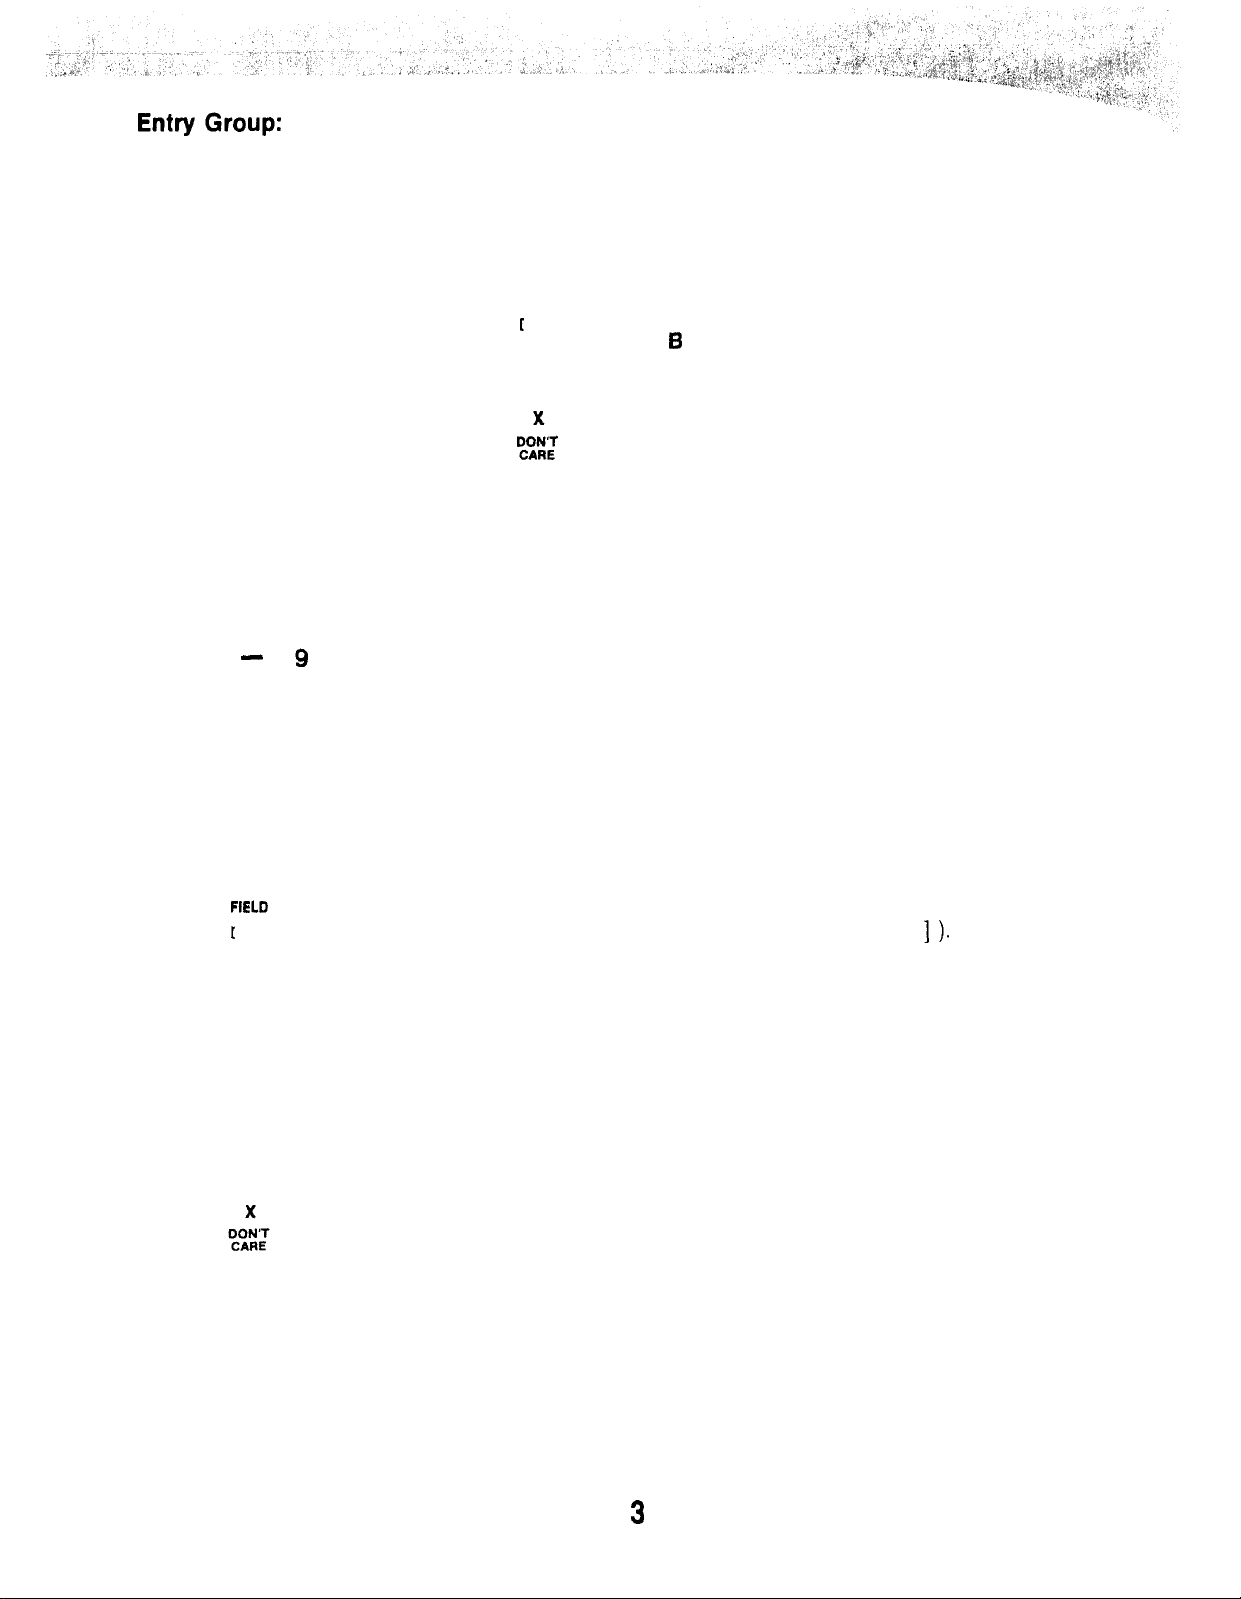
ENTRY
0
-
‘9
or
A-F
FIELD
SELECT
1
I
0
D E
A
6
7 8
4 5
1
2
F
c
9
6
3
Alphanumeric keys for entering information into all entry fields on
the displays.
FfELD
SELECT
1
I
Permits selection among field content variables. This key is used to
change inverse fields which contain brackets ( [
] ).
In entry fields:
“X” indicates that all allowed digit values are acceptable. In
octal fields allowed values of “X” are 0 through 7 (3 bits). In
hexadecimal fields allowed values for “X” are 0 through F (4 bits).
In label assignment fields:
“X” indicates that the channel is not used. An used channel is not
included in any other label reference.
3
Page 8
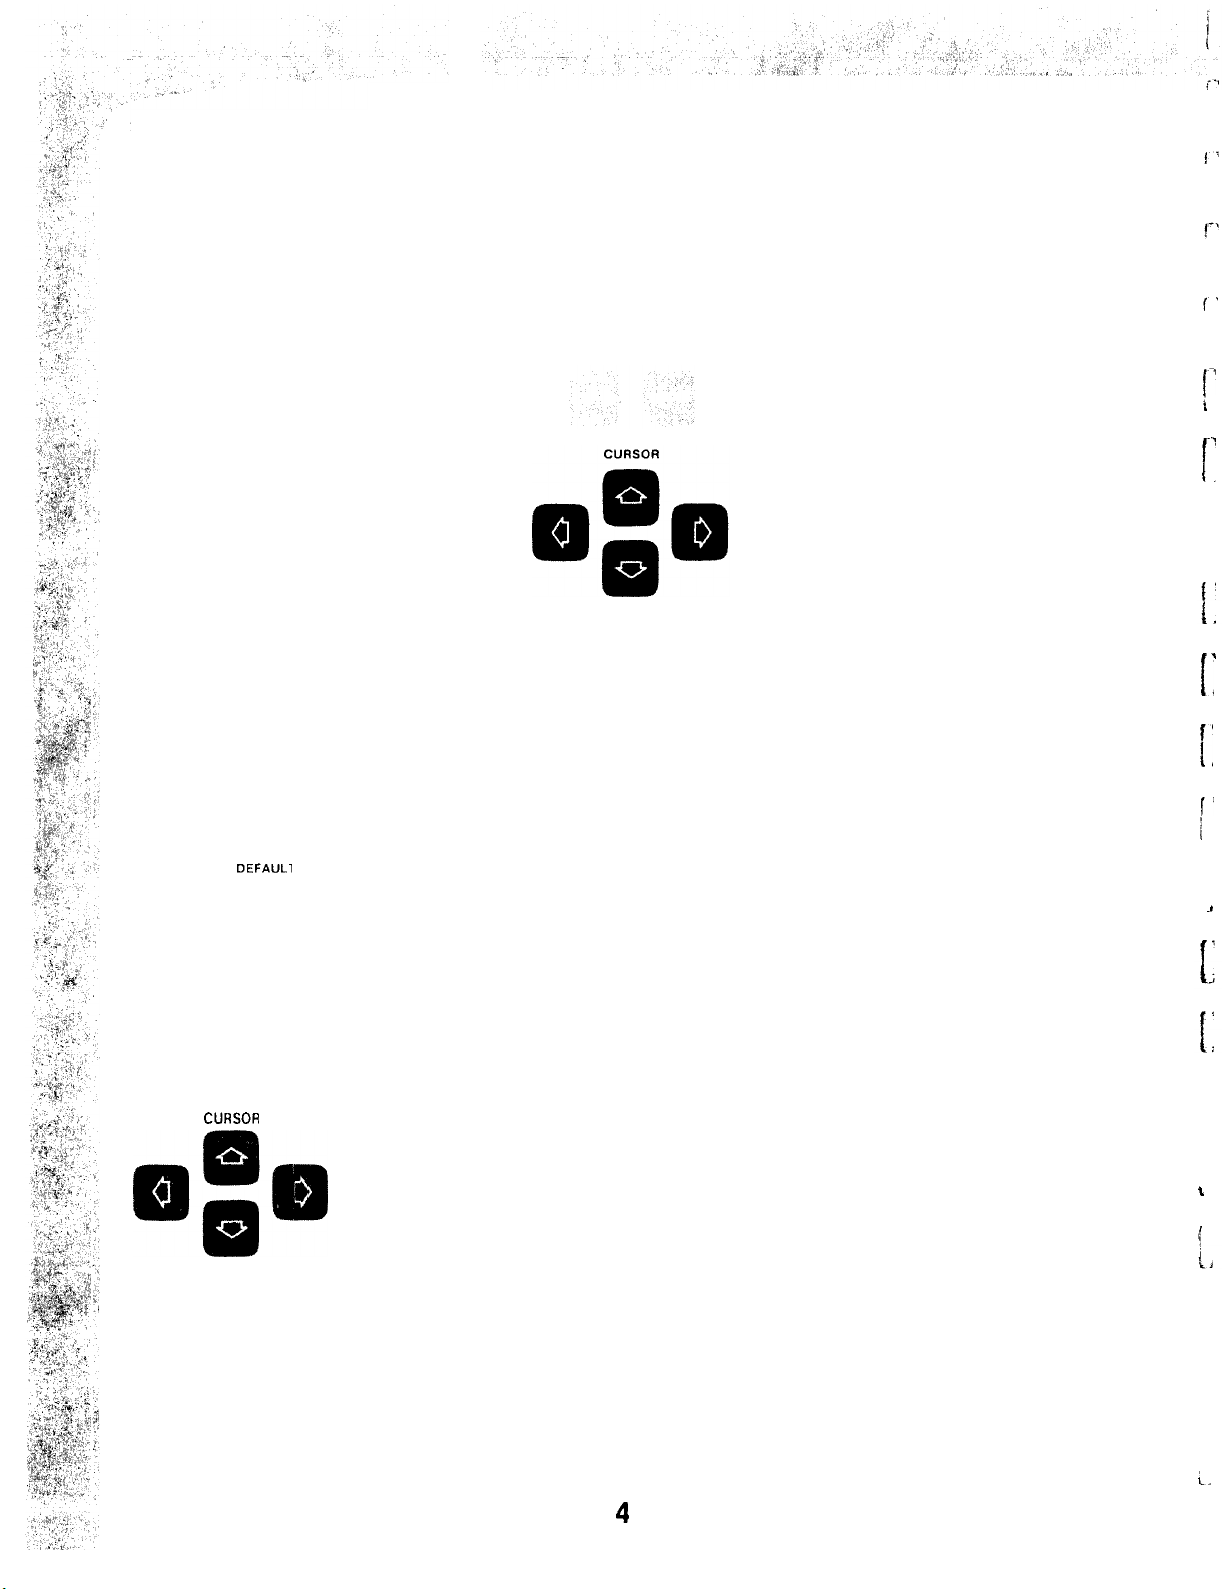
Edit Group:
EDIT
DEFAULT
GRAPH LIMITS
I’
i
.
aD+a
EDIT
DEFAULl
GRAPH LIMITS
CURSOR
1)
v
lb
Insert or delete lines which allow further definition of trace location
in program flow; or which selectively “TRACE ONLY STATES”
which meet any of several conditions.
Returns the currently displayed menu to its simplest form.
Used in TRACE GRAPH MENU only. Automatically changes upper
or lower graph limit.
Used to move blinking cursor in indicated direction.
I.
i,
I’
i
i
3
,
\
i.
4
Page 9
Execute Group:
,I.
.,,, ‘,
EXECUTE
STORE
CURRENTMEASUREMENT
..
,‘,
,,,:f;‘i/s, ”
’
,,
_.
,,.,’
“i,
‘1.” .*,
‘,I”,
,,,I
:
‘Q’S _,
Transfers current measurement data (with FORMAT and TRACE
SPECIFICATIONS) into separate storage memory; does NOT alter
current measurement information.
Performs an V-exchange between current measurement data and
data in stored memory (see COMPARED TRACE, Chapter III).
Initiates a print-out of the current display (except GRAPH) on an
interfaced HP Model
9866A/B
Printer.
Initiates a search in data flow to find and trace data that corresponds
to the parameters defined in the specification menus then displays
resultant data. Pressing the key one time initiates a single trace;
holding the key down places the 161 OA in the CONTINUOUS TRACE
mode, permitting observation of dynamic program flow.
Stops any “CONTINUOUSTRACE,““COMPAREDTRACE,””TRACE,”
or “PRINT” which remains “IN PROCESS.”
5
Page 10
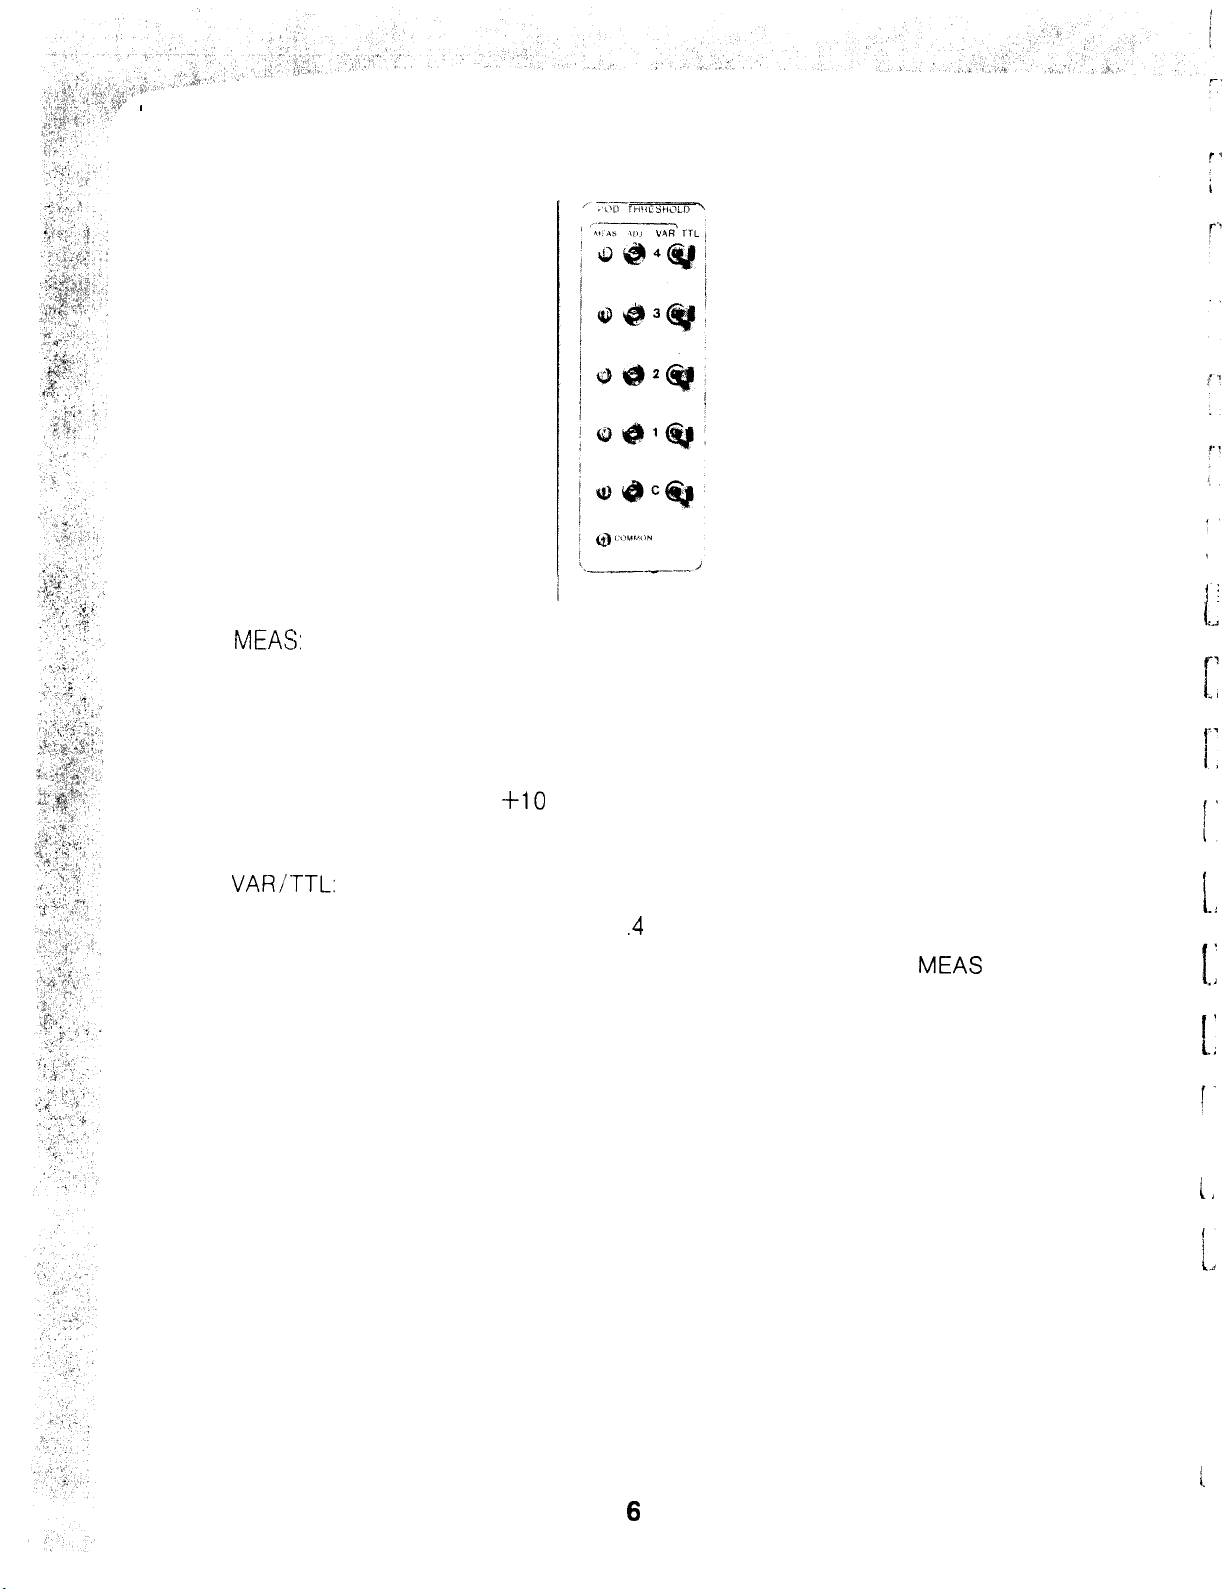
Probe Threshold:
------- THE FRONT PANEL -------
MEAS:
A point of attachment for a voltage measuring device when adjusting
threshold level.
ADJ: Adjustment for setting threshold level to the desired amplitude in a
range of -10 V to
VAH/TTL:
When this switch is set to TTL, the corresponding probe pod is
+lO
V.
set to operate at TTL (1 .4 V) threshold levels. In the VAR position, the probe pod is adjusted to required voltage at
COMMON: A grounding point
for measuring threshold voltage levels for
MEAS
point.
any probe pod.
------- PROBE POD CABLE CONNECTORS -------
i,
Directly under the keyboard are sockets for connecting the probe pod cables. These
cables are not numbered and will operate interchangeably, except for the Clock pod.
Pod numbers in the photograph relate pod location to the FORMAT SPECIFICATION
6
i.
Page 11
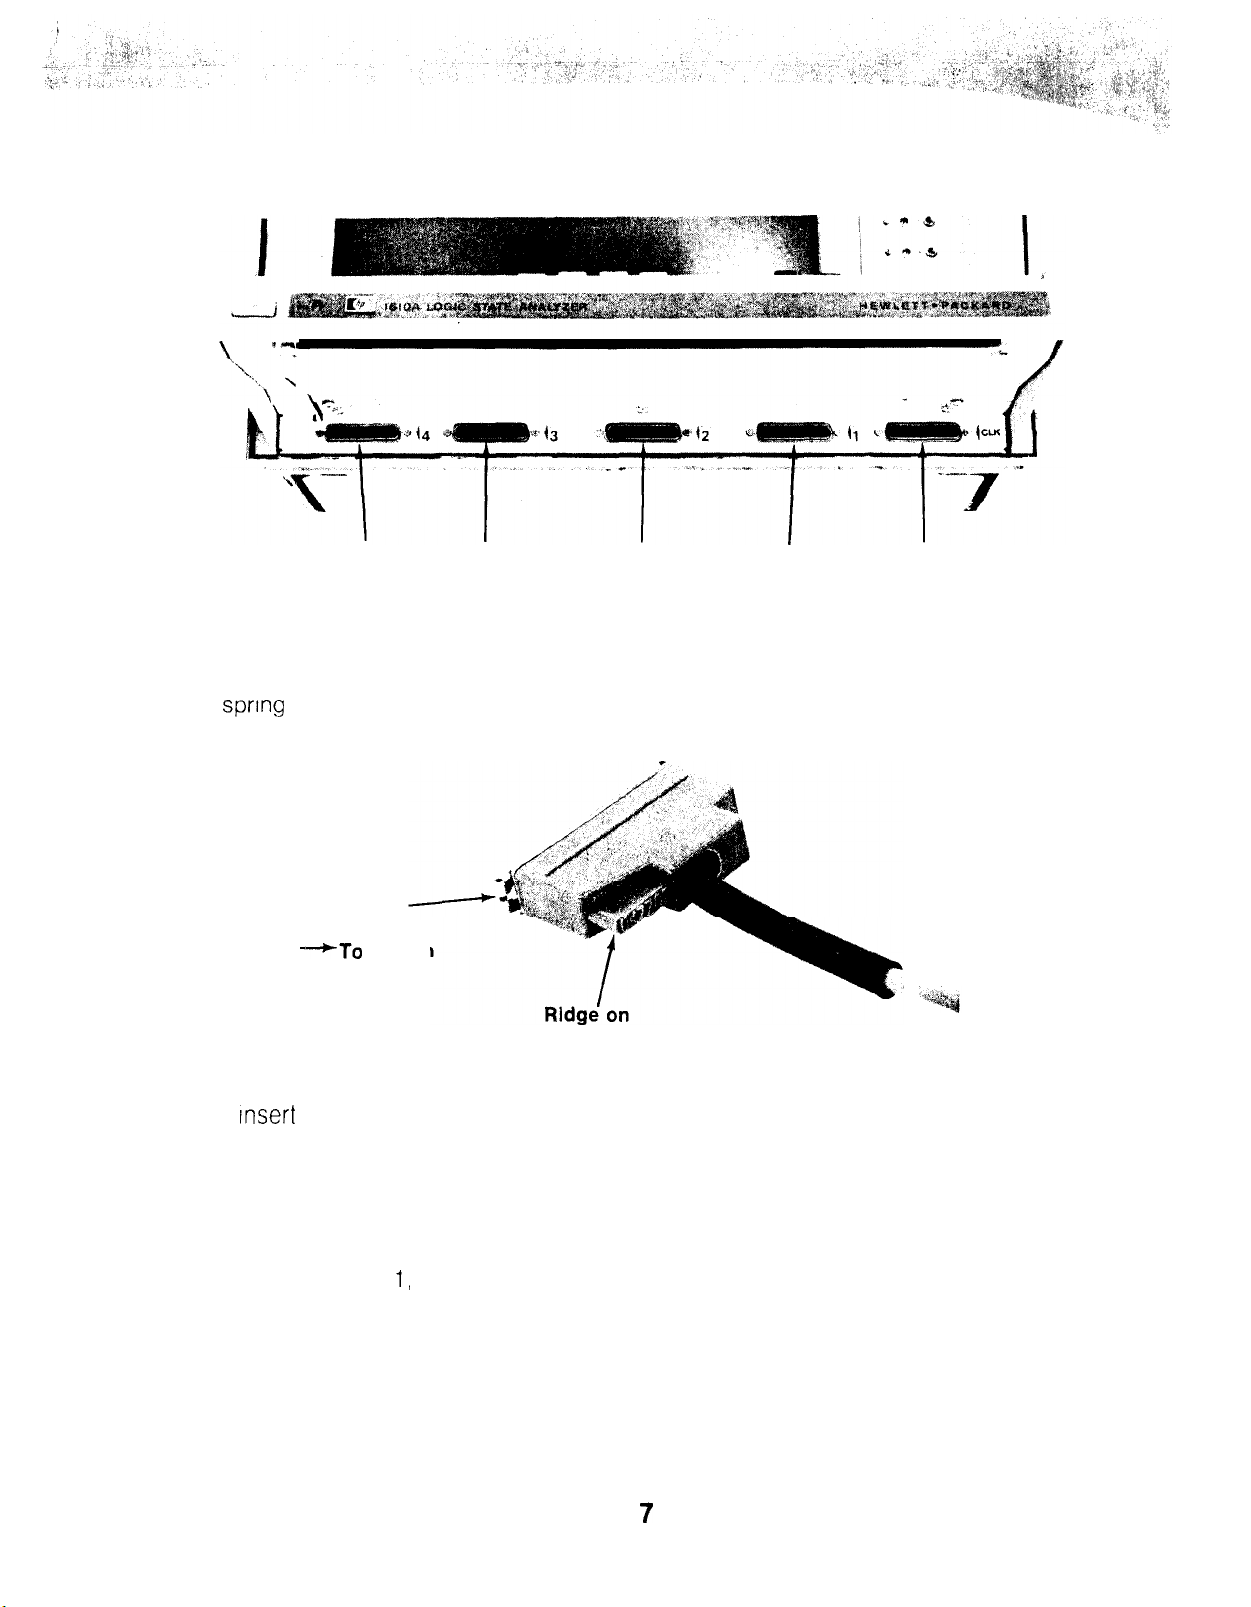
POD
4
POD
3
POD
2
POD
1
CLK
menu display (see Chapter III). Each connector is keyed to the socket; the
ridge in the molded plug should be on the left when being inserted in the socket.
A
sprtng
clip on the connector locks it in position when it is pushed to the left as shown.
Spring Clip
-+-To lock
To
--To
Insert
plug into socket, slide spring clip to the right, insert plug in socket, slide
plug in
Molded Plug
spring clip to the left to lock in position,
There are eight data lines and a ground lead in each pod. These lines are identified by
wire colors, The white/black line represents data bit 0, the white/brown line represents data bit 1, and so on to the white/violet line which represents data bit 7,
following the standard resistor value color code. A black lead indicates “ground.” For
purposes of the FORMAT SPECIFICATION menu (Chapter Ill), line 0 represents the
least significant bit and line 7 represents the most significant bit.
7
Page 12
,
I
:
:
‘1’ ..,
,, ”
‘,
,,’
:,1,
‘,
,,,L,“
1.
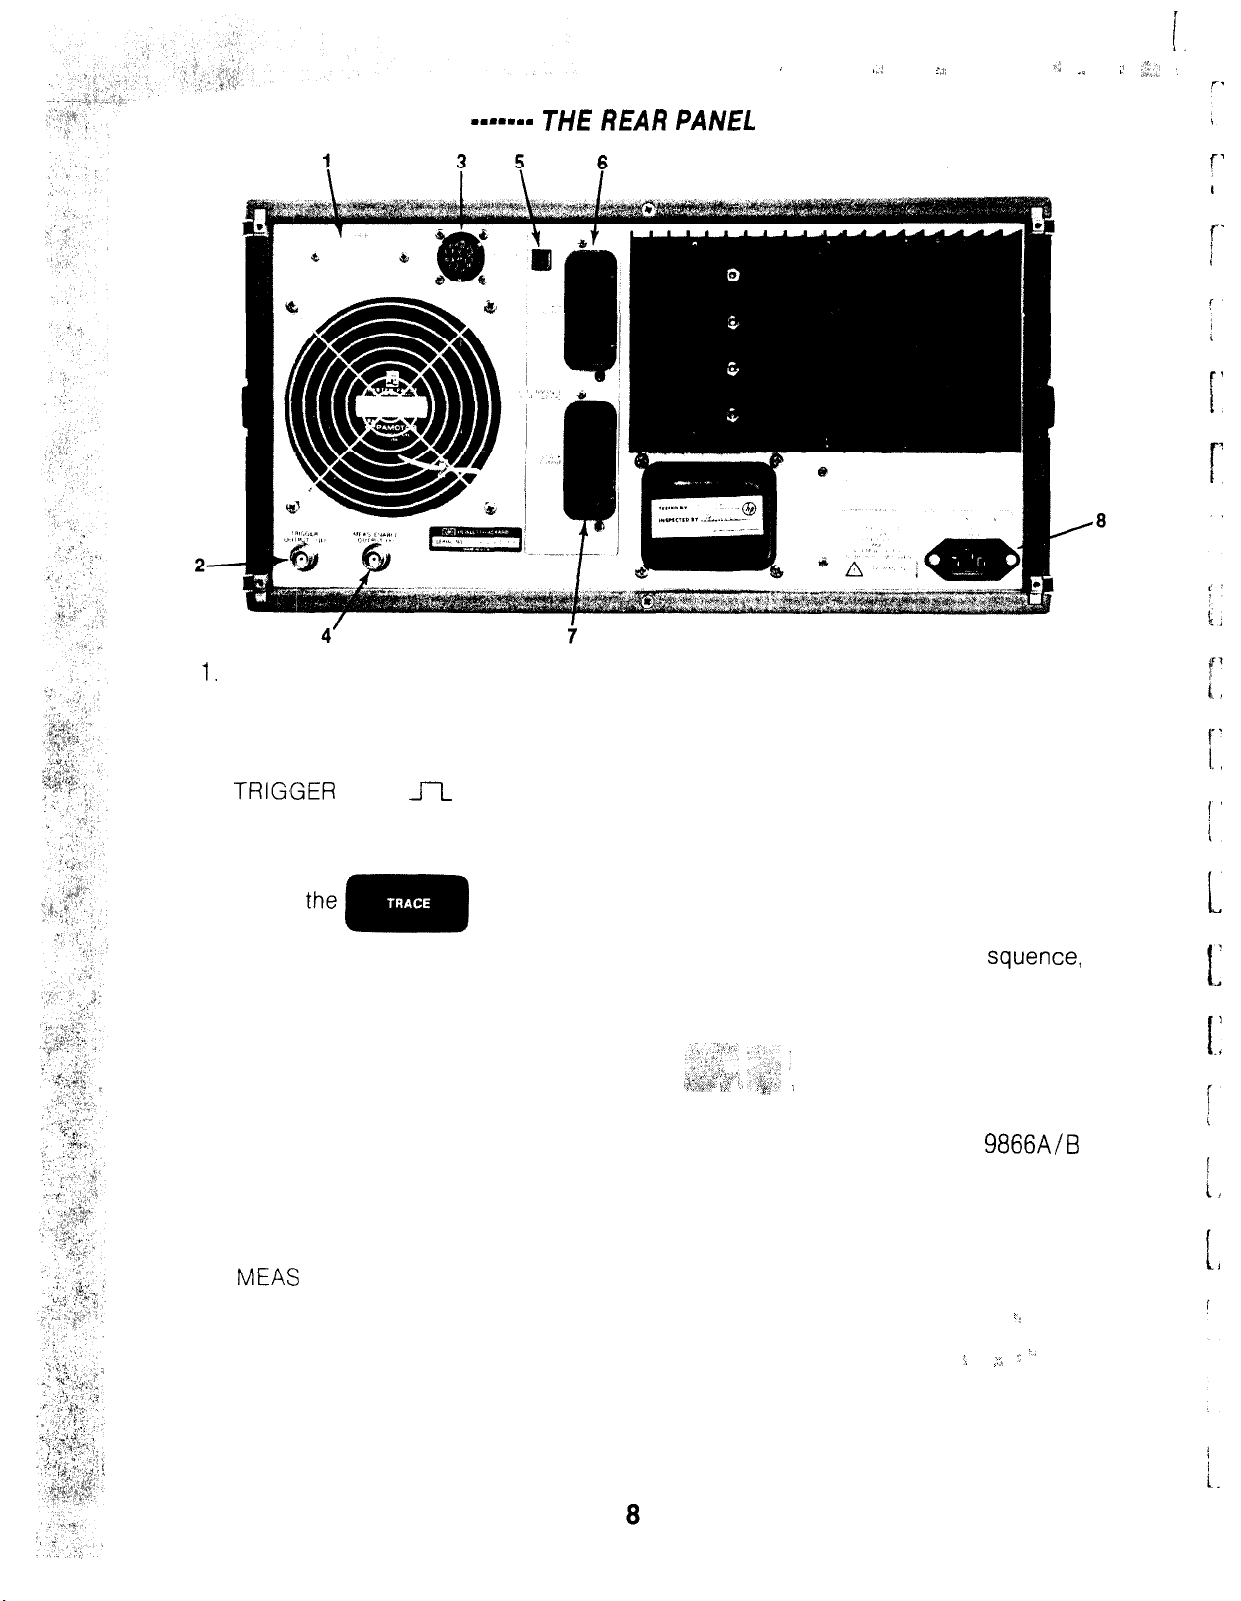
1
-----mm THE REAR PANEL
1.
For installation of a future Option which will permit use of the 161 OA with the HP
-s---m-
Interface Bus (HP IB).
2.
TRIG~GER
OUT
JI
connector provides high repetition rate pulses useful for
triggering external instrumentation such as oscilloscopes. Pulse output begins
when
the trace specification is satisfied. If the trace position includes a state
them
key is pressed, and a 50 ns pulse is generated each time
squence,
the pulse occurs when the last valid state is found; pulse output continues until
a new specification is traced, or until the
3.
PRINTER connector permits interfacing the 161 OA with an HP Model
L~~j$“‘- “.~~,I :
,
..;~.,‘:y
‘!,.I ‘t
,$:*<g*
p* :..tp
key is pressed.
i
9866A/B
Printer for obtaining hard copy of all display menus except GRAPH.
4.
MEAS ENABLE provides a low logic level when the 161 OA begins trace execution;
level remains low until the trace state is recognized or until
IS
pressed.
”
key
2 ^
>./r
‘1
:
Page 13

START
5.
m
pushbutton initiates internal performance verification routines. Perform-
ance verification destroys current specifications and data.
6. DATA POD connected to this socket provides a continuous 8-bit count at
10 MHz rate; also tests the data pod for accurate operation during performance
verification.
7.
CLOCK POD connected to this socket uses internally generated 10 MHz clock
signal for performance verification routines.
8. Line power socket.
-.------
BASIC INFORMATION ABOUT MENU DISPLAYS -------
Some features are common to all menu displays. These features are described here
so you
1.
Menu Title and Machine Status.
wiill
recognize them in the following pages.
The first line of all menus gives the name of the menu on the left. Machine status
is on the right and indicates the last machine operation initiated and whether the
operation is COMPLETED, FAILED, ABORTED, or IN PROCESS. When the 161 OA
is in continuous or compared trace modes, status condition will continue to flash
these possible conditions.
9
Page 14
2. ERROR, WARNING, and Information Messages.
Model
for communication between the 161 OA and the operator. Some of the messages,
ERROR and WARNING, imply a sense of urgency, but they do not in any way
mean damage to the machine or injury to the operator. ERROR is only to alert
the operator that he should make an immediate correction. WARNING cautions
the operator that a current entry may lead to an ERROR, or that a limit of execution has been reached. Appendix 6 lists and describes these messages in
more
3. Multiple-Choice Fields.
An inverse video field which contains brackets ( [
a choice among two or more variables in defining the parameter for that
ular field. Your choice is made by pressing the
1610A
‘detail.
is a conversational machine. Line two of each menu is reserved
]
) indicates that you have
partic-
&Fk&
key until the proper field
[
I
content is displayed. The 161 OA remembers the choice you made and carries it
into ali
IMPORTANT: If the COMPARED TRACE MODE selectable field is left in
[STOP=] or
single or continuous trace operation in any menu.
4. Entry Fields.
Inverse video fields without brackets indicate areas where you enter alpha-
numeric characters which define labels, states of interest, or state occur-
rences
other menu displays where it applies.
[STOP+],
condition, it must be returned to [OFF] to restore
10
Page 15
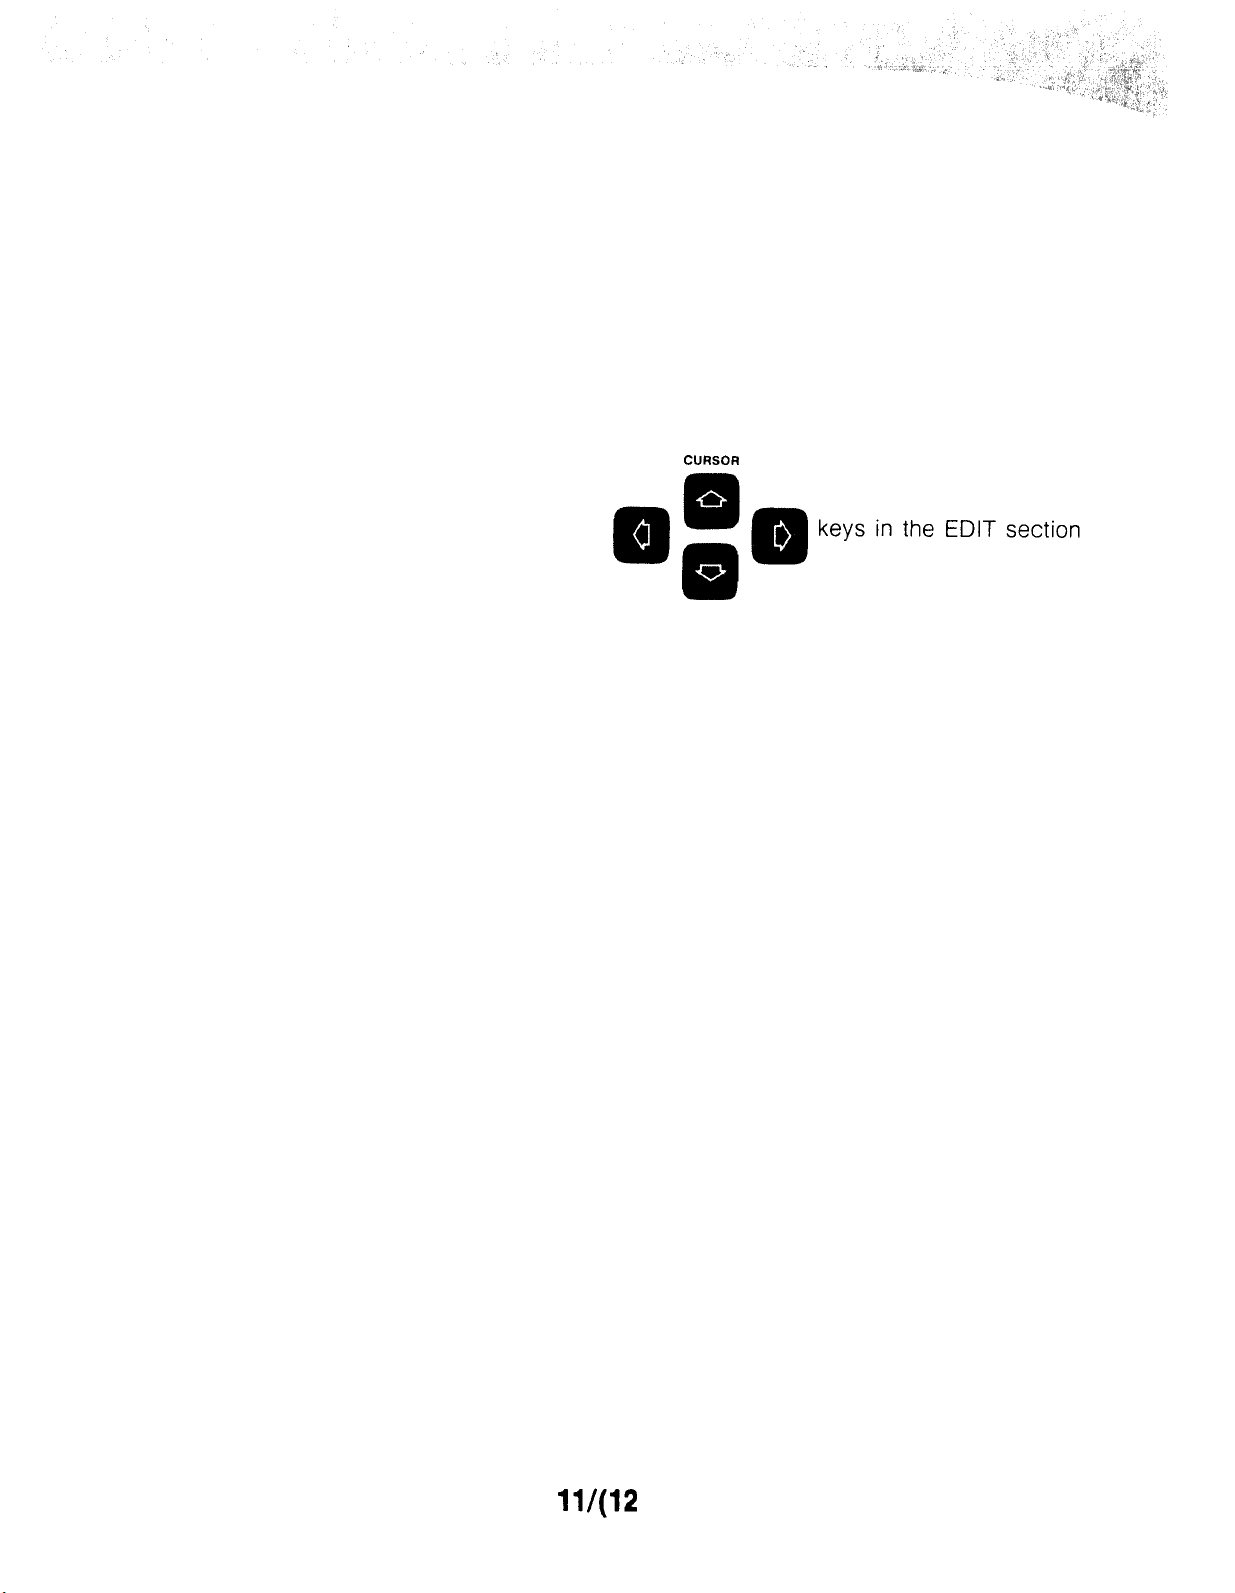
5. The Cursor.
A blinking inverse field one character wide, called the Cursor, indicates the
field in which a selection may be made, or the location where the next
alphanumeric character will be entered. You may reposition the cursor
CUASOR
into the desired field by using the
of the keyboard. The cursor is removed when the 161 OA is operating in any
continuous mode.
6. Menu Display Sections.
Each section of the menu display is given a title describing the data parameter
which it controls. Section titles are positioned along the left margin of the display.
11/(12
blank)
Page 16
Chapter II
OPERATING YOUR 1610A
------- PREPARING FOR OPERATION -------
Naturally, you want to get your 161 OA “on the air” as soon as you can. This chapter
will help you accomplish this. Let’s get started!
1. Connect the Data Pods and the Clock Pod cables under the keyboard as
described in Chapter I.
CAUTION
‘Your 1610A can be damaged if you operate it from a voltage
source different than that for which the internal Voltage
Selector switches are set. These switches are set at the factory
for operation on
different, have qualified service personnel change the Voltage
Selector switches to agree. Probe input limit
2. Plug the 1610A into the primary power source and set the front-rail LINE
switch (see keyboard fold-out) to the ON position. The power indicator light will
come on if power is present and an audible signal will indicate that the 1610A is in
a power-up condition. If you wish to do a Performance Verification procedure, see
Chapter V.
3.
In a few seconds, a display will appear on the CRT and you are ready to start
operation.
110-120 Vat.
If your primary power source is
515
V peak.
13
Page 17
-----mm
1.
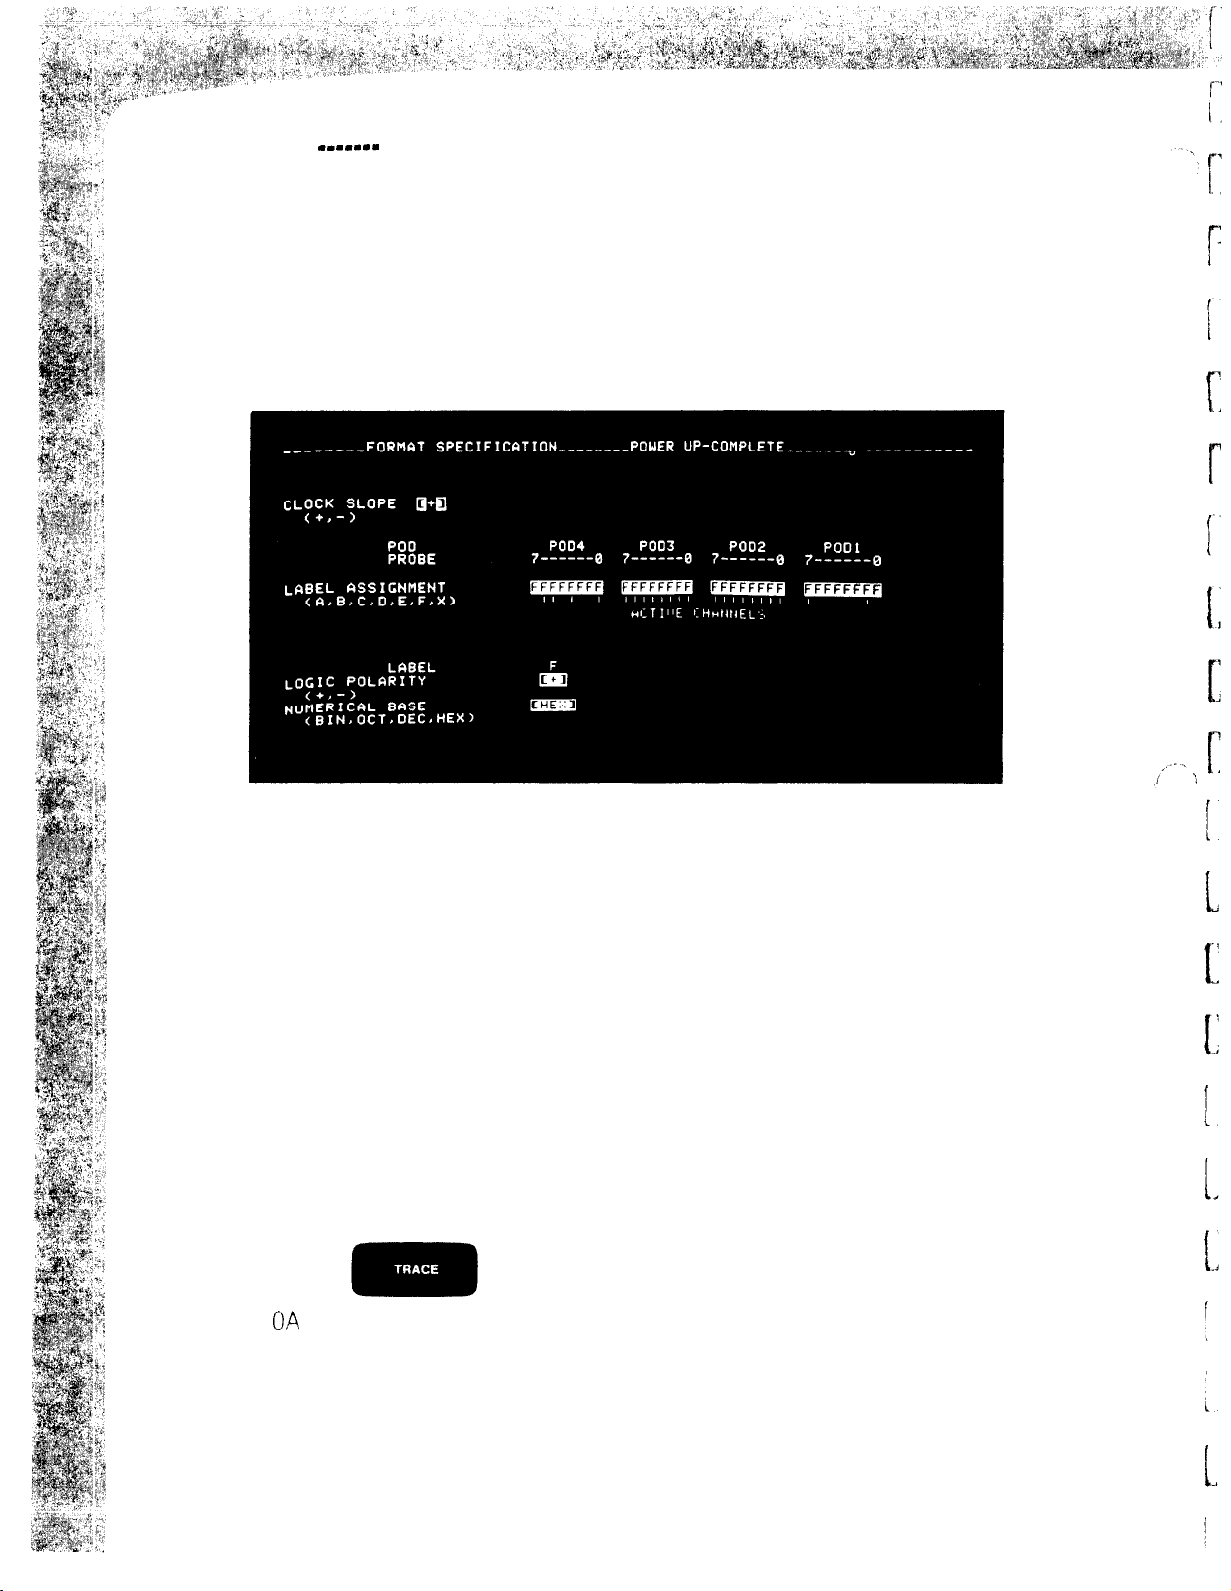
The display immediately seen on power-up is shown below. The first line shows
A QUICK RUN-THROUGH PROCEDURE -------
that this is the FORMAT SPECIFICATION menu, and the machine status shows that
the last operation initiated, Power-up, is complete.
2.
Line two shows a WARNING signal alerting you to a SLOW CLOCK condition.
This message is a good indicator during operation that a clock probe has come loose,
or that the system under test is malfunctioning. See Chapter III for a detailed discussion of the FORMAT SPECIFICATION menu.
3.
Connect probe pod 1 and the clock probe pod to their respective sockets in
the PERFORMANCE VERIFICATION section on the rear panel. These ports provide a
continuous 8-bit count at a 10 MHz rate. Notice that when this is done, the SLOW
CLOCK message disappears.
4. Press the
the 161
CIA
automatically goes to the TRACE LIST menu, and the machine status
key in the EXECUTE section of the keyboard. Notice that
reminds you that the last operation you initiated was TRACE, and the operation is
COMPLETE:.
14
Page 18
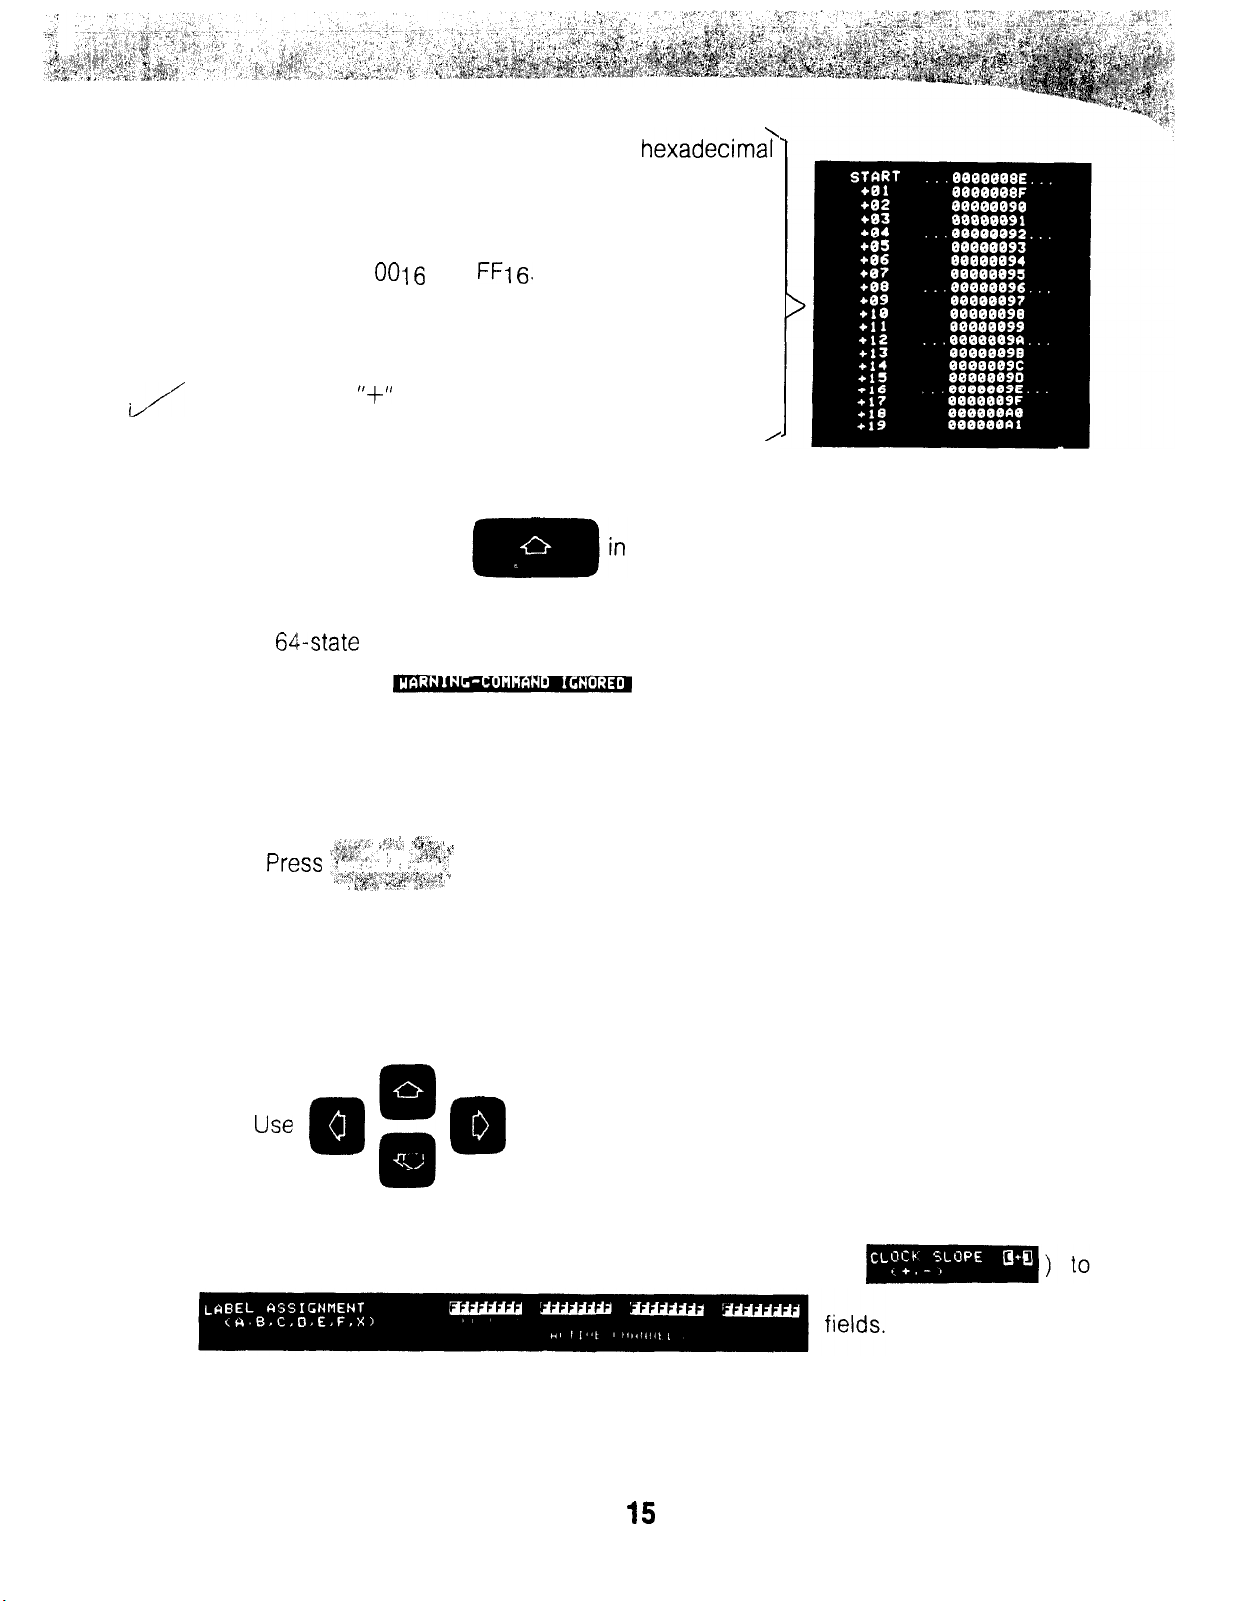
5.
The resulting trace consists of eight hexadecima?
digits representing 32 bits of data. Six of the digits are
constant (data pods not connected) and two bits are
counting from
0016
to
FFt6.
Trace starting point
is also indicated. Each successive line of memory is
numbered with a positive decimal integer for ease of
/
i
reading. The
lows the trace state in positive time.
‘I+”
sign indicates that the state fol-
/
6. Press and hold CURRENT MEASUREMENT DISPLAY
section of the keyboard. The display moves up enabling you to view any part
of the
will sound, and a
64state
memory. When the end of memory is reached, an audible signal
p
message alerts you that an operating limit
has been reached; the display will roll no further. Release the ROLL DISPLAY key and
the message will disappear.
,)< s
7
press yy,s.;,. 1” i ;:.s”?%T
.&&‘i~~ ?$+i’. ,*,r&~~: c
,;q &p ~,p;Amrr&
_ **<“‘* ~& ~~i7L’.’
““u, “<
’ in CURRENT MEASUREMENT DISPLAY section of the
-8 i,
”
keyboard. The format specification menu reappears and allows you to define state
parameters for a more useful display. See Chapter III for detailed discussion of
FORMAT SPECIFICATION menu.
8
use
Q
i
Q
(CURSOR) keys in
the EDIT section of the
(1,
keyboard to move the blinking cursor (now located at
15
Page 19

9 Use the
X
key in ENTRY section of the keyboard to enter “X” in all bit
DcobFJR;T
posrtions
to be entered continuously in each field.
10. Move the cursor to the selectable
Press
1 1. Press key. The TRACE SPECIFICATION menu allows you to
control trace and count measurements. See Chapter III for a detailed discussion of
this menu.
12. The cursor is in
in Pod 2, Pod 3, and Pod 4 columns. Holding the key down causes the “X”
field.
$&!&
II
repeatedly until the field contains
LT.
Press
m
number base.
SF
repeatedly until field reads
i
I-
I
t
13. Move cursor to open field in label F column and enter 0008. Now you
have specified that state
14. Press key in the EDIT section of the keyboard. Another line is now
available for further definition of trace position. Enter
the
16iOA: “Fiecognlze
is requested. When state
second occurrence is centered.” But that’s not all.
0008
state
0008
is to be centered in the trace.
0008
in the added open field
With these few keystrokes, you have told
0008
the first time it appears after trace
is recognized again, initiate a trace in which this
16
execution
Page 20

15. Move the cursor to
them
c OFF jselectable
field and
press FlELD
YLE7
until the field reads
the trace is initiated, the 1610A is to count elapsed time
8-bit count cycle from 0008 to
16. Press the
menu display (see Chapter III for a detailed description) now
shows the second occurrence of 0008 centered in the
trace. Data leading up to this state are designated by
negative line numbers,
have positive numbers (negative and positive time,
tively).
17. Press ROLL DISPLAY
mc
T~lIE I(
Now you have further specified that when
0008.
key. The TRACE
and data following this state
until beginning
LIST
respec-
_I
I
/
of the trace is displayed. The display shows the first
occurrence of 0008 as SEQUENCE. The TIME (in decimal
ABSolute
times are measured from the trace state, it is clear that
the elapsed time from first recognition to second
is 25.6
’ I
time) reads -25.6 microseconds. Since absolute
rc(s.
!
Page 21

‘,
,.
‘:
,,
.:
:, .%l,‘:r.
18. Press
in CURRENT MEASUREMENT DISPLAY section of the keyboard.
The resulting display shows all 64 states in memory. The first state in the trace is at
the extreme left and the last state (state 64) is at the extreme right. Vertical position
is determined by state value with respect to the UPPER LIMIT and LOWER LIMIT
values. Inl:ensified dots indicate the portion of the current valid data displayed when
‘_
!
,$p
shift to the right
you a good idea of operating methods, You begin to recognize the inter-relationships
key is pressed. Press ROLL DISPLAY
and observe intensified dots
N
-s-w--s
NOW
WHA
T?
s-----w
This procedure does not demonstrate all the features of your 161 OA, but it gives
between the keybaord and the displays, or between one display and another. Maybe
this all
Yost
need to start making meaningful measurements in your system. But if you
need more detailed information, Chapter III will give it to you.
18
Page 22

Chapter
III
DETAILED MENU DESCRIPTIONS
-w----w
/NTRODUCT/()N
----m-m
This chapter is intended to help you in two ways:
A quick reminder of the purpose
and content of each menu;
and
A detailed description of each
menu to help solve complex
measurement problems.
To do this, each menu is given a separate fold-out page. A summary of menu capabil-
ities appears first before the page is unfolded. You can glance through these sum-
maries until you find the menu with the capability you need.
When you have located the menu that seems to have what you need, unfold the
page for detailed study. Many illustrations are included to help relate the descriptions
to what you see on the display.
19/(20
blank)
Page 23

Page 24

FORMAT SPECIFICATION
MENU
l
Permits selection of desired Clock Slope.
l
Permits assignment of any of six labels to groups of input lines regardless
of Pod boundaries Unused channels may be turned off.
l
Indicates presence or absence of activity on each input channel.
l
Permits selection of logic polarity to be used in each label group.
l
Permits selection of numerical base to be used in each label group.
Page 25
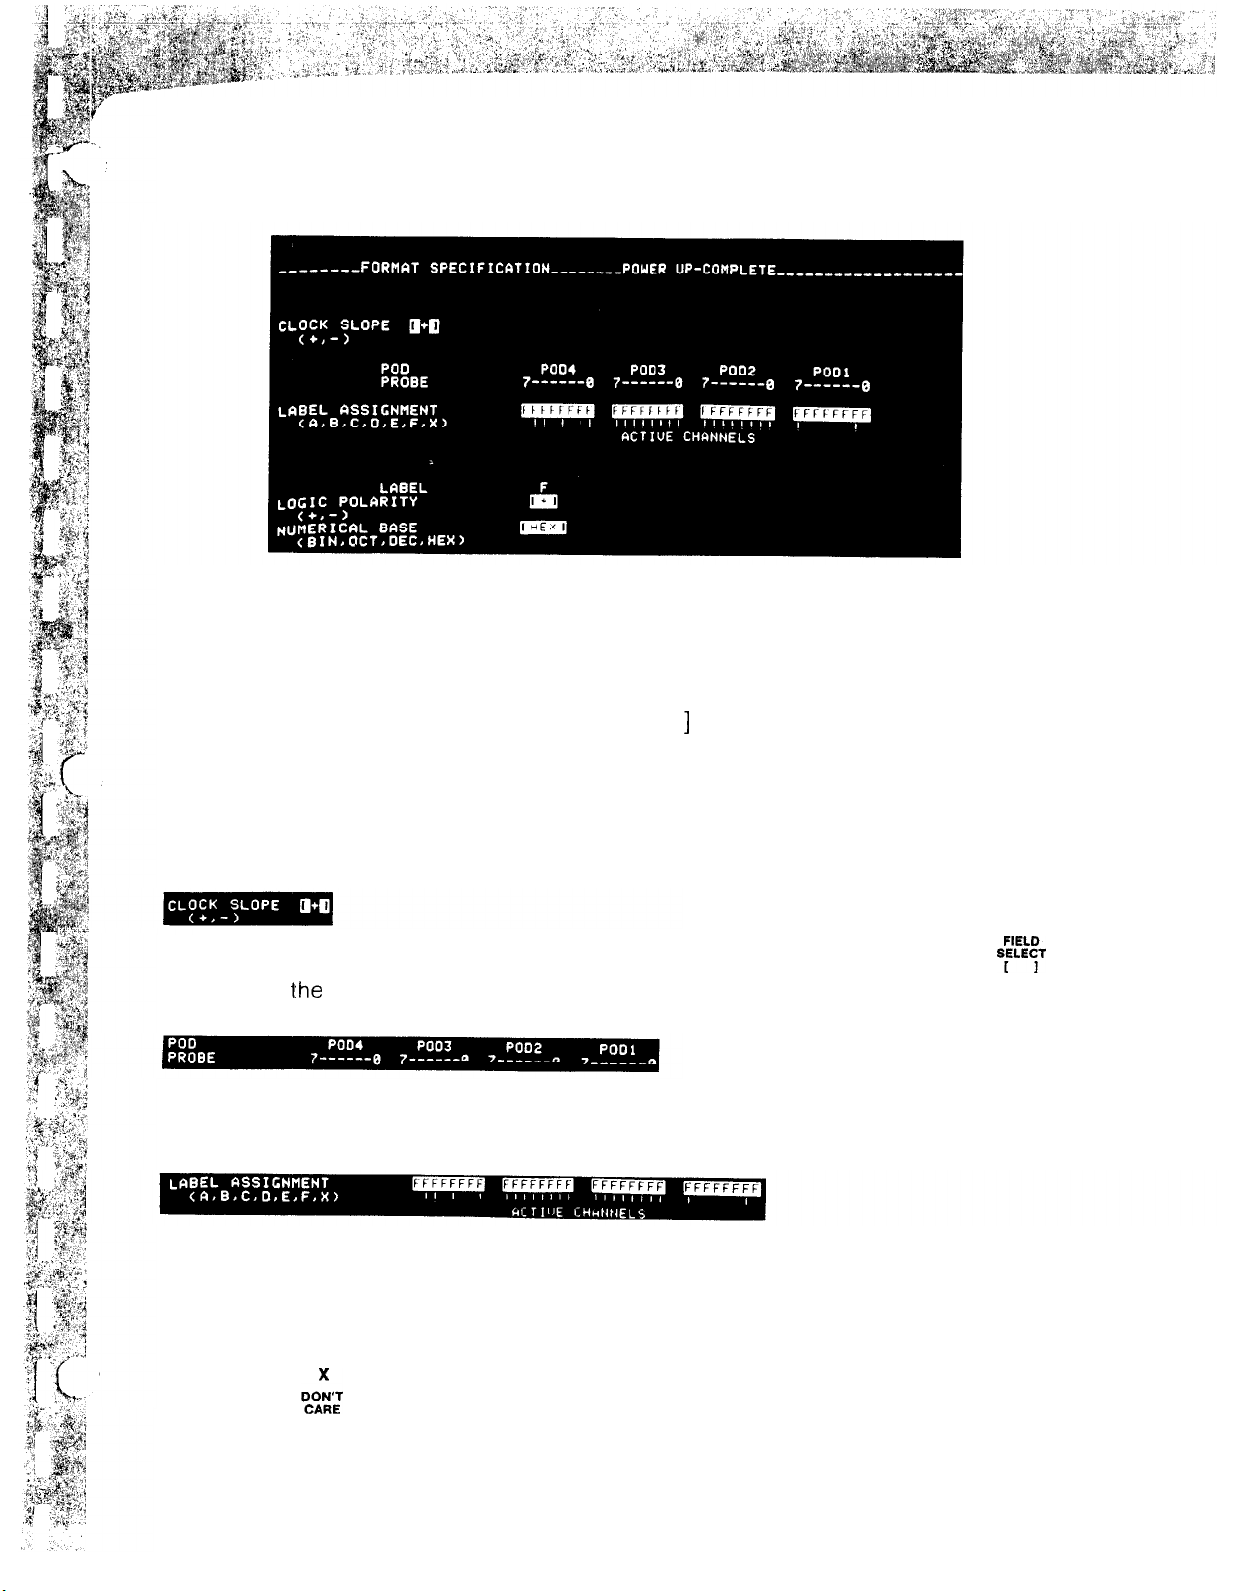
THE FORMAT SPECIFICATION MENU
Headings aligned with the left margin separate the display into sections indicating
the signal parameters controlled by each section; for example, “CLOCK SLOPE”.
]
Any inverse field containing brackets ( [
select from variable field contents.
) indicates that the operator may
Parentheses enclose field content choices available to the operator.
When the blinking cursor is in this field (or any variable field), pressing
changes
Column headings are a fixed part of the display and permit quick identification of
each channel in the label assignment groups.
Entry fields in each pod column allow entry of label designations.
Parentheses enclose labels available for selection by the operator.
Label “X” %iiz
i:he
field variable
turns off channels to which it is assigned.
S/T
One label may be assigned to any number of continuous adjacent channels regard-
Page 26

Labels assigned to non-continuous channels are not allowed.
These are called SPLIT LABELS; e.g.,
In case of a split label,
1-m
appears on line 2 of the display, and an
audible signal alerts the operator. The cursor is locked into the label assignment
field until the split label condition is corrected. No EXECUTE command can be
initiated while a split label condition exists.
The symbol
‘I!”
indicates channel activity at probe line
sampled at a :I ms rate, and each bit that has changed states in
marked with
“I”.
inputs. Inputs are
100 samples will be
Each label assigned in the Label Assignment fields will automatically be entered
in this section.
Logic
polarity
and numerical base may be defined appropriately for each label
i.
group independent of Pod boundaries.
Logic Polarity and Numerical Base field content may be selected from choices shown
in parentheses under each field name.
Field content is changed by positioning the cursor in the desired field and then pressing
the
SE
key.
All FORMAT SPECIFICATION label group parameters are automatically entered in
other menus. The FORMAT SPECIFICATION may be recalled and edited at any time
by pressing
thle
key.
Page 27

TRACE SPECIFICATION
MENU
0
IPositions
a selected state at the [START], [CENTER], or [END] of the trace
measurement.
l
ESstablishes
a state sequence condition which must be satisfied before the
trace measurement is made.
l Restricts the trace measurement to “ONLY STATES” which satisfy the
given state conditions.
l
!Specifies
a count of the occurrences of a given state; or time interval mea-
surement of each state acquired in the data trace.
Page 28
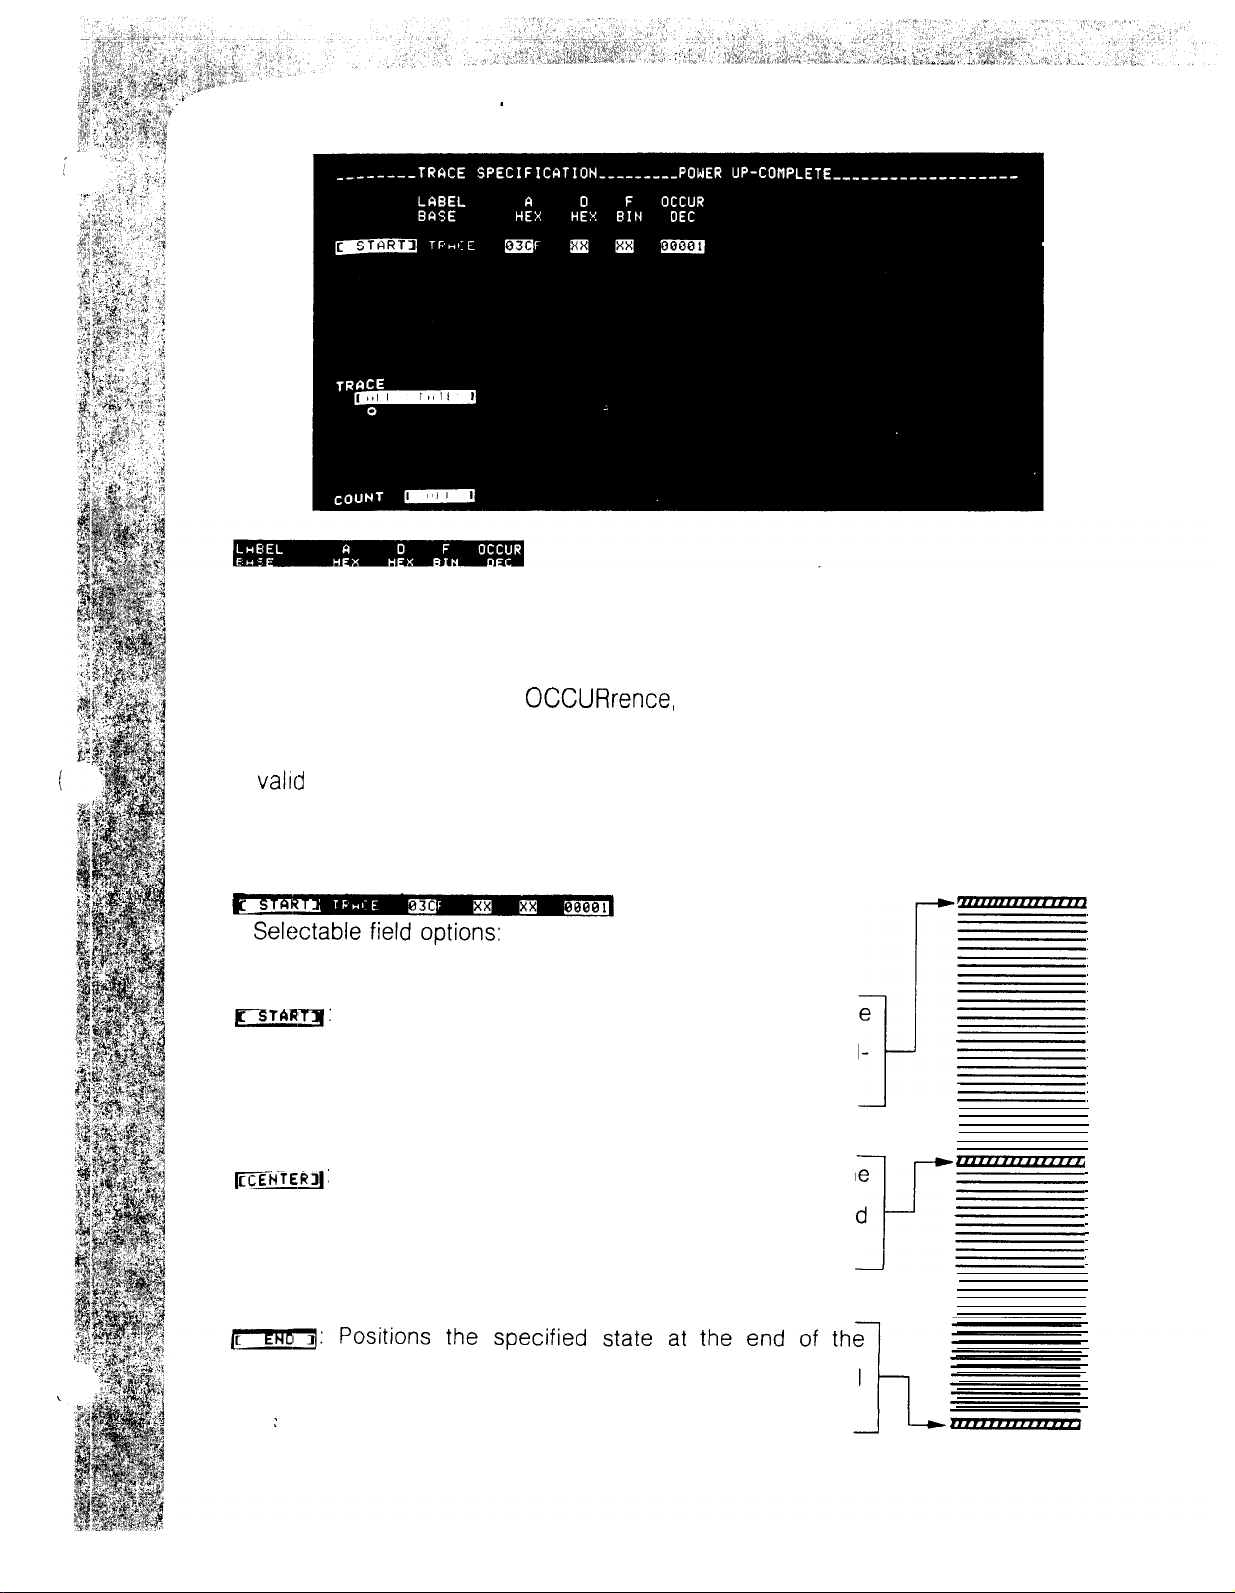
TRACE SPECIFICATION MENU
Each label and its numerical base defined in the FORMAT menu is automatically
entered in the TRACE SPECIFICATION menu.
An additional open field,
notation, the number of times a state must be recognized before it is entered as
valrd
data in memory. NOTE: a 0 in the “units” position is not allowed.
POSITIONING A GIVEN STATE IN THE DATA TRACE
FT~R~:
CENTERED:
Positions the specified state at the start of the
memory; display shows the specified state and 19 following states.
Positions the specified state at the center of the
memory; display shows 9 preceding states, specified
state, and 10 following states.
OCCURrence,
allows the operator to specify, in decimal
IJ-
T--
memory; display shows 19 preceding states and specified
state.
Page 29

Open fields permit entry of alphanumeric information that defines the desired state.
If information is entered in two or more label fields, both states must be recognized
simultaneously to initiate a trace.
Any assigned label may be used to define the trace state.
POSITIONING DATA TRACE IN PROGRAM FLOW
With the cursor located in the [
ditional lines to establish a state sequence of up to seven members.
Each member of a state sequence must be recognized in order (after occurring the
number of times specified in OCCUR field) before it is acquired into memory.
When all members of the state sequence have been recognized in order, the trace
state positions the specified state condition in memory when the trace measurement
is executed.
]
TRACE field, the
(ji,,:,-’
key will insert
_L “-
ad-
When
before the state sequence is satisfied, will restart the entire sequence search. Chapter
IV gives examples of uses.
This section of the display allows the operator to define which state(s) will be traced
into memory after the state sequence is satisfied.
SEC RESE!T
field is ON, you may specify a state which, when recognized
WHAT TO TRACE
Page 30

m
Thts
condition of the selectable field indicates that the 1610A is to trace all states
which occur after completing state sequence conditions.
key has been used to add lines. Desired states can be entered and they instruct
the 161 OA to gather only these states into memory. Additional lines may be entered
using
surement.
Entering a decimal value in the OCCUR column instructs the 161 OA to count
occurrences of each state in the TRACE section simultaneously. When any state
satisfies the count specification, it is gathered into memory and the count is restarted
on all states.
--”
:,*
key so that [ONLY STATES] may be specified in the trace mea-
STATE/TIME COUNTS
With the COUNT field in this condition, the operator may instruct the 1610A to
count occurrences of a specific state in program flow and store resultant count, along
with data, during the measurement.
With the COUNT field in this condition, the 1610A counts time intervals between
states. More information about state and time counts appears in the TRACE LIST
MENU.
mc
With the COUNT field in this condition, internal counters are not displayed.
liFr1(
Page 31

The following illustration specifies the starting addresses of three separate program
blocks which must be recognized sequentially to arrive at the block of program to be
investigated. As the program block of interest is entered at the trace state address,
a trace is initiated. The next 60 states are gathered into memory with the trace state
at the start.
Since each program block may contain many hundreds of program steps, this technique permits the operator to ignore thousands of program steps which are not pertinent to the desired measurement. You have, in effect, an apparent memory depth
which is, for all intents and purposes, limitless.
i
ll-Y--1
--i+
II r
STATE
SEOUENCE
I
I
TRACE
STATE
I
I
WHAT
TO
TRACE
II
Page 32

TRACE LIST
MENU
l Lists in memory all data in program flow and displays data according to
FORMAT and TRACE specifications.
l
Displays count of selected states.
l Displays time interval
Page 33

TRACE LIST MENU
All labels and their respective number bases defined in the FORMAT specification
are automatically entered in the TRACE LIST menu when
Data displayed in each label column shows (in this case)
address,
traced into memory, For example, at line i- 04, address 2899 shows data 96 and
control line condition low.
The dotted lines in the display appear after each four lines for convenience in
data, and control or qualifier line information for each successive state
,,;I
is pressed.
reading the display.
Page 34

DISPLAY WITH STATE COUNT OR TIME COUNT
[REL]:
Shows count value
to previous valid state; i.e.,
five
state counts between
line one and line two. Count
values always expressed in
decimal notation.
[ REL]:
Time interval values shown
are relative to previous time
interval value; i.e., 10
RELative
fls
[ABS]:
Shows absolute count value
with respect to trace state.
Count prefixed with
I,
-”
to show after trace state
or before trace state respectively; i.e.,
counts after trace state.
:ABS]:
Time interval values are shown
with respect to trace state in
terms of
“+18”
‘I-”
(before) or
“+I’
or
means 18
“f”
between first time interval
and next state. Values are
expres:sed
real time.
Pressing
recall current data at any time while examining other menus, until a new trace
measurement IS (executed.
See also TRACE COMPARE MENU or TRACE GRAPH for expanded use of this
,trace
list.
in
,YS,
ms, or s in
recalls data stored in current memory. This makes it possible to
(after) trace state occurrence;
i.e., +l .O ps after the trace
state.
Page 35

TRACEGRAPH
MENU
l Allows the operator to produce a graph of
l Any label assigned in the FORMAT
the data trace.
SPECIFICATION menu can be
graphed.
l Graph may be viewed in single or continuous TRACE.
l
Sel’ectable
upper and lower value limits for graphing.
27/(28
blank)
Page 36

GRAPH MENU
HOW THE GRAPH IS DERIVED
Each dot on the graph represents one state in the trace list.
The position of each dot is plotted on a horizontal coordinate representing the
location of the state in the trace, starting with the first state at the extreme left, and the
last state at the extreme right. The vertical coordinate represents the value of each
state with respect to the pre-selected upper and lower value limits.
Horizontal
Positioning
Dolt
r
State
#l
I
,.
*State
#64
!/I
Page 37
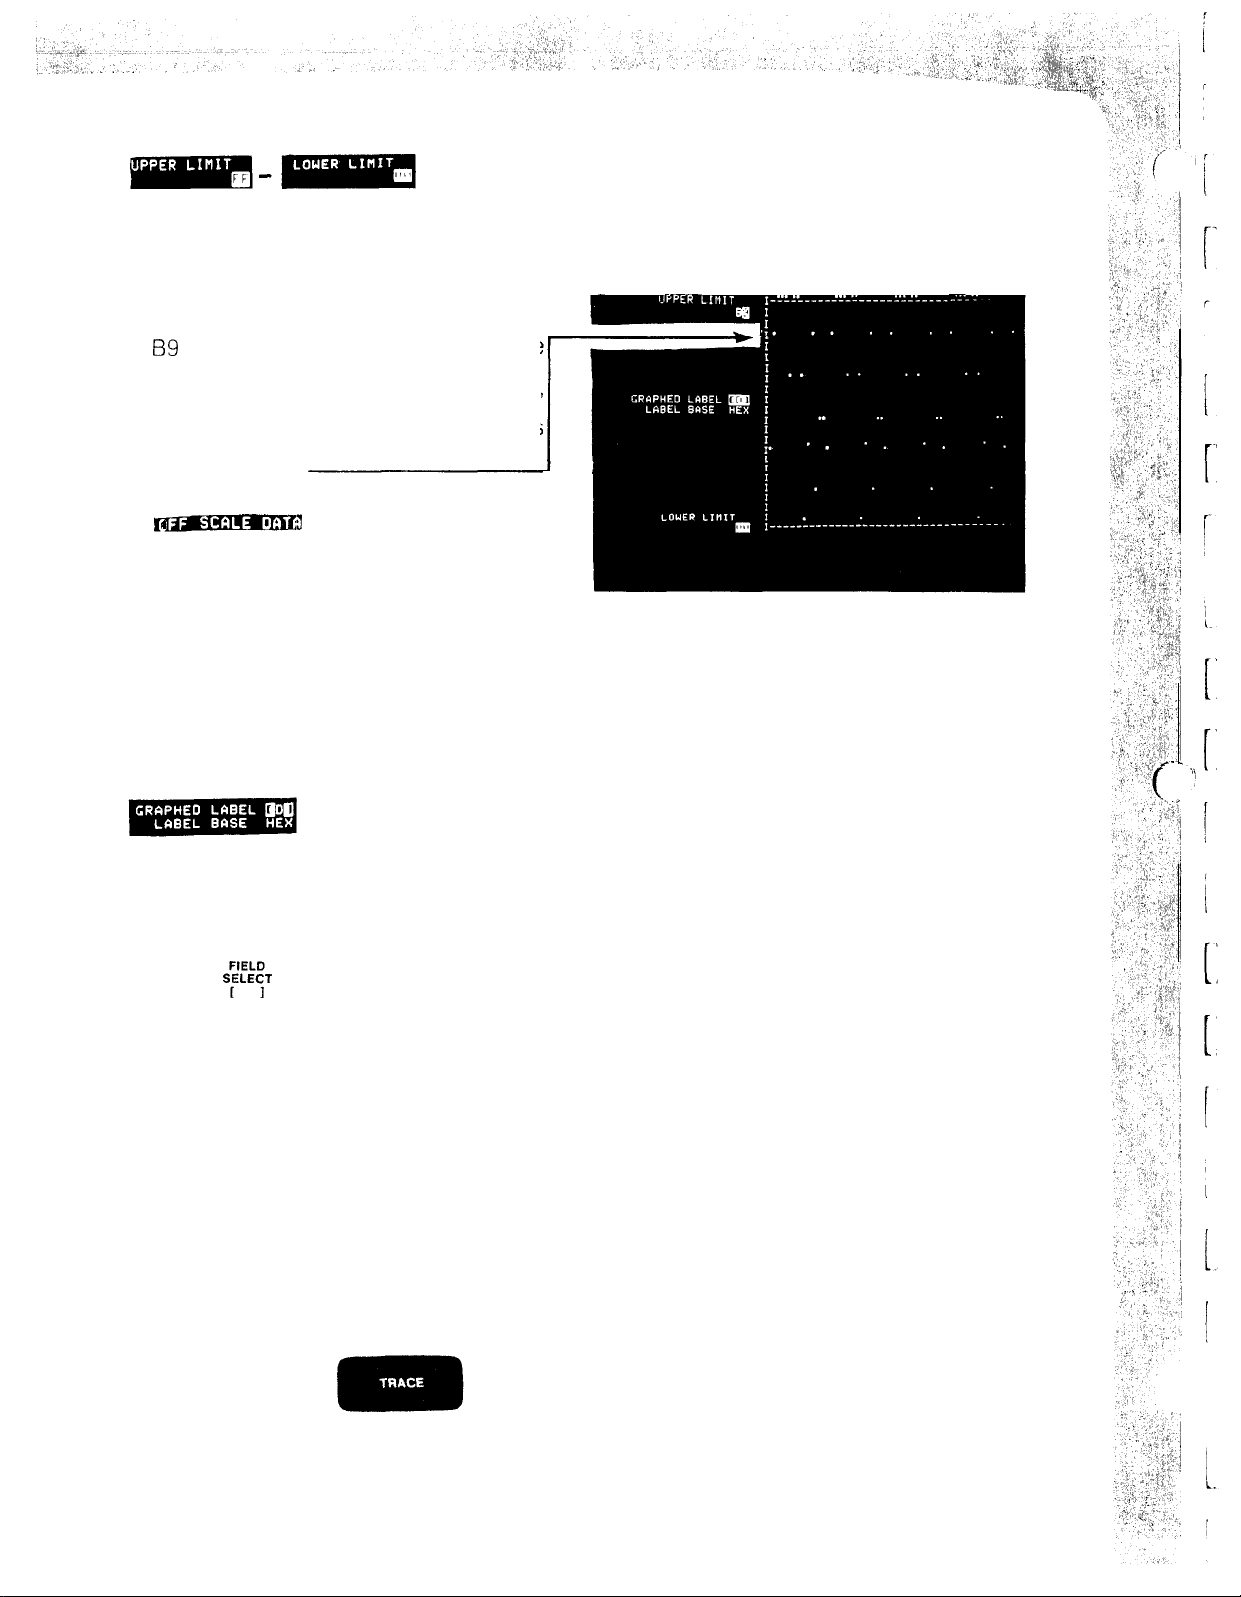
Vertical Dot Positioning
These open fields allow you to enter the value limits you desire within which the
states are to be graphed, e.g.:
Assuming that hexadecimal values
B9
and 00 have been assigned to the
upper and lower limit respectively,
this graph indicates that state 2 has
a value of A5.
-9
8
when one or more state values are
outside the specified value limits as in
the accompanying display.
Appearance of this message does not necessarily indicate a faulty measurement,
it is only the machine reminder to you that some data inputs are not appearing
on the graph.
This portion of the display indicates which label group is currently being graphed.
Any label assigned in the FORMAT specification may be selected for graphing,
Use the
Intensified Dots
5
message will appear
key to select the label you wish.
Intensified dots on the TRACE GRAPH represent the twenty states displayed if
you press the
as the displayed trace shifts. In this way, it is easy to use the ROLL DISPLAY keys to
locate and identify any specific dot of interest and read its actual value in TRACE
LIST.
Dynamic Graph
By pressing the
program flow on the TRACE GRAPH in a continuous TRACE mode.
key. When the trace is rolled, these intensified dots will shift
key and holding it down, you can watch dynamic
Page 38

TRACE COMPARE
MENU
l Permits “EXCLUSIVE
0R”ing
of current measurement data with a stored
standard.
l
Permiits
continuous compare of current measurement data with a known
standard with “Stop if Equal” capability.
l Permit continuous compare of current measurement data with a known
standard with “Stop if Not Equal” capability.
l Permits “Exchange” of current measurement data with stored data for visual
inspection or comparison.
Page 39

A separate rnemory in the 161 OA is provided for storing a known-standard data
trace. This standard may be derived from the trace list by pressing the
key in the EXECUTE portion of the keyboard. This key causes current measurement
data to be
Pressing the key in the CURRENT MEASUREMENT DISPLAY section of
the keyboard places the 161 OA in TRACE COMPARE mode and allows the operator
a choice of three types of comparison.
With the selectable field in this condition, pressing causes an
“EXCLUSI\/E
All states In current measurement data which are the same as corresponding states
in the stored trace are displayed as all zero’s Non-zero states differ from their
correspondrng
stlored
in the “compare” memory,
OR” comparison of current measurement data with the stored trace.
states as shown in the display.
Page 40

In
this
condition, pressing
current measurement data is equal to the stored trace. While the measurement is
in process, the instrument status message will flash “IN PROCESS” and “FAILED”
until the specification is met. At that time, an audible signal is sounded, and the
instrument stops showing a status message that reads “COMPLETE”.
is pressed, it initiates an action similar to the preceding except
that inequality between current measurement data and stored valid data is being
sought. When an inequality occurs, the instrument stops and displays a trace show-
ing where the inequality is located.
initiates a trace that continues until
NOTE
When a compared trace is in process, the blinking cursor
disappears from the selectable field; this field cannot be
changed until the search is completed or stopped.
NOTE
The selectable field must be returned to the “OFF” condi-
tion to obtain single or continuous trace operation.
This key enables the operator to exchange current valid data with a display of
stored data. Neither memory is lost unless a new trace is initiated, at which time
current measurement data in the memory is replaced.
Page 41

Chapter IV
------- POSITIONING THE TRACE WINDOW IN DATA FLOW -------
,’
Introduction
Most data programs are written in blocks, some containing loops, some containing
branches, and some containing jumps so that there is no real “continuity” of program
steps; each one may cover thousands of program steps. It can be an extremely
time-
consuming process to look backward in program flow to find a point of error.
The unique triggering capabilities of the
1610A
make it possible to open a trace
“window” on a specific location in program with pinpoint accuracy.
In the examples that follow, you will see how these triggering capabilities can be
*
,”
:
’
.,
1*
f:
used to eliminate the need for examining hundreds of program steps which do not
bear on the problem you are trying to solve.
$9
! ’
31
Page 42

EXAMPLE 1: SIMPLE SINGLE-STATE TRACE
Trace Specification
EXAMPLE 2: SINGLE-STATE TRACE WITH DELAY
States in
Display
03CF
and
next
states
Data
Flow
-?
1,
P
r
States in
Trace Specification
This technique locates the trace window in a desired block of program and con-
centrates on only that portion of the block of current interest.
Display
03CF
03E4
and
next
62
-- --
Data
Flow
--
m
-
i
32
Page 43

EXAMPLE 3: TRACING SPECIFIC DATA PATH IN A BRANCHING PROGRAM
Frequently, activity in a given program location depends on which one of several
program branches was followed to arrive at that location.
I
I
c
-.
8378
PATH
A
-l
I
, PATH
I
B
,j
/’
/’
/’
In the example given here, program address
is reached by Path A
(0378403E4).
from
03E4
is traced only when Path A is followed,
To ensure that program activity
(03CF-+03E4)
or Path B
03E4
a state recognition sequence must be set up in the
Trace Specification.
By specifying that the 161 OA must first recognize
state
lected at
03CF,
you are certain that when data is col-
03E4
Path A has been followed. If the
program flow branches through 0378, the Trace
Specification cannot be satisfied, and no data will
be gathered into memory.
33
Page 44

EXAMPLE 4: TRACING A
SPECIFIC PATH IN A MULTIPLE-BRANCH PROGRAM
More
sequential program flow
capability.
It is possible to trace program activity starting at address 286F after the
grarn has followed Path #2 by setting a Trace Specification like this:
clomplex
levels of
network branching are commonly encountered. Analyzing
in this example requires high-level sequential trigger
pro-
34
Page 45
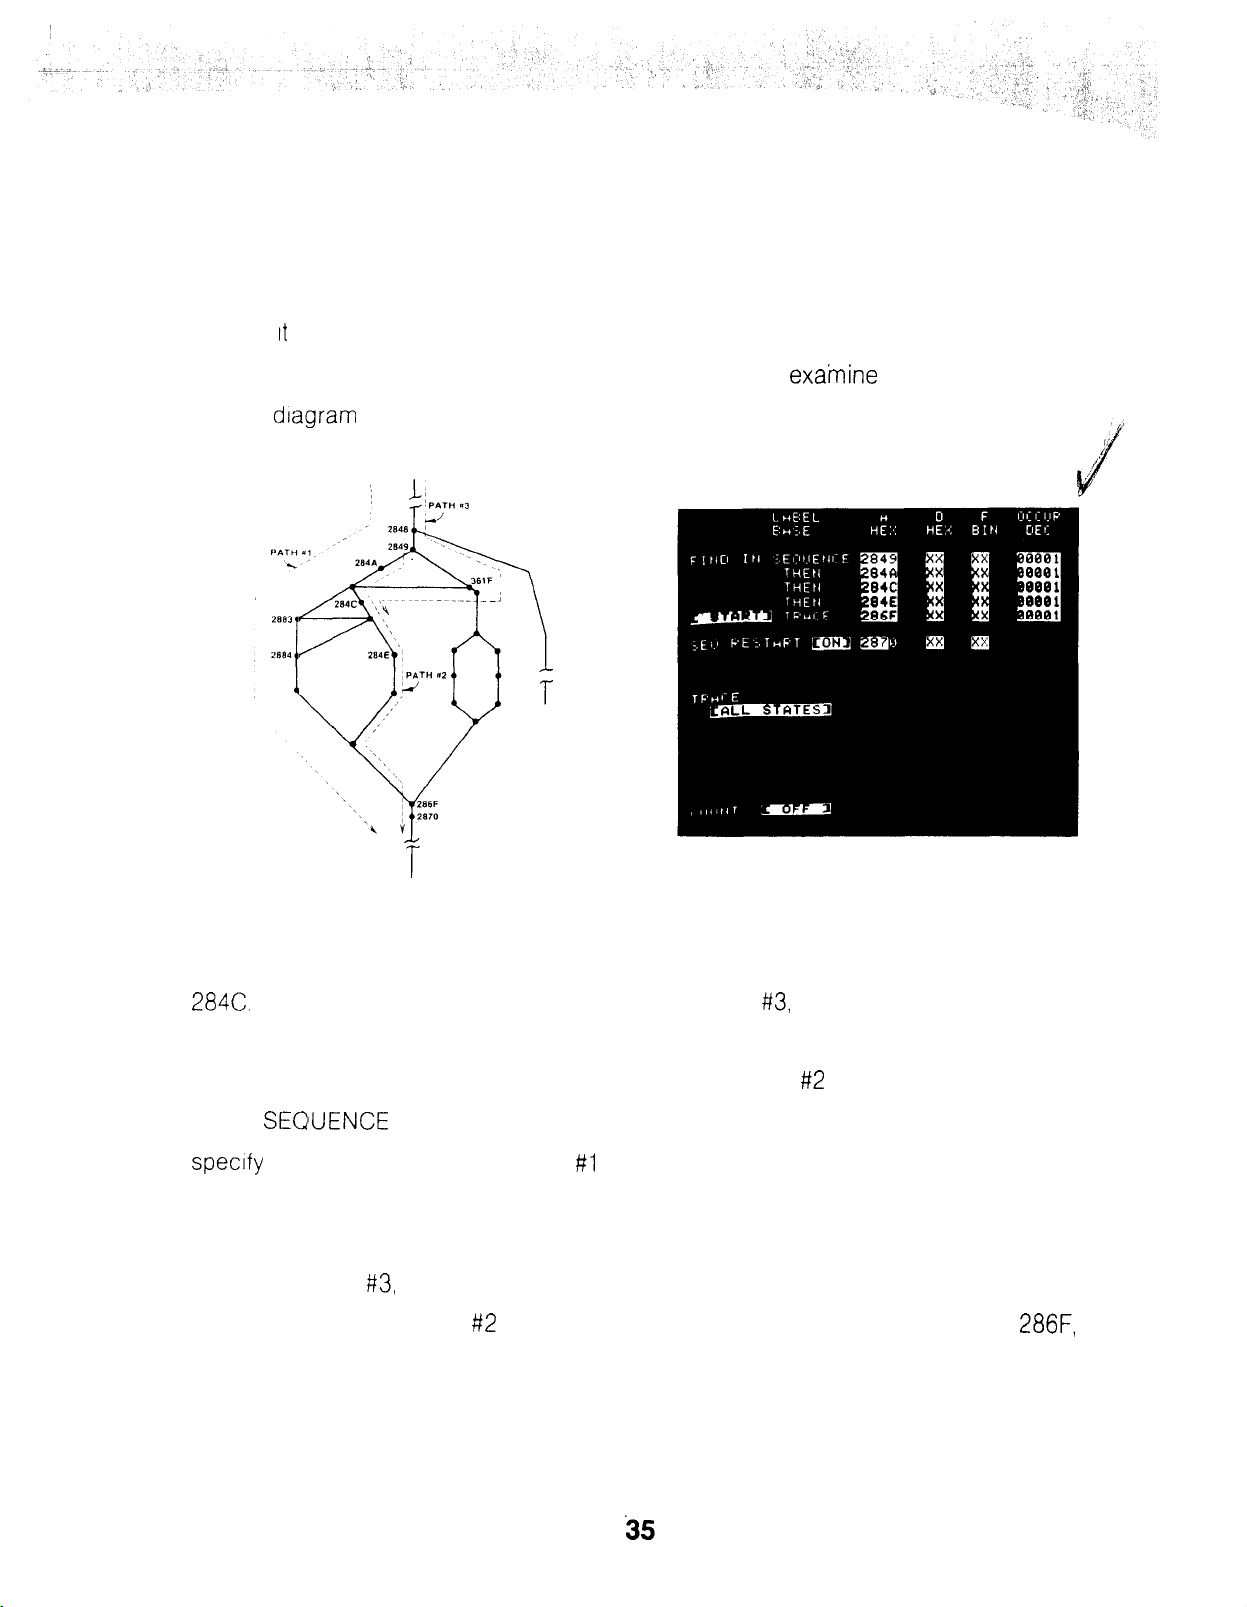
EXAMPLE 5: MULTIPLE-BRANCH PATH COMPLETED IN A SINGLE PASS
Often tt is necessary not only to follow a specific path, but also to analyze program
flow only if the path was completed in one pass. To
use the
diagram
and Trace Specification of Example 5.
exa’mine
this task, we can
Specified this way, the program can satisfy sequence states 2849 and 284A and
then exit the network at 286F leaving the 161 OA looking for the next occurrence of
2846.
The program can reenter the network via Path
#3,
satisfy the remaining con-
ditions vra 361 F, and the 1610A will capture data beginning at 286F. However,
the captured data will be erroneous with regard to a Path #2 branch.
Set
specify
SECUENCE
state 2870. Now, when Path #l is followed 2849 and 284A are satisfied, but
RESTART in the Trace Specification to the ON condition and
if the network is exited at 2870, the sequence search is restarted because a restart
state was recognized before all sequence states were satisfied. If the network is
entered by Path
Only by following Path #2 is it possible to acquire data at exit address
#3,
the sequence search is restarted again for the same reason.
286F,
because only this path satisfies all sequence conditions before the restart state is
recognized.
Page 46

EXAMPLE 6: TRACING A DIRECT JUMP IN A MULTIPLE-BRANCH PROGRAM
,-
PATH I
a1
i
j PATH
a3
Three common forms of program paths appear in this program flow diagram:
Path #l is a path whose length depends on the operation being performed on a
given pass;
Path #3 is a fixed-length path because the same operation is performed each time
this path is used;
Path #2 is a zero-length, or direct jump, path.
Defining a trace on Path #l or #3 is easy using the sequential state trace specifi-
cation
However the zero-length Path #2 is not reliably defined
this way because either of the other two paths satisfy the specification.
The solution is to use the SEQUENCE RESTART function to specify the desired path:
When state 2849 is recognized, the 1610A will examine the restart condition. If
I
either Path #l or Path #3 is followed, a state after 2849, other than
287C,
is found,
the restart condition (XXXX) is satisfied, and the sequence search is restarted.
A trace is captured only when 2849 is recognized immediately followed by 2876.
36
Page 47

EXAMPLE 7: TRACING PROGRAM FLOW IN NESTED LOOPS
The 1610A is capable of examining program activity when it is working in the
Nth pass of a sub-minor loop. The three-level loop in this diagram has a major loop
that iterates 17 times, a minor loop (J) that iterates 11 times for each occurrence of
the I loop, and a sub-minor loop (K) that iterates 13 times for each occurrence of
the J loop and 143 times for each occurrence of the I loop.
f-3
28AE ---
(I)
Using the trace specification shown above you can direct the 1610A to acquire
data at state 2841 only when the program is in the 9th pass of the I loop, the 8th
pass of the J loop, and the 7th pass of the K loop.
Notice that 2887 is to be recognized first. This ensures that when you start the
measurement, the
1610A
does not start in the middle of the loop and cause an
erroneous count.
37
Page 48

r
This capability is also helpful while developing a program. Once the program is
i
written, it
is,
run to verify completion of the desired task. Sometimes the task is
eventually completed with non-desired tasks completed in addition. An example is
this nested loop. To verify that the program actually completed only the specified
number of loops, count the number of occurrences of state 2840 and compare with
what was programmed to happen:
2940
2941 K
----_--
28A5
J LOOP (11)
---------
28AE
2007
P
Loop
(13)
I LOOP (17)
TRACE 7th PASS OF K
TRACE 9th PASS OF J
TRACE 9th PASS OF I
J x
-!9x11x13=1287
8x13= 104
7=
7
X=1398
An ABSOLUTE state count will show that 1398 occurrences of state 2840 were actually
counted, and that this section of program is performing as desired.
i
38
Page 49

Chapter V
PERFORMANCE VERIFICATION
s-m---- /NTRODUCT/ON
Intricate and complex measurements made on the system you are investigating
require that you have complete confidence in the performance accuracy of your 161 OA.
To inspire this confidence, a performance verification program is built into each
161 OA. You may call up this program at any time, and by following the simple instructions
in each test display, assure yourself of accurate measurement performance by your
161 OA.
You have complete control over the flow of the tests and proceed from one test
to the next only when you are satisfied that the current test is satisfactorily
completed.
If
your 161 OA is interfaced to an HP 9866A Printer, a print-out result of each test
(except GRAPH) can be made.
-------
-‘------ INITIATlON
With 161 OA power OFF, connect the clock pod and any one data pod, say POD
to
Its
respective socket in the PERFORMANCE
panel.
OF PERFORMANCE VERIFICATION -------
VERFICATION
section of the rear
39
1,
Page 50

Turn on 161 OA power and press the START pushbutton on the rear panel. Internal
ROM and RAM tests are performed and verified then the next test is displayed. Each
test display is described on the following pages.
DISPLAY TEST
40
Page 51

Display Interpretation
As with all displays, line one shows the name of the display, and the instrument
status with respect to that test.
Beginfling
initiate each action. The
select the next test.
You can verify that various brightness levels are used and provide necessary con-
trast in the display.
Each character in the 161 OA repertoire is printed for verification that none are
missing
The blinking cursor appears in the lower right hand corner to ensure you that it
is operating properly.
Press
on line 3, you are given a choice of actions and the keys to press to
key will re-run the test. The
,,;I
SE
and go on to the next test when you are satisfied.
p+
key will
KEYBOARD TESTKEYBOARD TEST
This test determines whether keys decode properly when manipulated.
The operator is required to press each key on the keyboard in no particular sequence
except that
SF!
must be the last key pressed to validate the test.
41
Page 52

!
”
,#,,I
.,
_.
‘.
,.
i
‘,
LAST CODE indicates which key was pressed last by displaying the code for that
key. On the fold-out keyboard photograph, key codes for this test are shown in
parentheses near the key to which they apply.
MISSING CODE indicates keys that must still be pressed to obtain a complete test,
This
test cannot be regenerated by pressing
TRACE TEST
i
I‘
i.
Unplug the CLOCK and DATA pods from the rear panel.
In the first line, notice the legend: ---POD-4321 C-T--. This legend indicates that no
pods are connected to the rear panel, and the COUNT
Plug in CLOCK pod and press
that the
(CLOCK
pod is connected and also that the
m
The
1
TME
function is inoperative.
C-T-
-
will disappear to indicate
COUNT TIME function is
operating.
Piug in the DATA pod and press
then
m
The respective
pod number will disappear from the legend to indicate that this pod is connected and
operating
Repeat ‘with each data pod to verify correct operation.
Because only one date probe can be connected at a time, and each time the
button is pressed, the test verification on line 1 will show FAILED.
m
However, the procedure described above is verification of the proper operation of
i.
1,
each probe.
42
Page 53

INTERRUPT TEST
This test enables the internal Interrupt Request
that an interrupt is being received and processed by the internal microprocessor,
Pressing
Press
e
,,:d
to advance to the next test.
will cause this test to be run continuously.
halts the continuous run and readies the instrument for the
PRINTER TEST
(IRQ)
line and the test verifies
This is the final test in the PERFORMANCE VERIFICATION routine and is valid
only if your 161 OA is interfaced with an HP Model 9866A Printer.
Each time this test is initiated and completed, the printer will print the line of
characters shown at the bottom of the display.
Comloarison
accuracy of the PRINT operation.
Upon completion of this test, pressing
and returns control to the operating system via the power-up routine.
of the printed line with the character line on the display will verify
s
terminates performance verification
43/(44
blank)
Page 54

Appendix A
GLOSSARY
ABSOLUTE (STATE-TIME):
A state count or time interval measurement in which each entry is in terms with
respect to the trace state.
CLOCK
SILOPE:
I’+”
indicates that data acquisition is initiated on the positive-going portion of the
clock pulse ( 1
!,
-”
indicates that data acquisition is initiated on the negative-going portion of
the clock pulse ( 1
).
).
CONTINUOUS TRACE:
A condition under which a measurement is traced continuously in accordance
with specified limits. Memory is continuously filled with new data.
FIELD (OPEN):
An entry field in a menu whose content is made up of alphanumeric characters
from the ENTRY section of the keyboard.
FIELD (SELECTABLE):
A menu field containing brackets ([
variables. Operator selection of field content is by use of
portron
of
,the
keyboard.
1)
whose content is limited by preset
SF&
key in the ENTRY
1
LABEL:
An arbitrary character (A, B, C, D, E, or F) assigned to a group of adjacent input
lines, regardless of pod boundaries, for ease of identification and display interpretation.
LOGIC POLARITY:
In positive logic polarity
logic
polarity,,an
input high = 0, an input low =
(+),
an input high level = 1, an input low = 0. In negative
1.
MEMORY:
Consists of 64 states gathered at the input lines in accordance with the
operator-
specified parameters and conditions.
A-l
Page 55

GLOSSARY (Cont’d)
MENU:
A display on the CRT in which the operator has many choices among input signal
paramleters,
TRACE:
[RELIATIVE:
A state count or time interval measurement in which each entry is relative to the
state definition, etc. May also be a simple trace display such as
LIST.
(COUNT-TIME):
preceding valid entry.
STATE:
The logic condition at all valid probe inputs at a given clock transition.
STATE SEQUENCE:
A defined series of states which must be recognized in a given order before
becoming valid memory transactions. A valid data trace can be enabled only after
the state sequence is satisfied.
TRACE:
The
6,4
valid states gathered into memory under the constraints defined in the
trace specifications. These states may or may not be consecutive depending upon
selected specifications.
TRACE STATE:
The defined state which is positioned in the trace; i.e., the trace which is at the
[START], [CENTER], or [END] of the trace.
TRACE WINDOW:
The twenty valid states in memory that are viewed on the CRT.
CURRENT MEASUREMENT DATA:
When :a measurement trace is executed, 64 valid states are gathered into inter-
nal memory and constitute current measurement data. This valid current data will re-
main in memory, and can be recalled with the
‘, I..*
key, until the next measurement
trace is executed, or until it is exchanged into an internal store memroy.
A-2
i
Page 56

Appendix B
MESSAGES
ERROR MESSAGES
-------
INVALID ENTRY:
Check for incorrect number base; unallowed entry at this cursor position.
OVERLAPPING LIMITS:
Check TRACE GRAPH upper and lower limits.
UNASSIGNED LABLE:
Refer to FORMAT SPECIFICATION for correct
USE FIELD SELECT KEY:
Alphanumeric keys do not change a multiple-choice field.
(Machine
------- (Alerts operator that entry Is -------
Response to Unacceptable Entry) -------
lable.
WARNING MESSAGES
Incorrect In present form)
COMMAND IGNORED:
Command has reached an execution limit; command does not apply.
GRAPH NOT PRINTABLE:
TRACE GRAPH not reproducible on HP
SLOW CLOCK:
System clock is not operating, or is operating at less than approximately 10 Hz.
The 161 OA still runs and measurements are valid but may be very slow. This
message simply alerts the operator.
9866A/B
Line Printer.
B-1
Page 57

SPLIT LABEL:
Appendix B (Cont’d)
Assilgned
AAABBAA.
until corrected.
Message also appears while changing labels, but disappears when label assign-
ment conditions are satisfied.
UNALLOWED VALUE:
Magnitude of specified value exceeds size of octal or hex label field assignment;
or OCCUR value of zero not allowed; or a decimal field has mixture of digits and
X’s. Cursor locked to field until corrected.
8-LINE TRACE SPECIFICATION LIMIT:
Lines added to state sequence and states-to-be-traced must not exceed a
combined total of eight.
label must have continuous bit assignment, e.g., AAAABBBB not
Split label condition locks cursor in LABEL ASSIGNMENT
------- 0
THE!?
MESSAGES -------
field
$
MEANS X’S NOT DISPLAYABLE IN SELECTED BASE:
Digit(s) cannot be displayed in selected base; or, if a decimal field, the total
field must be all digits or all
OFF SCALE DATA:
At least one data point on the TRACE GRAPH is not within range of graph limits.
If data point is above upper graph line, its value magnitude exceeds the upper
limit. If data point is below lower graph line, its value magnitude is less than
the lower limit.
SEQUENCE RESTARTED:
Sequence restart state recognition before state sequence is satisfied causes
compllete
sequence search to be restarted.
X’s,
B-2
Page 58

CURRENT MEASUREMENT
,,_
DISPLAY
,
.,in
,.
w
ENTRY
,-
:
.,
(I)
FIELD
SELECT
1
I
D E F
fW
IE)
(F)
(4
EDIT
<
i=)
GRAPH LIMITS
DEFAULT
f-1.
EXECUTE
STORE
CVRRENTMEASUREMENT
A B C
I-)
IA) 18)
IC)
(J)
W
ROLL DISPLAY
U-J
X
DON’T
CARE
7 8 9
(7)
(0
(9)
(7) (3
CURSOR
CT)
\
 Loading...