

Page 1

User Manual for
Profibus DP
HE800PBM650/HEPBM650 &
HE800PBS600/HEPBS600
Master and Slave SmartStack Modules
PAGE 1 of 97
EO 09-0009
Page 2

Preface MAN0575-04-EN
Profibus Modules User Manual
PREFACE
Copyright © 2001 Horner APG, LLC. 640 North Sherman Drive, Indianapolis, Indiana 46201-3899. All
rights reserved. No part of this publication may be reproduced, transmitted, transcribed, stored in a
retrieval system, or translated into any language or computer language, in any form by any means,
electronic, mechanical, magnetic, optical, chemical, manual or otherwise, without the prior agreement
and written permission of Horner APG, LLC.
Information in this document is subject to change without notice and does not represent a
commitment on the part of Horner APG, LLC.
Windows 95, Windows 98, Windows NT, windows 2000 and XP are registered
trademarks of Microsoft Corporation.
DeviceNet is a trademark of Open DeviceNet Vendors Association (ODVA).
Profibus is a trademark of Siemens.
Cscape, CsCAN, and SmartStack are trademarks of Horner APG, LLC.
For user manual updates and technical support contact:
Horner APG
Technical Support (317) 916-4274 Technical Support +353-21-4321266
Web site www.horner-apg.com. Web-site www.horner-apg.com
(USA) Horner APG (Europe)
LIMITED WARRANTY AND LIMITATION OF LIABILITY
Horner APG, LLC. ("HE-APG") warrants to the original purchaser that the Operator Station manufactured by HE is free from
defects in material and workmanship under normal use and service. The obligation of HE-APG under this warranty shall be
limited to the repair or exchange of any part or parts which may prove defective under normal use and service within two (2)
years from the date of manufacture or eighteen (18) months from the date of installation by the original purchaser whichever
occurs first, such defect to be disclosed to the satisfaction of HE-APG after examination by HE-APG of the allegedly defective
part or parts. THIS WARRANTY IS EXPRESSLY IN LIEU OF ALL OTHER WARRANTIES EXPRESSED OR IMPLIED
INCLUDING THE WARRANTIES OF MERCHANTABILITY AND FITNESS FOR USE AND OF ALL OTHER OBLIGATIONS OR
LIABILITIES AND HE-APG NEITHER ASSUMES, NOR AUTHORIZES ANY OTHER PERSON TO ASSUME FOR HE-APG,
ANY OTHER LIABILITY IN CONNECTION WITH THE SALE OF THE Operator Station. THIS WARRANTY SHALL NOT
APPLY TO THE Operator Station OR ANY PART THEREOF, WHICH HAS BEEN SUBJECT TO ACCIDENT, NEGLIGENCE,
ALTERATION, ABUSE, OR MISUSE. HE MAKES NO WARRANTY WHATSOEVER IN RESPECT TO ACCESSORIES OR
PARTS NOT SUPPLIED BY HE. THE TERM "ORIGINAL PURCHASER", AS USED IN THIS WARRANTY, SHALL BE
DEEMED TO MEAN THAT PERSON FOR WHOM THE Operator Station IS ORIGINALLY INSTALLED. THIS WARRANTY
SHALL APPLY ONLY WITHIN THE BOUNDARIES OF THE CONTINENTAL UNITED STATES.
In no event, whether as a result of breach of contract, warranty, tort (including negligence) or otherwise, shall HE-APG or its
suppliers be liable of any special, consequential, incidental or penal damages including, but not limited to, loss of profit or
revenues, loss of use of the products or any associated equipment, damage to associated equipment, cost of capital, cost of
substitute products, facilities, services or replacement power, down time costs, or claims of original purchaser's customers for
such damages.
PAGE 2 of 97
© Horner APG.This drawing is the property of Horner APG. And shall not be disclosed or reproduced except as specifically authorised.
EO 09-0009
Page 3

Preface MAN0575-04-EN
Profibus Modules User Manual
List of Revisions
Index Date Version Chapter Revision
20-Feb-03 01 All Initial release.
9-Nov-04 02 All Rev. 2
16-Oct-06 03 All Added Cscape configuration section 3.2
10-Jun-09 04 Added Interface details.
PAGE 3 of 97
© Horner APG.This drawing is the property of Horner APG. And shall not be disclosed or reproduced except as specifically authorised.
EO 09-0009
Page 4

Preface MAN0575-04-EN
Profibus Modules User Manual
TABLE OF CONTENTS
PREFACE ..................................................................................................................................................... 2
LIMITED WARRANTY AND LIMITATION OF LIABILITY ............................................................................. 2
CHAPTER 1: INTRODUCTION .................................................................................................................... 6
1.1 Scope ........................................................................................................................................... 6
1.2 Introduction ................................................................................................................................... 6
1.3 Installing and Removing a SmartStack Module ........................................................................... 7
1.4 Main Functions ............................................................................................................................. 8
CHAPTER 2: SOFTWARE INSTALLATION INSTRUCTIONS ..................................................................... 9
2.1 System Requirements .................................................................................................................. 9
2.2 System Installation ....................................................................................................................... 9
CHAPTER 3: GETTING STARTED – CSCAPE CONFIGURATION .......................................................... 11
3.1 Scope ......................................................................................................................................... 11
3.2 Configuring Cscape. ................................................................................................................... 11
3.3 Configuration of a SmartStack Profibus DP Master to any Profibus DP Slave ......................... 15
3.4 Configuration of a SmartStack Profibus DP Slave to any Profibus DP Master ......................... 16
3.5 Configuration of a SmartStack DPV1 Master to any DPV1 Slave ............................................. 17
3.6 Configuration a SmartStack Profibus DPV1 Slave to any Profibus DPV1 Master ..................... 18
3.7 Verifying a Project ...................................................................................................................... 19
CHAPTER 4: CONFIGURATION OF PROFIBUS WITH HSYCON ........................................................... 21
4.1 Setting up the PROFIBUS Configuration ................................................................................... 21
4.2 GSD Files ................................................................................................................................... 21
4.3 Master ........................................................................................................................................ 22
4.4 Master Configuration .................................................................................................................. 23
4.5 PROFIBUS-DP Auto Configuration ............................................................................................ 24
4.6 Replace Master .......................................................................................................................... 24
4.7 Insert DP Slave .......................................................................................................................... 25
4.8 Slave Configuration .................................................................................................................... 26
4.9 Inserting Predefined Device – PDD ........................................................................................... 28
4.10 Replace Slave ............................................................................................................................ 29
CHAPTER 5: SETTINGS ............................................................................................................................ 32
5.1 Device Assignment .................................................................................................................... 32
5.2 Bus Parameters ......................................................................................................................... 32
5.3 Setting the Bus Parameters and Profiles ................................................................................... 33
5.4 Description of the Individual Parameters ................................................................................... 34
5.5 Rules .......................................................................................................................................... 36
CHAPTER 6: DP MASTER ......................................................................................................................... 39
6.1 Master Settings .......................................................................................................................... 39
6.2 Group Membership .................................................................................................................... 40
CHAPTER 7: DP SLAVE ............................................................................................................................ 42
7.1 Slave Settings ............................................................................................................................ 42
7.2 Parameter Data .......................................................................................................................... 44
7.3 DPV1 Parameter ........................................................................................................................ 45
7.4 Project Information ..................................................................................................................... 46
7.5 Path ............................................................................................................................................ 47
7.6 Language ................................................................................................................................... 47
7.7 Start Options .............................................................................................................................. 47
CHAPTER 8: ONLINE FUNCTIONS .......................................................................................................... 49
8.1 Downloading the Configuration .................................................................................................. 49
8.2 Firmware Download ................................................................................................................... 49
8.3 Firmware / Reset ........................................................................................................................ 50
8.4 Device Info ................................................................................................................................. 50
8.5 Automatic Network Scan ............................................................................................................ 51
8.6 Assign Slave ............................................................................................................................... 53
8.7 Assign Module ............................................................................................................................ 54
8.8 Slave with Station Address 126 ................................................................................................. 55
PAGE 4 of 97
© Horner APG.This drawing is the property of Horner APG. And shall not be disclosed or reproduced except as specifically authorised.
EO 09-0009
Page 5

Preface MAN0575-04-EN
Profibus Modules User Manual
8.9 Start/Stop Communication ......................................................................................................... 56
CHAPTER 9 : DIAGNOSTIC FUNCTIONS ................................................................................................ 58
9.1 Live List ...................................................................................................................................... 58
9.2 Debug Mode (PROFIBUS-DP) ................................................................................................... 58
9.3 PROFIBUS DP Device Diagnostic ............................................................................................. 59
9.4 Compare Configuration .............................................................................................................. 64
9.5 Extended DP Slave Diagnostic .................................................................................................. 65
9.6 Global State Field ....................................................................................................................... 66
9.7 Extended Device Diagnostic ...................................................................................................... 67
9.8 I/O Monitor .................................................................................................................................. 68
9.9 I/O Watch ................................................................................................................................... 68
CHAPTER 10: PROFIBUS SERVICES ...................................................................................................... 71
10.1 Setting the Slave Address .......................................................................................................... 71
10.2 Message Monitor ........................................................................................................................ 72
10.3 Message Monitor for Testing of DPV1 (Master) ......................................................................... 73
10.4 Message Monitor for Testing of DPV1 (at Slave) ....................................................................... 74
CHAPTER 11: FILE, PRINT, EXPORT, EDIT AND VIEW ......................................................................... 77
11.1 File Open .................................................................................................................................... 77
11.2 File Save and Save As ............................................................................................................... 77
11.3 File Close ................................................................................................................................... 77
11.4 Print ............................................................................................................................................ 77
11.5 DBM Export ................................................................................................................................ 78
11.6 CSV Export ................................................................................................................................. 78
11.7 PDD Export ................................................................................................................................ 81
11.8 Cut, Copy and Paste (Master) .................................................................................................... 82
11.9 Cut, Copy and Paste (Slave) ...................................................................................................... 83
11.10 Delete ......................................................................................................................................... 84
11.11 Replace ...................................................................................................................................... 84
11.12 View the Configuration ............................................................................................................... 85
11.13 Device Table .............................................................................................................................. 85
11.14 Address Table ............................................................................................................................ 86
11.15 Address Overview ...................................................................................................................... 87
11.16 Byte information Window ........................................................................................................... 87
CHAPTER 12: TOOLS ................................................................................................................................ 88
12.1 GSD Viewer ................................................................................................................................ 88
CHAPTER 13: ERROR CODES ................................................................................................................. 89
13.1 Serial Driver Error Numbers (-20… -71) .................................................................................... 89
13.2 Database Access Error Numbers (100 .. 130) ........................................................................... 90
13.3 Online Data Manager Error Numbers ........................................................................................ 91
13.4 Message Handler Error Numbers (2010….,2017) .................................................................... 92
13.5 Driver Functions Error Numbers (2501…,2512) ........................................................................ 93
13.6 Online Data Manager Subfunctions Error Numbers (8001…,8035) .......................................... 93
13.7 Data Base Functions Error Numbers (4000 .. 4098).................................................................. 94
PAGE 5 of 97
© Horner APG.This drawing is the property of Horner APG. And shall not be disclosed or reproduced except as specifically authorised.
EO 09-0009
Page 6

Introduction MAN0575-04-EN
Profibus DP Modules User Manual
CHAPTER 1: INTRODUCTION
1.1 Scope
This manual shows how to connect and configure the Profibus Master or Slave Smartstack Modules.
HSyCon, is an easy-to-use ‘ Windows’-based configuration package for use with the SmartStack
COM range of fieldbus modules and Cscape or Cbreeze a windows based configuration package for
use with the OCS/ TIU product range. The software user’s guide is contained in this manual.
A basic level of understanding of Microsoft Windows technology and operation is assumed. The
manual assumes that the user is familiar with Windows 95, Windows 98, Windows NT, Windows
2000 or XP.
1.2 Introduction
The Smartstack Fieldbus module range require only three stages to become operational, these are:
1. Physical installation and connection.
2. Configuration of the fieldbus interface.
3. Configuration of Cscape / Cbreeze to map the fieldbus data.
The system is comprised of two separate software functions; the fieldbus interface software running
independently in the COM module and the OCS/TIU firmware running in the main module. Data and
commands are exchanged via a dual port ram interface. The configuration of the COM module is via
the RS232 serial port on the module. For correct operation, the number of registers assigned in the
OCS must match the number required by the Master or Slave module configuration.
The Smartstack module should be configured with the OCS/TIU first as otherwise it
will be held in reset and cannot be configured.
PAGE 6 of 97
© Horner APG.This drawing is the property of Horner APG. And shall not be disclosed or reproduced except as specifically authorised.
EO 09-0009
Page 7
Introduction MAN0575-04-EN
Profibus DP Modules User Manual
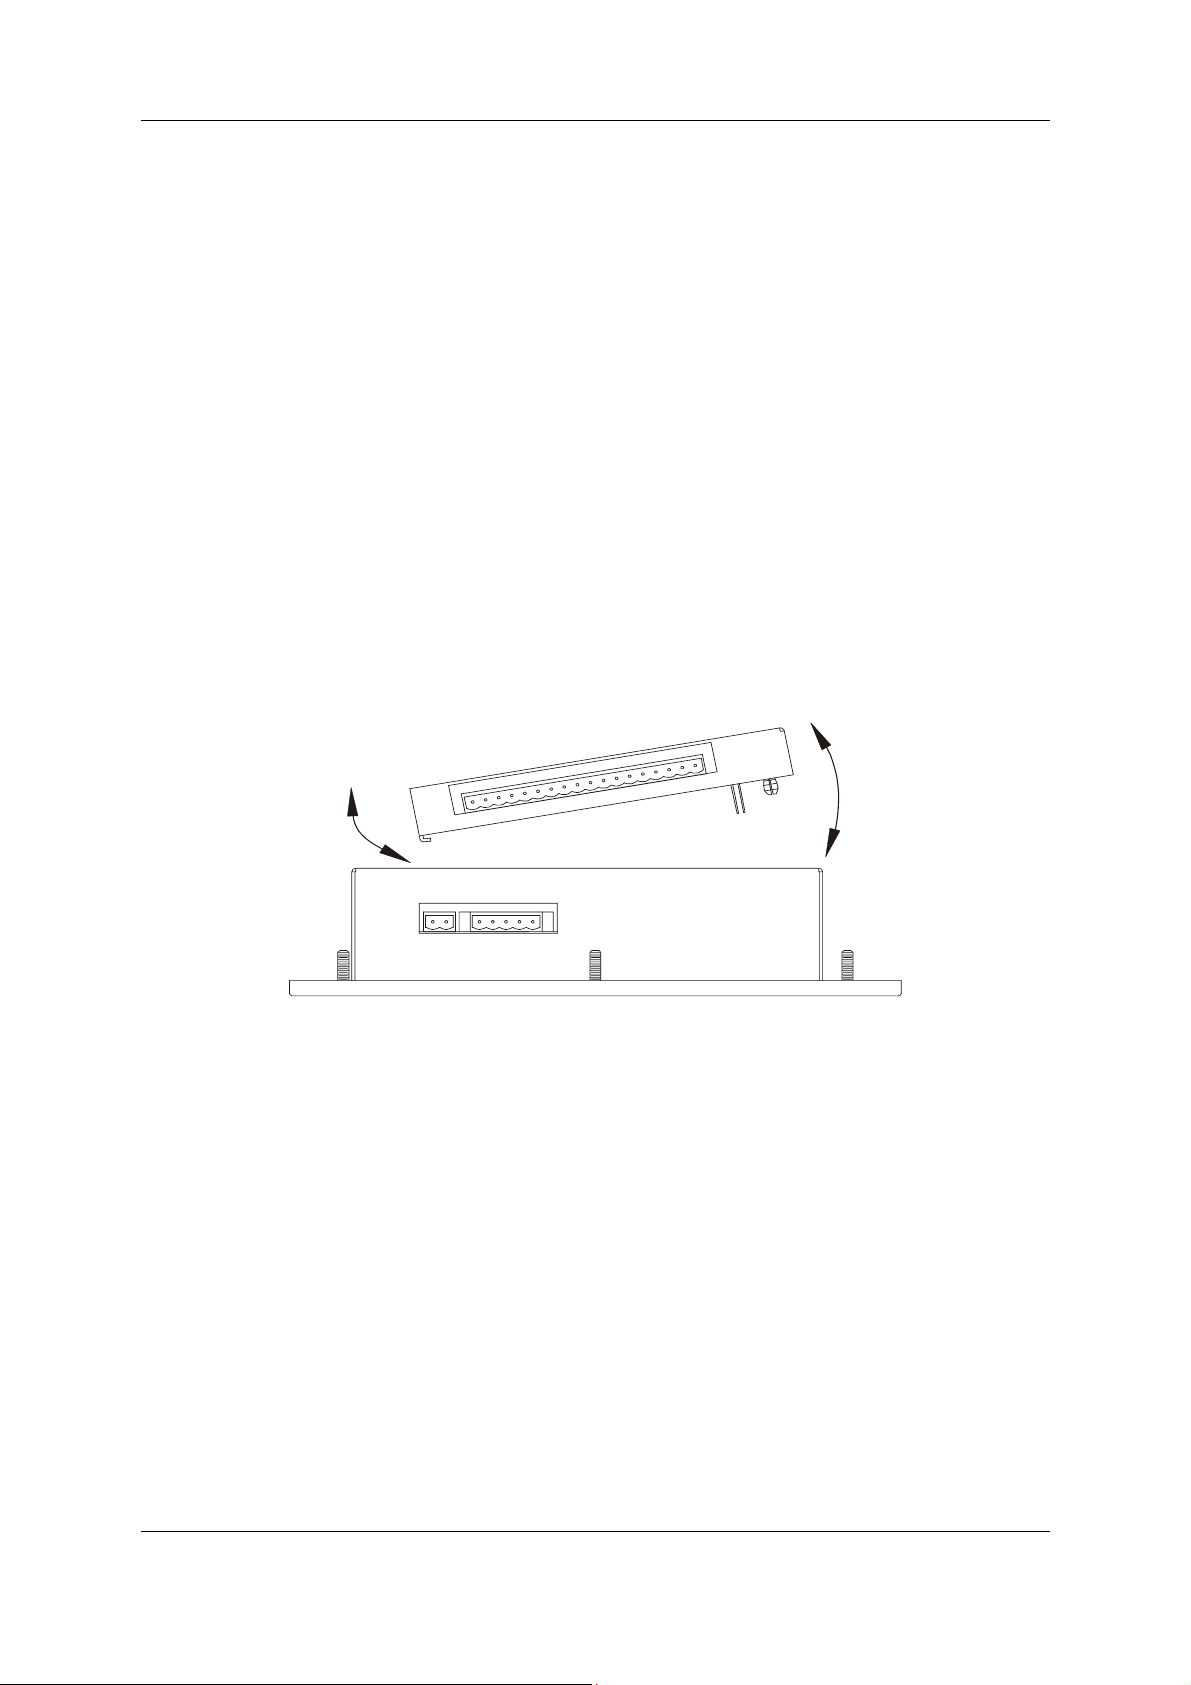
1.3 Installing and Removing a SmartStack Module
The following section describes how to install and remove a SmartStack Module.
Caution: To function properly and avoid possible damage, do not install more than four
Smart Stack Modules per OCS, RCS, NX, QX, FOX base/hub or TIU.
Do not attempt to install or remove a SmartStack module with the units powered on.
Installing SmartStack Modules
10 Hook the tabs. Each SmartStack Module has two tabs that fit into slots located on the OCS,
RCS, FOX base or TIU. (The slots on the OCS are located on the back cover.)
11 Press the SmartStack Module into the “locked” position, making sure to align the SmartStack
Module fasteners or clip with the SmartStack receptacles on the main housing.
Removing SmartStack Modules
1. In the case of a metal Smartstack module using a flathead screwdriver, lever up the end of the
SmartStack Module (opposite end to tabs) and swing the module out. In the case of a plastic
Smartstack module press the button in the end of the module and swing the module out.
2. Lift out the tabs of the module.
Figure 1.1 – Installing a SmartStack Module in an OCS
PAGE 7 of 97
© Horner APG.This drawing is the property of Horner APG. And shall not be disclosed or reproduced except as specifically authorised.
EO 09-0009
Page 8

Introduction MAN0575-04-EN
Profibus DP Modules User Manual
1.4 Main Functions
The main functions of the HsyCon System Configurator are:
• Configuration of the complete Fieldbus range with one package.
• Standardised configuration files – allows use of protocol specific standardised configuration files.
• Diagnostic tool – upon configuration download the software may be switched into diagnostic
mode.
Signal LED Colour State Definition
RDY Yellow On COM Ready
Cyclical flashing Bootstrap loader active
Non cyclical flashing Hardware or system error.
Off Hardware error.
RUN Green On Communication running.
Non cyclical flashing Parameter error.
Off Communications stopped.
ERR Red On Error on communications line.
Off No error.
STA Yellow On Master: Hold Token. Slave: Data Exchange
Off Master: No Hold Token. Slave: No Data Exchange
Figure 1.1
Figure 1.1 shows the onboard LED Status definitions for the PBM650/PBS600
PAGE 8 of 97
© Horner APG.This drawing is the property of Horner APG. And shall not be disclosed or reproduced except as specifically authorised.
EO 09-0009
Page 9
Installation MAN0575-04-EN
Profibus Modules User Manual
CHAPTER 2: SOFTWARE INSTALLATION INSTRUCTIONS
2.1 System Requirements
PC with 486-, Pentium processor or higher.
Windows 95/98/ME, Windows NT/2000/XP.
Free disk space: 30 - 80 Mbytes.
CD ROM drive.
RAM: min. 16 Mbytes.
Graphic resolution: min. 800 x 600 pixel.
Windows 95: Service Pack 1 or higher.
Windows NT: Service Pack 3 or higher.
Keyboard and Mouse.
2.2 System Installation
It is recommended that all application programs on the system be closed before installation begins.
Change to the Hscon/SYCON directory on the disk and start set-up
Note: Administrator privileges are required on Windows NT/2000/XP systems for installation!
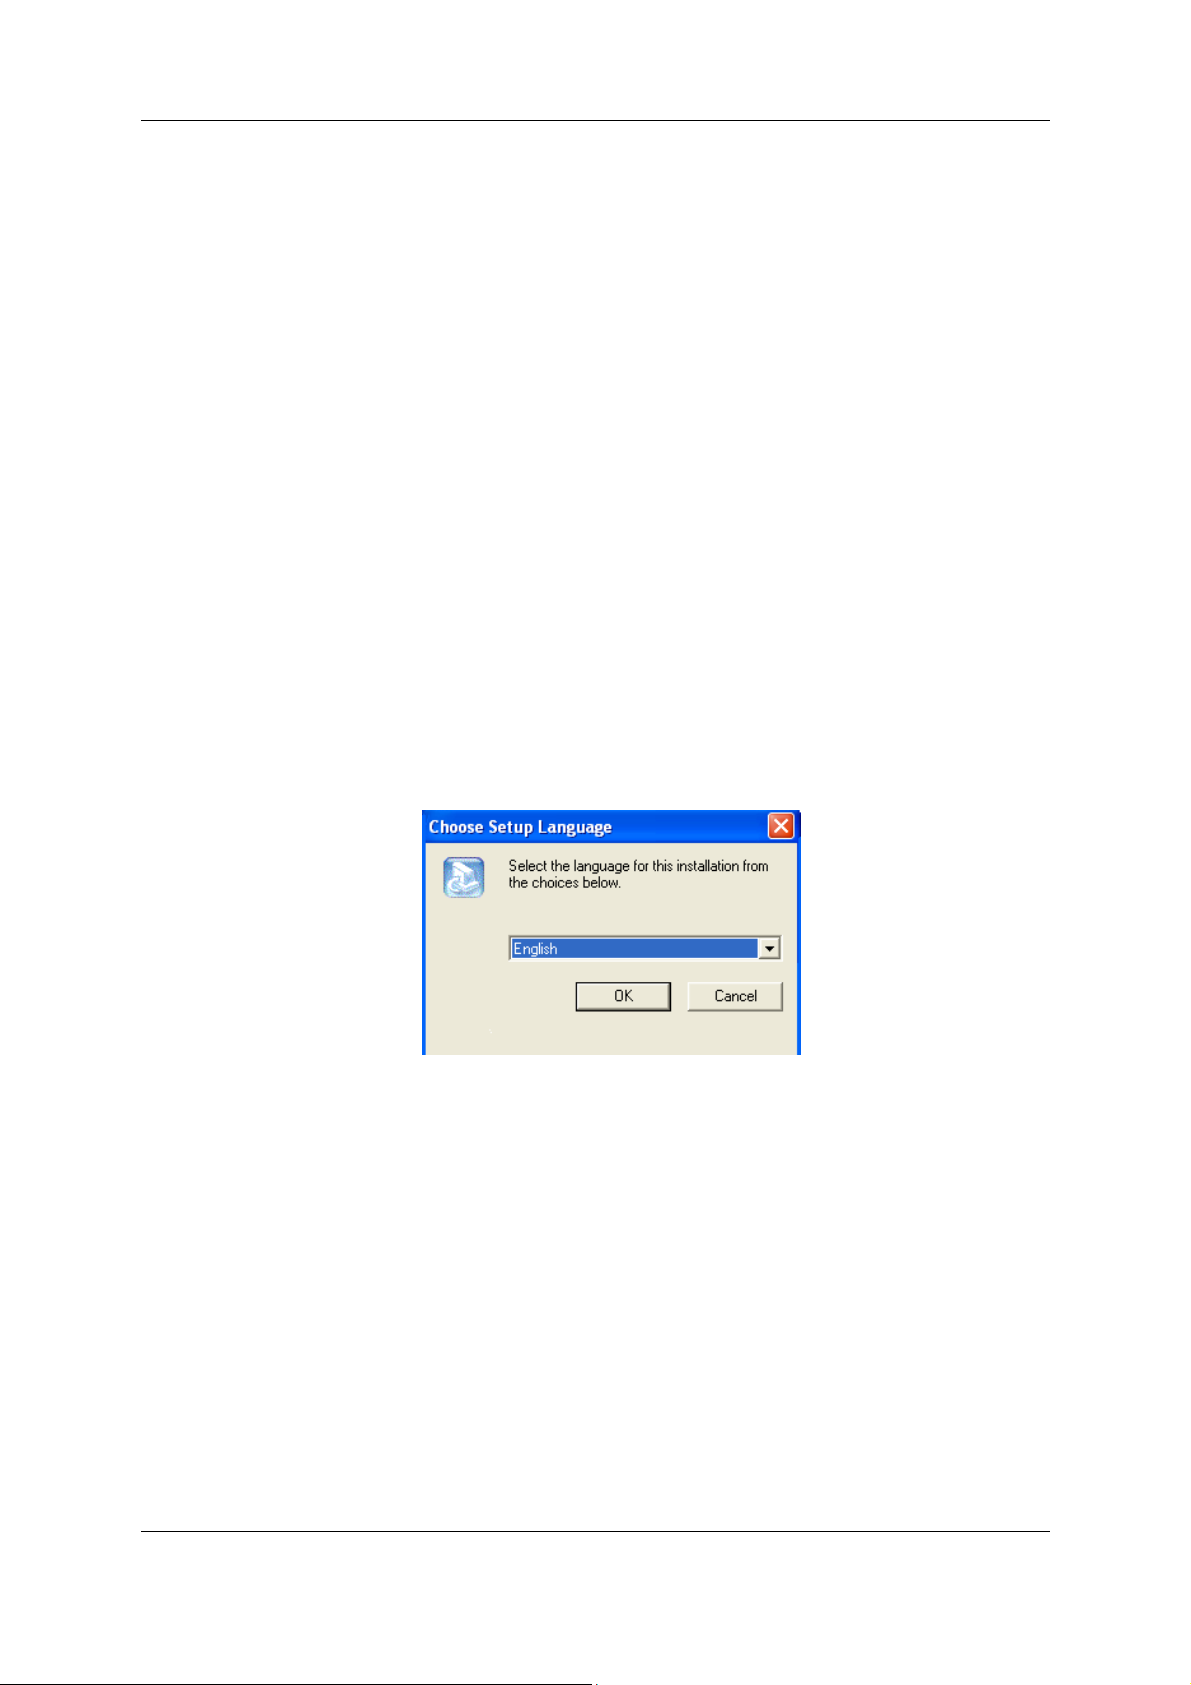
Select the required language version for installation.
Figure 2.1 – language selection
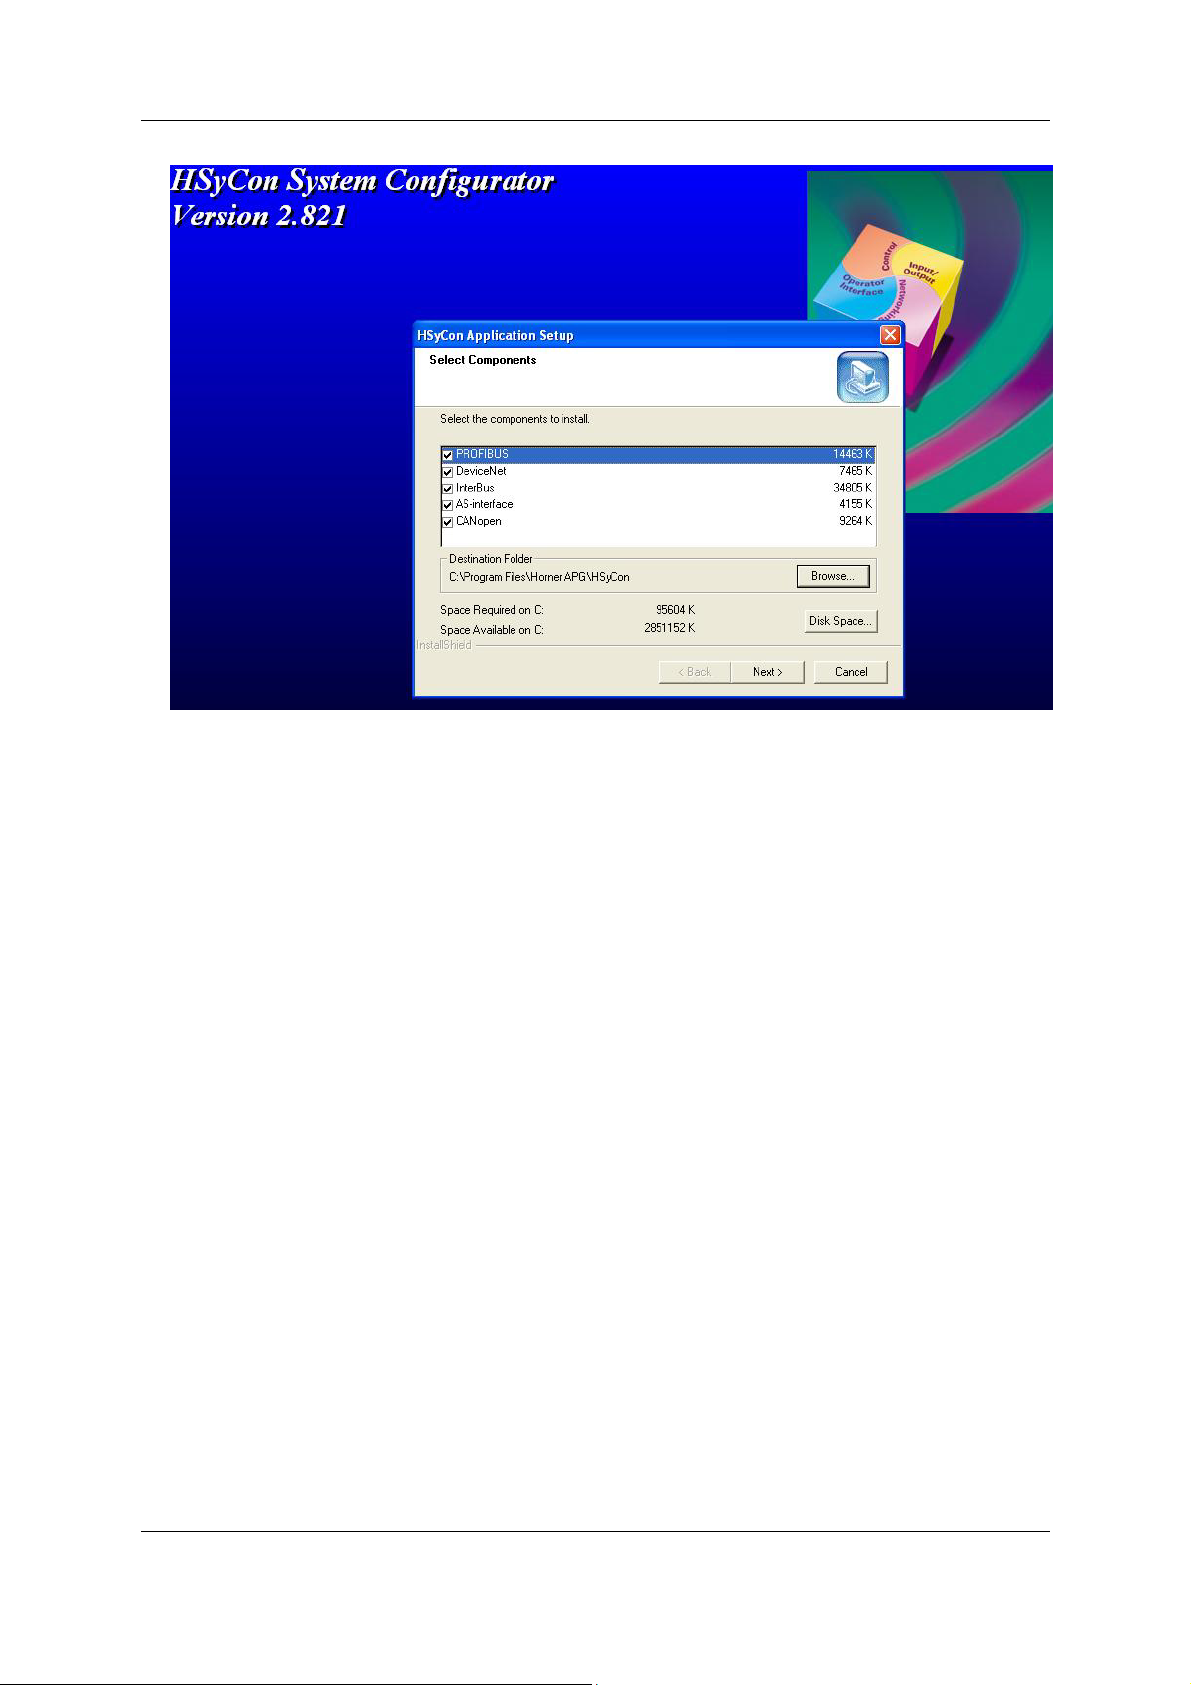
Select the desired Fieldbus components to install. Click Next and the required components will be
installed in the chosen destination folder.
The installation program copies the program files, GSD or EDS files and Bitmaps to the PC. Finally,
the following files are entered in the system Registry.
System Dynamic Link Library’s (DLL’s)
The application
PAGE 9 of 97
© Horner APG.This drawing is the property of Horner APG. And shall not be disclosed or reproduced except as specifically authorised.
EO 09-0009
Page 10
Installation MAN0575-04-EN
Profibus Modules User Manual
Figure 2.2 – Component Selection
PAGE 10 of 97
© Horner APG.This drawing is the property of Horner APG. And shall not be disclosed or reproduced except as specifically authorised.
EO 09-0009
Page 11
Getting Started MAN0575-04-EN
Profibus Modules User Manual
CHAPTER 3: GETTING STARTED – CSCAPE CONFIGURATION
3.1 Scope
This chapter describes the procedure for configuring the DP Master and slaves. This includes
configuring the Cscape section, loading GSD files, saving, downloading and assigning I/O.
3.2 Configuring Cscape.
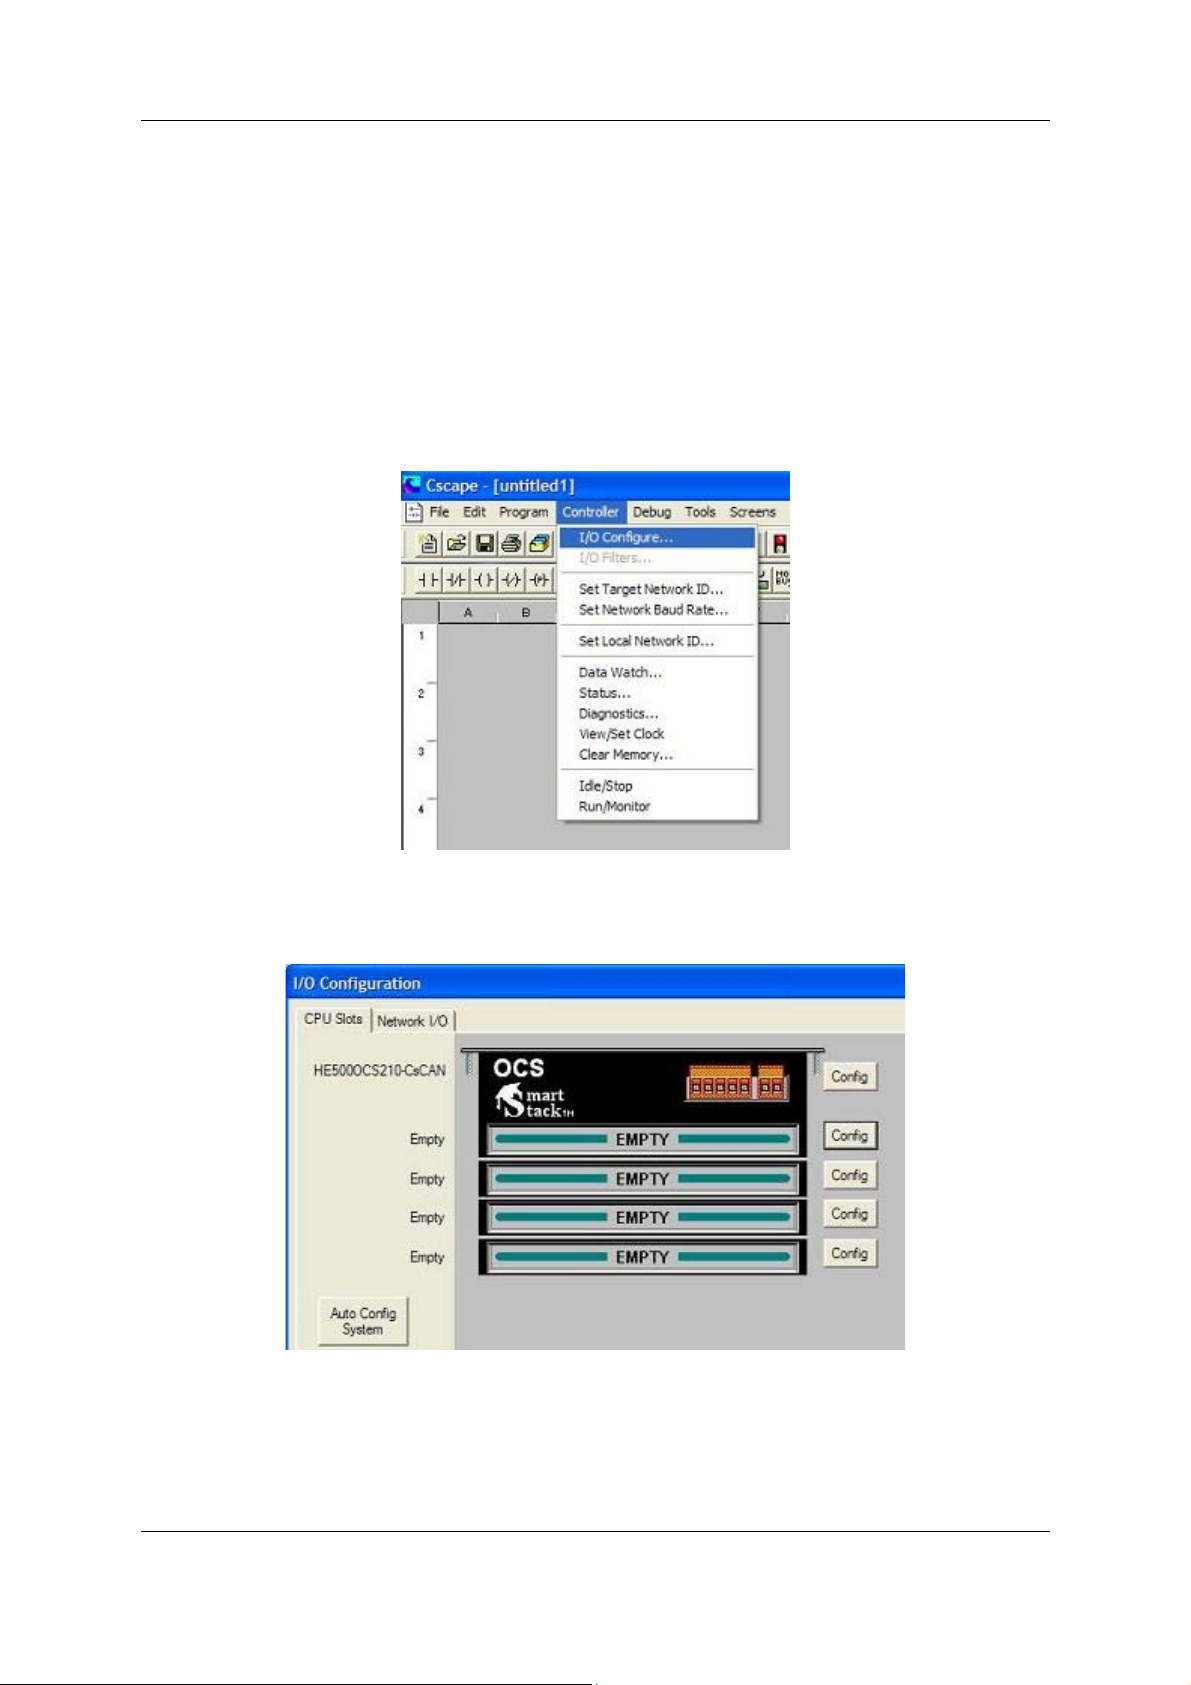
The following describes the steps involved to setup Cscape. Attach the communications module to
the appropriate OCS unit. Open Cscape. All I/O is setup through the I/O Configure Menu in Cscape:
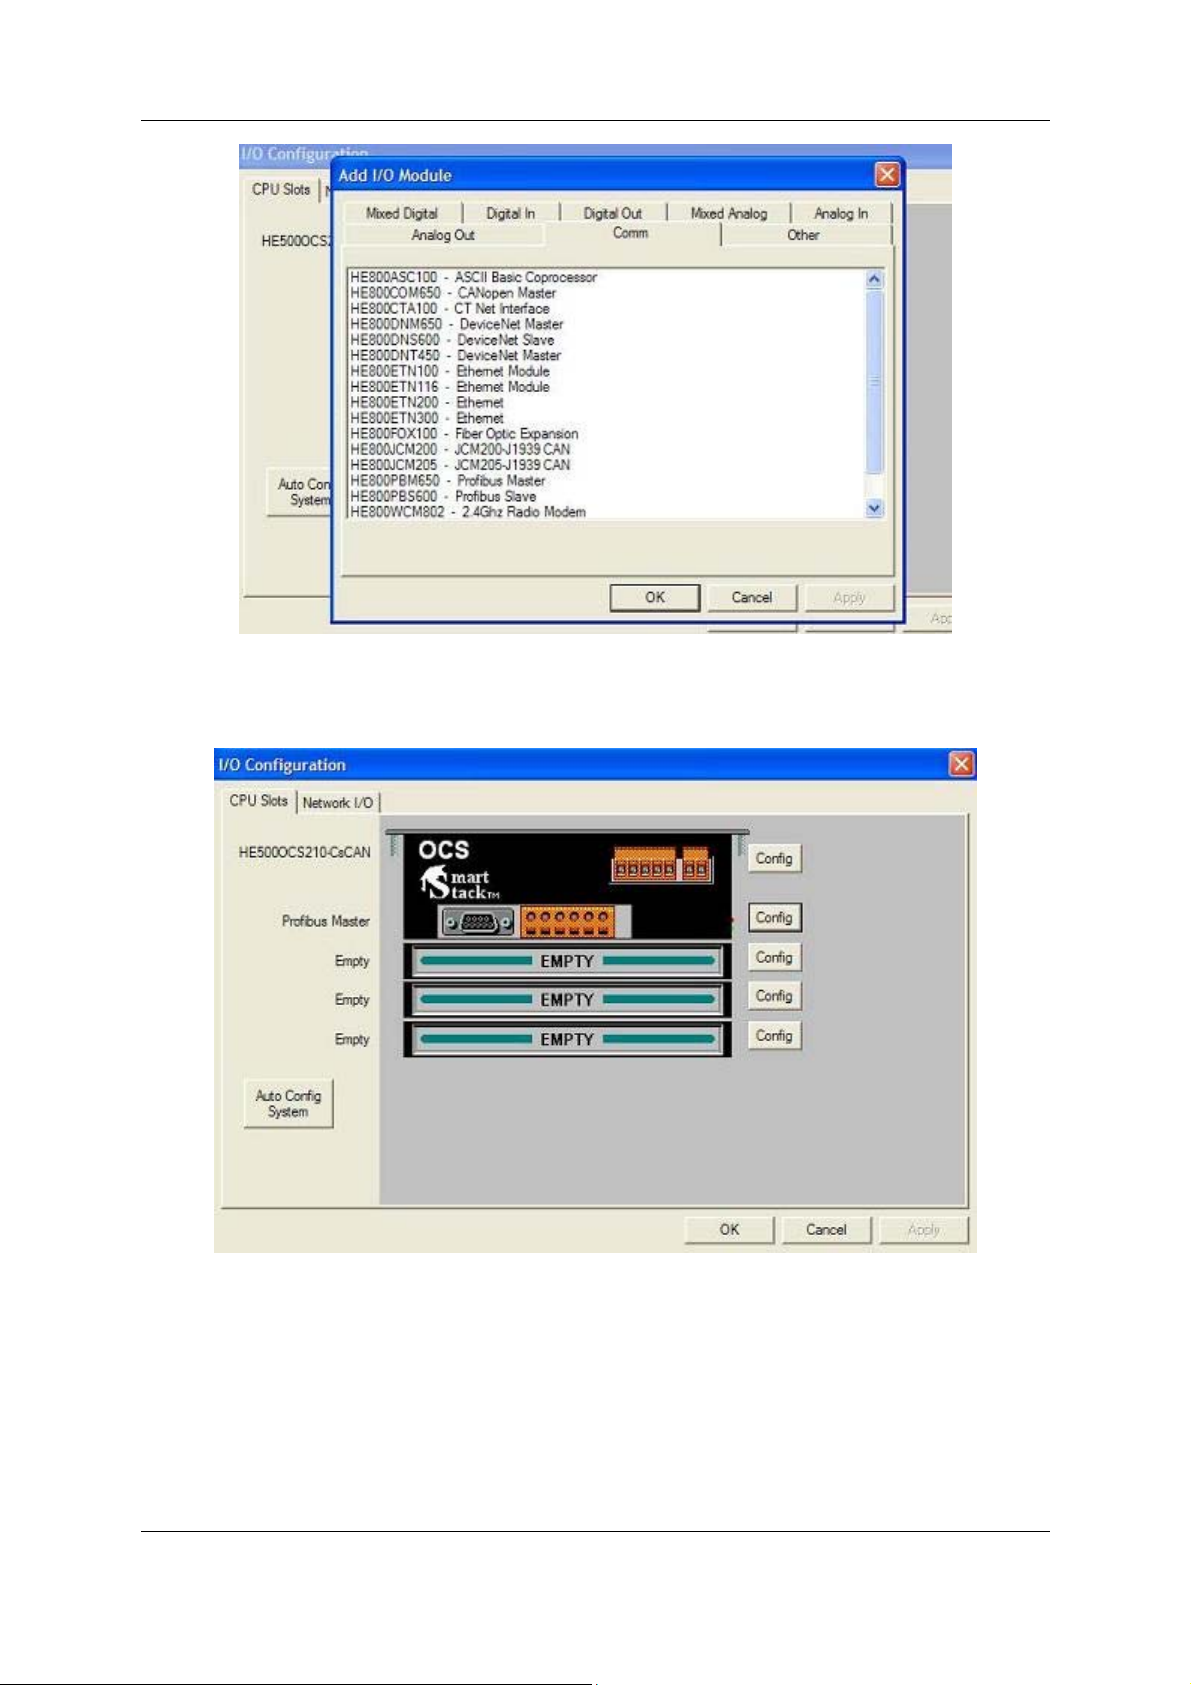
Figure 3.1
The following window is displayed. Select the CONFIG button adjacent to the first empty slot (nearest
the main unit).
Figure 3.2
Select the COMM Tab. From here select the appropriate Profibus Module and click OK.
PAGE 11 of 97
© Horner APG.This drawing is the property of Horner APG. And shall not be disclosed or reproduced except as specifically authorised.
EO 09-0009
Page 12
Getting Started MAN0575-04-EN
Profibus Modules User Manual
Figure 3.3
The selected module is now visibly attached to the main unit and can be configured.
Figure 3.4
Select the CONFIG button adjacent to the module. Then select the MODULE SETUP tab.
PAGE 12 of 97
© Horner APG.This drawing is the property of Horner APG. And shall not be disclosed or reproduced except as specifically authorised.
EO 09-0009
Page 13
Getting Started MAN0575-04-EN
Profibus Modules User Manual
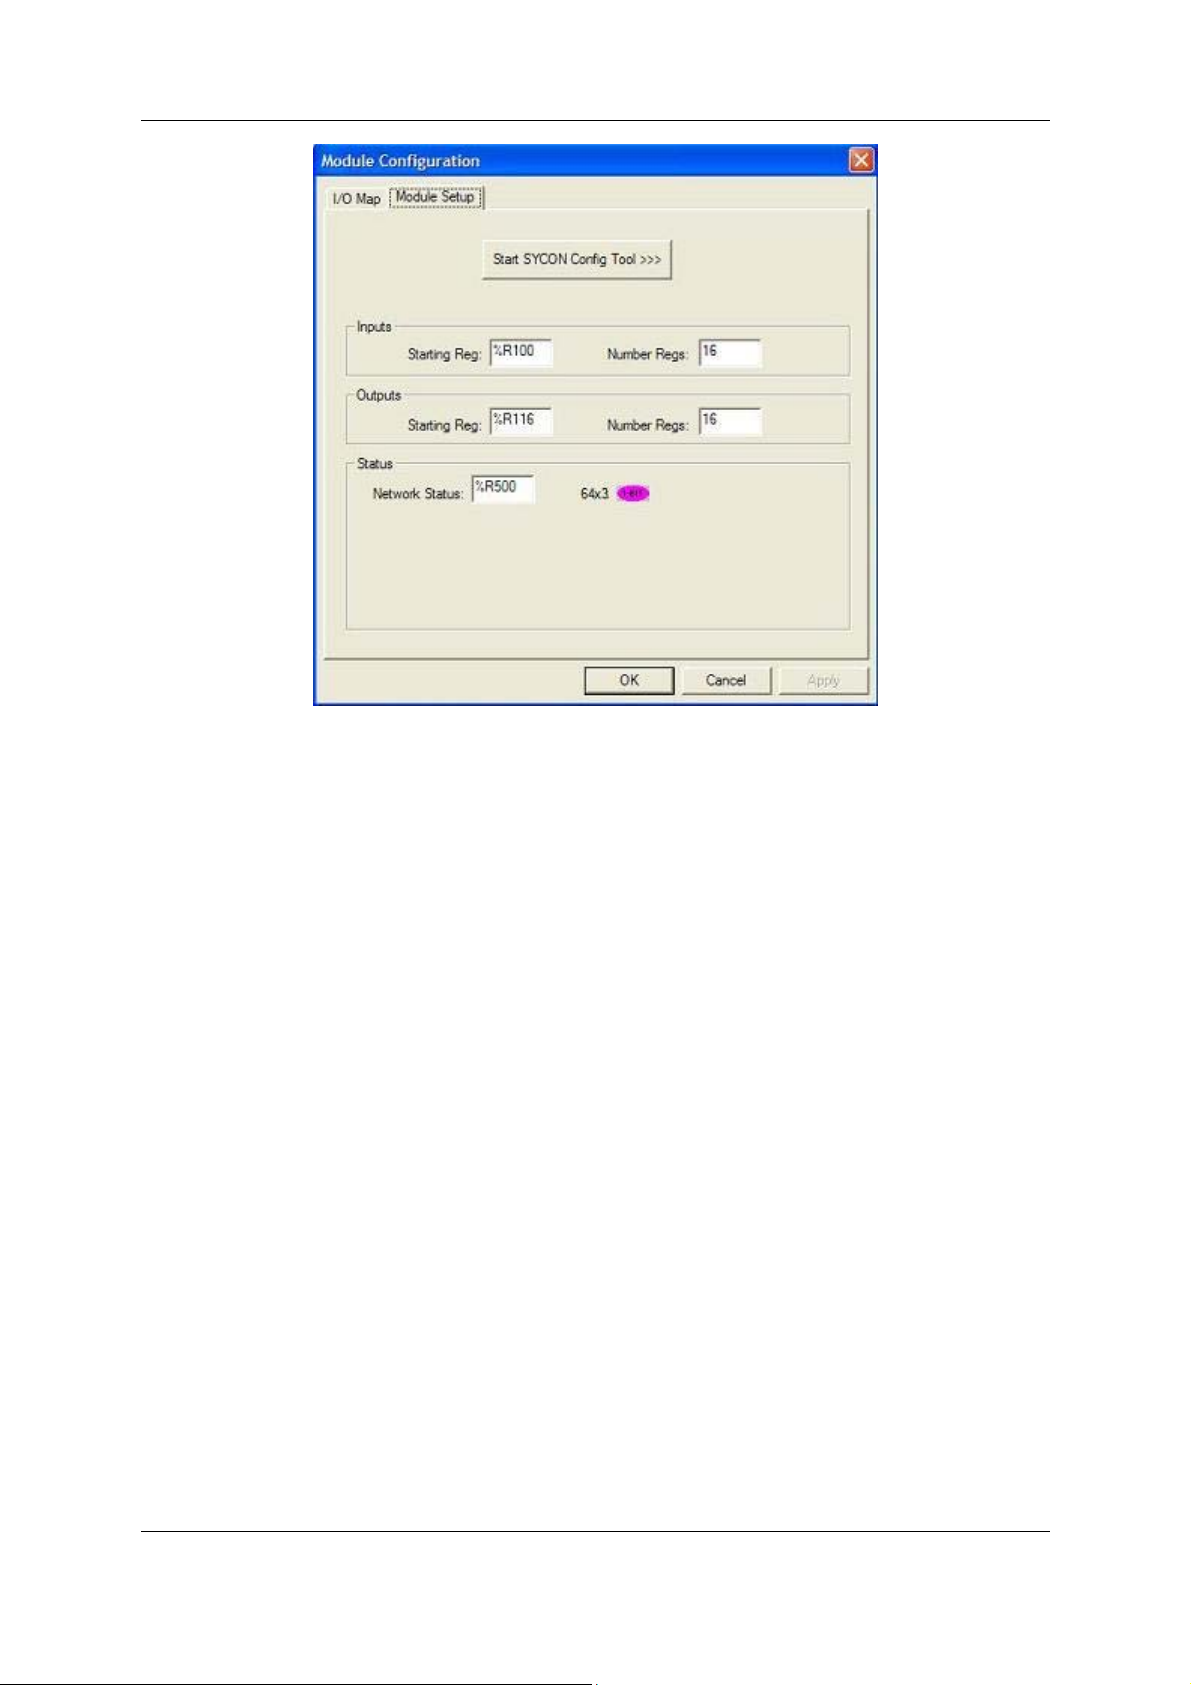
Figure 3.5
Configure the Inputs and Outputs.
NOTE:
INPUTS: means data coming FROM the Network VIA the PBM/PBS Module to the OCS Registers.
OUTPUTS: means data going TO the NETWORK VIA the PBM/PBS Module from the OCS Registers.
In Figure 3.5 above, For both Inputs and Outputs, 16 %R registers are used. The OCS %R registers
are retentive, general purpose, 16 bit registers.
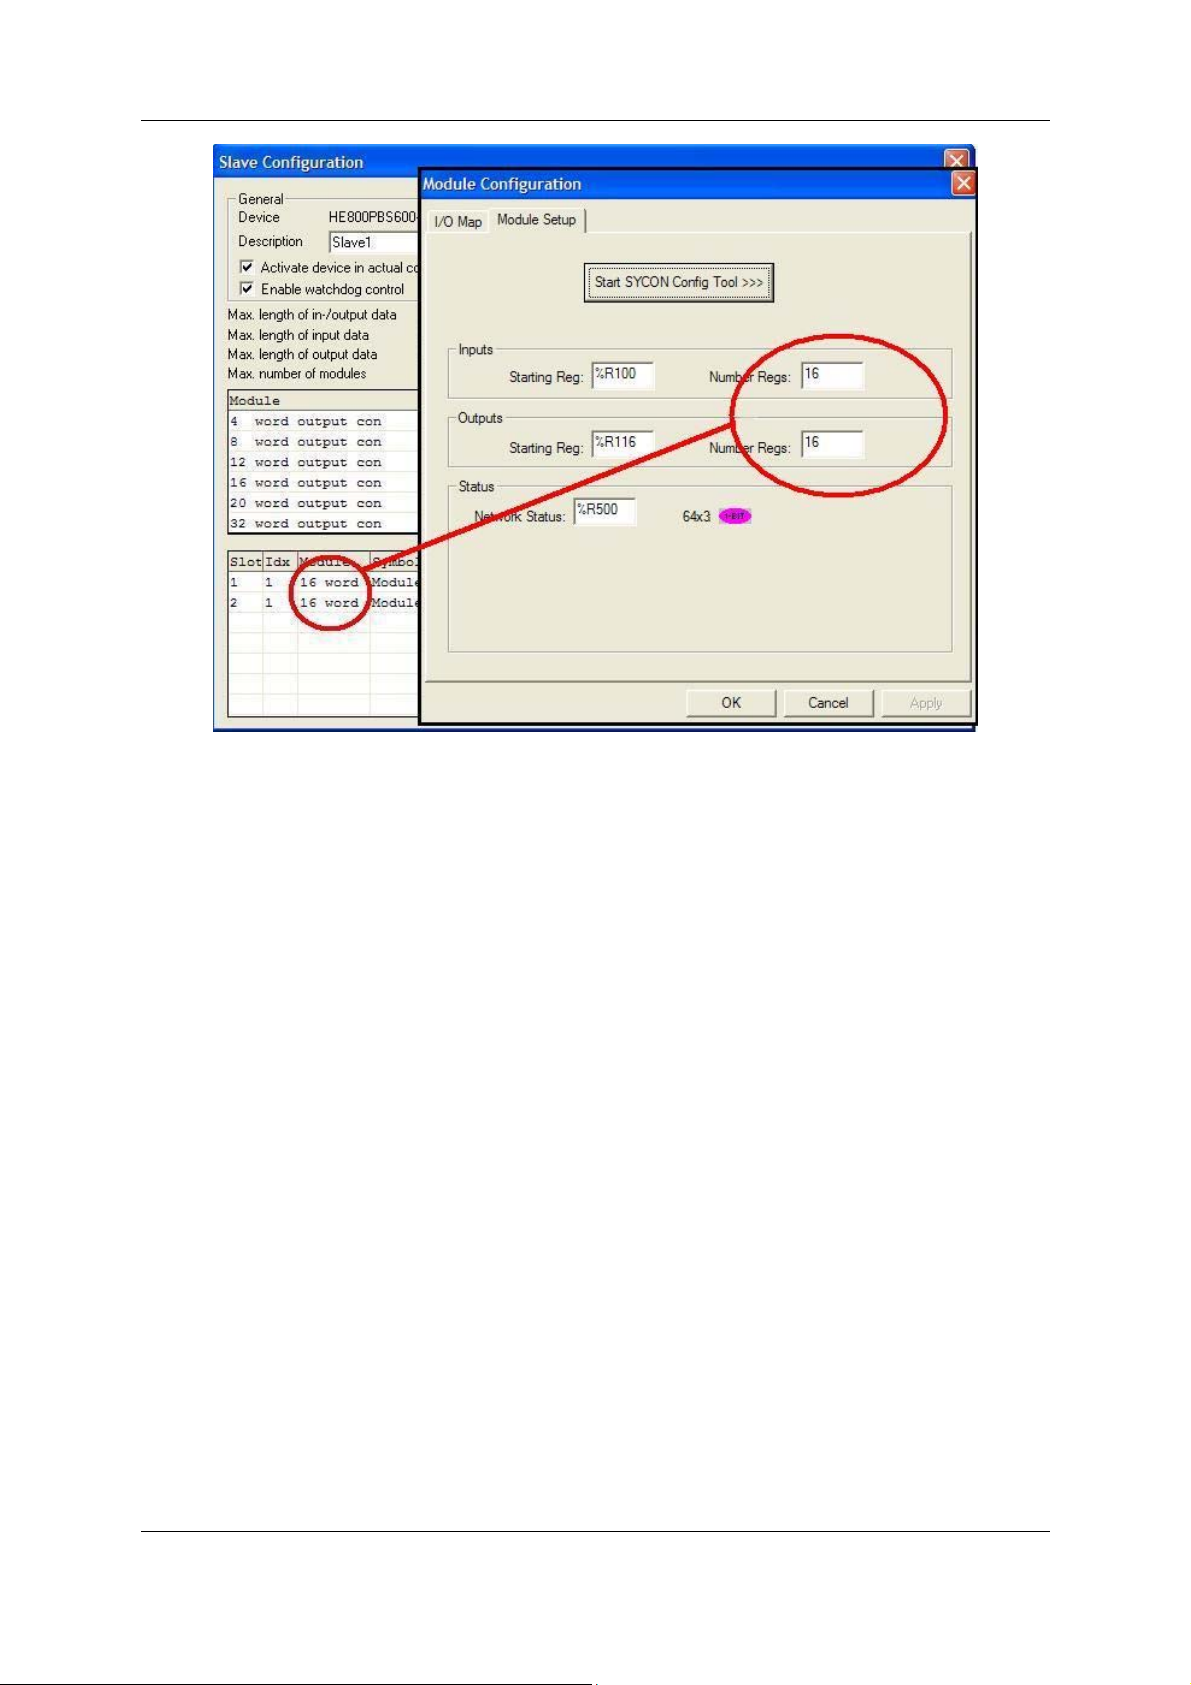
It is VERY important that the number of registers used for both Inputs and Outputs in Cscape
is identical to the number setup in the Hsycon software when setting up the PBM650 and
PBS600 modules. See Figure 3.6 below.
PAGE 13 of 97
© Horner APG.This drawing is the property of Horner APG. And shall not be disclosed or reproduced except as specifically authorised.
EO 09-0009
Page 14
Getting Started MAN0575-04-EN
Profibus Modules User Manual
Figure 3.6
The Network Status is a block of registers 64 bits x 3 tables give status’ of each slave station.
Table 1 indicates the the configured state of the corresponding slave.
1 or On means the Slave is configured in the Master
0 or Off means the Slave is not configured in the Master
Table 2 indicates the state of each slave.
1 or On means the Slave and Master are exchanging their I/O data.
0 or Off means the Slave and Master are not exchanging their I/O data.
Table 3 indicates the diagnostic bit of each slave. (Can only be viewed in Hsycon)
1 or On means the latest received slave diagnostic data are available in the
internal diagnostic buffer.
0 or Off means since the last diagnostic buffer read access of the host, no
values were changed in this buffer.
PAGE 14 of 97
© Horner APG.This drawing is the property of Horner APG. And shall not be disclosed or reproduced except as specifically authorised.
EO 09-0009
Page 15

Getting Started MAN0575-04-EN
Profibus Modules User Manual
3.3 Configuration of a SmartStack Profibus DP Master to any Profibus DP Slave
The following describes the steps to configure a SmartStack Profibus DP Master to any Profibus DP
Slave:
Action Menu in the System Configurator
Create a new project
•
Copy GSD file of the DP Slave, if the Slave is not in the
•
selection list. Horner module GSD’s loaded by default.
Choose Horner DP Master and provide bus address
•
Choose DP Slave and provide bus address
•
Assign the input and output modules (*1)
•
Assign the offset addresses
•
Assign the DP Slave Parameter data, if the Slave needs
•
Parameter data
Set the bus parameter Mark the Master (left Mouse click), then
•
Set device assignment if no automatic assignment has
•
occurred
Save project
•
Download to the Master. Mark the Master (left Mouse click), then
•
Download to the Slave (if a Horner DP Slave). Mark the Slave (left Mouse click), then
•
Live List Mark the Master (left Mouse click), then
•
Start Debugger Mark the Master (left Mouse click), then
•
Device diagnostic Mark the Slave (left Mouse click), then
•
Stop Debugger
•
Global Diagnostic Mark the Master (left Mouse click), then
•
Transfer user data:
•
Write output, read input
File > New > PROFIBUS
File > Copy GSD
Insert > Master
Insert > Slave
Mark the Slave (left Mouse click), then
Settings > Slave Configuration
Mark the Slave (left Mouse click), then
Settings > Parameter Data
Settings > Bus Parameters
Mark the Master (left Mouse click), then
Settings > Device Assignment
File > Save
Online > Download
Online > Download
Online > Live List
Online > Start Debug Mode
Online > Device Diagnostic
Online > Stop Debug Mode
Online > Global State Field
Mark the Master (left Mouse click), then
Online > I/O Monitor
Figure 3.2. Steps for Configuration of a SmartStack Profibus DP Master to any Profibus DP
Slave
Note (*1): The Offset addresses assigned in the Slave configuration are always related to the DP
Master.
PAGE 15 of 97
© Horner APG.This drawing is the property of Horner APG. And shall not be disclosed or reproduced except as specifically authorised.
EO 09-0009
Page 16

Getting Started MAN0575-04-EN
Profibus Modules User Manual
3.4 Configuration of a SmartStack Profibus DP Slave to any Profibus DP Master
The following table describes the steps to configure a SmartStack DP Slave to any DP Master:
Action Menu in the System Configurator
Create a new project
•
Choose Horner DP Master and provide bus address (*1) Insert > Master
•
Choose Horner DP Slave and provide bus address
•
Assign the input and output modules (*2)
•
Set device assignment if no automatic assignment has
•
occurred
Save project
•
Download Mark the Slave (left Mouse click), then
•
Configuration diagnostic Mark the Slave (left Mouse click), then
•
Configuration diagnostic Mark the Slave (left Mouse click), then
•
Transfer user data:
•
Write output, read input
File > New > PROFIBUS
Insert > Slave
Mark the Slave (left Mouse click), then
Settings > Slave Configuration
Mark the Slave (left Mouse click), then
Settings > Device Assignment
File > Save
Online > Download
Online > Extended Device Diagnostic >
SPC3CTRL Slave Config
Online > Extended Device Diagnostic >
SPC3CTRL Master Config
Mark the Slave (left Mouse click), then
Online > I/O Monitor
Figure 3.3. Steps for Configuration of a SmartStack Profibus DP Slave to any Profibus DP
Master
Note (*1): Insert a SmartStack DP Master. This Master is a placeholder and it is not necessary to
match the connected Master.
Note (*2): The Offset addresses assigned in the Slave configuration are always related to the DP
Master.
PAGE 16 of 97
© Horner APG.This drawing is the property of Horner APG. And shall not be disclosed or reproduced except as specifically authorised.
EO 09-0009
Page 17

1
2
3
4
5
6
7
8
9
1
0
1
1
1
2
1
3
Getting Started MAN0575-04-EN
Profibus Modules User Manual
3.5 Configuration of a SmartStack DPV1 Master to any DPV1 Slave
The following describes the steps to configure a SmartStack Profibus DPV1 Master to any Profibus
DPV1 Slave :
Action Menu in the System Configurator
Create a new project
•
Choose Horner DPV1 Master and
•
provide bus address
Choose Horner DPV1 Slave and provide
•
bus address
Set DPV1 parameter Mark the Slave (left Mouse click), then
•
Set DPV1 buffer size (if connecting to
•
Horner DPV1 Slave.
Set the bus parameter Mark the Master (left Mouse click), then
•
Set device assignment for the Master if
•
no automatic assignment has occurred
Set device assignment for the Slave if no
•
automatic assignment has occurred (if
connecting to a Horner Slave).
Save project
•
Download to the Master Mark the Master (left Mouse click), then
•
Download to the Slave Mark the Slave (left Mouse click), then
•
Live List Mark the Master (left Mouse click), then
•
Transfer user data:
•
Read and write data
File > New > PROFIBUS
Insert > Master
Insert > Slave
Settings > Slave Configuration
DPV1 Parameter data
Mark the Slave (left Mouse click), then
Settings > Slave Settings
Settings > Bus Parameters
Mark the Master (left Mouse click), then
Settings > Device Assignment
Mark the Slave (left Mouse click), then
Settings > Device Assignment
File > Save
Online > Download
Online > Download
Online > Live List
Mark the Master (left Mouse click), then
Online > Message Monitor
Mark the Slave (left Mouse click), then
Online > Message Monitor
Table 1: Steps for Configuration of Profibus DPV1 Master to any Profibus DPV1 Slave.
Note (*1): If connecting to anything other than a Horner Slave then see the Slave manual for
configuration help.
PAGE 17 of 97
© Horner APG.This drawing is the property of Horner APG. And shall not be disclosed or reproduced except as specifically authorised.
EO 09-0009
Page 18

1
2
3
4
5
6
7
8
9
Getting Started MAN0575-04-EN
Profibus Modules User Manual
3.6 Configuration a SmartStack Profibus DPV1 Slave to any Profibus DPV1 Master
The following table describes the steps to configure a SmartStack Profibus DPV1 Slave to any
Profibus DPV1 Master:
Action Menu in the System Configurator
Create a new project
•
Choose Horner DPV1 Master and provide bus address
•
(*1)
Choose Horner DPV1 Slave and provide bus address
•
Set DPV1 parameter Mark the Slave (left Mouse click), then
•
Set DPV1 buffer size Mark the Slave (left Mouse click), then
•
Set device assignment if no automatic assignment has
•
occurred
Save project
•
Download Mark the Slave (left Mouse click), then
•
Transfer user data:
•
Read and write data
File > New > PROFIBUS
Insert > Master
Insert > Slave
Settings > Slave Configuration
DPV1 Parameter data
Settings > Slave Settings
Mark the Slave (left Mouse click), then
Settings > Device Assignment
File > Save
Online > Download
Mark the Slave (left Mouse click), then
Online > Message Monitor
Figure 3.5. Steps for Configuration a SmartStack Profibus DPV1 Slave to any Profibus DPV1
Master
Note (*1): Insert a SmartStack Profibus DPV1 Master. This Master is a placeholder and it is not
necessary to match the connected Master.
PAGE 18 of 97
© Horner APG.This drawing is the property of Horner APG. And shall not be disclosed or reproduced except as specifically authorised.
EO 09-0009
Page 19

1
2
3
4
5
6
7
8
Getting Started MAN0575-04-EN
Profibus Modules User Manual
3.7 Verifying a Project
The following describes the steps to configure a SmartStack Profibus DP Master as a class 2 Master:
Action Menu in the System Configurator
Create a new project
•
Choose Horner DP Master and provide bus address
•
Set the bus parameter Mark the Master (left Mouse click), then
•
Set device assignment if no automatic assignment has
•
occurred
Save project
•
Download Mark the Master (left Mouse click), then
•
Live List Mark the Master (left Mouse click), then
•
Call DP class 2 function Mark the Hilscher Master (left Mouse click), then
•
File > New > PROFIBUS
Insert > Master
Settings > Bus Parameters
Mark the Master (left Mouse click), then
Settings > Device Assignment
File > Save
Online > Download
Online > Live List
Online > Message Monitor
Table 3.6: Steps for Configuration as a Class 2 Master.
Note (*1): The functions for Profibus DP class 2 are activated by messages or by the application
program.
PAGE 19 of 97
© Horner APG.This drawing is the property of Horner APG. And shall not be disclosed or reproduced except as specifically authorised.
EO 09-0009
Page 20

Page 21
Profibus configuration MAN0575-04-EN
Profibus Modules User Manual
CHAPTER 4: CONFIGURATION OF PROFIBUS WITH HSYCON
4.1 Setting up the PROFIBUS Configuration
To create a new configuration, choose the File > New menu. This will offer a selection list of fieldbus
systems. Choose PROFIBUS. If only the PROFIBUS fieldbus system is installed, the configuration
window will open directly. The name of the configuration file can be allocated when the configuration
is finished or with File > Save As.
4.2 GSD Files
GSD (Electronic data sheet of a device) files contain and describe the functions and characteristics of
PROFIBUS devices. The abbreviation GSD means 'Gerätestammdaten' (Device Base Files). All the
available GSD files together form the device database.
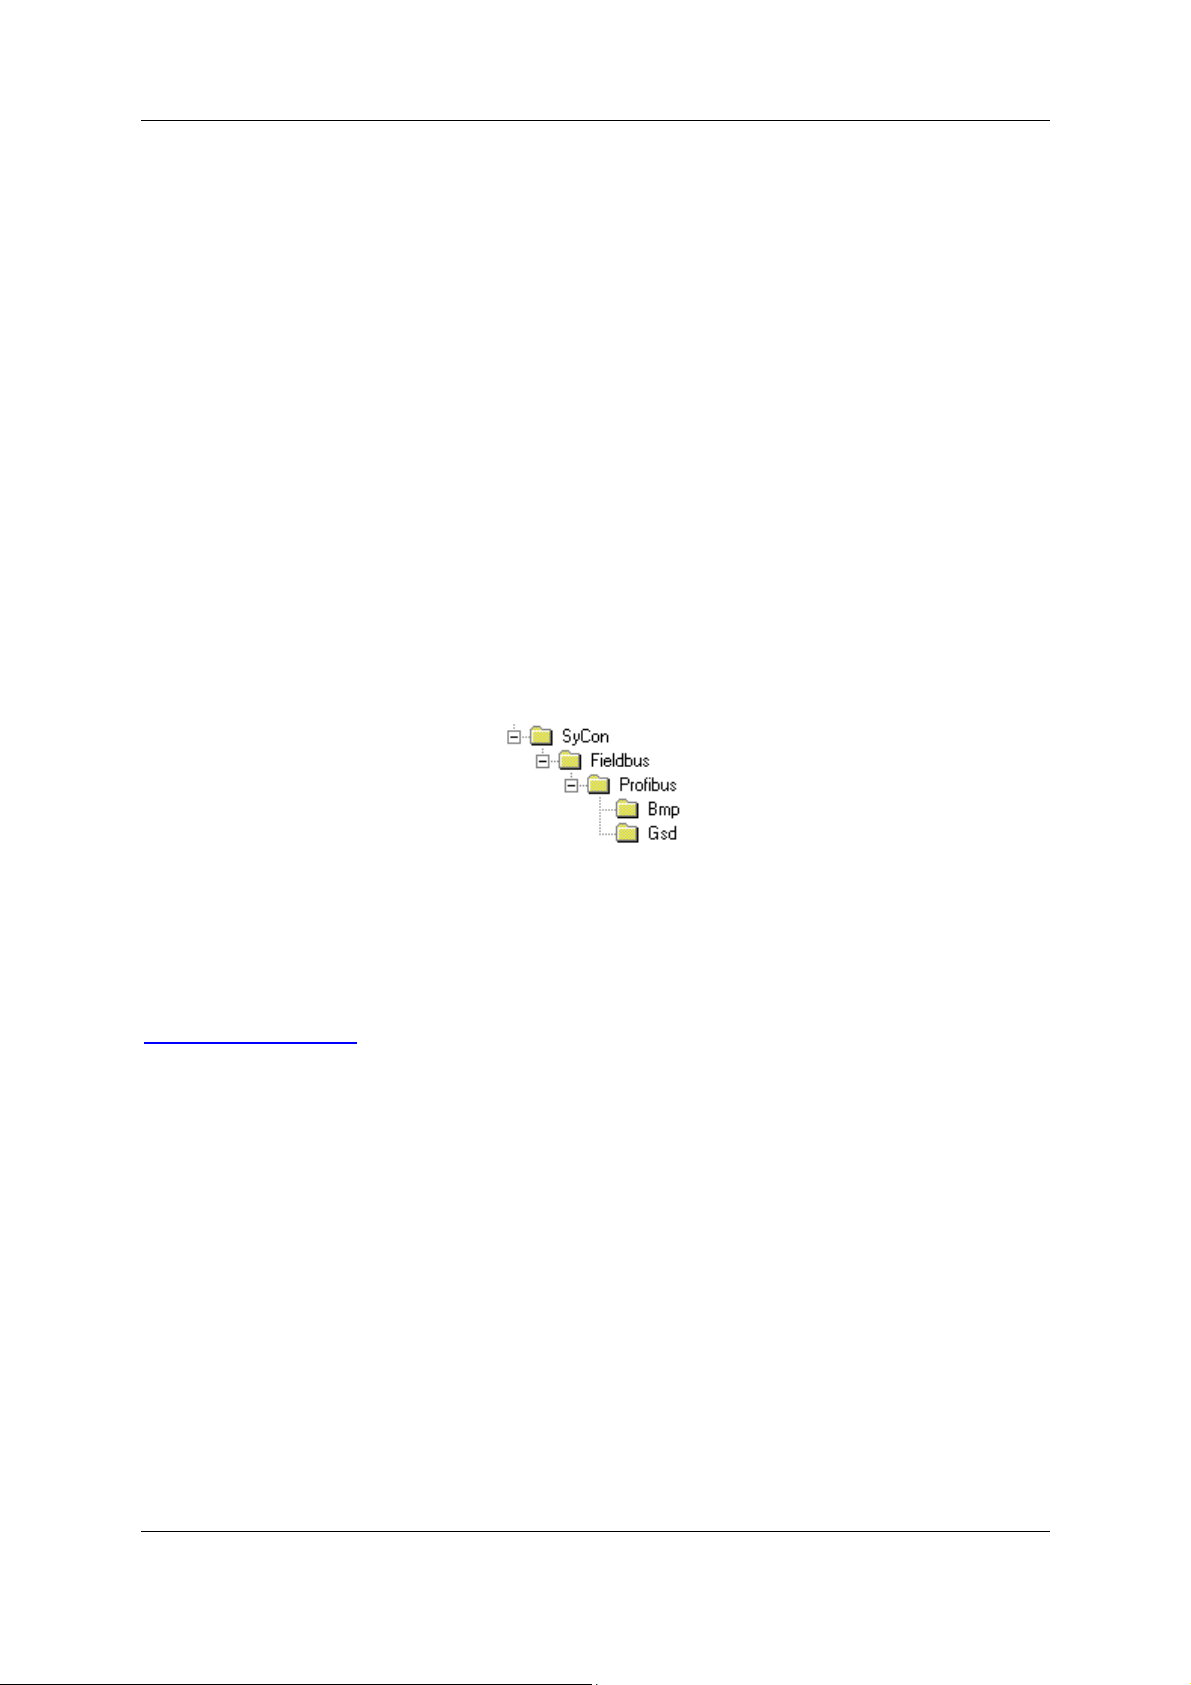
When the program is started, the System Configurator automatically retrieves all of the GSD files
stored in the GSD directory. The device names are placed into an internal list. During configuration,
the device-specific data is retrieved directly from the GSD files.
If a DP Slave device does not appear in the selection list, the required GSD file can be copied into the
GSD directory with File > Copy GSD. Another way is to copy the GSD file into the SyCon GSD
directory using Windows Explorer and then retrieve the GSD files into the GSD directory with
Settings > Path and OK.
The GSD files can be viewed with the Tools > GSD Viewer menu.
.
Figure 4.2: GSD files and bitmaps directory
SmartStack Devices: The GSD files for the SmartStack devices are included and installed.
Other Devices: The respective device manufacturer provides the GSD files for other devices.
The GSD files of many vendors are available on the PROFIBUS user organisation home page.
http://www.profibus.com
Note: GSD files are only used for PROFIBUS-DP.
The GSD directory is adjustable. In order to alter the directory from a previous setting in another
directory, use the Settings > Path menu. All GSD files must be placed in this directory.
PAGE 21 of 97
© Horner APG.This drawing is the property of Horner APG. And shall not be disclosed or reproduced except as specifically authorised.
EO 09-0009
Page 22
Profibus configuration MAN0575-04-EN
Profibus Modules User Manual
4.3 Master
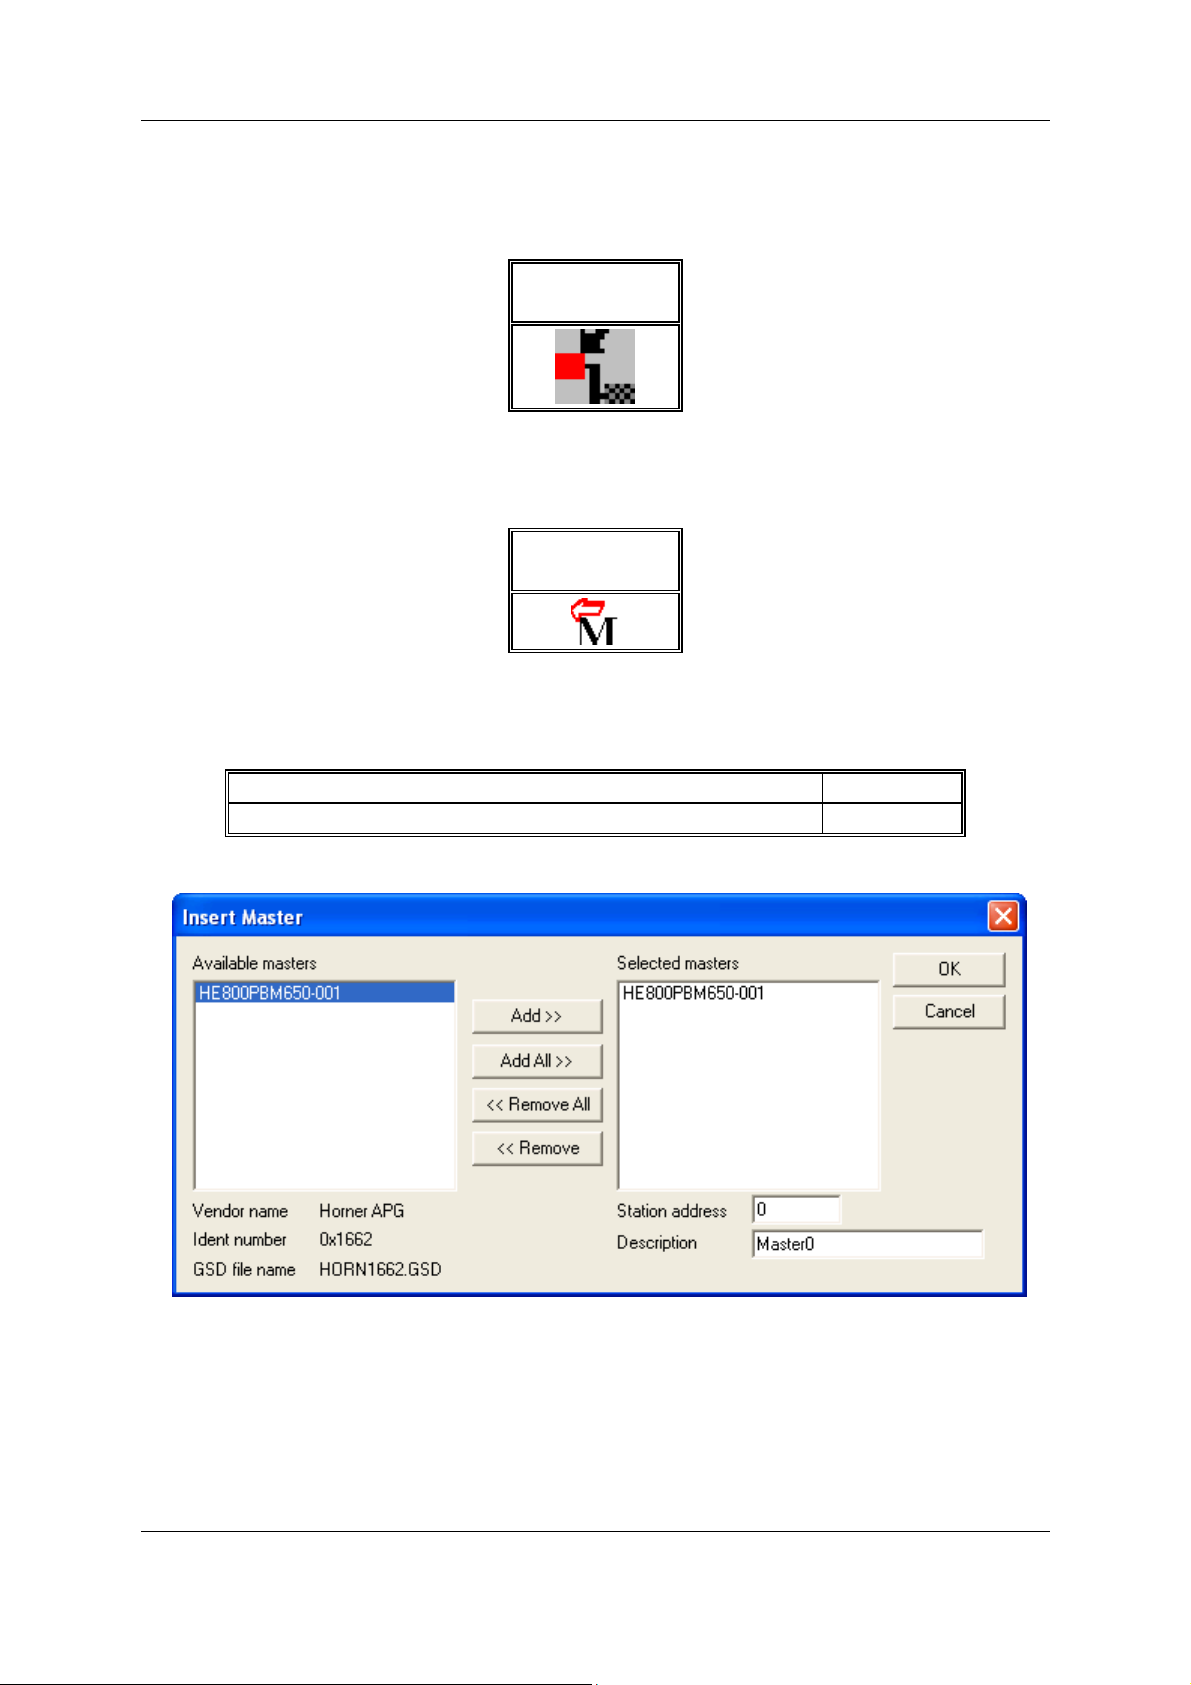
In order to insert a (SmartStack) Master into the configuration, choose the Insert > Master menu, this
will open the selection window, or click on the symbol:
Symbol
Insert > Master
Table 2: Symbol Insert > Master
The mouse pointer automatically changes into the Insert Master pointer.
Mouse pointer
Insert Master
Table 3: Mouse pointer insert Master
Click on the position where the Master is to be inserted. The dialog box, from which one or more
Masters can be chosen, opens. The following types of Masters may be selected:
PROFIBUS Combi Master (PROFIBUS-FMS and PROFIBUS-DP) PB
PROFIBUS-DP Master DPM
Table 4: Selectable Master types
Figure 1: Insert > Master
In this window select the required Master by clicking on it in the Available Masters list and then click
the Add button to put the Master to Selected Masters. With OK confirm the selection and the Master
will be insert. This example shows a HE800PBM650-001 that is inserted with the Station address 0
and the Master0. Note for SmartStack masters only COMDPM and COMPB are valid.
PAGE 22 of 97
© Horner APG.This drawing is the property of Horner APG. And shall not be disclosed or reproduced except as specifically authorised.
EO 09-0009
Page 23
Profibus configuration MAN0575-04-EN
Profibus Modules User Manual
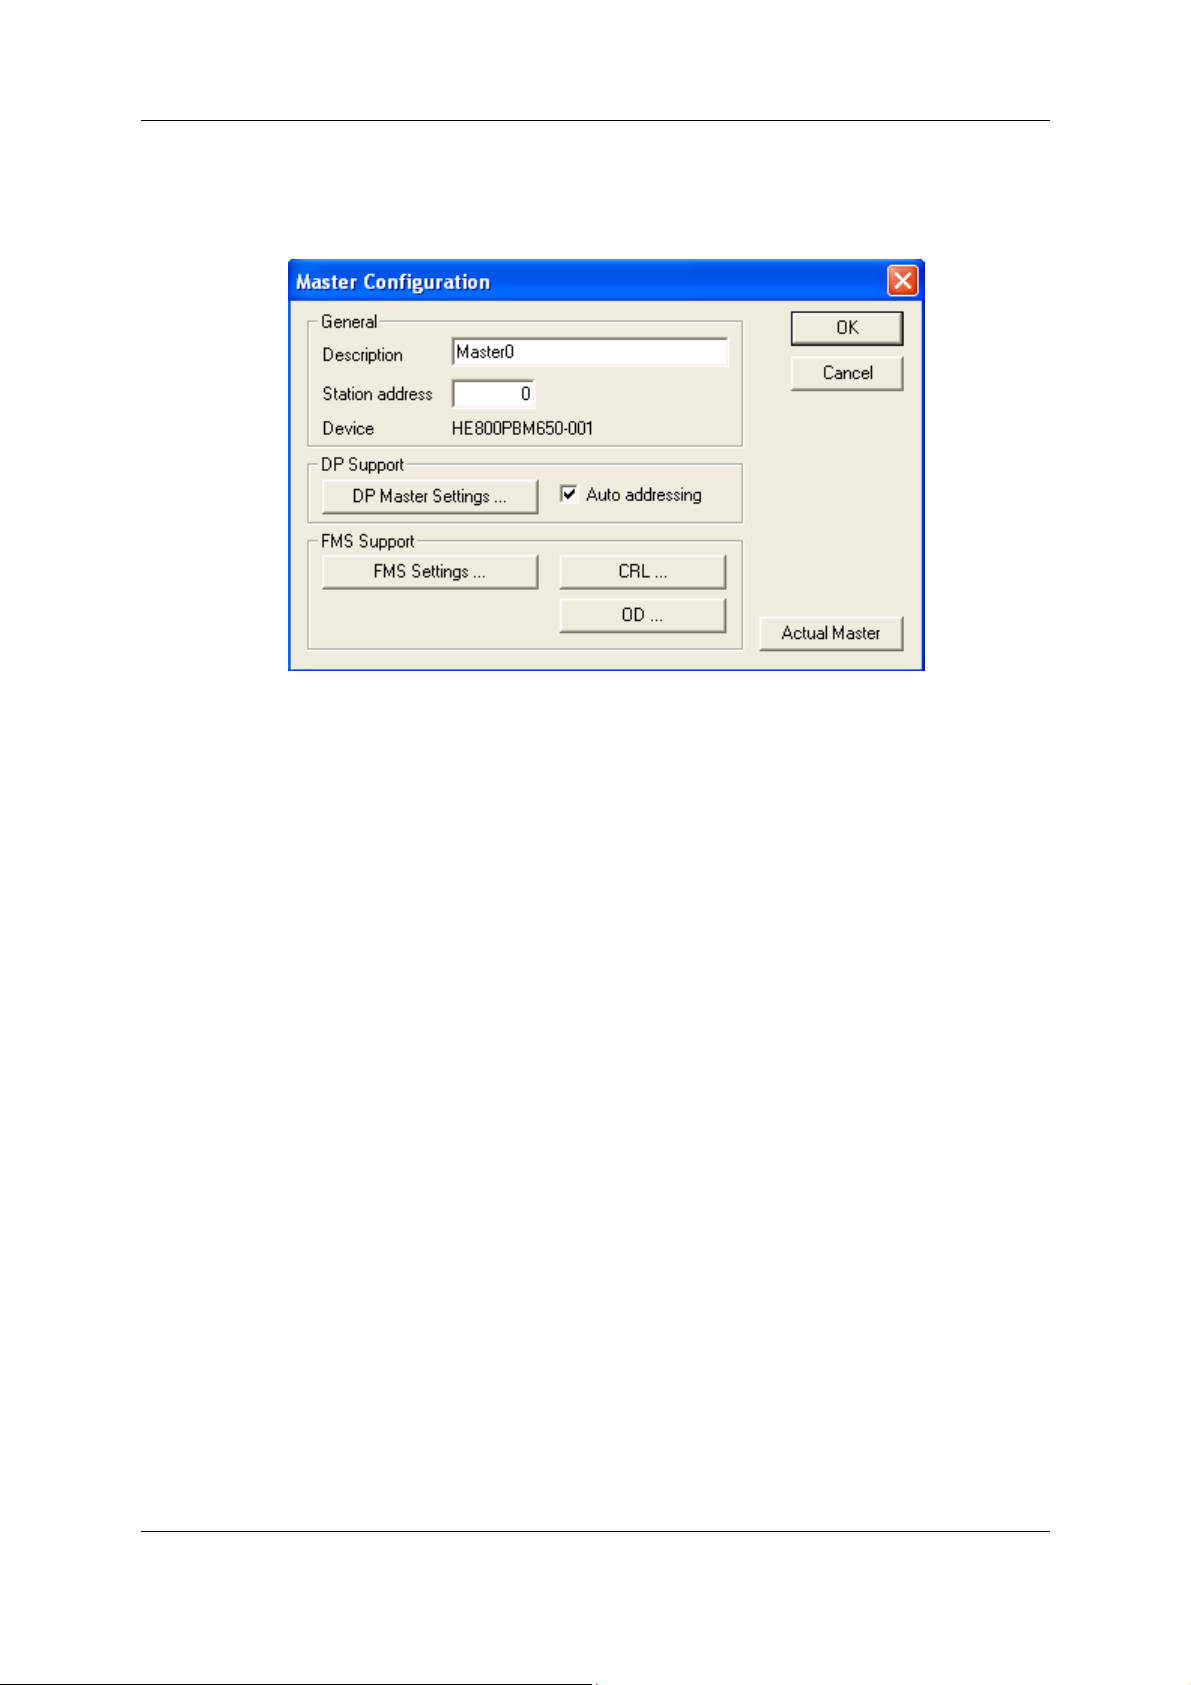
4.4 Master Configuration
The Master-specific configuration is carried out in the following window. Set the focus on the Master
(left mouse click) and then select the Settings > Master Configuration menu or double click on the
symbol of the Master to be configured, the following window will open.
Figure 2: Settings > Master Configuration
The following can be set in this Master Configuration window:
• A (symbolic) Description of the Master
• The Station address of the Master
• Selection of the Master as the Actual Master (for example as the download target)
The following parameters may be set for PROFIBUS-DP:
• Open the DP Master Settings window
• Activate or deactivate the automatic addressing (Auto addressing) for this DP Master.
PAGE 23 of 97
© Horner APG.This drawing is the property of Horner APG. And shall not be disclosed or reproduced except as specifically authorised.
EO 09-0009
Page 24

1
2
3
4
5
6
7
8
9
1
0
1
1
1
2
1
3
1
4
1
5
1
6
1
7
1
8
1
9
2
0
Profibus configuration MAN0575-04-EN
Profibus Modules User Manual
4.5 PROFIBUS-DP Auto Configuration
The Auto Configuration can be used to configure a Slave. The parameter data cannot be retrieved
from a PROFIBUS-DP Slave. Thus, if the Slave requires parameter data, it must be provided by the
user. The following is the procedure for Auto Configuration:
Action Menu in the System Configurator
Create a new project
•
Copy GSD file of the DP Slave, if the Slave is not in the
•
selection list
Choose Horner DP Master and provide bus address
•
Choose DP Slave and provide bus address
•
Set the bus parameter Mark the Master (left Mouse click), then
•
Set device assignment if no automatic assignment has
•
occurred
File > New > PROFIBUS
File > Copy GSD
Insert > Master
Insert > Slave
Settings > Bus Parameters
Mark the Master (left Mouse click), then
Settings > Device Assignment
Save project
•
Download Mark the Master (left Mouse click), then
•
Live List Mark the Master (left Mouse click), then
•
Start Debugger Mark the Master (left Mouse click), then
•
Device diagnostic Mark the Slave (left Mouse click), then
•
Compare Configuration
•
Automatic configuration
•
Stop Debugger
•
Save project
•
Download Mark the Master (left Mouse click), then
•
Start Debugger Mark the Master (left Mouse click), then
•
Device diagnostic Mark the Slave (left Mouse click), then
•
Stop Debugger
•
File > Save
Online > Download
Online > Live List
Online > Start Debug Mode
Online > Device Diagnostic
Compare Configuration
Automatic Configuration
Online > Stop Debug Mode
File > Save
Online > Download
Online > Start Debug Mode
Online > Device Diagnostic
Online > Stop Debug Mode
Transfer user data:
•
Write output, read input
Mark the Master (left Mouse click), then
Online > I/O Monitor
Figure 4.5. Auto Configuration (PROFIBUS-DP)
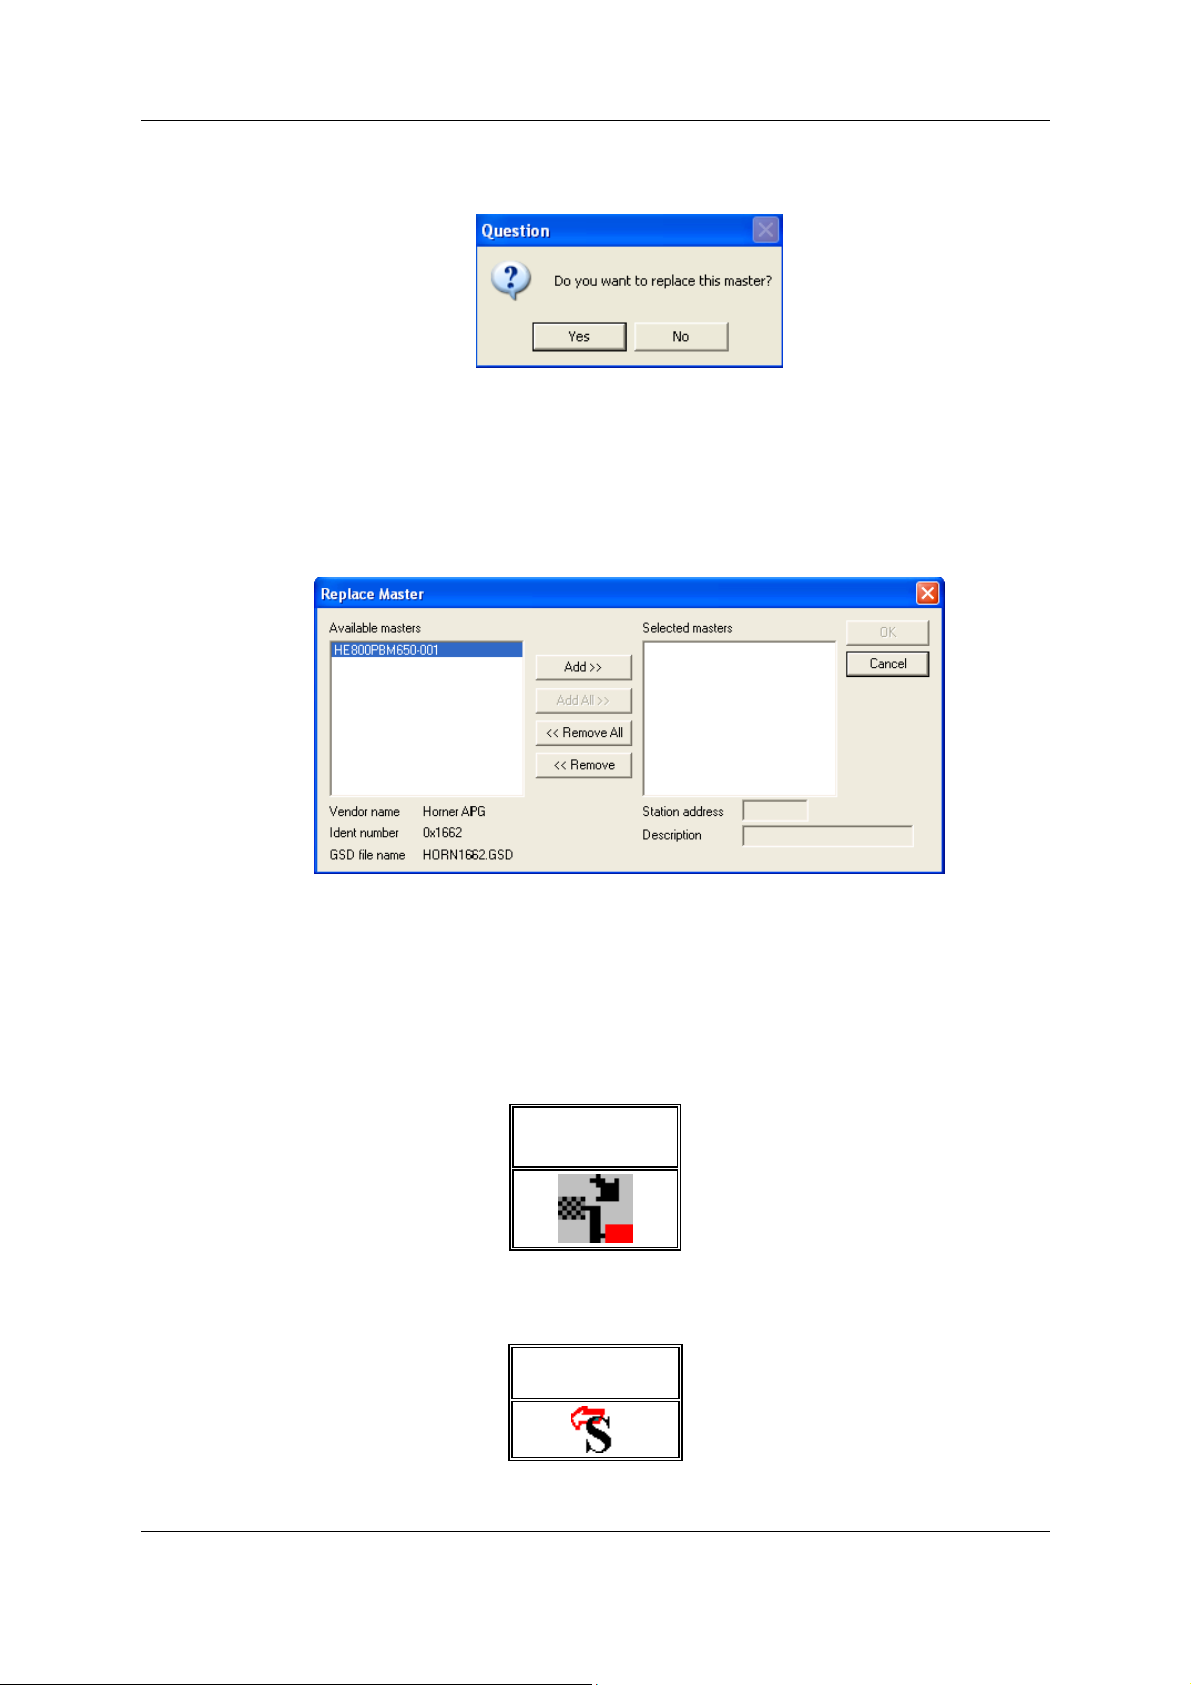
4.6 Replace Master
If a Master already exists in the configuration and should be replaced for another Master, first set the
focus on the Master (left mouse click on the Master) and then choose the menu Edit > Replace or
PAGE 24 of 97
© Horner APG.This drawing is the property of Horner APG. And shall not be disclosed or reproduced except as specifically authorised.
EO 09-0009
Page 25
Profibus configuration MAN0575-04-EN
Profibus Modules User Manual
Right mouse click on the Master and select Replace. In the newly opened window, the question
appears asking if the Master should be replaced.
Figure 3: Security question replace Master
Click the Yes button, a new window opens. Replace the Master for the required one.
Figure 4: Edit > Replace Master
Select the required Master by clicking on it in the Available Masters list. Click the Add button to put
the Master in the Selected Masters list. Confirm the selection by with OK and the Master will be
replaced.
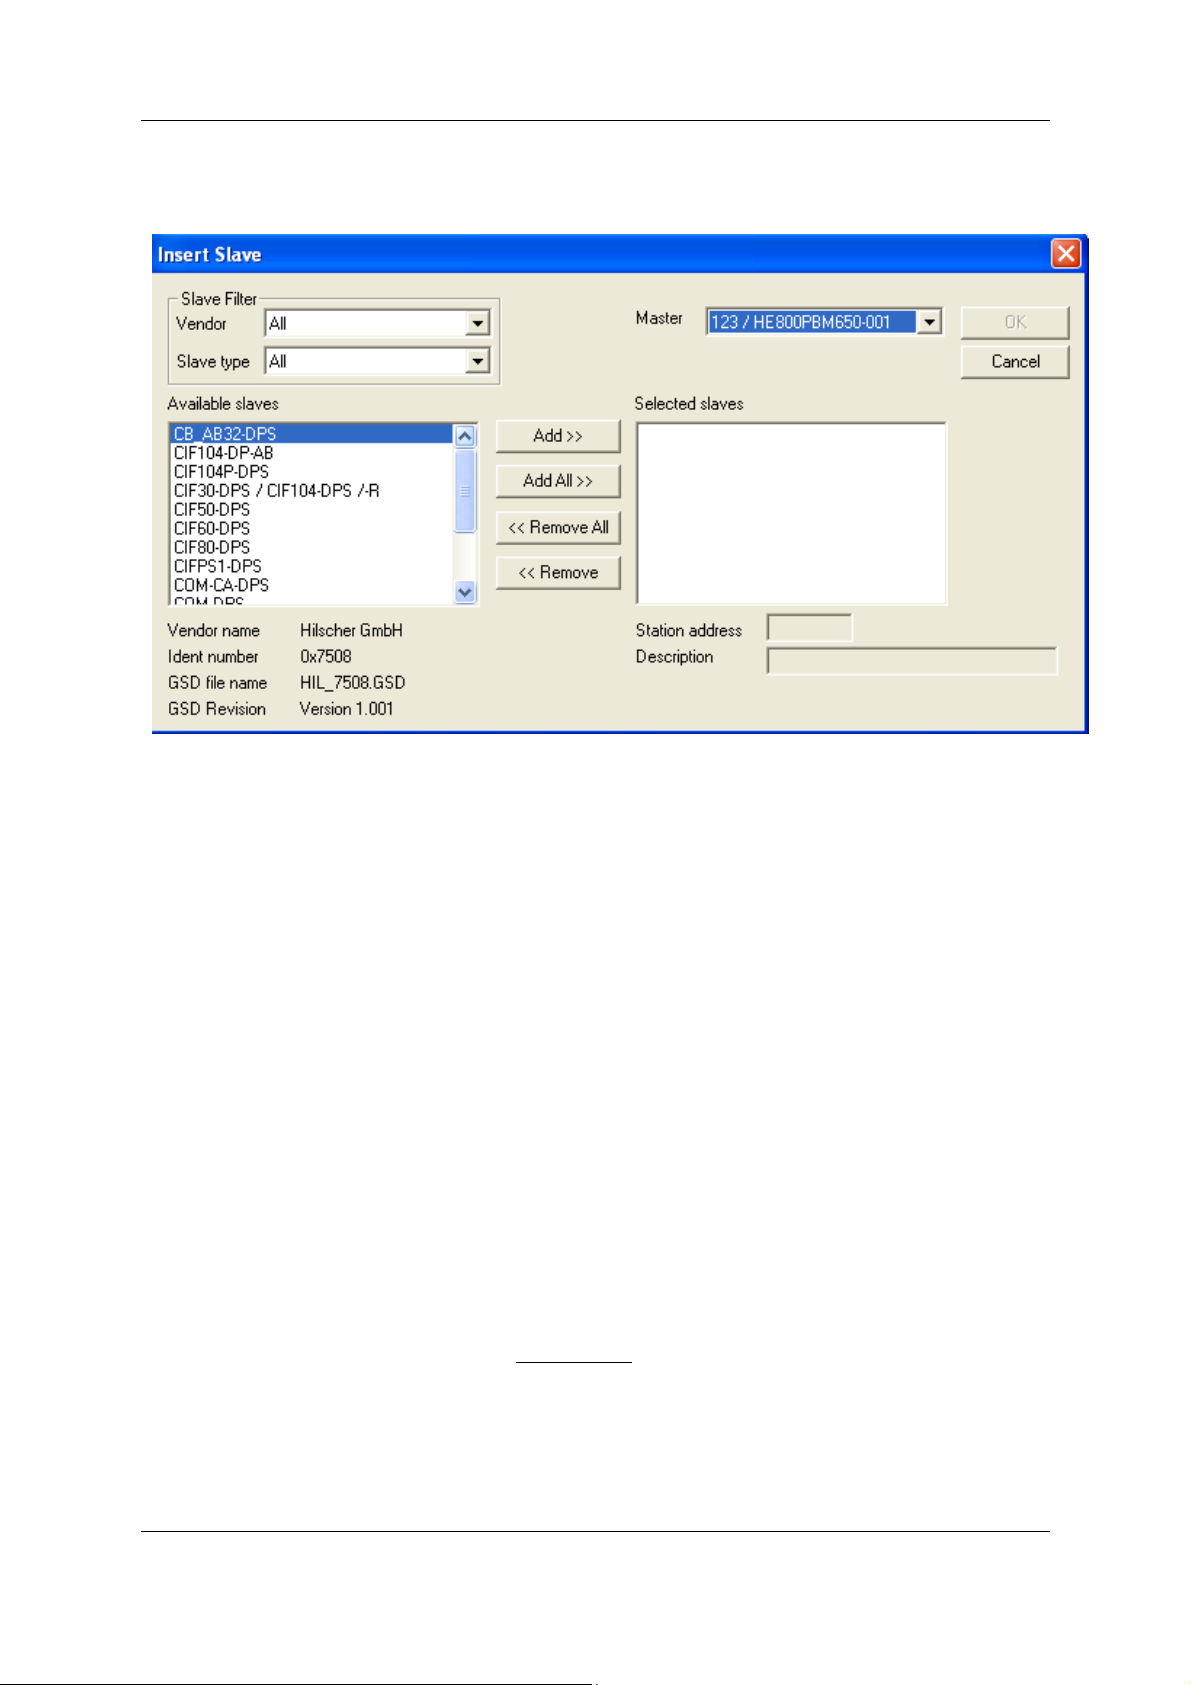
4.7 Insert DP Slave
To insert a PROFIBUS-DP Slave into the configuration, choose the Insert > Slave menu to open the
selection window, or click on the symbol:
Symbol
Insert > Slave
Table 5: Symbol Insert > Slave
The mouse pointer automatically changes to the Insert Slave pointer:
Mouse pointer
insert Slave
Table 6: Mouse pointer insert Slave
PAGE 25 of 97
© Horner APG.This drawing is the property of Horner APG. And shall not be disclosed or reproduced except as specifically authorised.
EO 09-0009
Page 26
Profibus configuration MAN0575-04-EN
Profibus Modules User Manual
Click on the position where the Slave is to be inserted. The dialog box, from which one or more
Slaves can be selected, opens:
Figure 5: Insert > Slave
The list on the left displays all the available Slave devices whose GSD files have been put in the GSD
directory. A filter can be used to limit the selection list to Slave type and Vendor (manufacturer).
Further information on a Slave is shown below the selection list (Available Slaves) when it is selected
(a mouse click). The Slave appears in the list Selected Slaves with a double click or with the Add
button.
All devices in the right-hand list are assigned to the current Master that is also shown in this window.
If the Slaves in the right-hand list are chosen, one after the other (a mouse click), then every Slave
can be allocated a Station address as well as a name in the Description field.
For every Slave accepted into the right-hand list, the station address count is automatically raised by
one but can be overwritten by the user in the Station address field.
Note: It is permissible to choose a Slave several times. However, each Slave must possess its own
(unique) station address in order to distinguish it on the network.
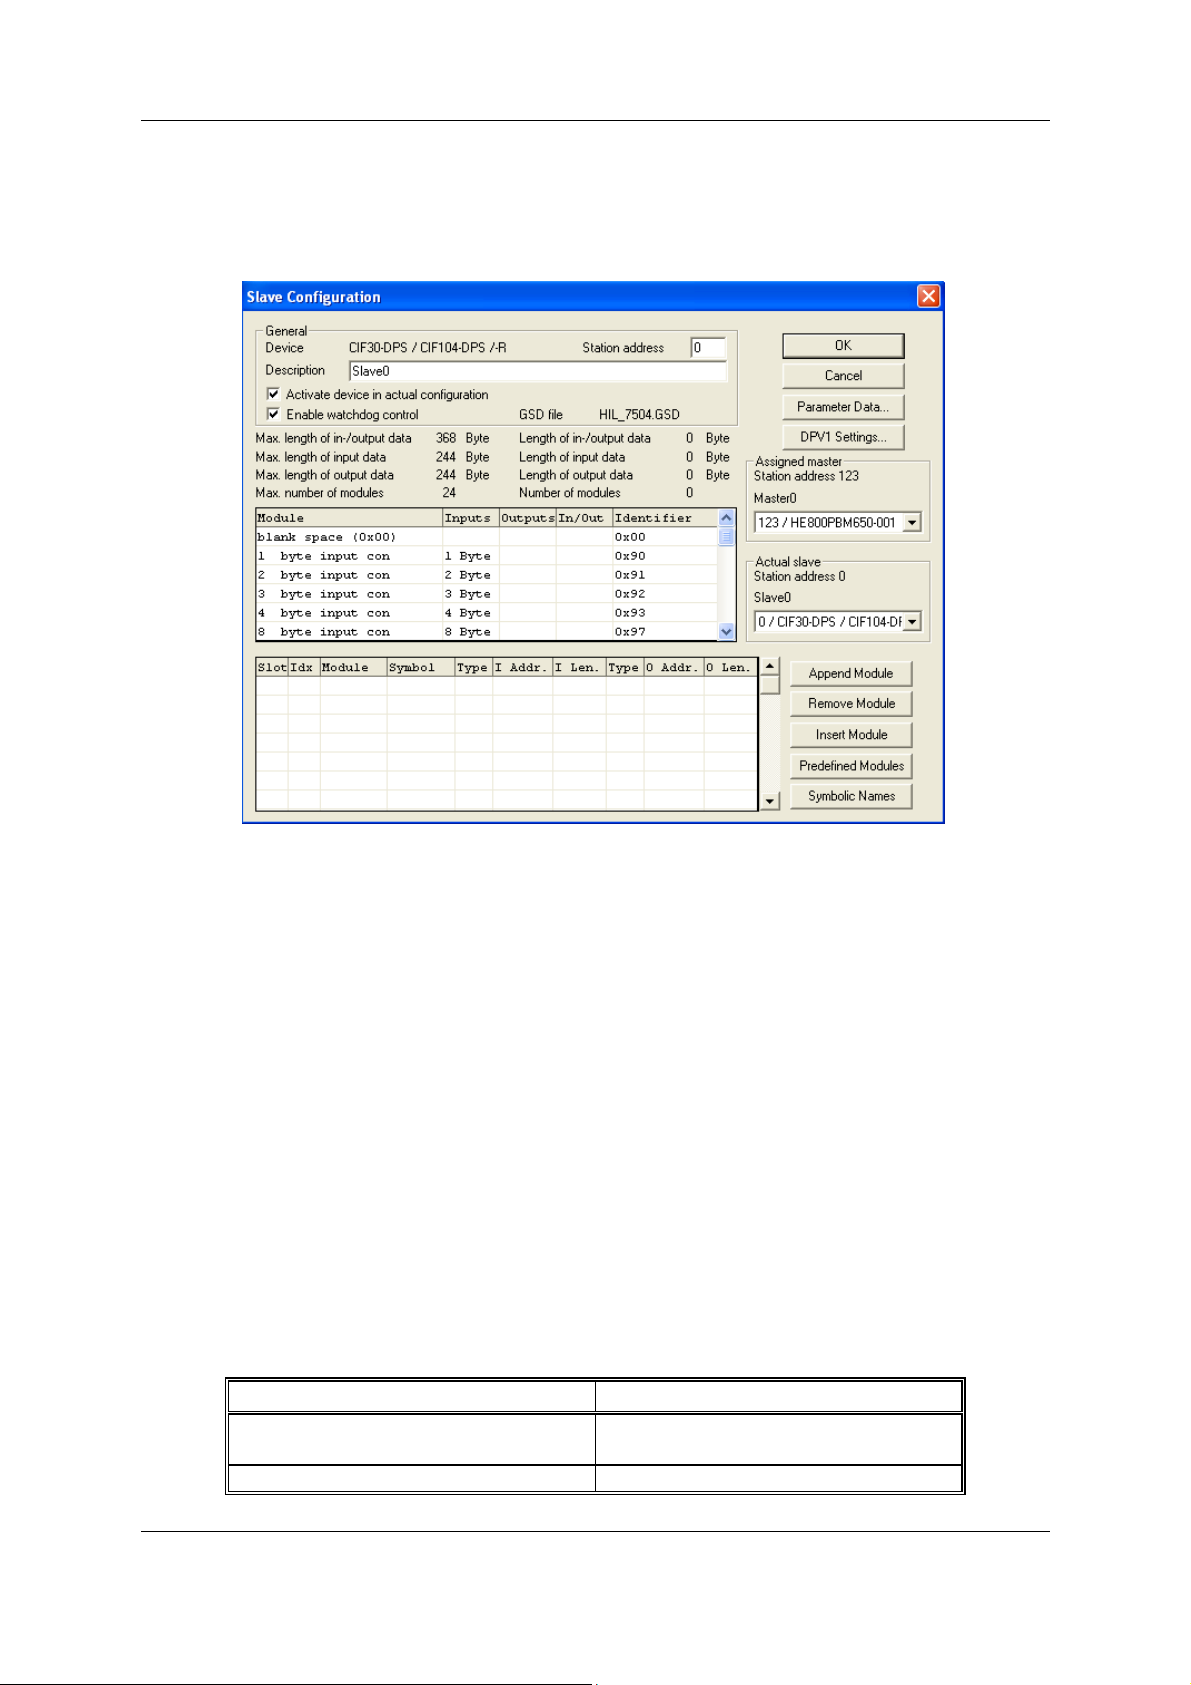
4.8 Slave Configuration
First click on the symbol of the Slave with the left mouse button and then choose the Settings >
Slave Configuration menu or open the Slave configuration window by double clicking on the
PROFIBUS-DP Slave device.
The Slave-specific configuration is carried out in this window. Here, the modules and their addresses
are allocated in the process data memory in the Master
. Note that the address must agree with that in
the PC application program.
Note 1: The information of the offset addresses refers to the addressing of the data in the Master!
The address information does not refer to the addressing of the data in the Slave! The Slave
organises its own data addressing.
PAGE 26 of 97
© Horner APG.This drawing is the property of Horner APG. And shall not be disclosed or reproduced except as specifically authorised.
EO 09-0009
Page 27
Profibus configuration MAN0575-04-EN
Profibus Modules User Manual
Note 2: With the SmartStack Slave, the input or output data at the bus are taken directly into the
Dual-port memory. The offset addresses refer to the Master.
There are two types of Slaves. A simple Slave has a fixed data length. The data length of a
modular Slave is configurable. A modular Slave can be understood as a combination of a simple
Slave with a Station address.
Figure 6: Settings > Slave Configuration
The selection list (upper list) shows all possible modules of the Slave. In the case of a simple Slave,
one module is shown and this is automatically copied into the configuration list (lower list). In the case
of a modular Slave, the user must select the required modules and transfer these by means of a
double click or transfer it using the Append Module button into the configuration list (lower list).
If a module consists of several sub-modules, then each sub-module is shown in the configuration list
(lower list) in a separate row. This is displayed by the number in the Slot column. The Index column
shows a sequential number for sub-modules.
For configuration of the modules (selection of the modules) of a Slave, proceed as follows:
Transfer all the required modules from the selection list (upper list) into the configuration list (lower
list). The sequence of the modules in the configuration list (lower list) is important and must be in
agreement with the Slave. Typically, the sequence follows the actual physical sequence. There are
Slaves to which this rule does not apply and where first analogue modules and then digital modules
must be entered, independent of their actual sequence.
In the configuration list (lower list) allocate the address of each module to the process depiction
memory. The address is entered separately in the Type and Addr columns for Inputs and Outputs.
The I/O addresses can be allocated by the user or can be automatically assigned by SyCon. For this
purpose Auto addressing must be activated or deactivated in the Master Configuration window:
Auto addressing activated Auto addressing deactivated
Auto addressing
(by SyCon)
The addresses will be allocated beginning
Manually addressing
(by the user)
The address 0 is shown in the I Addr or O
PAGE 27 of 97
© Horner APG.This drawing is the property of Horner APG. And shall not be disclosed or reproduced except as specifically authorised.
EO 09-0009
Page 28

Addr
Profibus configuration MAN0575-04-EN
Profibus Modules User Manual
with 0 and incremented in accordance with
the entry sequence of the Slaves before
downloading and can be viewed and
checked in the View > Address Table.
and must be overwritten by the user.
Table 7: Auto addressing activated / deactivated
Depending on the Addressing mode, which can be set in the DP Master Settings, the addresses
are either Byte or Word addresses. The DP Slaves utilise the Watchdog Control setting in order to
detect communication errors to the assigned DP Master. When the DP Slave finds an interruption of
an already operational communication, defined by a Watchdog time, then the Slave carries out an
independent Reset and places the outputs into the secure condition.
Caution: When the monitoring by means of the Watchdog Control has been deactivated, it is
possible that the outputs are not reset by the Slave, even though the communication has been
interrupted.
If Activate Device in the Current Configuration is selected, the process memory for this Slave is
occupied in the Master and data is exchanged. If this setting is switched off, the process memory for
this Slave is occupied in the Master and no data is exchanged.
4.9 Inserting Predefined Device – PDD
In order to insert predefined devices, choose Insert > PDD. This function is used for simple copying
or re-using already configured devices. Before this function can be used, a PDD Export must be
carried out as described in section PDD Export.
Figure 7: Inserting predefined device – PDD (1)
Select the PDD file and then Open. The following window appears:
PAGE 28 of 97
© Horner APG.This drawing is the property of Horner APG. And shall not be disclosed or reproduced except as specifically authorised.
EO 09-0009
Page 29

Profibus configuration MAN0575-04-EN
Profibus Modules User Manual
Figure 8: Inserting predefined device – PDD (2)
Select the device or devices of the Found predefined devices (left-hand side), pull this over to the
Selected predefined devices (right-hand side) and release the left mouse button (drag and drop).
The following picture will appear:
Figure 9: Inserting predefined device – PDD (3)
The figure shows a device with the description PC_Slave consisting of two modules with the
description Module1 and Module2. Choose Ok in order to insert the device into the configuration.
The station address of the device can be altered subsequently.
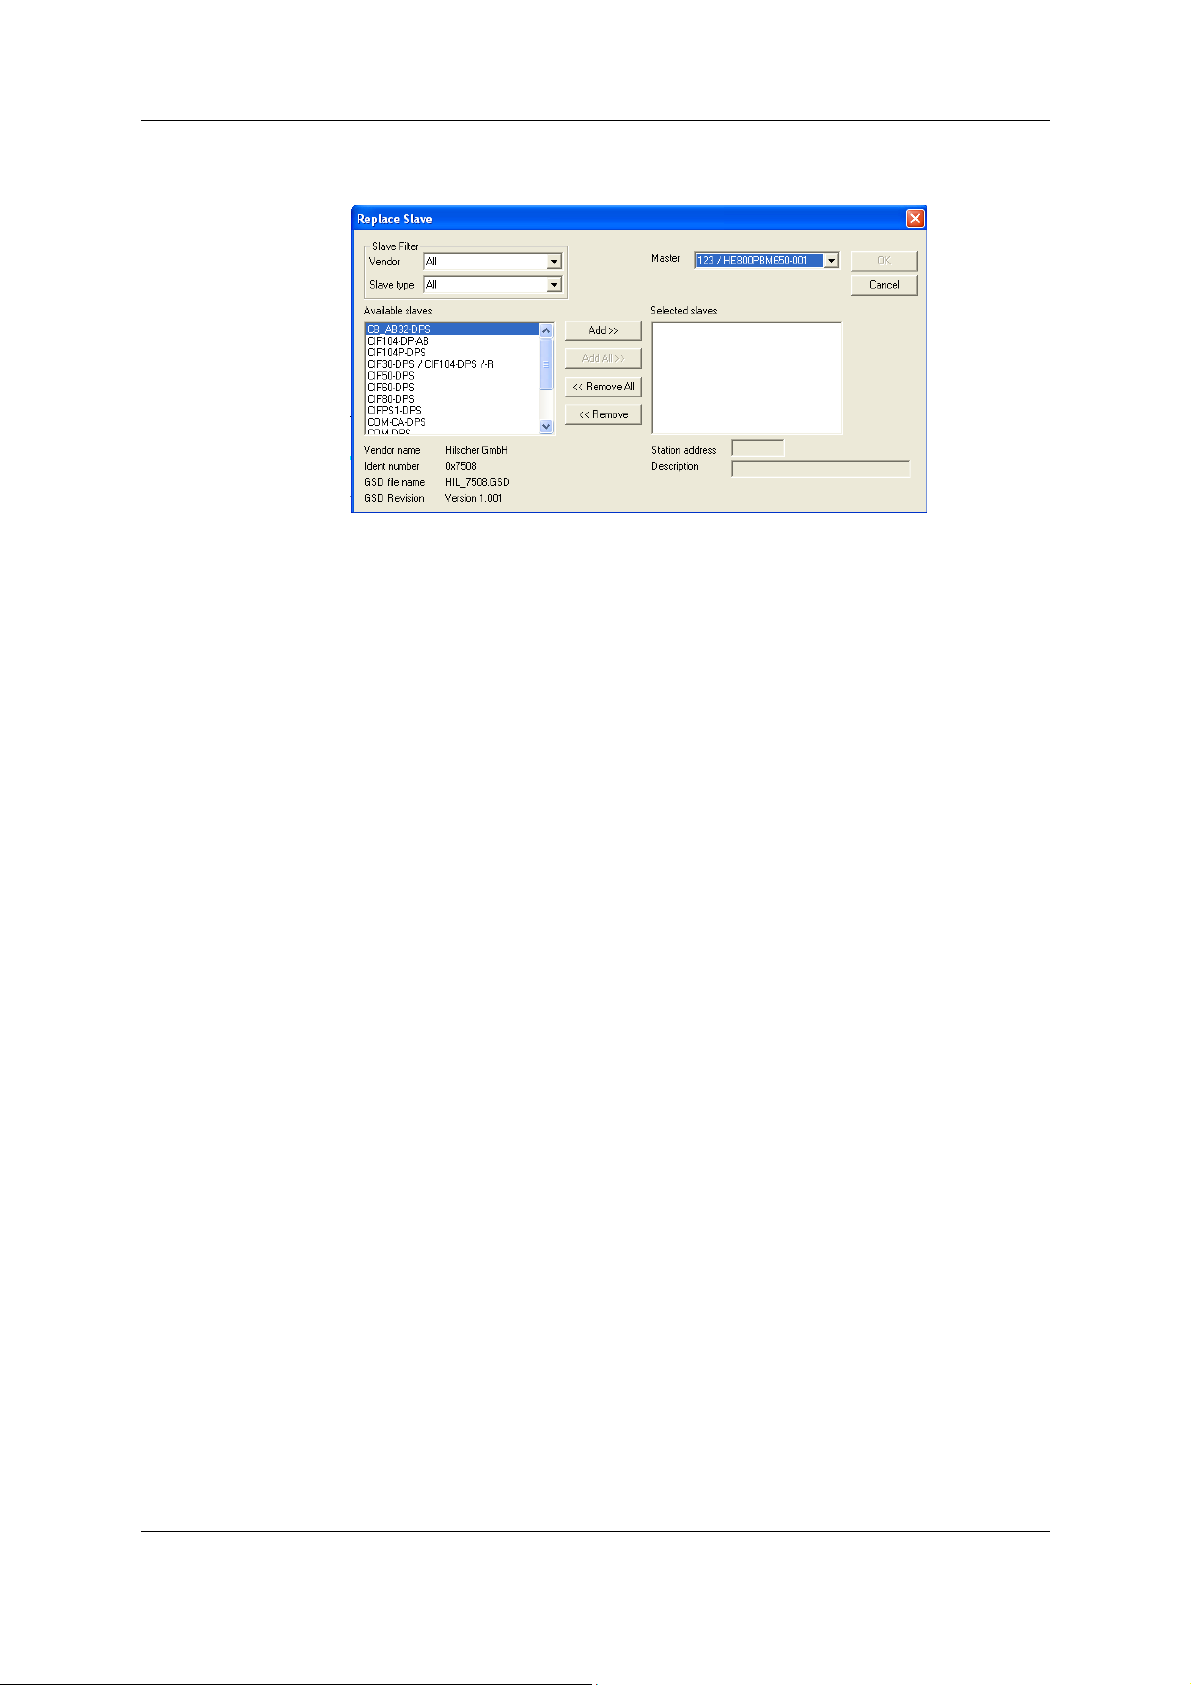
4.10 Replace Slave
If a Slave already exists in the configuration and should be replaced with another Slave, first set the
focus on the Slave (left mouse click at the Slave) and then choose the menu Edit > Replace or right
click the on the Slave and select Replace. In the new window, the question appears asking if the
Slave should be replaced.
Figure 10: Security question replace Slave
PAGE 29 of 97
© Horner APG.This drawing is the property of Horner APG. And shall not be disclosed or reproduced except as specifically authorised.
EO 09-0009
Page 30
Profibus configuration MAN0575-04-EN
Profibus Modules User Manual
Click the Yes button a new window opens, allowing the replacement of the current Slave with another
one.
Figure 11: Edit > Replace Slave
In this window, select the required Slave by clicking on it in the Available Slaves list. Clicking the
Add button puts the Slave in the list Selected Slaves. With OK confirm the selection and the Slave
will be replaced.
PAGE 30 of 97
© Horner APG.This drawing is the property of Horner APG. And shall not be disclosed or reproduced except as specifically authorised.
EO 09-0009
Page 31

Page 32

Setings MAN0575-04-EN
Profibus Modules User Manual
CHAPTER 5: SETTINGS
5.1 Device Assignment
The Device Assignment setting determines how the System Configurator communicates with the device. This
is set in the device arrangement via the menu Settings > Device Assignment. The following possibilities are
available:
------------------------------------- CIF Serial Driver -------------------------------------
Figure 12: Driver selection – CIF Serial Driver
CIF Serial Driver:
CIF Serial Driver: The HSystem Configurator communicates with the SmartStack device over a serial
connection. The serial interface of the PC must be connected via a cable (straight) with the diagnostic
interface of the SmartStack device. The cable is standard straight through Programming cable.
Choose the CIF Serial Driver and then OK, in order to select the CIF Serial Driver. The connection must first
be established using the relevant COM port checkbox. The ports available will depend upon the number of
ports installed in the PC. and free.
The System Configurator sends a request to the corresponding COM interface and polls the Firmware of the
device. A display of the Firmware will indicate when a device is connected. In the event that no device is
connected a Timeout error (-51) appears.
Figure 13: CIF Serial Driver – Device Assignment
The error number –20 indicates that this COM interface is not available or already in use.
5.2 Bus Parameters
The Bus Parameters are the foundations of a functioning data exchange. This section contains information
for setting the Bus Parameters as well as the descriptions of the individual parameters.
Basic Rule: The Bus Parameters must be set the same
for all devices. The Station Address, on the other
hand, must be different from device to device.
PAGE 32 of 97
© Horner APG.This drawing is the property of Horner APG. And shall not be disclosed or reproduced except as specifically authorised.
EO 09-0009
Page 33

Setings MAN0575-04-EN
Profibus Modules User Manual
For PROFIBUS Master devices (PROFIBUS-DP):
The Bus Parameters are set.
Most of the PROFIBUS-DP Slave devices
Recognize the Baud rate automatically and adapt to it. This is especially the case when the ASIC SPC3 is
used.
There are also PROFIBUS-DP Slave devices, in which the Bus Parameters must be set by the user.
5.3 Setting the Bus Parameters and Profiles
The Baud rate can be set in the Settings > Bus Parameters menu. Furthermore, the optimising or profile
can be selected.
Figure 14: Settings > Bus Parameters
The Bus Parameters may be viewed with the Settings > Bus Parameters menu and may be edited by
clicking on the Edit button. The Bus Parameters may or may not be edited depending upon the optimising or
profile selected. The optimising standard provides each Baud rate with default Bus Parameters for
PROFIBUS-DP systems. By changing the settings in the Optimising field from Standard to User defined,
all Bus Parameters may be edited.
Figure 15: Editing Bus Parameters
Caution: Changing the Bus Parameters can cause communication interruptions.
PAGE 33 of 97
© Horner APG.This drawing is the property of Horner APG. And shall not be disclosed or reproduced except as specifically authorised.
EO 09-0009
Page 34

Setings MAN0575-04-EN
Profibus Modules User Manual
Note: The offline Bus Parameters are displayed. The Bus Parameters are only accepted by the device upon
download of the configuration.
The Baud rate must be set to be the same for all devices on the bus. The result of changing the Baud rate is
that all other parameters must be re-calculated. The System Configurator tests whether the Baud rate is
supported by all configured PROFIBUS-DP Slave devices based on entries in the GSD files. If the System
Configurator recognizes at least one device that does not support the selected Baud rate, then an error
message will appear.
The highest station address is the highest bus address up to which a Master searches for another Master
on the bus in order to pass on the Token. This station address must on no account be smaller than the
Master station address.
For PROFIBUS-DP, the field Access monitoring time is used for the entry of the monitoring time of the
Slave. If the time chosen for this is too short for a low Baud rate, then it is possible that the Slaves will set
their outlets to zero. If the time chosen is too long, it is possible that if an interruption occurs, the Slaves will
take a long time to set their outlets to zero.
For PROFIBUS-DP, the Auto Clear setting is provided for global error handling. The DP Master monitors the
user data exchange (Data Exchange) to all DP Slaves by means of a timer. If no data exchange occurs to at
least one DP Slave, or an existing data exchange takes place after the expiration of a monitoring time, and the
Auto clear mode option is ON, then the Master leaves the Data Exchange and sets the outlets of all
assigned DP Slaves into a secure condition.
5.4 Description of the Individual Parameters
All times for the Bus, parameters are given in Bit times.
The Bit time t
is the result of the reciprocal of the Baud rate:
Bit
t
= 1 / Baud rate (Baud rate in Bit/s)
Bit
The conversion from milliseconds into a Bit time is shown in the following formula:
Bit time = Time [milliseconds] * Baud rate,
Formula 2: Conversion into Bit time t
The Bus parameters and their meanings:
Baud rate
Transfer speed: number of Bits per second.
Baud rate Bit time (t
9,6 kBaud 104,2 us 1200 m
19,2 kBaud 52,1 us 1200 m
93,75 kBaud 10,7 us 1200 m
187,5 kBaud 5,3 us 1000 m
500 kBaud 2 us 400 m
1,5 Mbaud 666,7 ns 200 m
3 Mbaud 333,3 ns 100 m
6 Mbaud 166,7 ns 100 m
12 Mbaud 83,3 ns 100 m
Formula 1: Bit time t
Max cable length (type
)
Bit
Bit
Bit
A)
Table 8: Baud rates, Bit times and cable lengths
Note: The maximum cable length is dependent on the Baud rate.
PAGE 34 of 97
© Horner APG.This drawing is the property of Horner APG. And shall not be disclosed or reproduced except as specifically authorised.
EO 09-0009
Page 35

Setings MAN0575-04-EN
Minimum Station Delay of Responders (min T
Profibus Modules User Manual
)
SDR
This is the shortest time period that must elapse before a remote recipient (Responder) may send an
acknowledgement of a received query telegram. The shortest time period between receipt of the last Bit
of a telegram to the sending of the first Bit of the following telegram.
Value range: 1 .. 65535
Maximum Station Delay of Responders (max T
SDR
)
This is the longest time period that must elapse before a Sender (Requestor) may send a further query
telegram. Greatest time period between receipt of the last Bit of a telegram to the sending of the first Bit
of the following telegram.
The Sender (Requestor, Master) must wait at least for this time period upon sending an unacknowledged
telegram (e.g. Broadcast only) before a new telegram is sent.
Value range: 1 .. 65535
Slot Time (T
)
SL
'Wait for receipt' – monitoring time of the Senders (Requestor) of telegram for the acknowledgement of the
recipient (Responder). After expiration, a retry occurs in accordance with the value of 'Max. telegram
retries'.
Value range: 52 .. 65535
Quiet Time (T
QUI
)
This is the time delay that occurs for modulators (Modulator-trip time) and Repeaters (Repeater-switch
time) for the change over from sending to receiving.
Value range: 0 .. 255
Setup Time (T
SET
)
Minimum period “reaction time” between the receipt of an acknowledgement to the sending of a new
query telegram (Reaction) by the Sender (Requestor).
Value range: 1 .. 255
Target Rotation Time (T
TR
)
Pre-set nominal Token cycling time within the Sender authorization (Token) will cycle around the ring.
How much time the Master still has available for sending data telegrams to the Slaves is dependent on
the difference between the nominal and the actual token cycling time.
Value range: 1 .. 16.777.215
GAP Update Factor (G)
Factor for determining after how many Token cycles an added participant is accepted into the Token ring.
After expiry of the time period G*T
, the Station searches to see whether a further participant wishes to
TR
be accepted into the logical ring.
Value range: 1 .. 100
Max number of telegram retries (Max_Retry_Limit)
Maximum number of repeats in order to reach a Station.
Value range: 1 .. 8
Highest Station Address (HSA)
Station address of the highest active (Master) Station.
Value range: 2 .. 126
Further, there are:
Ready time (T
RDY
)
This is the time period, after the Master has sent out a query, during which it must be ready for the
respective acknowledgement or answer.
PAGE 35 of 97
© Horner APG.This drawing is the property of Horner APG. And shall not be disclosed or reproduced except as specifically authorised.
EO 09-0009
Page 36

Setings MAN0575-04-EN
Synchronization time (T
SYN
)
Profibus Modules User Manual
This is the minimum time that must be available to each device as a rest condition before it is allowed to
accept the start of a query. It is defined at 33 Bit times.
The following parameters are applicable only for PROFIBUS-DP:
Data Control Time (Data_Control_Time)
This parameter defines the time within the Data_Transfer_List is updated at least once. After the
expiration of this period, the Master (class 1) reports its operating condition automatically via the
Global_Control command.
Value range: 1 .. 65535 (time basis 10ms)
Min Slave Interval (Min_Slave_Interval)
This parameter defines the minimum time period between two Slave list cycles. The maximum value that
the active Stations require is always given.
Value range: 1 .. 65535 (time basis 100us).
Access Monitoring (T
Access monitoring T
)
WD
at the Slave ensures that when an interruption of the DP Master occurs, the
WD
outlets are placed in a secure condition after this time period.
Poll Timeout (Poll_Timeout)
This parameter defines the maximum time period in a Master-Master relationship within which the
answer must be fetched by the Requestor.
Value range: 1 .. 65535 (time basis 1ms).
T
and T
ID1
ID2
This is the time that the Sender spends at idle after the receipt of the last Bit of a telegram on the Bus,
until the first Bit of a new telegram is sent on the Bus.
Depending on the type of the telegram:
T
starts after the Initiator has received an acknowledgement, answer or a Token telegram.
ID1
T
= max (T
ID1
+ 2 * T
QUI
+ 2 + T
SET
SYN
min T
SDR
). (*)
T
starts after the Initiator has sent a telegram that is not acknowledged.
ID2
These times cannot be set directly, they result from the given calculations.
(*) Depending on the ASIC and Baud rate utilized, the T
values due to the ASIC software.
5.5 Rules
© Horner APG.This drawing is the property of Horner APG. And shall not be disclosed or reproduced except as specifically authorised.
T
= max (T
ID2
For min T
0 < min T
For T
T
QUI
QUI
< T
, T
RDY
+ 2 * T
QUI
, max T
SDR
< max T
SDR
SDR
Formula 5: Min T
and min T
RDY
< min T
SDR
.
Formula 3: T
+ 2 + T
SET
Formula 4: T
ID1
SYN
ID2
max T
and T
ID1
). (*)
SDR
can take on somewhat different
ID2
and TSL the following rule applies:
< TSL
SDR
, Max T
SDR
the following rule applies:
SDR
PAGE 36 of 97
SDR
and T
SL
EO 09-0009
Page 37

Setings MAN0575-04-EN
Profibus Modules User Manual
Formula 6: T
QUI
, T
RDY
and min T
SDR
For access monitoring (T
) and Target Rotation Time (TTR):
WD
TWD > TTR
Formula 7: TWD and T
For the Data_Control_Time the following rule applies:
Data_Control_Time > 6 * TWD
Formula 8: Data_Control_Time
If the devices used have different values for min T
greatest of these values is used for all devices.
Min T
)
N
= max (min T
SDR
SDR device 1
Formula 9: Min T
Example: If for device 1 the value for min T
200, for device 2 the values 75 and for device 3 the value 125,
SDR
then the value of 200 must be used for all devices.
The same applies also for the Bus parameters max T
, min T
, TSL, T
SDR
TR
SDR device 2
SDR
, T
QUI
SDR
, ..., min T
and TTR.
SET
then the
SDR device
PAGE 37 of 97
© Horner APG.This drawing is the property of Horner APG. And shall not be disclosed or reproduced except as specifically authorised.
EO 09-0009
Page 38

Page 39

DP Master MAN0575-04-EN
Profibus Modules User Manual
CHAPTER 6: DP MASTER
6.1 Master Settings
To enter the DP Master settings, choose the Settings > Master Settings or click with the right mouse
button on the corresponding Master symbol and select Master Settings from the list that opens. The
DP Master Settings are also available in the Master Configuration window.
The DP Master settings contain parameters that determine the behaviour of the Master device as well
as the user interface. These settings are only valid for Horner devices and are included in the
download of the configuration.
Figure 16: DP Master Settings
Startup behaviour after system initialisation
When Automatic release of the communication by the device has been set, the Master device
starts to exchange data on the Bus once initialisation is complete. When Controlled release of
communication by the application program has been set, the application program must activate
the data exchange on the Bus.
User program monitoring
The Watchdog time determines how long the device waits for a triggering of the software Watchdog
by the application program until it sets the outputs of the Slave devices to zero. This function must be
activated by the user program and does not start automatically. The value must be set to zero on
current Horner modules.
Addressing mode
The addressing mode of the process data image determines how the addresses (Offsets) of the
process data are interpreted. Either of the addressing modes Byte addresses or Word
addresses are possible.
Storage format (word module)
PAGE 39 of 97
© Horner APG.This drawing is the property of Horner APG. And shall not be disclosed or reproduced except as specifically authorised.
EO 09-0009
Page 40

DP Master MAN0575-04-EN
Profibus Modules User Manual
The storage format determines how the data words are laid down in the process image. For the
Word data type it is possible to choose high/low (big Endian) value Byte or low/high value Byte
(little Endian).
Handshake of the process data
These various types are used for setting the handshake of the process data of the Master. The
choice of used type is important for the correct data exchange between the application program
and the device. The chosen handshake of the process data must be supported by the application
program. For all Horner modules select the buffered, host controlled handshake.
Hardware parameter
This parameter displays the size of the dual-port memory. The value enlarges or reduces the
permissible address area for the process data addresses.
For the Horner Profibus master the size of the dual-port memory is 8K.
For the Horner DP Slave the size of the dual-port memory is 2K.
6.2 Group Membership
After the Master has been assigned, the Slaves can be assigned to up to eight different groups.
These groups can then be assigned here. Choose the Settings > Group membership menu.
Choose the group that is to support the DP-Freeze and DP-Sync commands.
Figure 17: Settings > Group Membership (1)
In the Group Membership, the Slaves can be assigned to the groups with the desired characteristics.
The table shows all configured Slave devices from the main editor window. Here it is possible to
select which of up to eight possible groups the Slave is assigned. The selected group membership is
transferred to the Slaves during their start-up sequence. The group membership acts as a filter for
the Sync and Freeze global commands. These are output as Broadcast telegrams in order to
synchronize the input and output data of several Slaves. Only those Slaves in whose group these
commands have been released react to it.
PAGE 40 of 97
© Horner APG.This drawing is the property of Horner APG. And shall not be disclosed or reproduced except as specifically authorised.
EO 09-0009
Page 41

DP Master MAN0575-04-EN
Profibus Modules User Manual
Figure 18: Settings > Group Membership (2)
PAGE 41 of 97
© Horner APG.This drawing is the property of Horner APG. And shall not be disclosed or reproduced except as specifically authorised.
EO 09-0009
Page 42

DP Slave MAN0575-04-EN
Profibus Modules User Manual
CHAPTER 7: DP SLAVE
7.1 Slave Settings
The DP Slave Settings contain parameters that define the behaviour of the device at the user
interface, which do not belong to the DP configuration. This menu point is applicable only to Horner
devices. These settings are transferred with the download of the DP configuration to the device. In
order to open the DP Slave settings menu, first choose the Slave by clicking on it and then open the
window in the Settings > DP Slave Settings menu.
Figure 19: DP Slave Settings
Handshake of the process data
These various functions select the Handshake of the process data of the Slave. The selection of
the function is important for the correct data exchange between the application and the device.
Select ‘Buffered Host Controlled’ for all Horner Slave modules.
Configuration mode
If the Slave device is to use the parameters of the configuration that is downloaded from SyCon
then the Configuration by SYstem CONfigurator mode must be selected for the Configuration
mode. If the DP configuration is written online from an application into the Dual-port memory,
then the Configuration by Application mode must be selected.
PAGE 42 of 97
© Horner APG.This drawing is the property of Horner APG. And shall not be disclosed or reproduced except as specifically authorised.
EO 09-0009
Page 43

DP Slave MAN0575-04-EN
Profibus Modules User Manual
User program monitoring
The Watchdog time determines how long the device will wait for an application triggering until it
resets all outputs to zero. For current firmware versions, this must be set to zero.
Start-up behaviour after system initialisation
When Automatic release of the communication by the device has been chosen, then the
Slave is ready to communicate with the Master. When Controlled release of the
communication by the application program has been chosen, then the user must release the
communication by means of a defined release procedure. The current firmware version expects
the ‘Automatic release’ option to be chosen.
Configuration data
For Standard, the configuration of the Slave is compared with that from CHK_CFG_TELEGRAM
from the Master.
For Forced by CHK_CFG_TELEGRAM, the configuration of the Slave is transferred from the
Master to the Slave with the CHK_CFG_TELEGRAM. The normal (default) is ‘Standard’.
DPV1 Parameter
Class 1 Buffer length: This setting defines the size of the buffer for DPV1 class 1 services in the
DP Slave. The length determines the maximum data count that can be transferred in a DPV1
class 1 telegram. From the buffer size set here, 4 Bytes are reserved for the transfer of the DPV1
administration data and these are not available for transfer of user data.
Valid values for the length of class 1 buffer are in the range of 4 .. 244. Alterations of the size of
the buffer can only be set in the Slave configuration dialog, if the DPV1 services for the Slave
have been activated.
Class 2 Buffer length: The length of the DPV1 class 2 buffer that is to be established must be
defined in this field. Similar to the configuration of the class 1 buffer, here, 4 Bytes of the given
buffer length are reserved for the transfer of the DPV1 administration data. The maximum
transferable user data count is reduced by these 4 Bytes. Values in the range 48 .. 244 can be
defined for the DPV1 class 2 buffer lengths. If the value 0 is entered, then the DP Slave lays
down no DPV1 class 2 buffer. In this case, the DPV1 class 2 services of the Slave are not
available.
Note: Please note that the settings of the class 1 and class 2 buffer lengths influence the usable
data width in the cyclical I/O region. This limitation is caused by the restricted memory space in
the slave device. The purpose of the examples in the following table is to show how to estimate
the usable buffer length and I/O data width.
Example
Maximum I/O data 368 60 0
Maximum DPV1 class 1 buffer 304 244 0
Maximum DPV1 class 2 buffer 296 0 244
Maximum DPV1 class 1 buffer and
Maximum DPV1 class 2 buffer
128 Bytes for DPV1 class 1 buffer 344 128 0
128 Bytes for DPV1 class 2 buffer 328 0 128
128 Bytes for DPV1 class 1 buffer and
128 Bytes for DPV1 class 2 buffer
Cyclic I/O
data
200 244 244
280 128 128
DPV1 class 1
buffer
DPV1 class 2
buffer
Table 9: Buffer length for DPV1
In the case that the given lengths for buffer and I/O data exceeds the memory space available, the DP
Slave will report an error after the configuration download. This error message can be seen in the
extended device diagnostic of the Slave in the ’SPC3’ section under ‘Last Error’. If the error code 75
is entered there, more memory has been requested in the PROFIBUS-ASIC than is available.
Therefore, the DPV1 buffer length or I/O data width should be reduced and the configuration
download should then be carried out again.
PAGE 43 of 97
© Horner APG.This drawing is the property of Horner APG. And shall not be disclosed or reproduced except as specifically authorised.
EO 09-0009
Page 44

DP Slave MAN0575-04-EN
Profibus Modules User Manual
7.2 Parameter Data
The Parameter Data can be edited in the Settings > Parameter Data menu. If default parameters
are configured in the GSD file of the Slave, then these are automatically inserted when the menu is
opened for the first time. Some of the DP Slave devices require further Parameter data, for instance
in order to change a measuring limit or a value range. This type of data is Slave specific and their
functionality cannot be described here. The window below gives an example of parameter data of a
Slave.
Figure 20: Parameter Data (Hexadecimal depiction)
A modular PROFIBUS-DP Slave station could require parameter data for one or more modules and
for the Slave station itself (main station). There are three options:
Parameter data - These are all the parameters of a Slave station.
Common - Parameter Data of the main station.
Module - Parameter Data for one of the modules.
After the choice of the text button, the following window with the text parameter data appears. These
parameters are for the main station:
Example for parameter data:
Figure 21: Parameter Data (Text depiction)
PAGE 44 of 97
© Horner APG.This drawing is the property of Horner APG. And shall not be disclosed or reproduced except as specifically authorised.
EO 09-0009
Page 45

DP Slave MAN0575-04-EN
Profibus Modules User Manual
To edit the value double click on a row of parameter data.
Figure 22: Parameter Data (individual depiction)
Or to change the DPV1 description via the text setting.
Figure 23: Parameter Data
When several modules in the Slave configuration have been selected, then it is also possible to
change the module parameters by means of a double click on its associated line.
7.3 DPV1 Parameter
DPV1 serves for a cyclic data exchange and offers read, write and alarm processing functions.
The following information refers to Horner devices.
Figure 24: DPV1 Settings
Additional Slave Functions
Cyclic Connection
When Abort if Slave is not responding is chosen, the Master does not remain in the
DATA_EXCHANGE condition for the faulty Slave if the Slave has been recognized as faulty, but
breaks off the connection to the Slave. The Slave will in any case delete the outputs even when
the connection in the direction of the Slave is still functionally correct but the return for the answer
telegram to the Master is interrupted.
Fail Safe Support
This mode indicates to the Master that the affected Slave is working in a so-called Fail-Safe
mode. If the mode is activated, the Master will send in the condition CLEAR instead of the zero
output data, output data of length = 0. Based on this process, the Slave immediately recognizes
that the Master is in the CLEAR condition even if a previous CLEAR command was destroyed on
the Bus.
Ignore Auto Clear
PAGE 45 of 97
© Horner APG.This drawing is the property of Horner APG. And shall not be disclosed or reproduced except as specifically authorised.
EO 09-0009
Page 46

DP Slave MAN0575-04-EN
Profibus Modules User Manual
The global Auto Clear function is carried out or ignored when the connection to the Slave is
interrupted.
DPV1
Maximum Channel Data Length
Defines the maximum length of the DPV1 telegrams. The Slave will adapt its buffer size for the
respective data count.
Diagnostic Update Delay
Some newer Slave devices require more time for the consistency testing for the processing of the
SET_PRM parameterising telegrams. Often, therefore, a simple diagnostic cycle is insufficient
time for the participant to inform the Master of the release for the DATA_EXCHANGE. With the
diagnostic delay, the number of diagnostic cycles that is the maximum that the Master expects in
order to obtain this release is increased before it reports an error.
Maximum Alarm PDU Length
Determines the maximum length of the DPV1 Alarm telegrams.
Maximum Active Alarms
Determines the maximum quantity of active alarms: one alarm of each type or 2, 4, 8, 12, 16, 24
or 32 alarms in total.
Slave Functions
Extra Service Access Point for Alarm acknowledgement
Determine whether the DPV1 Master receipts an alarm to the DPV1 Slave via SAP 51 or 50.
Configuration Data convention
Determines whether the configuration data are interpreted according to EN 50170 or DPV1.
Enabled Alarms
Activates or deactivates the alarms (Module pulled), Process Alarm, Diagnostic Alarm, Manufacturer
Alarm, Status Alarm and Update Alarm.
7.4 Project Information
If the user creates a project, the project information can be typed in the Settings > Project
Information menu. The information may be viewed at any time by opening the window again.
Figure 25: Settings > Project Information
PAGE 46 of 97
© Horner APG.This drawing is the property of Horner APG. And shall not be disclosed or reproduced except as specifically authorised.
EO 09-0009
Page 47

DP Slave MAN0575-04-EN
Profibus Modules User Manual
7.5 Path
When the Settings > Path menu is selected, the search path for GSD files is displayed.
Figure 26: Settings > Path
Once the OK button is clicked, all GSD files are read in.
7.6 Language
To set the language option select: Settings > Language menu and the following window opens:
Figure 27: Settings > Language
Once the language option has been selected, the software must be closed and re-opened before the
new settings take effect.
Note: Not all languages are available for all fieldbuses!
7.7 Start Options
Starting from the window Network View (menu Window > Network View) the menu Setting > Start...
opens the window Start Options. The different start options or modes can be set. Some of these
settings are only for the OPC server and are not applicable to Horner modules.
Note: The Start Options menu is only displayed in the selection Settings, if a project is loaded.
PAGE 47 of 97
© Horner APG.This drawing is the property of Horner APG. And shall not be disclosed or reproduced except as specifically authorised.
EO 09-0009
Page 48

DP Slave MAN0575-04-EN
Profibus Modules User Manual
Figure 28: Settings > Start Options
Simulation mode ON/OFF
Not applicable for Horner modules.
Start SyCon hidden if started via OPC
Not applicable for Horner modules.
Start SyCon next time with last Configuration
This option automatically loads the last saved configuration when the SyCon is started again.
Logic Network View visible
This option allows the use of network mode. It is also possible to use the Watch List from the
network mode.
Fast start ON/OFF
Not applicable for Horner modules.
TAG tracing ON/OFF
Not applicable for Horner modules.
OPC tracing ON/OFF
Not applicable for Horner modules.
Auto connect ON/OFF
This option allows automatic connection to the device listed in the configuration file.
Start with multiple configurations
This option allows HSyCon to start with up to four configurations simultaneously. The paths are
shown in the window and are changeable.
PAGE 48 of 97
© Horner APG.This drawing is the property of Horner APG. And shall not be disclosed or reproduced except as specifically authorised.
EO 09-0009
Page 49

Online Functions MAN0575-04-EN
Profibus Modules User Manual
CHAPTER 8: ONLINE FUNCTIONS
8.1 Downloading the Configuration
First, the required device must be chosen for downloading by a left mouse click on the symbol of the
device. In order to release the configuration and network access, a transfer (Download) to the COM
device must be carried out on the Online > Download menu. A warning will appear that the
communication on the PROFIBUS will be interrupted. This warning must be confirmed:
Figure 29: Security question before Download
Attention: The download overwrites the configuration in the device and the connection with the
connected devices is interrupted.
Figure 30: Online > Download
Before the Download is executed, the configuration is checked by the Configurator. The most
common cause of error is overlapping of addresses in the process data image. This can be checked
by calling up the address table with the View > Address Table menu.
If automatic address assignment is required then the Auto Addressing button in the Master
Configuration window must be activated.
The configuration is transferred to the selected device and stored there in FLASH memory. After the
download, the device carries out an internal restart and begins communication if in DP Master
Settings the Automatic Release of Communication by the Device menu point has been set.
8.2 Firmware Download
If a Firmware update is required, proceed as follows: first choose the desired device for Firmware
downloading. Then, call up the Online > Firmware Download menu. Select the new Firmware and
send it to the device with Download.
PAGE 49 of 97
© Horner APG.This drawing is the property of Horner APG. And shall not be disclosed or reproduced except as specifically authorised.
EO 09-0009
Page 50

Online Functions MAN0575-04-EN
Profibus Modules User Manual
Figure 31: Online > Firmware Download
8.3 Firmware / Reset
First, the desired device must be chosen by a left mouse click on the symbol of the device. Then the
Online > Firmware / Reset menu must be called up, the name and the version of the Firmware are
displayed.
Figure 32: Online > Firmware / Reset
The device can be reset with the Reset button.
8.4 Device Info
First, the desired device must be chosen with a left mouse click on the symbol of the device. Then,
select the Online > Device Info menu in order to obtain further information on the selected device.
The manufacturer date, the device number and the serial number of the device is retrieved and
shown.
PAGE 50 of 97
© Horner APG.This drawing is the property of Horner APG. And shall not be disclosed or reproduced except as specifically authorised.
EO 09-0009
Page 51

Online Functions MAN0575-04-EN
Profibus Modules User Manual
Figure 33: Online > Device Info
8.5 Automatic Network Scan
This function scans the network structure. The scan will detect what devices are connected to this
PROFIBUS network and how these devices are configured. The following steps are necessary before
the scan can be performed:
Create a new project: Select the menu File > New and PROFIBUS.
Select the Master: Select the Master from the menu Insert > Master.
Set the Baud rate: Select the menu Settings > Bus parameter and set the Baud rate.
Load these settings to the Master: Select the menu Online > Download.
Save: Select File > Save to save the settings.
Scan the network: Select the menu Online > Automatic Network Scan.
Note: This function detects the devices on the PROFIBUS network and can read out how these
devices are configured. It cannot read out the parameters, as this is not specified in the PROFIBUS
protocol. Parameter data must be set by the user through the Master, which transfers the parameter
data to the Slaves.
Figure 34: Online > Automatic Network Scan (security question)
Click Yes if the connected PROFIBUS network should be scanned. Click No, if these functions should
not be performed.
PAGE 51 of 97
© Horner APG.This drawing is the property of Horner APG. And shall not be disclosed or reproduced except as specifically authorised.
EO 09-0009
Page 52

Online Functions MAN0575-04-EN
Profibus Modules User Manual
Figure 35: Online > Automatic Network Scan (During the Scan)
All buttons are grey during the network scan.
The System Configurator first detects what devices are connected to the PROFIBUS network. Next,
the identcode from each Slave is read. The configuration data (identifier bytes) is read from each
Slave and searched for in the corresponding GSD file (if GSD file is available), the module is
displayed in the column Real Cfg. Dat (Modules).
Figure 36: Online > Automatic Network Scan (After the Scan)
Note: Some Slave devices only allow the default configuration to be read.
PAGE 52 of 97
© Horner APG.This drawing is the property of Horner APG. And shall not be disclosed or reproduced except as specifically authorised.
EO 09-0009
Page 53

Online Functions MAN0575-04-EN
Profibus Modules User Manual
In the window Actual Network Constellation the text in the columns Found Slave and Real
Configuration Data can be displayed in the following colours:
Colour Found Slave Real Configuration Data
0 Orange
1 Black
Blue
≥2
For this device no suitable GSD file was
found
For this device exactly one suitable GSD
file was found
For this device more than one suitable
GSD file was found
No suitable modul was found in
the GSD file
Exactly one modul was found in
the GSD file
More than one modul was
found in the GSD file
Table 10: Network scan - Description of the displayed window
If a device is coloured, red in the Actual Network Constellation an error has occurred. For
example, a Slave with the Station Address 126 was detected. In this case, the Ident number cannot
be read out.
Upon exiting the window Actual Network Constellation, the System Configurator provides the option
as too whether the constellation should be taken into the configuration or not.
Figure 37: Online > Automatic Network Scan > Accept Configuration
Example:
This example shows a scanned Network Constellation with more than one suitable module for the
GSD file. The modules (Real Cfg. Data) are coloured blue, which means, that the assignment can be
changed by clicking the Assign Module button:
Figure 38: Online > Automatic Network Scan - Example for Assignment
8.6 Assign Slave
The identnumber is read from the Slave device during the network scan. If more than one GSD file is
available with this identnumber in the window Assign Slave, a list is displayed and the correct Slave
device may be selected.
PAGE 53 of 97
© Horner APG.This drawing is the property of Horner APG. And shall not be disclosed or reproduced except as specifically authorised.
EO 09-0009
Page 54

Online Functions MAN0575-04-EN
Profibus Modules User Manual
Figure 39: Online > Automatic Network Scan > Assign Slave
All devices found during the Automatic Network Scan appear in the Selected Slaves. By clicking the
Remove button a device may be removed and another device may be insert in the Actual Network
Configuration.
For this select a device by clicking on it. Click the Add button to put it into the right list. By pressing
the OK button the device is assigned to the Actual Network Configuration:
Figure 40: Change of the GSD against a GSE file
This picture shows a change of the WAGOB754.GSD for the WAGOB754.GSE.
8.7 Assign Module
It may be that more than one Configuration Data for a device was found during the network scan.
Clicking the button Assign Module in the Network Scan window allows the selection of suitable
modules for the assigned GSD file.
PAGE 54 of 97
© Horner APG.This drawing is the property of Horner APG. And shall not be disclosed or reproduced except as specifically authorised.
EO 09-0009
Page 55

Online Functions MAN0575-04-EN
Profibus Modules User Manual
Figure 41: Online > Automatic Network Scan > Assign Module
The modules found during the Automatic Network Scan are shown in the Selected modules list. By
clicking the Remove button a module may be removed and another insert in the Actual Network
Configuration.
Select a module by clicking on it and press the button Add to put it into the right list. The module is
assigned by clicking the OK button.
8.8 Slave with Station Address 126
The identnumber from Slave devices with station address 126 cannot be read out via the PROFIBUS.
Therefore either
Select the GSD file from the list of Slave devices.
Enter the ident number manually.
Figure 42: Online > Automatic Network Scan > Set Slave Address
Select GSD File. Click OK. A window opens where a Slave device may be selected. Enter
A station address between 0 and 125 with Set Slave Address and then scan the network again.
Ident Number
Enter the ident number manually. The ident number has to be entered in hexadecimal format.
Figure 43: Online > Automatic Network Scan > Enter Ident Number
PAGE 55 of 97
© Horner APG.This drawing is the property of Horner APG. And shall not be disclosed or reproduced except as specifically authorised.
EO 09-0009
Page 56

Online Functions MAN0575-04-EN
Profibus Modules User Manual
Enter a station address between 0 and 125 with Set Slave Address and scan the network again.
8.9 Start/Stop Communication
The communication between PROFIBUS-DP Master and PROFIBUS-DP Slave may be manually
started or stopped. First, the desired device must be chosen with a left mouse click on the symbol of
the device. Then select the Online > Communication start or Online > Communication stop
menu.
PAGE 56 of 97
© Horner APG.This drawing is the property of Horner APG. And shall not be disclosed or reproduced except as specifically authorised.
EO 09-0009
Page 57

Page 58

CH9: Diagnostics MAN0575-04-EN
Profibus Modules User Manual
CHAPTER 9 : DIAGNOSTIC FUNCTIONS
9.1 Live List
First, the desired device must be chosen with a left mouse click on the symbol of the device. Then,
select the Online > Live List menu to get an overview over all active devices at the PROFIBUS
network.
Figure 44: Online > Live List
A green number shows a Master and a blue number a Slave, whereby the number indicates the
Station address. The meaning of the other colours is given in the list above the table.
A click on a coloured number brings up its device type and status of the station.
Figure 45: Device type and device status of a Master and a Slave
The display is not automatically updated as this function loads the PROFIBUS network. However, the
Live List can be renewed with the Update button.
9.2 Debug Mode (PROFIBUS-DP)
First the Master device must be chosen with a left mouse click on the symbol of the Master device.
Then, select the Online > Start Debug Mode menu. The System Configurator cyclically interrogates
the status of the network communication on the module and the individual condition of the device.
To end the Debug Mode select the menu Online > Stop Debug Mode.
When the debug session is started, the configuration window changes into the debug window. The
devices and the line between them are displayed in green or red colour depending on the established
network communication.
PAGE 58 of 97
© Horner APG.This drawing is the property of Horner APG. And shall not be disclosed or reproduced except as specifically authorised.
EO 09-0009
Page 59

CH9: Diagnostics MAN0575-04-EN
Profibus Modules User Manual
.
Figure 46: The Debug Window
If diagnostic information is available for a specific device, the text Diag appears in red next to the
device icon. To get further device specific diagnostic information then double-click on the device itself
or set the focus to the device and select Online > Device Diagnostic.
The Master icon has the
In run mode the Master icon has the sign
sign to show the stop mode.
.
9.3 PROFIBUS DP Device Diagnostic
To activate the Debug Mode select the menu Online > Start Debug Mode. Then, mark a Slave (left
mouse click) and then the menu Online > Device Diagnostic to open the diagnostic window for this
Slave. Alternatively, double click on the symbol of the device to open this window. To end the Debug
Mode select the menu Online > Stop Debug Mode.
After the debugger has started HSyCon requests the state of all devices from the Master. If there is
an error on a device, the bus line to this Slave is displayed in red, otherwise it is green. HSyCon also
displays the letters Diag, if the device signals diagnostic information or the master holds diagnostic
information in its internal diagnostic buffer. This information is displayed in more detail if the
corresponding device in Debug Mode is selected with the mouse.
The diagnostic information of a DP Slave can be 6 to 100 (max. 244) bytes. The first 6 bytes are
standard diagnostic information (specification). The meaning of these 6 bytes is according to the
PROFIBUS specification and contains the Station Status 1, 2 , 3, the assigned master address and
the ident number of the Slave.
PAGE 59 of 97
© Horner APG.This drawing is the property of Horner APG. And shall not be disclosed or reproduced except as specifically authorised.
EO 09-0009
Page 60

CH9: Diagnostics MAN0575-04-EN
Profibus Modules User Manual
.
Figure 47: Online > Device Diagnostic
Station Status 1, 2 and 3 is described on the next page.
The Assigned Master Address is the address of the master, which has parameterised and
configured this Slave. If the value 255 is displayed, it means that the Slave reports that either
It is not parameterised or configured yet
That the received parameter information and configuration information have been rejected because of
an error.
The Real Ident Number is the ident number from the DP Slave connected. The GSD Ident Number
is the ident number from the GSD file read by the HSystem Configurator. Both ident numbers must
be the same. If they are different, the reason may be either:
The wrong GSD file has been read.
The DP Slave connected is the wrong one.
When the Real Ident Number is 0000, then the master has no connection via the PROFIBUS to the
DP Slave.
PAGE 60 of 97
© Horner APG.This drawing is the property of Horner APG. And shall not be disclosed or reproduced except as specifically authorised.
EO 09-0009
Page 61

CH9: Diagnostics MAN0575-04-EN
Profibus Modules User Manual
The meaning of Station Status 1:
StationStatus 1
Master Lock
(Bit 7)
Parameter
Fault
(Bit 6)
Invalid Slave
Response
(Bit 5)
Function not
supported
(Bit 4)
Extended Diag
(Bit 3)
Configuration
Fault
(Bit 2)
Set by Meaning and Remedy
Master
Slave
Master
Slave
Slave
Slave
Meaning: The Slave has already been parameterised by another Master and is locked in
its access.
Remedy: This is a security mechanism of PROFIBUS-DP. First, clarify which master
should have access to this Slave. Then add this Slave to the configuration of the master
that should have access to this Slave and remove this Slave from the configuration of the
other master.
Meaning: This bit is set by the Slave automatically, when the parameters sent by the
Master contain incorrect or insufficient data. Every received parameter telegram the Slave
executes a check routine on the whole parameter telegram. If the Slave detects a faulty
parameter value or illegal data during its check, it will report parameter fault. During the
check, routine the Slave compares its identnumber with the one sent by Master.
Remedy: If the Slave reports this error, first compare the Real Ident Number shown in the
Slave diagnostic field in debugger mode with the one shown at GSD Ident Number. If
these two Ident numbers are the same, check the parameter data. If they are different,
either the wrong GSD file has been used or the wrong device connected to the bus.
Meaning: This bit is set by the Master, when the bit receives an invalid answer from the
Slave. The physical contact to the Slave works, but the logical answer was not
understood.
Remedy: An error on the physical transmission line caused by a twisted cable, missing
bus termination or missing shield connection.
Use standardized DP Slave.
Meaning: This bit is set by the Slave, when a function should be performed which is not
supported. Newer releases of Slave stations normally support the Sync and Freeze-Mode
for I/O data. This is fixed in the GSD-File, read out by HSyCon, and sent to the Slave in
the parameter telegram.
Remedy: If this error occurs the GSD-File declares at least one of these commands as
supported, but the Slave does not. In this case, contact the manufacturer of the Slave
device for the right GSD-File for the used Slave.
Meaning: This bit is set by the Slave, if extended diagnostic data is read out. Extended
diagnostic data is optional and normally used by a Slave to hand out manufacturer specific
diagnostic information.
Remedy: Click on the button Extended Diagnostic to get a Hex-dump of the diagnostic
data and read about their meaning in the manual of the manufacturer
contains information about the Extended Device Diagnostic, it can be analysed with the
HSystem Configurator.
Meaning: During the start-up procedure the Slave compares its internal I/O configuration
with the configuration of the Master. If the Slave detects differences, it will report a
configuration error. This means that the Master has another I/O module configuration for
the Slave.
Remedy: First visually compare all configured I/O modules in the configuration data of
HSyCon for this Slave with its real physical configuration. Note that the order of the
module must agree. Some Slaves need virtual I/O modules to be configured first or empty
slot modules to get an even number of modules to run. The Slave specific I/O module
behaviour is not is in the GSD file. Please read the configuration notes of the slave
manufacturer.
Another way to get the Slave module configuration is to read it by using the Compare
Configuration command. Click on this button in the diagnostic field and a Hex-Dump of
the real Slave configuration data and the configured one (Real Configuration and SyCon
Configuration) will be displayed. Note that the DP configuration is coded in a very
compact form. The code for the modules is shown in the Slave Configuration.
. If the GSD-File
PAGE 61 of 97
© Horner APG.This drawing is the property of Horner APG. And shall not be disclosed or reproduced except as specifically authorised.
EO 09-0009
Page 62

CH9: Diagnostics MAN0575-04-EN
Profibus Modules User Manual
StationStatus 1
Station Not
Ready
(Bit 1)
Station not
existent
(Bit 0)
Set by Meaning and Remedy
Slave
Master
Meaning: The DP Slave is still not ready for the data exchange.
Remedy: When or at which event the Slave sets this bit is not defined in the specification.
That means it can have several Slave specific reasons. Usually the bit is set in
combination with one of the other fault bits.
Check the parameter and the configuration. Often the report 'Station not Ready' results in
the case of a parameter fault or configuration fault.
It is possible that the supply voltage at the Slave was just first switched on. Wait until the
device is initialised.
Meaning: This bit is set by the Master automatically, if this Slave does not answer or is not
reachable on the bus.
Remedy: Check the PROFIBUS cable. Both signal wires need to be connected correctly
between all devices. In addition, the connectors at the end of the cable need to be
provided with termination resistors.
Check that the device is connected to the bus cable.
Check the power supply at the Slave device.
Compare the station address at the Slave with the configuration of the Master. With the
menu Online > Live List, check which Slaves are available to the PROFIBUS.
Check, if the Slave supports the configured baud rate. Some Slaves only work up to 1.5
Mbaud or need to be set for PROFIBUS-DP conform behaviour.
Table 11: PROFIBUS-DP Diagnostic Station state 1 (Bit 7 to 0)
PAGE 62 of 97
© Horner APG.This drawing is the property of Horner APG. And shall not be disclosed or reproduced except as specifically authorised.
EO 09-0009
Page 63

CH9: Diagnostics MAN0575-04-EN
Profibus Modules User Manual
The meaning of Station State 2:
StationStatus 2
Slave
Deactivated
(Bit 7)
Reserved
(Bit 6)
Sync Mode
(Bit 5)
Freeze Mode
(Bit 4)
Watchdog ON
(Bit 3)
Slave Device
(Bit 2)
Static Diag
(Bit 1)
Parameter Req
used
(Bit 0)
Set by
DP
Master
- -
Slave This bit is set by the Slave, when it has received the sync control command.
Slave This bit is set by the Slave, when is has received the freeze control command.
Slave
Slave This bit is always set by the Slave.
Slave
Slave
Meaning
This bit is set by the Master, if the Slave in its parameter set is marked as inactive, so that
it is taken out from the cyclic I/O exchange.
This bit is set by the DP-Slave, when its Watchdog control is active to supervise its
corresponding Master connection.
The Slave sets this bit to indicate the Master to be not operative because of a general
error. Typically, the DP Slave is not ready for I/O data transfer. In the case of a set static
diagnostic bit, the Master has to collect diagnostic information as long as this bit is active.
On which events or at what time this bit can be set by a Slave device, is not defined in the
norm description and can not be mentioned here.
The Slave sets this bit to force the Master system to do a new parameterisation. It
remains set until the parameterisation is complete. In case of this error, compare the real
ident number with the GSD ident number in this window. This numbers must be the
same
Table 12: PROFIBUS-DP Diagnostic Station state 2
The meaning of Station State 3:
StationStatus 3
Ext Diag
Overflow
(Bit 7)
Reserved
(Bit 6 to 0)
Set by Meaning
Master
Slave
- -
This bit is set, if there is more extended diagnostic information to report to the Master than
can be given to the Master in one diagnostic telegram. The DP-Slave sets this bit for
example if there is more diagnostic channel information than the Slave can hold in its
diagnostic buffer.
Table 13: PROFIBUS-DP Diagnostic Stations status 3
PAGE 63 of 97
© Horner APG.This drawing is the property of Horner APG. And shall not be disclosed or reproduced except as specifically authorised.
EO 09-0009
Page 64

CH9: Diagnostics MAN0575-04-EN
Profibus Modules User Manual
9.4 Compare Configuration
The configuration can be read from the DP Slave via the PROFIBUS in debug mode. This information
is displayed in the upper part of the window Compare Configuration.
In the lower part of the window, the configuration is displayed and compared as set in the HSystem
Configurator.
Figure 48: Online > Device Diagnostic > Compare Configuration
Note: Some DP Slaves only give default configuration when read out via the PROFIBUS. To use this
function the DP Slave must support it.
PAGE 64 of 97
© Horner APG.This drawing is the property of Horner APG. And shall not be disclosed or reproduced except as specifically authorised.
EO 09-0009
Page 65

CH9: Diagnostics MAN0575-04-EN
Profibus Modules User Manual
9.5 Extended DP Slave Diagnostic
Figure 49: Device Diagnostic (PROFIBUS-DP extended diagnostic)
The Extended Device Diagnostic window shows a diagnostic telegram as a Hex dump. Here, the
first 6 Bytes are the standard diagnostic Bytes as described in section PROFIBUS DP Device
Diagnostic.
The Extended Device Diagnostic starts at the 7
th
Byte. This is manufacturer specific and can contain
Station related diagnostic.
Modul related diagnostic.
Channel related diagnostic.
The middle region of the window shows details and the top region the diagnostic report in clear text to
the extent given in the GSD file.
Note: To evaluate the extended (manufacturer specific) diagnostic read the device description of the
manufacturer.
PAGE 65 of 97
© Horner APG.This drawing is the property of Horner APG. And shall not be disclosed or reproduced except as specifically authorised.
EO 09-0009
Page 66

CH9: Diagnostics MAN0575-04-EN
Profibus Modules User Manual
9.6 Global State Field
First, the desired device must be chosen with a left mouse click on the symbol of the device. Next,
select the Online > Global State Field menu. A display window opens in which the cyclic status of
the Bus condition and the connected devices is shown:
Figure 50: Online > Global State Field
The first row displays the main state of the Master. It can have the status OPERATE, STOP,
OFFLINE or AUTO CLEAR.
The next row displays individual bus errors. A pending error is displayed in a red field. The meanings
of the individual abbreviations are shown in the following:
Status Bits Meaning
TOUT
NRDY
EVE
FAT
© Horner APG.This drawing is the property of Horner APG. And shall not be disclosed or reproduced except as specifically authorised.
TIMEOUT-ERROR the device has detected a skipped timeout supervision
time because of rejected PROFIBUS telegrams. It's an indication of bus
short circuits while the Master interrupts the communication. The numbers
of detected timeouts are fixed in the statistic bus information variable. The
bit will be set when the first timeout was detected and will not be deleted.
HOST-NOT-READY-NOTIFICATION shows if the application is ready or
not. If this bit is set, the application is not ready to receive data.
EVENT-ERROR the device has detected bus short circuits. The numbers of
detected events are fixed in the statistic bus information variable. The bit
will be set when the first event was detected and will not be deleted.
FATAL-ERROR because of heavy bus error, no further bus communication
is possible.
PAGE 66 of 97
EO 09-0009
Page 67

CH9: Diagnostics MAN0575-04-EN
NEXC
ACLR
CTRL CONTROL-ERROR parameterisation error.
NON-EXCHANGE-ERROR at least one Slave has not reached the data
exchange state and no process data exchange is done.
AUTO-CLEAR-ERROR device stopped the communication to all Slaves and
reached the auto-clear end state.
Profibus Modules User Manual
Table 14: Meaning of collecting status bits in the Global State Field
Further displays are:
Collective online error location and corresponding error gives the station address and the error
text.
Statistic bus information displays the number of the detected bus short circuits and the number of
rejected telegrams.
Device specific status bits:
Parameterised Devices, Activated Devices and Devices with Diagnostic are shown the buttons
are clicked. The activated addresses are coloured numbers. This application updates online the
status in the global state field. The diagnostic may be seen by double-clicking on a highlighted station
address of a device.
9.7 Extended Device Diagnostic
The Extended Device Diagnostic helps to find bus and configuration errors when the HSyCon menu
functions are of no further help. First, the desired device must be chosen with a left mouse click on
the symbol of the device. Then, select the Online > Extended Device Diagnostic menu.
This menu opens a list of diagnostic structures. These contain online counters, states and parameter
information:
Figure 51: Extended Device Diagnostic as and example for the PROFIBUS-DP.
PAGE 67 of 97
© Horner APG.This drawing is the property of Horner APG. And shall not be disclosed or reproduced except as specifically authorised.
EO 09-0009
Page 68

CH9: Diagnostics MAN0575-04-EN
Profibus Modules User Manual
9.8 I/O Monitor
This is an easy way of viewing and changing the first 32 Bytes of the process data image. To open
the I/O Monitor select the menu Online > I/O Monitor.
Figure 52: Online > I/O Monitor
DEC/HEX sets the representation of the input data. The output data is always in the decimal form.
Enter the output value and then press Update. Only the first 32 input and output Bytes of the process
depiction are shown, even when these Bytes have not been set by the configuration. The display is
always in a Byte manner.
9.9 I/O Watch
The I/O Watch monitor can be used in place of the I/O Monitor and offers more functionality including:
Various data formats: Hex, Unsigned Decimal, Signed Decimal, Bit.
The I/O Watch monitor works symbol oriented.
It is not necessary to know the offset addresses.
The following firmware supports the I/O Watch monitor function:
Fieldbus From Version
PROFIBUS-DP Master
InterBus Master 2.040
CANopen Master 1.040
DeviceNet Master 1.058
AS-Interface Master 1.010
1.040 (Combimaster) resp. 1.140 (DPMaster)
Table 15: Firmware for I/O Watch function
PAGE 68 of 97
© Horner APG.This drawing is the property of Horner APG. And shall not be disclosed or reproduced except as specifically authorised.
EO 09-0009
Page 69

CH9: Diagnostics MAN0575-04-EN
Profibus Modules User Manual
The following table lists the typical steps to use the I/O Watch monitor.
Preconditions:
The project/configuration already exists, containing a PROFIBUS-DP Master and the PROFIBUS-DP
Slave(s) as described in section Getting Started – CscaPe Configuration..
The Configuration has been downloaded to the PROFIBUS-DP Master using Online > Download
Running bus system.
Open the existing project using File > Open. Open the Windows dropdown menu and select Window
> Logical Network View to change the window. A window with three sections opens:
Left Window Centre Window Right Window
Project Tree structure Tag / Symbol IO Watch
Open the tree structure in the left window to reach the I/O module of the desired device:
Project > Master > Slave > Modul > (possible) Submodul
.
Left click on the module desired and the tags (I/Os) will be displayed in the centre window of the
Logical Network View.
Select with the left mouse button the tag/symbol desired and drag and drop them in the right window
of the Logical Network View.
In the right window, select the desired tag with the left mouse click to highlight it then right mouse click
to open a menu. Select Start. A new window called IO Watch appears.
A table shows the Device, Symbolic Name, IEC Address (Offset), Data type Representation and
Value. Select the line with the desired information. Click on Hex under Representation and select the
way the values are to be displayed. Choices are Hex, Decimal unsigned, decimal signed, Bit pattern.
Input data is displayed and can’t be changed. Output data may be entered into the value
PAGE 69 of 97
© Horner APG.This drawing is the property of Horner APG. And shall not be disclosed or reproduced except as specifically authorised.
EO 09-0009
Page 70

CH9: Diagnostics MAN0575-04-EN
Profibus Modules User Manual
Figure 53: I/O Watch Window
PAGE 70 of 97
© Horner APG.This drawing is the property of Horner APG. And shall not be disclosed or reproduced except as specifically authorised.
EO 09-0009
Page 71

CH9: Diagnostics MAN0575-04-EN
Profibus Modules User Manual
CHAPTER 10: PROFIBUS SERVICES
10.1 Setting the Slave Address
The desired Slave device must first be chosen with a left mouse click on the symbol of the Slave.
Next set the Station address of a Slave on the PROFIBUS with the Online > Set Slave Address
menu.
Enter the new address into the new station address field. If no further alterations to the Station
address are to be allowed then mark the No additional changing field. If required, enter further
parameters in hexadecimal format in the Remote Slave parameter field. Activate the command with
the Set Address button.
Figure 54: Online > Set Slave Address
Note: The setting of the Station address is only possible for Slaves that support this service.
PAGE 71 of 97
© Horner APG.This drawing is the property of Horner APG. And shall not be disclosed or reproduced except as specifically authorised.
EO 09-0009
Page 72

CH9: Diagnostics MAN0575-04-EN
Profibus Modules User Manual
10.2 Message Monitor
The Message Monitor permits access to the Mailbox of the Module.
Note: The usage of the Message Monitor assumes advanced knowledge from the user.
First, the Hilscher device must be chosen with a left mouse click on the symbol of the Hilscher device.
Then, call up the Online > Message Monitor menu.
.
Figure 55: Online > Message Monitor
A Message can be saved and retrieved and has the file suffix *.MSG.
File > New: clears the window
File > Open: opens a Message (Message can be retrieved)
File > Save or File > Save As: saves a Message
File > Exit: ends the Message Monitor and returns to the SyCon.
Edit > Create answer: creates an answer Message
Edit > Reset counter: resets the Message counter
View > Review the received data: all received data is shown
View > Review the send data: all the send data is shown
View > Number of receipt errors: the number of the receipt errors is shown
View > Decimal/Hexadecimal: Switch the display format
It is recommend that a sub-directory MSG is created and messages are stored there.
PAGE 72 of 97
© Horner APG.This drawing is the property of Horner APG. And shall not be disclosed or reproduced except as specifically authorised.
EO 09-0009
Page 73

CH9: Diagnostics MAN0575-04-EN
Profibus Modules User Manual
Figure 56: Save a Message
10.3 Message Monitor for Testing of DPV1 (Master)
The following steps show how to configure the Message Monitor for reading and writing via DPV1
from the Master:
Enter the following in the Message Monitor in order to read data via DPV1 from a Slave:
Message for Read via DPV1
Message header
Rx = 3 (always) Tx = 255
Ln = (calculated) Nr = 0 .. 255
A = 0 F = 0
B = 17 E = 0
Telegram header Meaning for DPV1 Value range
Device Adr Station address of the Slave 0 .. 126
Data Area Unused 0
Data Address Slot 0 .. 254
Data Index Index 0 .. 255
Data Count Data Count 1 .. 240
Data Type Data Type 10
Function Read 1
Table 16: Message Monitor – Example DPV 1 Read
The following must be entered in the Message Monitor in order to write data via DPV1 to a Slave:
Message for Write via DPV1
Message header
Rx = 3 (always) Tx = 255
Ln = (calculated) Nr = 0 .. 255
A = 0 F = 0
PAGE 73 of 97
© Horner APG.This drawing is the property of Horner APG. And shall not be disclosed or reproduced except as specifically authorised.
EO 09-0009
Page 74

CH9: Diagnostics MAN0575-04-EN
B = 17 E = 0
Telegram header Meaning for DPV1 Value range
Device Adr
Data Area Unused 0
Data Address Slot 0 .. 254
Data Index Index 0 .. 255
Data Count Data Count 1 .. 240
Data Type Data Type 10
Function Write 2
Send Data
Fill in as many data as the value in data count
Profibus Modules User Manual
Station address of the
Slave
0 .. 126
Table 17: Message Monitor – Example DPV 1 Write
10.4 Message Monitor for Testing of DPV1 (at Slave)
In the following, the Message Monitor for reading and writing via DPV1 at the Slave is described.
The following must be entered in the Message Monitor in order to read data via DPV1 from a Slave.
For this purpose, first a read Message must have been sent from the Master to the Slave. The Slave
creates an answer as follows:
Message for Read via DPV1
Message header
Rx = 3 (always) Tx = 255
Ln = (calculated) Nr = 0 .. 255
A = 17 F = 0
B = 0 E = 0
Telegram header Meaning for DPV1 Value range
Device Adr
Data Area Unused 0
Data Address Slot 0 .. 254
Data Index Index 0 .. 255
Data Count Data Count 1 .. 240
Data Type Data Type 10
Function Read 1
Read data
Fill in as many data as the value in data count
Station address of the
Slave
0 .. 126
Table 18: Message Monitor – Example DPV 1 Read
The following must be entered in the Message Monitor in order to write data via DPV1 to a Slave. For
this purpose, first a write message must have been sent from the Master to the Slave. The Slave
creates an answer as follows:
PAGE 74 of 97
© Horner APG.This drawing is the property of Horner APG. And shall not be disclosed or reproduced except as specifically authorised.
EO 09-0009
Page 75

CH9: Diagnostics MAN0575-04-EN
Message for Write via DPV1
Message header
Rx = 3 (always) Tx = 255
Ln = (calculated) Nr = 0 .. 255
A = 17 F = 0
B = 0 E = 0
Telegram header Meaning for DPV1 Value range
Device Adr Station address of the Slave 0 .. 126
Data Area Unused 0
Data Address Slot 0 .. 254
Data Index Index 0 .. 255
Data Count Data Count 1 .. 240
Data Type Data Type 10
Function Write 2
Profibus Modules User Manual
Table 19: Message Monitor – Example DPV 1 Write
PAGE 75 of 97
© Horner APG.This drawing is the property of Horner APG. And shall not be disclosed or reproduced except as specifically authorised.
EO 09-0009
Page 76

Page 77

MAN0575-04-EN
Profibus Modules User Manual
CHAPTER 11: FILE, PRINT, EXPORT, EDIT AND VIEW
11.1 File Open
An existing project can be opened with File > open.
11.2 File Save and Save As
When the file name is known, the configuration can be saved under the File > Save menu, otherwise
the File > Save As menu must be selected.
11.3 File Close
The current project can be closed with File > Close.
11.4 Print
Once the required printer has been selected in the File > Printer Set-up menu, the configuration can
be printed out under the File > Print menu. For a page view, select the File > Page View menu.
Figure 57: File > Print
The base setting prints information on one sheet only per device.
Topology prints the topology of the bus system.
Bus parameters print the bus parameters of the bus system.
Address table prints the address table of the Master.
Device table prints the device table.
The scope can be given with the Device Selection menu point. The following can be chosen:
All
From Station address to Station address
Selection of a device by means of its description.
PAGE 77 of 97
© Horner APG.This drawing is the property of Horner APG. And shall not be disclosed or reproduced except as specifically authorised.
EO 09-0009
Page 78

MAN0575-04-EN
Profibus Modules User Manual
If no option is selected and the OK button is pressed, nothing will be printed out. It is like clicking the
Cancel button.
11.5 DBM Export
Select the File > Export > DBM menu in order to save the previously saved project file (*.PB
Microsoft Access Format) in a DBM file (binary format). This DBM file can be retrieved in the DOS
Compro program. The configuration is stored in the Project directory in the path of the HSyCon
Installation with the extension *.DBM.
Attention: The file name can have max. 8 characters.
11.6 CSV Export
With the menu, File > Export > CSV the configuration data of the connected Slaves can be exported
into a table. The file must be saved before the export is executed. The exported file has the ending
.csv (comma separated value) and is put in the same directory as the configuration, but with the
ending *.csv.
The CSV file can be read with a table program e.g. Excel.
The CSV Export saves only the text and the values of the configured Slaves. The meaning of the
individual values can be shown in the table:
Parameter Meaning
Stationaddress
RecordType
IdentNumber
VendorNumber
VendorName
Device
Description
MasterAddress
Settings Contains information about the addressing mode and the storage format of the
Reserved
ModulCount Number of the modules of the device. For each modul the parameters data type,
DataSize_0
DataType_0 The Data Type, which is used in the configuration. The codes for this you find
DataPosition_0 The byte Data Position, which is used in the configuration. The codes for this you
Address_0
...
DataSize_59
DataType_59
DataPosition_59
Address_59
The Stationaddress is the unique device address of the Slave on the bus.
The RecordType defines the version of the following structure and is always 2.
This number is the unique device number of the Slave.
The VendorNumber is the clear number of the vendor (if available).
Here the name of the vendor is shown (max. 32 characters).
Name of the device (max. 32 characters).
This is the description of the device, which is set by the user (max. 32 characters).
This is the number of the Master Address.
process data (words, double words and floats) see section
Description of the Parameter Settings.
Reserved
data size, data position and offsetaddress are given. It can be follow max 60
modules. The parameters for modul 1 are marked with ..._0 and of the modul 60
are marked with ..._59.
Number of bytes, which were used by the module.
below this table in section
Description of the Parameter .
find below this table in section Description of the Parameter .
Offset Address in the Dual-port memory
...
See above.
See above.
See above.
See above.
Table 20: CSV Export - Meaning of the values
PAGE 78 of 97
© Horner APG.This drawing is the property of Horner APG. And shall not be disclosed or reproduced except as specifically authorised.
EO 09-0009
Page 79

MAN0575-04-EN
Profibus Modules User Manual
Description of the Parameter Settings
D7 D6 D5 D4 D3 D2 D1 D0
Reserved Area Format Address Mode
0 byte Address
1 word Address
1 little endian (LSB/MSB)
0 big endian (MSB/LSB)
Reserved
Table 21: CSV-Export - Description of the Byte Settings
Description of the Parameter Data Type
D7 D6 D5 D4 D3 D2 D1 D0
SubFlag Data Direction Data Format
0 start of a module
1 submodule
0 emty space
1 input
2 output
According EN standard
0 blank space
1 Boolean
2 Integer 8
3 Integer 16
4 Integer 32
5 Unsigned Integer 8
6 Unsigned Integer 16
7 Unsigned Integer 32
8 Float
9 ASCII
10 String
14 Bit
Table 22: CSV Export > Data Type Code
Description of the Parameter Data Position
D7 D6 D5 D4 D3 D2 D1 D0
Reserved Area Bit Position
Bit Position of the Offset Address
Reserved
Table 23: CSV Export > Data Position Code
PAGE 79 of 97
© Horner APG.This drawing is the property of Horner APG. And shall not be disclosed or reproduced except as specifically authorised.
EO 09-0009
Page 80

MAN0575-04-EN
Profibus Modules User Manual
Example of a CSV file, which was exported to Excel:
Cell Parameter Value Meaning
A1 Station Address 1 Station address of the PROFIBUS Slave device.
B1 Record Type 2 The Record Type is always 2.
C1 IdentNumber 7501 (0x049F) IdentNumber of the Slaves.
D1 VendorNumber 0 No Vendor number is available.
E1 VendorName Horner APG Vendor name of the device.
F1 Device HE800PBS600-001 Description of the device.
G1 Description PC_Slave
H1 MasterAddress 1 Address of the related Master.
I1 Settings 0
J1 Reserved Reserved Reserved
K1 ModulCount 2
L1 Data Size 4 The size of the modul is 4 bytes.
M1 Data Type 21 Input; Data type unsigned Integer 8
N1 Data Position 0 Output; Data type unsigned Integer 8
O1 Offset address 10 4 Byte-Modul starting with the offset address 10.
P1 Data Size 4 The size of the modul is 4 bytes.
Q1 Data Type 37 Output; Data type unsigned Integer 8
R1 Data Position 0 Data position of the second modul.
S1 Offset address 20 4 Byte-Modul starting with the offset address 10.
T1...IQ1 ... 0
Description of the device, which is also shown in SyCon as the
name of the device.
The addressing mode (byte- or word addressing) and the data
format of the process data are shown. The descriptions you see in
section
Description of the Parameter Settings.
Number of the modules of the device. For each modul the
information with data type, data size, data position and the offset
address follow. The information for
modul 1 you find in the cells L1, M1, N1, O1 and for
modul 2 in the cells P1, Q1, R1, S1.
The modules 3 till 59 are not used for this device and so a 0 is
shown.
Figure 58: Example of a CSV File in Excel
If two or more Slave devices are connected to the Master, these are displayed in the next lines of the
table.
PAGE 80 of 97
© Horner APG.This drawing is the property of Horner APG. And shall not be disclosed or reproduced except as specifically authorised.
EO 09-0009
Page 81

MAN0575-04-EN
Profibus Modules User Manual
11.7 PDD Export
The abbreviation PDD stands for Predefined Device. The purpose of the PDD Export is to export the
configured devices to a file in order to insert, or copy them again. It is recommended that a subdirectory with the name PDD in the SyCon directory be created in order to store the PDD files.
With the left mouse button, first set the focus on the Slave (left mouse click) to be exported.
Alternatively, the Master can be selected (again a left mouse click) in order to export several Slaves at
the same time.
Select the File > Export > PDD.
Figure 59: PDD Export (1)
Enter the file name. As an example, the figure shows the name Slave (.PDD).
Now select Open. The following figure appears:
Figure 60: PDD Export (2)
For instance, select the device/s from Configured devices (left-hand side) and pull them to the
Devices described in file side (right-hand side) and release the left mouse button (drag and drop).
The following figure appears:
PAGE 81 of 97
© Horner APG.This drawing is the property of Horner APG. And shall not be disclosed or reproduced except as specifically authorised.
EO 09-0009
Page 82

MAN0575-04-EN
Profibus Modules User Manual
Figure 61: PDD Export (3)
The figure shows a device with the description Slave2 consisting of two modules with the description
Module1 and Module2.
Select OK in order to write the PDD Export to the file. The symbols have the following meaning:
Symbol Meaning
H Header (File Information)
S Slave
M Module
I Input
O Output
Table 24: PDD Symbols
Finally, the path and the file name are displayed:
Figure 62: PDD Export (4)
11.8 Cut, Copy and Paste (Master)
With the menus Edit > Cut and Edit > Copy, it is possible to put the cut/copied Master with its
settings and configuration (not the description of the Master) on the Clipboard and with Edit > Paste,
it can be inserted.
The difference between Cut and Copy is:
With the menu option Edit > Cut, a Master is moved from one point in the configuration to another.
With the menu option, Edit > Copy a duplicate of an existing Master is made.
Upon selection of Edit > Cut a security question appears.
PAGE 82 of 97
© Horner APG.This drawing is the property of Horner APG. And shall not be disclosed or reproduced except as specifically authorised.
EO 09-0009
Page 83

MAN0575-04-EN
Profibus Modules User Manual
Figure 63: Security question cut device (Master)
The answer Yes cuts the Master to the clipboard.
With the menu Edit > Insert and clicking at the position where the Master should be inserted, a
window opens where the cut/copied Master can be selected.
Figure 64: Insert a cut/copied Master
Clicking on the OK button inserts the Master in to the configuration.
11.9 Cut, Copy and Paste (Slave)
With the menus Edit > Cut and Edit > Copy, it is possible to cut/copied device with its settings and
configuration (not the description of the device) to the Clipboard and with Edit > Paste it can be
inserted.
The difference between Cut and Copy is:
With the menu option Edit > Cut, it is possible to move a device from one point in the configuration to
another. While the menu, option Edit > Copy allows the duplication of an existing device.
Upon selection of Edit > Cut a security question appears.
Figure 65: Security question cut device (Slave)
Clicking Yes cuts the device to the clipboard.
PAGE 83 of 97
© Horner APG.This drawing is the property of Horner APG. And shall not be disclosed or reproduced except as specifically authorised.
EO 09-0009
Page 84

MAN0575-04-EN
Profibus Modules User Manual
With the menu Edit > Insert and clicking at the position where the device should be inserted, a
window opens where the cut/copied device can be selected.
Figure 66: Insert a cut/copied device
Clicking the OK button inserts the device in the configuration.
11.10 Delete
To delete a Master or Slave device first mark the device and then select the menu Edit > Delete.
Before HSyCon deletes the Master or Slave, a security question appears.
Figure 67: Security question delete device
Note: When a device is deleted the settings and configuration of this device are lost.
11.11 Replace
With the menu, Edit > Replace a Master or Slave device can be replaced. For details of how to
replace the Master, see section, Replace Master. For details of how to replace a Slave device see,
section Replace Slave.
PAGE 84 of 97
© Horner APG.This drawing is the property of Horner APG. And shall not be disclosed or reproduced except as specifically authorised.
EO 09-0009
Page 85

MAN0575-04-EN
Profibus Modules User Manual
11.12 View the Configuration
The configuration can be displayed in several tables. The following tables are available:
Device Table
Address Table (Occupation of the process image memory in the Horner PROFIBUS-DP Master)
Selecting the menu View > Address Table, View > CRL Table or View > OD Table the following
windows may appear to select the Master device.
Figure 68: View and Select Master
11.13 Device Table
The View > Device Table menu shows the list of all devices that have been inserted.
Figure 69: View > Device Table
PAGE 85 of 97
© Horner APG.This drawing is the property of Horner APG. And shall not be disclosed or reproduced except as specifically authorised.
EO 09-0009
Page 86

MAN0575-04-EN
Profibus Modules User Manual
11.14 Address Table
A list of all addresses used in the process depiction is displayed in the View > Address Table menu.
For this purpose, the current Master must be chosen for which the table is displayed. Addresses refer
to the Master.
Figure 70: View > Address Table
It is possible to sort the addresses according to Station addresses or data addresses.
PAGE 86 of 97
© Horner APG.This drawing is the property of Horner APG. And shall not be disclosed or reproduced except as specifically authorised.
EO 09-0009
Page 87

MAN0575-04-EN
Profibus Modules User Manual
11.15 Address Overview
Starting from View > Address Table and then Address Overview opens the window with the
overview of the assigned addresses in the input and output process images.
Figure 71: View > Address Table > Address Overview
Note: To change the offset addresses here the auto-addressing mode has to be disabled.
The assignments can be changed here by disabling the auto addressing. In order to change the
assignment, click with the left mouse button on a cross and keep the mouse button pressed. The
mouse button changes to an arrow. Pull the arrow (with depressed mouse button) to the desired
(unoccupied) position and release the mouse button. A confirmation query will appear, whether the
change is carried out or not.
The assignment of the Offset address can also be carried out via the Slave configuration menu.
The above example shows the moving of two- Byte modules.
Overlapping addresses are shown with a red cross. This means that this address is used by more
than one module.
11.16 Byte information Window
The information which Slave occupies a particular address can be seen by double clicking on the
corresponding cross. The Byte information window opens
PAGE 87 of 97
© Horner APG.This drawing is the property of Horner APG. And shall not be disclosed or reproduced except as specifically authorised.
EO 09-0009
Page 88

MAN0575-04-EN
Profibus Modules User Manual
CHAPTER 12: TOOLS
12.1 GSD Viewer
The menu Tools > GSD Viewer opens a GSD file to view it.
Figure 72: Tools > GSD Viewer
With more, the information e.g. max. Number of modules, max. Number of I/O data, max. Length of
input data and max. Length of output data is displayed.
With Layout the icons for the Slave are displayed for :
Configuration phase
Run phase
Diagnostic phase.
With Identifier, the modules of the device and its identifier bytes are displayed.
PAGE 88 of 97
© Horner APG.This drawing is the property of Horner APG. And shall not be disclosed or reproduced except as specifically authorised.
EO 09-0009
Page 89

MAN0575-04-EN
Profibus Modules User Manual
CHAPTER 13: ERROR CODES
13.1 Serial Driver Error Numbers (-20… -71)
This is the list of error numbers using the serial driver.
Error
Number
-20 Driver: No COM port found or COM port already in use.
-21 Driver: COM port already opened
-22 Driver: Function call into driver has failed
-23 Driver: Internal driver error
-24 Driver: Could not create read thread
-25 Driver: Could not create read event
-26 Driver: Could not create write event
-27 Driver: Could not create timer event
-28 Driver: Error by writing data
-29 Driver: Wrong COM state
-30 Driver: COM state error is set
-31 Driver: COM buffer set-up failed
-32 Driver: COM set timeout failed
-33 Driver: Receive buffer overrun
-34 Driver: Receive buffer full
-35 Driver: Send busy
-36 Driver: Error during close driver
-40 User: COM port not opened
-41 User: Invalid handle value
-42 User: Invalid COM number
-43 User: Size parameter invalid
-44 User: Size parameter zero
-45 User: Buffer pointer is NULL
-46 User: Buffer too short
-47 User: Set-up error
-50 User: Send message, timeout error
-51 User: Could not send a message cable not connected. Wrong cable. Device does not respond.
-52 User: Send message, no device connected
-53 User: Error by send message, message receiving
-54 User: Telegram collision
-55 User: Telegram, no acknowledgement received
-56 User: Telegram, noise
-57 User: Telegram, data overrun
-58 User: Telegram, parity error.
-59 User: Telegram, framing error.
-60 User: Telegram, unknown error.
-70 User: Timeout by receive a message.
-71 User: No message received.
Description
Table 25: Serial Driver Error Numbers
PAGE 89 of 97
© Horner APG.This drawing is the property of Horner APG. And shall not be disclosed or reproduced except as specifically authorised.
EO 09-0009
Page 90

MAN0575-04-EN
Profibus Modules User Manual
13.2 Database Access Error Numbers (100 .. 130)
The following table lists the error numbers of the database access errors
Error Number Description
100 Database already opened
101 Dataset could not be opened
103 Error while opening database occurred
104 No valid path name
105 No connection to data base. Call function DbOpen().
106 Error in parameter
107 Error during opening a table
108 Nullpointer occurred
109 Table not opened. Call function OpenTable() first.
110 The first record is reached
111 The last record is reached
112 Unknown type in the record found
113 Data has to be truncated
114 No access driver installed on the system
115 Exception received
116 This table is set to read only
117 There is no data set in the table
118 The requested table could not be edit
119 An operation could not be completed
120 User gives an unexpected length in WriteDs().
121 An assertion failed
122 DLL not found
123 DLL couldn't be freed
124 Specified function not found in the DLL
125 ODBC Function returns an error
126 Count of data bytes in the record exceeds 1938
127 DBM32 DLL is not loaded
128 Field with the given index was not found
129 This table contains no records
130 Invalid character (' ') found in a Table or Column
Table 26: Database Access Error Numbers (100..130)
PAGE 90 of 97
© Horner APG.This drawing is the property of Horner APG. And shall not be disclosed or reproduced except as specifically authorised.
EO 09-0009
Page 91

MAN0575-04-EN
Profibus Modules User Manual
13.3 Online Data Manager Error Numbers
The following table lists the error numbers of the Online Data Manager.
Error Number Description
1000 Driver OnlineDataManager not opened
1001 Initialization of the OnlineDataManager has failed
1002 No DriverObject found. OnlineDataManager Sub DLL not found.
1003 No DeviceObject found. Device not found.
1004 Application not found
1010 Application has requested an unknown event
1011
1012 Application has requested an unknown command
1013 Message Server already exists
1014 Message Server not registered
1015 Device already in use
1016 Device not assigned
1017 Device has changed
1018 Command active
Application has requested an unknown function mode, operating mode.
Known function modes, operating modes are Reset, Download, Register
Server, Unregister Server.
Table 27: Online Data Manager Error numbers (1000..1018)
PAGE 91 of 97
© Horner APG.This drawing is the property of Horner APG. And shall not be disclosed or reproduced except as specifically authorised.
EO 09-0009
Page 92

MAN0575-04-EN
Profibus Modules User Manual
13.4 Message Handler Error Numbers (2010….,2017)
The following table lists the error numbers of the Message handler of the Online Data Manager.
Error Number Description
2010 Message handler: Messagebuffer empty
2011 Message handler: Messagebuffer full
2021 Message handler: Invalid Message ID (msg.nr)
2022 Message handler: No entry
2023 Message handler: Message already active
2024 Message handler: Wrong Application
2025
2026 Message handler: Wait for Delete
2027 Message handler: No cyclic Message
Message handler: Message Timeout
No message received.
Possible Error Cause: Different reasons.
(1) The selected interrupt is not free or used also from another PC
component (shared interrupt).
(2) CIF is not initialised. This is shown by a acyclic flashing RUN LED.
(3) CIF is in bootstraploader mode. This is indicated by a flashing RDY
LED.
(4) Another application program is accessing to the CIF the same time
as SyCon.
Remedy:
(1A) Use polling mode instead of interrupt mode. Shared interrupts are
not supported from the CIF device driver under Windows 95/98/ME/NT.
(1B) Use a free interrupt.
(2) Download the configuration. If necessary create a new configuration.
(3) First download the firmware and then download the configuration.
(4) Close all other application programs that communicates to the CIF.
Table 28: Error Numbers of the Message Handler of the Online Data Manager (2010..2027)
PAGE 92 of 97
© Horner APG.This drawing is the property of Horner APG. And shall not be disclosed or reproduced except as specifically authorised.
EO 09-0009
Page 93

MAN0575-04-EN
Profibus Modules User Manual
13.5 Driver Functions Error Numbers (2501…,2512)
The following table lists the error numbers of the Driver Functions of the Online Data Manager.
Error Number Description
2501 OnlineDataManager Sub DLL not found
2502 Function missing
2503 'Read Thread' not created
2504 'Write Thread' not created
2505 'IO Thread' not created
2510 Function failed
2512 Assign reports error. Return neither OK or cancel
Table 29: Error Numbers of the Driver Functions of the Online Data Manager (2501..2512)
13.6 Online Data Manager Subfunctions Error Numbers (8001…,8035)
The following table lists the error numbers of the Subfunctions of the Online Data Manager.
Error Number Description
8001 Driver not opened. E.g. CIF Device Driver
8002 Application has requested an unknown event
8003 Application has requested an unknown command
8004 Command has failed
8005 Command active
8006 Device invalid
8010 No device was assigned
8011 Device was already assigned
8020 Driver not connected
8021 Driver already connected
8030 Faulty 'GetState'
8031 Send error (PutMessage returns error)
8032 Send active (PutMessage active)
8033 Receive error (GetMessage returns error)
8034 Receive active (GetMessage active)
8035 IO Error (ExchangeIO returns error)
Table 30: Subfunction Error Numbers of the Driver Functions of the Online Data Manager
(8001..8035)
PAGE 93 of 97
© Horner APG.This drawing is the property of Horner APG. And shall not be disclosed or reproduced except as specifically authorised.
EO 09-0009
Page 94

MAN0575-04-EN
Profibus Modules User Manual
13.7 Data Base Functions Error Numbers (4000 .. 4098)
The following table lists the error numbers of the converting functions.
Error Number Description
4000 File does not exist
4001 Success in comprimizing
4002 Dataset does not exist
4003 Last respectively first entry reached
4004 Not enough memory
4005 File directory full
4006 Max number of entries reached
4007
4008 Table name does already exist
4009 File name does not exist
4010 Free RAM length from RCS_CNF.P86 is smaller than E_F_INDEX * 2
4011 Parameter ‘next’ wrong
4012 Not enough free space to copy data set
4013 Set is deleted
4014 Value for Index is wrong
4015 Access not allowed
4016 open_file used before init_file
4017 Drive is not ready
4018 Not enough drive memory
4019 File name or path does not exist
4020 Cannot create path
4021 Wrong path
4022 Wrong flag
4023 The delete path is the root path
4024 Path file exists
4025 Write error during write a file
4026 Error during create a file
4027 Error during close a file
4028 No DBM file
4029 Length of the read data is unequal of the file length
No writing to this table possible, because the table is located in the
FLASH
Table 31: Error numbers of converting functions (4000..4029)
PAGE 94 of 97
© Horner APG.This drawing is the property of Horner APG. And shall not be disclosed or reproduced except as specifically authorised.
EO 09-0009
Page 95

MAN0575-04-EN
Profibus Modules User Manual
Error Number Description
4030 Path too long
4031 Directory changed
4032 Directory created
4034 Length of converting stream is 0
4035 Non equal data set found
4036 Non equal data set found
4037 Non equal data set found
4038 Data set has length 0
4039
4040 Printer not ready
4041 The data base is used from another function
4042 New length of data base is smaller than used
4043 Unknown access mode
4044 Old data base has to be converted
4045 Error while converting. Function not known
4046 Unknown type in set 0 found
4047 No float function available
4048 Function not in RCS module
4049 Check failed
4050 Checksum check failed
4051
4052
4053
4054 Not enough memory for allocation on the PC
4055 No index for file handle in structure FLASH_DIR of RCS found
4057 File type 2 can not be printed because of too many definitions
4058
4059 An unknown format for the parameter. Valid is U, H, or S
4060 Unknown parameter type
The function DbmInit has assigned a Zero pointer during RCS
initialisation
More segments are existing in file, than in the structure FILE_INFO_T in
wMaxEntries
SegLen in structure FILE_INFO_T is smaller then the length in the file.
Return of function dbm_restore_data
The header file holds an other information for a length than in the
segment itself
The definitions need too many lines to display them, than in the program
available
Table 32: Error numbers of converting functions (4030..4060)
PAGE 95 of 97
© Horner APG.This drawing is the property of Horner APG. And shall not be disclosed or reproduced except as specifically authorised.
EO 09-0009
Page 96

MAN0575-04-EN
Profibus Modules User Manual
Error Number Description
4061 The data base was transmitted into the FLASH
4062 Set 0 contains no structure definition
4063 Set 0 can not be deleted
4064 Error during execution of a ODBC data base access
4065 Initialization of DBM through RCS had no success
4066 Passed data length incorrect
4067 Sorting function not linked
4068 Error in function parameter
4069 Error from ODBC table
4070 No free handle available. Too many data base links are already opened
4071 Unknown data type found in the table
4072 Structure of table GLOBAL not correct or no such table existing
4073 No name of an ACCESS data base
4074 Download window can’t be created
4075 Download not fully performable
Table 33: Error numbers of converting functions (4061..4075)
PAGE 96 of 97
© Horner APG.This drawing is the property of Horner APG. And shall not be disclosed or reproduced except as specifically authorised.
EO 09-0009
Page 97

MAN0575-04-EN
Profibus Modules User Manual
Error Number Description
4082 More than 32 tables should be created
4083 No entry in element szSourceFile
4084
4085 Error in structure in the ACCESS data base that is in DBM format
4086 Error in structure in the ACCESS data base that is in DBM format
4087 No data in a ODBC table
4088 No entry
4089 ODBC set length not valid
4090 Not enough data sets in ODBC table
4091 Table CreateTab not found
4092 Error in structure of table CreateTab
4093 No entry in element szSourceTable
4094 No entry in element szDestTable
4095 Entry in iSourceType of table CreateTab is wrong
4096 Entry in iTranslate of table CreateTab is wrong
4097 Function SQLAllocStmt reports an error
4098 ODBC source table not found
4099 ODBC data truncated
4100 Download timeout
4101 Library load error
4102 Library function error
4103 Error in description 'toggle'
4104 Error in description 'KB'
4105 Column does not exist
4106 ODBC structure different
4107 ODBC address error
4108 No CRC sum exists (table GLOBAL exists or old)
4109 Table GLOBAL is old
4110 Calculated CRC different to CRC in table GLOBAL
4199 Programming error
ODBC connection initialisation not possible. This could happen when in
file ODBCINST.INI in section [Microsoft Access Driver (*.mdb)] is no
valid path to ODBCJT16/32.DLL.
Table 34: Error numbers of converting functions (4082..4199)
PAGE 97 of 97
© Horner APG.This drawing is the property of Horner APG. And shall not be disclosed or reproduced except as specifically authorised.
EO 09-0009
 Loading...