

Page 1

Viewing Leadership Through the Right Lens
Technical
Manual
Page 2

Hogan Leader Focus Report
Technical Manual
Hogan Assessment Systems
Tulsa, OK 74120, USA
2017
Page 3

© 2017 Hogan Assessment Systems, Inc.
No part of this work may be copied or transferred to
any other form of expression without the expressed
written consent of Hogan Assessment Systems, Inc.
Hogan Personality Inventory ™
Hogan Development Survey ™
Motives, Values, Preferences Inventory ™
Are exclusive registered trademarks of
Hogan Assessment Systems, Inc.
hoganassessments.com
Page 4

Leader Focus | Technical Manual
Contents
1. Conceptual Background 6
1.1 Introduction 6
2. The Hogan Leader Focus Model 6
2.1 Bright-Side Personality 6
2.2 Motives, Values, & Preferences 6
2.3 Why these Assessments 6
2.4 Leader Focus Dimensions 7
3. Understanding the Leader Focus Report 9
3.1 Reading the Scores 9
3.2 Interpreting Scores 10
3.3 Intended Audience 12
3.4 Implementation 12
4. Psychometric Properties of Hogan Leader Focus Dimensions 13
4.1 Descriptive Statistics 13
4.2 Test-Retest Reliabilities 14
4.3 Intercorrelations Between Leader Focus Dimensions 15
5. Validity 16
5.1 Construct Validity 16
5.1.1 Procedure and Sample 16
5.1.2 Instruments 16
5.1.3 Results of Scale to Scale Correlates 18
5.2 Correlations with Others’ Descriptions 21
5.2.1 Procedures, Samples, and Instruments 21
5.2.2 Results of Observer Description Correlates 22
Appendix A: Sample Hogan Leader Focus Report 25
Appendix B: Complete Correlation Matrices for Leader Focus Dimensions 35
References 38
4
Page 5

Leader Focus | Technical Manual
Tables & Figures
Table 2.1 Correlations Between Selected HPI and MVPI Scales 7
Table 2.2 Hogan Leader Focus Dimensions 7
Figure 3.1 Example of a Leader Focus Dimension Main Score 9
Figure 3.2 Example of Leader Focus Dimension Sub-Component Scores 9
Figure 3.3 Example of a High Score 10
Figure 3.4 Example of a Low Score 10
Figure 3.5 Example of a Moderate Score 11
Table 4.1 Classical Scale Statistics for Leader Focus Dimensions 13
Table 4.2 Test-Retest Reliability Estimates for Hogan Leader Focus Dimension Scores 14
Table 4.3 Correlations Between Leader Focus Dimensions 15
Table 5.1 Construct Validity Evidence for Results Focus Dimension 18
Table 5.2 Construct Validity Evidence for People Focus Dimension 18
Table 5.3 Construct Validity Evidence for Process Focus Dimension 19
Table 5.4 Construct Validity Evidence for Thought Focus Dimension 19
Table 5.5 Construct Validity Evidence for Social Focus Dimension 20
Table 5.6 Construct Validity Evidence for Data Focus Dimension 20
Table 5.7 Adjective Checklist Correlates for Constituent Scales of the Results Focus Dimension 22
Table 5.8 Adjective Checklist Correlates for Constituent Scales of the People Focus Dimension 22
Table 5.9 Adjective Checklist Correlates for Constituent Scales of the Process Focus Dimension 23
Table 5.10 Adjective Checklist Correlates for Constituent Scales of the Thought Focus Dimension 23
Table 5.11 Adjective Checklist Correlates for Constituent Scales of the Social Focus Dimension 23
Table 5.12 Adjective Checklist Correlates for Constituent Scales of the Data Focus Dimension 24
Table B.1 Correlations with International Personality Item Pool (IPIP) Scales 35
Table B.2 Correlations with HEXACO Honesty-Humility Scale & Subscales 35
Table B.3 Correlations with Hogan Development Survey (HDS) Scales 35
Table B.4 Correlations with MACH-IV Scale & Subscales 36
Table B.5 Correlations with Narcissistic Personality Inventory (NPI) Scale & Subscales 36
Table B.6 Correlations with Personality Inventory for DSM-5 (PID-5) Scales 36
Table B.7 Correlations with Verbal and Numerical Scales from the Hogan Judgment Report 37
Table B.8 Correlations with Hogan Business Reasoning Inventory (HBRI) Scales & Subscales 37
Table B.9 Correlations with Relationship Questionnaire Scales & Subscales 37
5
Page 6

Leader Focus | Technical Manual
1. Conceptual Background
1.1 Introduction
Organizational leaders influence an array of individual and organizational outcomes. Their leadership style
and the decisions they make impact the morale, well-being, and productivity of their teams and organizations.
Eective leaders inspire followership, organize people to work toward common goals, and motivate others to
exceed their potential. All leaders possess a unique set of personal characteristics that define the way they relate
to others, process information, perform tasks, set priorities, and lead teams.
Hogan’s Leader Focus Report provides insight into six leadership styles that represent dierent focus
areas, definitions of success, motivational strategies, and how a leader manages his or herself, career, and
relationships. This information provides insight to help leaders better understand their reputation and unique
personal brand.
2. The Hogan Leader Focus Model
Hogan identified the six styles in the Leader Focus Report based on empirical and conceptual relationships between
personality attributes on the Hogan Personality Inventory (HPI: R. Hogan & Hogan, 2007) and Motives, Values,
Preferences Inventory (MVPI: J. Hogan & Hogan, 2010). Consultants, coaches, and HR personnel who regularly
deliver development feedback to leaders oen locate and discuss multi-scale themes across our assessments. In
Hogan Certification Workshops and other training material, we teach users of our assessments to look for scale
dyads/triads both within and across assessments that are indicative of specific styles and behaviors.
In other words, examining combinations of scores oen provides more meaningful interpretation than
examining single scores by themselves. With the Leader Focus Report, our goal was to help decode otherwise
complex relationships specific to leadership styles between scores on two of our core inventories.
2.1 Bright-Side Personality
The Hogan Personality Inventory examines the “bright-side” of personality. The HPI reflects a person’s normal,
day-to-day behavior. Results from over 400 studies around the world support its validity for predicting
individual, leader, and team performance. HPI attributes represent stable and enduring behaviors that
determine how a leader pursues goals, manages relationships, solves problems, and processes information.
2.2 Motives, Values, & Preferences
The Motives, Values, Preferences Inventory assesses “the inside,” or a person’s core values. Organizations
use this assessment to evaluate person-organization fit and occupational preferences. Values associated
with MVPI scales form the lens through which people see the world, which powerfully influences a leader’s
priorities, decisions, and the standards he or she sets and enforces.
2.3 Why These Assessments
Related attributes from the HPI and MVPI provide insight into what leaders value and the behaviors they employ
to support their core values. In other words, they describe where a leader will focus his or her energy, attention,
and resources.
6
Page 7

Leader Focus | Technical Manual
For example, leaders who score high on the MVPI Power scale value status, authority, competition, and winning.
Leaders who score high on the HPI Ambition scale are likely competitive, confident, and driven. Taken together,
these two characteristics suggest these leaders will focus squarely on objective results to define success for their
teams. They will expect high levels of performance from themselves and others, establish loy goals, and work
tenaciously toward achieving their objectives. However, they also risk seeming overly demanding, intimidating,
or forceful – aspects of their reputation they may need to manage. These are strong Results Leaders, or leaders
whose values and behaviors all point to a relentless focus on winning.
2.4 Leader Focus Dimensions
Tables 2.1 and 2.2 provide a summary of HPI and MVPI scale combinations that comprise the six dimensions in the
Leader Focus Report, correlations between these scales, and descriptions of each dimension.
Table 2.1 Correlations Between Selected HPI and MVPI Scales
Leader Focus Style HPI Scale MVPI Scale Correlation
Results Leader Ambition Power .34
People Leader Interpersonal Sensitivity Altruistic .48
Process Leader Prudence Security .38
Thought Leader Inquisitive Aesthetics .30
Social Leader Sociability Ailiation .48
Data Leader Learning Approach Science .26
Note: N = 14,039 Leaders
Table 2.2 Hogan Leader Focus Dimensions and Scales
Leader Focus Dimension Scales Scale Definitions
Results Leader | key focus: winning
· Sets high goals and expectations for
themselves and others
· Results-oriented, competitive, tenacious,
and expects high levels of performance from
their direct reports
Ambition Degree to which a person seems “leader-like,” outwardly
confident, and driven
Power The extent to which a person values competition and
influence, is interested in challenges, and enjoys a
lifestyle organized around worldly success
· Driven and demanding, but can be
intimidating to others and might lead teams
to become too internally competitive
People Leader | key focus: relationships
· Skilled at building and maintaining nurturing
relationships with others
· Tends to focus on the morale and well-being
of sta, and seen as warm and caring
· Has a desire to maintain harmony with
others, which can interfere with the ability
to deliver candid feedback and make
unpopular decisions
Interpersonal
Sensitivity
Altruistic The extent to which a person values helping others, is
Degree to which a person seems warm, friendly, and
nurturing
concerned for the less fortunate, and has an interest in
public service and the betterment of humanity
7
Page 8
Leader Focus | Technical Manual
Table 2.2 Hogan Leader Focus Dimensions and Scales (Continued)
Leader Focus Dimension Scales Scale Definitions
Process Leader | key focus: implementation
•• Focuses on creating, following, and
enforcing policies and procedures
•• Has a strong implementation focus and the
ability to plan, stay organized, and follow
through on commitments
•• Has a tendency to be inflexible about rules,
micromanage processes, and resist change
Thought Leader | key focus: ideas
•• Focuses on creativity, innovation, and open-
minded evaluation of ideas and possibilities
•• Has a strategic problem-solving approach
with a motivation to experiment and
innovate
•• Big-picture oriented and willing to embrace
change, but may ignore practical solutions
and become bored with mundane tasks
Social Leader | key focus: influence
•• Skilled at communicating, networking, and
developing connections
•• Tends to use their relationship building
abilities and social influence to engage and
motivate sta
•• May confuse their social activity with
productivity and be distracting to others who
are trying to complete assignments
Data Leader | key focus: information
•• Skilled at analyzing relationships between
variables, identifying data trends, and
establishing credibility with technical
expertise
•• Enjoys staying up-to-date with industry
trends and using technology to solve
problems
•• May underestimate the importance of
managing people and have a lack of
tolerance for more intuitive decision-making
approaches
Prudence Degree to which a person seems detailed, rule-abiding,
and organized
Security The extent to which a person values order and structure,
risk-free environments, and a lifestyle organized around
minimizing uncertainty and criticism
Inquisitive Degree to which a person seems bright, creative, and
interested in intellectual matters
Aesthetics The extent to which a person values self-expression, a
dedication to quality, and attention to the appearance of
work products
Sociability Degree to which a person seems socially proactive,
gregarious, and enjoys interacting with others
Ailiation The extent to which a person values group membership,
has an interest in working with and being part of teams,
and prefers a lifestyle organized around social interaction
Learning
Approach
Science The extent to which a person is interested in science,
Degree to which a person seems to enjoy academic
activities and values educational achievement for its own
sake
technology, and data-based decision making
8
Page 9
Leader Focus | Technical Manual
Leader Focus
3. Understanding The Leader Focus Report
3.1 Reading the Scores
The Leader Focus Report provides information about a person’s likely leadership style according to six broad
leadership dimensions. These leadership “focus areas” influence the types of tasks the leader will prioritize,
what information he or she will attend to, and the behaviors the leader will likely encourage or penalize.
Main Score. The report includes main scores for each focus area. Higher scores indicate greater focus, or a greater
lilkelihood to exhibit behaviors associated with that leadership style, whereas lower scores indicate less focus in
that style. A leader’s highest and lowest scores will provide the greatest insight into which aspects of his or her
leadership style will be noticed by others.
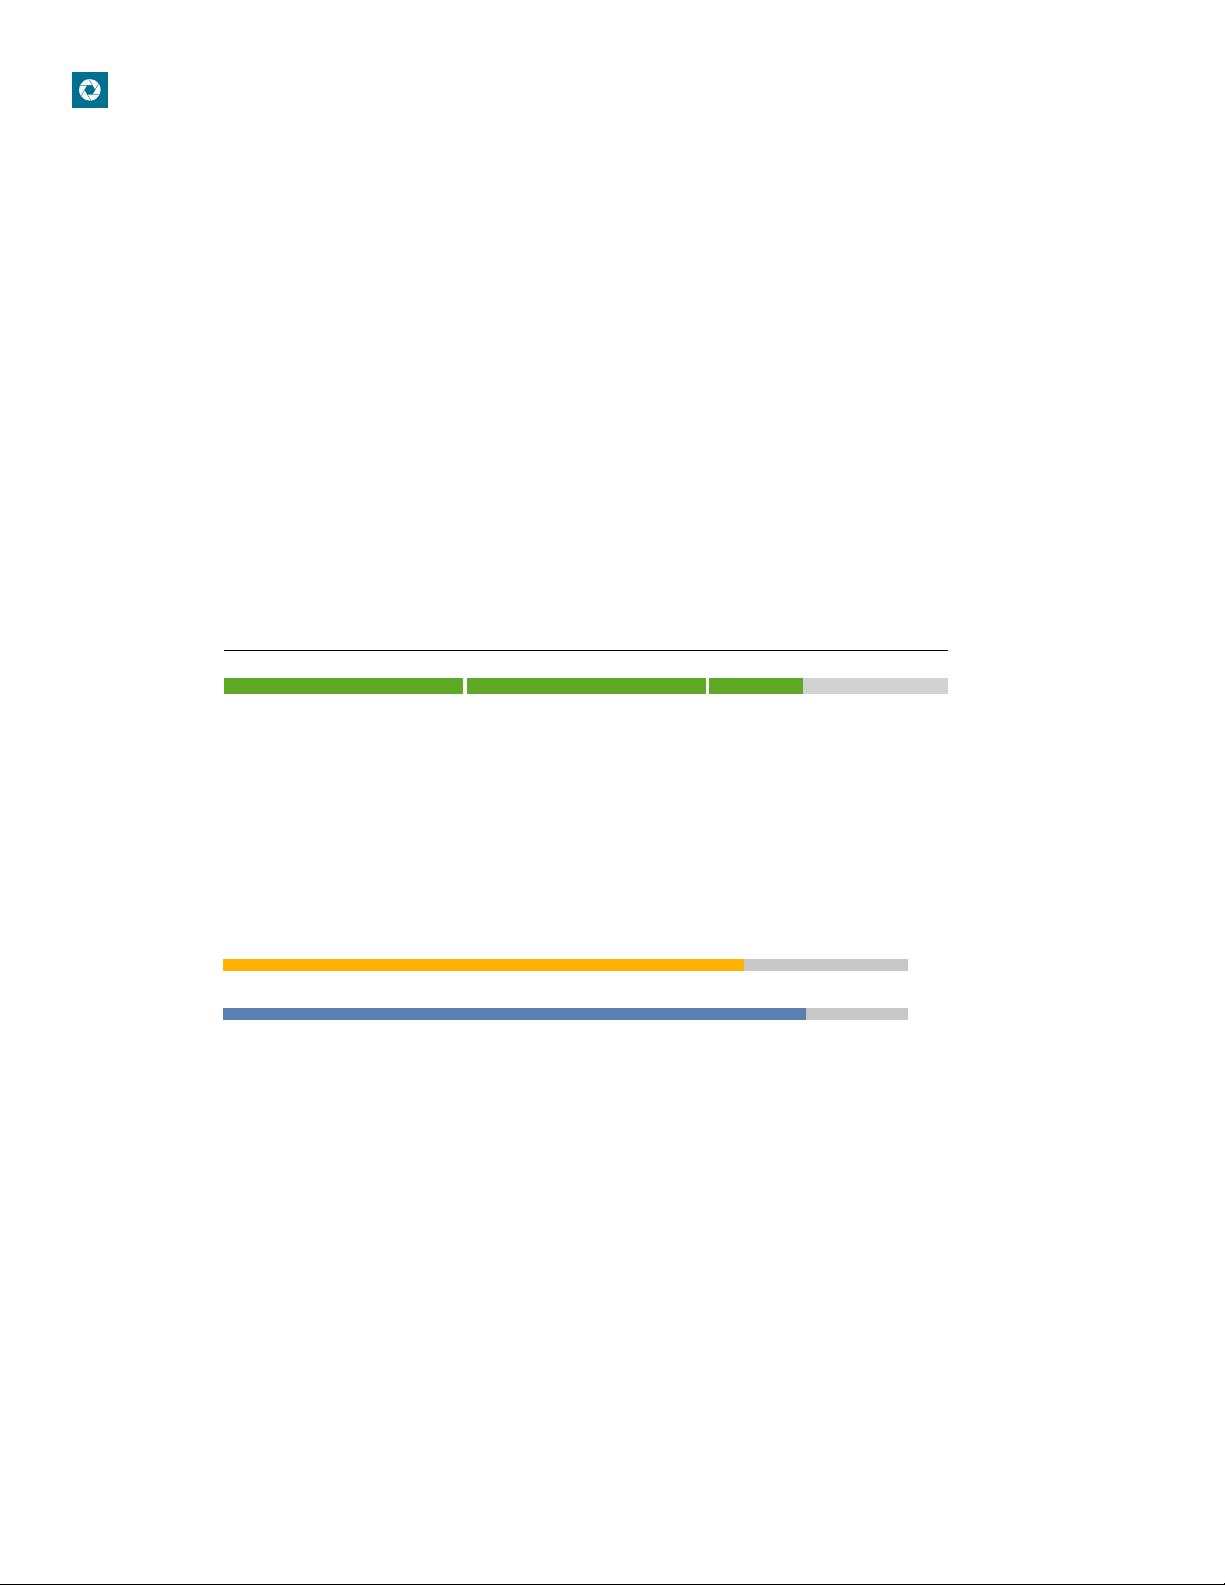
Figure 3.1 Example of a Leader Focus Dimension Main Score
Results Leader
LOW
Indicates a low degree of
focus on results
Indicates a balanced
degree on results
.
Indicates a high degree of
focus on results
HIGH
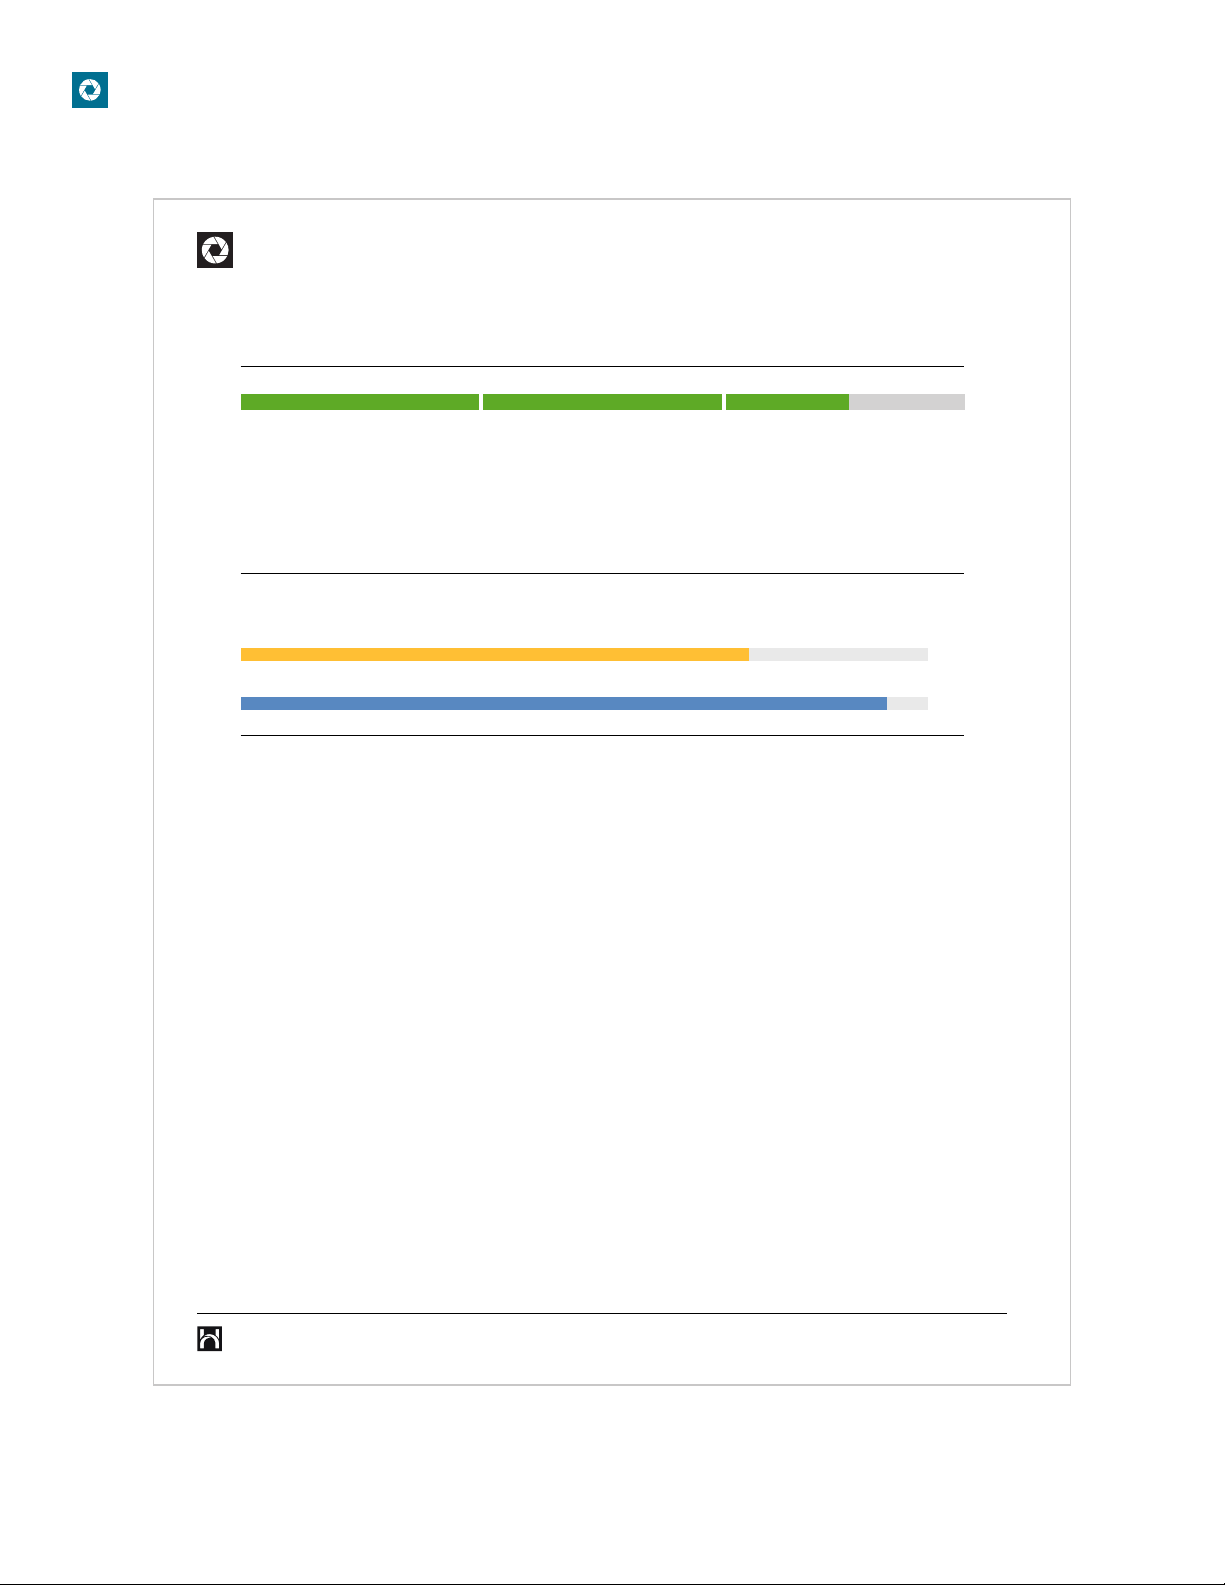
Sub-Components. The Leader Focus Report also presents results for the underlying HPI scale (yellow bar) and
MVPI scale (blue bar) associated with each focus area.
Figure 3.2 Example of a Leader Focus Dimension Sub-Component Score
Ambition
75
Power
80
Development Tips. Regardless of whether the scores are high, moderate, or low, there are development
considerations across the entire continuum for each Focus dimension. These tips are useful in guiding personal
development eorts.
Unconscious Biases. Leaders may not be aware how powerfully their values influence behavior. The unconscious
biases section associated with each focus area provides suggestions about how to raise awareness of and
monitor biases as a leader.
9
Page 10
Leader Focus | Technical Manual
3.2 Interpreting Scores
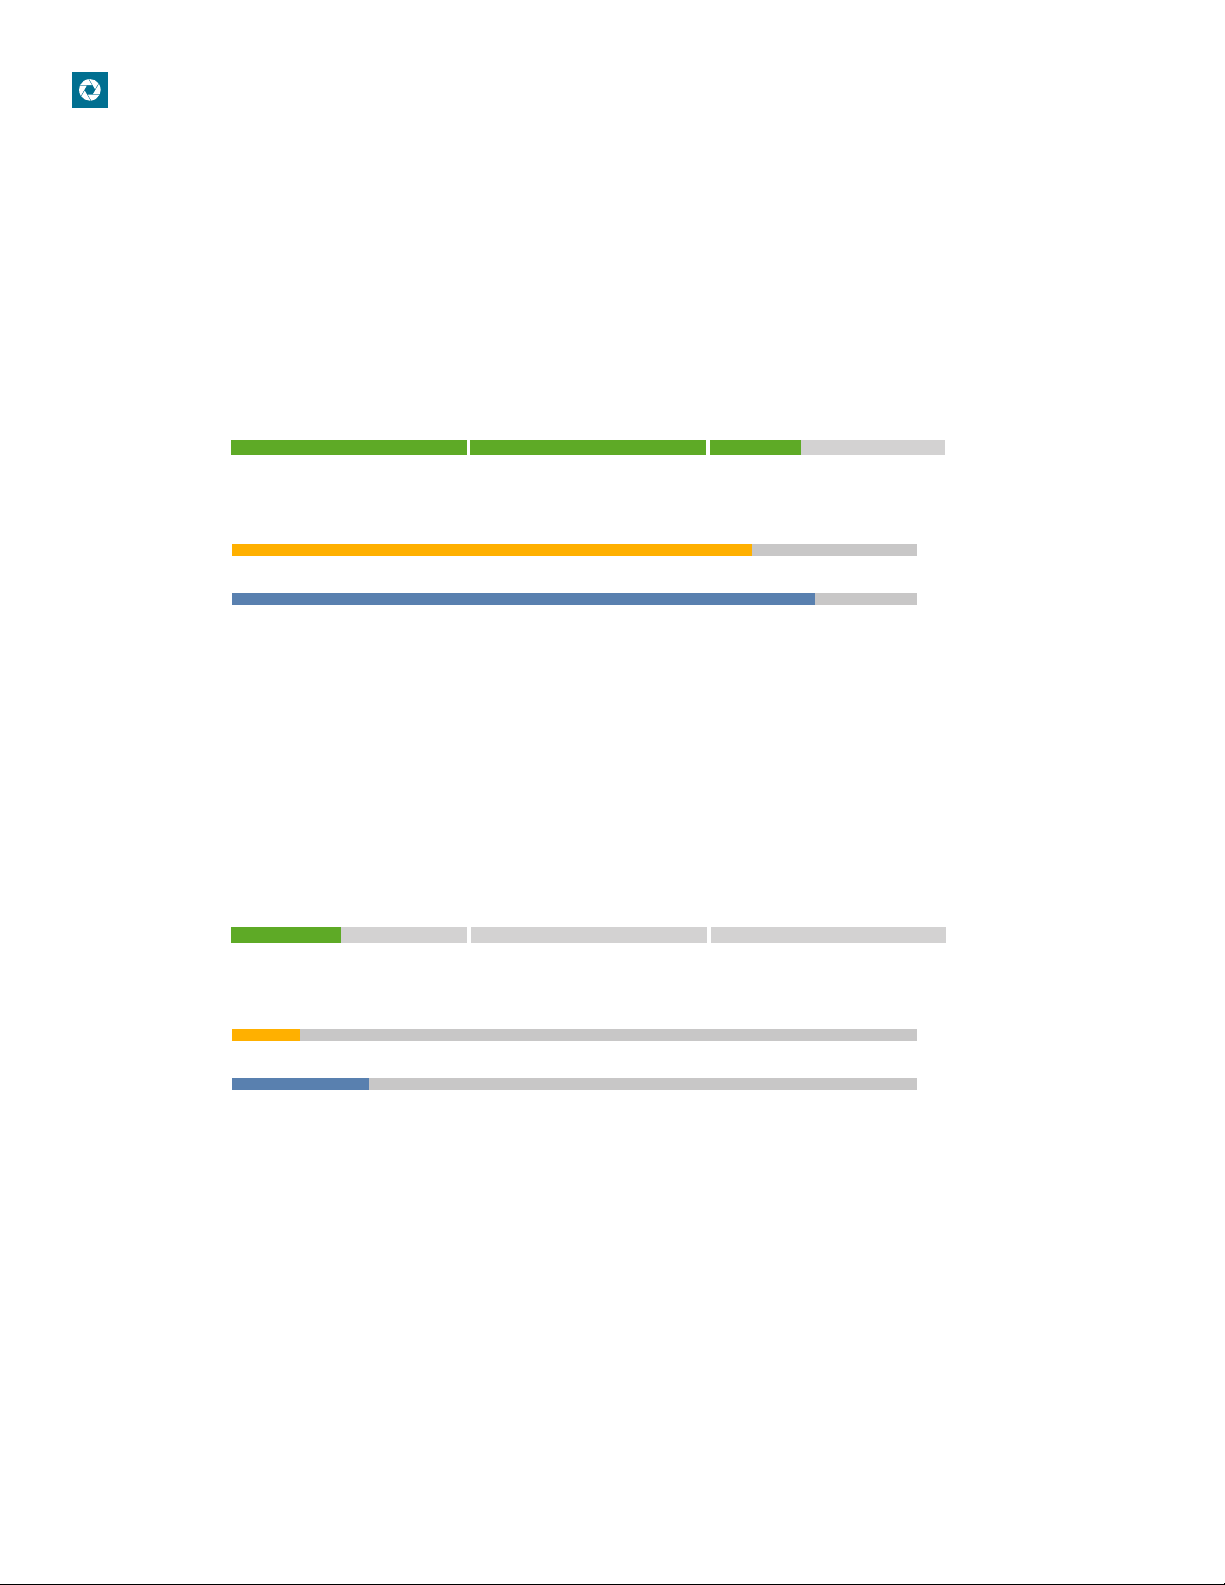
High Scores. High scores are easy to interpret, as they indicate a strong alignment between HPI and MVPI results.
This suggests a clear and consistent focus on a leadership dimension. For example, consider a high Results
Leader score.
Figure 3.3 Example of a High Score
Results Leader
LOW HIGH
Ambition
75
Power
This Ambition score indicates a relentless focus on getting ahead, reaching goals, and beating the competition. This leader
will tend to take initiative, drive for goal achievement, and may even compete with peers. His or her high Power score also
indicates a preference for taking on challenging projects and seeking opportunities to advance.
80
Low Scores. Low scores are also easy to interpret, as they also indicate strong alignment between HPI and MVPI
results. Consider the following example on the Social Leader dimension.
Figure 3.4 Example of a Low Score
Social Leader
LOW HIGH
Sociability
10
Ailiation
This low Sociability score indicates a likelihood of seeming introverted, uncommunicative, and task-focused. This leader will
tend to listen more than talk and seem quiet and socially reactive. His or her low Ailiation score also indicates a preference
to not engage in teamwork, instead preferring to work alone.
20
10
Page 11
Leader Focus | Technical Manual
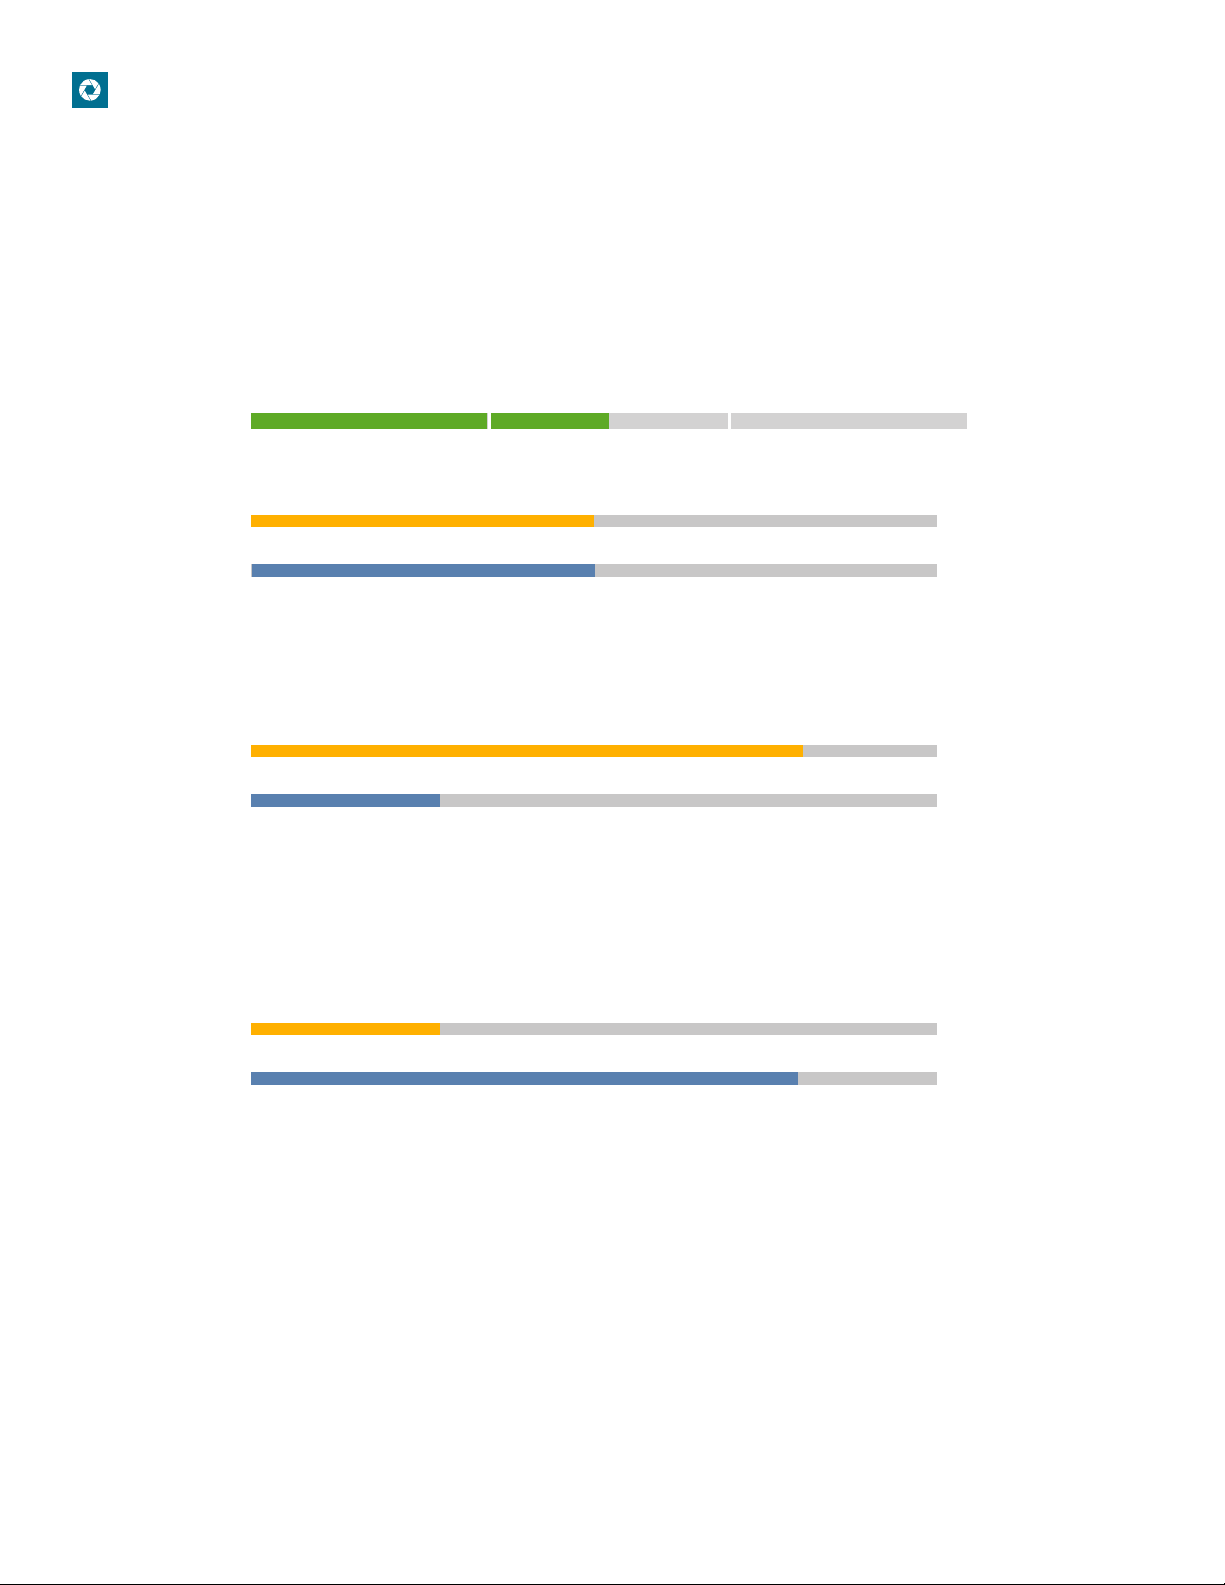
Moderate Scores. Moderate scores can be more diicult to interpret because they can occur as the result of
several dierent score combinations. When both the HPI and MVPI scores fall into the moderate range, this
indicates strong alignment between the scales for a focus area. Leaders with this combination of scores are likely
flexible and can adjust to the demands of the situation.
Figure 3.5 Examples of a Moderate Score
Process Leader
LOW HIGH
Prudence
50
Security
50
In some cases, moderate scores represent a score conflict. When such conflicts occur, it is because the way a leader
approaches their own work does not necessarily reflect the type of environment they prefer. Consider the following
examples for the Process Leader dimension.
Prudence
80
Security
Individuals with high Prudence scores tend to be organized and attentive to detail. However, when coupled with a low
Security score, structure and predictability do not necessarily motivate them. They will be unafraid to take risks and will
value trying new things, but will seem very planful in the way they approach new ventures. They are likely to be good
organizational citizens who follow rules and process, but prefer to take their own approach to work. However, they may
not always provide structure in process when managing others
Prudence
Security
Individuals with low Prudence tend to be flexible and willing to challenge process. However, when coupled with a
high Security score, they also prefer environments that emphasize safety, financial security, and risk avoidance. As a
leader, they may send conflicting messages to others between their desire to implement process and structure, and
their willingness to break rules and challenge authority. Direct reports are likely to be confused because they will be
unsure of whether to do as the leader says (e.g., follow process and avoid errors) or do as the leader does (e.g., work
independently and set his or her own rules).
20
20
80
11
Page 12

Leader Focus | Technical Manual
3.3 Intended Audience
We designed the Leader Focus Report for use with entry- to mid-level managers and leaders. Its is particularly
useful for the following people and scenarios:
•• Those who have transitioned (or are considering a transition) from being an individual contributor to a
leader
•• Senior technical talent who have transitioned (or are considering a transition) to management
•• In-role leaders and managers who wish to gain greater insight into their leadership style and develop
their leadership skills
3.4 Implementation
We recommend that participants receive structured feedback regarding the results of their Leader Focus Report.
This feedback can be delivered by a Hogan certified professional and/or through our web-based, self-guided
development materials.
12
Page 13

Leader Focus | Technical Manual
4. Psychometric Properties of Hogan Leader Focus Dimensions
4.1 Descriptive Statistics
Table 4.1 presents descriptive statistics for each of the dimensions in the Leader Focus Report, including
minimum and maximum observed scores, mean scores, standard deviations, skewness and kurtosis statistics,
and internal consistency reliability coeicients.
“Skewness” refers to departure from symmetry in a distribution of scores. When the distribution is symmetrical,
skewness values are around zero. Positive skewness values indicate that most scores fall toward the bottom end
of a distribution, and negative skewness values indicate that most scores fall near the top end of a distribution.
Skewness values greater than +1.0 or less than -1.0 generally indicate a significant departure from symmetry.
“Kurtosis” refers to how peaked or flat a score distribution is, relative to the normal distribution. When scores
are normally distributed, kurtosis values are around zero and we refer to them as mesokurtic. When distribution
is sharper than normal, kurtosis values are positive and we refer to them as leptokurtic. When distribution is
broader than normal, kurtosis values are negative and we refer to them as platykurtic.
Internal consistency is a measure of reliability that estimates how well variables—in this case the HPI and MVPI
scales—predict a common attribute (i.e., one of the Leader Focus Dimensions). When scales measure the same
construct, internal consistency reliability is high. When scales measure dierent constructs, it is low.
To examine the descriptive statistics for our competencies and dimensions, we obtained data from a global
sample of approximately 14,000 leaders. This group represents the intended population for this report. Most
of the sample (60.2%) completed the HPI and MVPI as part of employee development or leadership coaching
eorts and a smaller number completed the assessments for applicant screening (31.7%) or research (8.2%).
Participants were 39.64 years old on average (SD = 8.65); 59.8% were male, and 33.8% were female (6.4% of
participants did not indicate their gender).
Table 4.1 Classical Scale Statistics for Leader Focus Dimensions
Focus Min Max M SD Skew Kurt
Results 0.0 100.0 54.19 23.93 -0.19 -0.84 .49
People 0.0 100.0 51.91 23.79 -0.12 -0.84 .41
Process 0.0 99.5 48.67 23.80 0.03 -0.93 .55
Thought 0.0 100.0 49.84 22.68 0.02 -0.81 .46
Social 0.0 100.0 50.60 24.54 -0.04 -0.92 .62
Data 0.0 100.0 52.49 22.83 -0.10 -0.80 .41
Note: N = 14,039. Min = Minimum score; Max = Maximum score; M = Mean; SD = Standard deviation; Skew = Skewness
statistic; Kurt = Kurtosis statistic; α = Cronbach’s alpha.
α
13
Page 14

Leader Focus | Technical Manual
As shown in Table 4.1, minimum and maximum observed scores cover nearly the entire range of possible scores
from 0 to 100. Average scores fall near the scales’ midpoints, ranging from 48.67 (Process Focus) to 54.19 (Results
Focus). Standard deviations are consistent across all dimensions, ranging from 22.68 (Thought Focus) to 24.54
(Social Focus). Skewness statistics indicate that score distributions are adequately symmetrical, with results
ranging from -.19 (Results Focus) to .03 (Process Focus). Kurtosis statistics indicate that score distributions for all
dimensions are not abnormally peaked or flat, with results ranging from -.93 (Process Focus) to -.80 (Data Focus).
Internal consistency reliability coeicients range from .41 (Data Focus and People Focus) to .62 (Social Focus).
The Leader Focus Dimensions include related yet distinct HPI and MVPI scales, lowering internal consistency
coeicients. The reliability of the Leader Focus Dimensions may be better viewed as consistency over time,
which is more properly measured using test-retest reliability.
4.2 Test-Retest Reliabilities
Professional standards compel assessment providers to supply evidence that individual results do not vary
widely across time. Because we score our dimensions using scale scores from the HPI and MVPI, we obtained
this evidence by administering the assessments to the same sample of people twice, scoring their results, and
correlating scores from the first administration with those from the second administration. Higher correlations
indicate that scores are consistent across time; lower correlations reflect inconsistencies that may signal
problems with construct measurement.
Table 4.2 provides test-retest reliability estimates for all dimensions included in our model. We collected these
data from a sample of 541 individuals. Ages ranged from 17 to 62, with an average of 35.49 years (SD = 9.52). The
sample included 61.9% male and 28.5% female participants (9.6% of participants did not indicate their sex). The
interval between assessment administrations ranged from 0.00 to 5.72 years, with an average interval of 1.06
years. We separated our analyses between those whose interval was equal to or lesser than one year (N = 322)
and those whose interval was greater than one year (N = 219).
Table 4.2 Test-Retest Reliability Estimates for Hogan Leader Focus Dimension Scores
Test-Retest Correlation
Focus
Results .76 .70
People .68 .68
Process .82 .79
Thought .81 .79
Social .81 .74
Data .82 .76
Note: One Year or Less N = 322; More Than One Year N = 219; Test-retest reliabilities computed using Pearson correlations
between dimensions’ scores based on first and second assessment administrations.
One Year or Less
Test-Retest Correlation
More Than One Year
Within the first-year test-retest reliabilities for dimensions’ range from .68 (People Focus) to .82 (Data Focus and
Process Focus), with an average of .78. For those who take the assessments more than a year apart, test-retest
reliabilities range from .68 (People Focus) to .79 (Thought Focus and Process Focus), with an average of .74.
14
Page 15

Leader Focus | Technical Manual
4.3 Intercorrelations Between Leader Focus Dimensions
We computed correlations between the dimensions using our global sample of leaders previously described.
Table 4.3 presents these results.
Table 4.3 Correlations Between Leader Focus Dimensions
Focus Results People Process Thought Social Data
Results 1.00 .15** -.03** .19** .45** .30**
People 1.00 .18** .28** .38** .14**
Process 1.00 -.11** -.19** .08**
Thought 1.00 .26** .46**
Social 1.00 .15**
Data 1.00
Note: ** Statistically significant at the .01 level; N = 14,039.
Correlations between dimensions are generally small and positive with two exceptions. First, correlations
between Leader Focus Dimensions are higher when their underlying HPI dimensions are related. For instance,
Results Focus (HPI Ambition) and Social Focus (HPI Sociability), both related to Five-Factor Model (FFM)
Extraversion, have a correlation coeicient of .45. Thought Focus (HPI Inquisitive) and Data Focus (HPI Learning
Approach), both related to FFM Openness, have a correlation coeicient of .46. Second, Process has two negative
correlations and one practically non-zero correlation. These patterns indicate that the relationships among
the Leader Focus Dimensions reflect their underlying personality components and are conceptually distinct,
particularly for the Process Focus dimension.
15
Page 16

Leader Focus | Technical Manual
5. Validity
Validity concerns the degree to which scores predict meaningful behavioral outcomes. As such, the validity of our
solution depends on the relationships between scores on each component of the data from other sources (cf.
R. Hogan, Hogan, & Roberts, 1996). These sources include other assessments (construct validity) and adjective
checklists (others’ descriptions of the person).
5.1 Construct Validity
Information concerning construct validity includes correlations with relevant scales from assessments
measuring personality, cognitive ability, and relationship styles, as well as relationships with job performance
ratings.
The following section presents selected results from nine such assessments. Appendix B presents full correlation
matrices between dimensions from the Hogan Leader Focus Report and scales from these assessments.
5.1.1 Procedure and Sample
We collected data from 384 U.S. working adults who participated in an eight-week, online unproctored testing
series. All participants completed the HPI and MVPI, and nine additional assessments described below. The
sample included 44.5% males, 54.7% females, and 0.8% of participants who did not report their gender.
Participant ages ranged from 18 to 64 years with a mean of 34.17 years (SD = 10.43). Participants received
compensation for their time, and all participants completed the assessments as part of low-stakes testing where
results did not impact hiring, promotion, or any other personnel decisions.
5.1.2 Instruments
IPIP. The International Personality Item Pool (IPIP; Goldberg, 1999; Goldberg, et al., 2006) is an online, public
domain collection of over 3,000 personality assessment items researchers have used to create 274 scales.
We present correlations with scales aligned with the FFM of personality reflected in the NEO-PI-R (Costa &
McCrae, 1992): Extraversion, Agreeableness, Conscientiousness, Neuroticism, and Openness to Experience. This
inventory consists of 100 five-point, Likert-type items. Goldberg et al. (2006) describe technical features of the
IPIP, including norming samples, scale construction, and validity indices. The IPIP website (http://ipip.ori.org)
provides additional information.
Honesty-Humility from HEXACO. The Honesty-Humility scale from the HEXACO personality inventory
(HEXACO-100; Lee & Ashton, 2004; Lee & Ashton, 2016) consists of 16 five-point, Likert-type items and contains
four subscales: Sincerity, Fairness, Greed Avoidance, and Modesty. Lee and Ashton (2016) used 100,000 online
respondents and 2,000 Canadian undergraduate students to examine and report the psychometric properties of
the HEXACO-100.
HDS. The Hogan Development Survey (HDS; R. Hogan & Hogan, 2009) concerns characteristics that can derail
careers, relationships, and other productive activities. The HDS contains 11 primary scales: Excitable, Skeptical,
Cautious, Reserved, Leisurely, Bold, Mischievous, Colorful, Imaginative, Diligent, and Dutiful. These scales assess
dysfunctional dispositions that emerge when people stop considering how their actions aect others. Over time,
these dispositions create a person’s reputation and can impede job performance and career success.
16
Page 17

Leader Focus | Technical Manual
The HDS is not a medical or clinical assessment. It does not measure personality disorders, which are
manifestations of mental disorder. Instead, the HDS assesses self-defeating expressions of normal personality.
The DSM-5 (American Psychiatric Association, 2013, p. 647) makes this same distinction between behavioral
traits and disorders—self-defeating behaviors, such as those predicted by the HDS, come and go depending on
the context. In contrast, personality disorders are enduring and pervasive across contexts.
The HDS Technical Manual (R. Hogan & Hogan, 2009) and the HDS Form 5 Technical Supplement (Hogan
Assessment Systems, 2014a) provide more details about the reliability, validity, factor structure, and norm
development of the assessment.
MACH-IV. The MACH-IV (Christie & Geis, 1970) includes 20 five-point, Likert-type items that assess
Machiavellianism, which involves having a cynical world-view and being willing to manipulate others for one’s
personal gain. Christie and Geis (1970) provide information regarding the development and psychometric
evidence for the MACH-IV.
NPI. The Narcissistic Personality Inventory (NPI; Raskin & Terry, 1988) consists of 40 forced-choice response
items and contains seven subscales: Authority, Self-Suiciency, Superiority, Exhibitionism, Exploitativeness,
Vanity, and Entitlement. Raskin and Terry (1988) used over 1,000 U.S. undergraduate students to construct the
NPI and examine its psychometric properties.
PID-5. The Personality Inventory for DSM-5 (PID-5; American Psychiatric Association, 2013; Krueger, Derringer,
Markon, Watson, & Skodol, 2012) provides scale configurations that align with personality disorders from the DSM-
5. Although the American Psychiatric Association (2013) does not recommend researchers use the PID-5 for clinical
diagnoses, they do recommend it for research purposes or as a supplement when evaluating how personality
function changes over time. The PID-5 includes 220 four-point, Likert-type responses and contains 25 scales:
Anhedonia, Anxiousness, Attention Seeking, Callousness, Deceitfulness, Depressivity, Distractibility, Eccentricity,
Emotional Lability, Grandiosity, Hostility, Impulsivity, Intimacy Avoidance, Irresponsibility, Manipulativeness,
Perceptual Dysregulation, Perseveration, Restricted Aectivity, Rigid Perfectionism, Risk Taking, Separation
Insecurity, Submissiveness, Suspiciousness, Unusual Beliefs and Experiences, and Withdrawal.
Judgment. The Hogan Judgment Report (Hogan Assessment Systems, 2014b) measures verbal and numerical
information processing, four information processing styles, three decision-making approach dichotomies
(Threat Avoidance vs. Reward Seeking, Tactical vs. Strategic Thinking, and Data-Driven vs. Intuitive Decisions),
three decision reaction dichotomies (Defensive vs. Cool-Headed, Denial vs. Acceptance, and Superficial vs.
Genuine Engagement), and openness to feedback and coaching. Its normative sample includes data from over
750 global executives, managers, and other high-level professionals (Hogan Assessment Systems, 2014b).
HBRI. The Hogan Business Reasoning Inventory (HBRI; R. Hogan, Barrett, & Hogan, 2009) contains 24 items that
assess cognitive skills. Items reflect cognitive tasks with content reflecting business operations for managers
and professionals. The HBRI includes an Overall Reasoning score comprised of Strategic and Tactical Reasoning
scales. The HBRI Technical Manual (R. Hogan, Barrett, & Hogan, 2009) provides information on the technical
features of the test, including reliability, scale construction, factor analysis, and validity.
RQ. The Relationship Questionnaire (RQ; Bartholomew & Horowitz, 1991) consists of four seven-point, Likerttype items. Each item describes one of four relationship styles that align with four attachment styles: Secure,
Anxious-Preoccupied, Fearful-Avoidant, and Dismissive-Avoidant. The authors worded these items to reflect a
general attitude toward close relationships. Bartholomew and Horowitz (1991) used 144 U.S. college students to
construct and examine the psychometric properties of the RQ.
17
Page 18

Leader Focus | Technical Manual
5.1.3 Results of Scale to Scale Correlates
The following tables present selected correlations between Hogan Leader Focus Dimensions and conceptually
aligned scales from other assessments. Appendix B provides full correlation matrices with these assessments.
Results Focus. Table 5.1 presents selected correlations for the Results Focus dimension.
Table 5.1 Construct Validity Evidence for Results Focus Dimension
Assessment Scale Results Focus
HDS Bold .65**
NPI Narcissism .61**
HDS Colorful .49**
IPIP Conscientiousness .39**
PID-5 Distractibility -.31**
IPIP Neuroticism -.45**
HDS Cautious -.60**
Note: ** Statistically significant at the .01 level.
Results highlight the energetic and driving nature of the Results Focus Dimension. Others are likely to
describe people with high scores as highly driven (HDS Bold), energetic (HDS Colorful), and persistent (IPIP
Conscientiousness, IPIP Neuroticism, and PID-5 Distractibility). Others may also view high scorers as almost
fearless (HDS Cautious), to the point of potentially unrealistic expectations from themselves and others (NPI
Narcissism).
People Focus. Table 5.2 presents selected correlations for the People Focus dimension.
Table 5.2 Construct Validity Evidence for People Focus Dimension
Assessment Scale People Focus
IPIP Agreeableness .63**
RQ
HEXACO
HDS
PID-5
PID-5
MACH-IV
PID-5
HDS
HDS
Note: ** Statistically significant at the .01 level.
Secure Attachment Style
Honesty-Humility
Skeptical
Hostility
Callousness
Machiavellianism
Withdrawal
Excitable
Reserved
.37**
.33**
-.44**
-.45**
-.48**
-.51**
-.51**
-.55**
-.60**
Results highlight the nurturing, supportive nature of the People Focus dimension. Others are likely to describe
people with high scores as warm (IPIP Agreeableness, PID-5 Callousness, PID-5 Hostility, and HDS Skeptical) and
engaging (HDS Reserved, RQ Secure Attachment Style, and PID-5 Withdrawal). Others may also view high scorers as
modest (HEXACO Honesty-Humility), steady (HDS Excitable), and concerned about how their actions aect others
(MACH-IV Machiavellianism).
18
Page 19

Leader Focus | Technical Manual
Process Focus. Table 5.3 presents selected correlations for the Process Focus dimension.
Table 5.3 Construct Validity Evidence for Process Focus Dimension
Assessment Scale Process Focus
IPIP Conscientiousness .38**
HDS Diligent .37**
HDS Dutiful .35**
PID-5 Irresponsibility -.34**
PID-5 Impulsivity -.51**
HDS Mischievous -.58**
PID-5 Risk Taking -.60**
Note: ** Statistically significant at the .01 level.
Results highlight the planning nature of the Process Focus dimension. Others are likely to describe people with
high scores as organized (IPIP Conscientiousness), reliable (PID-5 Impulsivity and PID-5 Irresponsibility), and
conforming (HDS Dutiful). Others may also view high scorers as risk averse (HDS Mischievous and PID-5 Risk
Taking) with a tendency to micromanage their subordinates (HDS Diligent).
Thought Focus. Table 5.4 presents selected correlations for the Thought Focus dimension.
Table 5.4 Construct Validity Evidence for Thought Focus Dimension
Assessment Scale Thought Focus
IPIP Openness .62**
HDS Imaginative .52**
HDS Colorful .34**
PID-5 Risk Taking .21**
HDS Skeptical -.16**
HDS Cautious -.18**
Note: ** Statistically significant at the .01 level.
Results highlight the innovative nature of the Thought Focus dimension. Others are likely to describe people
with high scores as creative (IPIP Openness), trusting (HDS Skeptical), and willing to embrace new ideas and
ways of doing things (HDS Cautious and PID-5 Risk Taking). However, others may also view high scorers as
eccentric (HDS Imaginative) and as people who have diiculty eectively implementing creative ideas (HDS
Colorful).
Social Focus. Table 5.5 presents selected correlations for the Social Focus dimension.
19
Page 20

Leader Focus | Technical Manual
Table 5.5 Construct Validity Evidence for Social Focus Dimension
Assessment Scale Social Focus
IPIP Extraversion .65**
HDS Colorful .59**
NPI Narcissism .49**
PID-5 Attention Seeking .38**
RQ Secure Attachment Style .33**
PID-5 Manipulativeness .28**
HDS Excitable -.27**
IPIP Neuroticism -.32**
PID-5 Withdrawal -.48**
HDS Reserved -.57**
Note: ** Statistically significant at the .01 level.
Results highlight the outgoing nature of the Social Focus dimension. Others are likely to describe people with
high scores as gregarious (HDS Reserved, IPIP Extraversion, PID-5 Attention Seeking, and PID-5 Withdrawal),
good at building relationships (HDS Excitable, IPIP Neuroticism, and RQ Secure Attachment Style), and willing to
use those relationships to accomplish goals (NPI Narcissism and PID-5 Manipulativeness). Others may also view
high scorers as sociable to the point of interfering with their own and others’ productivity (HDS Colorful).
Data Focus. Table 5.6 presents selected correlations for the Data Focus dimension.
Table 5.6 Construct Validity Evidence for Data Focus Dimension
Assessment Scale Data Leader
IPIP Openness .37**
IPIP Conscientiousness .35**
HBRI Overall Critical Reasoning .34**
Judgment Numerical Information Processing .29**
Judgment Verbal Information Processing .27**
HDS Diligent .18**
HDS Cautious -.24**
PID-5 Distractibility -.27**
Note: ** Statistically significant at the .01 level.
Results highlight the analytical nature of the Data Focus dimension. Others are likely to describe people with
high scores as intellectual (HBRI Overall Critical Reasoning, IPIP Openness, Judgment Numerical Information
Processing, and Judgment Verbal Information Processing) and adventurous (HDS Cautious). Others will also
likely view high scorers as detail oriented (IPIP Conscientiousness), meticulous (HDS Diligent), and focused (PID5 Distractibility).
20
Page 21

Leader Focus | Technical Manual
5.2 Correlations with Others’ Descriptions
Correlations with observer ratings are one of the most important sources of information for interpreting scores.
According to Socioanalytic Theory, the same processes underlie social interaction and response to assessment
items. In theory, this is the reason certain scores are associated with certain peer descriptions (Mills & Hogan,
1976). Thus, finding correlations between scores on our model and others’ descriptions allows us to evaluate the
validity of our model for predicting people’s reputations at work.
We obtained peer rating information from the Eugene-Springfield Community Sample (ESCS; Goldberg, 2008).
The next section contains selected correlations between our dimensions and observer ratings from the ESCS.
For full correlation matrices between scales used to score Leader Focus competencies and descriptors from the
ESCS, consult the technical manuals for the HPI and MVPI.
5.2.1 Procedures, Samples, and Instruments
As part of Goldberg’s (2008) longitudinal community research, respondents and observers (e.g., significant
others, spouses, friends, acquaintances, coworkers) completed the Self/Peer Inventories, which include 88
items taken from Saucier’s (1994) 40-item Big-Five Mini-Markers, and the 44-item Big Five Inventory (John &
Srivastava, 1999; Benet-Martinez & John, 1998). In this survey, respondents described how well each adjective or
phrase described either themselves or the target individual using a Likert-type scale ranging from 1 (extremely
inaccurate) to 5 (extremely accurate).
Each participant, and up to four observers of each participant, completed these items. The sample of 196
participants providing self-ratings included 87 males and 109 females. Ages of subjects ranged from 21 years to
72 years with a mean of 45.45 years (SD = 8.72). Observers also responded to items assessing how and how well
they knew the target, how much they liked the target, and basic demographic questions on gender and age.
The sample of 538 respondents providing observer ratings included 208 males and 330 females. Ages ranged
from 7 to 89 years with a mean of 41.50 years (SD = 16.24). Observers included spouses and other relatives (N =
300), friends, coworkers, acquaintances, and significant others (N = 207), and 31 observers not indicating their
relationship to the target. Most observers indicated knowing the target “well” or “very well” (N = 522), and most
indicated they "liked" the target or liked the target “very much” (N = 520).
For each of the items, we averaged observer ratings to create a composite on each item for each target. We used
these mean responses (N = 196) to calculate correlations between observer ratings and our dimensions.
21
Page 22

Leader Focus | Technical Manual
5.2.2 Results of Observer Description Correlates
Results Focus. Table 5.7 provides selected correlations for the Results Focus Dimension.
Table 5.7 Adjective Checklist Correlates for Constituent Scales of the Results Focus Dimension
HPI Ambition MVPI Power
Has an assertive personality .34** Has an assertive personality .20*
Bold .33** Bold .18*
Energetic .32**
Perseveres until the task is finished .26**
A reliable worker .25**
Prefers routine work -.19* Prefers routine work -.22**
Tends to be lazy -.30**
Easily distracted -.33**
Note: * Statistically significant at the .05 level; ** Statistically significant at the .01 level.
Results reflect the goal-oriented nature of the Results Focus Dimension. Others describe individuals with high
scores as assertive, persistent, and energetic, and those with low scores as lazy and unfocused.
People Focus. Table 5.8 provides selected correlations for the People Focus Dimension.
Table 5.8 Adjective Checklist Correlates for Constituent Scales of the People Focus Dimension
HPI Interpersonal Sensitivity MVPI Altruism
Considerate and kind to almost everyone .30** Warm .32**
Warm .28** Helpful and unselfish with others .29**
Likes to cooperate with others .28** Considerate and kind to almost everyone .28**
Helpful and unselfish with others .22** Likes to cooperate with others .25**
Cold -.23** Cold -.19*
Finds fault with others -.24** Can be cold and aloof -.28**
Unsympathetic -.32** Unsympathetic -.32**
Note: * Statistically significant at the .05 level; ** Statistically significant at the .01 level.
Results reflect the caring-oriented nature of the People Focus Dimension. Others describe individuals with high
scores as kind, warm, helpful, and cooperative, and those with low scores as cold, unsympathetic, and critical.
Process Focus. Table 5.9 provides selected correlations for the Process Focus Dimension.
22
Page 23

Leader Focus | Technical Manual
Table 5.9 Adjective Checklist Correlates for Constituent Scales of the Process Focus Dimension
HPI Prudence MVPI Security
Prefers routine work .28** Prefers routine work .20*
Organized .23**
Makes plans and follows through .21**
Eicient .21**
Practical .19*
Sloppy -.20* Likes to reflect/play with ideas -.19*
Can be somewhat careless -.20* Imaginative -.24**
Likes to reflect/play with ideas -.31**
Note: * Statistically significant at the .05 level; ** Statistically significant at the .01 level.
Results reflect the procedure-oriented nature of the Process Focus Dimension. Others describe individuals with
high scores as organized, eicient, practical, and more comfortable with the familiar, and those with low scores
as careless, sloppy, and more interested in the new or novel.
Thought Focus. Table 5.10 provides selected correlations for the Thought Focus Dimension.
Table 5.10 Adjective Checklist Correlates for Constituent Scales of the Thought Focus Dimension
HPI Inquisitive MVPI Aesthetics
Likes to reflect/play with ideas .41** Has an active imagination .25**
Imaginative .37** Imaginative .23**
Has an active imagination .34** Likes to reflect/play with ideas .20*
Original/comes up with new ideas .30** Original/comes up with new ideas .17*
Uncreative -.23**
Unintellectual -.25** Unintellectual -.21**
Prefers routine work -.31** Uncreative -.27**
Note: * Statistically significant at the .05 level; ** Statistically significant at the .01 level.
Results reflect the creative nature of the Thought Focus Dimension. Others describe individuals with high scores
as imaginative and inventive, and those with low scores as uncreative and unintellectual.
Social Focus. Table 5.11 provides selected correlations for the Social Focus Dimension.
Table 5.11 Adjective Checklist Correlates for Constituent Scales of the Social Focus Dimension
HPI Sociability MVPI Ailiation
Extraverted .30** Extraverted .45**
Outgoing/Sociable .28** Outgoing/Sociable .45**
Energetic .27** Energetic .26**
Withdrawn -.17* Withdrawn -.29**
Quiet -.20** Is reserved -.31**
Is reserved -.24** Shy -.33**
Shy -.26** Quiet -.35**
Note: * Statistically significant at the .05 level; ** Statistically significant at the .01 level.
23
Page 24

Leader Focus | Technical Manual
Results reflect the gregarious nature of the Social Focus Dimension. Others describe individuals with high scores
as socially outgoing and easygoing, and those with low scores as shy, quiet, and more likely to withdraw from
social interaction.
Data Focus. Table 5.12 provides selected correlations for the Data Focus Dimension.
Table 5.12 Adjective Checklist Correlates for Constituent Scales of the Data Focus Dimension
HPI Learning Approach MVPI Science
Intellectual .41** Complex .25**
Complex .35** Systematic .16*
Deep .27** Intellectual .16*
Systematic .17*
Has a forgiving nature -.19* Unintellectual -.22**
Unintellectual -.26** Has a forgiving nature -.22**
Note: * Statistically significant at the .05 level; ** Statistically significant at the .01 level.
Results reflect the analytical nature of the Data Focus Dimension. Others describe individuals with high scores as
intellectual, deep, and systematic, and those with low scores as unintellectual and more forgiving of others.
24
Page 25
Leader Focus | Technical Manual
Appendix A: Sample Hogan Leader Focus Report
Leader
Focus
Viewing Leadership Through the Right Lens
Report for: Sam Poole
ID: HE764696
Date: 9.14.2017
© 2017 Hogan Assessment Systems Inc.
25
Page 26
Leader Focus | Technical Manual
Leader Focus
Introduction
Who you are determines how you lead. As a leader, you will influence others in their jobs – your actions will impact the
morale, well-being, and productivity of your team. You need to encourage followership, persuade people to work toward
common goals, and motivate them to work hard. All leaders have a distinct set of qualities that define how they relate to
others, process information, perform tasks, set priorities, and lead teams. These qualities influence your ability to get along
with others and have a successful career as a leader.
Leadership is complex. This report concerns six behavior patterns that influence leadership effectiveness. They affect
what you focus on, how you are seen by others, and how you manage yourself, your career, and your relationships. This
report provides information about your reputation and personal brand, and can provide powerful self-insight.
Your leadership context. Regardless of your current or aspirational role, you are constantly making leadership
impressions on those around you. This report is designed for individuals in traditional people leadership roles, but is also
applicable to those who want to understand the ways in which they influence others or work in a broad range of leadership
contexts – leading a product, project, process, initiative, technical team or just informally leading in everyday life.
Regardless of the specific leadership context, the six dimensions described in your report concern universal leadership
dimensions that will help you better understand your natural leadership style, sharpen your influence strategies, and
improve your overall effectiveness.
Understanding your results. There are a few important things to keep in mind when reading your report:
• Resist the temptation to evaluate high scores as "good" and low scores as "bad". High scores do not necessarily indicate
greater leadership competence, nor do low scores necessarily indicate leadership deficiency. Interpretation is context-
specific; it is critical to consider your unique leadership context and role demands when interpreting your scores.
• All profiles will indicate some specific areas of strength as well as some potential development needs. It is important to
examine your profile holistically and consider how your individual scores interact with each other and the context. You
can use this report to help you understand how to best leverage your strengths as well as how you may need to adapt
your approach to meet situational demands.
• Higher scores indicate greater focus on that style dimension, whereas lower scores indicate less focus on that style
dimension. For example, a person may score high on "Results Leader" but low on the "People Leader" dimension,
indicating a relentless focus on winning, while possibly competing with or overwhelming others on their team. There are
contexts in which this focus may contribute to success and others in which it could detract from success. Becoming more
aware of your areas of focus can help you identify situations or contexts in which you may need to flex your style to
achieve greater results.
Sam Poole
| HE764696 | 9.14.2017
2
26
Page 27
Leader Focus | Technical Manual
Leader Focus
Reading Your Report
This report is organized in terms of six broad patterns of leadership behavior.
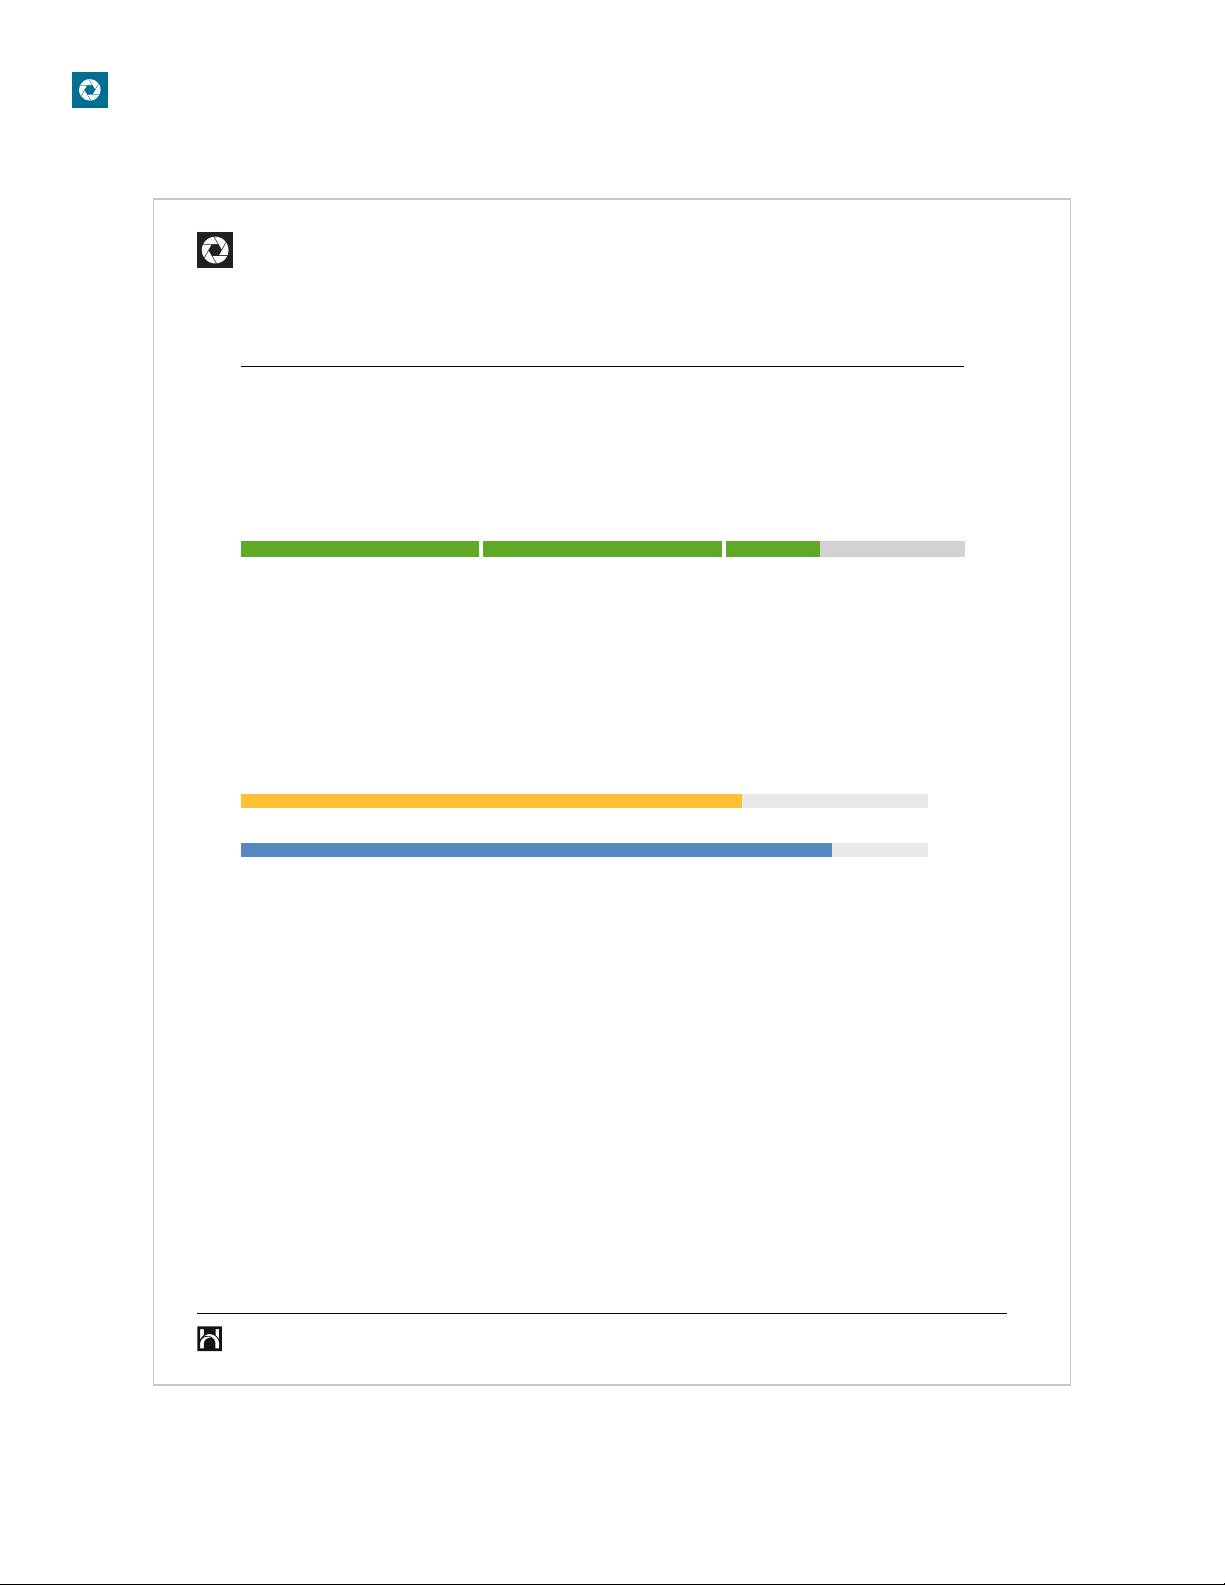
Main Score. You will receive feedback on a score for these six leadership themes. Higher scores indicate greater relevance,
whereas lower scores indicate less focus in that area. Your highest and lowest scores indicate which aspects of your
leadership style tend to be most salient, impactful, and readily noticed by others.
Example
LOW
Sub-Dimensions. Each focus dimension contains two components: (1) A behavioral attribute and (2) a personal value. The
yellow bar indicates the likelihood that you will exhibit that behavioral attribute. The blue bar indicates the degree to which
you value that behavior. For example, people may act like extraverts, and seem talkative, gregarious, and socially active.
However, they may value their quiet time and create a leadership culture that emphasizes independence and self-
sufficiency.
.
HIGH
Example
Ambition
.
Power
.
Development Tips. These are developmental considerations that apply, whether your scores are high or low on each focus
dimension. These tips should be useful in guiding your personal development efforts.
Personal Biases. Leaders' values powerfully influence their behavior and the kind of culture they are likely to create within
their teams and work groups. This section concerns raising awareness of a person's unconscious biases as a leader.
73
86
Sam Poole
| HE764696 | 9.14.2017
3
27
Page 28
Leader Focus | Technical Manual
Leader Focus
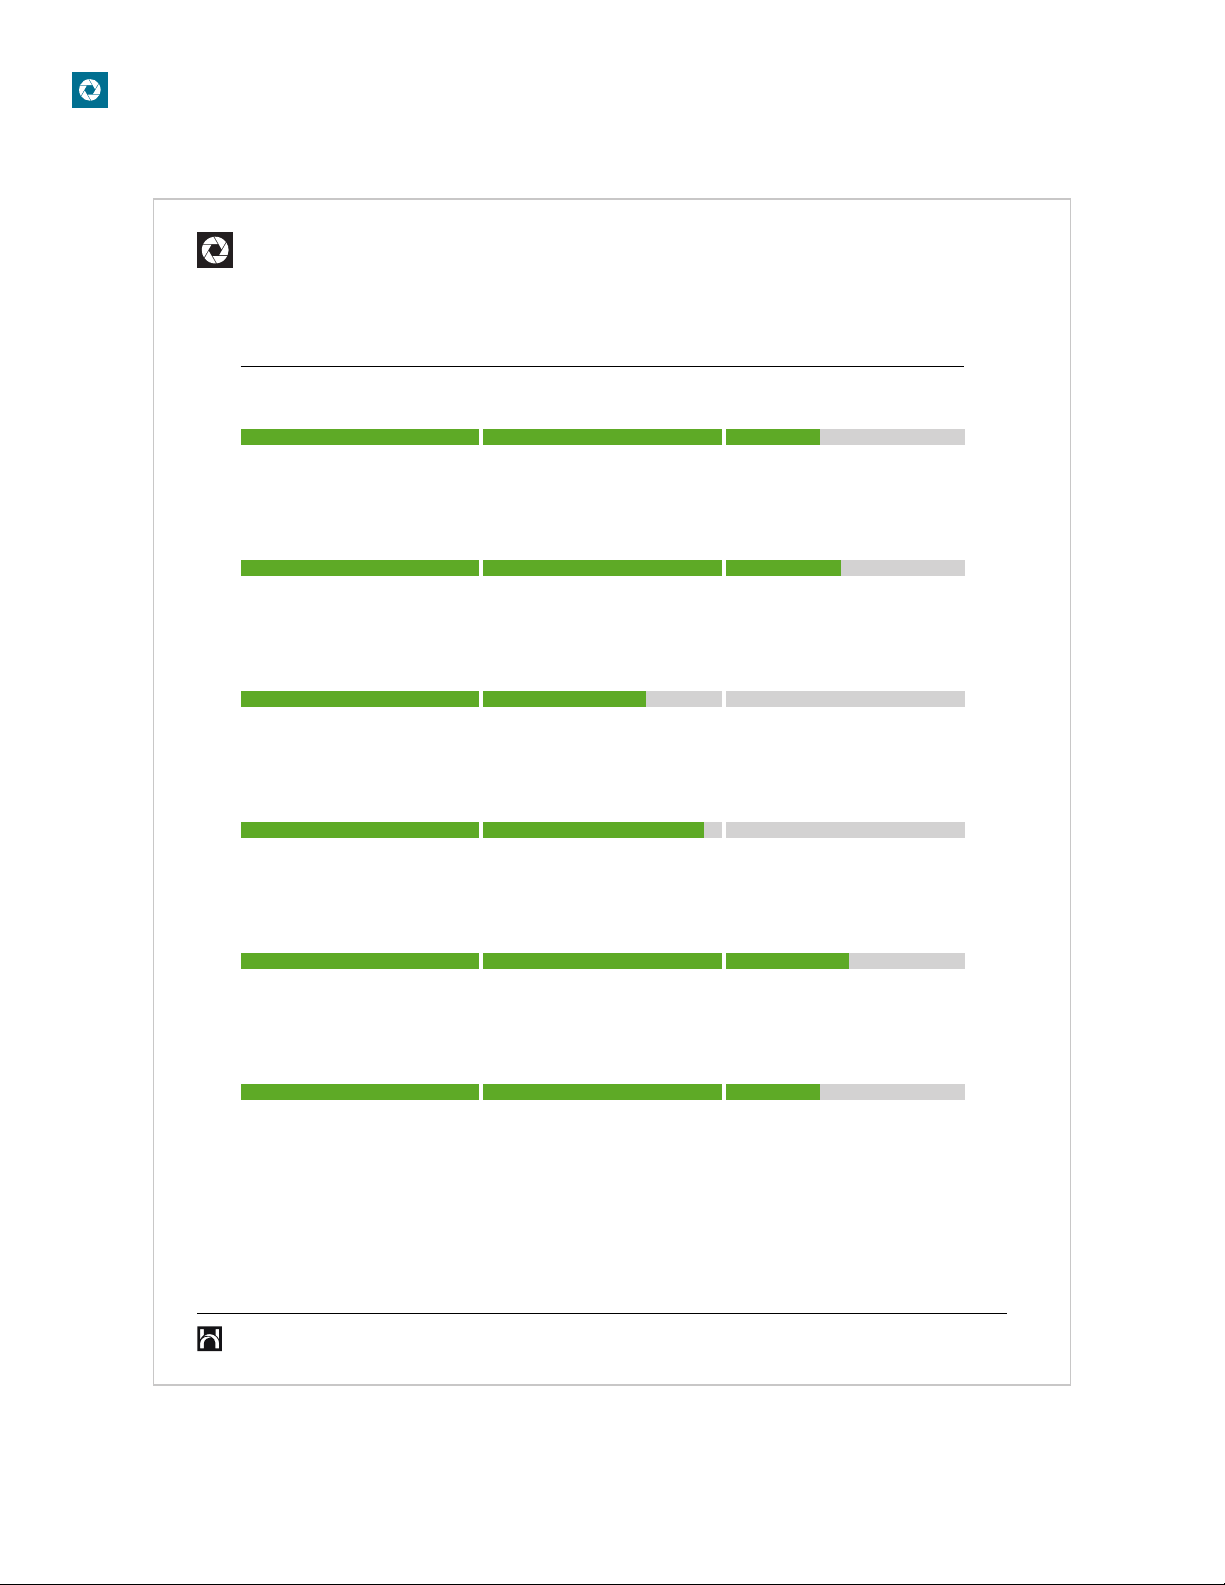
Executive Summary
Results Leader
Focus on:
Cooperation, collaboration Competition, goal attainment
.
Focus on:
People Leader
Focus on:
Transparency, task completion Relationships, morale
.
Focus on:
Process Leader
Focus on:
Flexibility, autonomy Planning, risk-management
.
Focus on:
Thought Leader
Focus on:
Pragmatics, idea implementation Innovation, idea generation
.
Focus on:
Social Leader
Focus on:
Autonomy, efficiency Communication, networking
.
Focus on:
Data Leader
Focus on:
Experience, intuition Facts, research
Sam Poole
| HE764696 | 9.14.2017
.
Focus on:
28
4
Page 29
Leader Focus | Technical Manual
Leader Focus
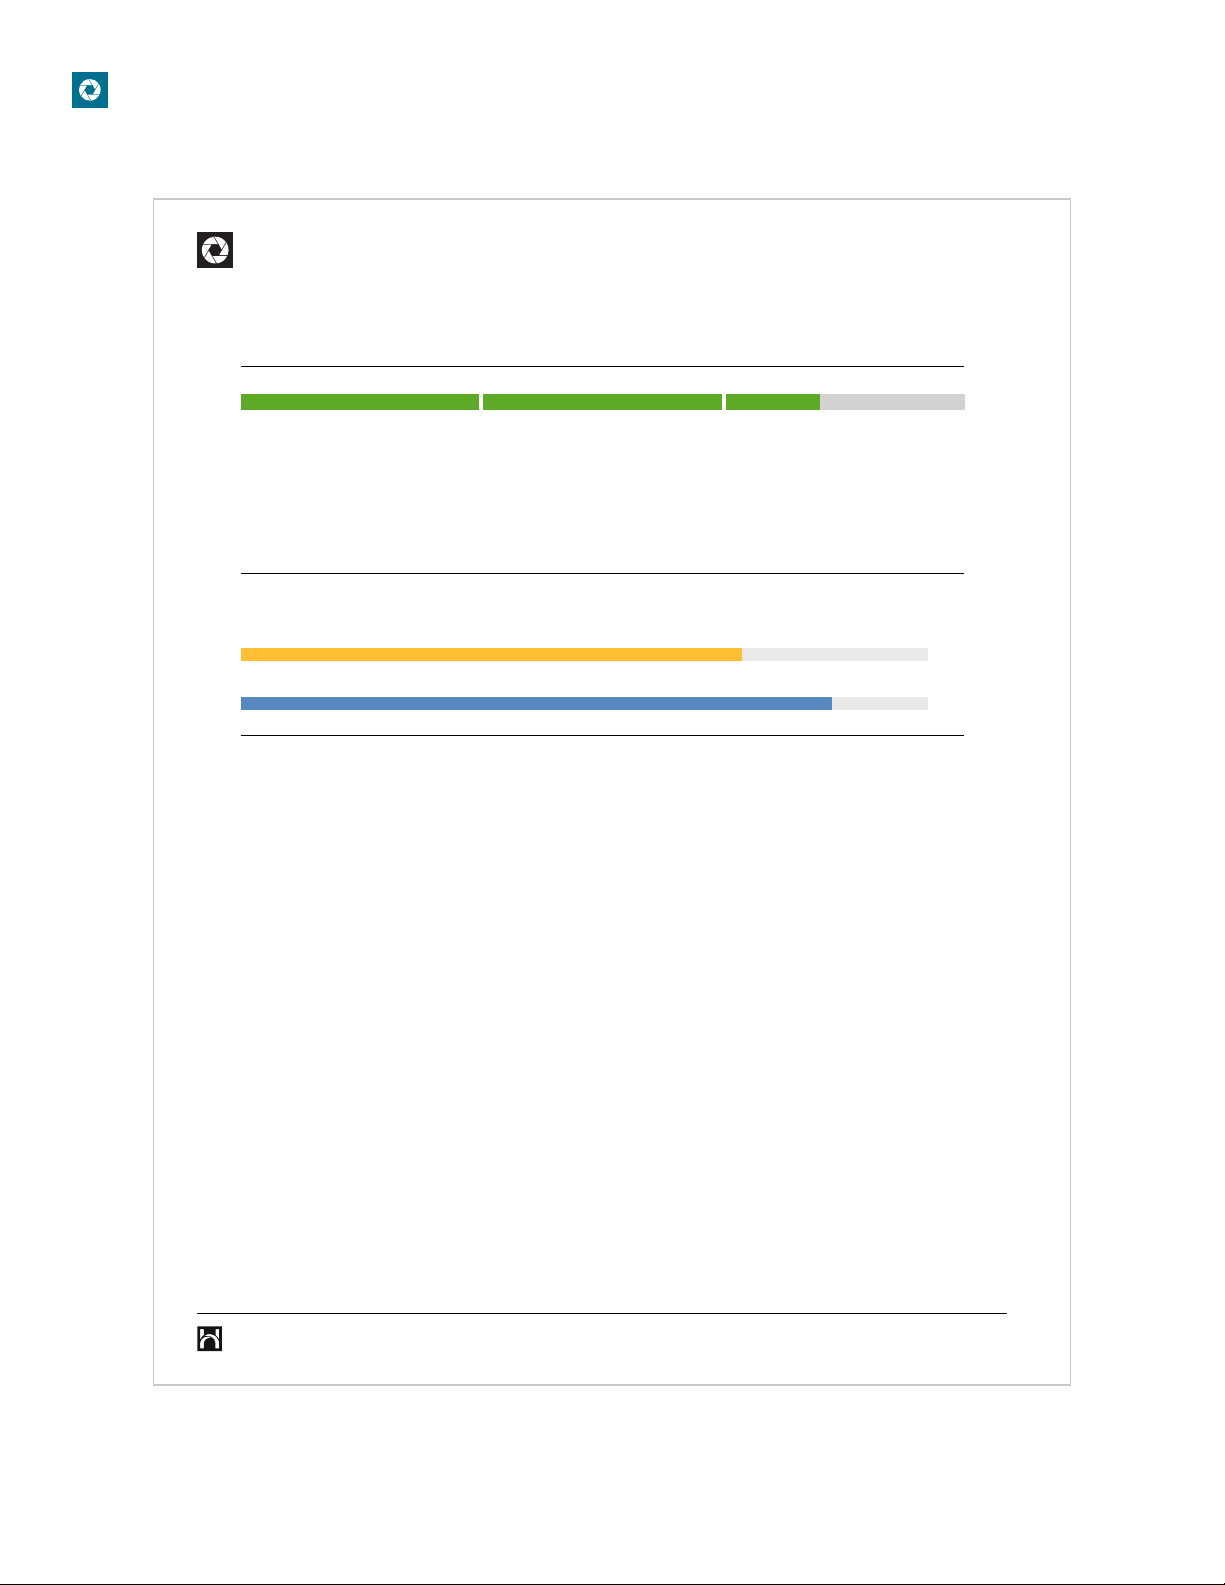
Results Leader
LOW
You are likely seen as a person who drives results in your organization. Although others will appreciate your goal focus and
willingness to take charge, you may also intimidate some people. Your strong focus on competition, status and
achievement may result in a tendency to prioritize results and personal advancement over cooperation and team effort.
When working toward important goals, you will likely bounce back easily from setbacks and seem confident in your ability
to succeed, but may not demonstrate a strong sense of urgency.
.
HIGH
Qualities
Ambition
.
Power
.
Development Tips
• Your drive to succeed may intimidate new or more junior staff members. Please remember that not everyone shares your
drive for results; some may prefer lower profile roles.
• You have the energy and confidence needed to make things happen. However, be sure realistically to evaluate what your
team can get done and avoid overcommitting your own and your team's resources.
• You tend to have high expectations for yourself and others; be sure to clearly communicate these expectations so your
staff will understand their gaps, and can chart a clear path to success.
Unconscious Biases
• Don't let your desire to get things done interfere with your ability to create organizational value. Remember not to
compete with your peers, team members, or other business units.
• It is important to focus on both intangible results and hard metrics to maximize your team's contributions to the
organization. Be willing to take on projects with long-term potential, even if they do not immediately affect the bottom-
line.
• Your drive for results will likely shape your management style and the behaviors you reward and punish. Understand
that others can contribute in their own way, even if they seem to lack your drive to win.
73
86
Sam Poole
| HE764696 | 9.14.2017
5
29
Page 30
Leader Focus | Technical Manual
Leader Focus
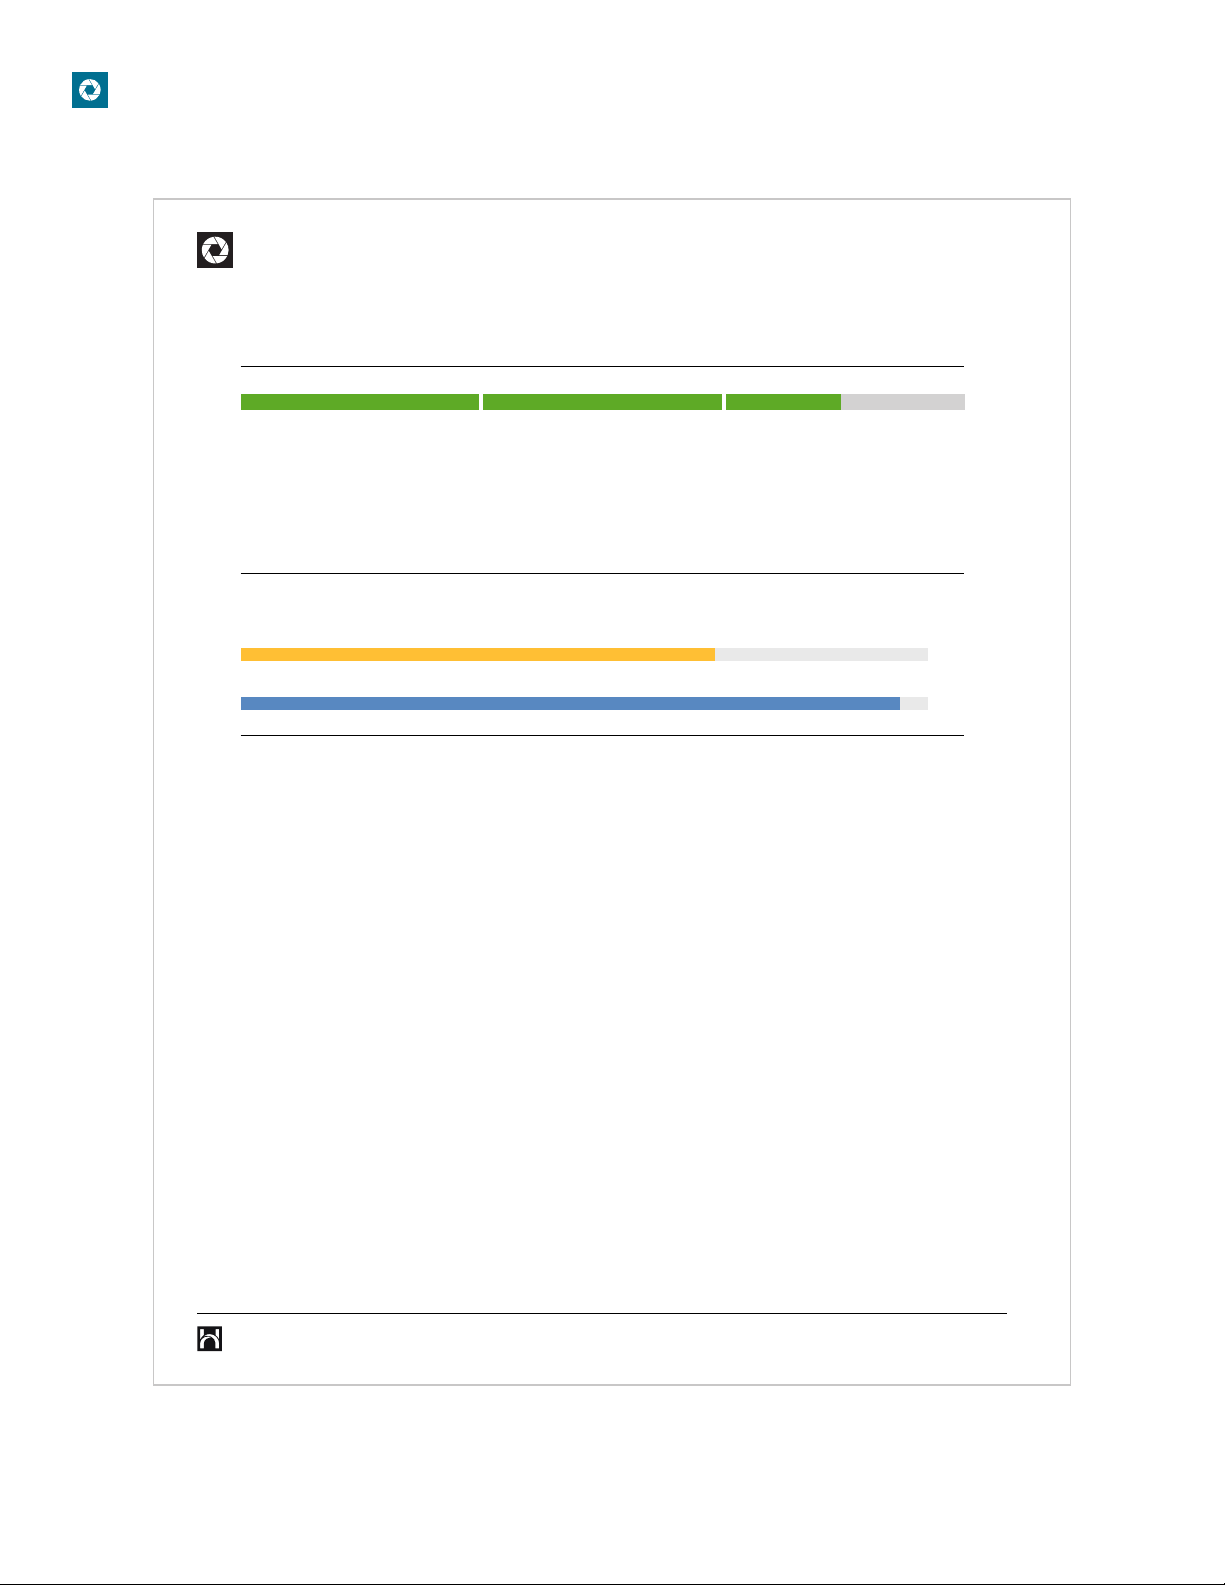
People Leader
LOW
You are likely seen as having strong people skills. Although others will appreciate your warm communication style, you may
struggle to hold people accountable and deliver tough messages. Your strong interest in helping others, giving back, and
supporting your team may result in a tendency to prioritize team harmony and cohesion over personal responsibility for
results. When dealing with sensitive people problems, you tend not to overreact and typically seem mature and
emotionally in control. However, you may also tend to dismiss critical feedback from others.
.
HIGH
Qualities
Interpersonal Sensitivity
.
Altruistic
.
Development Tips
• You seem willing to gather input from others before making decisions, but remember that management by consensus is
not always appropriate. Learn when to consult your team and when to take independent action.
• You may find it difficult to give your staff negative feedback, but providing timely feedback will produce better results,
while withholding feedback may cause inefficiencies and can create perceptions of favoritism.
• Although conflict is uncomfortable, avoiding confrontations may undermine your effectiveness as a leader. You can
maintain friendly relations with your staff, but also be prepared to confront the difficult issues.
Unconscious Biases
• You seem to care about the welfare of your staff and probably find opportunities to develop your team. Remember that
you may need to draw lines with direct reports who do not respond to coaching or development.
• One of your strengths as a leader is your concern for staff growth and well-being. Try to seek out development activities
that will allow your direct reports to grow, but also be ready to hold them accountable for their performance.
• Keep in mind that others may try to take advantage of your considerate management style. Realize when it is time to
take corrective action with team members who consistently fail to meet expectations.
69
96
Sam Poole
| HE764696 | 9.14.2017
6
30
Page 31
Leader Focus | Technical Manual
Leader Focus
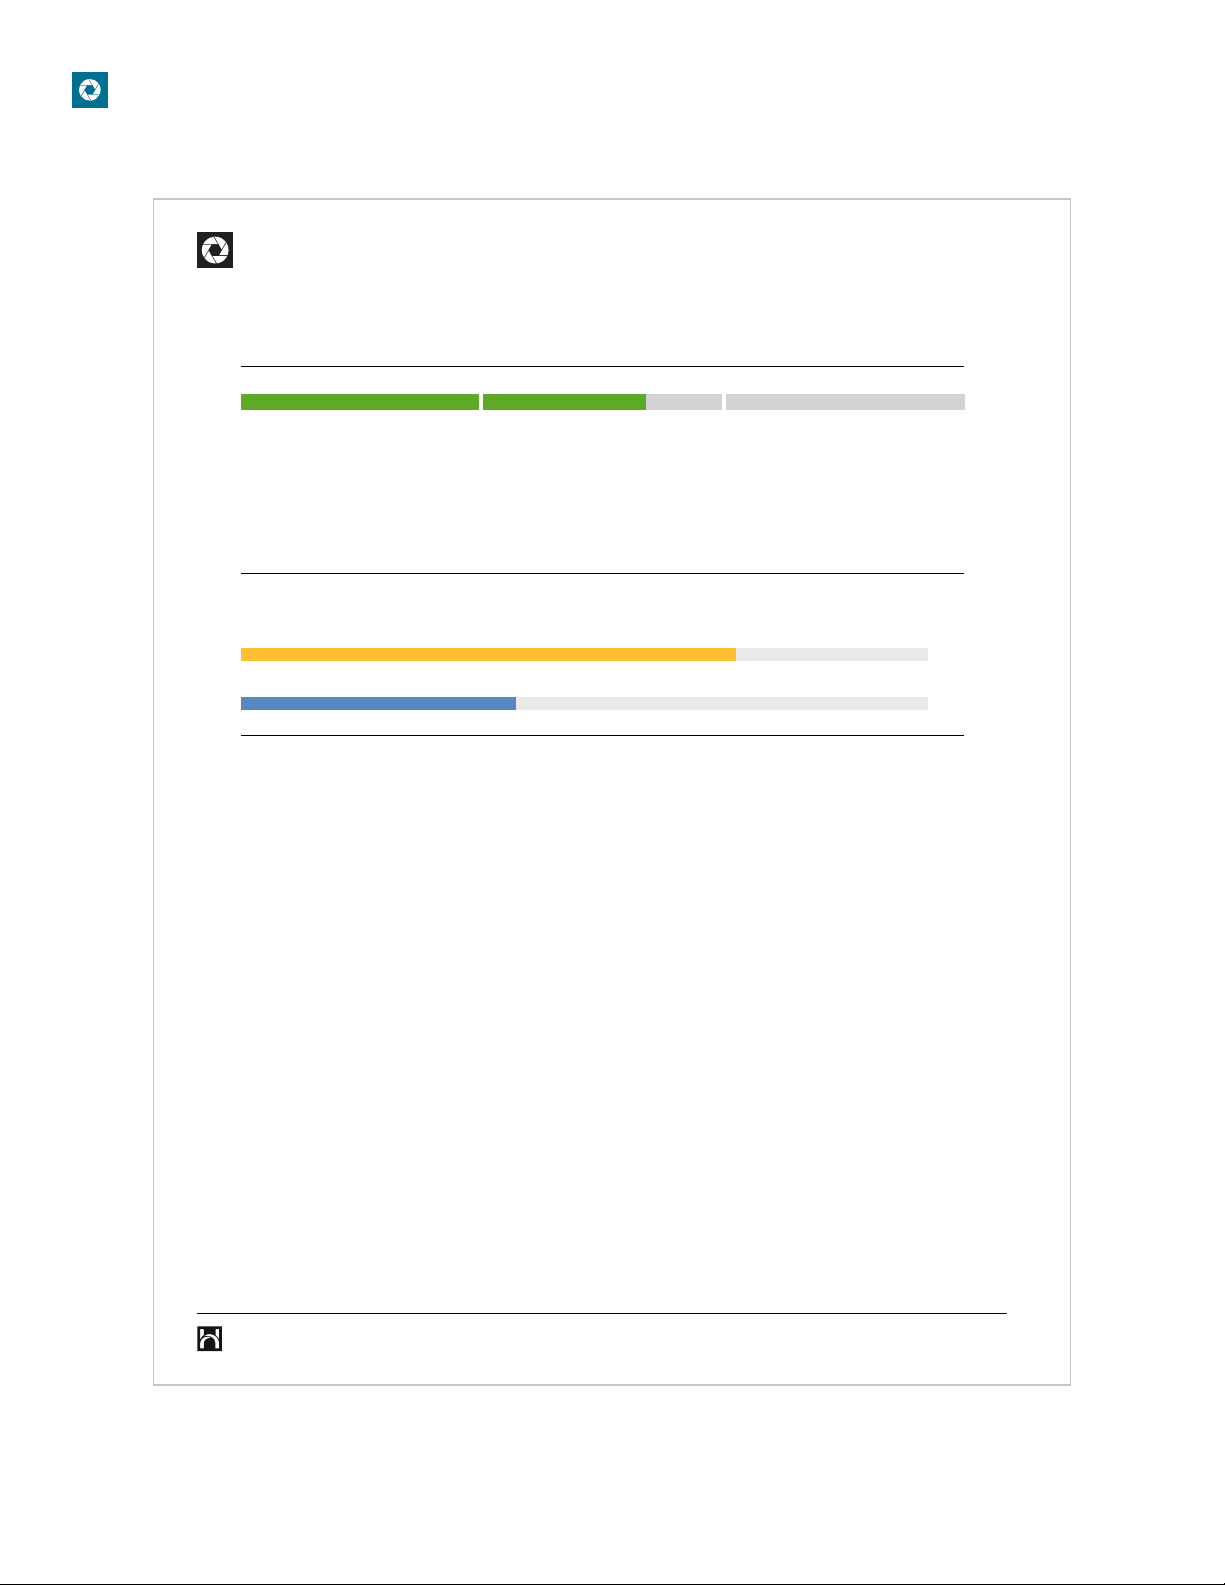
Process Leader
LOW
Others likely perceive you as organized, compliant, and disciplined about process. Although people will appreciate your
operational skills, you may also seem inflexible and overly focused on details. You probably focus on both sides of the risk -
reward equation when making important decisions, suggesting a balanced tendency around smart risk-taking. When
working on important tasks or projects, you should seem calm under pressure and maintain a positive attitude when
problems arise, but may minimize your mistakes.
.
HIGH
Qualities
Prudence
.
Security
.
Development Tips
• Your strengths include being thorough and attentive to detail. These important strengths can become a problem,
however, if you micromanage your staff. Be sure you empower them to do their jobs.
• Plans almost always change, and change is part of organizational life. As a leader, you must be ready to manage change.
Identify someone in your organization who seems comfortable with change and learn from him/her.
• You will rarely have enough information to make the best possible decision. Effective management is about making the
best decisions with the information you have. Make a list of what you need to know and then act.
Unconscious Biases
• Although you are likely to create structure for your team, you also allow some flexibility within these parameters. This
leadership style will work with a wide variety of people, but remember that some team members will need more, and
some need less structure than others.
• You tend to be calculated risk-taker and likely to encourage your team to do the same. As a leader, you might
periodically step out of your comfort zone to take strategic, more aggressive risks. You can serve as an example to your
team in this are.
• You tend to examine both sides of the risk-reward equation when making decisions. Although this promotes effective
decision-making, be sure you pay attention to context to determine when to pursue potentially risky opportunities.
72
40
Sam Poole
| HE764696 | 9.14.2017
7
31
Page 32
Leader Focus | Technical Manual
Leader Focus
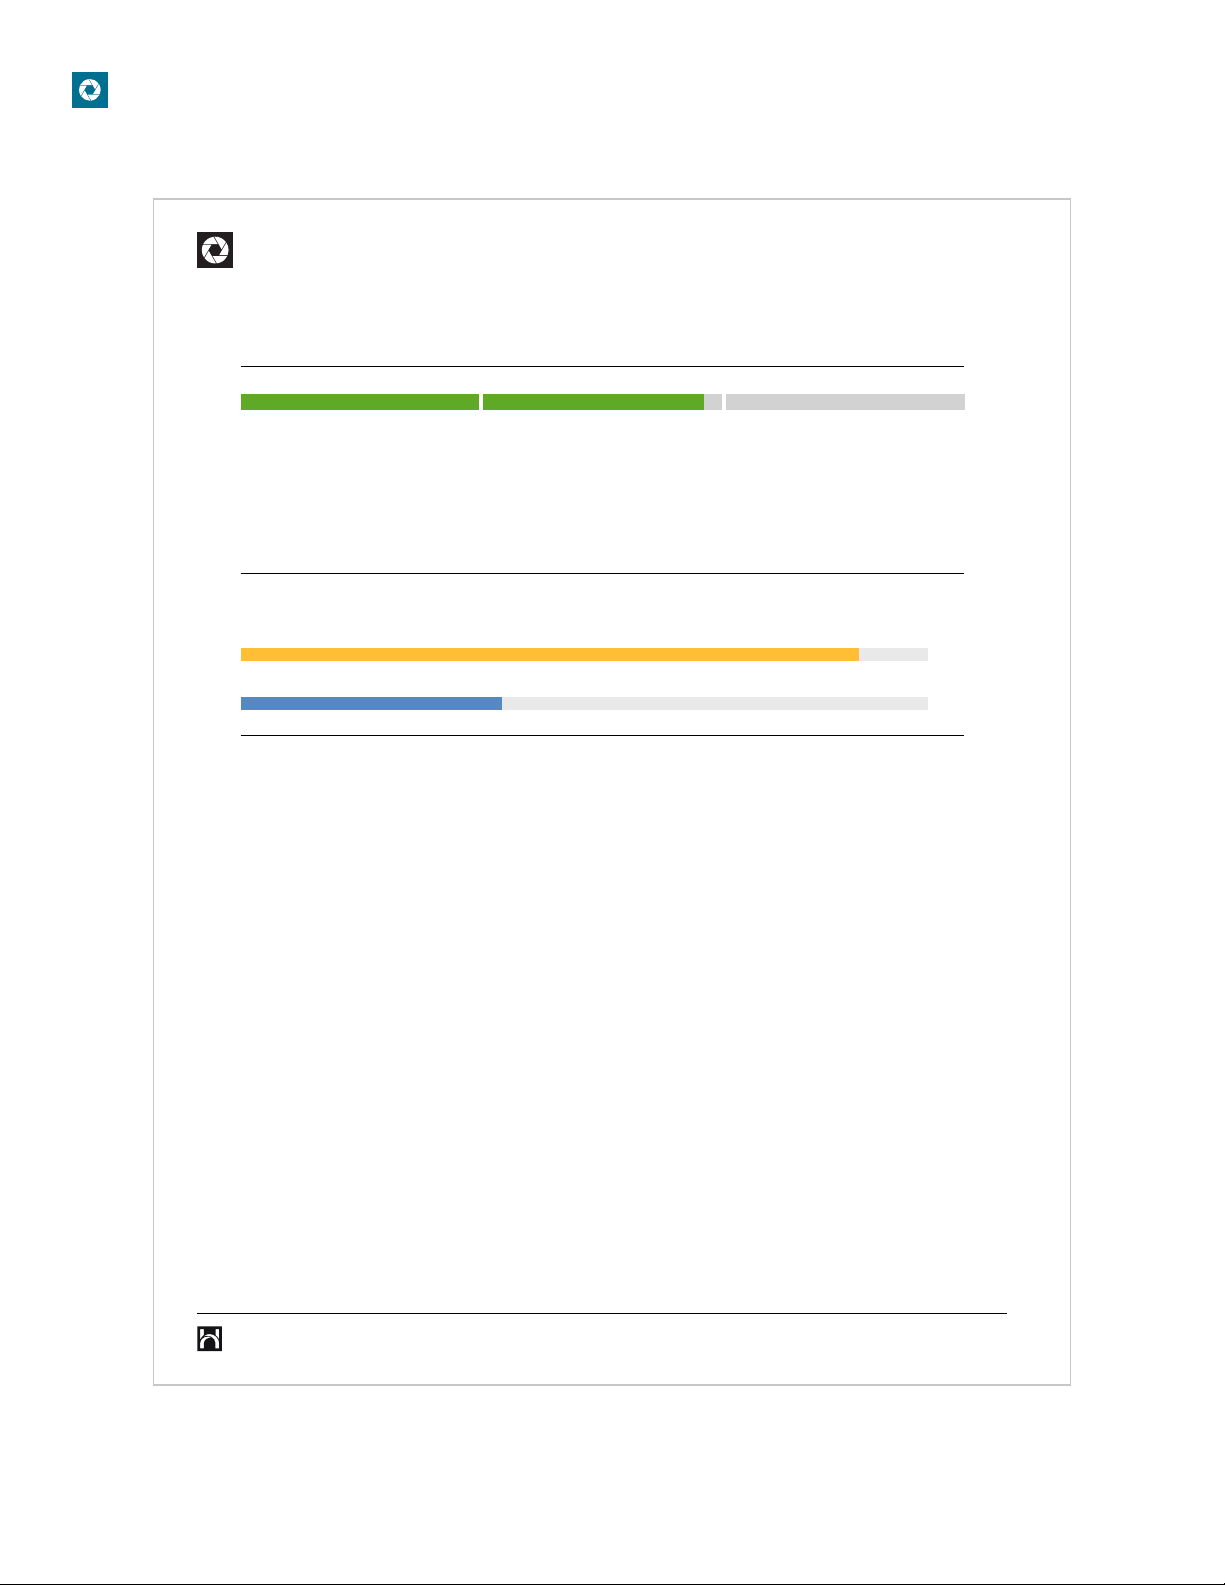
Thought Leader
LOW
People in your organization likely view you as a pragmatist. Although others will appreciate your originality, you may seem
to become easily bored with the details of implementation. You seem able to balance the competing demands of style
versus functionality, to be willing to listen to creative input from others, and to appreciate the importance of branding
issues as they serve business goals. When evaluating new ideas, you typically assume that things will go well, and tend to
minimize the risks and the possibilities of failure.
.
HIGH
Qualities
Inquisitive
.
Aesthetics
.
Development Tips
• Innovation is an essential component of successful leadership. However, not every task needs a novel solution. When
solving problems, try to determine whether an acceptable solution already exists.
• You seem to enjoy thinking more about strategic, long-range issues and find tactical problems a bit boring. Make
considering the short term effects of decisions a consistent part of your problem-solving process.
• Make sure you have a sound rationale for your ideas and present it carefully. You need to sell your ideas to others to
ensure their commitment and support. Ask colleagues for feedback on how well you are communicating your vision with
others.
Unconscious Biases
• In a debate regarding form versus function, you seem to balance these two considerations. Try to identify team members
who are skilled in each area and encourage them to work together to bring the best of both worlds to important projects.
• You seem to balance the competing demands of style and functionality when it comes to work products. Be sure to
gather input from others when making critical design choices that impact user experience to find the highest-quality
solution.
• You probably pay attention to your organization's branding, marketing, and advertising strategies. Leverage this interest
by supporting the company's efforts to manage brand consistency and presence in your market.
90
38
Sam Poole
| HE764696 | 9.14.2017
8
32
Page 33
Leader Focus | Technical Manual
Leader Focus
Social Leader
LOW
Others probably see you as an active and vigorous communicator. Although your proactive communication style will serve
you well, you may sometimes seem to confuse activity with productivity, and you may not always listen well. You seem to
enjoy frequent and varied opportunities to connect with others. Although your networking skills will serve you well, you
may rely too heavily on group decision-making. When building new networks, you will seem appropriately self-confident,
but perhaps too trusting about others' intentions.
.
HIGH
Qualities
Sociability
.
Affiliation
.
Development Tips
• You seem to enjoy interacting and working with others. Be sure to practice active listening and to set aside time for your
own work. Effective leaders move back and forth easily.
• Be aware that your high energy and strong social presence may overwhelm peers and subordinates. Be sure to give
others a chance to speak, solicit their opinions, and practice active listening skills by remaining quiet while you wait for
others to contribute.
• You probably communicate with many people across your organization, and this is a hallmark of successful leaders. Be
sure to leverage your many relationships to help your team get things done.
Unconscious Biases
• Because you value collaboration and group decision-making, you may sometimes rely on it too much. Remember that
some decisions should only be made by you alone, whereas other issues are best decided in a group.
• You value on an open-door policy. Your staff will appreciate you being accessible and willing to discuss how the team is
working together - but be sure you know when it's time to close the door.
• Because you enjoy social interaction, you may sometimes confuse activity with productivity. Try to identify the activities
that contribute to productivity and those that detract from it.
74
94
Sam Poole
| HE764696 | 9.14.2017
9
33
Page 34

Leader Focus | Technical Manual
Leader Focus
Data Leader
LOW
Others will observe that you enjoy learning thoroughly, stay up-to-date on industry trends, and have well-informed
opinions. People will likely see you as bright and well-informed, but possibly pedantic at times. When evaluating past
experiences, you seem to prefer to make decisions using rational, analytical, data-based methods. Although this is likely to
result in high-quality decisions, others may become impatient with your careful analytical style. You seem to be a person
who makes confident decisions, who tends not to worry about past mistakes, and may miss opportunities to learn from
them.
.
HIGH
Qualities
Learning Approach
.
Science
.
Development Tips
• Your interest in staying informed and up-to-date with business trends will enhance your effectiveness. However, avoid
seeming to have all of the answers, and allow your staff to solve problems on their own when appropriate.
• As a leader, you seem likely to build a rich learning environment for your team. Try to add variety in the learning
opportunities you offer. For example, hold information sessions, after action reviews following important projects, or
regular discussions of an important topic in your business unit.
• You seem likely to encourage frequent staff development opportunities, remember that people learn differently. Try to
allow for hands-on training opportunities in addition to more traditional, classroom-style learning activities.
Unconscious Biases
• Because you are curious and analytical, you may have trouble making rapid decisions by insisting that you need more
data or better analytical methods. Learn to appreciate when you have enough information to make a decision.
• Although you may enjoy problem solving analyses, not all people enjoy data analysis. Try to appreciate other methods of
problem-solving and remember that people with differing styles can contribute as well.
• You will be most satisfied working in organizations that value using the latest thinking, technology, and analytical
strategies to do their work. Understand that intuitive and experience based approaches offer real value at times.
73
86
Sam Poole
| HE764696 | 9.14.2017
10
34
Page 35

Leader Focus | Technical Manual
Appendix B: Complete Correlations Matrices For Leader
Focus Dimensions
Table B.1 Correlations with International Personality Item Pool (IPIP) Scales
Scale Results People Process Thought Social Data
Agreeableness .16** .63** .37** .14* .19** .18**
Conscientiousness .39** .39** .38** .03 .15* .35**
Extraversion .61** .52** -.01 .20** .65** .26**
Neuroticism -.45** -.42** -.08 -.14* -.32** -.26**
Openness .29** .37** -.08 .62** .31** .37**
Note: N = 298; * Correlation is significant at the .05 level; ** Correlation is significant at the .01 level.
Table B.2 Correlations with HEXACO Honesty-Humility Scale & Subscales
Scale Results People Process Thought Social Data
Honesty-Humility -.06 .33** .35** .05 -.11 .08
Fairness .12* .37** .32** .10 .03 .08
Greed -.15** .21** .20** .08 -.17** .10
Modesty -.18** .24** .28** -.05 -.12* .07
Sincerity -.01 .15* .24** -.01 -.08 -.03
Note: N = 285; * Correlation is significant at the .05 level; ** Correlation is significant at the .01 level.
Table B.3 Correlations with Hogan Development Survey (HDS) Scales
Scale Results People Process Thought Social Data
Excitable -.24** -.55** -.25** -.09 -.27** -.14**
Skeptical -.05 -.44** -.20** -.16** -.17** -.07
Cautious -.60** -.29** .09 -.18** -.44** -.24**
Reserved -.30** -.60** -.14** -.15** -.57** -.14**
Leisurely -.07 -.30** -.15** .00 -.14** -.08
Bold .65** .17** -.09 .24** .45** .26**
Mischievous .43** .05 -.58** .36** .46** .12*
Colorful .49** .18** -.30** .34** .59** .21**
Imaginative .42** .18** -.31** .52** .37** .21**
Diligent .22** .14** .37** -.01 .02 .18**
Dutiful -.21** .16** .35** -.12* .00 -.06
Note: N = 382; * Correlation is significant at the .05 level; ** Correlation is significant at the .01 level.
35
Page 36

Leader Focus | Technical Manual
Table B.4 Correlations with MACH-IV Scale & Subscales
Scale Results People Process Thought Social Data
Total Score -.15* -.51** -.31** -.12* -.18** -.17**
Tactics -.13* -.43** -.29** -.08 -.08 -.12*
Views -.14* -.46** -.25** -.15** -.24** -.22**
Morals -.01 -.17** -.16** .08 -.03 .11
Note: N = 284; * Correlation is significant at the .05 level; ** Correlation is significant at the .01 level
Table B.5 Correlations with Narcissistic Personality Inventory (NPI) Scale & Subscales
Scale Results People Process Thought Social Data
Total Score .61** .02 -.31** .18** .49** .14*
Authority .71** .13* -.20** .20** .45** .20**
Self-Suiciency .50** .09 -.08 .09 .28** .14*
Superiority .41** .02 -.27** .19** .40** .13*
Exhibitionism .31** -.03 -.33** .10 .40** .01
Exploitativeness .42** -.01 -.27** .20** .36** .12*
Vanity .27** .01 -.19** -.01 .30** .05
Entitlement .34** -.21** -.30** .08 .28** -.01
Note: N = 285; * Correlation is significant at the .05 level; ** Correlation is significant at the .01 level.
Table B.6 Correlations with Personality Inventory for DSM-5 (PID-5) Scales
Scale Results People Process Thought Social Data
Anhedonia
Anxiousness
Depressivity
Emotional Lability -.24** -.26** -.18** .03 -.11 -.12*
Hostility
Perseveration
Rigid Perfectionism -.01 -.19** .05 -.03 -.12* .03
Separation Insecurity -.21** -.16** -.04 -.01 -.05 -.06
Submissiveness
Suspiciousness
Withdrawal
Attention Seeking .25** -.05 -.31** .15* .38** .09
Callousness
Deceitfulness
Grandiosity
Manipulativeness
Intimacy Avoidance -.26** -.31** -.17** -.03 -.20** -.21**
Restricted Aectivity -.07 -.29** -.17** -.07 -.17** .03
-.41** -.42** -.11 -.10 -.33** -.21**
-.37** -.27** -.01 -.08 -.25** -.17**
-.33** -.34** -.12* -.04 -.21** -.16**
-.12* -.45** -.32** -.08 -.10 -.15*
-.21** -.31** -.24** .00 -.13* -.14*
-.28** -.12* .08 -.06 -.12* -.02
-.16** -.38** -.20** -.12* -.17** -.18**
-.42** -.51** -.12* -.09 -.48** -.20**
-.07 -.48** -.37** -.06 -.06 -.17**
-.05 -.31** -.35** .03 .07 -.06
.26** -.13* -.20** .12* .19** .06
.25** -.08 -.29** .14* .28** .11
36
Page 37

Leader Focus | Technical Manual
Table B.6 Correlations with Personality Inventory for DSM-5 (PID-5) Scales Continued
Scale Results People Process Thought Social Data
Distractibility
Eccentricity
Perceptual Dysregulation -.15** -.26** -.31** .08 -.04 -.13*
Risk Taking
Unusual Beliefs and Experiences -.03 -.19** -.34** .15* .03 -.07
Impulsivity -.05 -.26** -.51** .00 .08 -.19**
Irresponsibility
Note: N = 297; * Correlation is significant at the .05 level; ** Correlation is significant at the .01 level.
Table B.7 Correlations with Verbal and Numerical Scales from the Hogan Judgment Report
Scale Results People Process Thought Social Data
Verbal -.00 .05 -.01 .12
Numerical .03 -.02 -.14
-.31** -.33** -.29** -.03 -.14* -.27**
-.15** -.31** -.37** .14* -.08 -.08
.37** -.05 -.60** .21** .36** .07
-.14* -.30** -.34** .02 -.02 -.15**
*
*
.11 .08 .29
.11 .27
**
**
Note: N = 296; * Correlation is significant at the .05 level; ** Correlation is significant at the .01 level.
Table B.8 Correlations with Hogan Business Reasoning Inventory (HBRI) Scales & Subscales
Scale Results People Process Thought Social Data
Overall -.05 .00 -.03 .07 -.05 .34
Tactical -.03 .10 .02 .07 -.05 .30
Strategic -.06 -.08 -.06 .04 -.04 .28
Note: N = 297; ** Correlation is significant at the .01 level.
Table B.9 Correlations with Relationship Questionnaire Scales & Subscales
Scale Results People Process Thought Social Data
Secure .27** .37** .12* .16** .33** .19**
Fearful-Avoidant -.32** -.32** -.15** -.06 -.29** -.16**
Anxious-Preoccupied -.16** -.22** -.12* .00 -.03 -.12*
Dismissive-Avoidant .04 -.12* -.12* .01 -.11 -.03
Note: N = 297; * Correlation is significant at the .05 level; ** Correlation is significant at the .01 level.
**
**
**
37
Page 38

Leader Focus | Technical Manual
References
American Psychiatric Association. (2013). The Personality Inventory for DSM-5 (PID-5) — Adults. Retrieved from
https://www.psychiatry.org/File%20Library/Psychiatrists/Practice/ DSM/APA_DSM5_The-PersonalityInventory-For-DSM-5-Full-Version-Adult.pdf
Bartholomew, K., & Horowitz, L. M. (1991). Attachment styles among young adults: A test of a four-category
model. Journal of Personality and Social Psychology, 61, 226-244.
Benet-Martinez, V., & John, O. (1998). Los Cinco Grandes across cultures and ethnic groups: Multitrait-
multimethod analyses of the Big Five in Spanish and English. Journal of Personality and Social Psychology, 75,
729-750.
Christie, R., & Geis, F. (1970). Studies in Machiavellianism. San Diego, CA: Academic Press.
Costa, P. T. Jr., & McCrae, R. R. (1992). Revised NEO Personality Inventory (NEO-PI-R) and NEO Five-Factor Inventory
(NEO-FFI): Professional manual. Odessa, FL: Psychological Assessment Resources.
Goldberg, L. R. (1999). A broad-bandwidth, public domain, personality inventory measuring the lower-level
facets of several five-factor models. In I. Mervielde, I. Deary, F. De Fruyt, & F. Ostendorf (Eds.), Personality
psychology in Europe (Vol. 7, pp. 7-28). Tilburg, Netherlands: Tilburg University Press.
Goldberg, L. R. (2008). The Eugene-Springfield Community Sample: Information available from the research
participants. Oregon Research Institute Technical Report Vol. 48, No. 1. Eugene, Oregon: Oregon Research
Institute.
Goldberg, L. R., Johnson, J. A., Eber, H. W., Hogan, R., Ashton, M. C., Cloninger, C. R., & Gough, H. C. (2006).
The International Item Pool and the future of public-domain personality measures. Journal of Research in
Personality, 40, 84-96.
Hogan Assessment Systems. (2014a). Hogan Development Survey Technical Supplement Form 5. Tulsa, OK: Author.
Hogan Assessment Systems. (2014b). Hogan Judgment Assessment technical manual. Tulsa, OK: Author.
Hogan J., & Hogan R. (2010). Motives, Values, Preferences Inventory manual: 2010 administrative and norming
updates. Tulsa, OK: Hogan Press.
Hogan, R., Barrett, P., & Hogan, J. (2009). Brief technical manual: Hogan Business Reasoning Inventory. Tulsa, OK:
Hogan Assessment Systems.
Hogan, R., & Hogan, J. (2007). Hogan Personality Inventory manual (3rd ed.). Tulsa, OK: Hogan Assessment
Systems.
Hogan, R., & Hogan, J. (2009). Hogan Development Survey manual (2nd ed.). Tulsa, OK: Hogan Press.
38
Page 39

Leader Focus | Technical Manual
Hogan, R., Hogan, J., & Roberts, B. W. (1996). Personality measurement and employment decisions: Questions
and answers. American Psychologist, 51, 469-477.
John, O., & Srivastava, S. (1999). The Big Five Trait taxonomy: History, measurement, and theoretical
perspectives. In L. A. Pervin & O. P. John (Eds.), Handbook of personality: Theory and research (2nd ed., pp.
102-138). New York, NY: Guilford Press.
Krueger, R. F., Derringer, J., Markon, K. E., Watson, D., & Skodol, A. E. (2012). Initial construction of a maladaptive
personality trait model and inventory for DSM-5. Psychological Medicine, 42, 1879-1890.
Lee, K. & Ashton, M. C. (2004). Psychometric properties of the HEXACO personality inventory. Multivariate
Behavioral Research, 39, 329-358.
Lee, K., & Ashton, M. C. (2016). Psychometric properties of the HEXACO-100. Assessment, doi:
10.1177/1073191116659134
Mills, C.J., & Hogan R. (1978). A role-theoretical interpretation of personality scale item responses. Journal of
Personality, 46, 788-785
Raskin, R., & Terry, H. (1988). A principal-components analysis of the Narcissistic Personality Inventory and
further evidence of its construct validity. Journal of Personality and Social Psychology, 54, 890-902.
Saucier, G. (1994). Mini-markers: A brief version of Goldberg’s unipolar Big-Five markers. Journal of Personality
Assessment, 63, 506-516
39
 Loading...