

ST4030
Visit us at www.TestEquipmentDepot.com
99 Washington Street
Melrose, MA 02176
Phone 781-665-1400
Toll Free 1-800-517-8431
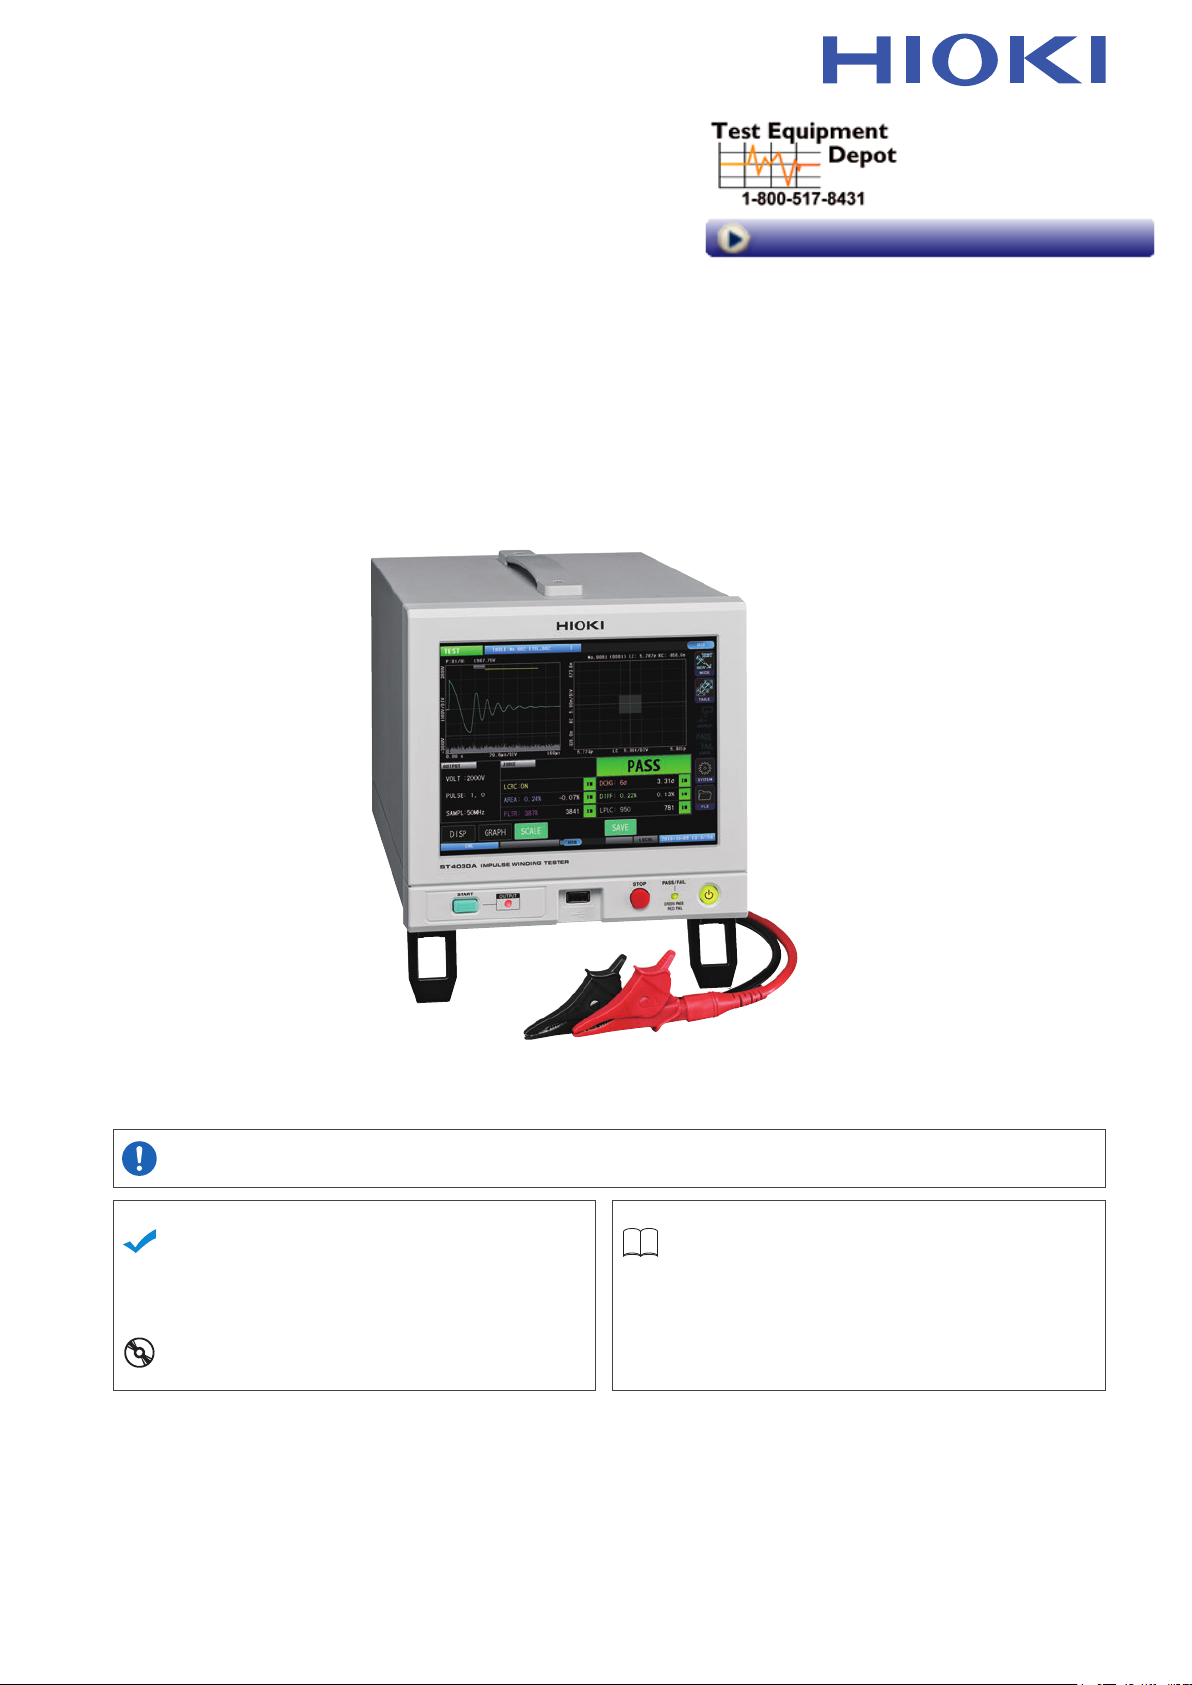
ST4030A
Instruction Manual
IMPULSE WINDING TESTER
Be sure to read this manual before using the instrument.
When using the instrument for the
rst time
Parts Names and Functions
Communication Command
Instruction Manual
Dec. 2019 Revised edition 2
ST4030A961-02 19-12H
p.8 Maintenance and Service
CD Error Display and Solution
Troubleshooting
p.207
p.214
p.5
EN
Measurement Flowchart
The basic measuring ow is as described below.
Preparation
See “2 Preparation for Measurements” (p. 13)
Master workpiece
(known-good winding)
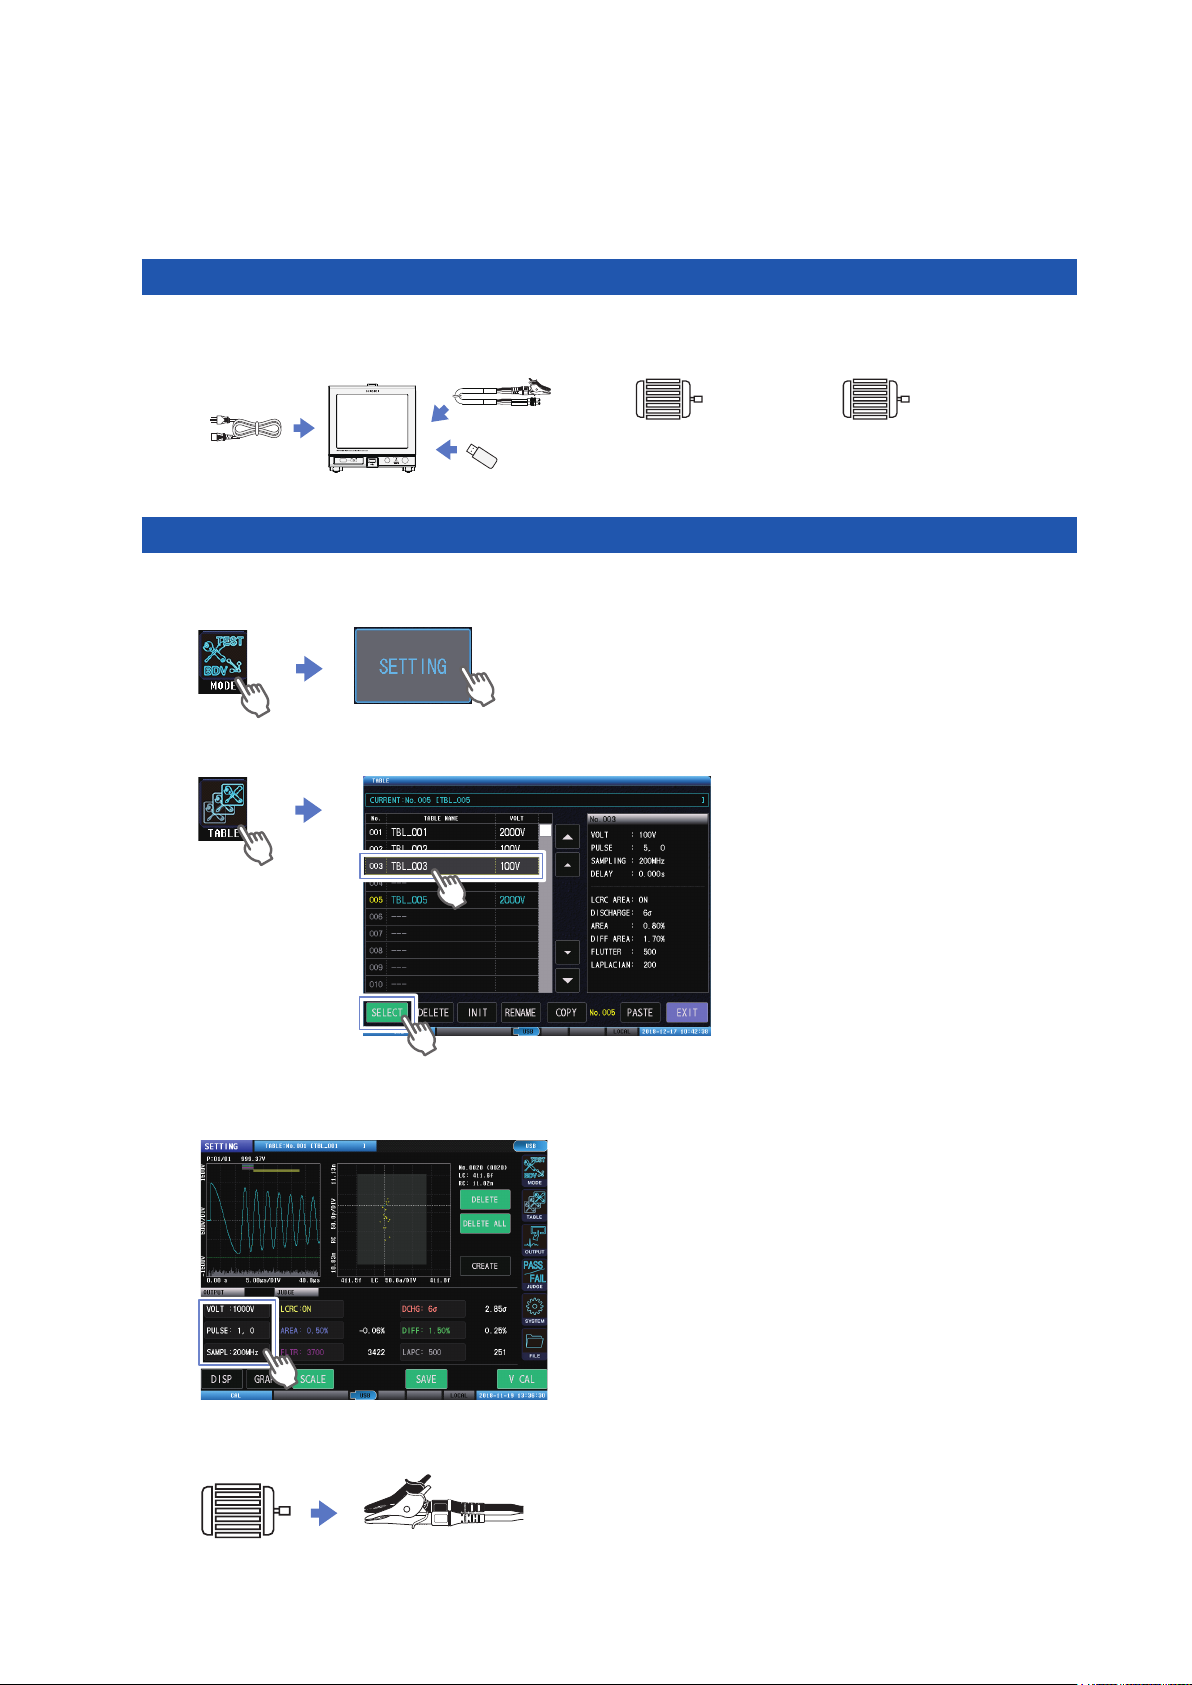
Setting Test Conditions and Judgment Conditions
Select [SETTING] in test conditions settings mode. (p. 18)
1
Select the settings table that will acquire the master waveform. (p. 29)
2
Workpiece
under test
Set the output items such as applied voltage, applied number of pulses, sampling frequency,
3
etc. (p. 41)
Connect the master workpiece to the test lead.
4
ST4030A961-02
Calibrate the voltage and acquire the master waveform. (p. 49)
5
Set the judgment criteria. (p. 53)
6
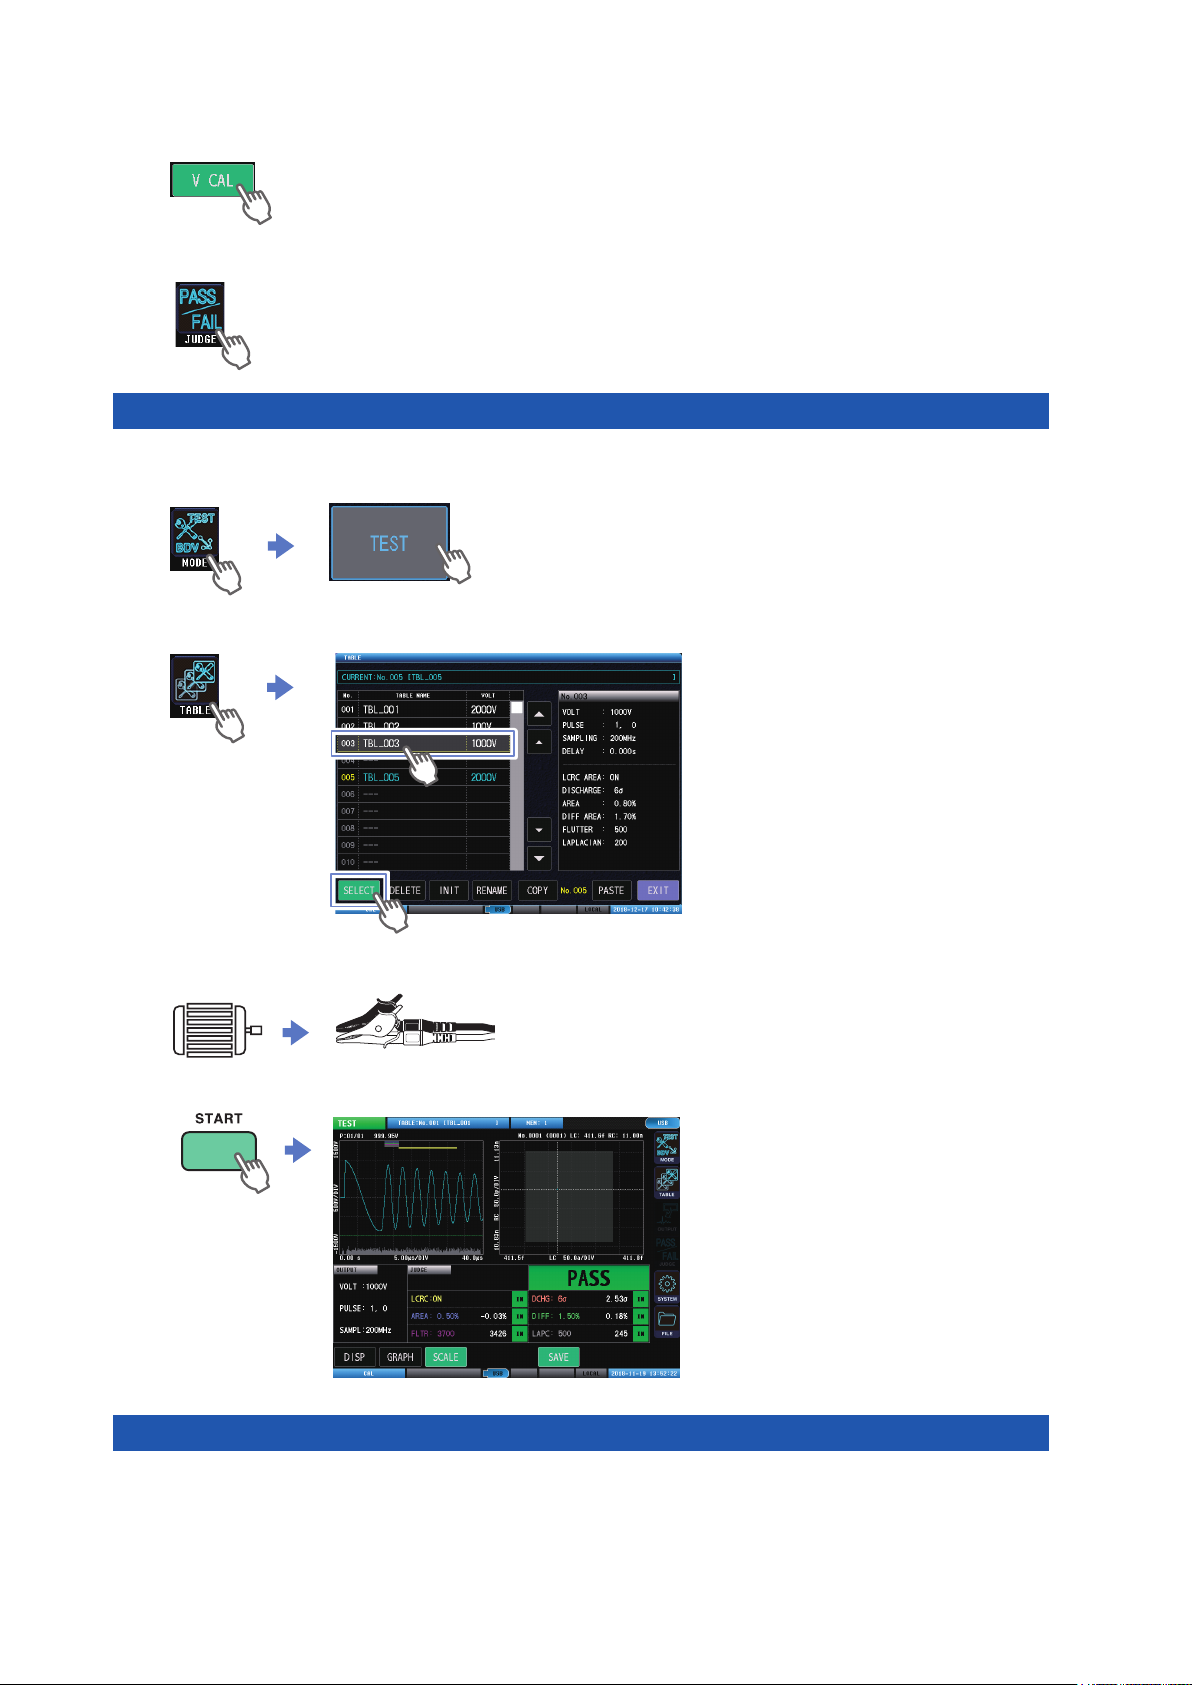
Implementing tests
Select [TEST] in test mode. (p. 18)
1
Select the settings table that acquired the master waveform to be used in the test (p. 29)
2
Connect the workpiece under test to the test lead.
3
Start the test and check the test results. (p. 84)
4
Save the test results
Make the settings for saving the data. (p. 169)
1
Save the test results. (p. 176)
2

Contents
5
4
3
2
1
Introduction
Notations
Conrming Package Contents
Options (Sold separately)
Usage Notes
........................................................1
............................................................2
........................3
................................4
......................................................5
1 Overview 7
1.1 Overview
1.2 Features
1.3 Parts Names and Functions
1.4 Screen Operations
Measuring mode settings
Moving windows
Touch keyboard inputs
Screen conguration
..................................................7
...................................................7
.................8
...............................10
........................... 10
........................................ 11
............................... 11
..................................12
2 Preparation for
Measurements
2.1 Connecting the Test Lead (on the
ST4030)
2.2 Connecting the Power Cord
2.3 Power Supply ON/OFF
Main power supply ON
Main power supply OFF
Sleep mode
Startup mode
2.4 Select Measuring Mode
2.5 Inspecting before Measurement
and Verifying Operations
Inspection
Checking the voltage generated
Checking the impulse response waveforms
.................................................14
................15
........................16
..............................16
.............................16
............................................... 17
............................................17
.......................18
.....................19
.................................................19
................20
13
21
3 Switching Test
Conditions (Table
Functions)
3.1 Overview
Overview of test conditions switching
functions
Items that can be saved
Operations owchart in test conditions
settings mode and test mode
Screen conguration
3.2 Current Table Selection
3.3 Table Initialization
................................................25
...................................................25
.............................26
..................................28
.................................30
.....................27
.......................29
25
3.4 Table Deletion
3.5 Changing the Table Name
3.6 Table Copying
.......................................31
..................32
.......................................33
4 Setting the Test
Conditions
4.1 Overview
Operations owchart in test conditions
settings mode
Screen conguration
4.2 Applied Voltage
4.3 Number of Applied Pulses
4.4 Sampling Frequency/Number of
Sampling Data
Automatic settings for range of
waveform acquisition
4.5 Trigger Delay
4.6 Voltage Calibration
................................................35
............................................35
..................................36
.....................................41
...................42
......................................44
................................. 46
.........................................47
...............................49
5 Setting Judgment
Conditions
5.1 Overview
Judgment types
Settings operations procedure
5.2 LC and RC Values Area
Judgments [LCRC AREA]
Enabling the LC and RC values
judgments function
Importing LC and RC master values
Auto creation of the PASS judgment area
Manually creating the PASS judgment area
5.3 Waveform Judgments
Surface area comparison judgments
[AREA]
Differential surface area comparison
judgments [DIFF AREA]
Flutter detection judgments [FLUTTER]
Secondary differential detection
judgments [LAPLACIAN]
Waveform judgment area and judgment
threshold value automatic settings
functions
5.4 Discharge Judgments (When
Incorporating Model ST9000)
Discharge judgment methods
[DISCHARGE]
................................................51
.........................................51
...................52
..................53
....................................55
..........56
..........................62
..................................................... 62
............................ 64
.......................... 69
...................................................71
.............72
..........................................73
35
51
.. 58
60
..... 66
i

Contents
Threshold value of the test waveform
discharge amount over the master
waveform discharge amount
Deviation threshold value of the test
waveform discharge amount
Setting the discharge amount judgment
area
..........................................................76
......................74
......................75
6 Implementing Tests 77
6.1 Overview
Operations owchart in test mode
Screen conguration
6.2 Checking Test Start and Test Results
................................................77
..............77
..................................78
84
7 Break down voltage
test (BDV)
7.1 Overview
Operations owchart in break down
voltage test mode
Screen conguration
7.2 Checking Test Start and Test Results
7.3 Setting the Test Conditions
Applied voltage settings
Number of applied pulses settings
Setting the sampling frequency and
number of sampling data
Setting the waveform acquisition area
automatically
7.4 Setting Dielectric Break down
Judgment Conditions
LC and RC values judgments
Discharge judgment
Waveform surface area comparison
judgment
Peak voltage value uctuations
Vibration frequency uctuations
................................................85
...................................... 85
..................................86
.................90
.............................90
.............91
...........................93
............................................. 94
...........................95
.................... 95
..................................96
................................................... 97
.................. 98
.................99
85
89
8 Other Functions 101
8.1 Interlock Function
Unlocking the interlocks
8.2 Key Lock Function
Unlocking the key locks
8.3 Double Action Function
8.4 Memory Function
Memory function settings (ON/OFF)
Saving memory data
Deleting memory data
...............................101
...........................103
..............................104
...........................105
......................106
................................107
.........108
................................109
............................. 110
8.5 Displays
8.6 Graph Display Settings
Overlay settings
Waveform color settings
LC and RC graph scale settings
Implementing the LC and RC graph auto
scale
8.7 Judgment Beep
8.8 Key Beep
8.9 Test Time (EOM) Display
...............................................111
......................112
...................................... 112
..........................113
............... 115
....................................................... 116
...................................117
.............................................118
...................119
8.10 Communications Commands Long
Format Settings
..................................120
8.11 Initializing the Instrument (System
Reset)
8.12 Terminal Open Error Setting
8.13 Voltage Error Setting
...................................................121
.............122
..........................123
9 System Settings 125
9.1 Instrument System Information
9.2 Self-test Function
Touch panel test
Touch panel correction
Screen display test
ROM/RAM test
EXT. I/O test
............................................131
9.3 Date and Time Settings
................................126
...................................... 126
............................127
.................................. 128
........................................ 129
.....................132
........125
10 External Control
(EXT. I/O)
10.1 External Control Measurement
......................................................134
Flow
10.2 Sinking Current (NPN) / Sourcing
Current (PNP)
10.3 Connection (Instrument and
Control Devices)
Instrument connector and compatible
connectors
Signal functions
Internal circuit conguration
Electrical specications
Connection examples
10.4 Timing Chart
Explanation of timing chart times
Measurement timing example
Flow of starting measurements from
an external device, and reading the
judgment results
.....................................135
.................................136
..............................................136
.......................................138
..................... 139
............................140
.............................. 140
........................................142
.............142
.................. 143
......................................144
133
ii

Contents
Index
11
12
13
14
15
6
7
8
9
10
11 Communications
Interface
11.1 Overview
Screen display
11.2 Specications
RS-232C
GP-IB
USB
LAN
Total
11.3 Mounting and Removing an
Interface
11.4 Interface Settings
11.5 Connecting and Setting RS-232C
(Model Z3001)
11.6 Connecting and Setting GP-IB
(Model Z3000)
11.7 Connecting and Setting USB
11.8 Setting and Connecting LAN
Connection method
Setting procedure
11.9 Remote Mode
11.10 Communications Monitor
..............................................146
.........................................146
......................................147
................................................. 147
...................................................... 148
........................................................ 148
........................................................148
........................................................148
...............................................149
................................151
.....................................152
.....................................154
............155
............157
.................................157
.................................... 159
.....................................162
...................163
145
12 USB Host 165
12.1 Overview
12.2 Removing the USB Memory
12.3 File Window
12.4 Settings for Saving the Data
Setting auto save
Setting manual save
Text save items settings
Setting the text save format
Setting the image save format
Setting the name of the saved le and
its folder
12.5 Saving Test Results
Saving manually
Checking the test results that have been
saved
12.6 Saving and Importing Test
Conditions
Saving test conditions
Importing test conditions
12.7 Editing Files and Folders
Formatting USB memory
..............................................165
.............166
.........................................168
.............169
.....................................169
................................170
...........................171
.....................172
.................173
..................................................174
............................176
......................................176
......................................................178
............................................180
.............................. 180
..........................182
...................184
.........................184
Deleting les and folders
Creating folders
Changing the folder name and le name
Information display
.......................................187
.........................186
. . 188
..................................189
13 Specications 191
13.1 General Specications
13.2 Input Specications/Output
Specications/Measurement
Specications
Basic specications
Accuracy specications
13.3 Functional Specications
Test conditions settings
Set judgment conditions
Test conditions switching functions
Break down voltage test (BDV) mode
Safety protection function
Other functions
13.4 Interface Specications
External control terminal (EXT.I/O)
specications
Communications interface specications
USB host specications
Test time (Reference value)
13.5 L2250 Clip Type Lead (Option)
General Specications
Basic specications
13.6 L2252 Unprocessed Lead Cable
(Option)
General Specications
Basic specications
......................................192
........................................198
..........................................200
................................................205
.......................191
.................................192
...........................192
...................193
............................193
..........................193
...........195
......196
........................197
.....................200
. . 202
........................... 203
..................... 204
........205
............................. 205
.................................205
............................. 205
.................................205
14 Maintenance and
Service
14.1 Troubleshooting
Before sending the instrument for repair
FAQ regarding external control (EXT. I/O)
14.2 Initializing the Instrument (Full
Reset)
14.3 Error Display
14.4 Discarding the Instrument
(Removing the Lithium Battery)
...................................................213
..................................208
.......................................214
207
..208
212
........220
iii

Contents
15 Appendix 221
15.1 Block Diagram
15.2 Circuit Conguration
Circuit operations during tests
Effects of cable parasitic components
15.3 Rack Mount
Metal tting dimensions
Installation method
15.4 Dimensions Diagram
.....................................221
..........................222
..................222
......223
.........................................224
...........................225
..................................227
..........................229
15.5 Repeat Accuracy (Reference Value)
Reproducibility of the voltage generated
Oscillation waveform reproducibility
..230
.........231
15.6 Max. Applicable Voltage
(Reference Value) According to
the Workpiece Inductance
.................232
15.7 Voltage Switching Time (Reference
Value)
...................................................233
15.8 Waveform Differences (Typical
Values) Between Instruments
...........234
15.9 Affects on Measurements
According to the Length of the
Test Lead
.............................................236
15.10 Precautions when Processing Test
....................................................237
Leads
15.11 Ver. 1.01 Compatibility Function
.......239
230
Index 241
Warranty Certicate
iv

Introduction
Thank you for choosing the Hioki ST4030, ST4030A Impulse Winding Tester. Preserve this manual
carefully and keep it handy to make full use of this instrument for a long time. Read the separate
document “Operating Precautions” carefully before using the instrument.
Target audience
This manual has been written for use by individuals who use the product in question or who teach
others to do so.
It is assumed that the reader possesses basic electrical knowledge (equivalent to that of someone
who graduated from the electrical program at a technical high school).
Trademarks
• Windows is either registered trademarks or trademarks of Microsoft Corporation in the United
States and other countries.
• Any other products and company names are generally either trade names, registered trademarks
or trademarks of respective companies.
Introduction
1

Notations
Notations
Safety symbols
In this document, the risk seriousness and the hazard levels are classied as follows.
WARNING
CAUTION
IMPORTANT
Indicates a potentially hazardous situation that may result in death or serious
injury to the operator.
Indicates a potentially hazardous situation that may result in minor injury to the
operator or damage to the instrument or malfunction.
Indicates information related to the operation of the instrument or maintenance
tasks with which the operators must be fully familiar.
Indicates prohibited actions.
Indicates an action that must be performed.
Symbols afxed to the instrument
Indicates cautions and hazards. Refer to the “Usage Notes” (p. 5) and warning
messages presented at the beginning of each instruction for use of the Instruction
Manual, and included “Operating Precautions”.
Indicates that dangerous voltage may be present at this terminal.
Other Descriptions
(p. ) Indicates the location of reference information.
START
(Boldface)
[ ]
S/s
Indicates the names and keys on the windows in boldface.
Names of menus, dialog boxes, buttons in a dialog box, and other UI elements on the
screen are enclosed in brackets [ ].
The instrument describes the number per second of digitized analog input signals in
units of samples per second (S/s).
Example: “20 MS/s” (20 megasamples per second) means digitization of 20 × 10
times per second.
Accuracy descriptions
We dene measurement tolerances in terms of setting values with the following meanings.
Setting Indicates the value set as the output voltage, current, or other quantity.
6
2
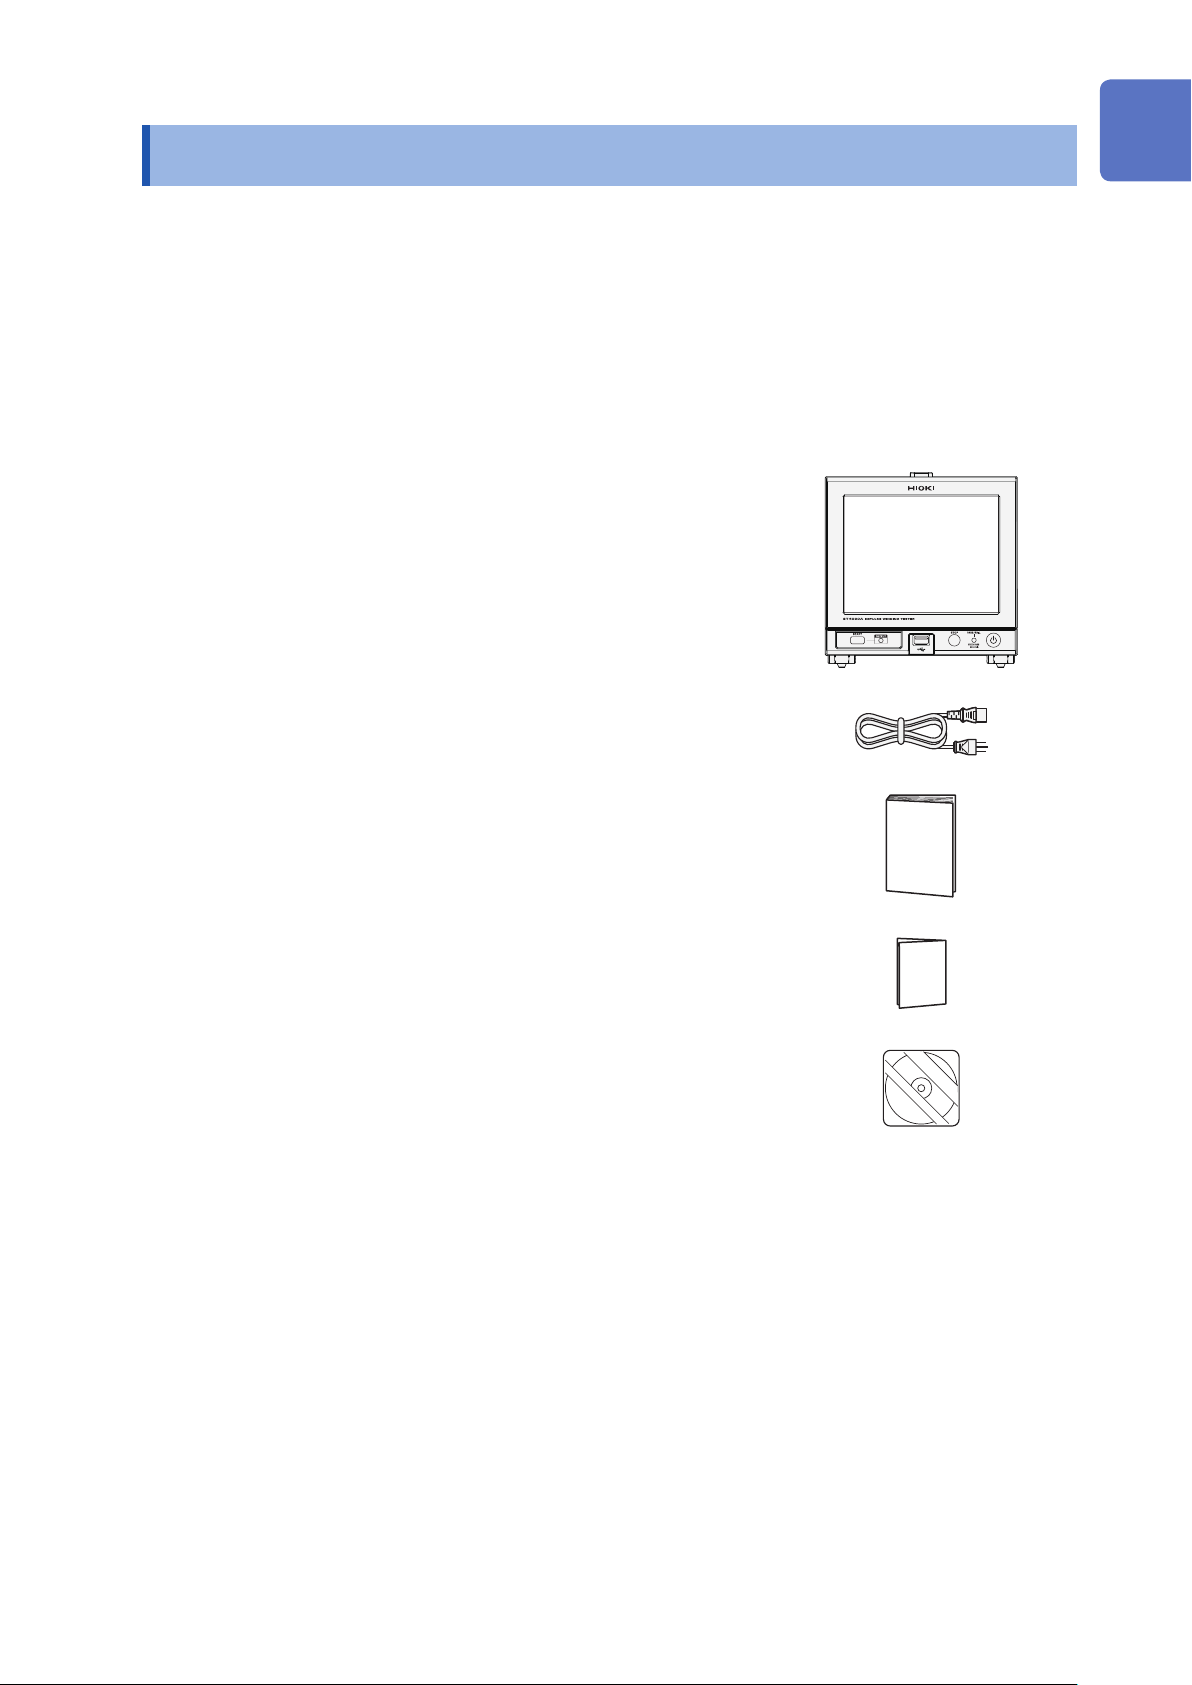
Conrming Package Contents
Conrming Package Contents
When you receive the instrument, inspect it carefully to ensure that no damage occurred during
shipping. In particular, check the accessories, panel switches, and connectors. If damage is evident,
or if it fails to operate according to the specications, contact your authorized Hioki distributor or
reseller.
Store the packaging materials even after unpacking, because you will need them when you
transport the instrument.
Conrm that these contents are provided.
Model ST4030 or ST4030A Impulse Winding Tester
Power cord
Instruction Manual (this document)
Operating Precautions (0990A903)
Application disc (CD)
• Communication Command Instruction Manual
Communication Command Reference
Default settings table
• USB driver
The latest version can be downloaded from our website.
3
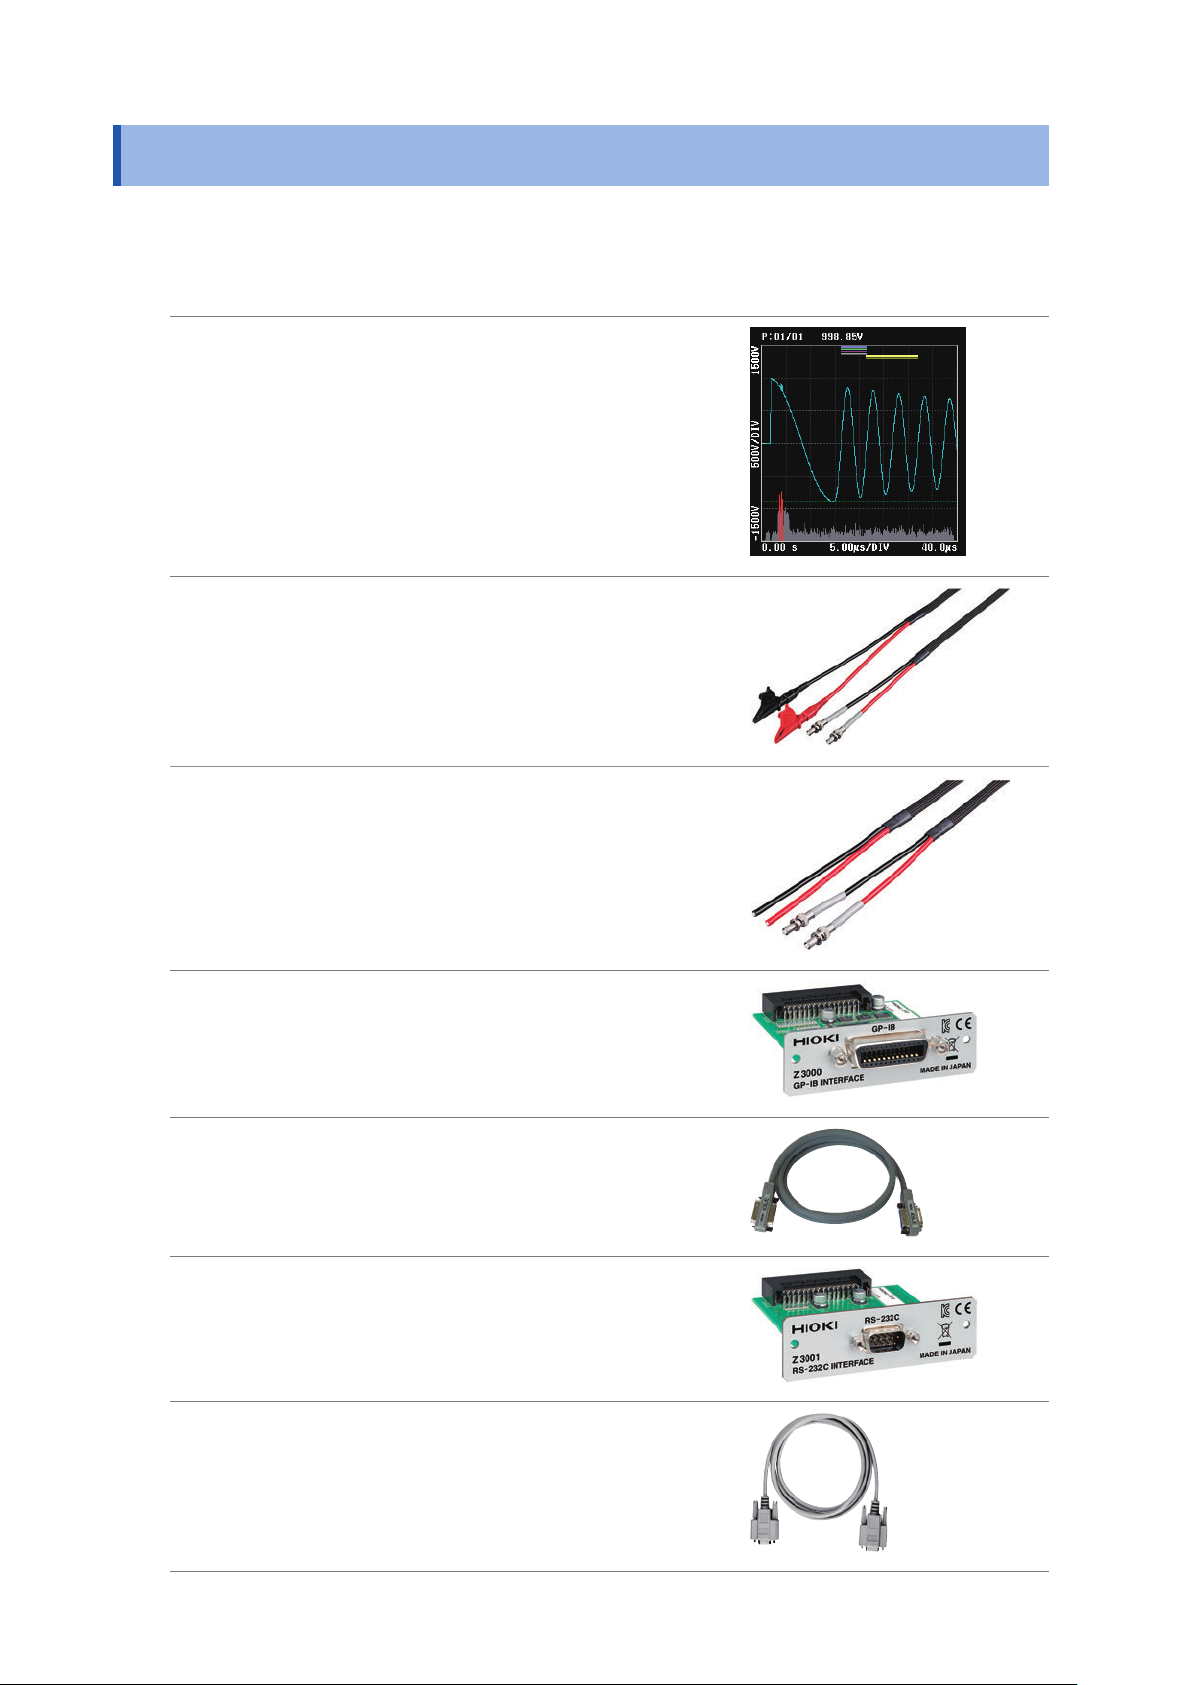
Options (Sold separately)
Options (Sold separately)
The following options are available for the instrument. To purchase an option, please contact your
authorized Hioki distributor or reseller. Options are subject to change. Please check Hioki’s website
for the latest information.
Model ST9000 Discharge Detection Upgrade
(Optional when shipped from factory)
Model L2250 Clip Type Lead
(Maximum rated voltage: 3300 V AC peak)
Model L2252 Unprocessed Lead Cable
(Maximum rated voltage: 4200 V AC peak)
Model Z3000 GP-IB Interface
Model 9151-02 GP-IB Connector Cable (2 m)
Model Z3001 RS-232C Interface
Model 9637 RS-232C Cable (9pin-9pin/1.8 m)
4
Usage Notes
Read the separate document “Operating Precautions” carefully before using the instrument. Follow
these precautions to ensure safe operation and to obtain the full benets of the various functions.
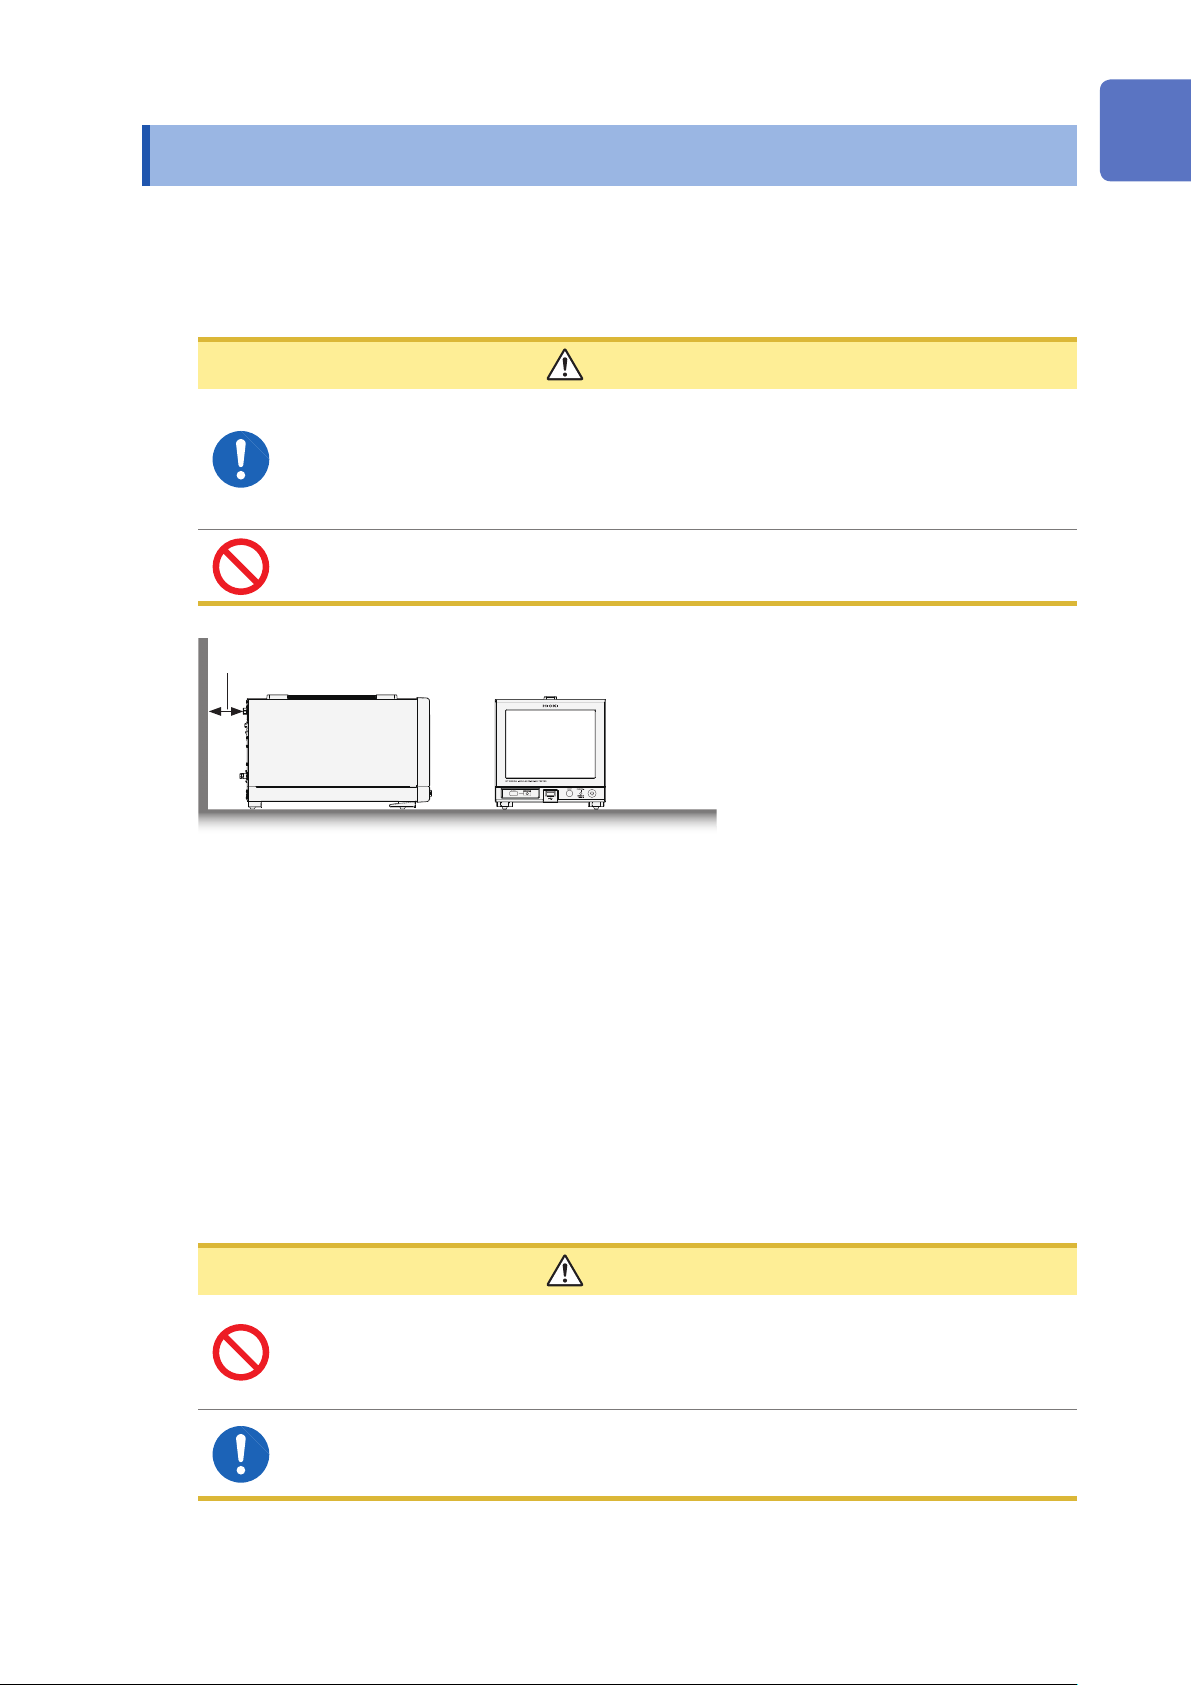
Installation
CAUTION
• Ventilation holes for heat radiation are provided on the rear of the instrument. Leave
sufcient space around the ventilation holes and install the instrument with the holes
unobstructed.
Installation of the instrument with the ventilation holes obstructed may cause a
malfunction of the instrument or a re.
• Do not place the instrument on an unstable surface or inclined place.Dropping or
knocking down the instrument could cause bodily injury or damage to the instrument.
Usage Notes
Open 5 cm or longer
This instrument may cause interference if used in residential areas. Such use must be avoided
unless the user takes special measures to reduce electromagnetic emissions to prevent
interference to the reception of radio and television broadcasts.
Application disc
• Exercise care to keep the recorded side of discs free of dirt and scratches. When writing text on a
disc’s label, use a pen or marker with a soft tip.
• Keep discs inside a protective case and do not expose them to direct sunlight, high temperature,
or high humidity.
• Hioki is not liable for any issues your computer system experiences in the course of using this
disc.
Test lead
CAUTION
• Do not make small bends or repeatedly bend the cable.
As a benchmark, bending to 6x or less the cable diameter will damage the cable core
and cover, causing deterioration.
• Do not hold the cable when removing the clip from the workpiece.
• Hold the clip in your hand, and open and close gently.
Repeatedly opening and closing so that the clip springs risks damaging and causing
deterioration to the opening and closing mechanism.
5

Usage Notes
6
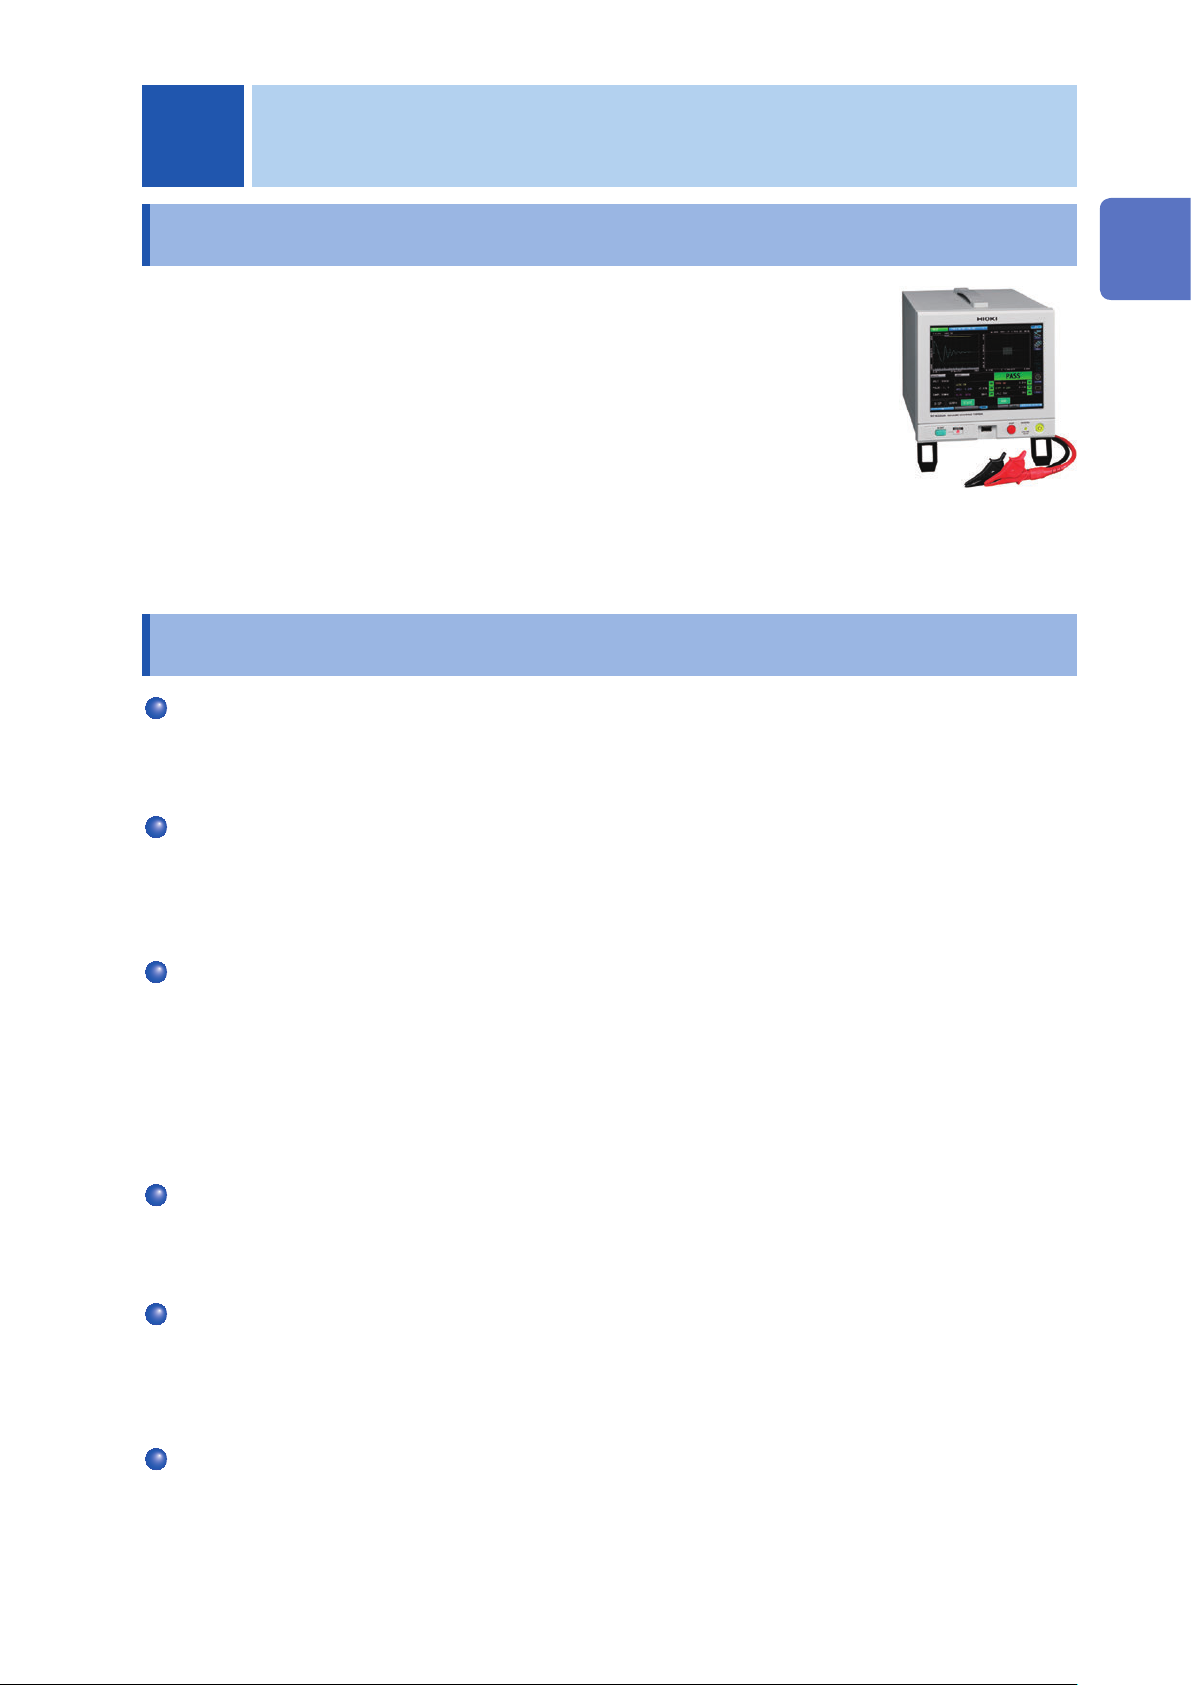
1
Overview
1.1 Overview
Windings (workpieces) found in motors, coils, and other components are
covered with insulation, but the insulation resistance may fall and short
circuits occur between proximate layers for some reason. The condition is
called a “layer short circuit”.
The ST4030, ST4030A Impedance Winding Tester not only compares and
judges waveform conformance through comparisons with existing response
waveforms, but also detects layer short circuits using judgment methods
that employ the rendering of response waveforms as numerical values (LC
and RC values). Further, incorporating the ST9000 Discharge Detection Upgrade (optional) into
the instrument enables highly precise detection of partial discharges that occur in the stages in
advance of a layer short circuit.
1.2 Features
High-speed and high-resolution sampling
Sampling using 200 MHz, 12 bit resolution enables the detection of minute changes in the response
waveform that hitherto could not be seen. In this way, it is possible to detect layer short circuits with
a high level of accuracy compared to before.
Numerical rendering of impulse response waveforms (LC and RC values)
1
Overview
The equivalence circuits for the impulse test are viewed as LCR linear equivalent circuits, and the
response waveforms are rendered numerically into LC and RC values. Rendering the response
waveforms into numerical values enables the response waveforms to be judged quantitatively.
Further, the data can be managed more easily than the waveform data.
Impulse can be tested with the rotor mounted
With the rotor and motor stator mounted, the stray capacitance between the rotor and the stator
changes depending on the rotor angle.
Changes in the stray capacitance also change the impulse response waveform, so judgments are
difcult using existing waveform comparison methods.
Numerical judgment values using LC and RC values can create PASS judgment area from the LC
and RC values distribution, and so by creating PASS judgment area using a healthy phase, it is
possible to test the impulse with the rotor mounted.
High-precision Discharge Detection Upgrade
Extracting the high-frequency discharge components of the response waveform enables highly
precise detection of partial discharges, which have hitherto been difcult to detect using utter
operations and Laplacian operations.
High waveform reproducibility
The applied voltage variation is small, so it is possible to detect defective products accurately.
Further, the instrument differences when the same workpiece is tested are small, so it is possible to
use the master workpiece data as is even if the instrument is replaced.
Reference: “15.5 Repeat Accuracy (Reference Value)” (p. 230)
Easy-to-use interfaces and an abundance of interfaces
The screen uses 8.4-inch color TFT crystals with touch panel for easy viewing and intuitive
operability. Compatible with various usage scenarios using external control (EXT. I/O), USB
memory, USB devices, and LAN. Further, RS-232C or GP-IB can be added as options.
7
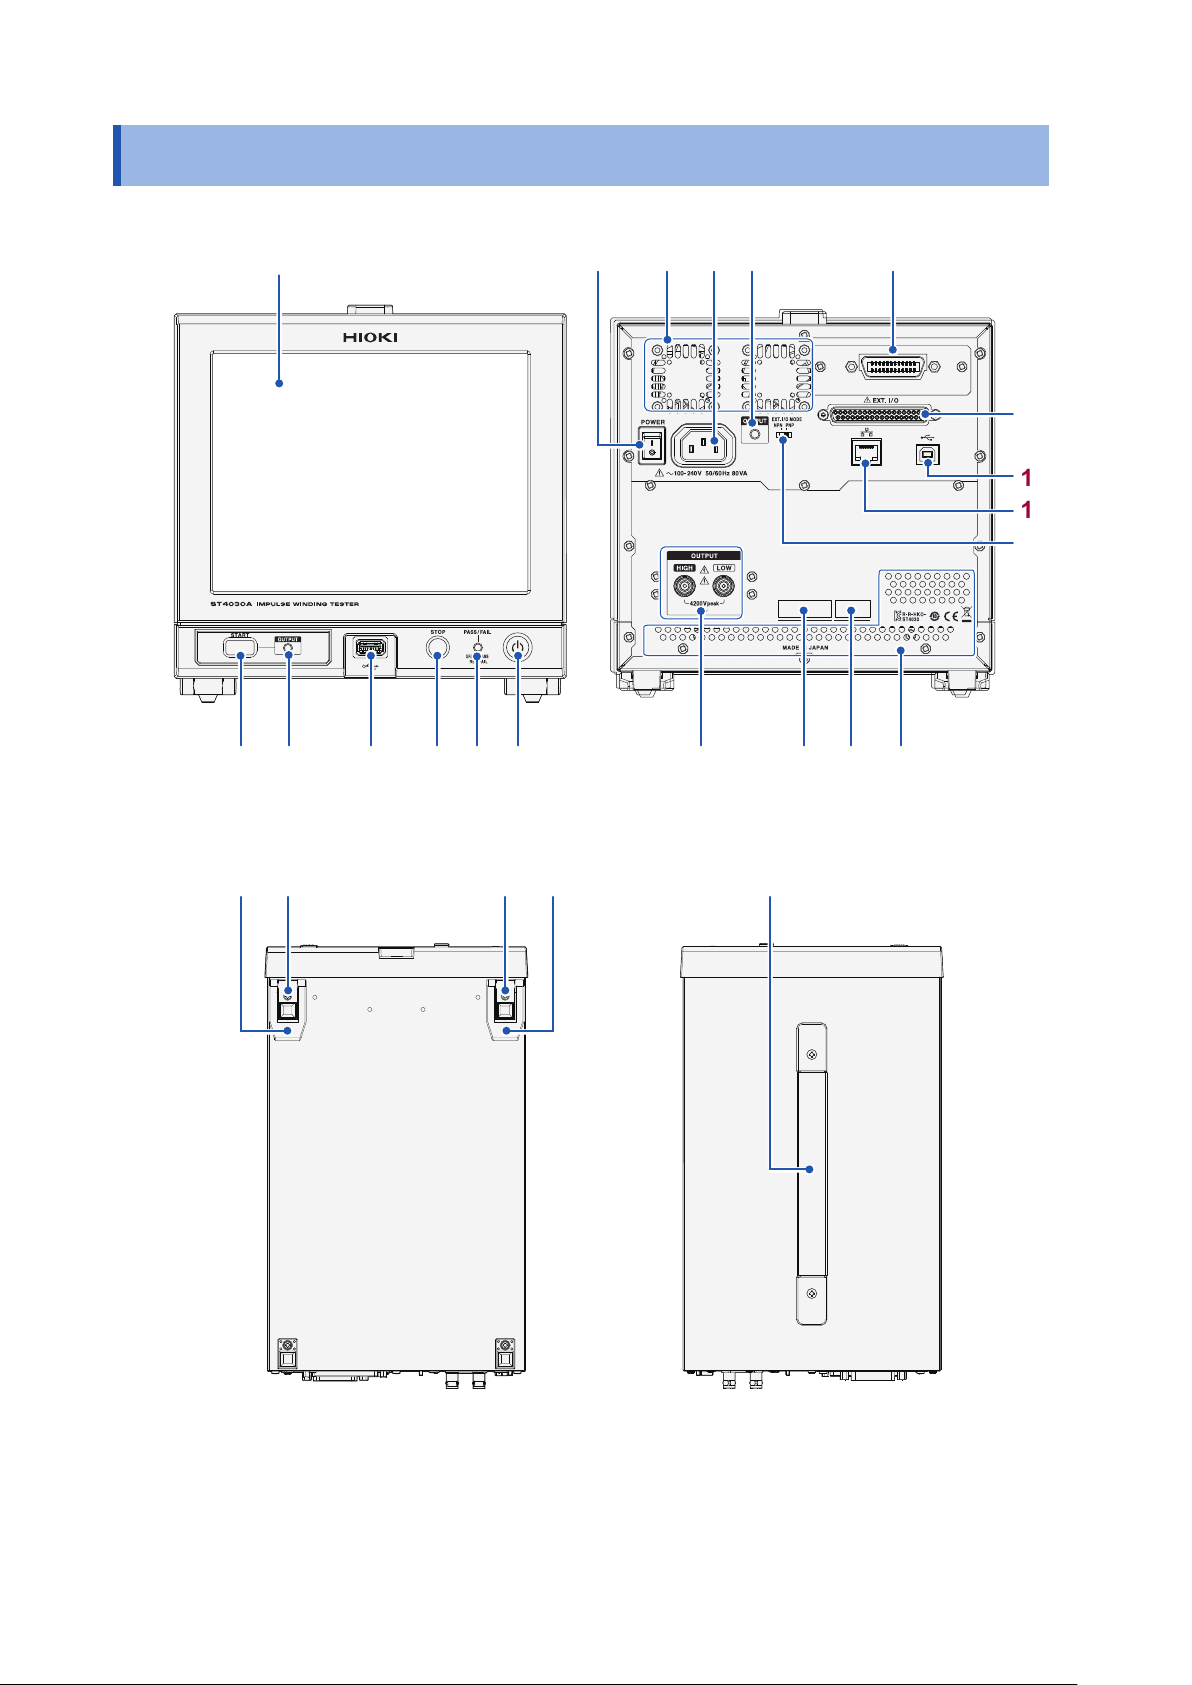
Parts Names and Functions
1.3 Parts Names and Functions
1
2 3 4 5 6 7
Front
18 17 16
11
8 11
9310
Rear
15
14
13
12
19 19
Bottom
212020
Top
8
Parts Names and Functions
No. Name Function
Display 8.4-inch color TFT liquid crystal display.
1
START button Starts measurements. p. 77
2
OUTPUT lamp Shows the voltage
3
USB connector Connects a USB memory. p. 165
4
STOP button Stops the voltage application and suspends testing.
5
PASS/FAIL lamp Shows the total judgment
6
Startup button Switches the instrument
7
Voltage output terminal Connects a test lead (optional). p. 14
8
Serial number The serial number consists of 9 digits. The rst two (from the left)
9
Comes with a resistant lm touch panel.
Red: Voltage is being applied p. 84
application status.
Also used during double actions.
result.
ON and OFF.
indicate the year of manufacture, and the next two indicate the
month of manufacture.
Required for production control. Do not peel off the label.
OFF: Standby
Green: Total judgment result PASS p. 84
Red: Total judgment result FAIL
OFF: No judgments
OFF: Main power supply OFF p. 16
Red: Sleep mode
Green: ON mode
Reference
p. 10
p. 84,
106
p.
p.
125
1
Overview
MAC address MAC address of the instrument. p. 125
10
Vent holes For ventilation, and to prevent the interior of the instrument from
11
EXT.I/O
12
NPN/PNP switch
1
mount
1
1
LAN connector *
13
USB connector *
14
External control
15
terminal (EXT.I/O)
Communications
16
interface*
Power inlet Connects the provided power cord. p. 15
17
Main power supply
18
switch
Stand Tilts the instrument to enable the screen to be viewed easily.
19
20
Support legs
overheating. Install so that the vent holes are not blocked.
Switches the programmable type of the external control terminal.
Left: NPN (current sink)
Connects a LAN cable. p. 157
Connects a USB cable. p. 155
Enters signals from the programmable controller and I/O boards to
control the instrument.
Mount a Z3000 GP-IB Interface (optional) or Z3001 RS-232C
Interface (optional).
Turns ON and OFF the main power supply to the instrument. p. 16
Make sure to fully open both the left and right stands before
installation.
When mounting the instrument to a rack*
legs.
Right: PNP (current source)
2
, remove the support
–
133
p.
p. 133
152,
p.
p.
154
–
–
Handle Used to carry the instrument. –
21
*1: For how to use RS-232C, GP-IB, USB, and LAN, see the “Communications Commands Instruction
Manual” on the application disk.
*2: The instrument can be mounted to a rack. See “15.3 Rack Mount” (p. 224).
9
Screen Operations
1.4 Screen Operations
The instrument uses a touch panel for all settings and changes to the measuring conditions.
Gently touch the onscreen keys to select the items and values set for those keys.
CAUTION
Do not press the touch panel forcefully or jab it with the point of a hard object. Doing so
may cause a malfunction.
This document describes below the procedures up to displaying the various settings screens.
Example: When displaying the [SETTING] screen
Measurement screen
(
) [MODE] > [SETTING]
Measuring mode settings
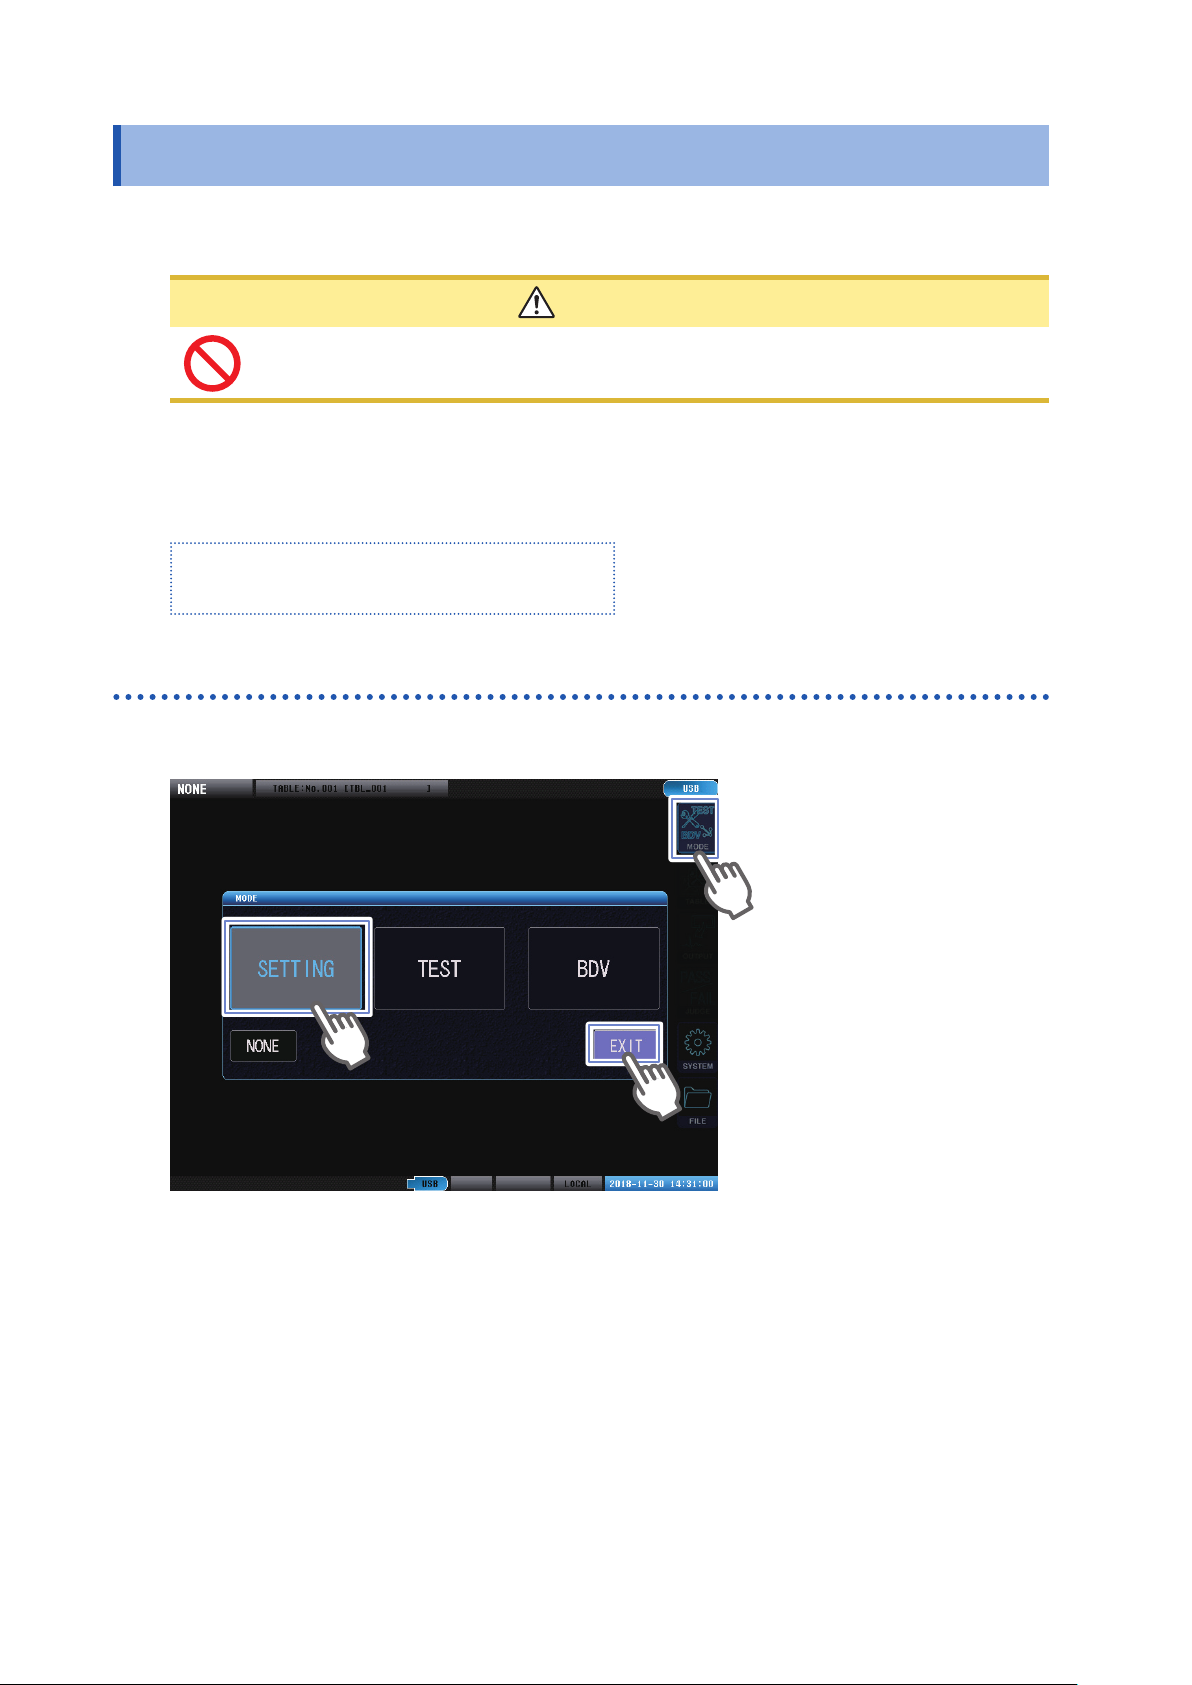
Example: Selecting the test conditions settings mode
2
Tap [MODE] to display the measuring mode selection window.
1
1
3
Select the measuring mode.
2
Here, tap [SETTING].
Tap [EXIT] to return to the measurement screen.
3
10
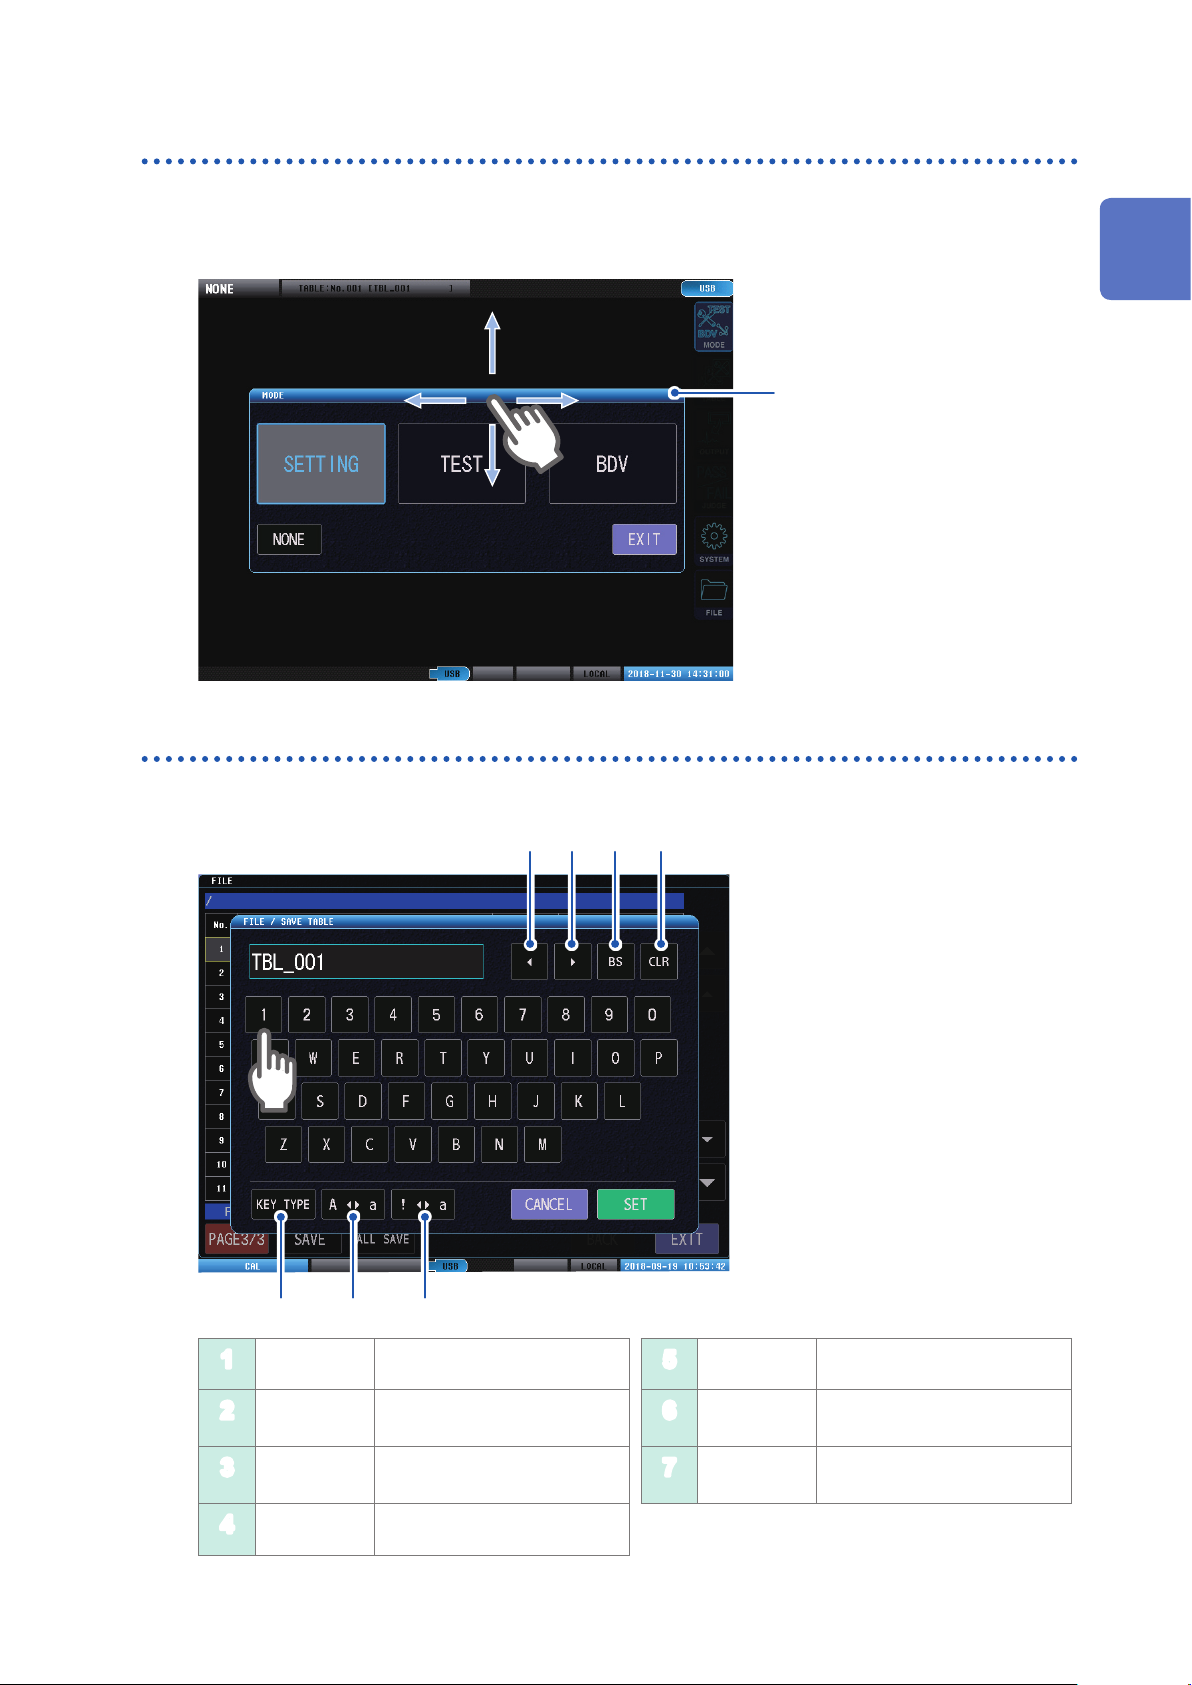
Moving windows
Press and hold the window title bar while dragging the window to move the window to a new
position.
Window title bar
Screen Operations
1
Overview
Touch keyboard inputs
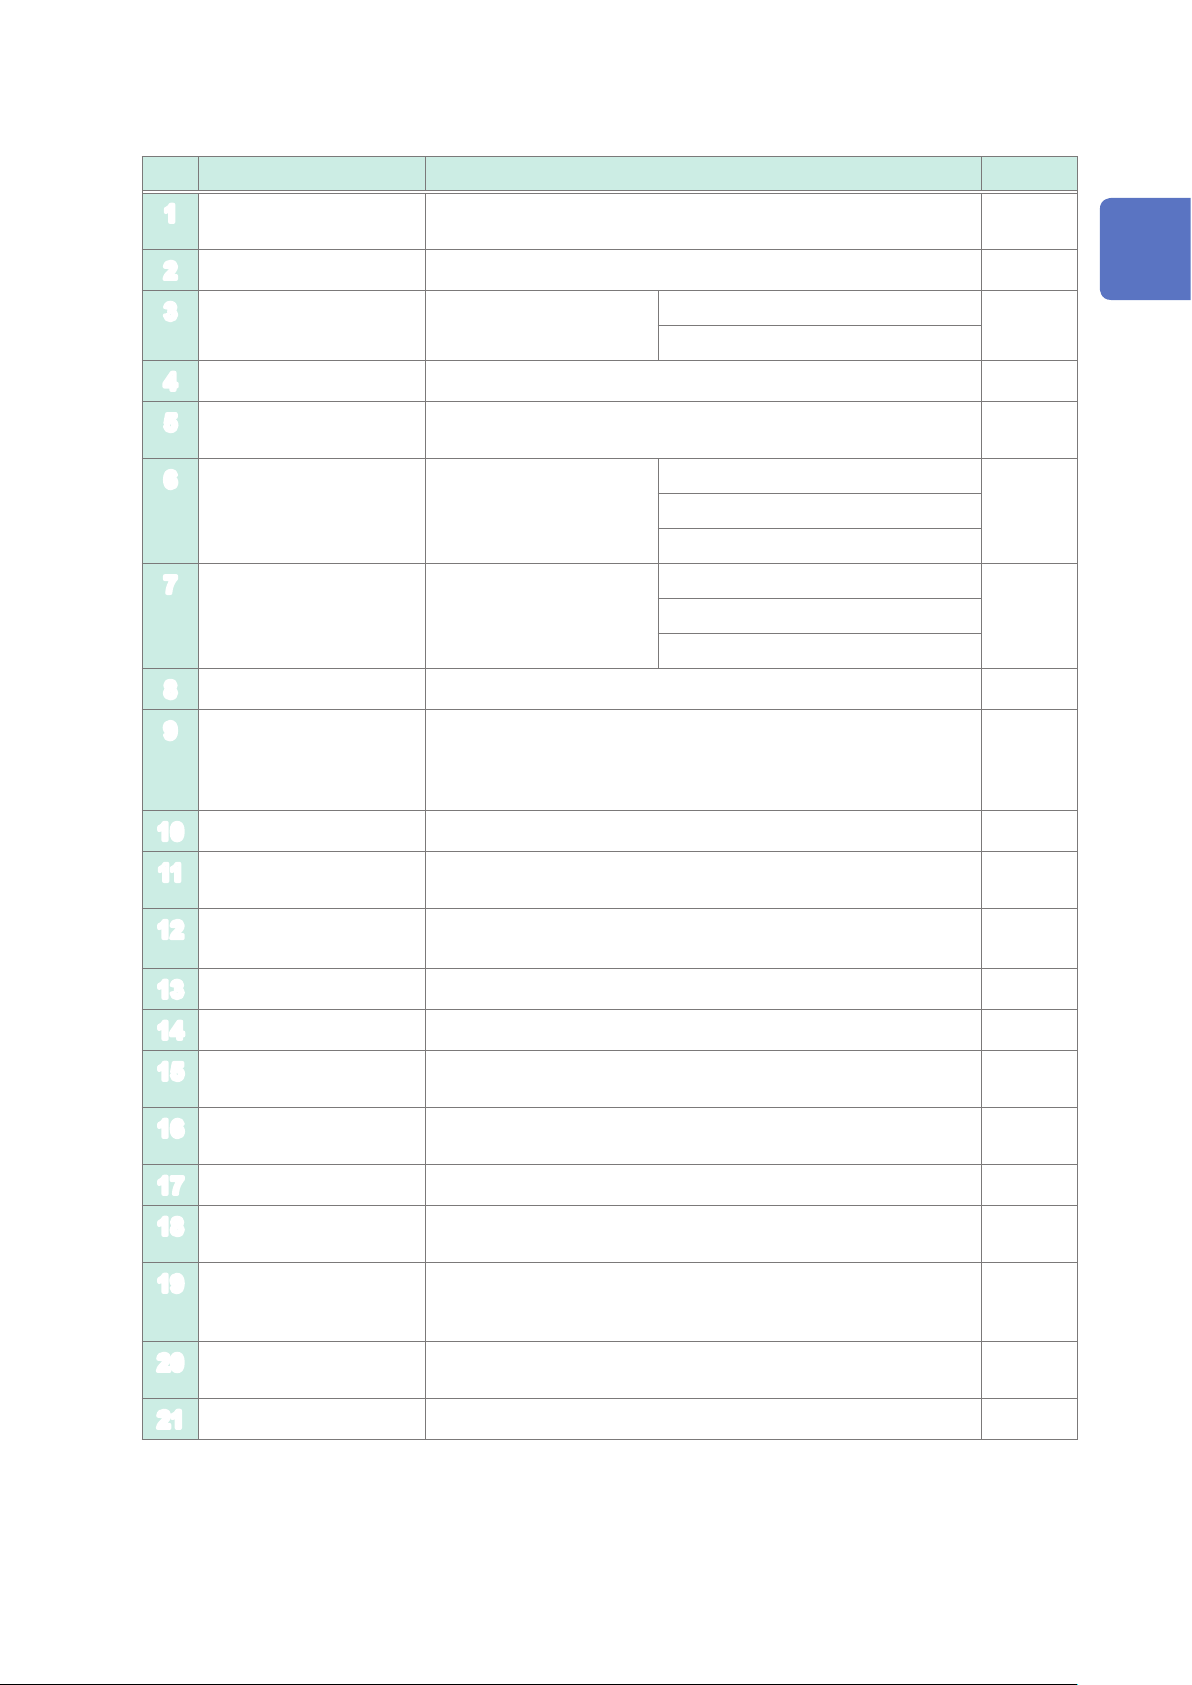
Enter text and then tap [SET] to conrm. To cancel, tap [CANCEL].
1 3 4
2
5 6 7
1
2
3
4
BS Deletes 1 character.
CLR Deletes all.
Moves the cursor to the left.
Moves the cursor to the right.
KEY TYPE Switches the keyboard type.
5
6
7
A a Switches between upper and
lower case.
! A Switches between symbols/
numbers, and the alphabet.
11
Screen Operations
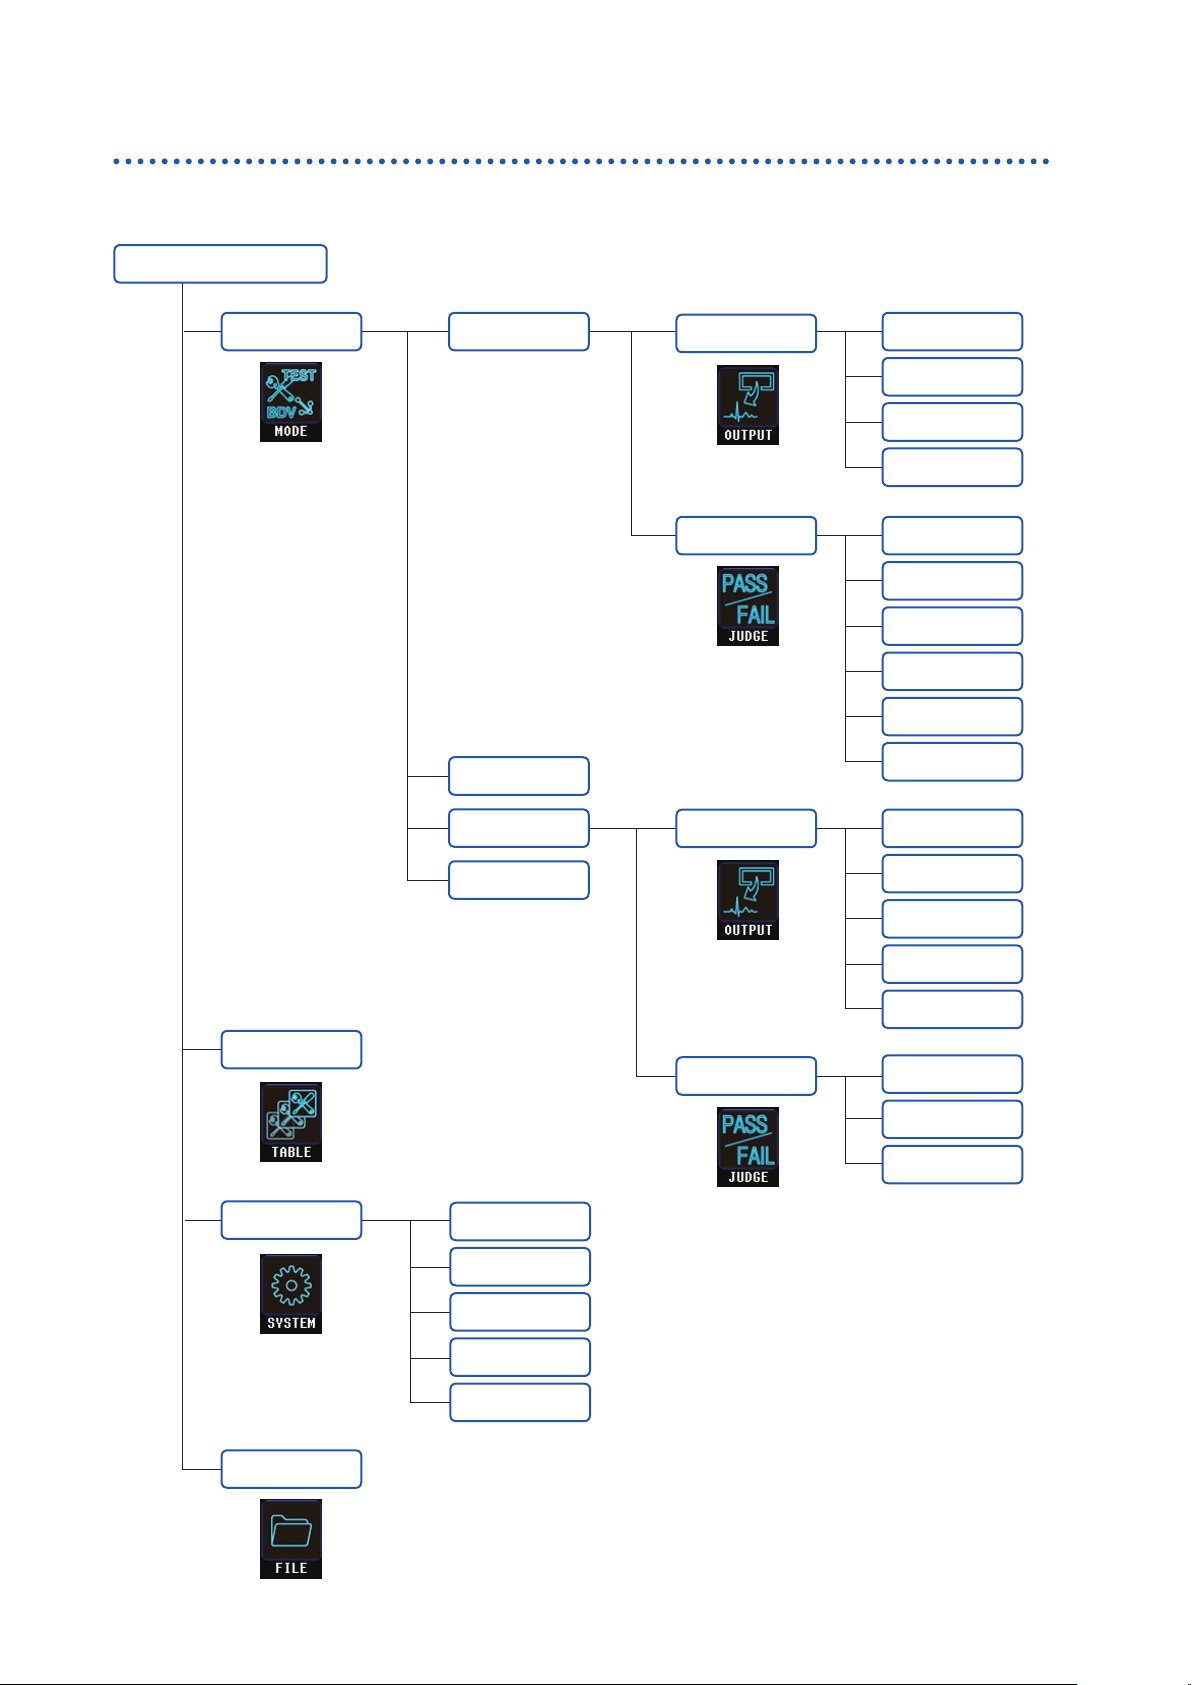
Screen conguration
The instrument settings windows are congured using the following stages.
Measurement screen
MODE VOLT
SETTING
TEST
BDV
NONE
OUTPUT
PULSE
SAMPLING
DELAY
JUDGE
OUTPUT START
LCRC AREA
DISCHARGE
AREA
DIFF AREA
FLUTTER
LAPLACIAN
END
TABLE
SYSTEM
FILE
SYSTEM
I/F
INFO
TEST
CLOCK
JUDGE
STEP
PULSE
SAMPLING
LCRC AREA
DISCHARGE
AREA
12

2
Preparation for Measurements
Make sure to read through both “Usage Notes” (p. 5) in this manual and the separate “Operating
Precautions” before starting the preparations that precede measuring.
For rack mounts, see “15.3 Rack Mount” (p. 224).
Installing the device.
Connecting the test lead.
p. 5
p. 14
Connecting and setting the external interface (as necessary).
EXT. I/O p. 136
RS-232C p.
GP-IB p.
USB p.
152
154
155
2
Preparation for Measurements
LAN p.
USB memory p.
Connecting the power cord.
Turning on the instrument power supply.
Setting the date and time (as necessary).
Setting the measuring mode.
Inspecting before measurement and verifying operations.
157
169
p. 15
p. 16
p. 132
p. 18
p. 19
13
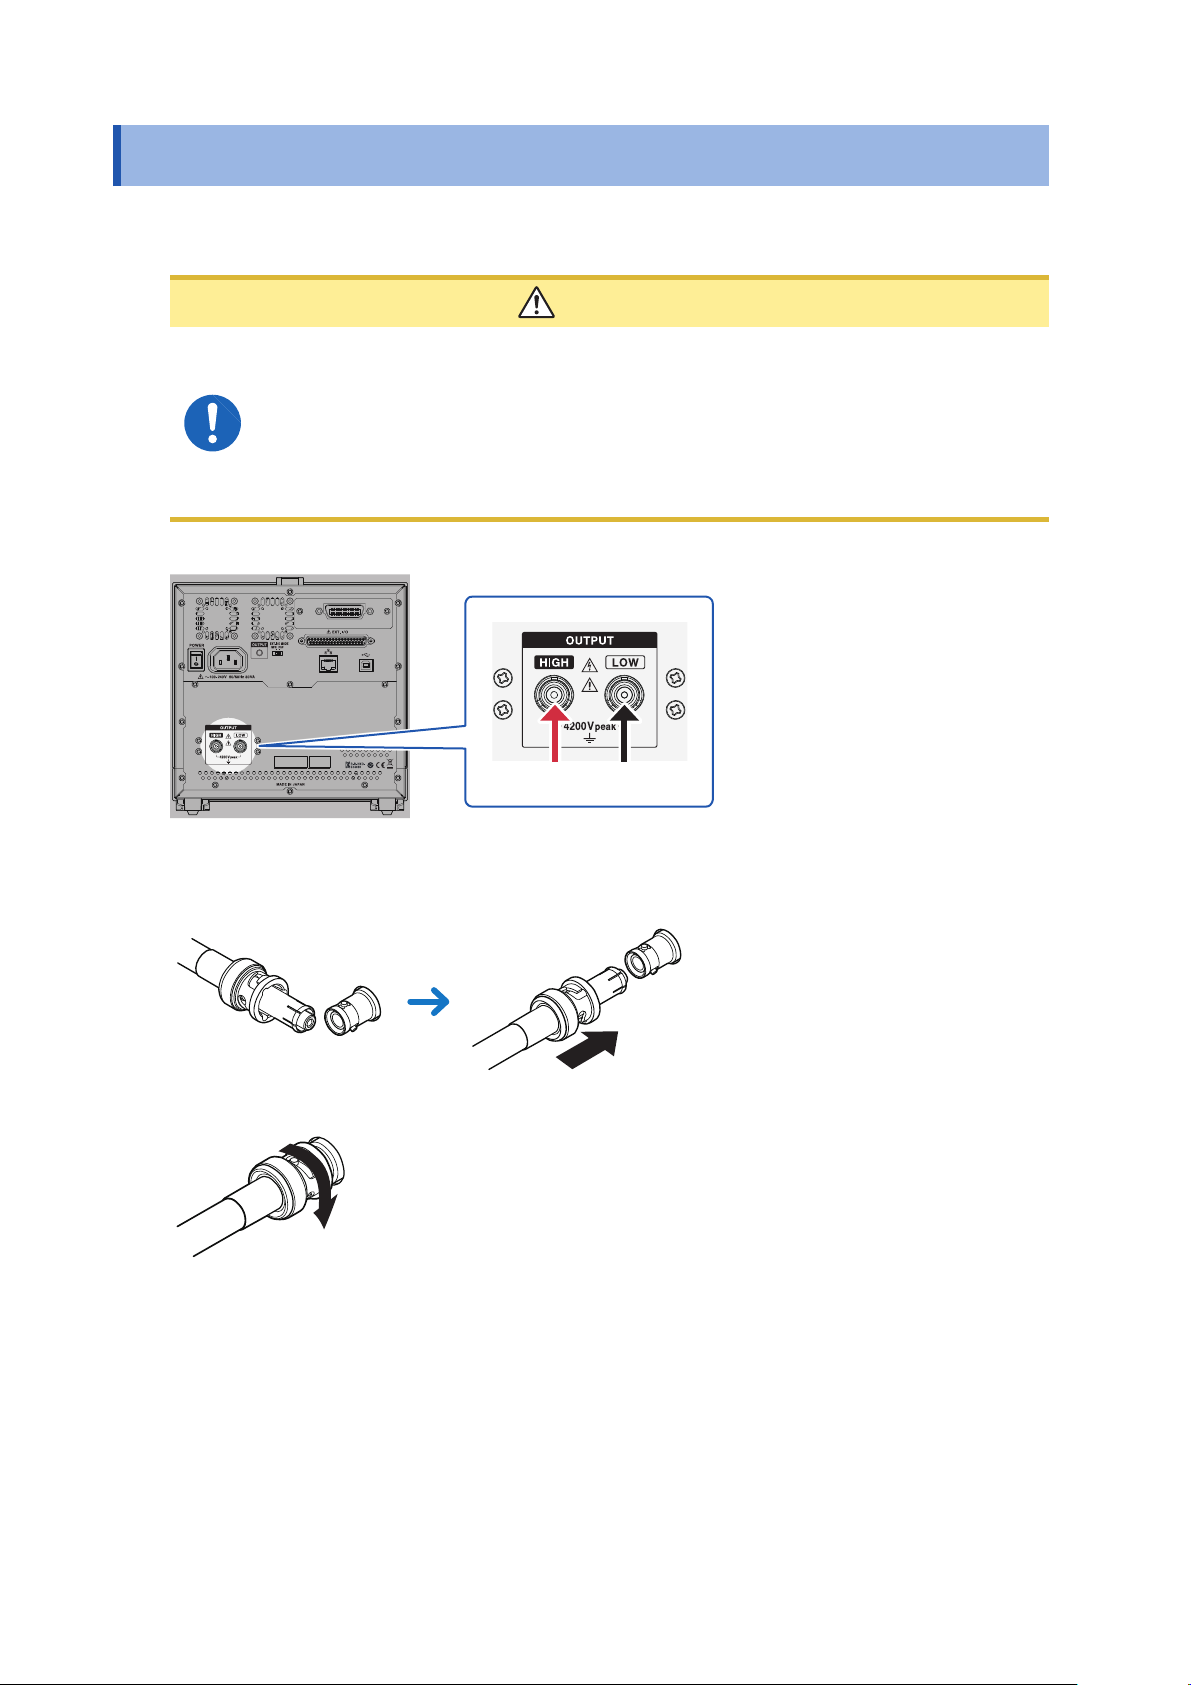
Connecting the Test Lead (on the ST4030)
2.1 Connecting the Test Lead (on the ST4030)
Connect the test lead to the voltage output terminal on the instrument.
CAUTION
• To prevent damage to the coaxial connectors or joint, make sure to unlock rst, and
grasp the coaxial connector and pull it out.
• Model L2250 Clip Type Lead’s maximum rated voltage is 3300 V AC peak. To test
higher voltages, use the L2252 Unprocessed Lead Cable.
• Model L2252 requires customer modication. To prevent electric shock and equipment
damage when modifying the lead, see “15.10 Precautions when Processing Test
Leads” (p. 237).
Red Black
Rear
Align the groove on the test lead’s coaxial cable to the lock pin on the voltage output
1
terminal on the ST4030 side and insert.
Rotate the coaxial connector on the test lead to the right to lock it.
2
When removing, rotate the coaxial connector on the connection cable to the left and then pull out.
14
Connecting the Power Cord
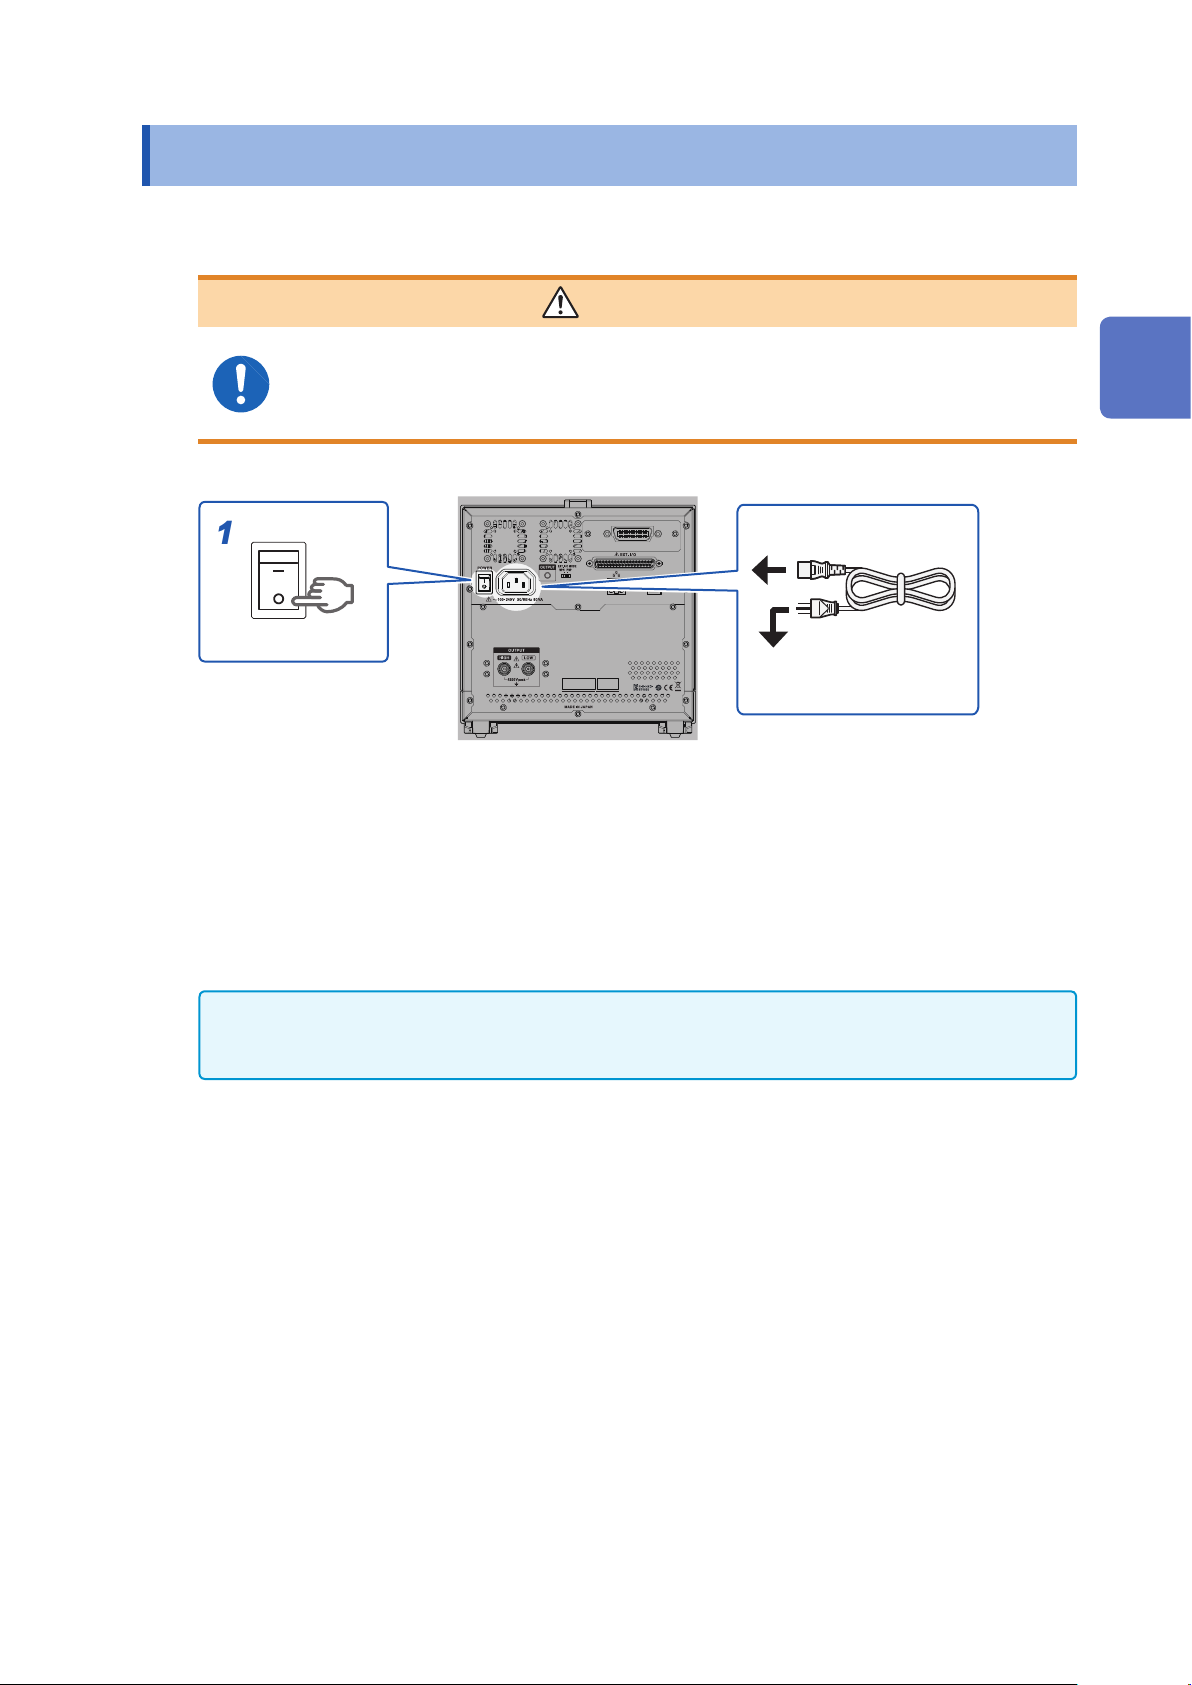
2.2 Connecting the Power Cord
To supply power to the instrument, connect the power cord to the power supply inlet on the rear of
the instrument.
WARNING
Before turning on the power supply, check that the power supply voltage described on
the power supply connector on the instrument and the power supply voltage to be used
match each other. Using outside the range of the designated power supply voltage may
cause damage and electrical malfunction to the instrument.
2
Preparation for Measurements
1
OFF
Rear
Turn OFF the main power supply switch on the rear of the instrument.
1
Connect the power cord to the power inlet.
2
Connect the plug of the power cord to the grounded outlet.
3
IMPORTANT
If the power supply is cut off while the main power supply is ON (by a breaker tripping, etc.), the instrument
will start automatically when the power is supplied again.
2
To grounded outlet
3
15
Power Supply ON/OFF
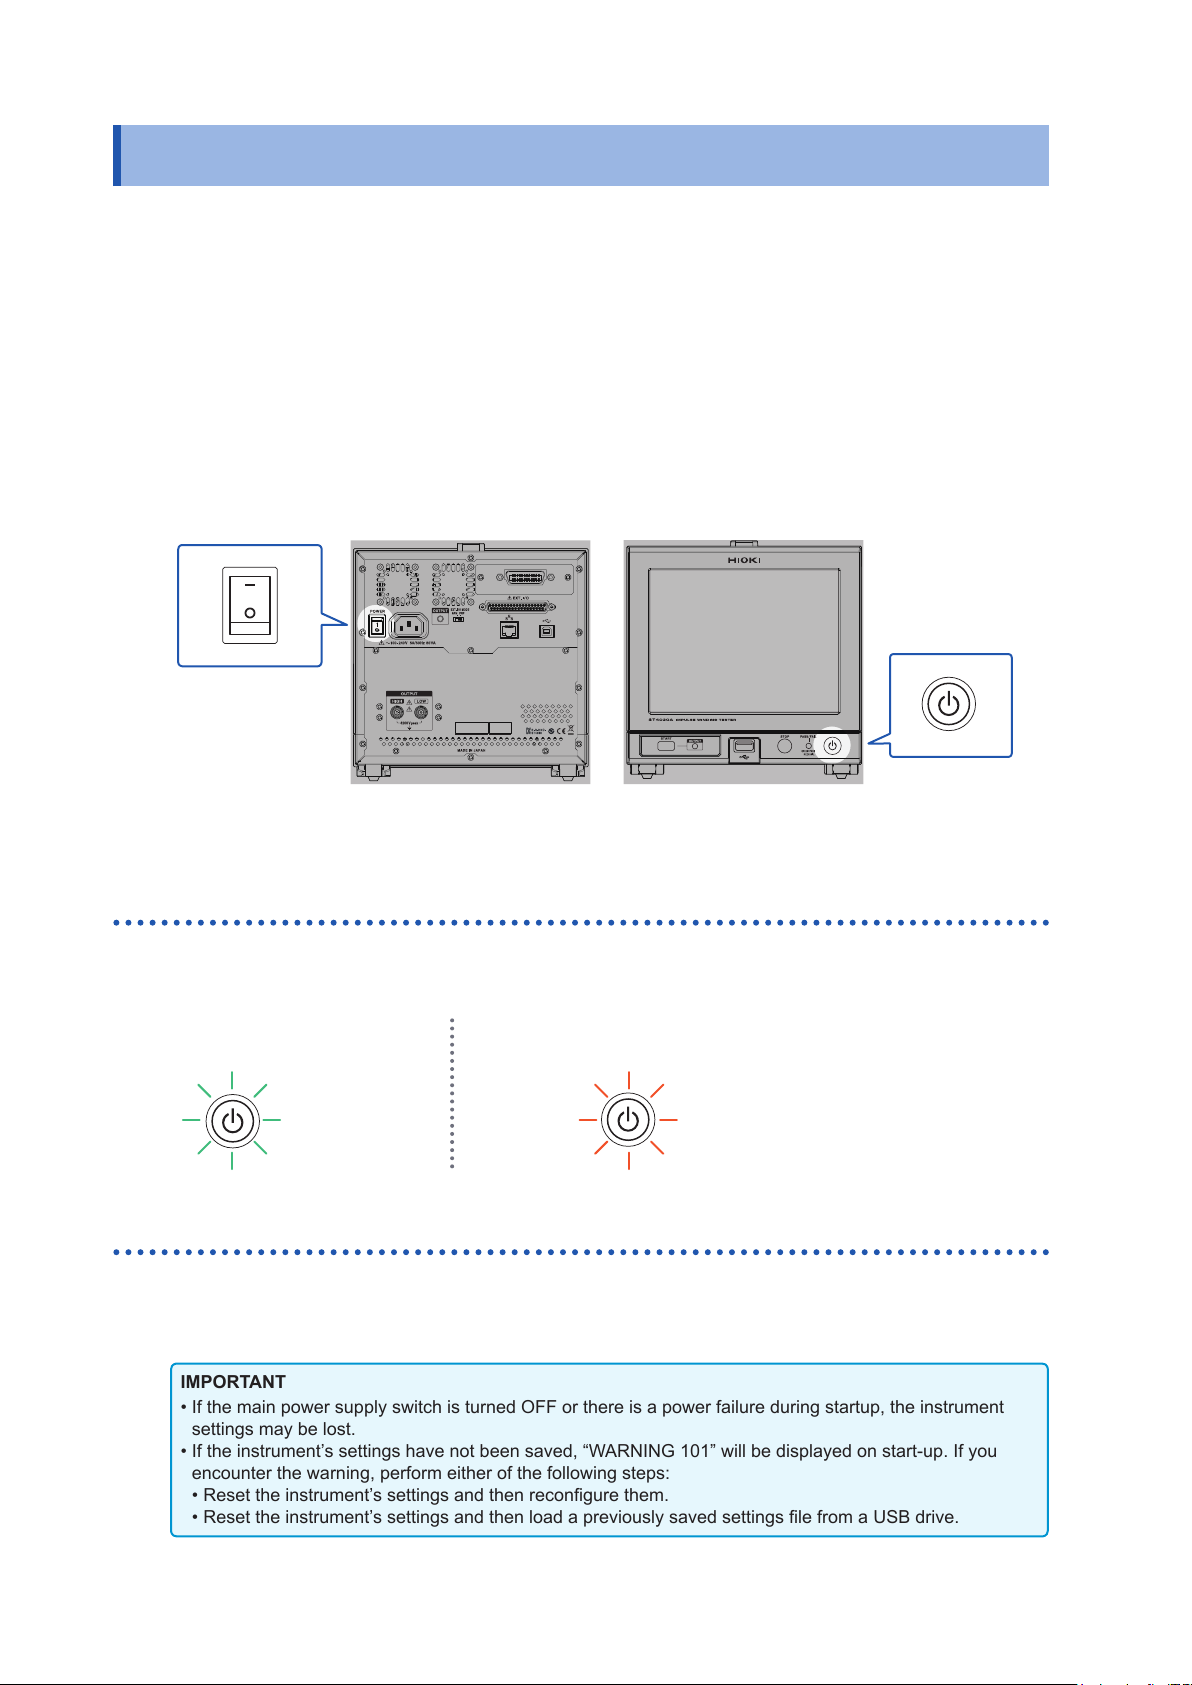
IMPORTANT
• If the main power supply switch is turned OFF or there is a power failure during startup, the instrument
settings may be lost.
• If the instrument’s settings have not been saved, “WARNING 101” will be displayed on start-up. If you
encounter the warning, perform either of the following steps:
• Reset the instrument’s settings and then recongure them.
• Reset the instrument’s settings and then load a previously saved settings le from a USB drive.
2.3 Power Supply ON/OFF
Turn ON the main power supply on the rear of the instrument beforehand to enable turning ON and
OFF the power supply using the startup button on the front. This is convenient if incorporating the
instrument into an automated machine or assembly line.
If the main power supply is turned OFF while the instrument is in sleep mode and then turned ON
again, the instrument will start in sleep mode.
• Using the startup button in sleep mode will hold the instrument settings even if the main power
supply switch is turned OFF (backup).
• If the instrument was not used for a long time, it is necessary to charge the internal backup
battery. Turning ON the instrument’s main power supply will charge the internal battery. Charge
for a minimum of 3 hours, although 24 hours is recommended.
Main power supply
switch
Main power supply ON
Turn ON the main power supply switch.
The startup button lamp will turn on.
Startup mode
Lit green
Main power supply OFF
Startup button
Rear Front
Sleep mode
Lit red
Turn OFF the main power supply switch.
The startup button lamp will turn off.
16
Power Supply ON/OFF
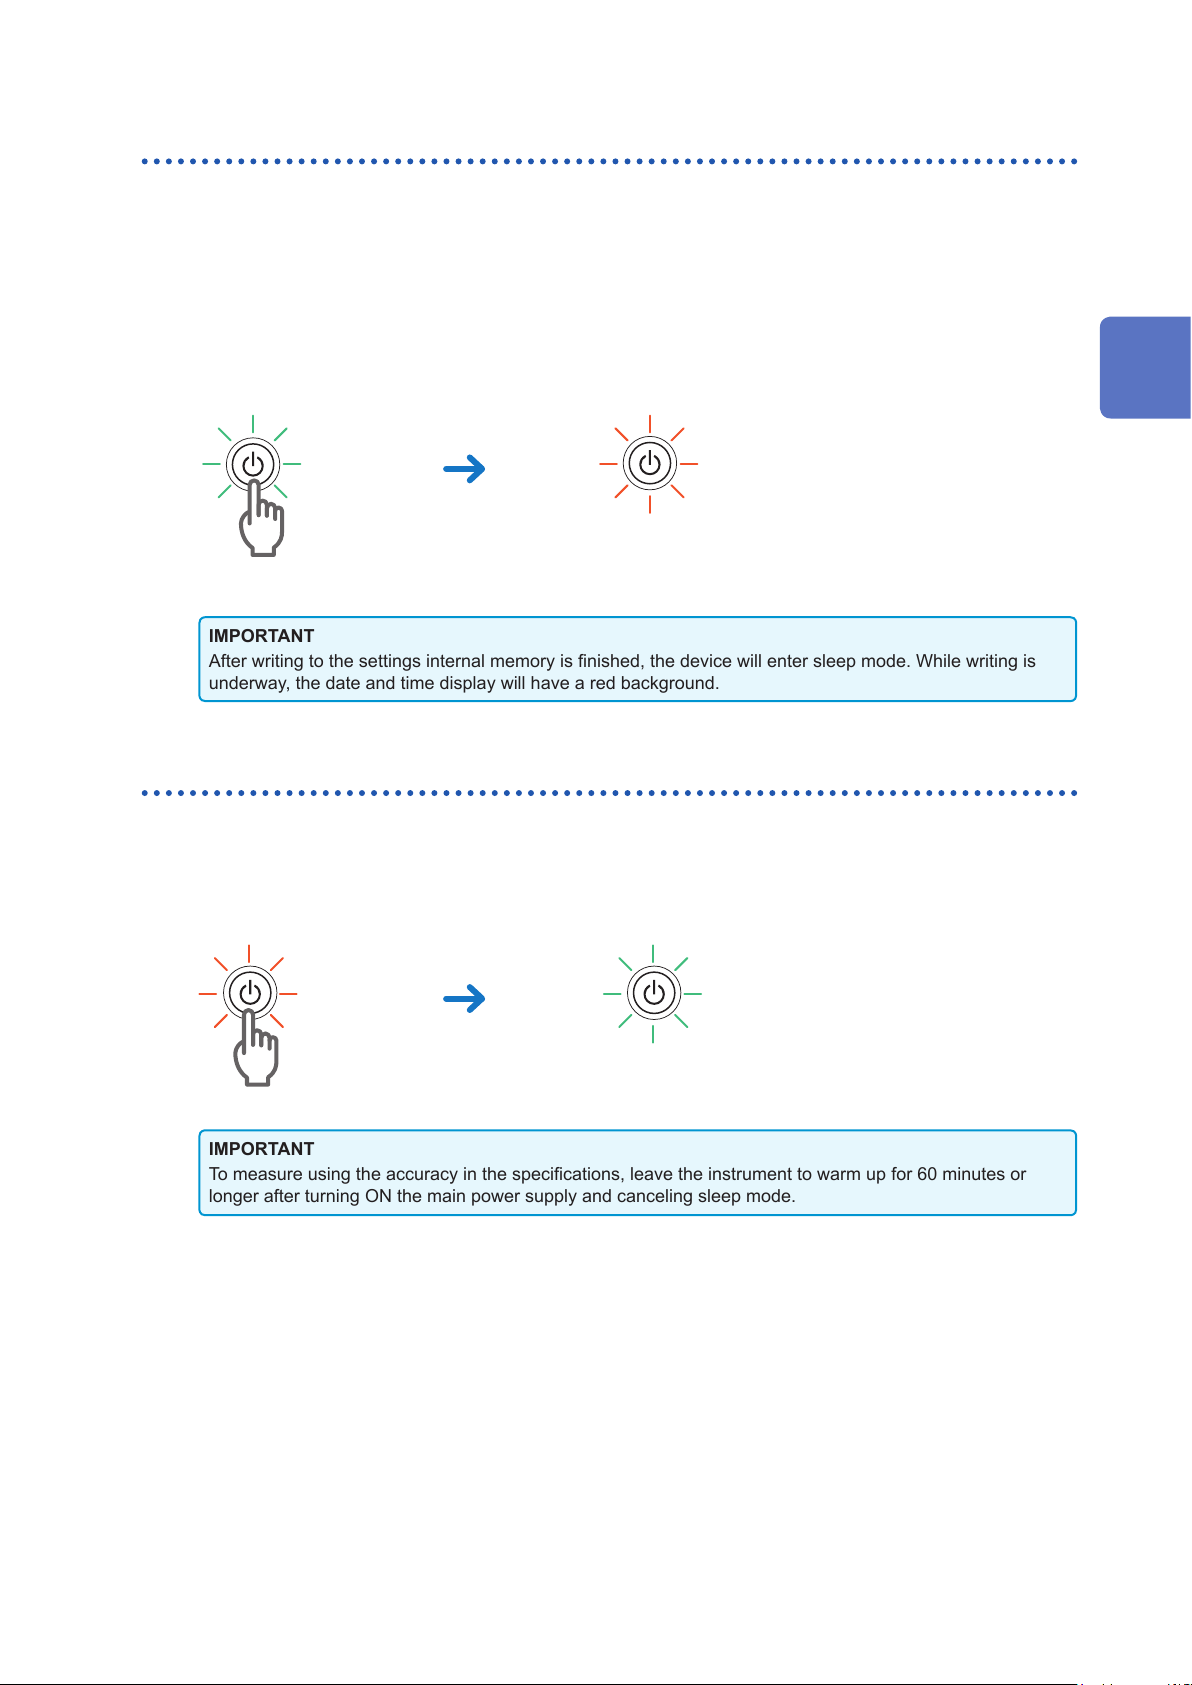
IMPORTANT
After writing to the settings internal memory is nished, the device will enter sleep mode. While writing is
underway, the date and time display will have a red background.
IMPORTANT
To measure using the accuracy in the specications, leave the instrument to warm up for 60 minutes or
longer after turning ON the main power supply and canceling sleep mode.
Sleep mode
This is the mode in which the device power supply is OFF.
Only the circuit that turns on the startup button lamp is operating.
With the main power supply switch turned ON, press and hold the startup button for approx.
2 sec.
The startup button lamp will turn red and the instrument will enter sleep mode.
Startup mode Sleep mode
Lit green Lit red
Approx. 2 sec.
Startup mode
Press the startup button when the instrument is in sleep mode.
The startup button lamp will turn green and the instrument will enter startup mode.
Sleep mode
Startup mode
2
Preparation for Measurements
Lit red
Lit green
17
Select Measuring Mode
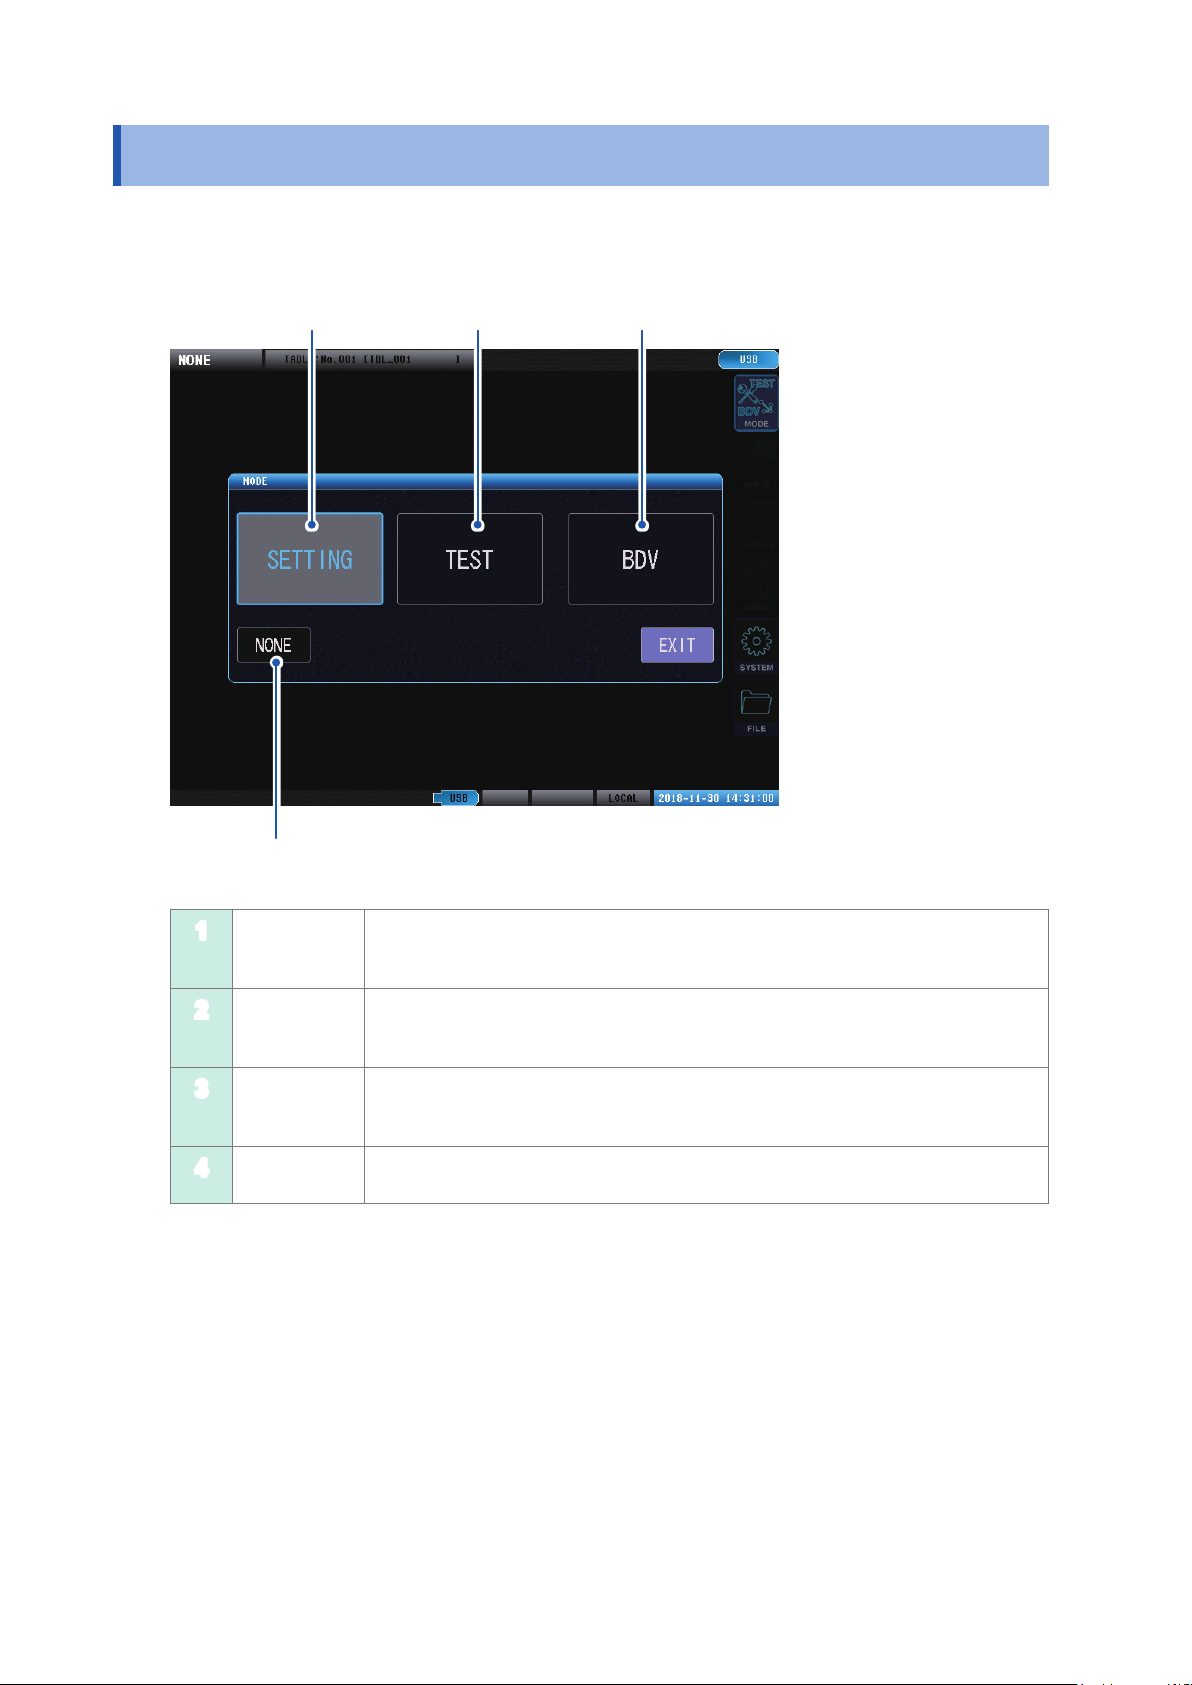
2.4 Select Measuring Mode
Tap [MODE] in the measurement screen to display the measuring mode selection window. Choose
from 4 types of measuring mode.
1 2 3
4
[SETTING] Test conditions settings mode
1
2
3
4
[TEST] Test mode
[BDV] Break down voltage test (BDV) mode
[NONE] Voltage application disabled mode
Sets the test conditions, sets the judgment conditions, and acquire the master
waveforms.
Calls the test conditions that have been set using test conditions settings mode, and
to test objects.
Tests the impedance while gradually increasing the voltage applied to the workpiece
to determine the break down voltage.
It is not possible to output from the instrument for safety reasons.
18
Inspecting before Measurement and Verifying Operations
2.5 Inspecting before Measurement and Verifying
Operations
Inspection
Before using the instrument for the rst time, verify that it operates normally to ensure that no
damage occurred during storage or shipping. If you nd any damage, contact your authorized Hioki
distributor or reseller.
Is the sheath of the cable
1
normal without any damage or
exposed metal part?
Not exposed
Is the instrument normal
2
without any damage?
Exposed
Damaged
This may cause electric shock or short circuit,
so replace with an undamaged cable.
Contact your authorized Hioki distributor or
reseller.
Send for repairs.
2
Preparation for Measurements
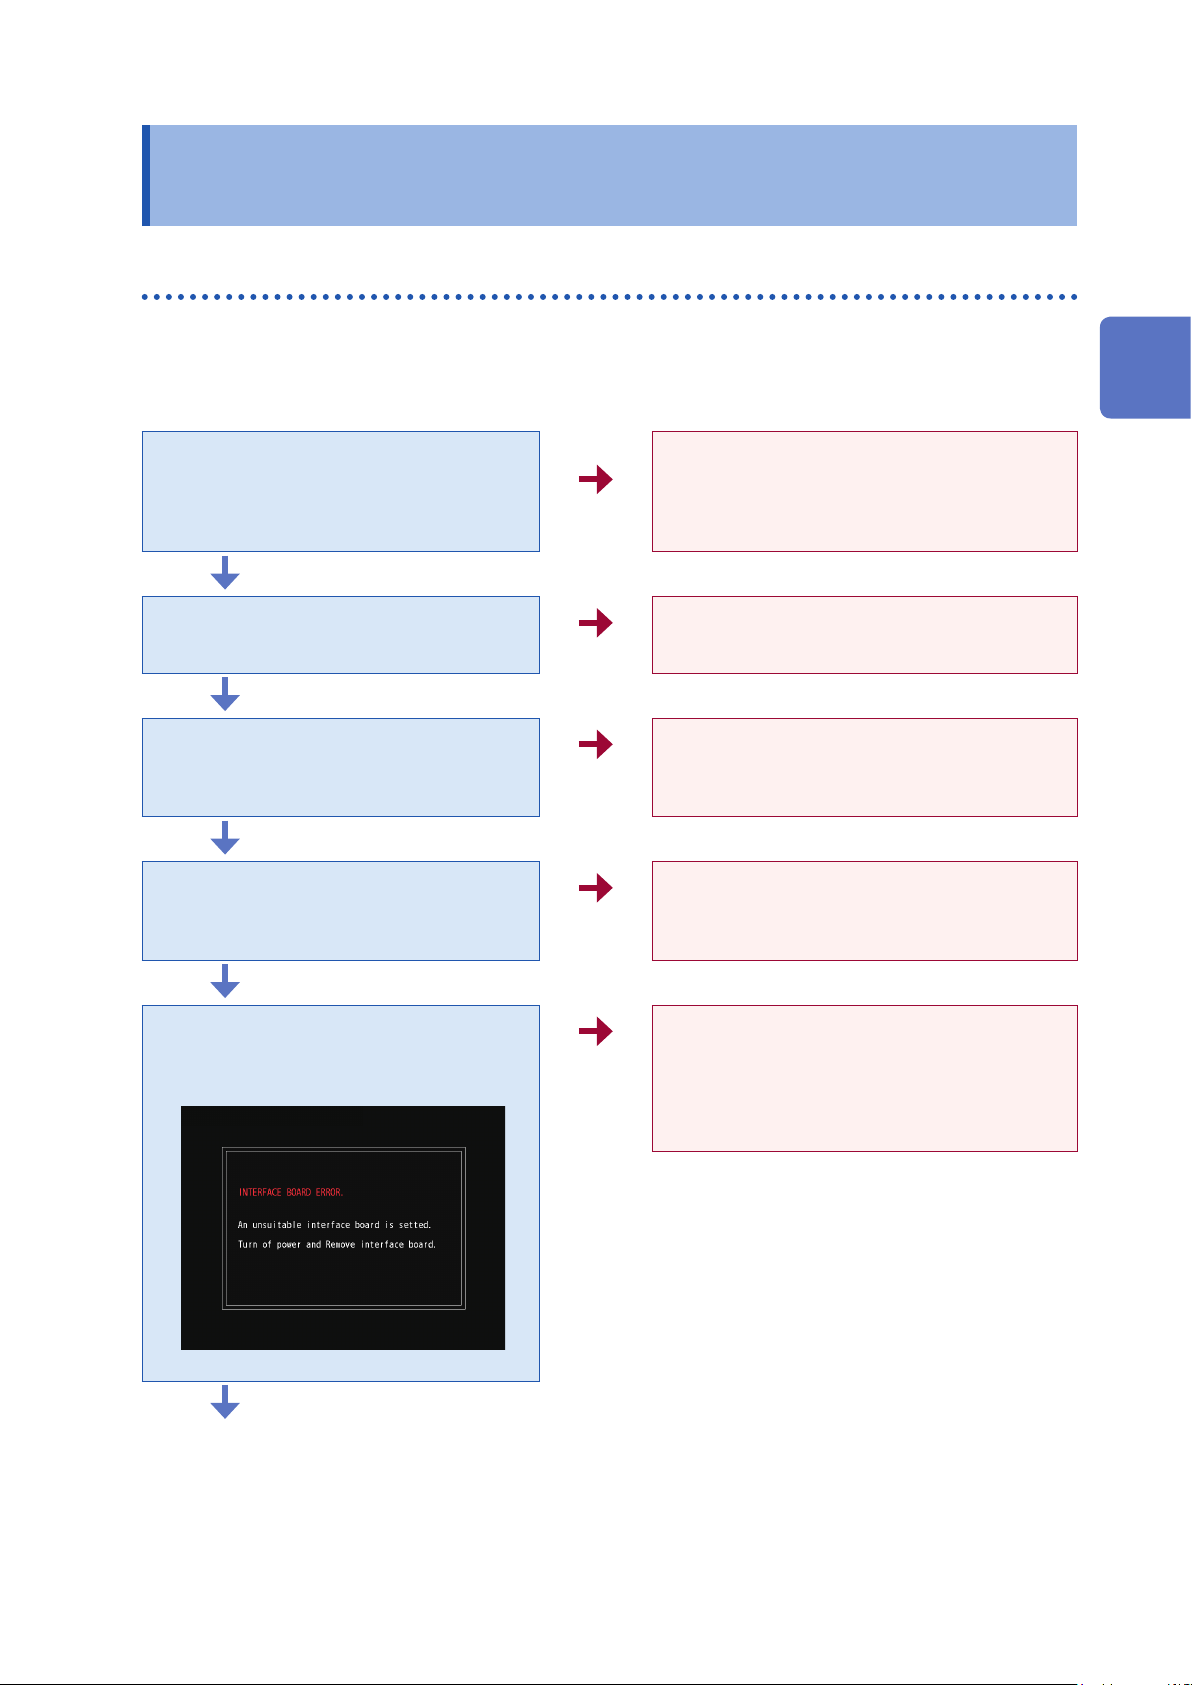
Not damaged
When the main power supply
3
is ON, is the startup button
lamp either green or red?
Lamp is ON
When the startup button is ON,
4
is the opening screen (model
name and version) displayed?
Displayed
After the opening screen is
5
displayed, is the interface
board error screen displayed?
Lamp is
OFF
Not
displayed
Displayed
Send for repairs.
There is a risk of a broken wire in the power
cord, or of a malfunction in the instrument.
Send for repairs.
There is a risk of a malfunction in the device.
Turn OFF the power supply, remove the
interface board, and turn ON the power
supply again.
Z3002 LAN Interface boards cannot be used
with this instrument.
Not displayed
Inspection is complete.
19
Inspecting before Measurement and Verifying Operations
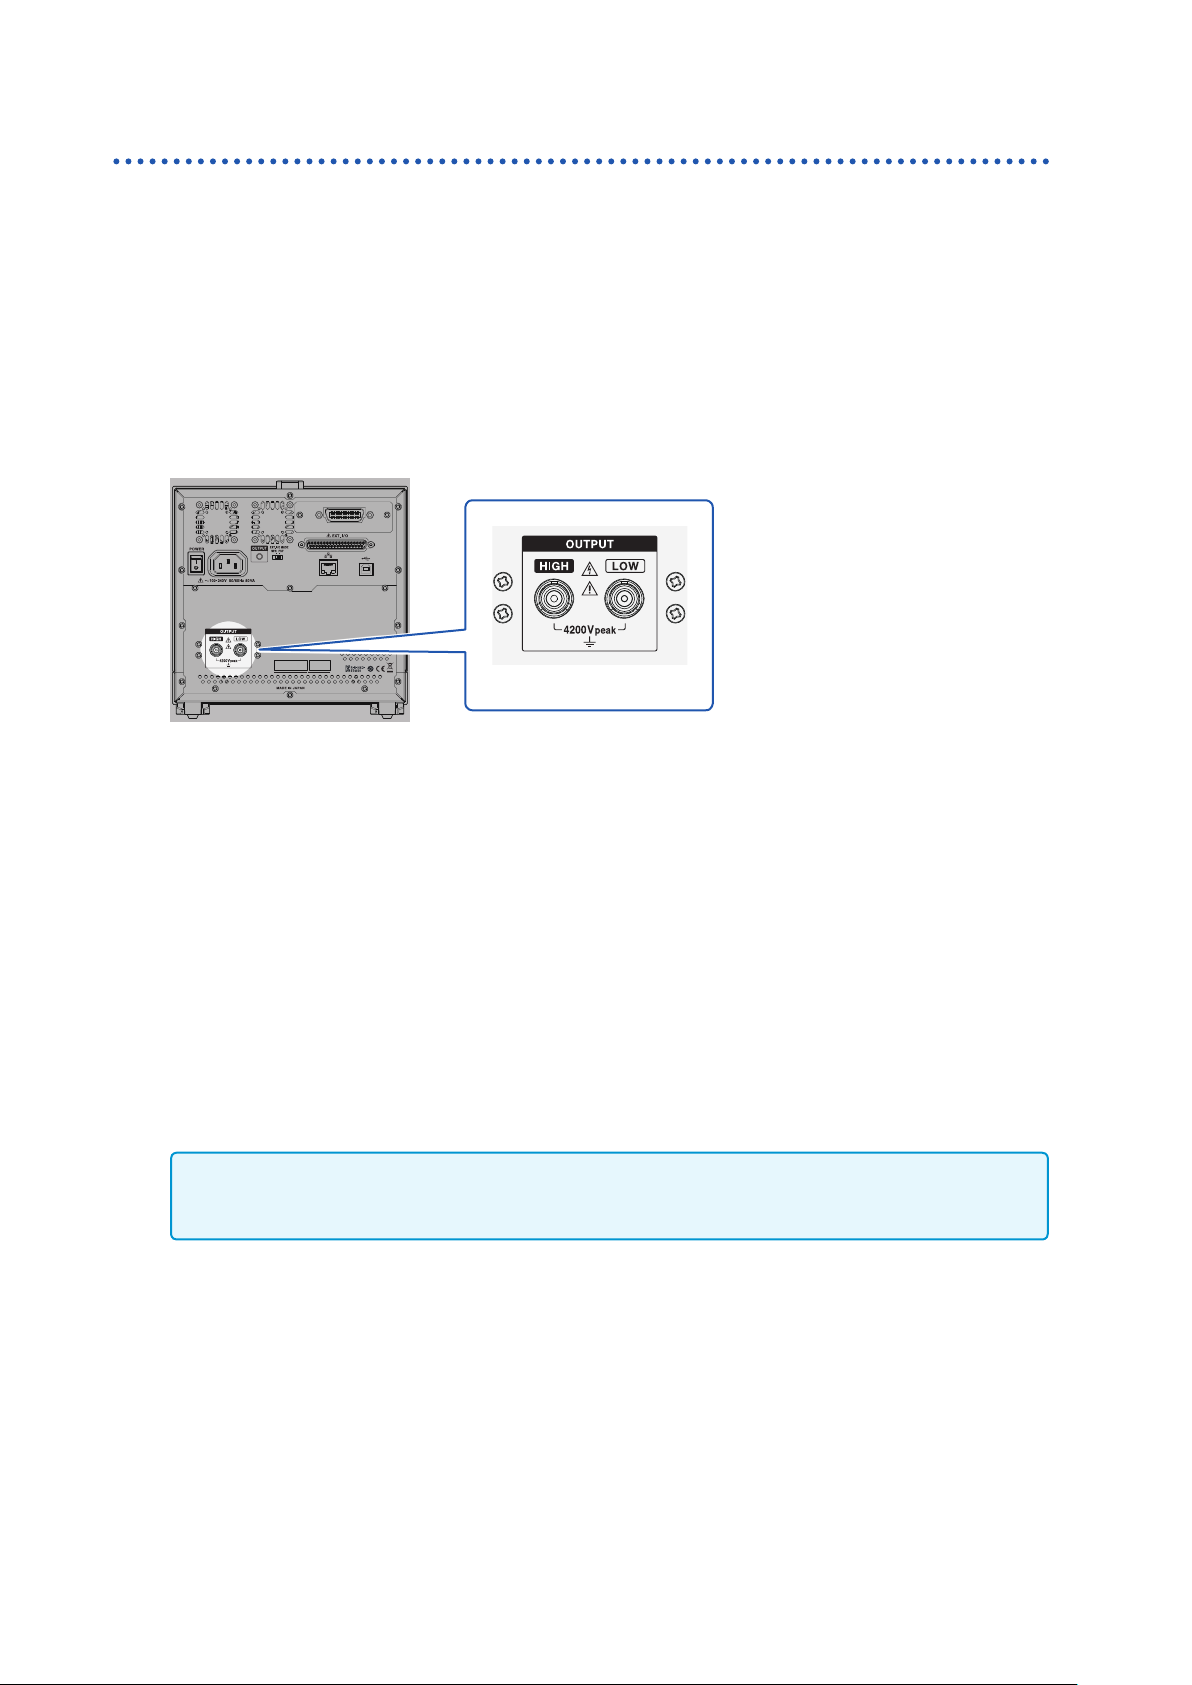
Checking the voltage generated
Check that operations are at an environmental temperature of 23C±5C, and that the humidity is
80% RH or less.
Select an empty table to which nothing has been saved in the test conditions settings mode.
1
Set the applied voltage to 100 V, the sampling frequency to 200 MHz, the number of sampling
2
data to 1001, and the number of pulses to be applied to 1.
Implement the tests with nothing connected to the voltage output terminal.
3
(Illustration below is ST4030A)
(Nothing is connected)
Rear
Check that the peak voltage (value displayed on the instrument) is 100 V ±2%.
4
Change the voltage setting.
5
ST4030: 3300 V
ST4030A: 4200 V
Implement the test with nothing connected to the voltage output terminal.
6
Check that the peak voltage (value displayed on the instrument) is below.
7
ST4030: 3300 V±2%
ST4030A: 4200 V±2%
IMPORTANT
Contact your authorized Hioki distributor or reseller if the peak voltage differs from the set voltage by 2% or
greater.
20

Inspecting before Measurement and Verifying Operations
Checking the impulse response waveforms
Implement impulse testing on the inspection master workpiece to check that there are no
abnormalities in the instrument or equipment. Set the test conditions according to the workpiece.
Tools to be prepared
Master workpiece (a workpiece close to the mass production master workpiece, or a coil of approx.
1 mH created using reinforced insulation wire)
Calibrate the voltage of the master workpiece beforehand and record the master waveform.
Connect the master workpiece to the test lead.
1
Select the table to which the master waveform was saved in test mode.
2
Implement the test.
3
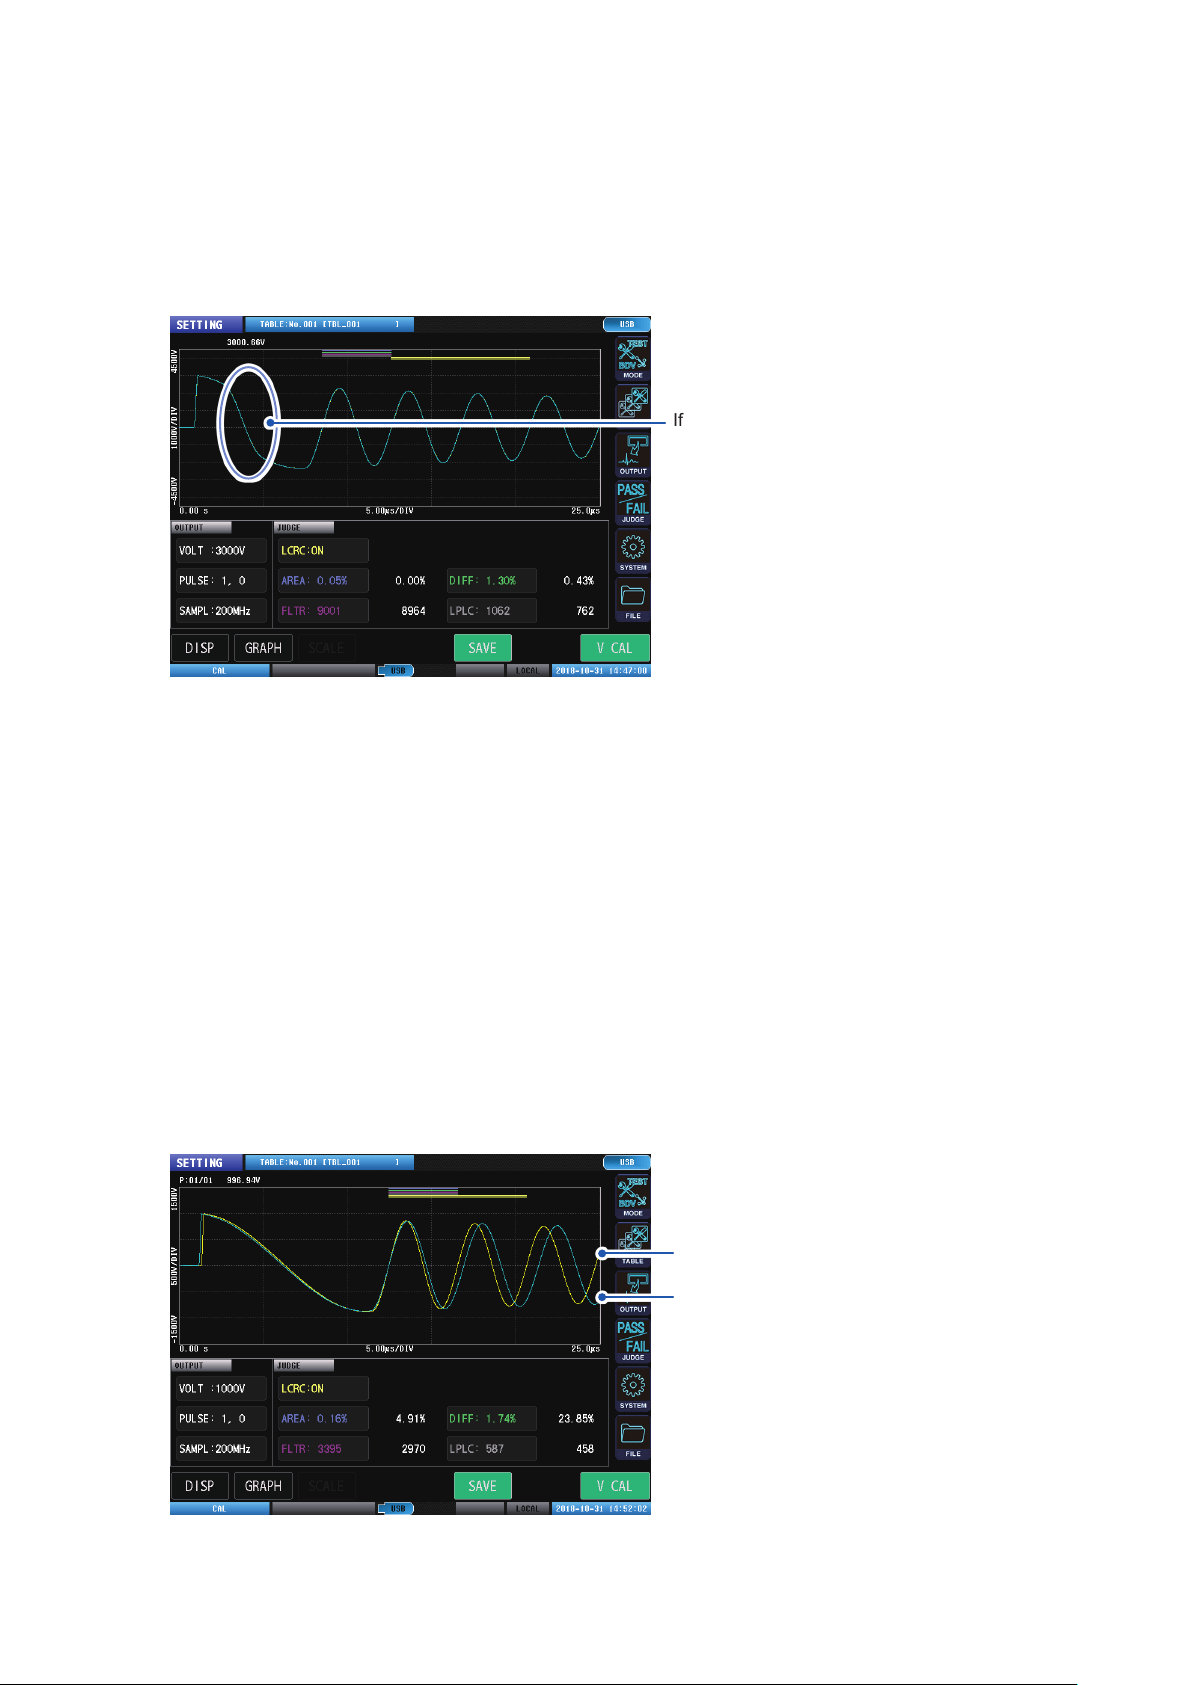
If the waveform shape (peak voltage, zero‑cross point, etc.) changes greatly
(1) Being affected by residual magnetization from the workpiece core.
2
Preparation for Measurements
Apply a degaussing impulse to the workpiece until the waveform stops changing.
You can see how waveforms diverge by turning
on waveform superposition and repeating the
test multiple times.
Reference: “Overlay settings” (p.
112)
21
Inspecting before Measurement and Verifying Operations
(2) Waveform reproducibility is poor.
Periods of magnetic saturation reduces the workpiece inductance, so the vibration frequency of the
response waveform increases (i.e., inclination is more sudden).
The waveform may experience major variation when multiple impulse tests are performed on the
same workpiece because of the magnetic characteristics of the core.
If the core is magnetically saturated, the
waveform will tilt rapidly.
(3) Being affected by the magnetic anisotropy of the workpiece core.
The characteristics of the magnetic materials may depend on its orientation. Implement the tests
using the same layout as during the voltage calibration.
(4) The master workpiece has been changed.
Recalibrate the voltages.
Even if the coil and motor have the same model number, if they have different magnetic core
characteristics (varied by lot), there is a risk that the waveform will change due to differences in the
stray capacitance of the workpiece.
(5) The equipment cable or device connected in parallel to the instrument has changed.
The cable capacitance and the parasitic capacitance of the equipment connected in parallel affects
the vibration frequency. Recalibrate the voltages.
Example:
Waveform difference due to cable length when implementing impulse tests on coils with
the same inductance values (1 mH).
If 1.5 m
22
If 3.0 m
Inspecting before Measurement and Verifying Operations
If ringing occurs that did not occur during voltage calibration
(1) Master workpiece is grounded.
When the master workpiece is grounded, ringing may occur due to parasitic components of the
power cord or test lead.
Do not ground the master workpiece.
Th
(2)
e test lead has been extended.
The longer the test lead the more the parasitic capacitance and parasitic inductance increase,
making it easy for ringing to occur.
If the user is processing the test lead themselves, make the lead as short as possible.
If replacing the test lead, recalibrate the voltages.
Ringing
2
Preparation for Measurements
(3) Master workpiece insulation is worn.
Prepare a new master workpiece, and implement voltage calibration.
(4) Test lead insulation is worn.
Prepare a new test lead, and implement voltage calibration.
IMPORTANT
If none of these apply, there is a risk that the instrument is damaged. Contact your authorized Hioki
distributor or reseller.
23

Inspecting before Measurement and Verifying Operations
24

Switching Test Conditions (Table
3
Functions)
3.1 Overview
• The test conditions, judgment conditions, and master waveform are saved to the instrument’s
internal memory as settings tables.
A maximum of 255 settings tables (No. 001 to No. 255) can be created.
• Select a table that creates the master waveform in test conditions settings mode to acquire the
master waveform.
• Select the table to which the master waveform to be used in the test was saved in test mode, and
implement the test.
• Even if the instrument’s power supply is turned OFF, the settings table details will be retained.
Overview of test conditions switching functions
You can save multiple test conditions, judgment conditions, and master waveforms as settings
tables and switch between them as desired.
3
Switching Test Conditions (Table Functions)
Number of settings saved
Retained settings
Switching between settings
tables
Settings table settings
initialization
Settings table name settings
IMPORTANT
Select the table to be used, and change the test conditions and acquire the waveform. Changing the test
conditions and acquiring the waveform will overwrite the previous settings.
255
Test conditions, judgment conditions, and master waveforms
Switch using screen operations, communications, and signal inputs
to external control terminal (EXT.
Restores the settings such as the master waveforms in the settings
tables to their default settings.
Add a user-selected name to each settings table (127 characters
max.)
Default value: TBL_XX (XX is the table number)
I/O).
25

Overview
Items that can be saved
The following items can be saved to settings tables.
Test conditions settings
VOLT Applied voltage
PULSE No. of applied pulses, No. of degaussing pulses, min. interval between pulse outputs
SAMPLING Sampling frequency, No. of sampling data
DELAY Trigger delay
Judgment conditions settings
LCRC AREA LC and RC values judgments
DISCHARGE*
AREA Waveform surface area comparison judgment
DIFF-AREA Waveform difference surface area comparison judgments
1
Discharge judgment*
1
FLUTTER Waveform utter detection judgments
LAPLACIAN Waveform secondary differential detection judgments
*1: When incorporating Model ST9000
Master waveform
Master waveform data
26

Overview
Operations owchart in test conditions settings mode and test mode
In test conditions settings mode and test mode, select the table to be used before you move on to
the next operation, by using the operations procedure as shown in the diagram.
Test conditions
settings mode
[SETTING]
Select the table to which to save
the master waveform.
[TABLE]
Set the test conditions.
[OUTPUT]
Enable the judgment conditions to be
used.
[JUDGE]
Calibrate the voltage and import the
master waveform.
[V CAL]
Test mode
[TEST]
Select the table to which the
master waveform to be used
in the tests was saved.
[TABLE]
Implement the test.
Check the test results.
Finish
3
Switching Test Conditions (Table Functions)
Import the master data for the LC and
RC values (When using LC and RC
values judgments).
Set the judgment conditions.
[JUDGE]
Finish
27

Overview
Screen conguration
(Measurement screen) [MODE] > [SETTING] or [TEST] > [TABLE]
1 2 5
3 4
6 7 8 9 10
Current table number
1
Table name
Tables list List of the tables that have been saved.
2
Scroll bar Drag to scroll the table.
3
UP/DOWN buttons Moves up or down the table that is displayed.
4
Table setting description Settings descriptions for the table selected onscreen.
5
[SELECT] Sets the selected table as the current table.
6
[DELETE] Deletes the selected table.
7
[INIT] Initializes the selected table.
8
[RENAME] Changes the name of the selected table.
9
[COPY] [No.xxx] [PASTE] Copies the table that has been created and pastes it to a table
10
4
Number and name of the (current) table that is presently set.
The table in which the characters are light blue is the present table.
Reference: “3.2 Current Table Selection” (p. 29)
Reference: “3.4 Table Deletion” (p. 31)
Reference: “3.3 Table Initialization” (p. 30)
Reference: “3.5 Changing the Table Name” (p. 32)
chosen by the user.
The table selected for copying is displayed as [No. xxx] (with the
characters in yellow).
Reference: “3.6 Table Copying” (p. 33)
28

Current Table Selection
3.2 Current Table Selection
Sets the table used as the test conditions as the current table (i.e., the table to be used from now
on).
(Measurement screen) [MODE] > [SETTING] or [TEST] > [TABLE]
1
2
Tap the table that is to be set as the current table.
1
The table selected will be surrounded by a yellow frame.
Tap [SELECT].
2
The characters in the table selected as the current table will turn light blue.
Test conditions settings mode: Saves the settings and the master waveform to the selected current table.
Test mode: Implements tests using the master waveform in the selected current table.
3
Switching Test Conditions (Table Functions)
29

Table Initialization
3.3 Table Initialization
Restores the settings details of the selected table to their default values. Also deletes the master
waveform.
Reference: “Default settings table” on the application disc
(Measurement screen) [MODE] > [SETTING] > [TABLE]
1
2
Tap the table.
1
Tap [INIT].
2
The conrmation window will be displayed.
Tap [OK].
3
3
30

3.4 Table Deletion
Deletes the settings details from unnecessary tables. After deletion, the [TABLE NAME] is
displayed as [– – –].
(Measurement screen) [MODE] > [SETTING] > [TABLE]
Table Deletion
1
2
Tap the table to be deleted.
1
Tap [DELETE].
2
The conrmation window will be displayed.
Tap [OK].
3
3
Switching Test Conditions (Table Functions)
3
31

Changing the Table Name
3.5 Changing the Table Name
Changes the name of the table saved to the instrument.
(Measurement screen) [MODE] > [SETTING] > [TABLE]
1
2
Tap the table whose name you want to change.
1
Tap [RENAME].
2
Enter the new name of the table.
3
Reference: “Touch keyboard inputs” (p. 11)
32

3.6 Table Copying
You can copy the table that has been created and paste it to your chosen table.
(Measurement screen) [MODE] > [SETTING] > [TABLE]
Table Copying
3
1
3
2
Tap the table to be copied.
1
Tap [COPY].
2
Tap the table to be pasted.
3
Tap [PASTE].
4
The conrmation window will be displayed.
Tap [OK].
5
Switching Test Conditions (Table Functions)
5
4
IMPORTANT
If there is already data in the target table, the source data will be overwritten.
33

Table Copying
34

4
Setting the Test Conditions
4.1 Overview
Use the master workpiece to set the test conditions in order to judge whether or not the workpiece
to be tested is defective.
In test conditions settings mode, set the output conditions and the judgment conditions such as the
pulse to be applied, etc., and acquire the master waveform. You can save up to 255 test conditions
settings in a table.
Operations owchart in test conditions settings mode
In test conditions settings mode, set the output conditions and judgment conditions, and acquire the
master waveform using the operations procedure as shown in the diagram.
Test conditions settings mode
[SETTING]
Select the table to which to save the master waveform.
[TABLE]
4
Setting the Test Conditions
Set the test conditions.
[OUTPUT]
Enable the judgment conditions to be used.
[JUDGE]
Calibrate the voltage and import the master waveform.
[V CAL]
Import the master data for the LC and RC values.
(When using LC and RC values judgments)
Set the judgment conditions.
[JUDGE]
Finish
35

Overview
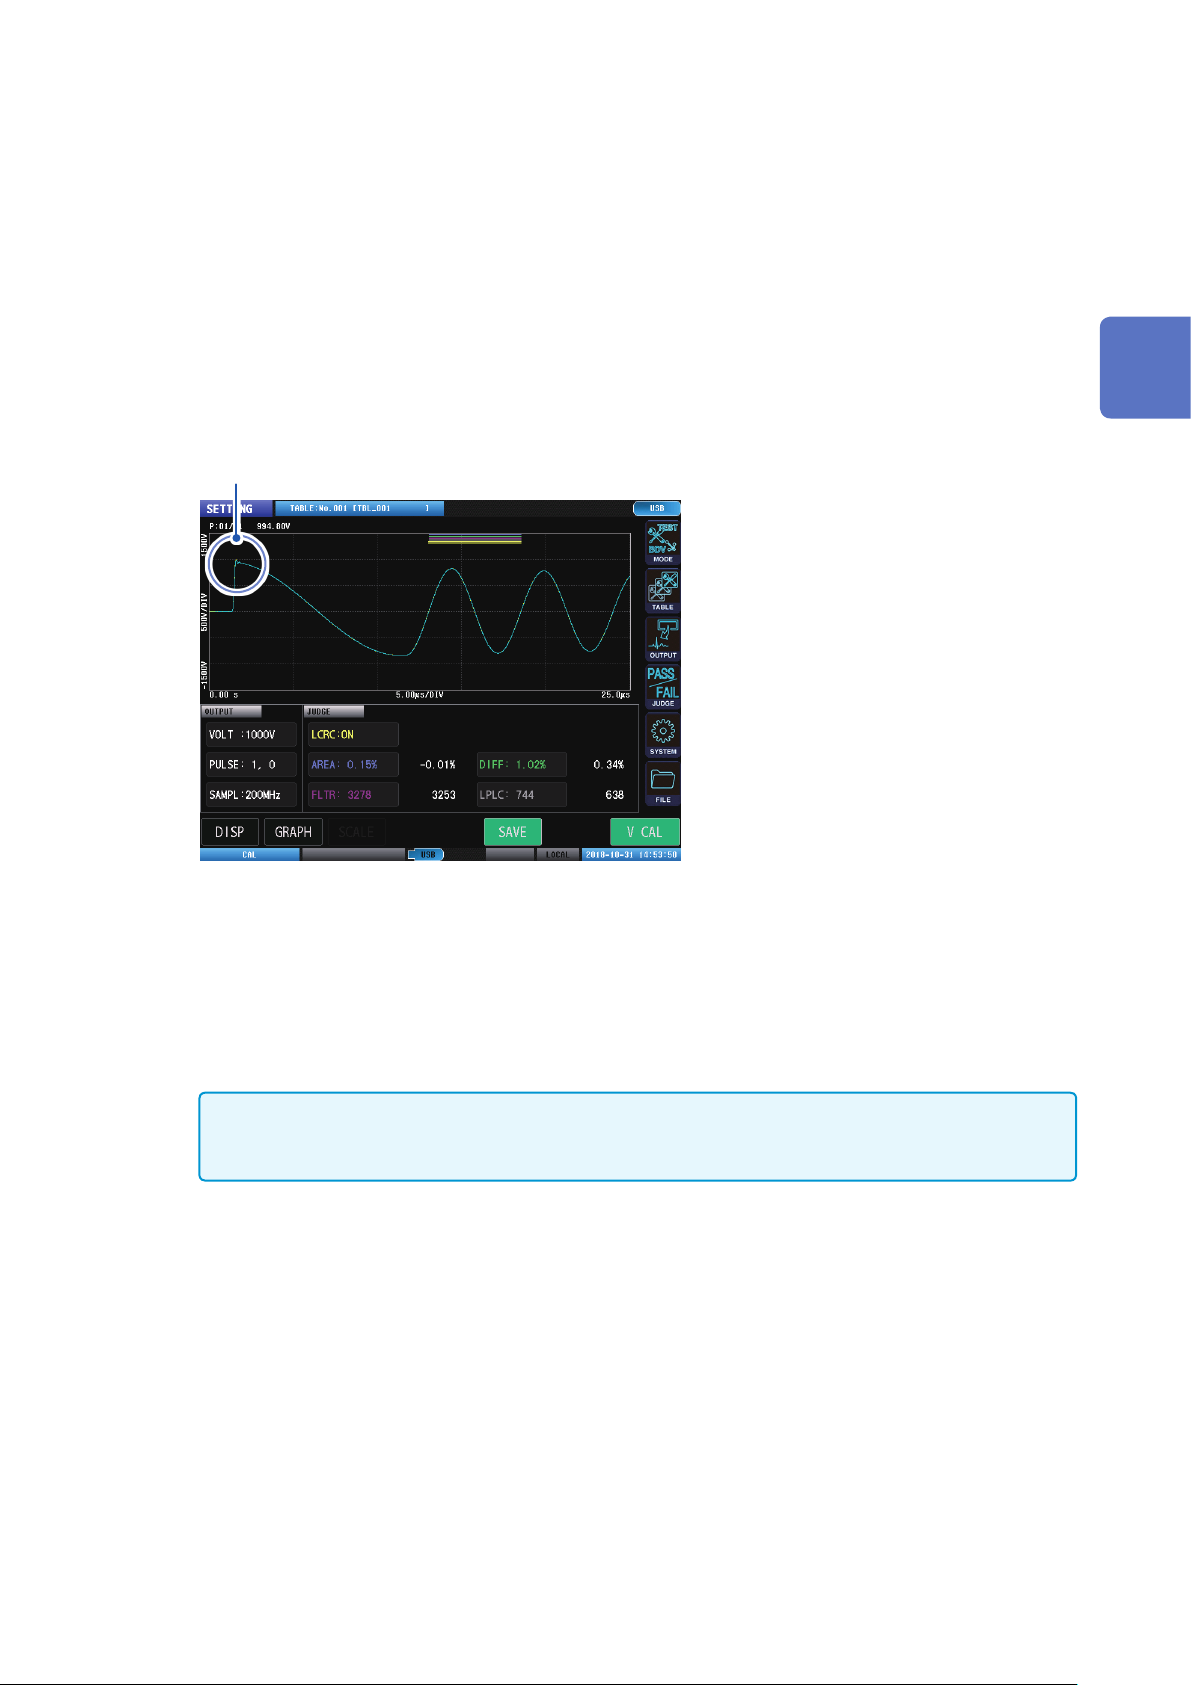
Screen conguration
Measurement screen
1 2
3 5 6 8 9
4 7
Graph display Displays the waveform graph and the LC and RC graph.
1
Menu icons [MODE]: See “2.4 Select Measuring Mode” (p. 18)
2
[DISP] Switches the graph displayed onscreen.
3
Test conditions settings
4
display
[GRAPH] Sets the graph display.
5
[SCALE] Auto-scales the LC and RC graph.
6
Judgment conditions settings
7
display
[SAVE] Saves the test results to USB memory.
8
Reference: “Graph display (display graph switching)” (p.
[TABLE]: See “3.2 Current Table Selection” (p.
[OUTPUT]: See “4 Setting the T
[JUDGE]: See “5 Setting Judgment Conditions” (p.
[SYSTEM]: See “9 System Settings” (p.
[FILE]: See “12 USB Host” (p.
[WAVE]: Waveform graph
[LCRC]: LC and RC graph
[WAVE&LCRC]: Waveform graph + LC and RC graph
Displays the setting for the applied voltage, number of pulses, and
sampling frequency.
Reference: “8.6 Graph Display Settings” (p. 112)
Reference: “LC and RC graph scale settings” (p.
Displays the judgment conditions settings.
Reference: “12 USB Host” (p. 165)
est Conditions” (p. 35)
125)
165)
37)
29)
51)
115)
36
[V CAL] Calibrates the voltages.
9
IMPORTANT
Tap items such as the output conditions settings and the judgment conditions settings to display each
settings window directly.
Reference: “4.6 Voltage Calibration” (p. 49)

Graph display (display graph switching)
Waveform graph display
Displays the waveform graph only.
21 3 54
Overview
4
Number of applied pulses and
1
peak voltage display
Waveform judgment area and
2
LC and RC values operation
range bar
Response waveform Yellow: Master waveform
3
Discharge judgment threshold
4
value bar
Discharge waveform Green dotted line: Discharge judgment threshold value
5
[P:XX/XX]: Number of pulses that have been applied/Total number of
pulses
[xxxV]: Max. peak voltage value of the response waveform
Blue: AREA judgment area
Green: DIFF judgment area
Purple FLUTTER judgment area
Gray: LAPLACIAN judgment area
Yellow (×2): LC and RC value operation areas
Blue: Test waveform
Note: You can change the color of the waveform.
Reference: “8.6 Graph Display Settings” (p.
Displays the discharge judgment threshold value.
Gray: Discharge amount graph (Parts where the discharge amount
exceeds the threshold value are displayed in red)
Note: Displayed only if the Discharge Detection Upgrade is ON.
Reference: “5.4 Discharge Judgments (When Incorporating Model
ST9000)” (p.
72)
Setting the Test Conditions
112)
37

Overview
LC and RC graph display
Displays only the LC and RC graph.
1 2
3
4
5
LC and RC graph Blue (dots): Latest LC and RC values
1
LC and RC cursor values [No.XXX, (XXX)]: Master data number of the cursor values (Total
2
[DELETE] Deletes the master data for the LC and RC values shown by the
3
[DELETE ALL] Deletes the master data for all LC and RC values.
4
[CREATE] Creates the PASS judgment area automatically.
5
IMPORTANT
Tap the LC and RC values on the graph to move the cursor and check each LC and RC value.
Yellow (dots): Imported LC and RC values master data
Gray (solid): LC and RC values PASS judgment area
Note: Dotted colors operate in tandem with the waveform colors.
Also, you can change the color of the waveform.
Reference: “8.6 Graph Display Settings” (p.
number of master data that have been imported)
[LC/RC: xxx]: LC and RC values selected using the cursor
cursor.
Reference: “Importing LC and RC master values” (p. 56)
Reference: “Importing LC and RC master values” (p.
Reference: “Auto creation of the PASS judgment area” (p. 58)
112)
56)
38

Display the waveform graph and the LC and RC graph
Displays the waveform graph and the LC and RC graph simultaneously.
Overview
4
Setting the Test Conditions
39

Overview
Instrument status display and error display
1 2 3
4
Current measurement
1
mode display
Current table display Displays the number and table name of the table presently being used.
2
Communications
3
interface settings display
Voltage calibration status
4
display
Test status display Displays the test status.
5
USB memory status
6
display
Double action status
7
display
Interlock status display
8
Communications status
9
display
Date and time display Displays the date and time that has been set in the instrument.
10
5 6 8 9 10
Displays the settings for the communications interface presently being
used.
Reference: “14.3 Error Display” (p.
Note: The background is displayed in red while writing to the settings
internal memory.
7
(Gray)
(Blue)
(Red)
(No display)
(Green)
(Gray)
(No display)
(Red)
(Gray)
Voltage application disabled mode
Test conditions settings mode
Test mode
BDV mode
Voltage calibration not implemented
(Master waveform not acquired)
Voltage calibration implemented
(Master waveform acquired)
214)
USB memory not connected
USB memory connecting
Accessing USB
Double action function OFF
START button enabled
START button disabled
Interlock function OFF
Interlock engaged
Interlock canceled
Remote status
Local status
40

4.2 Applied Voltage
Sets the peak voltage value of the pulse applied to the workpiece. Inputs can be set either by using
the up and down keys, or be entered using the numeric keypad.
(Measurement screen) [MODE] > [SETTING] > [OUTPUT] > [VOLT]
Applied Voltage
4
1
Set the applied voltage value.
1
Settings range: ST4030: 100 V to 3300 V (resolution: 10 V)
ST4030A: 100 V to 4200 V (resolution:10 V)
C Sets to the default values.
‑KEY Displays the numeric keypad.
10
Increases by 1.
Decreases by 1.
Setting the Test Conditions
41

Number of Applied Pulses
4.3 Number of Applied Pulses
Sets the number of test pulses to be used in the tests and the number of degaussing pulse
applications to eliminate magnetic elds from the workpiece.
Both the test pulses and degaussing pulses continue to be applied until their set number is
reached.
PULSE NUM
(Number of test pulses applied)
DEGAUSS NUM
(Number of degaussing pulses
applied)
PULSE PERIOD
(Pulse application interval)
Sets the number of test pulses to be applied.
When multiple test pulses are applied, each test pulse is judged
individually.
Sets the number of degaussing pulses to be applied.
A degaussing pulse is a pulse that is applied before the test pulses
to remove any residual magnetization from the workpiece.
Degaussing pulse waveforms are not sampled or judged.
Sets the pulse application interval if multiple degaussing pulses and
test pulses are to be applied.
When multiple pulses are applied, the pulse application interval
operates at or above the set time.
Overview of application pulse settings
TRIG EOM
Degaussing pulse
*1
Test pulse
*2
Pulse application interval
*1: Sampling and judgment not implemented
Each pulse is sampled and judged
*2:
*3: If the single pulse test time setting is shorter than the application interval time setting, the set time will wait
before applying the next pulse. If the single pulse test time is longer than the set time, the next pulse is
applied after the previous pulse test has nished.
*3
42

(Measurement screen) [MODE] > [SETTING] > [OUTPUT] > [PULSE]
Number of Applied Pulses
3
1
Set the number of test pulses.
1
Setting range: 1 to 32
C Sets to the default values.
Set the number of degaussing pulses.
2
Setting range: 0 to 10
C Sets to the default values.
Increases by 1.
Decreases by 1.
Increases by 1.
Decreases by 1.
2
4
Setting the Test Conditions
Set the pulse application interval.
3
Setting range: 0.050 s to 1.000 s (resolution 0.001 s)
C Sets to the default values.
10‑KEY Displays the numeric keypad.
Increases by 1.
Decreases by 1.
43

Sampling Frequency/Number of Sampling Data
4.4 Sampling Frequency/Number of Sampling Data
Sets the voltage sampling frequency and the number of sampling data to be imported to the
instrument.
Sets the voltage sampling frequency.
SAMPLING
(Sampling frequency)
RECORD LENGTH
(No. of sampling data)
If a sufciently long response waveform cannot be imported because
the response waveform vibration period is long, you can extend the
length of the waveform being imported by extending the sampling
frequency.
Sets the number of sampling data to be imported to the instrument.
Sets the length of the waveform to be imported, and sets the
sampling frequency. Adjust the number of sampling data so that a
suitable waveform length can be imported for judgment.
AUTO SET
(Automatic settings function for
range of waveform acquisition)
Sampling waveform lengths
Pulse application
area
Imported waveform length when the number of sampling data is 8001 points
Imported waveform length when the number of sampling data is
6001 points
This function automatically adjusts and sets the sampling frequency
and number of sampling data during voltage calibration so that the
waveform acquisition range is optimal.
Self-resonant area
44
Important: Recommended import length of the sampling waveform
Adjust the sampling wavelength so that the vibration waveform of the self-resonant area imports for 4 or
more periods to enable sufcient waveform data to be used by the LC and RC values operations and the
waveform judgment function. Slow the sampling frequency to lengthen the waveform to be imported.

Sampling Frequency/Number of Sampling Data
(Measurement screen) [MODE] > [SETTING] > [OUTPUT] > [SAMPLING]
1
2
4
Set the sampling frequency.
1
Setting range: 10 MHz, 20 MHz, 50 MHz, 100 MHz, 200 MHz
Set the number of sampling data.
2
Setting range: 1001 points to 8001 points (resolution: 1000 points)
Slows the sampling frequency.
Accelerates the sampling frequency.
Decreases by 1000.
Increases by 1000.
Setting the Test Conditions
45

Sampling Frequency/Number of Sampling Data
Automatic settings for range of waveform acquisition
You can automatically adjust and set the sampling frequency and number of sampling data during
voltage calibration so that the waveform acquisition range is optimal.
(Measurement screen) [MODE] > [SETTING] > [OUTPUT] > [SAMPLING]
1
Tap [AUTO SET].
1
46

Trigger Delay
4.5 Trigger Delay
Sets the delay time (trigger delay) from the start of measuring to the application of the rst pulse.
If using this function, you can start measuring after the workpiece connection status has stabilized
even if trigger timing and probing timing are the same when combined in the equipment.
Trigger delay
4
Trigger
(Measurement start)
IMPORTANT
The OUTPUT lamp is synced to the EOM signals and so turns on even if the trigger is delayed.
Pulse application
Setting the Test Conditions
47

Trigger Delay
(Measurement screen) [MODE] > [SETTING] > [OUTPUT] > [DELAY]
1
Set the trigger delay.
1
Setting range: 0.000 s to 9.999 s (resolution: 0.001 s)
C Sets to the default values.
‑KEY Displays the numeric keypad.
10
Increases by 1.
Decreases by 1.
48

4.6 Voltage Calibration
Calibrates the voltages after the test conditions settings are nished.
Voltage calibration adjusts the output voltage so that the set voltage is applied to the workpiece,
and then imports the master waveform using the output voltage after making the adjustments.
Items implemented using voltage calibration
Gradually raise and adjust the output voltage so that the max. peak
Output voltage calibration
voltage of the response waveform is the same as the set voltage
value.
Voltage Calibration
Automatically sets the
sampling frequency and
number of sampling data
LC and RC values operation
range settings
Importing basic data for
discharge judgments
Auto settings for the judgment
range and judgment standards
for each waveform judgment
Importing master waveform
Implemented when the auto setting for the waveform acquisition
range is ON.
Implemented when the ST9000 Discharge Detection Upgrade is
enabled.
Implemented when the auto settings for waveform judgment areas
and judgment threshold values are ON.
Calibrating output voltages
The max. peak voltage of the response waveform is repeatedly compared to the pulse application,
max. peak voltage, and set voltage values while gradually increasing the set voltage value and the
output voltage.
4
Setting the Test Conditions
Max. peak voltage
Even if the response waveform max. peak voltage is outside the primary peak, adjust so that the
max. peak voltage value is the same as the set voltage value.
49

Voltage Calibration
(Measurement screen) [MODE] > [SETTING] > [OUTPUT]
2
3
1
Tap [V CAL].
1
The settings window will open.
Select the calibration type.
2
TYPE1 If the instrument determines that the entire workpiece response waveform can be measured
using more appropriate settings by adjusting the sampling frequency and sampling data count,
either “INFORMATION 1021” or “INFORMATION 1022” will be displayed.
If the set voltage is not applied, “WARNING 104” will be displayed.
TYPE2 The above information will not be displayed.
Tap [YES].
3
Voltage calibration starts.
When importing the master waveform has nished after the voltage calibration has nished, the icon at the
bottom left of the screen will change from [UNCAL] (red) to [CAL] (blue).
Reference: See “14.3 Error Display” (p. 214).
50

5
Setting Judgment Conditions
5.1 Overview
Applies a set impulse voltage using voltage calibration to the workpiece to be tested, and compares
the response waveform, LC and RC values, and discharge composition amount to the master
workpiece data to judge whether or not the workpiece being tested conforms to quality.
LC and RC values judgments
Judgment types
The following three types of judgment are available.
LC and RC values judgments
Waveform judgments
Waveform judgments
“LC and RC Values Area Judgments [LCRC AREA]” (p. 53)
“Surface area comparison judgments [AREA]” (p. 62)
“Differential surface area comparison judgments [DIFF AREA]”
(p. 64)
“Flutter detection judgments [FLUTTER]” (p. 66)
“Secondary differential detection judgments [LAPLACIAN]”
(p.
69)
Discharge judgments
5
Setting Judgment Conditions
Discharge judgments (When
incorporating ST9000)
“Discharge judgment methods [DISCHARGE]” (p. 73)
51

Overview
Settings operations procedure
Imports the master workpiece waveform as the master waveform, and sets the threshold values for
each judgment function from the master waveform.
Turns ON the [ENABLE] settings for the
Test conditions
settings mode
[SETTING]
Select the table to which to save
the master waveform.
[TABLE]
Set the test conditions.
[OUTPUT]
Enable the judgment conditions
to be used.
[JUDGE]
Calibrate the voltage and import the
master waveform.
[V CAL]
Imports the master data for the LC
and RC values and creates the PASS
judgment area.
(When using LC and RC values
judgments)
Set the judgment conditions.
[JUDGE]
Finish
1
judgment functions to be used. (p. 55)
• [JUDGE] > Use the judgment functions tab to turn ON
the [ENABLE] setting for the judgment functions to be
used, and to turn OFF the [ENABLE] setting for the
judgment functions that will not be used.
• Turning OFF the judgment functions that will not be
used shortens the test times.
Press START button to implement the impulse
2
tests and import the LC and RC master values
(Implemented multiple times). (p. 56)
• Up to 1024 LC and RC master values max. can be
imported.
• Tap
[SCALE] at the bottom of the screen to
automatically set the LC and RC graph scale values.
• Tap the master values on the LC and RC graph to
move the cursor.
• Tap
[DELETE] alongside the LC and RC graph to
delete the LC and RC master values selected by the
cursor.
• Tap [DELETE ALL] alongside the LC and RC graph
to delete all the imported LC and RC master values.
The PASS judgment area is created
3
automatically from the imported LC and RC
master values. (p. 58)
• Tap [CREATE] alongside the LC and RC graph>
Set the margin for the master values in the
PASS judgment area, and then tap [CREATE] to
automatically create the PASS judgment area.
• The PASS judgment area that has been created is
displayed in a gray square on the LC and RC graph.
Adjust the PASS judgment area manually.
4
(p. 60)
• You can set the PASS judgment area manually using
the [JUDGE] > [LCRC AREA] tab.
You can set the PASS judgment area using the upper
and lower limit values of the LC and RC values when
[HI-LO] is ON.
You can set the PASS judgment area using the LC
and RC values of the rectangle’s zenith when [HI-LO]
is OFF.
• Tap the LC and RC values graph when the [LCRC
AREA] tab is selected to edit the PASS judgment
area directly.
Setting judgment conditions other than LC
5
and RC values judgments.
• [JUDGE] > Set the judgment threshold values in the
judgment functions tab.
52

LC and RC Values Area Judgments [LCRC AREA]
5.2
LC and RC Values Area Judgments [LCRC AREA]
What are LC and RC values?
The equivalence circuit for the impulse tests is viewed as a LCR linear equivalence circuit as shown
in the diagram below, and is the value that was quantied as the 2 parameters of “L*C” value and
“R*C” value using the equivalence circuit and impulse response waveform data.
Impulse response waveforms
: R*C value
R
C
Power
supply
L
: L*C value
5
Setting Judgment Conditions
Impulse Winding Tester Motor
IMPORTANT
The LC and RC values are values approximated from the impulse response waveform. Accurate
equivalence circuit parameter values may be different.
53

LC and RC Values Area Judgments [LCRC AREA]
LC and RC values judgments
Test conditions settings mode
The PASS judgment area is created based on multiple LC and RC values imported from the master
workpiece after voltage calibration has been implemented.
LC and RC graph (Test conditions settings mode)
Yellow dots: Imported LC and RC master
values
Gray: The PASS judgment area that has
been created
Test mode
Judged by whether the LC and RC values of the workpiece being tested are inside the PASS
judgment area that has been created.
LC and RC graph (Test mode)
Blue dots: LC and RC values of workpiece
under test
Gray: PASS judgment area
IMPORTANT
• The LC and RC values judgments function calculates the internal coefcients such as the waveform
operation area of the LC and RC values during voltage calibration. Consequently, make sure to enable the
LC and RC values judgments function before implementing voltage calibration.
• The PASS judgment area created during voltage calibration is set based on the LC and RC values
variation for the conforming workpiece during voltage calibration. If the settings include LC and RC values
variation for the workpiece under test, it is necessary to import the LC and RC master values and create a
P
ASS judgment area, or to adjust the judgment area manually.
• If the measured waveforms lacks the second and subsequent cycles, the LC and RC values will be
calculated using the area that includes the point at which the voltage was applied. In this case, the LC and
RC values will not correspond to the values calculated based on a conventional LCR resonance circuit,
but they can still be used to generate a judgment.
54

LC and RC Values Area Judgments [LCRC AREA]
Enabling the LC and RC values judgments function
(Measurement screen) [MODE] > [SETTING] > [JUDGE] > [LCRC AREA]
1
2
Tap [ENABLE], and turn [ON] the LC and RC values area operation functions.
1
Tap [JUDGE], and turn [ON] the LC and RC values judgments functions.
2
IMPORTANT
If implementing LC and RC values operations only with no judgment, turn ON [ENABLE] and turn OFF
[JUDGE].
5
Setting Judgment Conditions
55

LC and RC Values Area Judgments [LCRC AREA]
Importing LC and RC master values
Implement voltage calibration and import the master waveform before importing multiple LC and
RC values as the master values.
Test while implementing voltage calibration to save the LC and RC values acquired for each test as
master values to the instrument.
• Up to 1024 LC and RC master values max. can be imported.
• LC and RC master values are deleted when the power supply is turned OFF.
Checking and editing imported LC and RC master values
You can check imported LC and RC master values using the cursor. The cursor moves whenever a
LC or RC value is tapped.
• Tap [SCALE] at the bottom of the screen to automatically set the LC and RC graph scale values.
• Tap [DELETE] alongside the LC and RC graph to delete the LC and RC master values presently
selected by the cursor.
• Tap [DELETE ALL] alongside the LC and RC graph to delete all the imported LC and RC master
values.
56

LC and RC Values Area Judgments [LCRC AREA]
IMPORTANT
Tap the LC and RC values on the graph to move the cursor and check each LC and RC value.
1
2
3
4
5
LC and RC cursor values [No.XXX]: Master data number of the cursor value.
1
[DELETE] Deletes the master data for the LC and RC values shown by the cursor.
2
[DELETE ALL] Deletes the master data for all LC and RC values.
3
[CREATE] Creates the PASS judgment area automatically.
4
[SCALE] Auto-scales the LC and RC graph.
5
[(XXX)]: Total number of master data that have been imported.
Reference: “Importing LC and RC master values” (p.
Reference: “Importing LC and RC master values” (p.
Reference: “Auto creation of the PASS judgment area” (p.
Reference: “LC and RC graph scale settings” (p.
56)
56)
58)
115)
5
Setting Judgment Conditions
57

LC and RC Values Area Judgments [LCRC AREA]
Auto creation of the PASS judgment area
The PASS judgment area is created automatically from the imported LC and RC master values.
(Measurement screen) [MODE] > [SETTING]
1
2
4
3
Tap [CREATE] (on the measurements screen).
1
Tap [AREA TYPE] to set the shape of the area when the PASS judgment area is created
2
automatically.
HI-LO Creates a rectangular PASS judgment area from the maximum and minimum LC and RC
master values.
Used when the master workpiece’s LC and RC values are distributed in close proximity.
FIT Creates a banded PASS judgment area that covers the LC and RC master values.
Used if the LC and RC values distribution is banded by the rotor position (angle) with a motor
that has been combined with a rotor.
Rectangular PASS judgment area
[HI-LO]
Set the margin when creating the PASS judgment area automatically.
3
[AREA TYPE] [HI-LO] : Adds the result of multiplying the LC and RC average values by the margin rate to the
upper and lower limit values.
[FIT] : Adds the result of multiplying the length of the long and short sides of the banded area
by the margin rate to the outside of the long and short sides, respectively. Since a
value of 100% will cause the original lengths to be added on both sides, the long and
short sides will be 3 times their original length.
Banded PASS judgment area
[FIT]
58

LC and RC Values Area Judgments [LCRC AREA]
Tap [CREATE].
4
The PASS judgment area is created automatically. The PASS judgment area that has been created is
displayed in a gray square on the LC and RC graph.
IMPORTANT
• When the margin is 0%, the distribution of the imported LC and RC master values remain unchanged, and
a PASS judgment area is created for the distribution to act as the PASS judgment area threshold values.
• If the margin rate increases, a PASS judgment area is created so that the P
values are greater than the distribution of the imported LC and RC master values.
ASS judgment area threshold
5
Setting Judgment Conditions
59

LC and RC Values Area Judgments [LCRC AREA]
Manually creating the PASS judgment area
You can set the PASS judgment area manually. You can manually micro-adjust the PASS judgment
area after auto creation.
(Measurement screen) [MODE] > [SETTING] > [JUDGE] > [LCRC AREA]
1
2
Tap [HI-LO] to set the shape of the PASS judgment area.
1
(ON)
(OFF)
IMPORTANT
Adjusts the PASS judgment area directly by tapping the PASS judgment area in the LC and RC graph when
[LCRC AREA] tab is displayed.
(ON):
Adjusts the size of the rectangle by tapping and dragging the borders of the area rectangle.
(OFF):
Adjusts the zenith positions by tapping and dragging the zeniths of the area trapezoids.
[LO][HI]
Sets the PASS judgment area threshold values using the upper and lower limit values of
the LC and RC values.
[POINT1] [POINT2] [POINT3] [POINT4]
Sets the PASS judgment area threshold values using the LC and RC values of the
rectangle’s zenith.
Tap any of the following: [HI] [LO] or [LC] [RC].
2
Set the PASS judgment area threshold values using either the upper and lower limit values of the LC and RC
values, or the LC and RC values at the rectangle’s zenith.
60

LC and RC Values Area Judgments [LCRC AREA]
Use the numeric keypad to enter the threshold values.
3
Settings range: ±(0.000 f to 1.000) (effective number of digits: 4)
C Clear the entered value.
− Enter a minus sign.
3
X10
/10
3
Multiplies the entered value by ×1000.
Multiplies the entered value by ×1/1000.
[HI-LO] is ON (Threshold value set using upper and lower limit values)
LC
HI
RC
LO
HILO
[HI-LO] is OFF (Threshold value set using LC and RC values zeniths)
POINT 1
POINT 2
5
Setting Judgment Conditions
POINT 4
POINT 3
61

Waveform Judgments
5.3 Waveform Judgments
Surface area comparison judgments [AREA]
Compares the master waveform surface area and the test waveform surface area in the area
specied by the user and judges whether the workpiece being tested conforms by the extent of the
difference.
The surface area of the waveform in the judgment area (solid yellow color) is calculated as shown
in the “Waveform surface area calculation example” below.
The judgment standard is set using percentage value, and if the surface area difference is within
that range, the workpiece being tested is judged to conform.
Waveform surface area calculation example
Judgment area
Surface area comparison value operation
Test waveform surface
AREA
(%) =
area value
Master waveform surface
area value
1
*
100
Enabling the surface area comparison judgment function
(Measurement screen) [MODE] > [SETTING] > [JUDGE] > [AREA]
1
Tap [ENABLE], and turn [ON] the surface area comparison judgment function.
1
62

Setting the surface area comparison judgment threshold value
(Measurement screen) [MODE] > [SETTING] > [JUDGE] > [AREA]
Waveform Judgments
2
1
Tap [LIMIT].
1
Use the numeric keypad to enter the surface area comparison threshold value.
2
Settings range: 0.00% to 99.99% (resolution: 0.01%)
OFF Surface area comparison value operations are implemented, but judgments are not.
Tap [SET] to conrm.
3
Setting the surface area comparison judgment area
(Measurement screen) [MODE] > [SETTING] > [JUDGE] > [AREA]
Judgment area bar
You can change the
judgment area by dragging
the lines of the start and
end points.
3
5
Setting Judgment Conditions
1
/
/
Set the start and end points for the judgment area.
1
Moves 1 point.
Moves 100 points.
[END]: End point
[BEGIN]: Start point
63

Waveform Judgments
Differential surface area comparison judgments [DIFF AREA]
Calculates the surface area surrounded by the master waveform and test waveform in the userdesignated area to judge whether the test workpiece within that area conforms.
The surface area surrounded by the master and test waveforms in the judgment area (surface area
in a solid orange color) is calculated as shown in the “Differential surface area calculation example”
below.
The judgment standards are set using percentages, and the test workpiece is judged to conform if
the percentage of the test waveform surface area over the master waveform surface area is in that
range.
Differential surface area calculation example
Judgment area
Differential surface area comparison value operation formula
Diff
(Test waveform surface area value −
(%) =
Master waveform surface area value
Master waveform surface area value)
Enabling the differential surface area comparison judgment function
(Measurement screen) [MODE] > [SETTING] > [JUDGE] > [DIFF AREA]
*
100
1
Tap [ENABLE], and turn [ON] the differential surface area comparison judgment function.
1
64

Waveform Judgments
Setting the differential surface area comparison judgment threshold value
(Measurement screen) [MODE] > [SETTING] > [JUDGE] > [DIFF AREA]
2
1
Tap [LIMIT].
1
Use the numeric keypad to enter the threshold values.
2
Settings range: 0.00% to 99.99% (resolution: 0.01%)
OFF Differential surface area comparison value operations are implemented, but judgments are not.
Tap [SET] to conrm.
3
Setting the differential surface area comparison judgment area
(Measurement screen) [MODE] > [SETTING] > [JUDGE] > [DIFF AREA]
Judgment area bar
You can change the
judgment area by dragging
the lines of the start and
end points.
3
5
Setting Judgment Conditions
1
/
/
Set the start and end points for the judgment area.
1
Moves 1 point.
Moves 100 points.
[END]: End point
[BEGIN]: Start point
65

Waveform Judgments
Flutter detection judgments [FLUTTER]
The amount of the high-frequency component expressed by the test waveform in the userdesignated area is detected, and the size of the amount used to judge the discharge.
The response waveform is primarily differentiated and the surface area of the differentiated
waveform calculated as the amount of the high-frequency component.
Example of the test waveform discharge component
Example of high-frequency components
due to discharge
Flutter value operation
Number of data
Flutter
=
Σ
n
=1
−
|
d
d
n
Judgment area
|
n
−1
66

Enabling waveform utter detection judgment functions
(Measurement screen) [MODE] > [SETTING] > [JUDGE] > [FLUTTER]
1
Waveform Judgments
Tap [ENABLE], and turn [ON] the utter detection judgment functions.
1
Setting the utter detection judgment threshold values
(Measurement screen) [MODE] > [SETTING] > [JUDGE] > [FLUTTER]
1
5
Setting Judgment Conditions
2
3
Tap [LIMIT].
1
Enter the utter detection judgment threshold values.
2
Setting range: 0 to 999,999 (resolution: 1)
OFF Flutter value operations are implemented, but judgments are not.
Tap [SET] to conrm.
3
67

Waveform Judgments
Setting the utter detection judgment area
(Measurement screen) [MODE] > [SETTING] > [JUDGE] > [FLUTTER]
Judgment area bar
1
You can change the judgment
area by dragging the lines of
the start and end points.
/
/
Set the start and end points for the judgment area.
1
Moves 1 point.
Moves 100 points.
[END]: End point
[BEGIN]: Start point
68
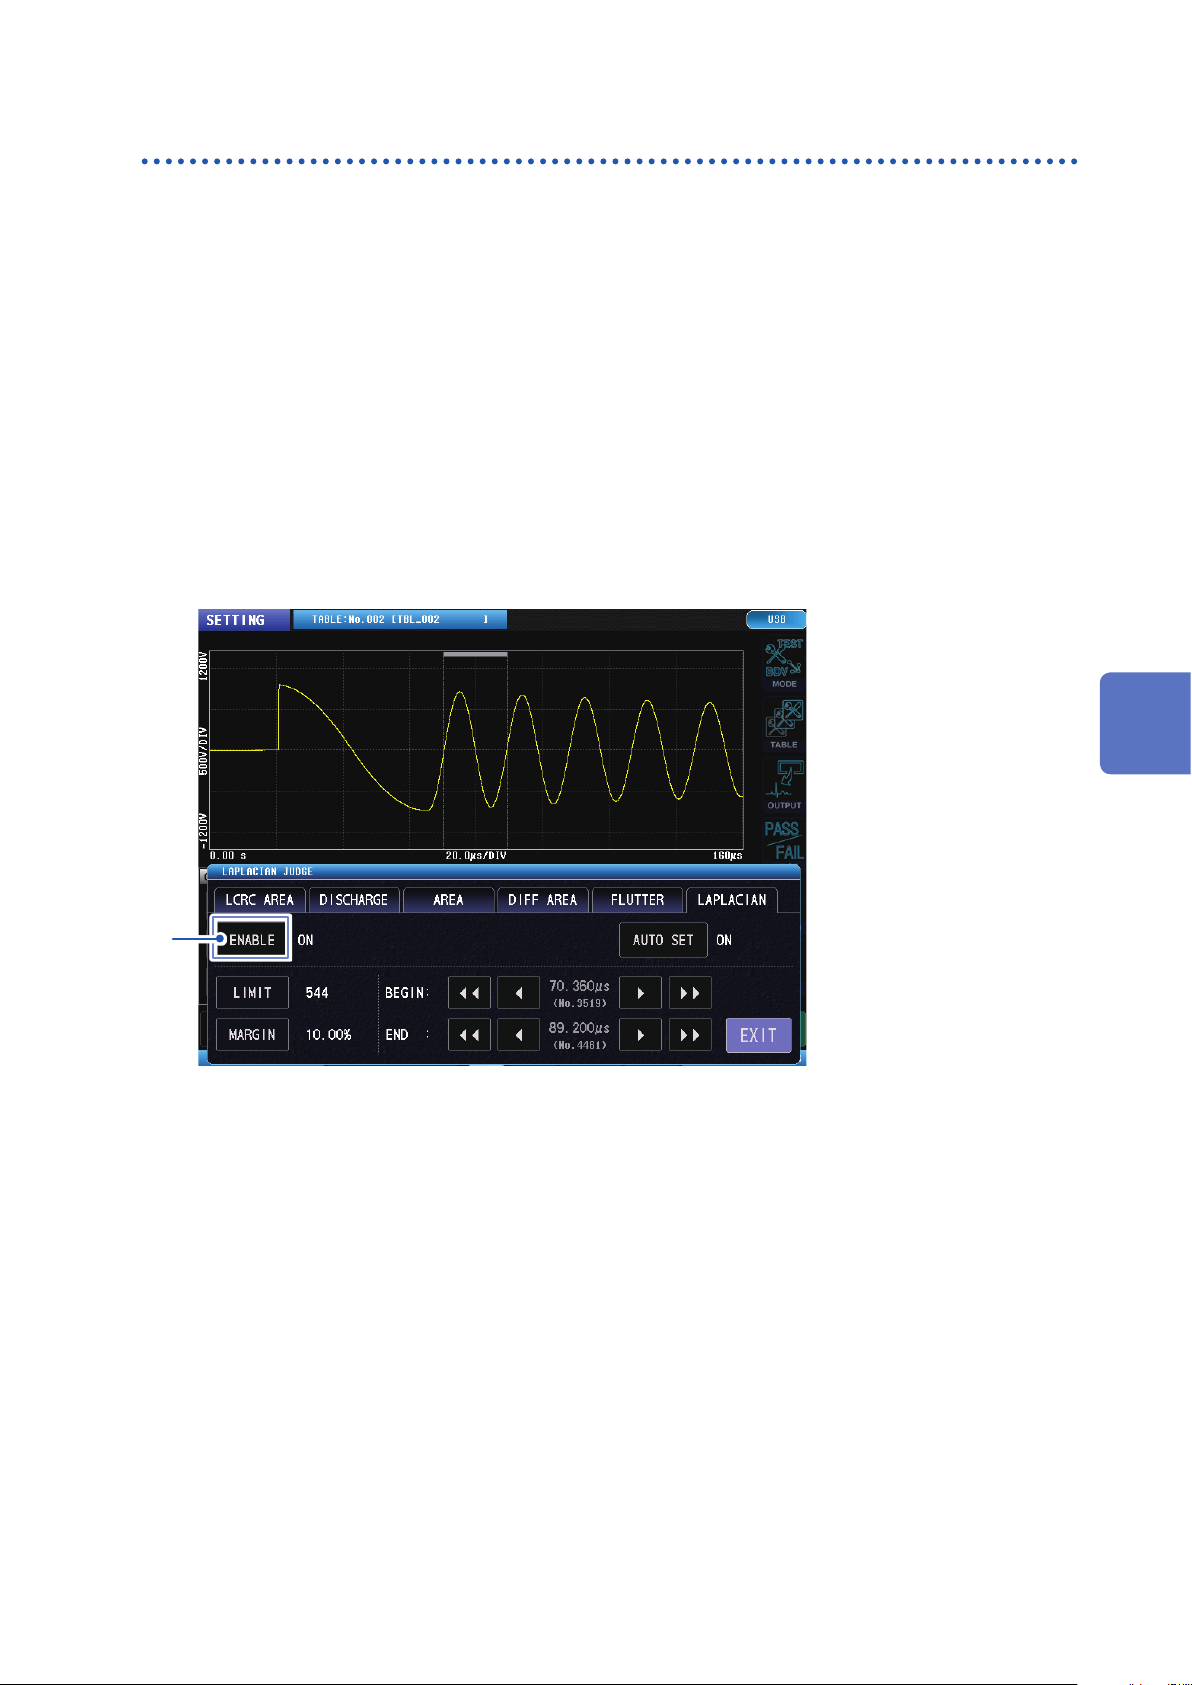
Waveform Judgments
Secondary differential detection judgments [LAPLACIAN]
The amount of the high-frequency component expressed by the test waveform in the userdesignated area is detected, and the size of the amount used to judge the discharge. The response
waveform is secondarily differentiated and the surface area of the differentiated waveform
calculated as the amount of the high-frequency component.
Laplacian operations
Number of data−1
Laplacian
=
Σ
n
=1
Enabling secondary differential detection judgment functions
(Measurement screen) [MODE] > [SETTING] > [JUDGE] > [LAPLACIAN]
+2
−
|−
d
n
−1
|
d
d
n
n
+1
1
Tap [ENABLE], and turn [ON] the secondary differential detection judgments.
1
5
Setting Judgment Conditions
69

Waveform Judgments
Setting the secondary differential detection judgment threshold values
(Measurement screen) [MODE] > [SETTING] > [JUDGE] > [LAPLACIAN]
2
1
Tap [LIMIT].
1
Enter the secondary differential detection judgment threshold values.
2
Setting range: 0 to 999,999 (resolution: 1)
OFF Laplacian value operations are implemented, but judgments are not.
Tap [SET] to conrm.
3
Setting the secondary differential detection judgment areas
(Measurement screen) [MODE] > [SETTING] > [JUDGE] > [LAPLACIAN]
Judgment area bar
You can change the judgment
area by dragging the lines of the
start and end points.
3
1
/
/
Set the start and end points for the judgment area.
1
70
Moves 1 point.
Moves 100 points.
[END]: End point
[BEGIN]: Start point

Waveform Judgments
Waveform judgment area and judgment threshold value automatic
settings functions
Waveform judgment areas and judgment threshold values are set automatically by the instrument
based on the waveform and variability at the set voltage during voltage calibration so as to optimize
judgment settings for waveform judgment functions.
This function can be set individually using the next judgment function. The judgment threshold
values and judgment areas for the enabled judgment functions are set automatically during voltage
calibration.
• Surface area comparison judgments [AREA]
• Differential surface area comparison judgments [DIFF AREA]
• Flutter detection judgments [FLUTTER]
• Secondary differential detection judgments [LAPLACIAN]
Each judgment function sets threshold values by adding the result of multiplying the average
measured value by the margin rate to the variability exhibited by each measured value during
voltage calibration.
Enabling waveform judgment area automatic settings functions
(Measurement screen)
[MODE] > [SETTING] > [JUDGE] > [AREA], [DIFF AREA], [FLUTTER], [LAPLACIAN]
2
5
Setting Judgment Conditions
1
Tap [AUTO SET], and turn [ON] the auto settings function.
1
Tap [MARGIN] and set the margin rate to add to the judgment threshold.
2
Setting range: LC, RC, FLUTTER, LAPLACIAN: 0.00% to 999.99% (resolution: 0.01%)
AREA, DIFF AREA: 0.00% to 99.99% (resolution: 0.01%)
71

Discharge Judgments (When Incorporating Model ST9000)
5.4 Discharge Judgments (When Incorporating
Model ST9000)
Noise manifesting at a xed level in the overall waveform among the high-frequency components
manifesting in the test waveform is eliminated, and only the amount of the partial discharge
components manifesting locally are sampled and judged.
Discharge judgments are enabled only when the Model ST9000 Discharge Detection Upgrade
(optional when shipped from factory) has been incorporated.
IMPORTANT
Discharge detection upgrade eliminates simple noise such as utter and Laplacian operations that are
difcult to separate using primary and secondary differential operations using ltering. This way, you can
detect the partial discharge components with high precision.
Discharge judgment algorithm (when judgments are AUTO)
Test waveform
Test waveform HPF and standardization
processing
Compensation processing
Judgment processing
Discharge waveform
• The high-frequency discharge components of the test waveform
are sampled by separating them from the vibration waveform
components.
• Standardization
components
(In order to enable size comparison of the regular noise
components)
Compensating the distortion part of the test waveform
The compensated standardization waveform is used to judge
whether or not the max. deviation value has exceeded the
threshold value (σ value).
using the standard deviation of the high-frequency
Green dotted line: Discharge judgment
threshold value bar
Gray waveform: Discharge amount graph
(Parts where the discharge amount exceeds
the threshold value are displayed in red)
72
IMPORTANT
The Discharge Detection Upgrade calculates the internal coefcient, etc., used for judgments during voltage
calibration. Consequently, make sure to set the discharge judgment method before implementing voltage
calibration.
If voltage calibration is not implemented, the discharge amount is not calculated even if the judgment setting
is other than OFF.

Discharge Judgments (When Incorporating Model ST9000)
Discharge judgment methods [DISCHARGE]
(Measurement screen) [MODE] > [SETTING] > [JUDGE] > [DISCHARGE]
1
Tap [ENABLE], and turn [ON] the discharge judgment methods.
1
OFF Disables the Discharge Detection Upgrade.
FIXED Compares the amount of the discharge component of the master waveform and the amount of
the discharge component of the test waveform.
AUTO Calculates variations in the high-frequency component that appears in test waveforms as the
standard deviation (σ). Discharges will be detected based on whether the deviation exceeds a
xed amount due to a sudden increase in the high-frequency component due to discharge.
IMPORTANT
If the discharge judgment method is AUTO, suitable ltering is automatically selected according the the
response waveform of the conforming workpiece by implementing voltage calibration. The discharge
judgment method AUTO has a higher discharge judgment performance than FIXED, so normally make sure
to select the AUTO setting. If using a special workpiece that emits a greatly different response waveform
than normal, it may be difcult to render judgments when the discharge judgment method is AUTO. In such
cases, set the discharge judgment method to FIXED.
5
Setting Judgment Conditions
73

Discharge Judgments (When Incorporating Model ST9000)
Threshold value of the test waveform discharge amount over the
master waveform discharge amount
When the judgment method is [FIXED]
(Measurement screen) [MODE] > [SETTING] > [JUDGE] > [DISCHARGE]
2
1
3
Tap [LIMIT].
1
Enter the threshold value of the test waveform discharge amount over the master waveform
2
discharge amount.
Settings range: 0% to 999% (resolution: 1)
OFF Discharge amount operations are implemented, but judgments are not.
Tap [SET] to conrm.
3
IMPORTANT
• When the threshold value is 100%, the discharge amount has the same threshold value as the master
waveform discharge value.
• When the threshold value is 200%, the discharge amount has double the threshold value of the master
waveform discharge value.
74

Discharge Judgments (When Incorporating Model ST9000)
Deviation threshold value of the test waveform discharge amount
When the judgment method is [AUTO]
(Measurement screen) [MODE] > [SETTING] > [JUDGE] > [DISCHARGE]
1
Tap [LIMIT].
1
Enter the deviation threshold value of the test waveform discharge amount.
2
Setting range: 3σ to 100σ (resolution: 1)
C Sets to the default values.
OFF Discharge amount operations are implemented, but judgments are not.
IMPORTANT
• Individual points’ high-frequency components are standardized using the standard deviation of the entire
waveform’
set thresholds for most workpieces.
• In the absence of any discharges, the deviation for the points will fall within a xed area.
• In the event of a discharge, the magnitude of the high-frequency component will increase during the
discharge, causing the deviation for that point to increase.
• The instrument automatically corrects internally for a certain amount of variation in workpiece L values and
applied voltages.
• If a different type of workpiece is measured, or if the waveform changes for another reason, for example
due to a short-circuit in the workpiece, the instrument may detect a discharge even though no discharge
has occurred.
Increases by 1.
Decreases by 1.
s high-frequency component and converted to deviations. This process makes it unnecessary to
2
5
Setting Judgment Conditions
75

Discharge Judgments (When Incorporating Model ST9000)
Setting the discharge amount judgment area
Sets the extend of the the response waveform for the discharge judgment to target.
Shorten the judgment area to reduce the operations time.
(Measurement screen) [MODE] > [SETTING] > [JUDGE] > [DISCHARGE]
1
Set the end point for the judgment area.
1
Setting range: 1001 points to 8001 points (resolution: 1000 points)
IMPORTANT
Set the settings range so that the vibration waveform of the self-resonant area includes at least 4 periods. If
the settings range is too narrow, the discharge judgment will always be FAIL.
Decreases by 1000.
Increases by 1000.
76

6
Implementing Tests
6.1 Overview
Calls the master waveform that has been set using test conditions settings mode, and tests the
workpiece to be tested.
The text results are output to the screen, communications, and external control terminal (EXT. I/O).
Operations owchart in test mode
In test mode, select the master waveform and implement the test, by using the operations
procedure as shown in the diagram.
Test mode
[TEST]
Select the table to which the
master waveform to be used in
the tests was saved
[TABLE]
Implement the test
Check the test results
Finish
6
Implementing Tests
77

Overview
Screen conguration
Measurement screen
1 2
3 5 6 87
4
Graph display Displays the waveform graph and the LC and RC graph.
1
Menu icons [MODE]: “2.4 Select Measuring Mode” (p. 18)
2
[DISP] Switches the graph displayed onscreen.
3
Test conditions settings
4
display
[GRAPH] Sets the graph display.
5
[SCALE] Auto-scales the LC and RC graph.
6
Judgment results display Displays the judgment threshold value settings and the judgment
7
[SAVE] Saves the test results to USB memory.
8
Reference: “Graph display (display graph switching)” (p.
[TABLE]: “3.2 Current Table Selection” (p.
[SYSTEM]: “9 System Settings” (p.
[FILE]: “12 USB Host” (p.
[WAVE]: Waveform graph
[LCRC]: LC and RC graph
[WAVE&LCRC]: Waveform graph + LC and RC graph
[RESULT]: Advanced judgment results display
Displays the settings for the applied voltage, number of pulses, and
sampling frequency.
Reference: “8.6 Graph Display Settings” (p. 112)
Reference: “LC and RC graph scale settings” (p. 115)
results.
Reference: “12 USB Host” (p. 165)
165)
29)
125)
79)
78

Graph display (display graph switching)
Waveform graph display
Displays the waveform graph only.
Overview
1 4
2 3
5
Number of applied pulses and
1
peak voltage display
Waveform judgment area and
2
LC and RC values operation
range bar
Response waveform Yellow: Master waveform
3
Discharge judgment threshold
4
value bar
Discharge amount graph Discharge amount graph (Parts where the discharge amount
5
[P:XX/XX]: Number of pulses that have been applied/Total number of
pulses
[xxxV]: Max. peak voltage value of the response waveform
Blue: AREA judgment area
Green: DIFF judgment area
Purple FLUTTER judgment area
Gray: LAPLACIAN judgment area
Yellow (×2): LC and RC value operation areas
Blue: Test waveform (Failures are displayed in red)
Displays the discharge judgment threshold value.
exceeds the threshold value are displayed in red)
Note: Displayed only if the Discharge Detection Upgrade is enabled.
Reference: “5.4 Discharge Judgments (When Incorporating Model
ST9000)” (p. 72)
6
Implementing Tests
79

Overview
LC and RC graph display
Displays only the LC and RC graph.
1 2
LC and RC graph Blue dots: Test LC and RC values (Failures displayed in red)
1
LC and RC cursor values [No.XXX, (XXX)]: Cursor value test number, (total number of LC and
2
IMPORTANT
Tap the LC and RC values on the graph while multiple pulses are applied, to move the cursor and check
each LC and RC value.
Gray (solid): LC and RC values PASS judgment area
RC values)
[LC]/[RC]: LC and RC values presently selected by the cursor
80

Display waveform graph and the LC and RC graph
Displays the waveform graph and the LC and RC graph simultaneously.
Overview
6
Implementing Tests
81

Overview
Expanded judgment results
Expands and displays the judgment results.
21 3 4
Tap the LC and RC values judgments area to check the LC and RC values for each pulse.
Judgment settings Displays the set values of the judgment functions.
1
Total judgment results Displays the total judgment results.
2
Judgment values Displays the judgment operation values of the judgment functions.
3
Judgment results Displays the judgment results of the judgment functions.
4
82

Instrument status display and error display
Overview
1 2 3
4
5
Present measurement
1
mode display
Current table display Displays the number and table name of the table presently being used.
2
Information saved to
3
internal memory
Communications
4
interface settings display
Voltage calibration status
5
display
Test status display Displays the test status. Reference: “14.3 Error Display” (p. 214)
6
USB memory status
7
display
Double action status
8
display
Interlock status display
9
Communications status
10
display
Date and time display Displays the date and time that has been set in the instrument.
11
6 7 9 10 118
Displays the settings for the communications interface presently being
used.
(Gray)
(Blue)
(Red)
(No display)
(Green)
(Gray)
Note: The background is displayed in red while writing to the settings
internal memory.
(No display)
(Red)
(Gray)
Voltage application disabled mode
Test conditions settings mode
Test mode
BDV mode
Number of data saved to internal memory
Voltage calibration not implemented
(Master waveform not acquired)
Voltage calibration implemented
(Master waveform acquired)
USB memory not connected
USB memory connecting
Accessing USB
Double action function OFF
START button enabled
START button disabled
Interlock function OFF
Interlock engaged
Interlock canceled
Remote status
Local status
6
Implementing Tests
83

Checking Test Start and Test Results
6.2 Checking Test Start and Test Results
Press the instrument START button to implement the test. (You can start the test from either
communications or external control terminal as well.)
When a test nishes, the test results are output to the screen and external control terminal (EXT.I/O).
Test results can also be acquired using communications.
See “6.1 Overview” (p. 77) for the display details of the test results onscreen.
CAUTION
If the OUTPUT lamp is red, do not touch the test lead clip or workpiece. There is no
adverse impact on the human body but electric shock will occur.
PASS judgment example
FAIL judgment example
Total judgment results
Judgment results
Total judgment results
Judgment results
84
IMPORTANT
To cancel a test that is underway, press the STOP button.

7
Break down voltage test (BDV)
7.1 Overview
Implement the test while gradually increasing the voltage applied to the test object, and evaluate
the voltage at which the insulation starts to break down from the waveform LC and RC values,
discharge amount, and waveform surface area, etc.
Operations owchart in break down voltage test mode
Break down voltage test mode evaluates the break down voltage, by using the operations
procedure as shown in the diagram.
BDV mode
[BDV]
Set the test conditions.
[OUTPUT]
Set the judgment conditions.
[JUDGE]
Implement the test.
[START]
Check the break down voltage.
Finish
7
Break down voltage test (BDV)
85

Overview
Screen conguration
Measurement screen
1 2
3 654
Graph display Displays the waveform graph and the LC and RC graph.
1
Menu icons [MODE]: “2.4 Select Measuring Mode” (p. 18)
2
[GRAPH] Sets the graph display.
3
Test conditions settings
4
display
Judgment results display Displays the test results and the individual judgment results.
5
[SAVE] Saves the test results to USB memory.
6
Reference: “Graph display (display graph switching)” (p.
[OUTPUT]: “7.3 Setting the Test Conditions” (p.
[JUDGE]: “7.4 Setting Insulation Break down Judgment Conditions”
(p. 95)
[SYSTEM]: “9 System Settings” (p.
[FILE]: “12 USB Host” (p.
Reference: “8.6 Graph Display Settings” (p.
Displays the settings for application start voltage, max. voltage, and
voltage rise width.
Reference: “7.2 Checking Test Start and Test Results” (p. 89)
Reference: “12 USB Host” (p. 165)
165)
125)
112)
37)
90)
86
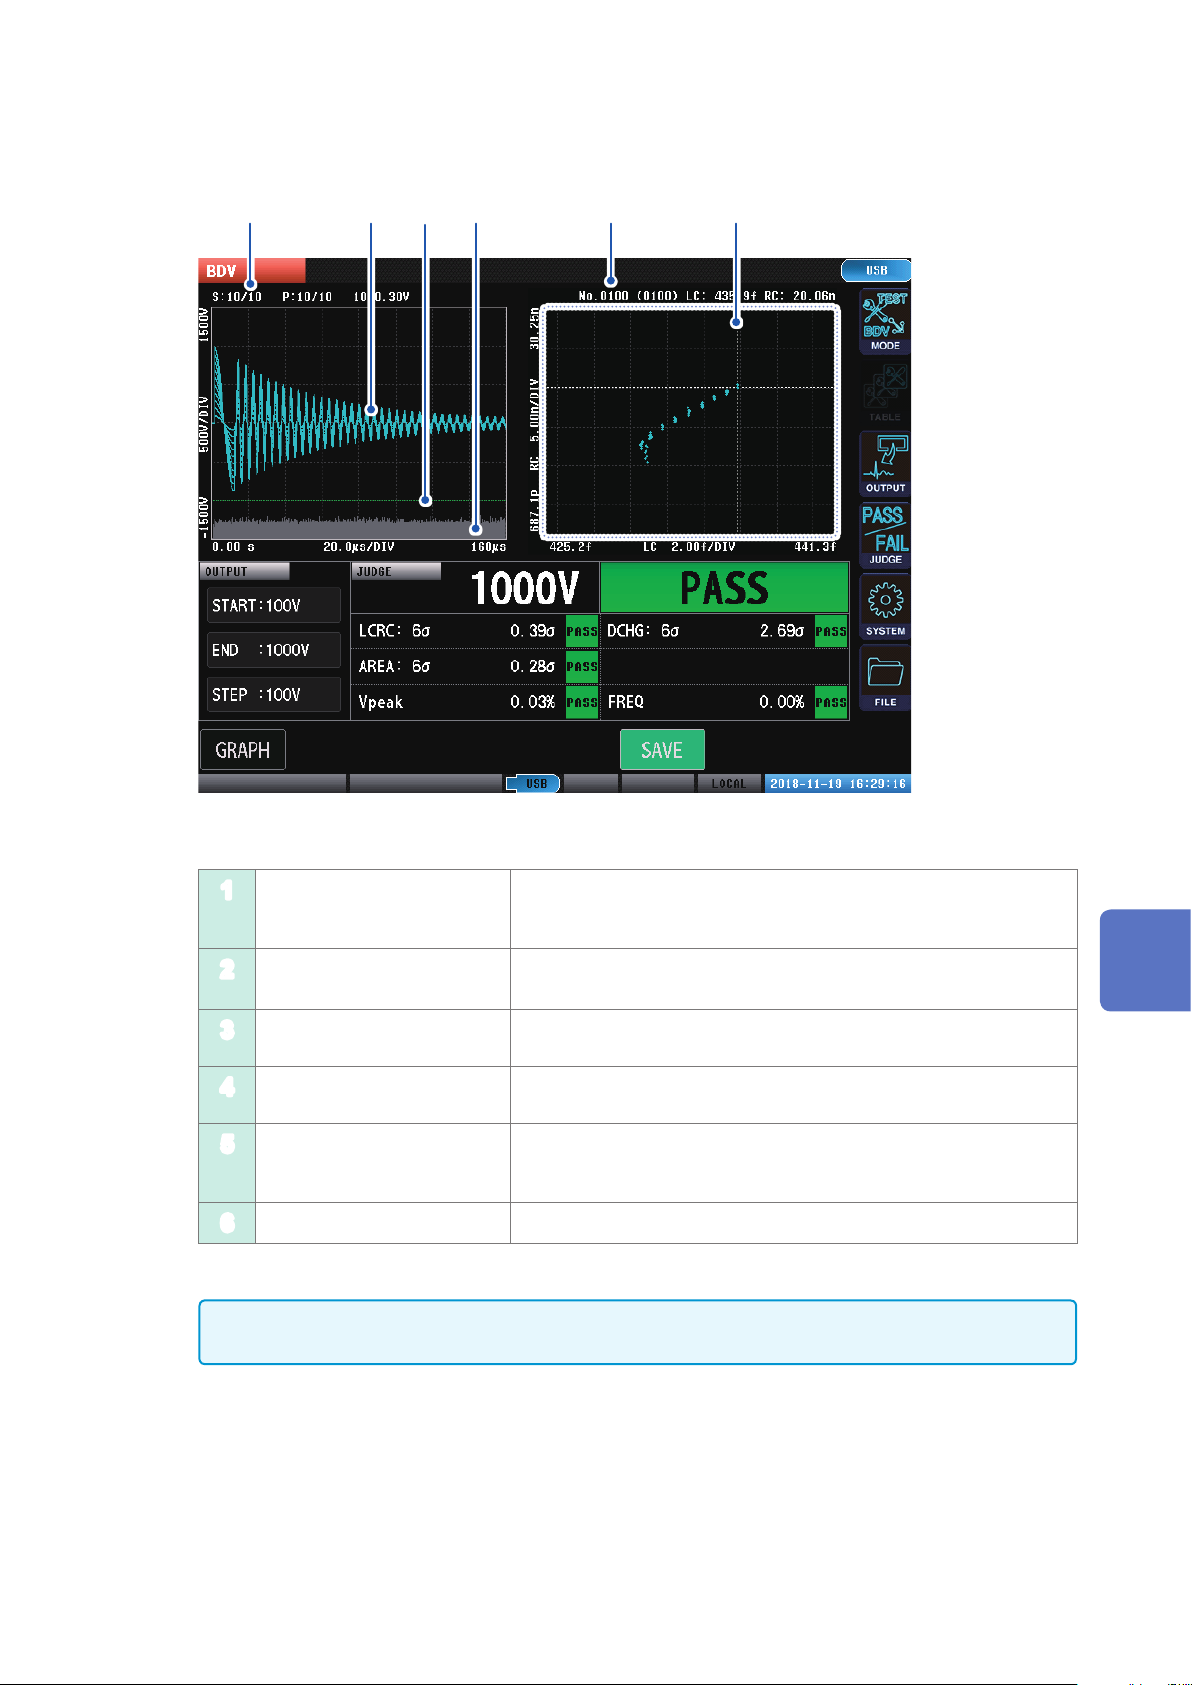
Graph display
1 52 3 4 6
Overview
Number of steps, number
1
of applied pulses, and peak
voltage value display
Response waveform Blue: PASS waveform
2
Discharge judgment threshold
3
value bar
Discharge amount graph Discharge amount graph (Parts where the discharge amount
4
LC and RC cursor values [No.XXX, (XXX)]: Cursor value test number, (total number of LC and
5
LC and RC graph Blue dots: Test LC and RC values
6
IMPORTANT
Tap the LC and RC values on the graph to move the cursor and check each LC and RC value.
[S:X/X]: Present number of steps/total number of steps
[P:X/X]: Present number of pulse applications/total number of pulses
[xxxxV]: Response waveform peak voltage
Red: FAIL waveform
Discharge judgment threshold value
exceeds the threshold value are displayed in red)
RC values)
[LC]/[RC]: LC and RC values presently selected by the cursor
7
Break down voltage test (BDV)
87

Overview
Instrument status display and error display
1 2
3 4 6 7 85
Present measurement
1
mode display
Communications
2
interface settings display
Test status display Displays the test status. Reference: “14.3 Error Display” (p. 214)
3
USB memory status
4
display
Double action status
5
display
Interlock status display
6
Communications status
7
display
Date and time display Displays the date and time that has been set in the instrument.
8
Displays the settings for the communications interface presently being
used.
(Gray)
(Blue)
(Red)
(No display)
(Green)
(Gray)
(No display)
(Red)
(Gray)
Note: The background is displayed in red while writing to the settings
internal memory.
Voltage application disabled mode
Test conditions settings mode
Test mode
BDV mode
USB memory not connected
USB memory connecting
Accessing USB
Double action function OFF
START button enabled
START button disabled
Interlock function OFF
Interlock engaged
Interlock canceled
Remote status
Local status
88

Checking Test Start and Test Results
7.2 Checking Test Start and Test Results
Press the instrument START button to implement the test. (You can start the test from either
communications or external control terminal as well.)
When a test nishes, the test results are output to the screen, communications, and external control
terminal (EXT. I/O).
IMPORTANT
If any of the judgment results are FAIL, it views that dielectric breakdown as having started and the test
ends at that point in time.
If the judgment results are all PASS, implement testing until max. voltage is reached.
PASS judgment example
FAIL judgment example (discharge FAIL at 2000 V)
Present applied voltage value
Total judgment results
Judgment results
Voltage value during
breakdown judgment
Total judgment results
*1
7
Break down voltage test (BDV)
Judgment results
*1: LCRC: XXσ Max. deviation of LC and RC values
DCHG: XXσ Max. deviation of discharge amount
AREA: XXσ Max. deviation of waveform surface area value
Vpeak XX% Max. misalignment width from standard of the peak voltage value
FREQ XX% Max. misalignment value from standard of the vibration frequency
Note: The values displayed are the judgment values and results of the present voltage values
*1
89

Setting the Test Conditions
7.3 Setting the Test Conditions
Sets the application voltage, number of pulses applied per voltage, and the sampling frequency.
Applied voltage settings
Sets the start voltage, max. voltage, and voltage rise width.
Evaluate the voltage at which isolation break down starts by implementing impulse tests while
increasing the voltage for each voltage rise width from the application start voltage that has been
set to the max. application voltage.
START
(Application start voltage)
END
(Max. applied voltage)
STEP
(V
oltage rise width)
(Measurement screen) [MODE] > [BDV] > [OUTPUT]
Sets the application start voltage. Starts application from the set voltage.
Settings range:
Sets the max. applied voltage. Implement tests while increasing the
voltage to the set voltage.
Settings range:
Note: If isolation break down is identied before the max. voltage is
reached, the test ends at that time.
Sets the voltage rise width.
Settings range:
1
2
ST4030: 100 V to 3300 V (resolution: 10 V)
ST4030A: 100 V to 4200 V (resolution: 10 V)
ST4030: 100 V to 3300 V (resolution: 10 V)
ST4030A: 100 V to 4200 V (resolution: 10 V)
ST4030: 10 V to 3200 V (resolution: 10 V)
ST4030A: 10 V to 4100 V (resolution: 10 V)
3
Tap [START], and set the start voltage.
1
Settings range: ST4030: 100 V to 3300 V (resolution: 10 V)
ST4030A: 100 V to 4200 V (resolution: 10 V)
Tap [END], and set the max. voltage.
2
Settings range: ST4030: 100 V to 3300 V (resolution: 10 V)
ST4030A: 100 V to 4200 V (resolution: 10 V)
Tap [STEP], and set the voltage rise width.
3
Settings range: ST4030: 10 V to 3200 V (resolution: 10 V)
ST4030A: 10 V to 4100 V (resolution: 10 V)
90

Setting the Test Conditions
Number of applied pulses settings
Sets the number of test pulses to be used in the tests and the number of degaussing pulse
applications to eliminate magnetic elds from the workpiece.
Reference: “4.3 Number of Applied Pulses” (p. 42)
PULSE NUM
(Number of test pulses
applied)
DEGAUSS
(Number of degaussing
pulses applied)
PERIOD
(Pulse application interval)
There can be up to 32 test voltage steps max. If the voltage rise width setting is small, the test will
end when 32 steps have been completed even if the max. application voltage has not been reached.
(Measurement screen) [MODE] > [BDV] > [OUTPUT]
Sets the number of test pulses to be applied.
The test pulses are applied continuously for the number of times that
have been set respectively in each voltage step.
Sets the number of degaussing pulses to be applied.
Degaussing pulses are applied continuously for the number of times
set at the start of BDV testing. (Degaussing pulse waveforms are not
sampled or judged.)
Sets the pulse application interval if multiple degaussing pulses and test
pulses are to be applied.
When multiple pulses are applied, the pulse application interval operates
at or above the set time.
1
2
Tap [PULSE].
1
Set the number of test pulses to be applied.
2
Setting range: 3 to 32
C Sets to the default values.
Set the number of degaussing pulses to be applied.
3
Setting range: 0 to 10
Tap [Period], and set the pulse application interval.
4
Setting range: 0.050 s to 1.000 s (resolution: 0.001 s)
Increases by 1.
Decreases by 1.
7
Break down voltage test (BDV)
4
3
91

Setting the Test Conditions
IMPORTANT
Since statistical values are used in the calculation of discharge judgments, reducing the number of pulse
applications will increase the magnitude of errors and may result in erroneous judgments. If you encounter
this issue, either increase the LCRC and AREA judgment thresholds or set judgment to “OFF.”
92

Setting the Test Conditions
Setting the sampling frequency and number of sampling data
Sets the voltage sampling frequency and the number of sampling data to be imported to the
instrument.
Sets the voltage sampling frequency.
SAMPLING
(Sampling frequency)
RECORD LENGTH
(Number of sampling data)
If a sufciently long response waveform cannot be imported because
the response waveform vibration period is long, you can extend the
waveform to be imported by extending the sampling frequency.
Sets the number of sampling data to be imported to the instrument.
If there are vibration waveform parts that are unnecessary for
judgment at the end of the waveform after the sampling frequency
has been adjusted and the waveform length decided, you can adjust
so as to exclude the unnecessary waveform parts by reducing the
number of sampling data.
AUTO SET
(Automatic settings function for
range of waveform acquisition)
Reference: “4.4 Sampling Frequency/Number of Sampling Data” (p. 44)
(Measurement screen) [MODE] > [BDV] > [OUTPUT]
This function automatically adjusts and sets the sampling frequency
and number of sampling data during voltage calibration so that the
waveform acquisition range is optimal.
1
2
7
Break down voltage test (BDV)
3
Tap [SAMPLING].
1
Set the sampling frequency.
2
Setting range: 10 MHz, 20 MHz, 50 MHz, 100 MHz, 200 MHz
Set the number of sampling data.
3
Setting range: 1001 points to 8001 points (resolution: 1000 points)
Increases by 1.
Decreases by 1.
93
 Loading...