

Page 1

SF1001
Instruction Manual
POWER LOGGER VIEWER
Apr. 2018 Revised edition 4
SF1001A981-04 18-04H
EN
Page 2

Page 3

User's License Agreement
Important
Please read the following agreement carefully. This user's license agreement (hereafter
referred to as Agreement) is a legal contract between the software user (individual or institution) and HIOKI E. E. CORPORATION (hereafter referred to as HIOKI). The term "software"
includes any related electronic documentation and computer software and media, as well as
any printed matter (such as the Instruction Manual).
By installing, reproducing, or using the software, you, the Licensee, agree to accept the
license terms set forth in this Agreement.
This software is protected by copyright laws, international copyright agreements, as well as
non-corporate laws. The software is a licensed product, and is not sold to the user.
1. License
This Agreement grants you, the Licensee, a license to install a single copy of the software on
a specified computer system.
2. Explanation of other rights and restrictions
-1. Restrictions on reverse engineering, decompiling, and disassembling:
You may not reverse engineer, decompile, or disassemble the software.
-2. Separation of components:
This software is licensed for use as a single product. You may not separate the components
for use on multiple computer systems.
-3. Loaning:
You may not loan or lease the software.
-4. Transfer of software:
You may transfer full rights in accordance with this Agreement. However, if you do so, you
may not retain any copy of the software, but must transfer the software in its entirety (all components, media, related documentation such as the Instruction Manual, and this Agreement),
and must ensure that the receiver of the software agrees with the terms set forth in this
Agreement.
-5. Cancellation:
In the event that the terms and conditions set forth in this Agreement are violated, HIOKI
retains the right to cancel this Agreement without compromise of any of its other rights. In this
event, you must destroy all copies of the software and its components.
3. Copyright
The title and copyright rights concerning the software's related documentation, such as the
Instruction Manual and copies of the software, are the property of HIOKI and other licensors,
and are protected by copyright laws and international agreement regulations. Accordingly,
you must treat the software as you would any other copyrighted document. However, you are
permitted to make copies as indicated in (A) and (B) below provided such copies are not
intended for use other than back-up purposes.
(A) You may make a single copy of the software.
(B) You may install this software on a single computer.
However, you may not reproduce the documentation supplied with the software, such as the
Instruction Manual.
SF1001A981-04
Page 4

4. Dual media software
You may receive the same software on more than one type of media. However, regardless of
the type and size of media provided, you may only use one media type and only on a single
computer. You must not use or install the other media on any other computer. Furthermore,
except when transferring the software as stipulated above, you may not loan, lease, or transfer the other media to any other user.
5. Warranty
-1. HIOKI reserves the right to make changes to the software specifications without any
prior warning.
-2. If the software does not operate in accordance with the supplied Instruction Manual,
or the software media or Instruction Manual are damaged in any way, you have one
year from the date of purchase to apply for either an exchange or repair at HIOKI's
discretion.
-3. In no event will HIOKI be liable for any damages resulting from fire, earthquake, or
actions of a third party under the conditions stated in item number 2 above, or for any
damage caused as a result of your using the software incorrectly or under unusual
circumstances. Further, the warranty is invalid if the following occurs:
(A) Damage incurred through transport, moving, droppage, or any other kind of impact after
you purchased the software.
(B) Damage incurred through any form of alteration, unwarranted servicing, or any other type
of mistreatment.
-4. In the event that the software is exchanged or repaired, the period of warranty
expires on the latest occurring date out of the day stated in the original warranty, and
exactly 6 months from the day the exchanged/repaired software is returned to you.
-5. Regardless of the grounds for making a legal claim, HIOKI and its licensors will not
be liable for any damage incurred (including, but not limited to: lost profits, suspension of business, loss of data or lost savings) unstated in the warranty terms for the
use of this software. This is true even if HIOKI is notified of the possibility of such
damages. In any event, HIOKI's liability shall be limited only to replacing defective
software with software that is not defective.
Page 5

Contents
Contents
i
Introduction .................................................. 1
Confirming Package Contents.................... 1
Notation......................................................... 1
Mouse Operation.......................................... 2
Notes on Use ................................................ 2
Chapter 1 Product Overview 3
Chapter 2 Before Viewing Data 5
2.1 System Requirements ....................... 5
2.2 Installing the Software ....................... 6
Uninstalling the Software ..................... 6
2.3 Launching the SF1001 ....................... 7
Exiting the SF1001............................... 7
2.4 Loading a Measurement-data File ....8
Loading Folders
(Model PW3360, Model PW3365) ....... 9
Loading Files...................................... 12
Changing a Data Name ..................... 15
Changing the Facility Capacity Setting 16
Deleting a Data File from the List....... 17
Deleting All Data Files on the Llist ..... 18
Loading data logger recorded data .... 19
2.5 Saving Data in CSV Format ............. 21
Toolbar ............................................... 34
Pasting to the Clipboard ..................... 34
Chapter 4 Displaying a
Time-series Graph 35
4.1 Select Data Items and Graph type
to Display ..........................................36
4.2 Select Detail Items ............................37
4.3 Set Data Interval for the Displayed
Data ....................................................39
4.4 Setting the Graph Display Start
and End Time and Date ....................40
4.5 Move Display Range ........................41
4.6 Set Display Period ............................42
4.7 Displaying the Value at the Cursor
Position .............................................43
4.8 Set Vertical Axis ...............................44
4.9 Changing the Maximum Number
of Display Items ................................45
4.10 Change Display Unit ........................46
4.11 Change Background Color ..............47
4.12 Set time display down to seconds
or lower digit .....................................48
2.6 Saving in a Combined File Under a
New File Name .................................. 23
Loading a Combined File ................... 24
Saving a Combined File..................... 24
2.7 Settings at Startup of the SF1001 ... 25
2.8 Changing the Date of
Measurement Data ...........................26
Chapter 3 Screen Configuration
31
3.1 Screens .............................................31
3.2 Common Interface Elements and
Functionality .....................................32
Menu Bar ........................................... 33
Chapter 5 Displaying
Summary 49
5.1 Select Data Items to Display ...........50
5.2 Set Data Interval for the Displayed Data
............................................................52
5.3 Set Display Time ...............................53
5.4 Move Display Range ........................54
5.5 Set Display Period ............................55
5.6 Scroll Screen ....................................56
5.7 Change Display Unit ........................57
5.8 Change Column width .....................58
Page 6

ii
Contents
8.7 Change Display Unit ........................ 84
Chapter 6 Displaying the Re-
port: Daily/ Weekly/
Monthly 59
6.1 Select Data Items to Display ...........60
6.2 Select Demand Period .....................62
6.3 Set the Start Date .............................63
6.4 Move Display Range ........................64
6.5 Select a Report .................................65
6.6 Scroll Screen ....................................66
6.7 Change Display Unit ........................67
6.8 Changing the Report Column Width
............................................................68
6.9 Displaying the Load Factor and
Demand Factor .................................69
6.10 Displaying Active Energy by Time
of Day ................................................70
6.11 Displaying Active Energy
Converted into CO2 Amount ...........72
8.8 Change Background Color ............. 85
Chapter 9 Displaying Measure-
ment Data Waveforms
87
9.1 Selecting the Waveform Display Data
............................................................ 88
9.2 Toggling the Waveform Display
On and Off ........................................ 89
9.3 Setting the Start Time ...................... 89
9.4 Displaying the Value at the Cursor
Position ............................................. 90
9.5 Changing the Graph Display .......... 90
9.6 Set Vertical Axis ............................... 91
9.7 Change Display Unit ........................ 92
9.8 Change Background Color ............. 93
Chapter 7 Displaying a
Harmonic List 73
7.1 Select Data Channel to Display .......74
7.2 Select Detail Items ............................75
7.3 Setting the Display Time ..................76
7.4 Change Display Unit ........................77
Chapter 8 Displaying a
Harmonic Graph 79
8.1 Select Data Items to Display ...........80
8.2 Select Detail Items ............................80
8.3 Setting the Display Time ..................82
8.4 Setting the Axis to a Linear Axis
or LOG Axis ......................................82
8.5 Displaying the Value at the Cursor
Position .............................................82
Chapter 10Displaying
Settings for
Measurement Data
95
10.1 Select Measurement Data ............... 96
10.2 Set Column Width ............................ 96
Chapter 11Printing 97
11.1 Printing Screens .............................. 97
11.2 Printing Reports ............................. 100
Chapter 12Specifications 105
12.1 General Specifications .................. 105
12.2 Functional Specifications ............. 106
12.3 Calculation Formulas .................... 110
8.6 Set Vertical Axis ...............................83
Page 7

Introduction
Introduction
Thank you for purchasing the HIOKI Model SF1001 Power Logger Viewer.To obtain maximum performance from the software, please read this manual first, and keep it handy for future reference.
Trademarks
Windows and Internet Explorer are either registered trademarks or trademarks of Microsoft Corporation
in the United States and other countries.
Confirming Package Contents
When you receive the software, inspect it carefully to ensure that no damage occurred during shipping. If
damage is evident, or if it fails to operate according to the specifications, contact your dealer or Hioki representative.
1
Application disk (1)
“SF1001 Power Logger Viewer, Instruction Manual (This file)”
Notation
The following symbols in this manual indicate the relative importance of cautions and warnings.
Indicates that incorrect operation presents a possibility of injury to the user or damage
to the software.
Indicates advisory items related to performance or correct operation of the software.
(p. )
*
Indicates the location of reference information.
Indicates that descriptive information is provided below.
[ ]
Windows
Dialog
Menus, commands, dialogs, buttons in a dialog, and other names on the screen and the
keys are indicated in brackets.
Unless otherwise specified, “Windows” represents Windows 7 SP1 (32-bit version/64bit version) or later, Windows 8.1 (32-bit version/64-bit version),and Windows 10 (32-bit
version/64-bit version).
Dialog box represents a Windows dialog box.
Page 8
2
Mouse Operation
Mouse Operation
Click Press and quickly release the left button of the mouse.
Right-click Press and quickly release the right button of the mouse.
Double click Quickly click the left button of the mouse twice.
Drag
Notes on Use
• Always hold the disc by the edges, so as not to make fingerprints on the disc or
scratch the printing.
• Never touch the recorded side of the disc. Do not place the disc directly on anything
hard.
• Do not wet the disc with volatile alcohol or water, as there is a possibility of the label
printing disappearing.
• To write on the disc label surface, use a spirit-based felt pen. Do not use a ball-point
pen or hard-tipped pen, because there is a danger of scratching the surface and corrupting the data. Do not use adhesive labels.
• Do not expose the disc directly to the sun's rays, or keep it in conditions of high temperature or humidity, as there is a danger of warping, with consequent loss of data.
• To remove dirt, dust, or fingerprints from the disc, wipe with a dry cloth, or use a CD
cleaner. Always wipe from the inside to the outside, and do no wipe with circular
movements. Never use abrasives or solvent cleaners.
• Hioki shall not be held liable for any problems with a computer system that arises
from the use of this CD, or for any problem related to the purchase of a Hioki product.
While holding down the left button of the mouse, move the mouse and then release the
left button to deposit the chosen item in the desired position.
Page 9

3
Product
Overview Chapter 1
The SF1001 Power Logger Viewer is a software application for graphing measurement data
recorded using the Hioki power meter (Model PW3360, model PW3365, and model 3169) with a
computer.
The SF1001 has the following functions.
Time-series Graph Display
Displays measurement data in a time-series graph. When the demand in each system is measured
separately, these measurements will be displayed one on top of another.
Summary Display
Displays a list of measurement data.
Daily, Weekly, and Monthly Report Display
Displays a daily, weekly, or monthly report of measurements.
Harmonic Display
Displays harmonic measurement data in the form of a graph or list.
Waveform Display
Displays waveform data in the form of a graph.
Printing
Prints out the screen image on the printer connected to the PC.
Report Printing
Create and print reports about time-series graphs; summary; daily report; harmonic graph; harmonic
list; and waveform for loaded measurement data.
Data Combination
Combines up to 16 pieces of measurement data of the Hioki power meter (Model PW3360, PW3365,
and 3169). The data is saved and read out as a single combined file.
Manually saved data of the 3169 Clamp on Power HiTester cannot be loaded.
Page 10

4
Page 11
2.1 System Requirements
Before Viewing
Data Chapter 2
Install and launch the SF1001 application.
Load measurement data. (You can load measurement data saved with the PW3360, the PW3365,
and the 3169 or files saved in the SF1001 file format.)
2.1 System Requirements
The computer running the SF1001 program must satisfy the following requirements.
5
English/ Chinese version
OS
CPU 1.0 GHz or more (2.0 GHz or more recommended)
Memory
Hard Disk Free disk space of 128 MB or more (at launch)
Display Resolution 1024 x 768 dots or more, 65536 colors or more
Disk System CD-ROM drive (Used only for installation)
Printer
• Windows 7 SP1 (32-bit version/ 64-bit version) or later
• Windows 8.1 (32-bit version/ 64-bit version)
• Windows 10 (32-bit version/ 64-bit version)
1.0 GHz or more (2.0 GHz or more recommended)
*For Windows 7 (64-bit version), Windows 8.1 (64-bit version), and Windows 10 (64-bit ver-
sion), 2.0 GB or more
Required for screen image or report printing on the computer.
Either color or monochrome can be used.
• For some models, proper operation cannot be guaranteed even when the above
requirements are satisfied.
• To transfer data from a PW3360 or a PW3365 to a Computer, SD memory card is
required.
• To transfer data from a 3169 to a Computer, PC card is required.
Page 12
6
2.2 Installing the Software
2.2 Installing the Software
Use the following procedure to install the software.
1
2
3
4
Set up the computer.
Shut down all currently running applications.
Insert the supplied CD into the CD-ROM drive.
Double-click the setup file (setup.exe) contained in the "English" or “Chinese”
folder.
Installation of the SF1001 application will begin.
If the SF1001 installer does not launch automatically, double-click [Start]-[Computer]-[Devices
with Removable Storage]-[SF1001] on the Windows menu.
Follow the directions on the screen to complete the installation.
• If other application are running it may not be possible to complete the installation. As
far as possible, close all other applications before beginning the installation. In particular, if any anti-virus software is running, it may prevent the installation, even though it
is not a virus. In this case, make the appropriate settings in the anti-virus software to
allow the installation to proceed.
• Following installation, the computer may need to be restarted.
Uninstalling the Software
Use the following procedure to uninstall the software.
1
2
3
In the Windows Start menu, select [Start]-[Control Panel].
Click the [Programs]-[Uninstall a program] icon, to display the [Programs and Fea-
tures] dialog.
In the [Uninstall or change a program] tab of the dialog, click on [SF1001 Power
Logger Viewer] in the list of applications, and click [Uninstall].
This runs the uninstaller, which removes the SF1001 software.
Page 13

2.3 Launching the SF1001
Click
2.3 Launching the SF1001
Use the following procedure to launching the software.
In Windows, select [Start]-[All programs]-[HIOKI]-[SF1001]-[SF1001 Power Logger
1
Viewer].
The main screen appears.
2
7
Exiting the SF1001
Select
You can also click
[File]-[Exit] on the menu bar.
[x] (Close) at the top right corner of the window to close the application.
Page 14
8
2.4 Loading a Measurement-data File
2.4 Loading a Measurement-data File
This section describes how to load data recorded by the instrument. The following data files can be
loaded:
Model number File type Contents of data File type Extension
Maximum value, Minimum value,
PW3360
PW3365
Measurement data file
Harmonic data file Harmonic data Binary file .hrm
Waveform data file Waveform data Binary file .wui
Measurement data file
Harmonic data file
(Firmware version number
2.00 or later is required)
Waveform data file Waveform data Binary file .wui
Average value, Integrated value,
Demand value
Maximum value, Minimum value,
Average value, Integrated value,
Demand value
Harmonic data Binary file .hrm
CSV file .csv
CSV file .csv
Instantaneous value, Maximum value,
Measurement data file
3169
Waveform data file Waveform data Binary file .wui
Short-term-interval
data file
SF1001 Combined file Combined file Binary file .da2
9625 Combined file Combined file Binary file .dat
Data Logger Recorded data file
Minimum value, Average value,
Integrated value, Demand value,
Harmonic waveform data
Instantaneous value Binary file .bin
Instantaneous value, Maximum value,
Minimum value, Average value
CSV file .csv
Binary file .hrp2
• The maximum total amount of data that can be loaded from files is as follows:
4 GB (when there is no binary file)
2 GB (when there is a binary file)
• The following files will be also loaded in addition to measurement data files.
Model PW3360 and model PW3365: harmonic data file and waveform data file
Model 3169: waveform data file
• A file cannot be loaded if it has been overwritten on a spreadsheet program.
• If a waveform data file or a short-term-interval data file is converted to a CSV file using
binary CSV conversion software for the 3169, the CSV file cannot be loaded.
• Data recorded by a data logger can be loaded by opening it with the LR5000 utility
software and converting it to a CSV file.
See:"Loading data logger recorded data" (p.19)
Page 15
2.4 Loading a Measurement-data File
Click
Click
Loading Folders (Model PW3360, Model PW3365)
Data saved with Model PW3360 and PW3365 can be loaded by specifying a folder including the data.
Loading a folder is not the same thing as loading all CSV files in the folder.
See:"Loading Files" (p.12)
• If a data file exceeds 200 MB during measurement with Model PW3360 or PW3365, it
will be divided into multiple files, being saved. Because all of the files divided into multiple files inside a folder are loaded as a single file when loading a folder, the loading
process may take time.
• If there is only one CSV file inside the loaded folder, the CSV filename will be used as
the data name. However, if multiple CSV files have been loaded, the data name will be
derived by changing the last two characters of the CSV filename to ##.
• If you only wish to load one CSV file from a folder, see "Loading Files" (p.12).
• When you load a folder containing CSV files with different measurement dates or
measurement start times, only the data with the earliest measurement start time will
be displayed. To load multiple data with different measurement dates or measurement
start times, either load separate folders that contain only the data you wish to display,
or load the desired files separately using “Load (Specify folder)”.
• Filenames can be checked and changed on the “Loading the file” dialog box.
9
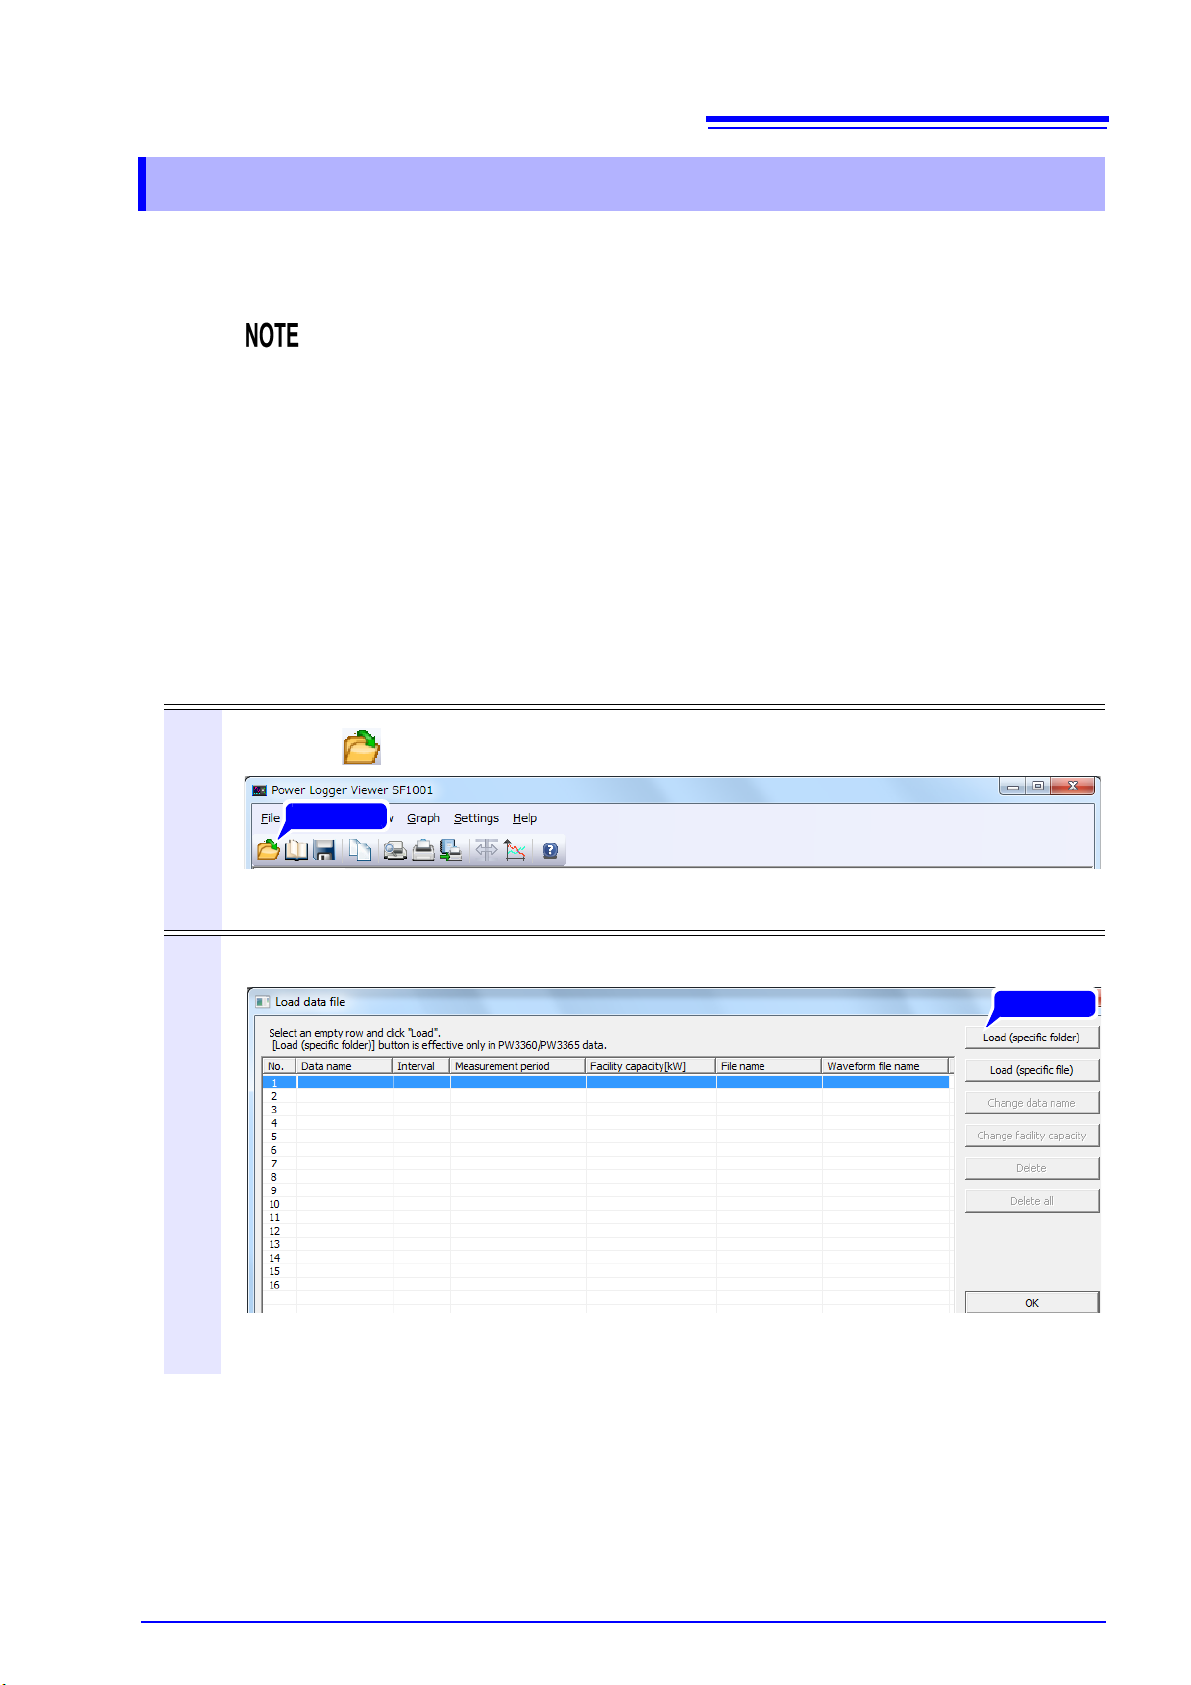
1
2
Click the button on the tool bar.
The “Load data file” dialog will appear.
Click the [Load (specific folder)].
The “PW3360 Load data specified folder” dialog will appear.
Page 16

10
2 Click
1 Click
2.4 Loading a Measurement-data File
3
4
Select a folder to be loaded, and click [OK].
The “Loading the file” dialog will appear.
5
The CSV files in the folder will be loaded into the selected list row (up to 16 sets of data).
Click [OK].
Page 17

11
2.4 Loading a Measurement-data File
• Subsequent data loading times can be reduced by saving loaded data as a combined
file. For more information about how to create a combined file, see "2.6 Saving in a
Combined File Under a New File Name" (p.23).
• When loading multiple large CSV files, the application may initially display “file merging.”
• Folders containing 2 GB or more data cannot be loaded. An error message will be displayed.
• If there is a folder named “HARMONIC” in the selected folder and a harmonic data file
(with the extension .HRM) that has the same filename as the CSV file in that folder,
the harmonic data file will also be loaded.
• If there is a folder named “AUTOWAVE” in the selected folder and a waveform data
file (with the extension .WUI) that has the same filename as the CSV file in that folder,
the waveform data file will also be loaded.
• Harmonic and waveform data files cannot be loaded independently.
• If the ABC folder is loaded as part of the folder hierarchy shown below, the following
files will be loaded: ABC00.CSV, ABC00.HRM, and ABC00.WUI.
Page 18

12
Click
Click
1 Click
2 Click
2.4 Loading a Measurement-data File
Loading Files
Load data files of Model PW3360, model PW3365, or model 3169.
1
2
Click the button on the tool bar.
The “Load data file” dialog will appear.
Select an empty number in the list and click [Load (specific file)].
3
The “Open” dialog will appear.
Select a data file to be loaded, and click [Open].
Page 19

13
2.4 Loading a Measurement-data File
4
5
The “Load data file” dialog will appear.
The file will be loaded into the selected list row.
Up to 16 data files can be loaded.
To load multiple files, perform this procedure after selecting a list number for each file.
Click [OK].
The loaded file data will be displayed.
Page 20

14
PW3360 measurement data file
One 1P2W circuit
Save items: All data (no Harmonic)
Data size: 200 MB
Computer system architecture
CPU : Intel Core i5-2400s 2.5GHz
OS : Microsoft Windows7 Professional
Memory : 4GB
Loading time:
Approx. 50 min.
2.4 Loading a Measurement-data File
• Subsequent data loading times can be reduced by saving loaded data as a combined
file. For more information about how to create a combined file, see "2.6 Saving in a
Combined File Under a New File Name" (p.23).
• Only files containing measurements made by the PW3660, the PW3365, or the 3169
can be loaded using the “Load files” command. Combined files cannot be loaded.
When loading combined files, see "Loading a Combined File" (p.24).
• It takes time to load large files. Load times will vary with the system configuration of
the computer being used.
A rough guide for loading times is provided below:
• For model PW3360 and model PW3365, Harmonic and waveform data files cannot be
loaded independently. If there is a folder named “HARMONIC” in the same folder as
the selected CSV file and a harmonic data file (with the extension .HRM) that has the
same filename as the CSV file in that folder, the harmonic data file will also be loaded.
• For model PW3360 and model PW3365, Waveform data files cannot be loaded independently. If there is a folder named “AUTOWAVE” in the same folder as the selected
CSV file and a waveform data file (with the extension .WUI) that has the same filename as the CSV file in that folder, the waveform data file will also be loaded.
• For Model 3169, if there is a waveform data file that is the same type as the CSV file
(extension: WUI), the waveform data file will also be loaded .
If the name of the waveform data file differs from that of the measurement data file, no
waveform data file can be loaded together with the loaded measurement data file.
For files that was automatically named and saved with Model 3169, if the numbers
“XX” in the name of the measurement data file “69MEASXX.CSV” differs from those in
the name of the waveform data file “69WAVEXX.WUI”, no waveform data file can be
loaded.
Harmonic and waveform data files cannot be loaded independently.
• For loading multiple data files, all of the files must have been obtained for a measurement period of one year or less.
Page 21

Changing a Data Name
Click
Click
15
2.4 Loading a Measurement-data File
1
2
Click the button on the tool bar.
The “Load data file” dialog will appear.
Select the number of the data file you wish to change from the list and click
[Change data name].
The data name will change only within the SF1001 application. The names of loaded files will not
change. Data names can be up to 127 characters in length.
Page 22

16
Click
2 Click
1 Click
1 Input
2 Click
2.4 Loading a Measurement-data File
Changing the Facility Capacity Setting
You can calculate the demand factor for the active power demand value (consumption) by setting the
equipment capacity*. The demand factor is displayed at the bottom of the table on the Report: Daily/
Weekly/Monthly tab. The demand factor is not displayed initially because the default setting for the equipment capacity is 0 kW.
* Total of the rated capacity (maximum value for the product of the allowable voltage and current) for each
load installed on the equipment you wish to measure
1
2
Click the button on the tool bar.
The “Load data file” dialog will appear.
Select the number of the data file you wish to change and click [Change facility
capacity].
The “Change facility capacity” dialog will appear.
3
Enter a capacity for each circuit, and click [OK].
You will only be able to change the setting for the measurement data circuits.
Page 23

Deleting a Data File from the List
Click
1 Click
2 Click
17
2.4 Loading a Measurement-data File
1
2
Click the button on the tool bar.
The “Load data file” dialog will appear.
Select the number of the data file you wish to delete from the list and click [Delete].
A confirmation message will appear.
3
Click [Yes].
The selected data file from the list will be deleted.
Loaded data will not be deleted when data files on the list are deleted.
Page 24

18
Click
Click
2.4 Loading a Measurement-data File
Deleting All Data Files on the Llist
1
2
Click the button on the tool bar.
The “Load data file” dialog will appear.
Click [Delete all].
3
A confirmation message will appear.
Click [Yes].
All data files from the list will be deleted.
Loaded data will not be deleted when data files on the list are deleted.
Page 25

2.4 Loading a Measurement-data File
2 Click
1 Click
2 Click
1 Click
Loading data logger recorded data
To load data recorded by a data logger with the SF1001 application, it must be opened with the LR5000
utility software and converted.
19
1
2
Select [Settings]-[Convert data loggers recorded data] on the menu bar.
The “Open” dialog will appear.
Select a data file to be loaded, and click [Open].
Specify the LR5000 representative file (.hrp2).
Page 26
20
2.4 Loading a Measurement-data File
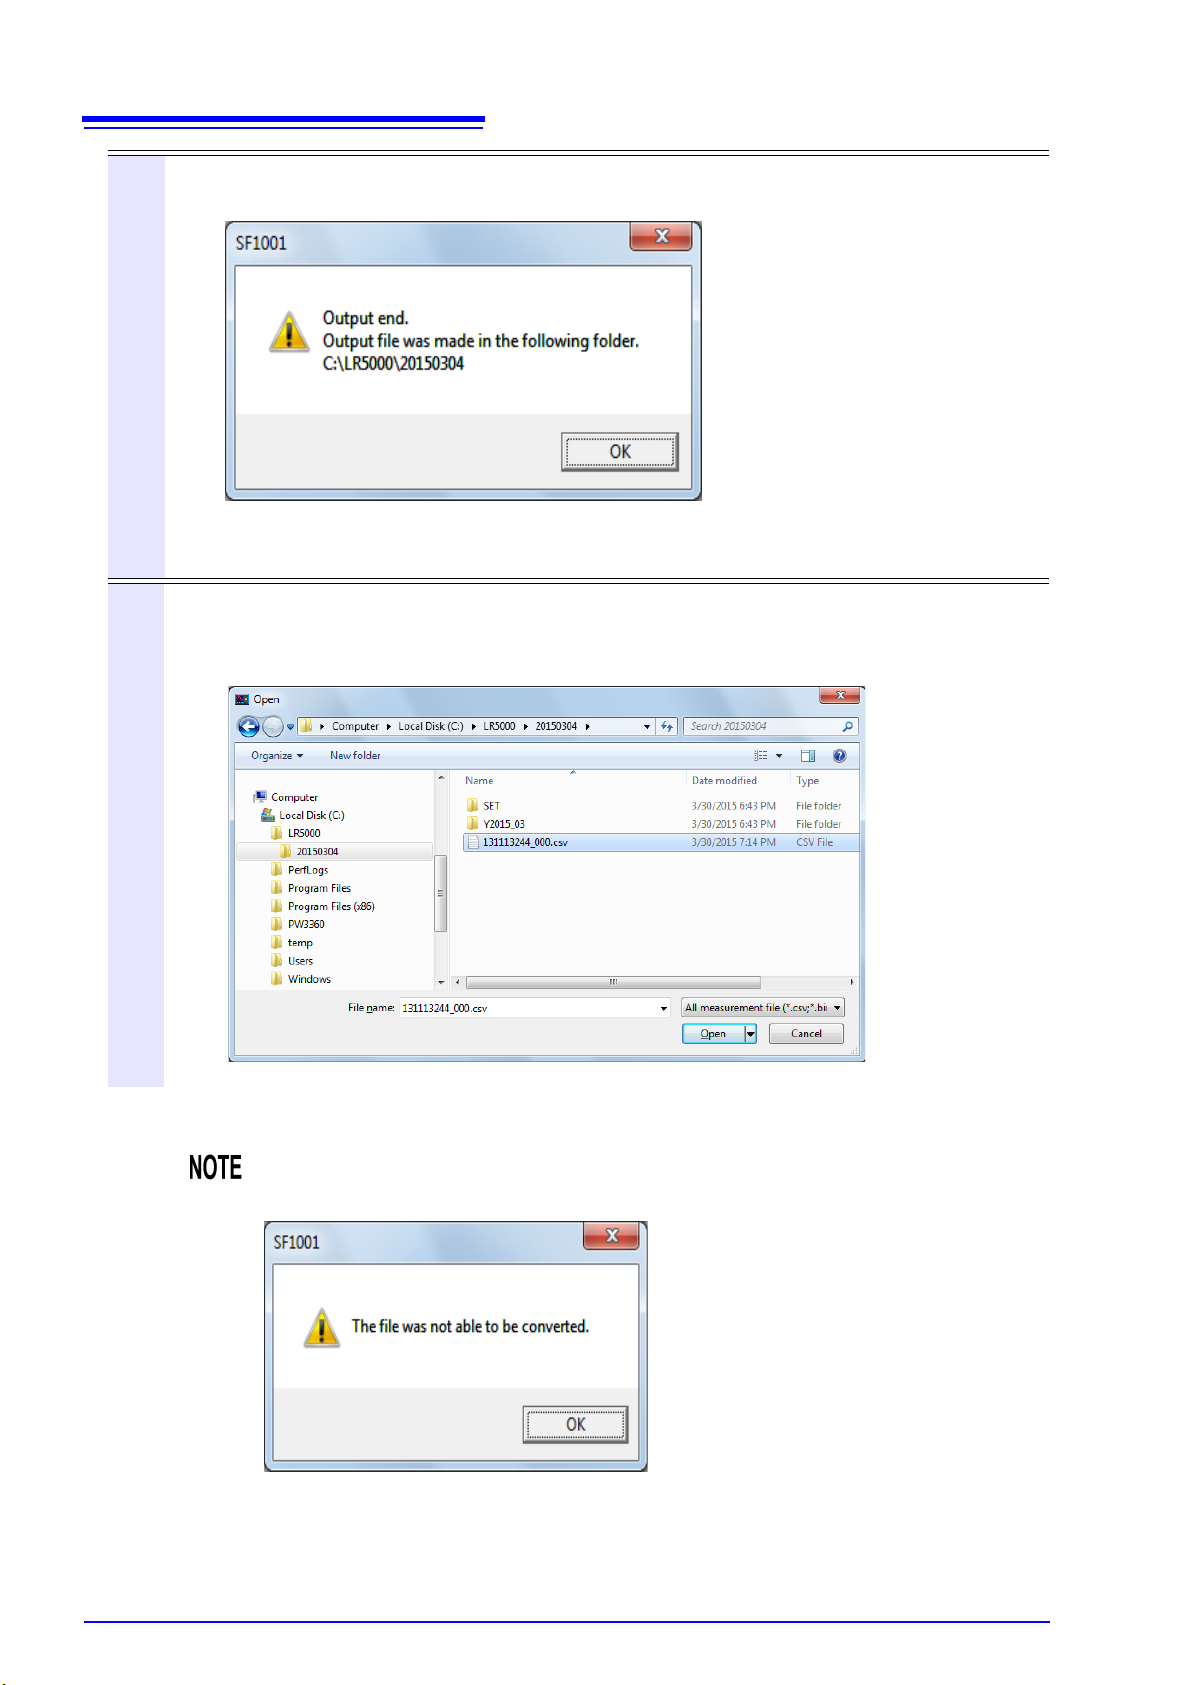
3
4
A message will be displayed when the conversion is complete. Click [OK].
The converted file will be output into a folder with the same name as the LR5000 representative
file (.hrp2) located one level lower in the file hierarchy than the original file.
Load the output file.
For more information about how to load the file, see "Loading Files" (p.12).
• "If the software is unable to convert the file (for example if the necessary files are not
available), an error message will be displayed.
• If the specified LR5000 representative file (.hrp2) contains multiple sets of data
recorded by the data logger, each set of data will be output into its own converted file.
Page 27
2.5 Saving Data in CSV Format
2 Click
1 Click
2.5 Saving Data in CSV Format
Parameters displayed on the Time-series Graph screen, Summary screen, Daily/Weekly/Monthly Report
screen, and Waveform screen as well as data for the displayed time period can be saved as a CSV-format file. Harmonic graph screen, Harmonic list screen, and Settings screen content cannot be saved.
Saved CSV files can be used to create reports using commonly available computer spreadsheet programs.
21
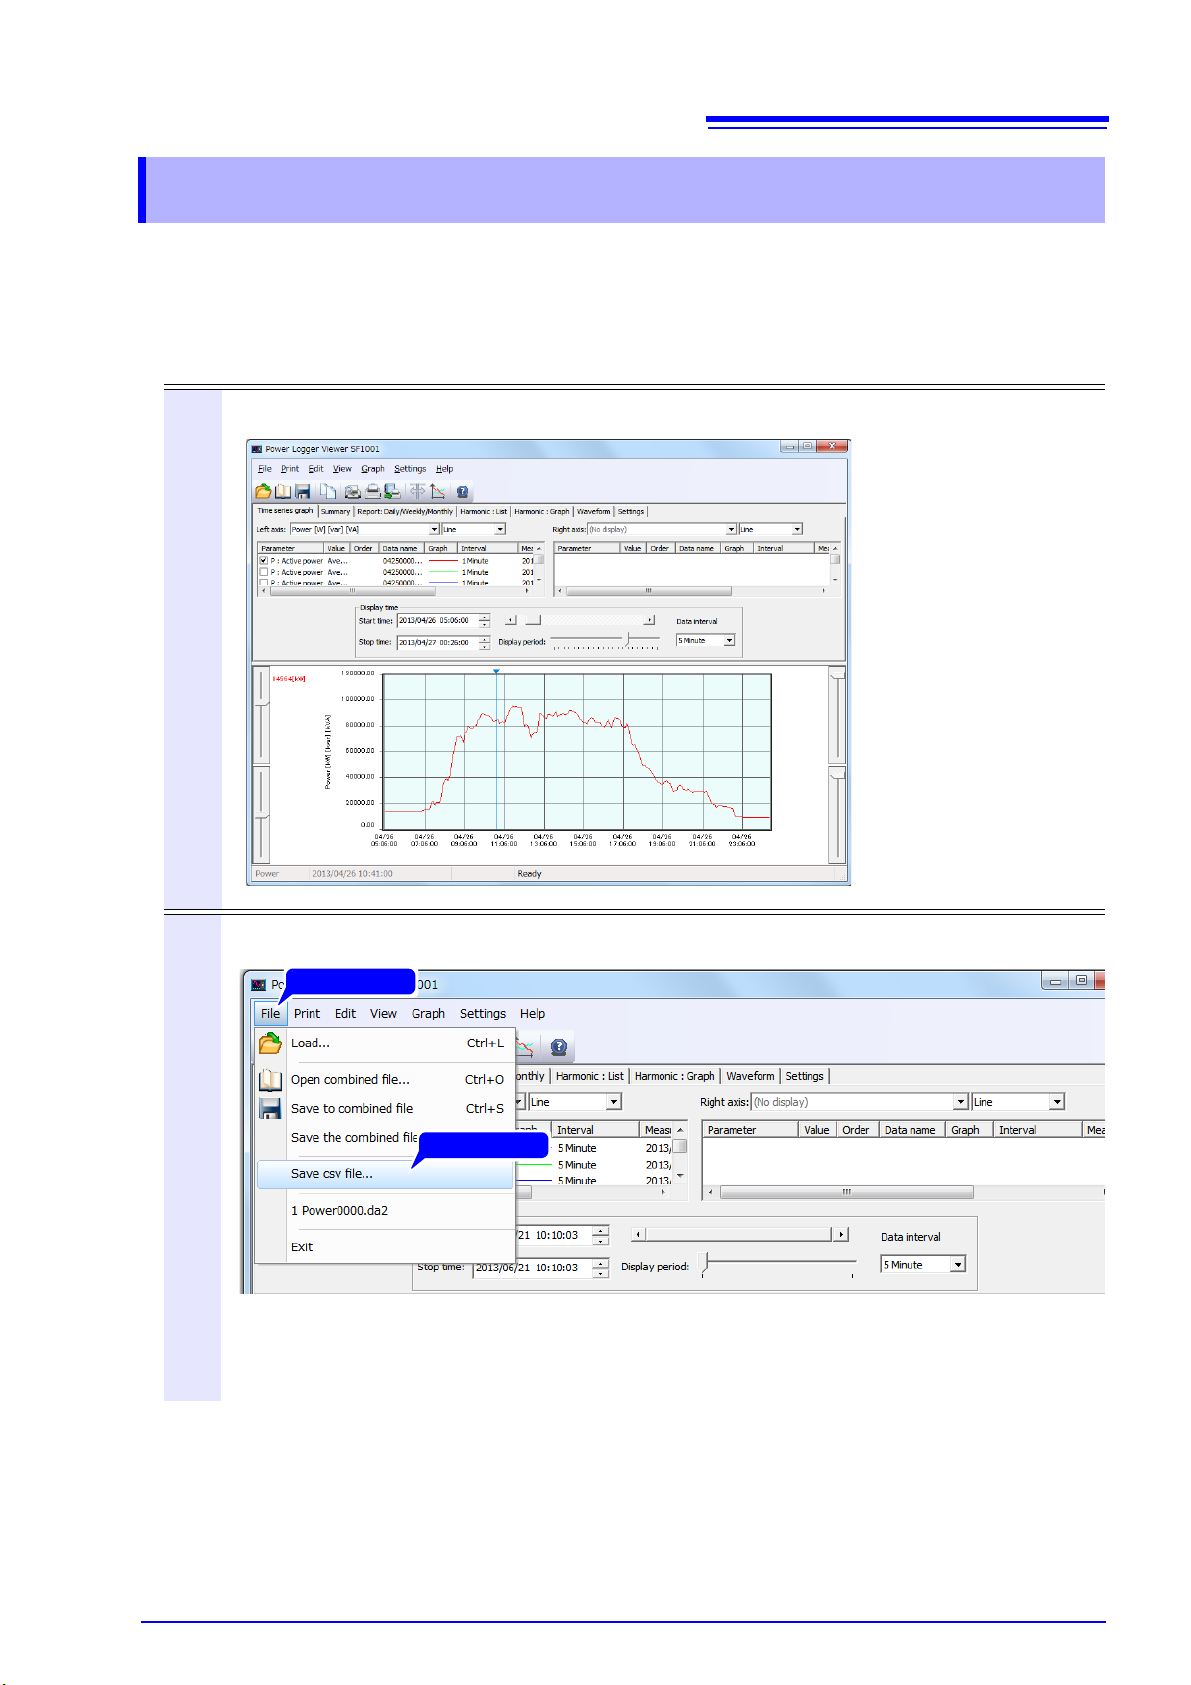
1
2
Display the screen from which to save data in CSV format.
Select [File]-[Save csv file] on the menu bar.
The “Save as CSV file” dialog appears.
Page 28
22
1 Input
2 Click
2.5 Saving Data in CSV Format
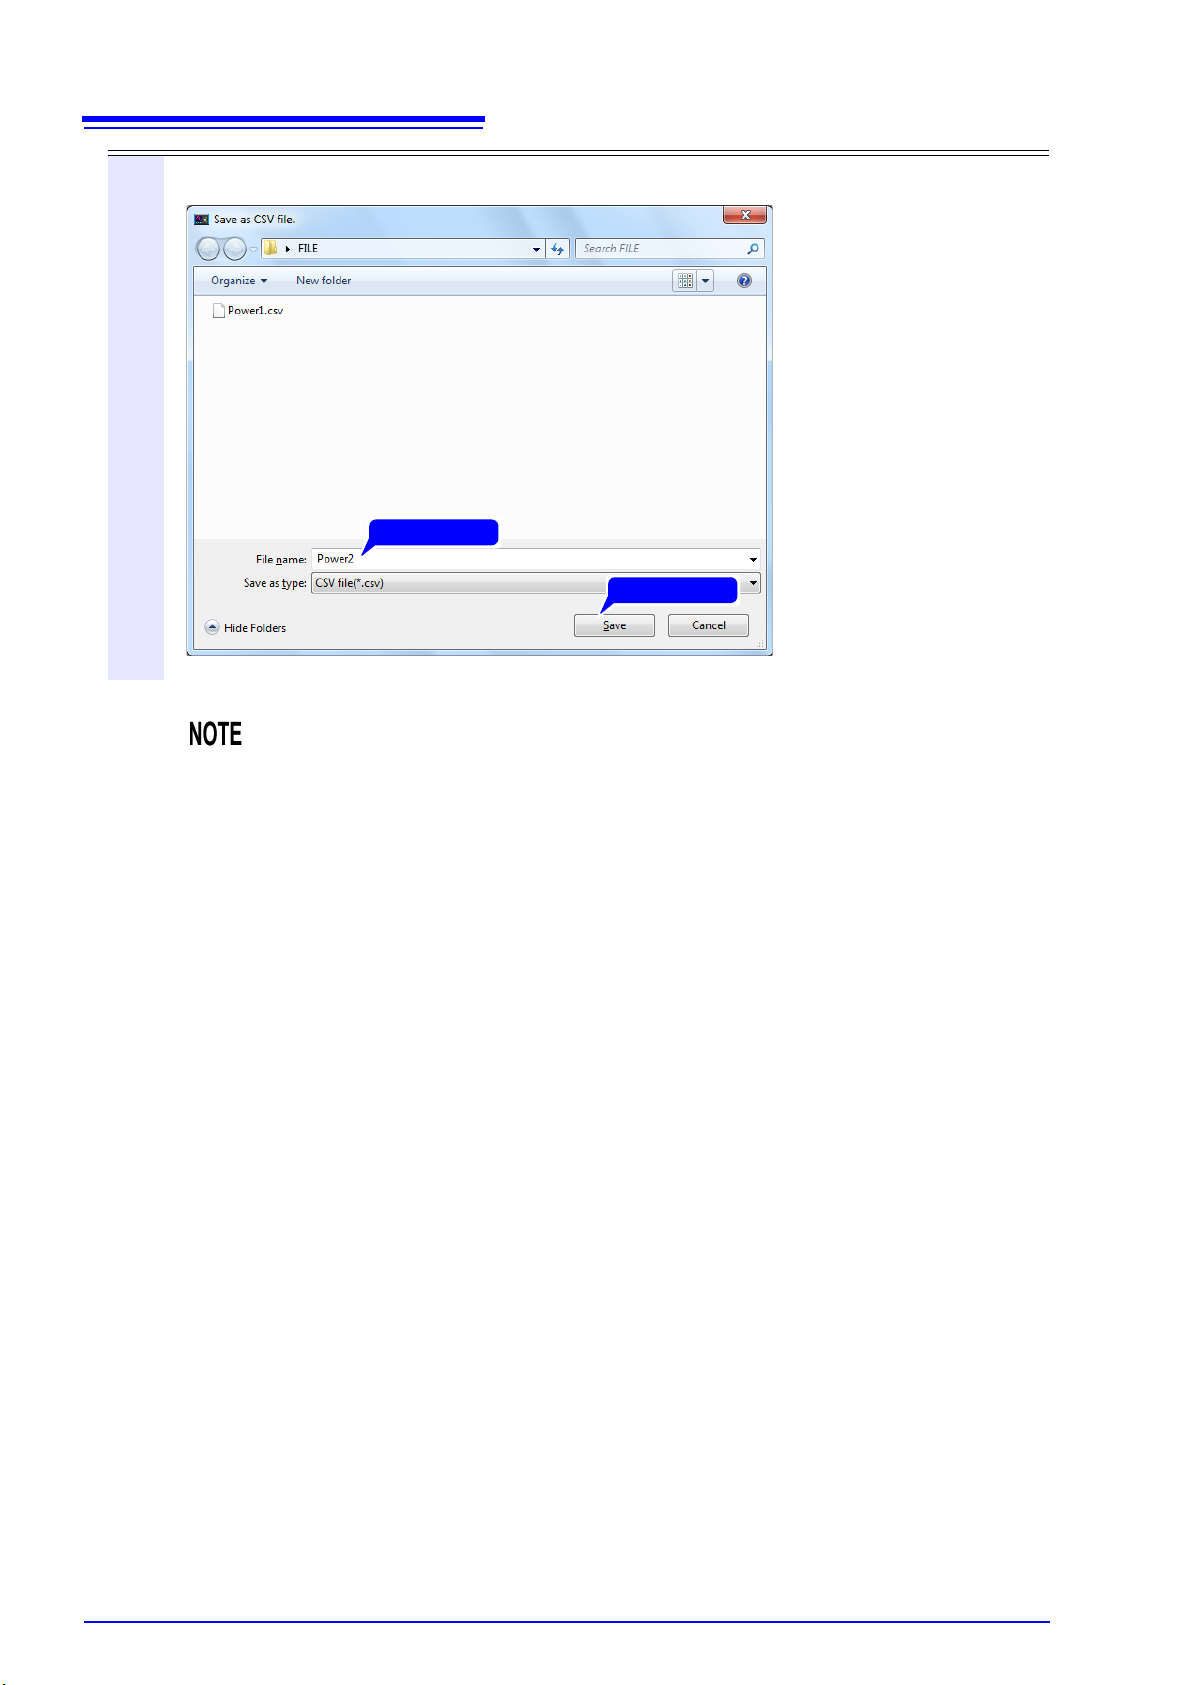
3
Enter a filename, and click [Save].
Data saved as a CSV-format file cannot be loaded by the SF1001 application.
Page 29
2.6 Saving in a Combined File Under a New File Name
1 Click
2 Click
1 Input
2 Click
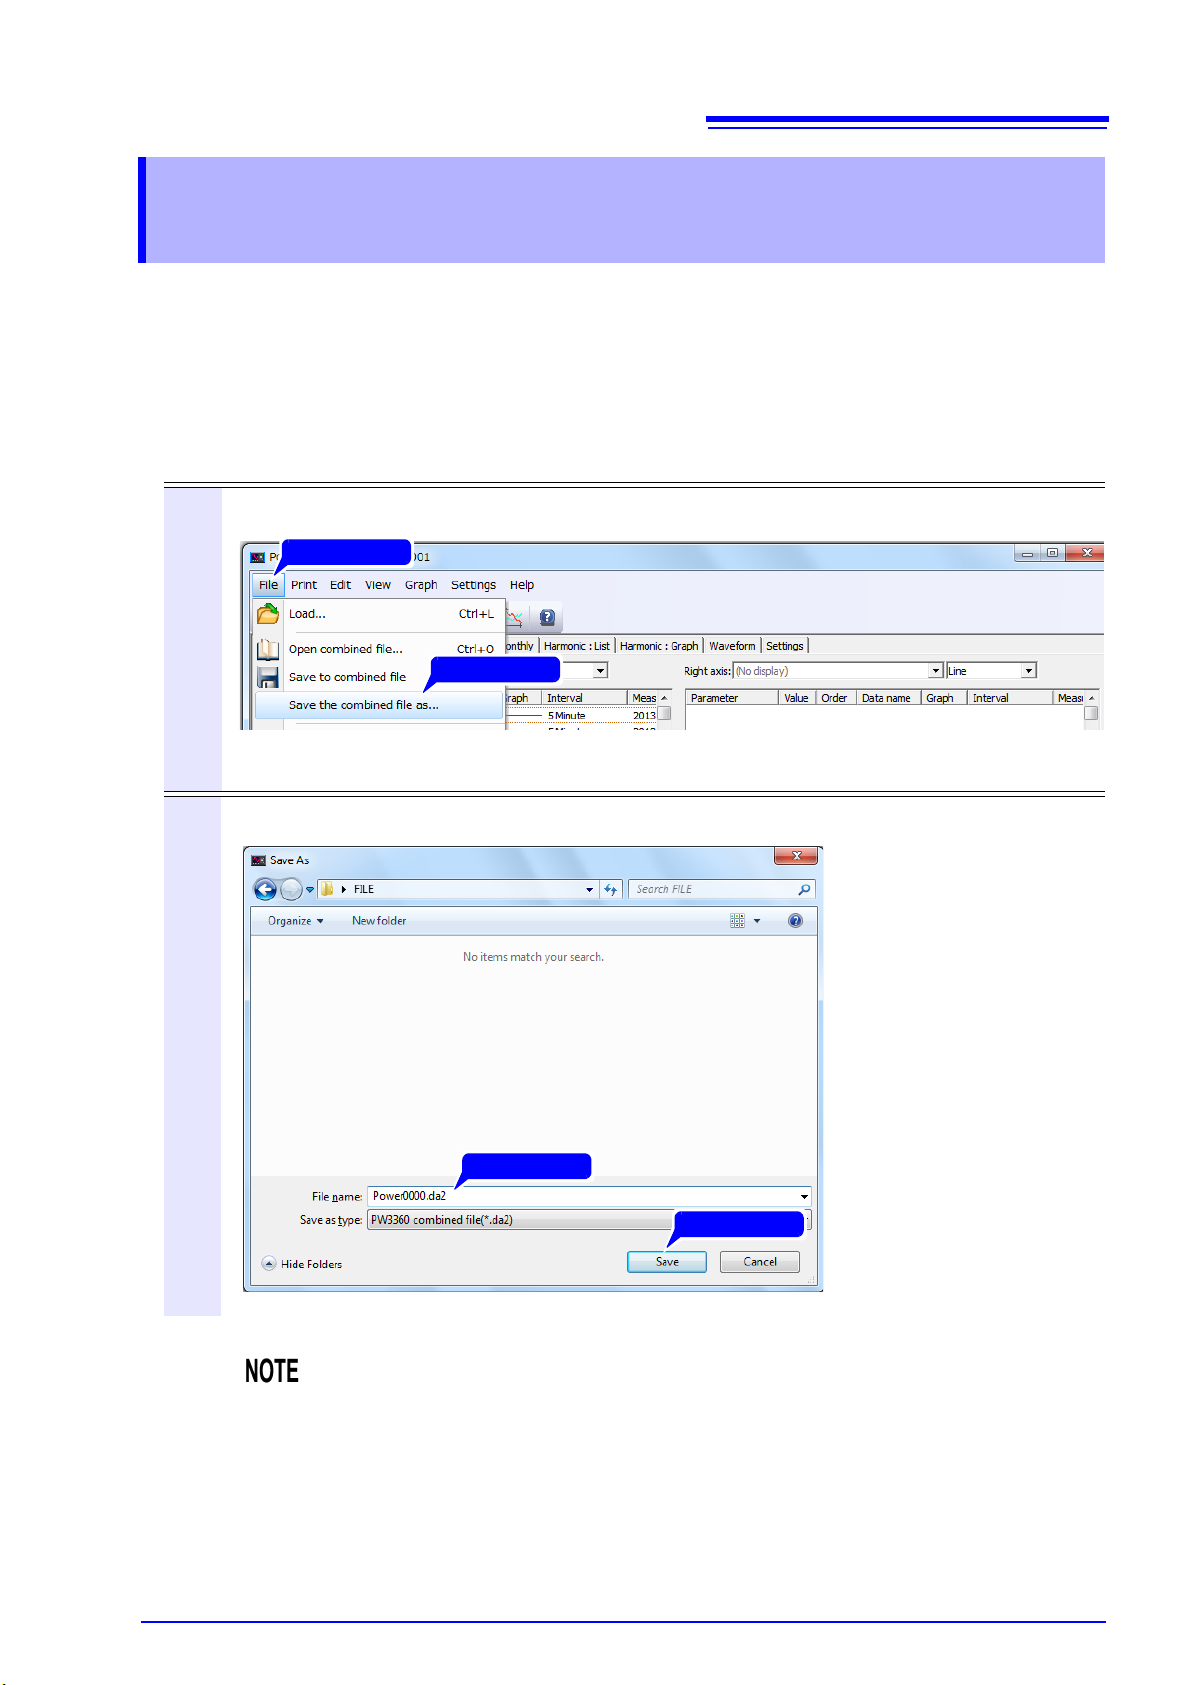
2.6 Saving in a Combined File Under a New File
Name
Combine loaded data files into one file, and save the file as a new combined file. (Extension: da2)
What is a combined file?
A combined file is a single file that contains up to 16 sets of PW3360, PW3365, or 3169 measurement
data. Data handling can be simplified by combining multiple data files into a single data set stored as a
combined file. Additionally, since the size of the data is reduced when it is converted into a combined file,
data loading times can be reduced.
23
1
2
Select [File]-[Save the combined file as] on the menu bar.
The “Save As” dialog will appear.
Enter a filename, and click [Save].
Maximum data capacity that can be stored in the integrated file is 2GB.
Page 30
24
2 Click
1 Click
Click
2.6 Saving in a Combined File Under a New File Name
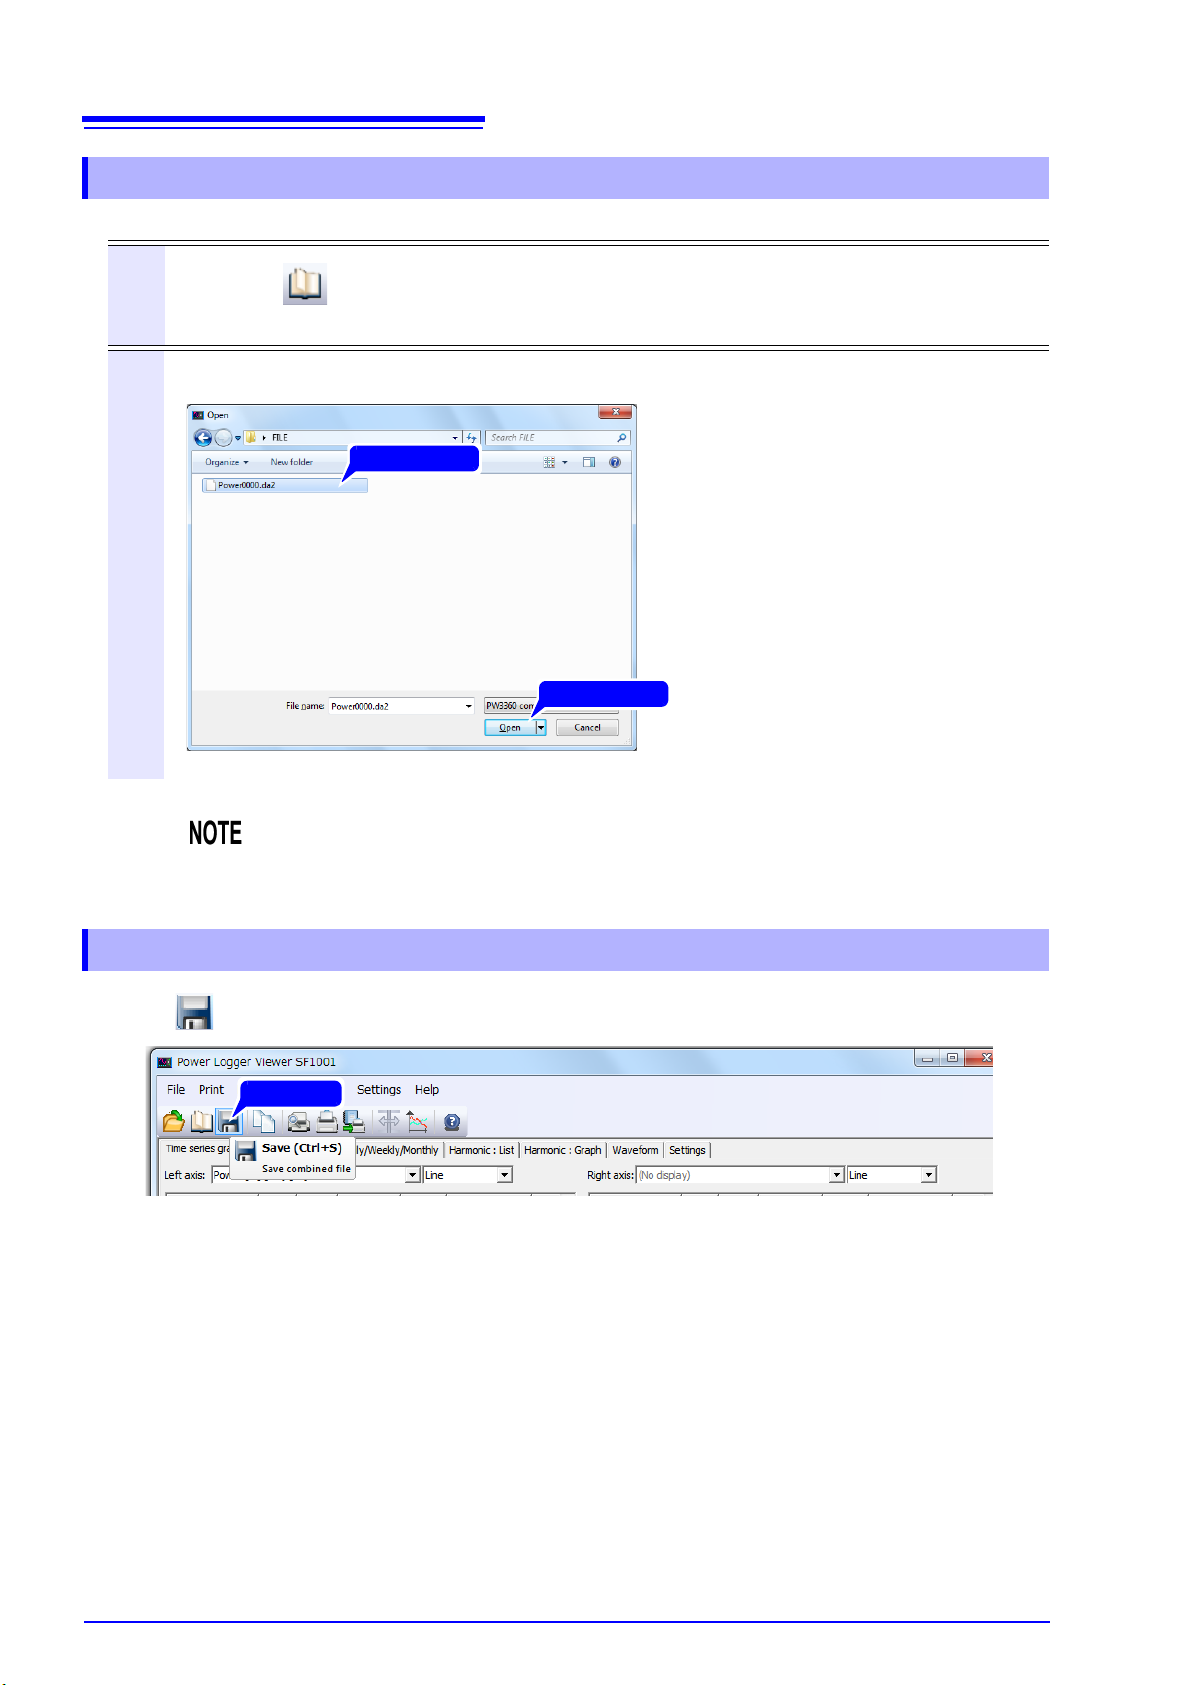
Loading a Combined File
1
2
Click the on the tool bar.
The “Open” dialog will appear.
Select a combined file to be loaded, and click [Open].
• When a combined file is loaded, the previously loaded data will be deleted.
• Multiple combined files cannot be loaded at the same time. To load multiple files, you
must load one combined file and then load the remaining data as CSV files.
Saving a Combined File
Click on the tool bar to save the combined file (by overwriting).
Page 31

2.7 Settings at Startup of the SF1001
2 Click
1 Click
1 Click
2 Select
2.7 Settings at Startup of the SF1001
This section describes how to set whether to load the last files in use or revert the application to its default
state when launched. By default, neither option is checked. Please set as necessary.
25
1
2
Select [Settings]-[Options] on the menu bar.
The “Open” dialog will appear.
Display the [Other] tab and select one of the checkboxes.
3
Click [OK].
To discard changes, click [Cancel].
• If “Start with default settings at the next restart” is checked, “Load previous file when
starting” is ignored.
• The “Load previous file when starting” will take effect the next time the application is
launched. If the location of the files has changed, nothing will be loaded.
• The “Start with default settings at the next restart” will only take effect the next time the
application is launched.
• Reverting the application to its default state will have the effect of deselecting both
checkboxes.
Page 32

26
2 Click
1 Click
1 Click
2.8 Changing the Date of Measurement Data
2.8 Changing the Date of Measurement Data
This section describes how to change the measurement date and time for data saved by the PW3360 or
PW3365.
• The measurement date and time cannot be changed for measurement data saved by the 3168 or
3169.
• The measurement date and time can be changed for measurement data files and harmonic data
files. The measurement date and time cannot be changed for waveform data files.
1
2
Select [Settings]-[Change data time] on the menu bar.
The “Chenge data itme” dialog appears.
Click [Select file].
The “Open” dialog appears.
Page 33

27
2 Click
1 Click
2.8 Changing the Date of Measurement Data
3
Enter a filename, and click [Open].
Specify a measurement data file (.csv).
Page 34

28
2 Click
1 Input
2.8 Changing the Date of Measurement Data
4
Enter the desired change basis and click [Make file].
A confirmation message will be displayed.
5
Click [OK] to start converting the file.
A message will be displayed while the file is being converted.
If there is a harmonic data file (.hrm) corresponding to the measurement data file (.csv) that you
selected, it will be converted as well.
Page 35

29
2.8 Changing the Date of Measurement Data
6
A message will be displayed when the conversion is complete. Click [OK].
The converted file will be output into a new folder created with the name "ConvertXX" (where XX
indicates an automatically allocated value from 00 to 99) in the same folder as the specified measurement data file (.csv).
• A warning message will be displayed if you attempt to load a file other than a measurement data file from the PW3360 or PW3365.
• Specify either "Revised time" or "margin" as the change basis.
• To convert all measurement data files in the folder in which the specified measurement
data file is located, select the [Convert files in folder]
checkbox and click [Make file].
Page 36

30
2.8 Changing the Date of Measurement Data
Page 37

3.1 Screens
Screen
Configuration Chapter 3
3.1 Screens
The SF1001 application consists of seven screens. Click the tabs on the main screen to switch among
the screens.
31
Screen name Contents For more information
Time-series Graph
Screen
Summary Screen Displays a list of selected data "Chapter 5 Displaying Summary" (p.49)
Daily, Weekly, and
Monthly report
Screen
Harmonic List
Screen
Harmonic Graphic
Screen
Waveform Screen
Setting Screen Displays major setting information
Displays a time-series graph of
selected data
Displays a daily, weekly, or monthly
report of demand data
Displays a list of harmonic measurement data
Displays a graph of harmonic measurement data
Displays a graph of waveform data
"Chapter 4 Displaying a Time-series Graph" (p.35)
"Chapter 6 Displaying the Report: Daily/ Weekly/
Monthly" (p.59)
"Chapter 7 Displaying a Harmonic List" (p.73)
"Chapter 8 Displaying a Harmonic Graph" (p.79)
"Chapter 9 Displaying Measurement Data Waveforms" (p.87)
"Chapter 10 Displaying Settings for Measurement
Data" (p.95)
Page 38

32
Tool bar(p.34)
Status bar
Displays the time during cursor measurement, explanations of
the menu bar or tool bar, and the "Loading" message.
Menu bar(p.33)
3.2 Common Interface Elements and Functionality
3.2 Common Interface Elements and Functionality
Page 39

3.2 Common Interface Elements and Functionality
Menu Bar
The menu bar has the following menu options.
Menu Contents
File Load Load a data file.
33
Open combined file
Save to combined file
Save the combined file as
Save csv file
Recently opened combined file Display a list of the combined files worked on last.
Exit
Print Print
Print preview
Report printing
Header settings
Printer settings
Edit Copy
View Toolbars
Open a combined file.
Save a combined file.
Save in a combined file under a new filename.
Save the data of the displayed measurement item in CSV
format.
Exit the SF1001.
Print the currently displayed screen.
Display a print preview of the currently displayed screen.
Print a report for the set period of time.
Set the logo and title to use when printing reports as well
as the comments to display.
Configure printer settings.
Copy the currently displayed screen to the clipboard.
Set whether to display the tool bar.
Tool button
Graph Change vertical axis settings
Settings Change column width
Change display maximum number
Options
Change data time
Convert data logger recorded data
Help About
Open help file
Change the button size and set whether to display button
labels.
Display the “Vertical axis setting” dialog for a graph.
Change the column width in the list display.
Change the maximum number of display items.
Display the “Options” dialog box for setting the display
units, and other parameters (background color for graphs,
rendering interval, and startup state).
Change the data's measurement date and time.
Convert and output data recorded by a data logger so that
it can be opened by the SF1001 application.
Display version information.
Open the user manual.
Page 40

34
Load data file
Open combined file
Save to combined file
Copy display
Print preview
Print
Change vertical axis setting
Change column width
Report printing
Open help file
3.2 Common Interface Elements and Functionality
Toolbar
Pasting to the Clipboard
Click the button, or select [Edit]-[Copy] on the menu bar.
The currently displayed screen can be pasted to the clipboard and worked on using another program,
such as a word-processing program.
Page 41

35
Selection of data parameter
shown on left axis of graph (p.36)
Graph type
selection
(p.36)
Selection of data parameter shown on
right axis of graph (p.36)
Graph type
selection
(p.36)
Display-range
scrolling
(p.41)
Display-period
setting
(p.42)
Data-interval
setting
(p.39)
Vertical-axis
upper-limit
slider (right)
Cursor measurement value(p.43)
Vertical-axis
lower-limit
slider (right)
Cursor
(p.43)Cursor-indicated time
Vertical-axis
lower-limit
slider (left)
Vertical-axis
upper-limit
slider (left)
Display start/
stop time setting
(p.40)
Detail item
selection (p.37)
Click
Cursor measurement
value(p.43)
Displaying a
Time-series
Graph Chapter 4
Display a time-series graph of selected data. Click the “Time-series graph” tab to display.
Page 42

36
4.1 Select Data Items and Graph type to Display
4.1 Select Data Items and Graph type to Display
Select a data item for each of the left and right axes of the graph.
Select a graph type (line, bar, and stacked bar graphs) for each axis.
Stacked bar graphs are available for demand and demand value (excluding the power factor) only.
Page 43

4.2 Select Detail Items
(1) (2) (3) (4) (5) (6) (7)
Check boxes
(8) (9) (10)
4.2 Select Detail Items
Select the checkbox for the items you wish to graph.
(1) Parameter
Check the box of each item to be displayed.
Click (1) on the parameter of an item, and a list of selectable parameters will appear. Select an item to
display from the list.
37
(2) Value
Click (2) on the value of an item, and a list of selectable data types (instantaneous, average, maximum,
and minimum) will appear. Select a data type from the list.
If the loaded data contains only average values, you will only be able to select average values as the data
type. You will not be able to select electrical energy, demand quantity, demand value, pulse input value,
or electricity charges.
(3) Circuit
Click (3), and the selectable circuit numbers will be displayed. Select a circuit number to be displayed.
(4) Order
Click (4) on the value of an item, and a list of selectable harmonic data degree will appear. Select the
order to display.
(5) Data name
Click (5) on the data name, and a list of selectable data names will appear. Select the name of the data to
be displayed.
Page 44

38
Check to set the display name of each item separately.
Select and enter a symbol from the symbol list.
You may also enter any desired character.
4.2 Select Detail Items
(6) Graph
Click (6) on the graph, and the “Change graph format” dialog will appear.
This box allows the line color, line style, line width, frame of bar graph, marker color, marker type, and
marker size to be set.
Line styles can be changed only when line width is set to 1.
(7) Interval
Display the measurement interval of the data to be loaded.
(8) Measurement period
Display the measurement period of the data to be loaded.
(9) File name
Display the file name of the data to be loaded.
(10) Display name
Set the name of each display item to be used in printout.
Click (10) on the display name, and the “Display name” dialog will appear.
The display name setting applies to time-series graph screen copies and when printing.
Page 45

4.3 Set Data Interval for the Displayed Data
Click
4.3 Set Data Interval for the Displayed Data
This section describes how to set the data interval to determine the interval time for the data being displayed.
39
• An interval smaller than the interval of the loaded data cannot be set.
• When multiple pieces of data have been loaded, a larger interval will be used.
• If the data interval is set to other than an integral multiple of the measurement interval,
the display may not show the actual data.
Page 46

40
Start time End time
4.4 Setting the Graph Display Start and End Time and Date
4.4 Setting the Graph Display Start and End
Time and Date
This section describes how to set the start and end times for the graph display.
If the display start time is set to a time other than (measurement start time + the displayed time) will differ from the actual time. Thus, measurements made immediately
before the displayed time of each interval will be displayed as made at the actual time.
Page 47
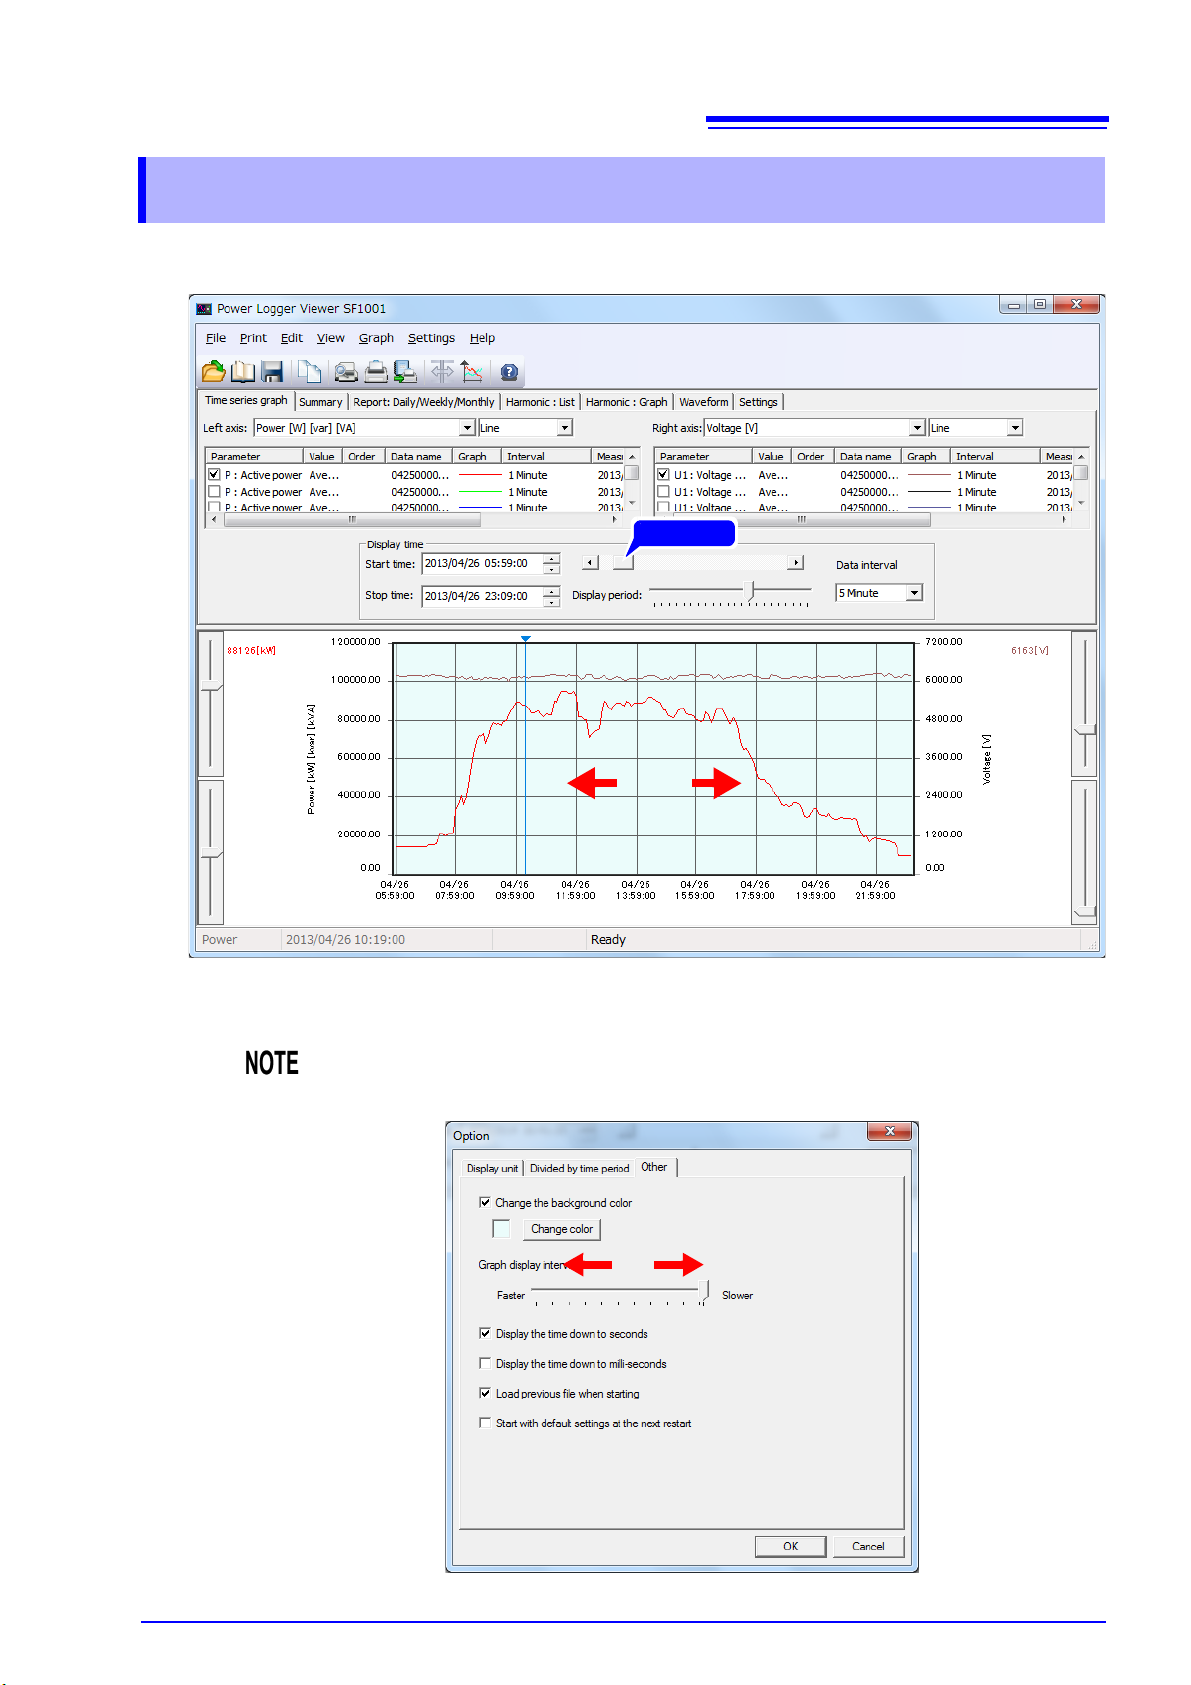
4.5 Move Display Range
Scroll
The display range may be changed by moving the scroll bar.
41
4.5 Move Display Range
If the graph renders slowly, change the graph rendering interval under [Option]-
[Other]-[Graph display interval].
Page 48

42
Scroll
Scroll
4.6 Set Display Period
4.6 Set Display Period
The display period may be changed by moving the slider.
• The maximum number of graph data points that can be displayed on a single screen
can be changed under [Settings]-[Change display maximum number].
See:"4.9 Changing the Maximum Number of Display Items" (p.45)
• The data interval, display times, and display period are linked to the Summary screen
settings.
• Up to 10,000 data points can be displayed on the graph. Depending on the maximum
number of display items and data interval settings, it may not be possible to simultaneously display the graph start and end times.
Page 49

4.7 Displaying the Value at the Cursor Position
Measured value
at cursor position
(left axis)
Cursor
Click
Measured value
at cursor position
(right axis)
4.7 Displaying the Value at the Cursor Position
Click in the graph display area, and the cursor will appear. The measurement of the point at which the
cursor is located will be displayed. The cursor can also be moved using the and keys on the key-
board. To hide the cursor, click anywhere outside the graph display area.
43
Page 50

44
Click
4.8 Set Vertical Axis
4.8 Set Vertical Axis
1
2
Click the on the tool bar.
The “Vertical axis settings” dialog will appear.
Set the vertical axis.
3
Click the [OK].
Parameters Description
Left axis,
Right axis
Grid
Reference
Value
Changes the upper limit value (Max) and lower limit value (Min) for the vertical axis.
(These values are usually set automatically.) The values can also be changed using the
vertical slider.
Show or hide the grid line. Set the color and line style.
Show or hide the reference value. Set the value, color, and line style.
The grid color of the time axis is determined by the grid color of the left axis.
Page 51

45
1 Click
2 Click
4.9 Changing the Maximum Number of Display Items
4.9 Changing the Maximum Number of Display
Items
Set the maximum displayable number of items along the time axis.
1
2
Select [Settings]-[Change display maximum number] on the menu bar.
The “Display maximum number” dialog will appear.
Set the maximum number of display items on the graph as necessary.
This setting will also be applied to the number of Summary display items.
3
Click the [OK].
• The setting will take effect the next time the application is launched.
• By default, 336 data points (7 days’ of data with a 30 min. recording interval) are
shown.
Page 52

46
1 Click
2 Click
Selecting this checkbox causes data to be displayed using the number of measurement data
digits, without regard to the number of decimal places setting.
1 Click
2 Deselect
4.10 Change Display Unit
4.10 Change Display Unit
1
2
Select [Settings]-[Options] on the menu bar.
Deselect the [Display by the number of digits in default setting.] checkbox on the “Dis-
play unit” tab.
3
4
Set the display unit for measurement value, and the number of decimals
Click the [OK].
Page 53

4.11 Change Background Color
1 Click
2 Click
1 Click
3 Click
2 Check
1 Select
2 Click
47
4.11 Change Background Color
1
2
Select [Settings]-[Options] on the menu bar.
Check the “Change the background color” box and click the [Change color].
3
4
The ”Color” dialog will appear.
Select a background color.
Click the [OK].
• The graph background color applies only to the SF1001 graph display and screen
copies.
• White is used as the graph background color during screen and report printing.
Page 54

48
1 Click
2 Click
1 Click
2 Check
4.12 Set time display down to seconds or lower digit
4.12 Set time display down to seconds or lower
digit
Set whether to display the time down to seconds and milliseconds.
Configure this setting as appropriate.
The setting also applies to the time displays in the daily, weekly, and monthly reports.
1
2
Select [Settings]-[Options] on the menu bar.
Display the [Other] tab and select the [Display the time down to seconds] checkbox.
3
Click [OK].
To discard changes, click [Cancel].
When the data saved with Model 3196 with the short-term interval set to “Full wave” are
displayed with the data interval set to “Full wave”, they are displayed down to not milliseconds but seconds.
Page 55

49
Display-range
scrolling
(p.54)
Display-period
setting
(p.55)
Data-interval
setting
(p.52)
Screen
scrolling
(p.56)
Screen scrolling(p.56)
Display date
and time setting
(p.53)
Detail item
selection
(p.50)
Click
Displaying
Summary Chapter 5
Display a list of numerical values of selected data. Click the “Summary” tab to display.
Invalid data is displayed as a blank.
Page 56

50
(1) (2) (4) (5) (6) (7) (8)
Check boxes
(9)
(3)
5.1 Select Data Items to Display
5.1 Select Data Items to Display
Choose up to 16 data items to display and select their checkboxes.
(1) Parameters
Check the box of each item to be displayed.
Click (1) on the parameter of an item, and a list of selectable parameters will appear. Select an item to
display from the list.
(2) Value
Click (2) on the value of an item, and a list of selectable data types (instantaneous, average, maximum,
and minimum) will appear. Select a data type from the list.
If the loaded data contains only average values, you will only be able to select average values as the data
type. You will not be able to select electrical energy, demand quantity, demand value, pulse input value,
or electricity charges.
(3) Circuit
Click (3), and the selectable circuit numbers will be displayed. Select a circuit number to be displayed.
(4) Order
Click (4) on the value of an item, and a list of selectable harmonic data degree will appear. Select the
order to display.
(5) Data name
Click (5) on the data name, and a list of selectable data names will appear. Select the name of the data to
be displayed.
(6) Interval
Display the measurement interval of the data to be loaded.
(7) Measurement period
Display the measurement period of the data to be loaded.
(8) File name
Display the file name of the data to be loaded.
Page 57

5.1 Select Data Items to Display
Check to set the display name of each item separately.
Select and enter a symbol from the symbol list.
You may also enter any desired character.
(9) Display name
Set the name of each display item to be used in printout.
Click (9) on the display name, and the “Display name” dialog will appear.
The display name setting applies to time-series graph screen copies and when printing.
51
As for power factor and displacement power factor averages taken over the period, simple average values are calculated.
Page 58

52
Click
5.2 Set Data Interval for the Displayed Data
5.2 Set Data Interval for the Displayed Data
Set a data interval for the displayed data.
• An interval smaller than the interval of the loaded data cannot be set. When multiple
pieces of data have been loaded, a larger interval will be used.
• If the start time is changed, the end time will be automatically changed accordingly.
Page 59

5.3 Set Display Time
Start time
End time
Set the start time and stop time of data to be displayed as a summary.
53
5.3 Set Display Time
• If the display start time is set to a time other than (measurement start time + an integral multiple of the measurement interval), the displayed time will differ from the actual
time. Thus, measurements made immediately before the displayed time of each interval will be displayed as made at the actual time.
• Since the number of display items is fixed, changing either the start time or the end
time causes the other parameter to be shifted by the same amount.
• Values in the [Average in the period], [Maximum value in the period], [Minimum
value in the period] rows are calculated from values of each parameter acquired dur-
ing the period entered under [Display time].
Page 60

54
Scroll
5.4 Move Display Range
5.4 Move Display Range
The display range may be changed by moving the scroll bar.
Page 61

5.5 Set Display Period
Scroll
The display period may be changed by moving the slider.
55
5.5 Set Display Period
The data interval, display times, and display period are linked to the Time series graph
screen settings.
Page 62

56
Scroll
Scroll
5.6 Scroll Screen
5.6 Scroll Screen
The screen can be scrolled up and down and right and left using the vertical and horizontal scroll bars.
Page 63

5.7 Change Display Unit
1 Click
2 Click
Selecting this checkbox causes data to be displayed using the number of measurement data
digits, without regard to the number of decimal places setting.
1 Click
2 Deselect
57
5.7 Change Display Unit
1
2
Select [Settings]-[Options] on the menu bar.
Deselect the [Display by the number of digits in default setting.] checkbox on the “Dis-
play unit” tab.
3
Set the display unit for measurement value, and the number of decimals.
Page 64

58
1 Click
1 Input
2 Click
5.8 Change Column width
5.8 Change Column width
1
2
Click the button on the tool bar.
The “Column width” dialog will appear.
Enter the table column width and click [OK].
Page 65

59
Display-range
scrolling
(p.64)
Report selection
(p.65)
Demand period
selection
(p.62)
Screen scrolling
(p.66)
Screen scrolling(p.66)
Start time
setting
(p.63)
Detail item
selection
(p.60)
When the [Pdem+ demand active power] parameter is selected, the active power demand value (consumption) total, average, maximum demand, maximum demand time, load
rate, demand rate, and Facility capacity will be displayed.
Click
Displaying the Report:
Daily/ Weekly/
Monthly Chapter 6
Display the daily, weekly, or monthly report of selected data.
Click the [Report:Daily/Weekly/Monthly] to display.
The daily report shows numerically the sum of measurements taken at intervals of 30 minutes or 1
hour for a day.
The weekly report shows numerically the sum of measurements taken at intervals of one day for a
week.
The monthly report shows numerically the sum of measurements taken at intervals of one day for
a month.
Average values are shown for all values except energy, demand quantity, demand value, pulse
input value, and electricity charges.
To calculate the demand factor, you must set the equipment capacity. Selecting [File]-
[Load] on the menu bar will display the “Load data file” dialog box, allowing you to set
the equipment capacity for each load.
Page 66

60
(1) (2) (3) (5) (6) (7) (8)
Check boxes
(4)
6.1 Select Data Items to Display
6.1 Select Data Items to Display
Select items to display and select their checkboxes.
(1) Parameters
Check the box of each item to be displayed.
Click (1) on the parameter of an item, and a list of selectable parameters will appear. Select an item to
display from the list.
(2) Circuit
Click (2), and the selectable circuit numbers will be displayed. Select a circuit number to be displayed.
(3) Data name
Click (3) on the data name, and a list of selectable data names will appear. Select the name of the data to
be displayed.
(4) Interval
Display the measurement interval of the data.
(5) Measurement period
Display the measurement period of the data.
(6) File name
Display the file name of the data.
Page 67

(7) Display name
Check to set the display name of each item separately.
Select and enter a symbol from the symbol list.
You may also enter any desired character.
Set the name of each display item to be used in printout.
Click (7) on the display name, and the “Display name” dialog will appear.
The display names are also used as form item names.
61
6.1 Select Data Items to Display
(8) Value
Display the data type.
Voltage waveform peak values and current waveform peak values display the maximum value and
energy, demand quantity, demand value, pulse input value, and electricity charges display a blank and
others display the average value.
As for power factor and displacement power factor averages, simple average values are
calculated.
Page 68

62
Click
6.2 Select Demand Period
6.2 Select Demand Period
Select a demand period for the data to be displayed at either 30 minutes or 1 hour.
An interval smaller than the measurement interval of the loaded data cannot be set.
Page 69

6.3 Set the Start Date
Input
6.3 Set the Start Date
Set the start date of the daily, weekly, or monthly report to be displayed. Depending on the tabulation
method, 1 day, 7 days, or 1 month from the start date is automatically displayed, so only the start date
need be set.
63
Page 70

64
Scroll
6.4 Move Display Range
6.4 Move Display Range
The display range may be changed by moving the scroll bar.
Page 71

6.5 Select a Report
Click
Select a report to be displayed from the daily, weekly, and monthly reports.
65
6.5 Select a Report
Page 72

66
Scroll
Scroll
6.6 Scroll Screen
6.6 Scroll Screen
The screen can be scrolled up and down and right and left using the vertical and horizontal scroll bars.
Page 73

6.7 Change Display Unit
1 Click
2 Click
Selecting this checkbox causes data to be displayed using the number of measurement data
digits, without regard to the number of decimal places setting.
1 Click
2 Deselect
67
6.7 Change Display Unit
1
2
Select [Settings]-[Options] on the menu bar.
Deselect the [Display by the number of digits in default setting.] checkbox on the “Dis-
play unit” tab.
3
Set the display unit for measurement value, and the number of decimals
Page 74

68
1 Click
1 Input
2 Click
6.8 Changing the Report Column Width
6.8 Changing the Report Column Width
1
2
Click the button on the tool bar.
The “Column width” dialog will appear.
Enter the table column width and click [OK].
Page 75

6.9 Displaying the Load Factor and Demand Factor
6.9 Displaying the Load Factor and Demand
Factor
The load factor and demand factor can be calculated and displayed in the last row of the form for the
[Pdem+ Demand active power (consumption)] parameter. The load factor indicates the extent of fluc-
tuations in power demand over the tabulation interval, while the demand factor indicates the maximum
power used as a percentage of the installed load equipment capacity.
If you select [Pdem+ Demand active power (consumption)] for multiple parameters, the total [Pdem+
Demand active power (consumption)] will be displayed in the last column.
69
• The calculation formula is given in "12.3 Calculation Formulas" (p.110).
• In order to calculate demand factor, you must first set the equipment capacity. For
more information about how to do so, see "Loading Folders (Model PW3360, Model
PW3365)" (p.9) to "Changing the Facility Capacity Setting" (p.16).
• Only Pdem+ parameters are added to calculate the total demand active power (consumption). Pdem+1, Pdem+2, and Pdem+3 parameters are not included.
Page 76

70
1 Click
2 Click
6.10 Displaying Active Energy by Time of Day
6.10 Displaying Active Energy by Time of Day
This section describes how to set operating hours and calculate active energy by time of day. This information
is displayed in the last line of the form under the [Pdem+ Demand active power (consumption)] item.
1
Select [Settings]-[Options] on the menu bar.
Page 77

71
Selecting this checkbox displays active energy values by time.
Operating hours are set in 30-minute
blocks. You cannot set hours that
span multiple dates.
Selecting this checkbox displays
electric charges.
Set the currency unit for electric
charges.
6.10 Displaying Active Energy by Time of Day
2
Set the operating hours and time divisions on the [Divided by time period] tab.
Up to four time divisions can be set.
Example display
3
• Electric charges are displayed for reference purposes only. (Displayed values cannot be used
for billing or to establish power use.)
• Electric charges displayed on the [Report: Daily/Weekly/Monthly] tab are calculated by mul-
tiplying the active power by the electric charge rate.
This value differs from the "electric charges" parameter output by the PW3360 and PW3365.
(Parameters outputted from the instrument are displayed on a time-series graph.)
• The operating system's currency symbol setting is used as the default value for the electric
charge currency unit.
• The default electric charge rate is $0.1/kWh. Change the setting as necessary.
Click [OK].
To discard changes, click [Cancel].
Page 78

72
1 Click
2 Click
Selecting this checkbox displays CO2
conversion value.
6.11 Displaying Active Energy Converted into CO2 Amount
6.11 Displaying Active Energy Converted into
CO2 Amount
The active energy can be converted into CO2 Amount and displayed.
1
2
Select [Settings]-[Options] on the menu bar.
Select the Display CO2 conversion values on the [Divided by time period] tab.
3
Click [OK].
To discard changes, click [Cancel].
• The CO2 converted value is equivalent to the integrated active power [kWh]
value multiplied by the CO2 conversion rate.
• The initial setting of the CO2 conversion rate is ”0.36 kg-CO2/kWh” so that
change the rate by yourself accordingly.
Page 79

73
Display time
setting
(p.76)
Selection of display channel (p.74)
Click
Displaying a
Harmonic List Chapter 7
This chapter describes how to display harmonic data for a user-specified time as a list of values.
The level, content percentage, and phase angle will be shown at the same time. If the loaded data
does not include harmonic data, this information cannot be displayed.
Click the [Harmonic:List] tab to display the screen.
When the display time is the time of the beginning of the data, a blank is displayed because there is no value.
Page 80

74
7.1 Select Data Channel to Display
7.1 Select Data Channel to Display
Select a data channel.
Page 81

7.2 Select Detail Items
(1) (2) (4) (6)
Check boxes
(7)(5)(3)
Select items to display.
(1) Parameter
Check the box of each CH to be displayed.
Select a CH to display from the list.
75
7.2 Select Detail Items
(2) Value
Click (2) on the value of an item, and a list of selectable data types (instantaneous, average, maximum,
and minimum) will appear. Select a data type from the list.
If the loaded data contains only average values, you will only be able to select average values as the data
type.
(3) Circuit
Click (3), and the selectable circuit numbers will be displayed. Select a circuit number to be displayed.
(4) Data name
Click (4) on the data name, and a list of selectable data names will appear. Select the name of the data to
be displayed.
(5) Interval
Display the measurement interval of the data to be loaded.
(6) Measurement period
Display the measurement period of the data to be loaded.
(7) File name
Display the file name of the data to be loaded.
Page 82

76
7.3 Setting the Display Time
7.3 Setting the Display Time
Set the display time using the display time text box or scroll bar.
Page 83

7.4 Change Display Unit
1 Click
2 Click
Selecting this checkbox causes data to be displayed using the number of measurement data
digits, without regard to the number of decimal places setting.
1 Click
2 Deselect
77
7.4 Change Display Unit
1
2
Select [Settings]-[Options] on the menu bar.
Deselect the [Display the number of digits in default setting.] checkbox on the “Display
unit” tab.
3
4
Set the display unit for measurement value, and the number of decimals
Click the [OK].
Page 84

78
7.4 Change Display Unit
Page 85

Displaying a
Display start
time setting
(p.82)
Detail item
selection
(p.80)
Selection of data parameter (p.80)
Cursor
measured
value
(p.82)
Cursor
(p.82)
Setting the
Axis to a Linear
Axis or LOG
Axis (p.82)
Click
Harmonic
79
Graph
This chapter describes how to display harmonic data for a user-specified time as a graph. A vector graph will be shown for [Harmonic phase angle power] data only. If the loaded data does not
include harmonic data, this information cannot be displayed. Click the [Harmonic:Graph] tab to
display the screen.
Chapter 8
Page 86

80
(1) (2) (4) (6)
Check boxes
(7) (8) (9)(5)(3)
8.1 Select Data Items to Display
8.1 Select Data Items to Display
Select a data item.
8.2 Select Detail Items
Select items to display.
(1) Parameter
Check the box of each item to be displayed.
Click (1) on the parameter of an item, and a list of selectable parameters will appear. Select an item to
display from the list.
(2) Value
Click (2) on the value of an item, and a list of selectable data types (instantaneous, average, maximum,
and minimum) will appear. Select a data type from the list.
(3) Circuit
Click (3), and the selectable circuit numbers will be displayed. Select a circuit number to be displayed.
(4) Data name
Click (4) on the data name, and a list of selectable data names will appear. Select the name of the data to
be displayed.
(5) Interval
Display the measurement interval of the data to be loaded.
Page 87

(6) Measurement period
Check to set the display name of each item separately.
Select and enter a symbol from the symbol list.
You may also enter any desired character.
Display the measurement period of the data to be loaded.
(7) File name
Display the file name of the data to be loaded.
(8) Display name
Set the name of each display item to be used in printout.
Click (8) on the display name, and the “Display name” dialog will appear.
The display name setting applies to time-series graph screen copies and when printing.
81
8.2 Select Detail Items
(9) Graph
Click (9) on the graph, and the “Change graph format” dialog will appear.
This box allows the line color to be set.
Page 88

82
Cursor measured value
Cursor
8.3 Setting the Display Time
8.3 Setting the Display Time
Set the display time using the display time text box or scroll bar.
8.4 Setting the Axis to a Linear Axis or LOG Axis
Set the horizontal axis to use either a linear axis or LOG axis when displaying harmonic levels or content
percentage.
8.5 Displaying the Value at the Cursor Position
Click in the graph display area, and the cursor will appear. The measurement of the point at which the
cursor is located will be displayed. The cursor can also be moved using the and keys on the key-
board. To hide the cursor, click anywhere outside the graph display area.
Page 89

8.6 Set Vertical Axis
Click
83
8.6 Set Vertical Axis
1
2
Click the on the tool bar.
The “Vertical axis settings” dialog will appear.
Set the vertical axis.
3
Click the [OK].
Parameters Description
Left axis,
Right axis
Grid
Reference
Value
The grid color of the time axis is determined by the grid color of the left axis.
Changes the upper limit value (Max) and lower limit value (Min) for the vertical axis.
(These values are usually set automatically.) The values can also be changed using the
vertical slider.
Show or hide the grid line. Set the color and line style.
Show or hide the reference value. Set the value, color, and line style.
Page 90

84
1 Click
2 Click
Selecting this checkbox causes data to be displayed using the number of measurement data
digits, without regard to the number of decimal places setting.
1 Click
2 Deselect
8.7 Change Display Unit
8.7 Change Display Unit
1
2
Select [Settings]-[Options] on the menu bar.
Deselect the [Display by the number of digits in default setting.] checkbox on the “Dis-
play unit” tab.
3
4
Set the display unit for measurement value, and the number of decimals
Click the [OK].
When using the LOG axis, the setting for the number of digits after the decimal point is
invalid.
Page 91

8.8 Change Background Color
1 Click
2 Click
1 Click
3 Click
2 Check
1 Select
2 Click
85
8.8 Change Background Color
1
2
Select [Settings]-[Options] on the menu bar.
Check the “Change the background color” box and click the [Change color].
3
4
The ”Color” dialog will appear.
Select a background color.
Click the [OK].
• The graph background color applies only to the SF1001 graph display and screen copies.
• White is used as the graph background color during screen and report printing.
Page 92

86
8.8 Change Background Color
Page 93

87
Display time setting
(p.89)
Waveform display
selection (p.89)
Waveform display
data selection
(p.88)
Cursor
measured
value (p.90)
Cursor (p.90)
Line legend
(p.90)
Cursor
measured
value (p.90)
Click
Displaying Measurement
Data Waveforms Chapter 9
This chapter describes how to display the voltage and current waveforms for a user-specified
time. If the loaded data does not include waveform data, this information cannot be displayed.
Click the [Waveform] tab to display the screen.
Page 94

88
9.1 Selecting the Waveform Display Data
9.1 Selecting the Waveform Display Data
Select the data name for which to display a waveform.
Page 95

9.2 Toggling the Waveform Display On and Off
9.2 Toggling the Waveform Display On and Off
Selecting the checkbox for the parameter you wish to display causes that waveform to be displayed.
Checkboxes for waveforms whose parameters were not saved cannot be checked.
89
9.3 Setting the Start Time
Set the display time with the display time scroll bar.
You cannot set the display time by entering a value directly.
Page 96

90
Cursor measured value
Cursor
9.4 Displaying the Value at the Cursor Position
9.4 Displaying the Value at the Cursor Position
Click in the graph display area, and the cursor will appear. The measurement of the point at which the
cursor is located will be displayed. The cursor can also be moved using the and keys on the key-
board. To hide the cursor, click anywhere outside the graph display area.
9.5 Changing the Graph Display
Click the legend for each parameter’s line and set the color, style, and thickness of the graph line and the
color, type, and size of the marker on the “Change graph format” dialog box. The line style can only be
changed when the line thickness is set to 1.
Page 97

9.6 Set Vertical Axis
Click
91
9.6 Set Vertical Axis
1
2
Click the on the tool bar.
The “Vertical axis settings” dialog will appear.
Set the vertical axis.
3
Click the [OK].
Parameters Description
Left axis,
Right axis
Grid
Reference
Value
The grid color of the time axis is determined by the grid color of the left axis.
Changes the upper limit value (Max) and lower limit value (Min) for the vertical axis.
(These values are usually set automatically.) The values can also be changed using the
vertical slider.
Show or hide the grid line. Set the color and line style.
Show or hide the reference value. Set the value, color, and line style.
Page 98

92
1 Click
2 Click
9.7 Change Display Unit
9.7 Change Display Unit
1
2
3
Select [Settings]-[Options] on the menu bar.
Set the display unit for measurement value, and the number of decimals
Click the [OK].
Page 99

9.8 Change Background Color
1 Click
2 Click
1 Click
3 Click
2 Check
1 Select
2 Click
93
9.8 Change Background Color
1
2
Select [Settings]-[Options] on the menu bar.
Check the “Change the background color” box and click the [Change color].
3
4
The ”Color” dialog will appear.
Select a background color.
Click the [OK].
• The graph background color applies only to the SF1001 graph display and screen copies.
• White is used as the graph background color during screen and report printing.
Page 100

94
9.8 Change Background Color
 Loading...