

Page 1

Instruction Manual
RM3542
RM3542-01
RESISTANCE HiTESTER
September 2013 Revised edition 3 RM3542A981-03 13-09H
Page 2

Page 3

Contents
Contents
i
1
Task-Oriented Reference...............................1
Measurement Flow.........................................2
Introduction.....................................................3
Verifying Package Contents...........................3
Safety Information..........................................5
Operating Precautions....................................7
Chapter 1 Overview 11
1.1 Product Overview and Features ........11
Block Diagram ..........................................14
1.2 Names and Functions of Parts ...........15
1.3 Screen Organization ..........................17
Chapter 2 Measurement
Preparations 21
2.1 Connecting the Power Cord............... 22
2.2 Connecting Measurement Cables and
Test Fixtures ......................................23
Making Your Own Measurement Cables ..24
2.3 Turning the Power On and Off ...........25
Chapter 3 Measurement
Settings (Basic Measurements)
27
3.1 Pre-Operation Inspection ...................27
3.2 Measurement Object Types ...............28
3.3 Setting the Measurement Speed .......29
3.4 Setting Measurement Start Conditions
(Trigger Source) .................................30
3.5 Selecting the Measurement Range ....31
3.6 Zero Adjustment .................................32
3.7 Judging Measured Values
(Comparator Function) .......................34
Enabling and Disabling the Comparator
Function .................................... ................35
Decide According to Reference Value and
Tolerance (REF% Mode) ..........................35
Decide According to Upper/Lower Thresholds
(ABS Mode) ............................................. 37
3.8 Confirming Faulty Measurements ......38
Chapter 4 Customizing
Measurement Settings 41
4.1 Making Range-Specific Measurement
Settings 41
4.2 Setting Pre-Measurement Delay ........42
4.3 Setting the Measurement Integration
Time Option 44
4.4 Checking for Poor or Improper Contact
(Contact Check Function) ...................46
4.5 Improving Probe Contact
(Contact Improver Function) ...............47
4.6 Detecting Measurement Voltage Faults
(Voltage Level Monitor Function) .......49
4.7 Applying Current Only When Measuring
(Current Mode Setting) .......................50
4.8 Test for Short-Circuited Probe
(Probe Short-Circuit Detection Function)
............................................................51
4.9 Comparing the Measurement Settings of
Two Instruments
(Settings Monitor Function)................ 53
4.10 Retrying Measurement After a Fault
(Retry Function) ..................................56
4.11 Maintaining Measurement Precision
(Self-Calibration) ................................57
4.12 Compensating for Thermal EMF Offset
(Offset Voltage Compensation - OVC) 57
Chapter 5 System Settings 59
5.1 Disabling and Enabling Key Operations
59
Disabling Key Operations
(Key-Lock Function) ................................. 59
Re-Enabling Key Operations
(Key-Lock Cancel) ................................... 60
5.2 Setting the Comparator Decision and
Key Beepers .......................................61
Enabling or Disabling the Key Beeper ..... 61
2
3
4
5
Page 4

ii
Contents
Setting the Comparator Decision (“JUDGE”)
Beeper ..................................................... 62
5.3 Power Line Frequency Manual Setting
63
5.4 Setting the Clock ................................64
5.5 Adjusting Screen Contrast ..................65
5.6 Adjusting the Backlight .......................66
5.7 Initializing (Reset) ...............................67
Default Settings ........................................ 68
Chapter 6 Storing and
Exporting Data 69
6.1 Storing Data at Specific Times
(Data Memory Function) .....................70
6.2 Store as soon as Measurement is
Stable (Auto-Memory Function) ........71
6.3 Performing Statistical Calculations on
Measured Values ...............................74
Using Statistical Calculations ................... 75
Confirming, Printing, and Erasing
Calculation Results .................................. 76
6.4 Auto-Exporting Measured Values
(at End of Measurement)
(Data Output Function) .......................77
Chapter 7 Printing 79
7.1 Connecting the Printer ........................79
Connecting the Printer to the Instrument . 80
7.2 Instrument Settings ............................81
7.3 Printing ...............................................82
Printing Measured Values and
Comparator Decisions 82
Printing Statistical Calculation Results ..... 82
Chapter 8 External Control 85
8.1 External Input/Output Connector
and Signals......................................... 85
Connector Type and Signal Pinouts ........ 86
Signal Descriptions .................................. 87
8.2 Timing Chart .......................................88
8.3 Internal Circuitry .................................90
Electrical Specifications ........................... 91
Connection Examples ............................ .. 92
8.4 External I/O Settings .......................... 93
Setting End-of-Measurement Signal Output
Signal Setting) ...............................93
(EOM
Setting the Trigger (TRIG) Signal Logic ... 94
8.5 External Control Q&A ........................ 95
8.6 Supplied Connector Assembly ...........96
Chapter 9 Communications
(RS-232C/ GP-IB Interface) 97
9.1 Overview and Features ......................97
9.2 Specifications .....................................98
9.3 Connecting .........................................99
Using the RS-232C Interface ................... 99
Using the GP-IB Interface
(RM3542-01 only) ........ ... ... ... .... ... ... ... ... . 100
9.4 Configuring the Communications
Protocol ............................................101
Configuring RS-232C Interface
Communications ....................................101
Configuring GP-IB Interface Communications
(RM3542-01 only) 102
Select the Measurement Data Transmission
Format (both RS-232C and GP-IB) 103
9.5 Communication Methods .................104
To cancel the Remote state
(enter the local state) .............................104
Message Format .................................... 105
Output Queue and Input Buffer .............. 108
Status Byte Register ..............................109
Event Registers ...................................... 111
Initialization Items ...................................114
Command Execution Time ..................... 115
Errors During Communications .............. 115
9.6 Message List ....................................116
Standard Commands ............................. 116
Device-Specific Commands ...................117
9.7 Message Reference .........................122
Message Reference Interpretation ......... 122
Standard Commands ............................. 123
Device-Specific Commands ...................127
9.8 Data Exporting Methods ..................148
9.9 Sample Programs ............................150
Using Visual Basic 5.0 or 6.0 ................. 150
Creation Procedure (Visual Basic 2005) 160
Sample Programs (Visual Basic 2005) .. 162
9.10 Device Compliance Statement ........ 164
Page 5

Chapter 10Specifications 167
Chapter 11
Maintenance and Service 179
11.1 Troubleshooting ...............................179
Inspection and Repair .............................179
11.2 Cleaning ........................................... 180
11.3 Error Displays and Remedies ..........181
11.4 Disposing of the Instrument .............183
Removing the Lithium Battery .................183
iii
Contents
Appendix A 1
Appendix 1Four-Terminal (Voltage-Drop)
Method......................................A 1
Appendix 2Effect of Thermal emf ...............A 2
Appendix 3Unstable Measurement Values.A 3
Appendix 4Rack Mounting..........................A 8
Appendix 5Dimensional Diagram .............A 10
Appendix 6Calibration...............................A 11
Appendix 7Adjustment Procedure ............A 13
Appendix 8Table of Commands Compatible
with the ADEX AX-162D.........A 14
Appendix 9Zero Adjustment .....................A 16
Index Index 1
6
7
8
9
10
11
12
Appendix
Index
Page 6

iv
Contents
Page 7

Task-Oriented Reference
Setting the measurement speed (p. 29)
1
Task-Oriented Reference
To minimize measurement error
To judge measurement results
To correct faulty measurements
To automatically store measured
values
Setting the measurement speed integration time option (p. 44)
Zero-adjustment (p. 32)
Judge measured values (comparator function) (p. 34)
Compare the measurement settings of two instruments
(Settings Monitor function) (p. 53)
Confirm faulty measurement (p. 38)
Improve probe contact (Contact Improver function) (p. 47)
Test for short-circuited probe (probe short-circuit detection
function) (p. 51)
Compare the measurement settings of two instruments
(Settings Monitor function) (p. 53)
Store as soon as measurement is stable
(Auto Memory function) (p. 71)
To print measurement results Printing (p. 79)
To measure by PLC connection
(PLC: Programmable Logic Controller)
To connect to a computer Communications (RS-232C/GP-IB interface) (p. 97)
To automatically send measurement data to a computer
(RS-232C interface only)
To check operation
External control (p. 85)
Communications (RS-232C/GP-IB interface) (p. 97)
Export measurement values automatically
(when finished measuring) (p. 77)
Setting Measurement Start Conditions (Trigger Source) (p. 30)
Internal trigger (INT)
Calibration (p. A11)
Page 8
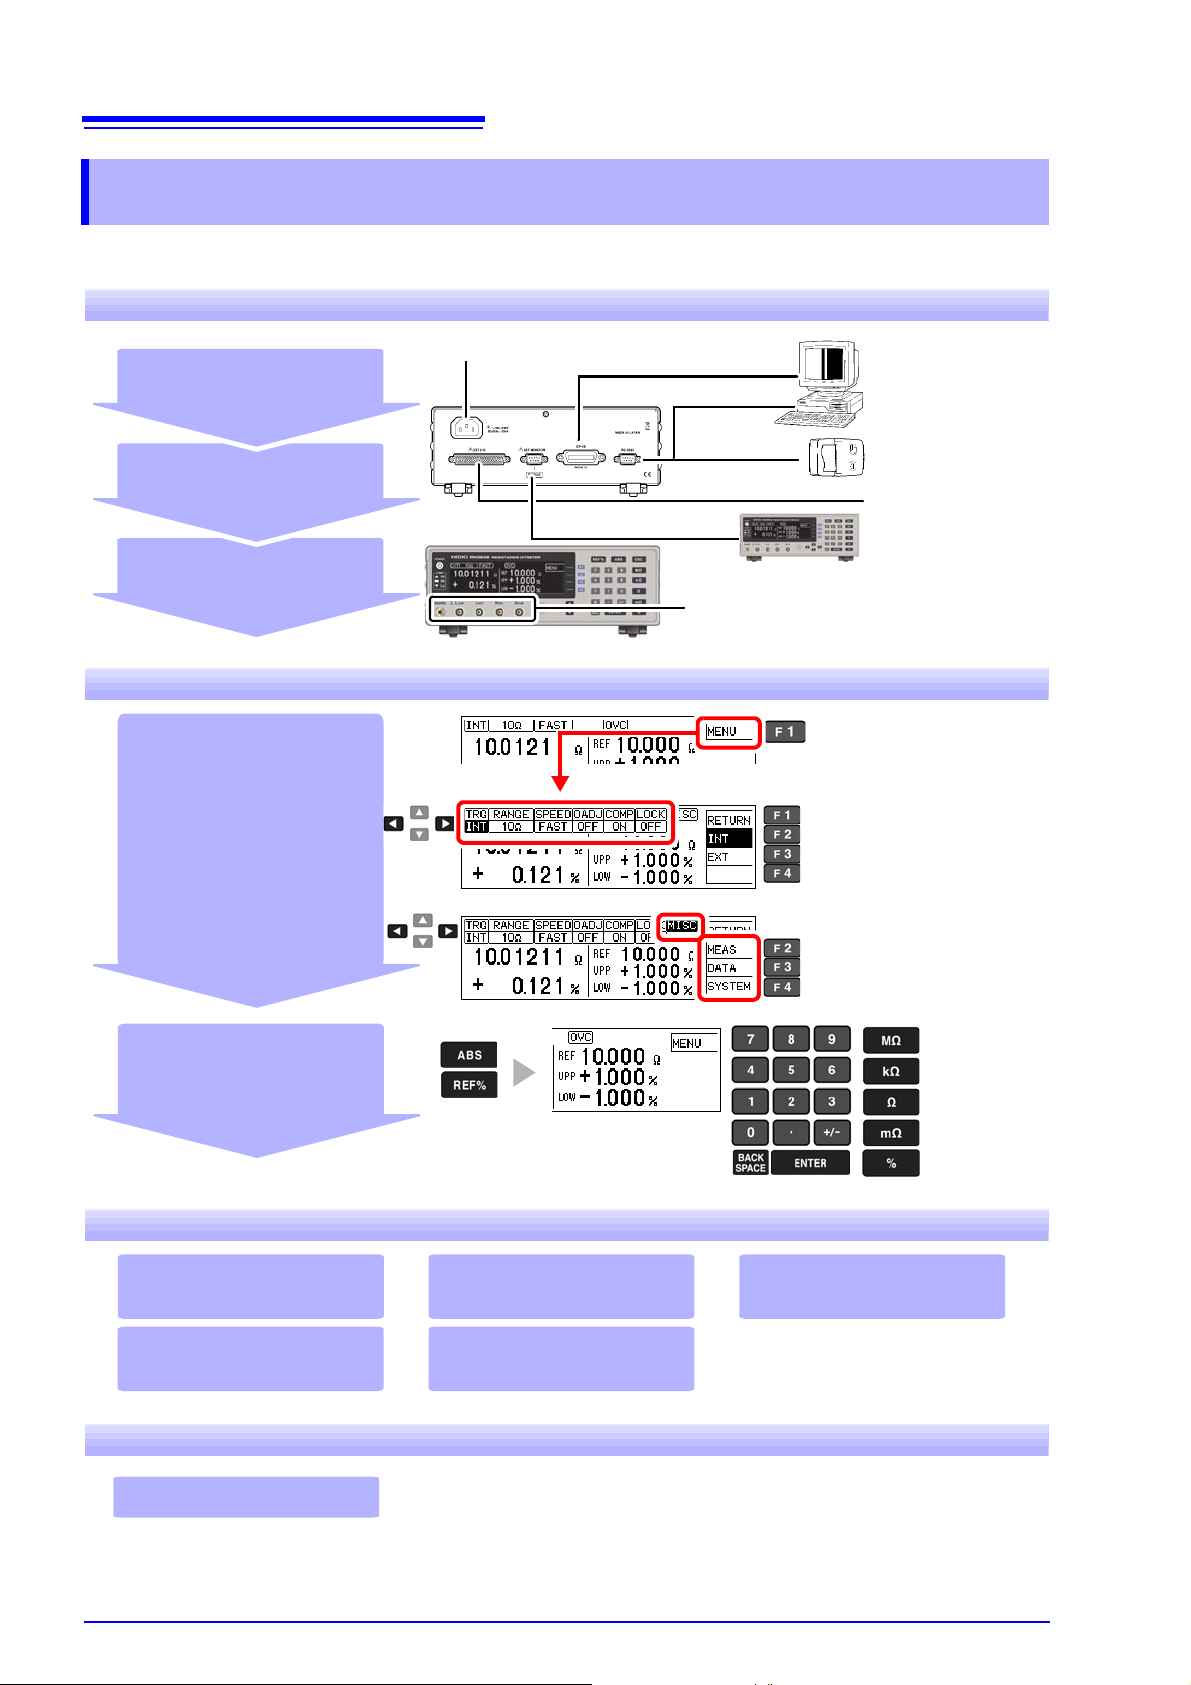
2
Computer
communications
(p. 97)
Printing (p. 79)
External control
(p. 85)
EXT I/O
RS-232C
GP-IB
Compare the settings of two instruments
(p. 53)
SET MONITOR
Connecting the Power Cord (p. 22)
Turn the power on (p. 25)
Connect (p. 21)
Install (p. 7)
Connect the measurement cables (p. 23)
Set measurement
conditions (as needed)
Confirm the screen confi guration
(p. 17)
Confirm the initial setup (p. 68)
• Basic Settings (p. 27)
• Configure settings for your
specific conditions (p. 41)
• System-related settings
(p. 59)
When changing settings
Change basic settings such
as measurement speed
Change to detailed settings
(measurement conditions
and system-related)
Set decision criteria
(p. 34)
Data transmission (p. 77) Printing (p. 79)
Computer communications
(p. 97)
External control (p. 85)
Statistical calculations
(p. 74)
Instrument interface settings must be
configured before printing or using
communications or remote control.
Turn the power off (p. 25)
Measurement Flow
Measurement Flow
Be sure to read the "Operating Precautions " (p. 7) b efore us e.
Installing, Connecting and Turning On
Settings
Calculation, Printing, Communication, and External Control Settings
When Finished
Page 9
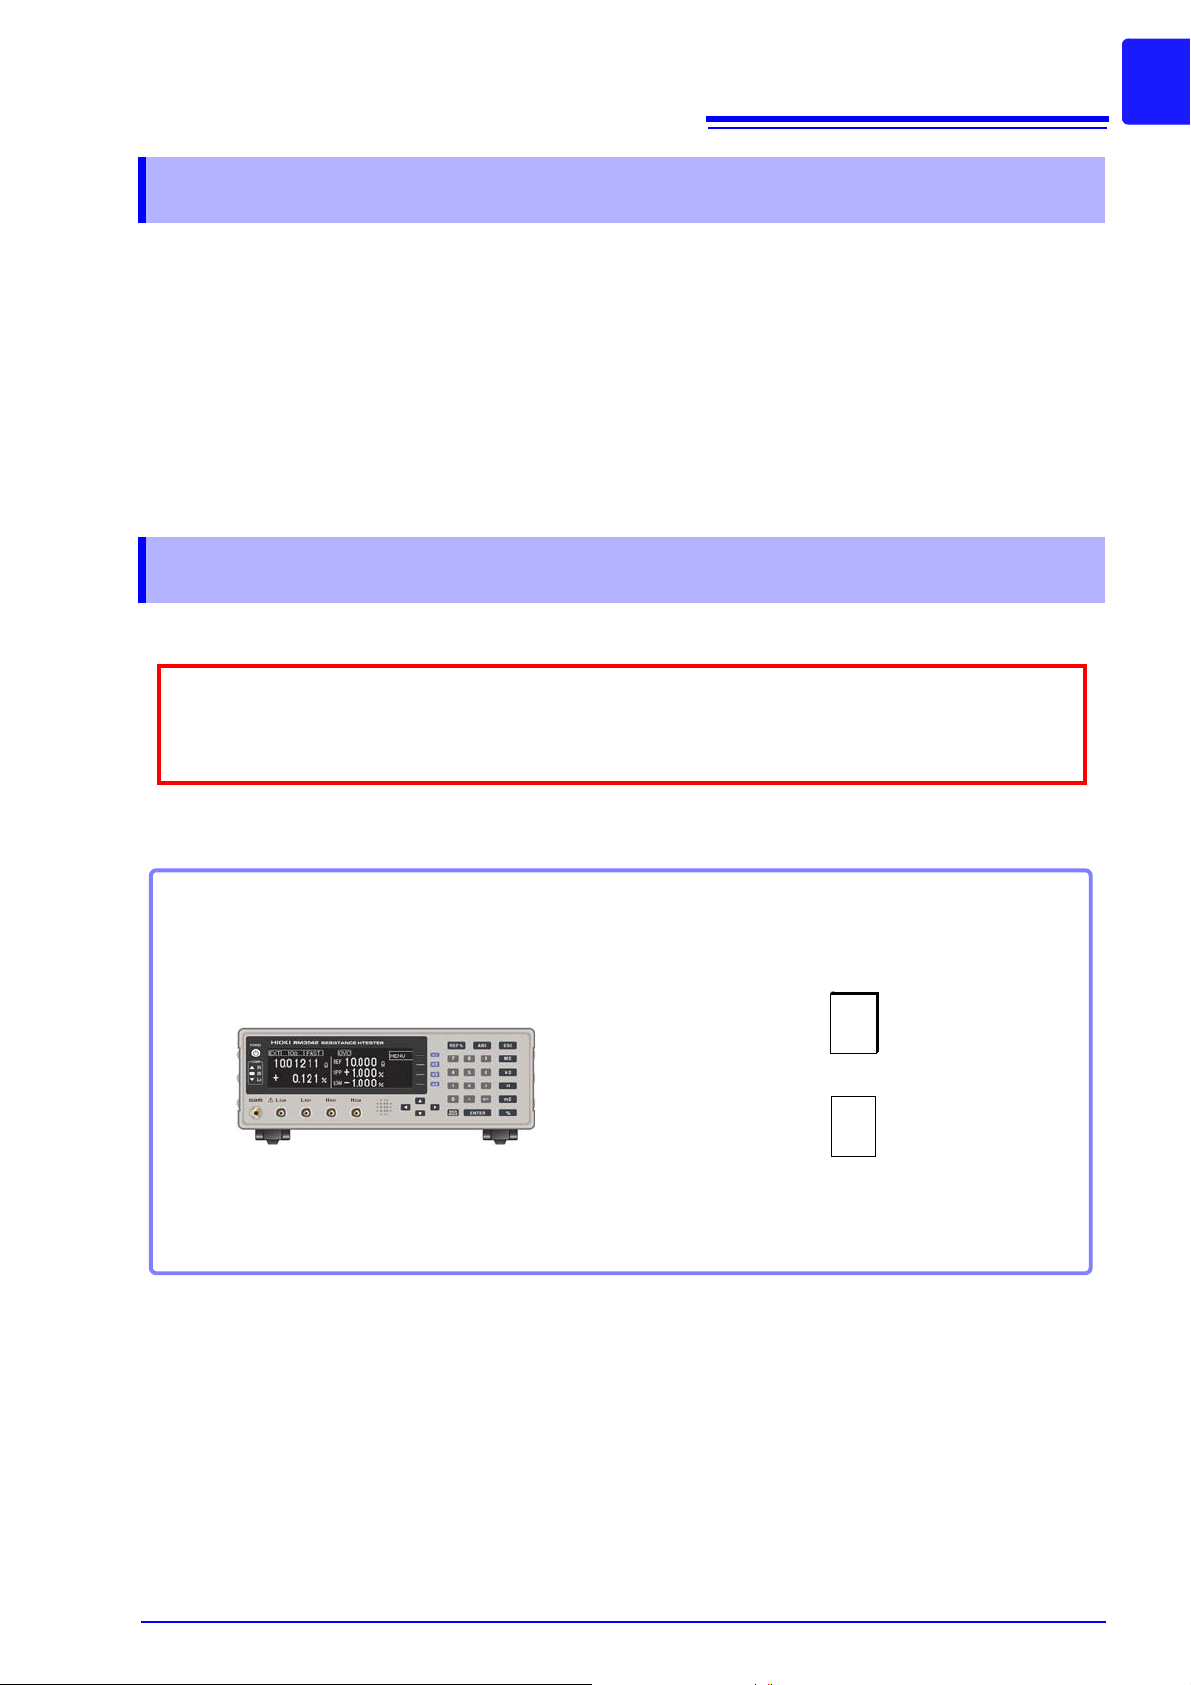
Introduction
When you receive the instrument, inspect it carefully to ensure that no damage occurred during shipping. In particular, check the accessories, panel switches, and connectors. If damage is evident, or if it
fails to operate according to the specifications, contact your dealer or Hioki representative.
Confirm that these contents are provide d.
Model RM3542 or
RM3542-01 (with GP-IB included)...............1
Power Cord (2-line + ground)(p. 22)
EXT I/O Male Connector (p. 96)
Instruction Manual (This document)............ 1
Operation Guide.......................................... 1
Thank you for purchasing the HIOKI Model RM3542/ RM3542-01 Resistance HiTester.
To obtain maximum performance from the instrument, please read this manual first, and keep
it handy for future reference.
Model RM3542-01 is the same as the RM3542, but with GP-IB included.
Registered trademarks
Windows and Visual Basic are registered trademark of Microsoft Corporation in the United
States and/or other countries.
Verifying Package Contents
Inspection
3
Introduction
Content confirmation
Page 10
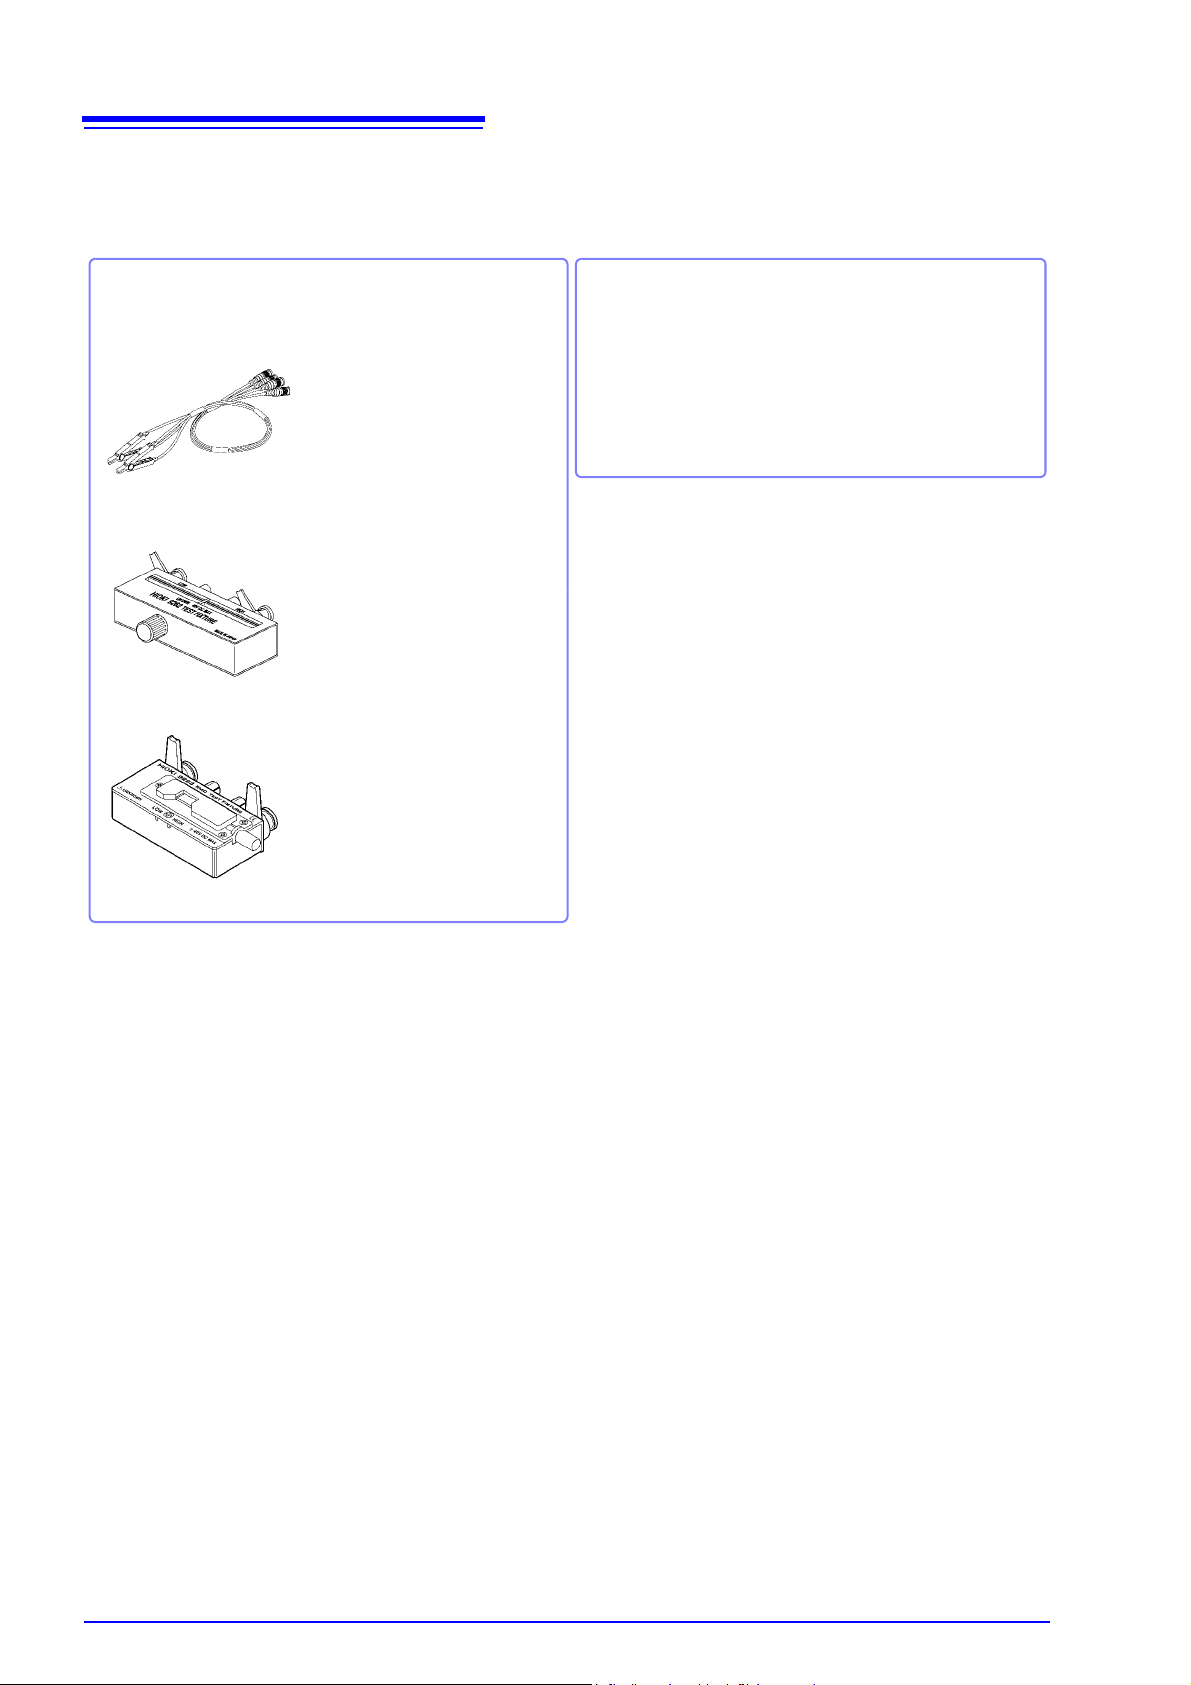
4
Measurement Probes and Fixtures
(connect to measurement jacks)
Model 9140 4-terminal Probe
Model 9262 Test Fixture
Model 9263 SMD Test Fixture
Alligator-clip-type measurement
probes. These general-purpose
dual-electrode clips fit a wide
range of conductor thicknesses.
This fixture is for measuring lead
components. (less than 10 m
residual resistance after zero
adjustment)
This fixture is for measuring chip
components. (less than 10 m
residual resistance after zero
adjustment)
Interface Cables
Model 9637 RS-232C Cable
(9-pin to 9-pin/ crossover cable)
Model 9638 RS-232C Cable
(9-pin to 25-pin/ crossover cable)
Model 9151-02 GP-IB Connector Cable (2m)
Verifying Package Contents
Options
Contact your dealer or Hioki representative for details.
Page 11
5
Safety Information
Safety Information
This instrument is designed to comply with IEC 61010 Safety S t andards , and has b een
thoroughly tested for safety prior to shipment. However, mishandling during use
could result in injury or death, as well as damage to the instrument. Using the instrument in a way not described in this manual may negate the provided safety features.
Be certain that you understand the instructions and precautions in the manual before
use. We disclaim any responsibility for accidents or injuries not resulting directly
from instrument defects.
This manual contains information and warnings essential for safe operation of the instrument and for maintaining it in safe operating condition. Before using it, be sure to carefully read the following safety precautions.
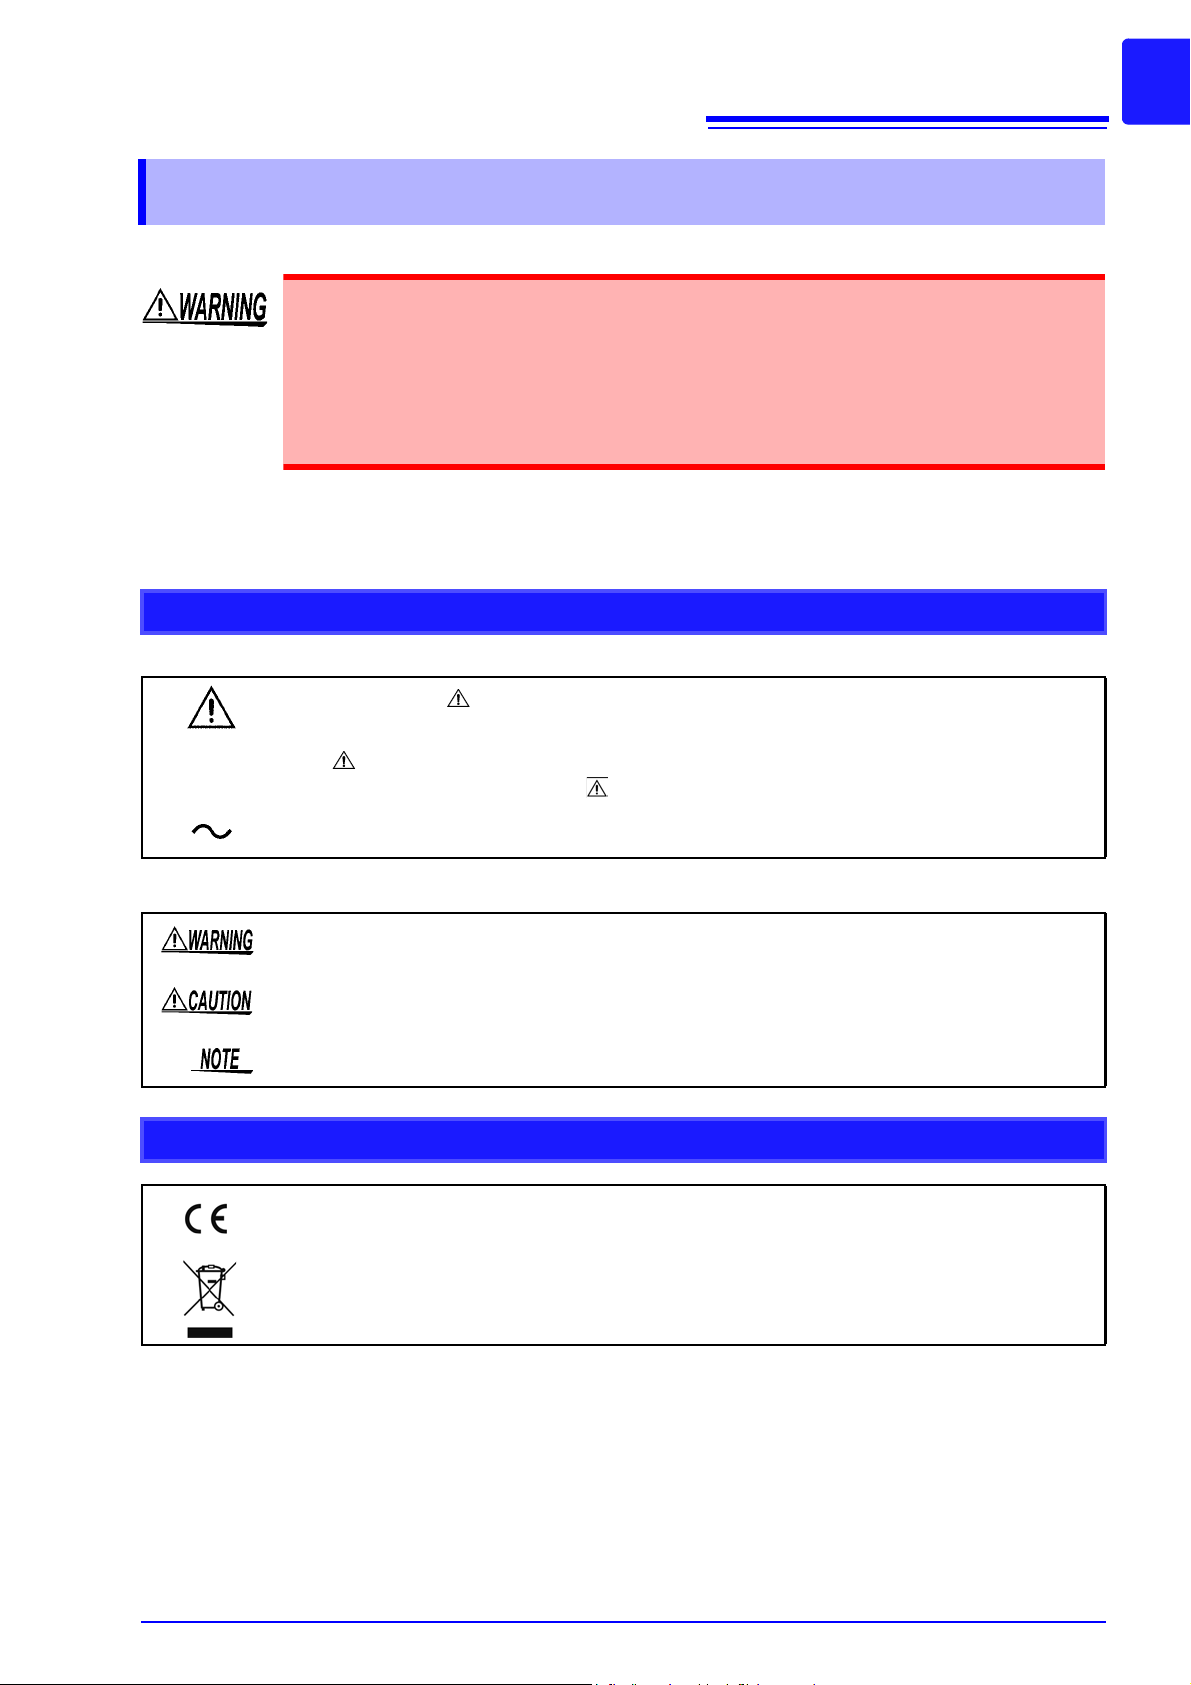
Safety Symbols
In the manual, the symbol indicates particularly important information that the user should read
before using the instrument.
The symbol printed on the instrument indicates that the user should refer to a corresponding
topic in the manual (marked with the symbol) before usi ng the relevant function.
Indicates AC (Alternating Current).
The following symbols in this manual indicate the relative importance of cautions and warnings.
Indicates that incorrect operation presents a significant hazard th at could result in serious injury or
death to the user.
Indicates that incorrect operation presents a possibility of injury to the user or dama ge to the instrument.
Indicates advisory items related to performance or correct operation of the instru ment.
Symbols for Various Standards
This symbol indicates that the product conforms to regulations set out by the EC Directive.
WEEE marking:
This symbol indicates that the electrical and electronic appliance is put on the EU market after August
13, 2005, and producers of the Member States are required to display it on the appliance under Article 11.2 of Directive 2002/96/EC (WEEE).
Page 12
6
Safety Information
Other Symbols
Indicates the prohibited action.
(p. )
*
[ ]
SET
(Bold characters)
Unless otherwise specified, “Windows” represents Windows 95, 98, Me, Widows NT4.0, Windows 2000,
Windows XP, or Windows Vista.
Click: Press and quickly release the left button of the mouse.
Double click: Quickly click the left button of the mouse twice.
Indicates the location of reference information.
Indicates that descriptive information is provided below.
Square brackets indicate instrument display labels (such as setting item names).
Bold characters within the text indicate operating key labels.
Accuracy
We define measurement tolera nces in terms of f.s. (full scale), rdg. (reading) and dgt. (digit) values, with the following meanings.
f.s. (maximum display value)
The maximum displayable value. This is usually the name of the currently selected range.
rdg. (reading or displayed value)
The value currently being measured and indicated on the measuring instrument.
dgt. (resolution)
The smallest displayable unit on a digital measuring instrument, i.e., the input value that causes the
digital display to show a “1” as the least-significant digit.
Page 13
Operating Precautions
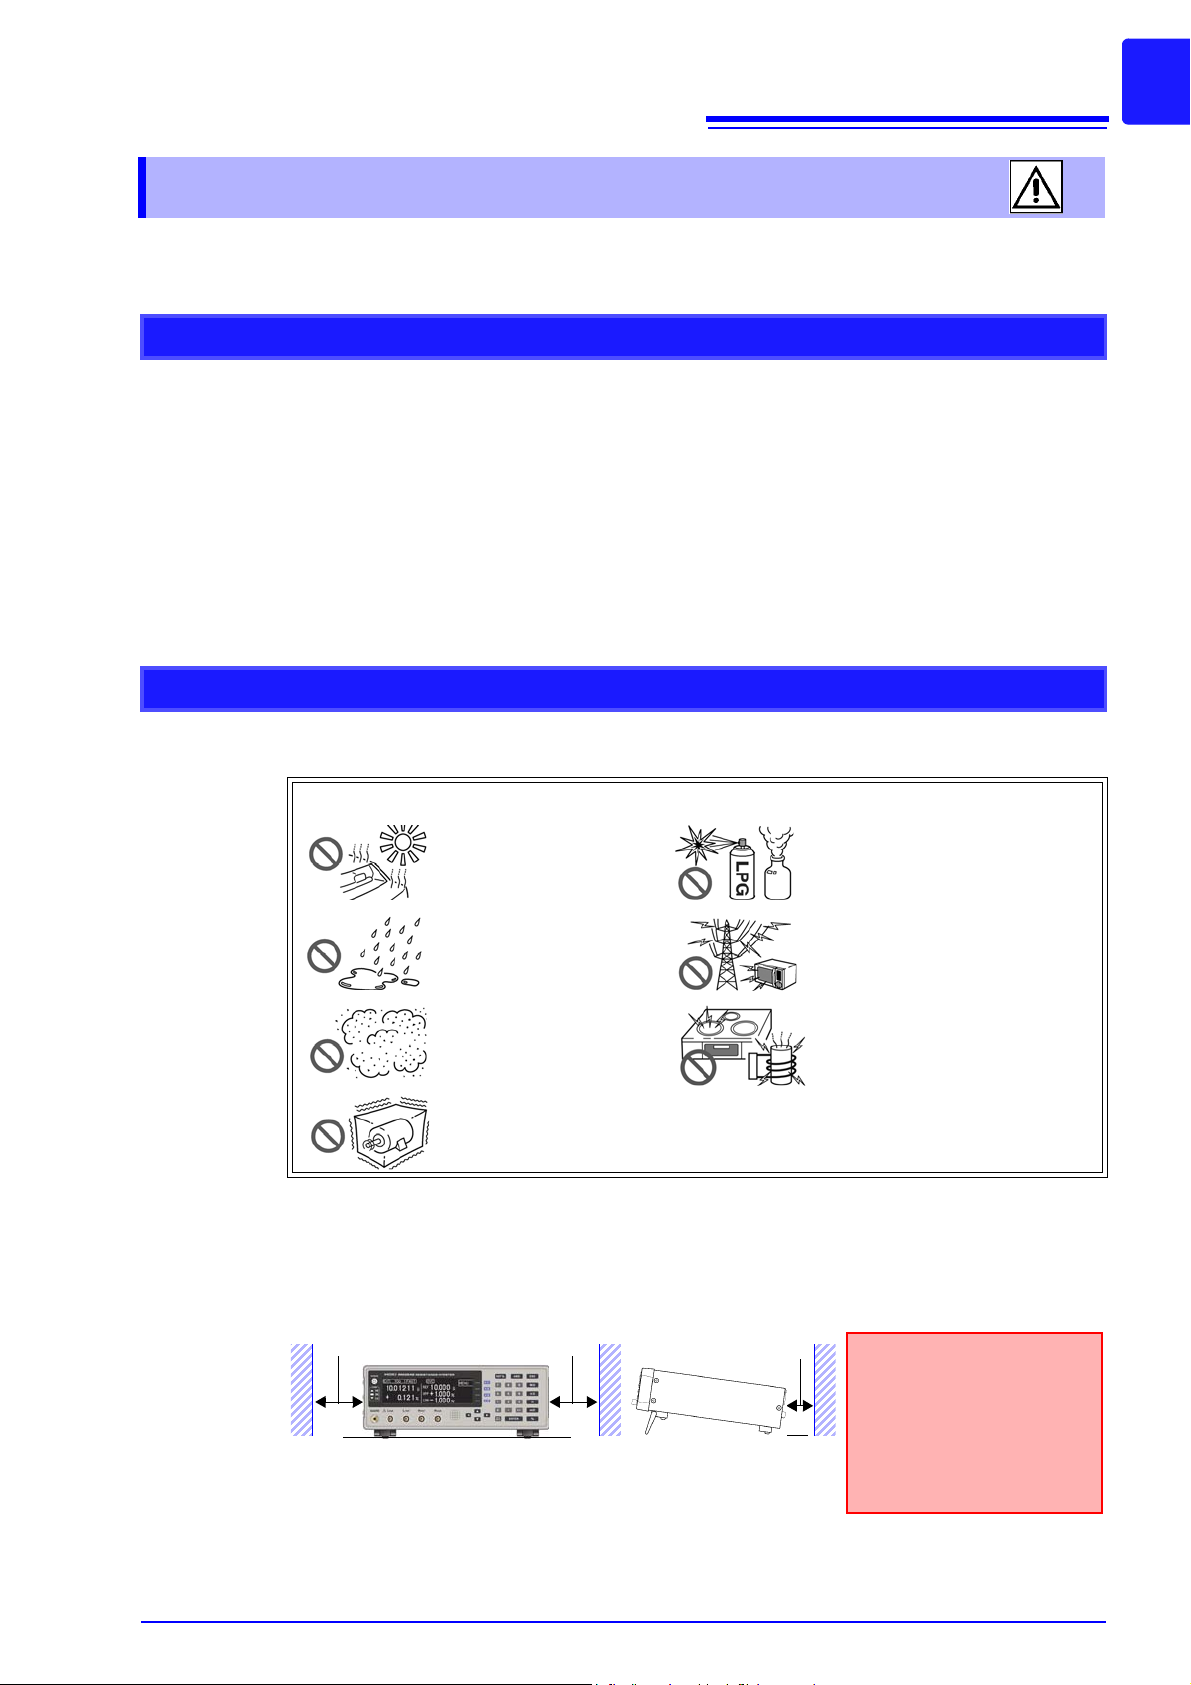
The instrument can be used with the stand (p. 16).
It can also be rack-mounted. (p. A8).
50 mm or more
10 mm or more
Rear
50 mm or more
Unplugging the power cord
kills power to the instrument.
Be sure to provide enough
unobstructed space to unplug
the power cord immediately
in an emergency.
Follow these precautions to ensure safe operation and to obtain the full benefits of the various
functions.
Preliminary Checks
• Before using the instrument for the first time, verify that it operates normally to ensure that
no damage occurred during storage or shipping. If you find any damage, contact your
dealer or Hioki representative.
• Before using the instrument make sure that the insulation on the powe r co rd is unda mag ed
and that no bare conductors are improp erly exposed. Using the instru ment in such conditions could cause an electric shock, so contact your dealer or Hioki representative for
repair.
• Before using the instrument, make sure that the insulation on the measurement cables is
undamaged and that no bare metal is improperly exposed. If there is any damage, measured values may be unstable and measurement errors may occur.
7
Operating Precautions
Instrument Installation
Storage temperature and humidity: -10°C to 50°C at 80% RH or less (non-condensating)
Operating temperature and humidity: 0 to 40°C at 80% RH or less (non-condensating)
Avoid the following locations that could cause an accident or damage to the instrument.
Installation Precautions
Exposed to direct sunlight
Exposed to high temperature
Exposed to liquids
Exposed to high humidity
or condensation
Exposed to high levels of
particulate dust
Subject to vibration
In the presence of corrosive or explosive gases
Exposed to strong electromagnetic fields
Near electromagnetic radiators
Near induction heating systems
(e.g., high-frequency induction
heating systems and IH cooking
utensils)
• The instrument should be operated only with the bottom downwards.
• Do not place the instrument on an unstable or slanted surfa ce.
Page 14
8
Operating Precautions
Handling the Instrument
• Do not allow the instrument to get wet, and do not take measurements with wet
hands. This may cause an electric shock.
• Do not attempt to modify, disassemble or repair the instrument; as fire, electric
shock and injury could result.
To avoid damag e to the instrument, protect it from physical shock when transporting and
handling. Be especially careful to avoid physical shock from dropping.
This instrument may cause interference if used in residential areas. Such use must be
avoided unless the user takes special measures to redu ce electromagnetic emissions to p revent interference to the reception of radio and television broadcasts.
Handling the Cords and Probes
• Avoid stepping on or pinching cables, which could damage the cable insulation.
• To avoid breaking the cables, do not bend or pull them.
• To avoid damaging the power cord, grasp the plug, not the cord, when unplugging it from
the power outlet.
• When disconnecting the BNC connector, be sure to release the lock before pulling off the
connector. Forcibly pulling the connector without releasing the lock, or pulling on the cable,
can damage the connector (p. 23).
• Use only the specified connection cables. Using a non-specified cable may result in incorrect measurements due to poor connection or other reasons.
• Before using a test fixture, read the instructions provided with it.
Before Turning Power On
Before turning the instrument on, make sure the supply voltage matches that indicated on its power connecto r. Connection to an improper supply voltage may damag e
the instrument and present an electrical hazard.
Page 15
Before Connecting EXT I/O
To avoid electric shock or damage to the equipment, always observe the following
precautions when connecting to the EXT I/O connector.
• Always turn off the power to the instrument and to any devices to be connected
before making connections.
• Be careful to avoid exceeding the ratings of external terminals (p. 91).
• During operation, a wire becoming dislocated and contacting another conductive
object can be serious hazard. Make sure that connections are secure and use
screws to secure the external connectors.
• Properly insulate any devices and mechanisms to be connected to the EXT I/O con-
nector.
• The ISO_5V pin of the EXT I/O connector is a 5V power output. Do not apply ext ernal
power to this pin.
9
Operating Precautions
Before Measuring
• Do not apply any voltage to the measurement jacks. Doing so could damage the instrument.
• Never attempt to measure at a point wher e voltage is pr esent. In particular, do not measure
a transformer or motor immediately after a temperature increase test or withstand-voltage
test, as the instrument could be damaged by induced voltage or residual charge.
• Battery internal resistance cannot be measured with this instrument. It will sustain damage.
To measur e battery internal resistance, we recommend the HIO KI 3554, 3555, BT3562,
BT3563, and 3561 Battery HiTesters.
• To obtain the guaranteed measurement accuracy, allow at least 30 minutes warm-up.
• The instrument internally retains all settings (but not measured values), such as measurement range and comparator settings. However, measurement settings made through the
RS-232C or GP-IB interface are not memorized.
• In the 100 and higher ranges (LOW POWER set to OFF), thermal emf can cause measurement errors.
• The DC resistance of a power transformer cannot be measured. When measuring objects
with a large L, such as choke coils and other inductors, measured values may be unst able.
In such cases, contact your dealer or Hioki rep r esentative.
• Carefully insulate all H
cannot be performed and an error will occur if core and shield wires touch.
CUR
, H
POT
, L
POT
, and L
wiring. Proper 4-terminal measurements
CUR
Page 16

10
Operating Precautions
Page 17
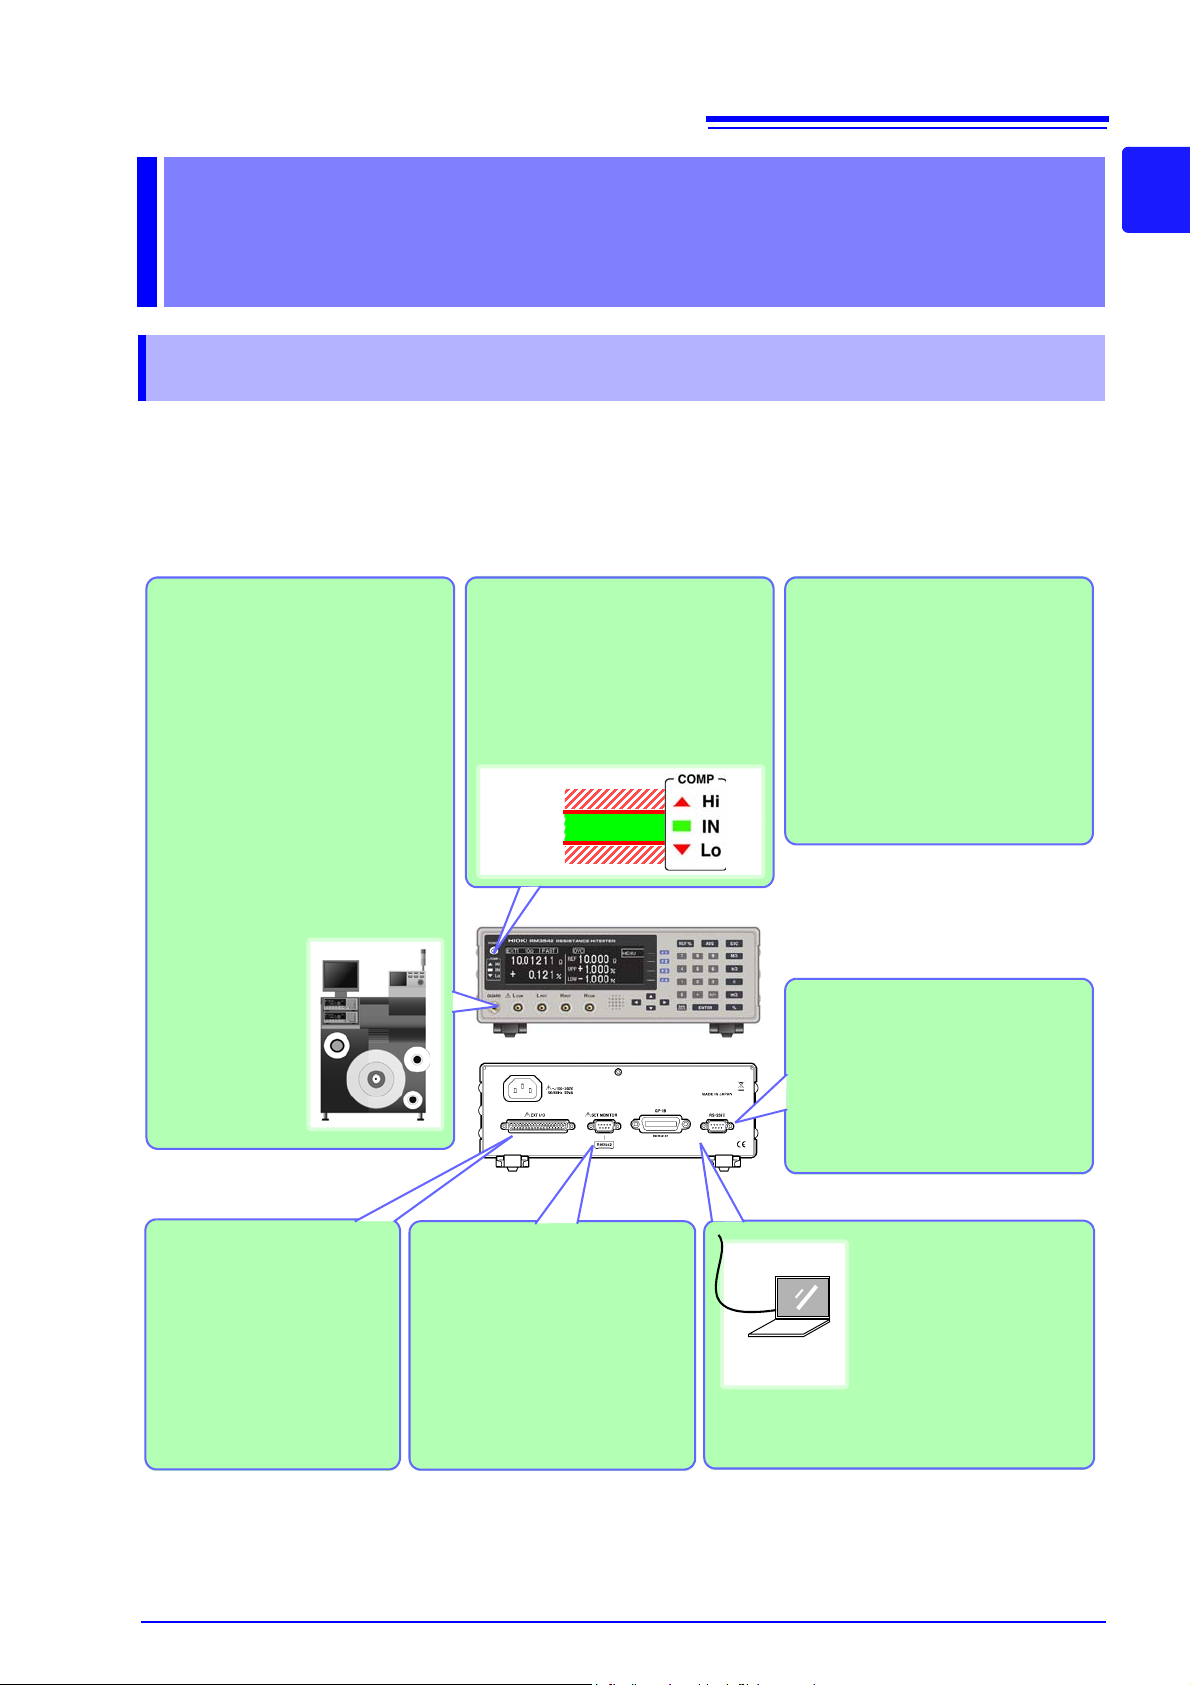
1.1 Product Overview and Features
The Hioki RM3542 Resistance HiTester employs the 4-terminal method to quickly and accurately measure
the DC resistance of components such as resistors and ferrite beads. It includes advanced contact-check,
comparator, and data output functions. The intuitive user interface and high noise immunity are ideal for use
with taping machines and separators.
Resistance Measurement
The factory defaults (initial settings)
are optimized for chip-component
resistance measurements. The
RM3542 can also measure devices
that are otherwise difficult to measure with high current, such as ferrite-bead and small multilayer
inductors (low-power resistance
measurement, p. 28).
Interface
Communications
Connect the instrument to a
controller via the RS-232C
or GP-IB interface to control
measurement data acquisition (p. 97).
Send Measurement Data and
Calculation Results to a
Printer
Use a commercially available printer with a serial interface to print
measured values and calculation
results (p. 79).
Save and Output Measured
Values
Measured values can be stored in
internal memory (p. 69)
Statistical calculations can be performed on the stored data, which
can be transferred to a computer in
batch form (however, stored data
cannot be confirmed internally).
Judge Measured Values
Measured values are compared
with a pre-specified referenc e value
or thresholds, and the result is output externally and indicated by the
COMP indicators (comparator function, p. 34).
Connect a PLC or
I/O Board
To control from a PLC, connect to the EXT I/O connector. In addition to comparator
results, various measurement
anomaly signals can be output (p. 85).
Upper limit
Lower limit
Compare Two Instrument’s
Setting Conditions
When measuring with two interconnected instruments, settings
are compared, and an alarm is
output and measurement is inhibited if the settings differ (Settings
Monitor function, p. 53).
Optional Hioki probes and fixtures
are available to connect to the measurement jacks (BNC jacks, p. 4).
Alternatively,
commercially
available cables
such as 1.5D-2V
coax can be used
(p. 24).
Overview Chapter 1
1.1 Product Overview and Features
11
1
Page 18
12
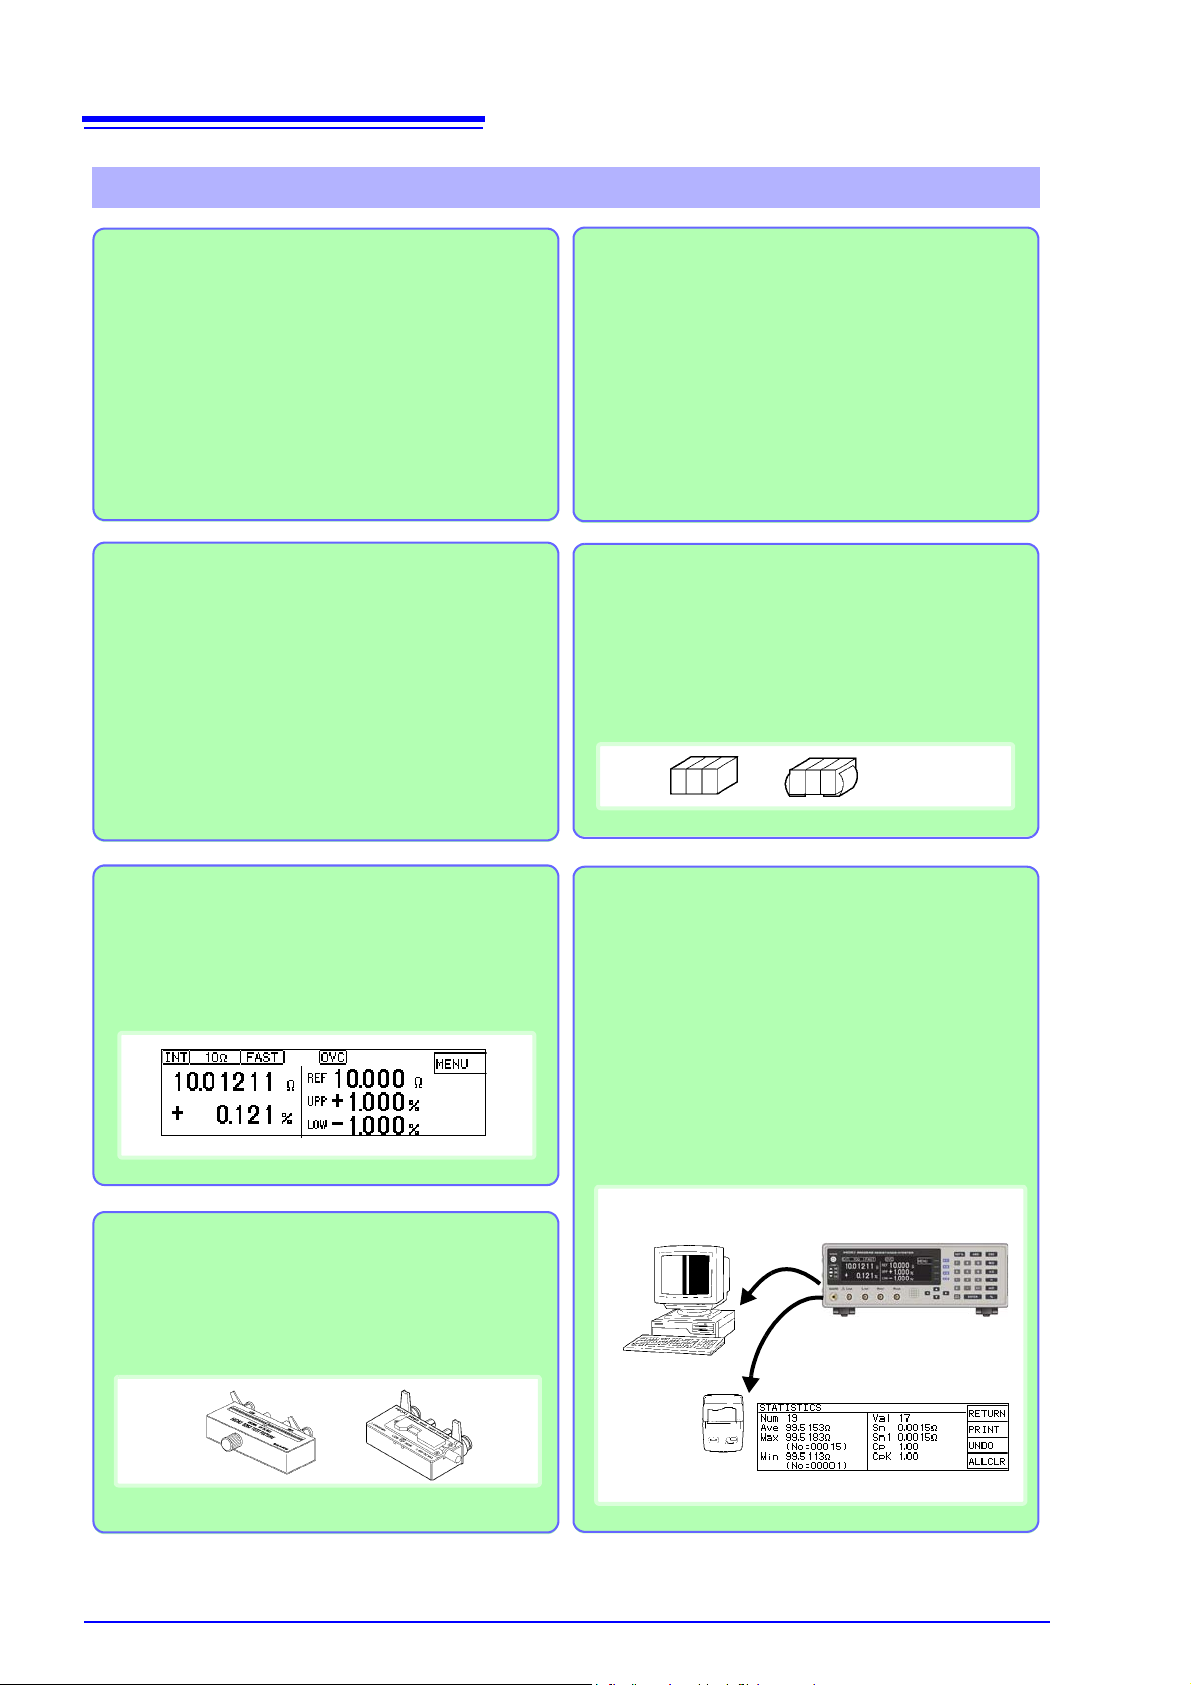
Ultra Fast and Accurate Measurements
Increase Productivity
The factory default settings are optimized for chipcomponent resistance measurements. Enhanced
contact-to-measurement and contact-check-to-decision times are only 1 ms. The offset-voltage compensation (OVC) function minimizes the effects of thermal
emf when using low-power resistance measurement
and the 100 m
to 10 ranges (p. 57). Measurement
results are judged pass/fail with 10 ppm resolution,
ideal for high-speed Class B resistor testing.
High-Speed Dat a Output and Ample Memory
The Data Output function transfers measured data at
5 ms/sample, even via RS-232C. Up to 30,000 measurements can be stored, and all data can be exported
at the end of measuring each reel. This function is ideal for system setup, debugging and process management.
Multiple Interfaces
EXT I/O is isolated from the measurement and control
circuits to provide noise immunity (p. 85).
All data can be acquired in real time using the built-in
38.4-kbps high-speed RS-232C interface. Connect
the commercially available printer with a serial interface to print measured values and statistical calculation results (p. 79).
The GP-IB interface is available for Model RM3542-01
(specified when ordering, p. 97).
Low-Power Function (p. 28)
For ranges from 1000 m to 1000 , low-power resistance measurement is provided to minimize measurement current. Safely measure devices that are
otherwise difficult to measure with high current, such
as ferrite-bead and multilayer inductors.
Clearly Visible Display and Intuitive Operation
High-contrast LCD provides clear visibility, helping
avoid setting mistakes. The optimum range is selected
automatically when comparator thresholds are entered.
Auto Memory Function Convenient for Sampling Tests (p. 71)
The auto memory function is convenient for sampling
tests after screen-printing. Measured values are automatically acquired as soon as they stabilize, and statistical calculations proceed until the specified quantity is
obtained, upon which an alert notification (alarm) occurs. Selecting [PRINT] (screen display) prints measured values and statistical calculation results (p. 82).
Fixtures for Component Measurements (p. 4)
The BNC-type measurement jacks exhibit good noise
immunity. Ready availability and easy assembly ensure smooth system setup. Various test fixtures are
available for Hioki LCR HiTesters.
Features
1.1 Product Overview and Features
Page 19
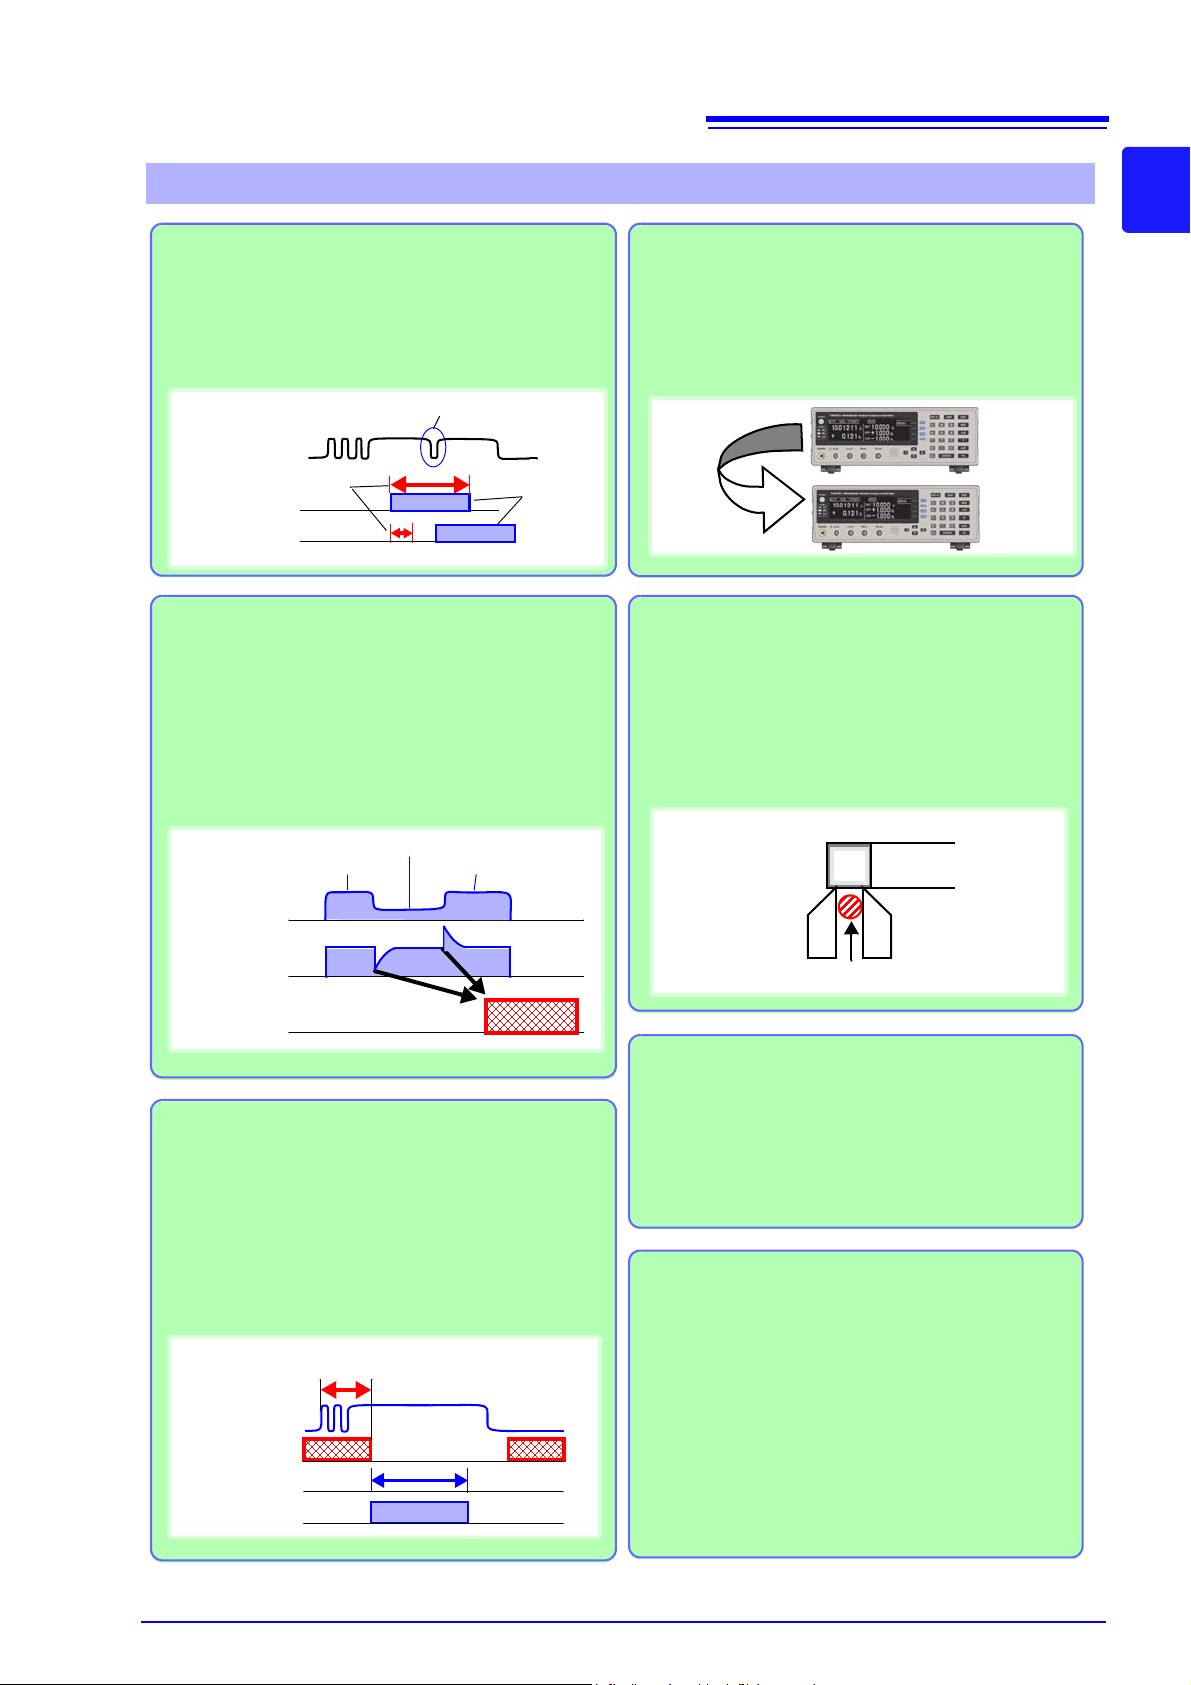
Reliable Contact Checkin g (p. 46)
Contact checking (that was previously performed before and after measuring) is now performed during measurement, so probe bounce and contact resistance
fluctuations can be detected. Contact checking time can
be shortened, improving tact times.
Features
Measurement Circuit Strongly Immune to
Contact Resistance Fluctuations
The effects of contact resistance fluctuations are reduced even when scattering occurs near the end of
probe life. Such effects are minimized by the fast response of the measurement circuit.
Contact Improver Function (p. 47)
The Contact Improver function improves bad contacts
between probes and test samples. Contacts errors are
reduced by penetrating oxidation and impurities between probes and samples. Reducing contact errors
can increase productivity and quality. The intensity of
the contact improver function can be adjusted according to probe type.
Reject Faulty Data –
Voltage Level Monitor Function (p. 49)
When the contact resistance of the H
CUR
and L
CUR
leads fluctuates, the measurement current changes
momentarily. Such momentary changes are not detectable by typical contact checking. The Voltage Level
Monitor function detects a contact error if the detection
voltage changes significantly, which can increase the
reliability of measured values.
Minimize Human Error and Risk –
the Settings Monitor Function (p. 53)
If the settings of two instruments are different, triggering is inhibited and an alarm notification is generated
to avoid setting mistakes due to human error.
Reliable Four-Terminal Measurement –
Probe Short-Circuit Detection Function
(p. 51)
Four-terminal measurements are inhibited when a
conductive foreign object is present between the
POT and CUR probe tips. Short-circuit probe anomalies are detected by checking the resistance between
these tips when not measuring.
Strong Electrical Noise Immunity
The specified measurement accuracy is achieved
even with ±1.5 kV mixed pulse noise. The floating
measurement section design is highly impervious to
electrical noise, minimizing the effect on measured
values even when turning large-induction motors on
and off. The free-range power supply input (90 to 264
V) is practically unaffected by voltage fluctuations, so
stable measurements are possible even in under
poor power conditions.
Previously
Model
RM3542
Contact Condition
Contact Check
Measuring
Probe Bounce
Contact
Condition
Detection
Voltage
Error
Good Contact
Poor Contact
Excessive detection
voltage fluctuation error
Good Contact
ERROR
Measurement
Status
Contact Check
Contact Condition
Contact Improver
Function
Contact Improvement
Measuring
Checking
ONON
DUT
Foreign object
POT
CUR
DUT electrode
13
1.1 Product Overview and Features
1
Page 20
14
AB
C
D
E
F
G
H
I
E
D
1.1 Product Overview and Features
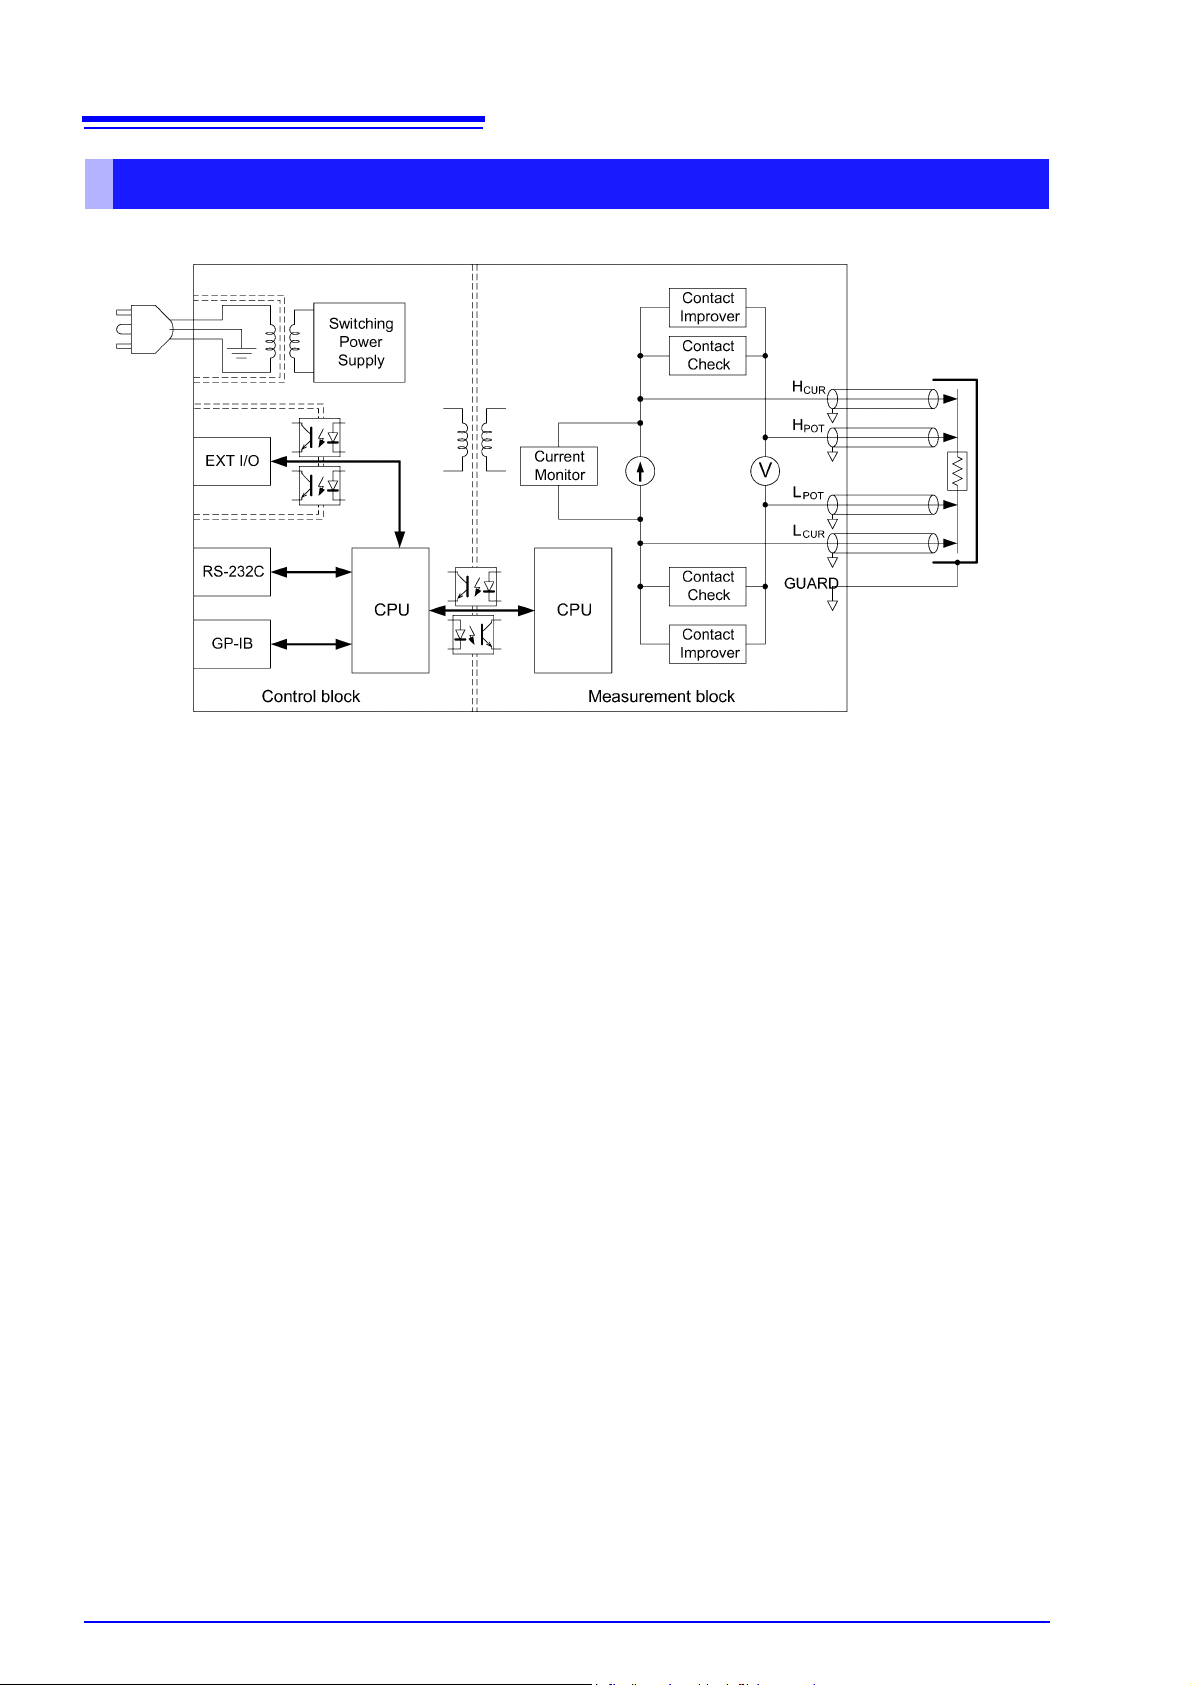
Block Diagram
• Constant current (determined by the measurement range) is applied between the H
age is measured between the H
voltage (B) by the constant current flow (A).
POT
and L
terminals. The resistance value is obtained by dividing the measured
POT
CUR
and L
terminals while volt-
CUR
• The effects of large offset voltage such as from thermal emf are reduced by current flowing in the positive and negative
directions (A).
• The constant current source (A) and voltmeter (B) circuit designs are largely unaffected by contact resistance.
• Faulty measurement values caused by unstable or chattering contact conditions can be eliminated by monitoring (C)
the detection voltage (B) waveform (Volta ge Le ve l Mo ni to r fu nction).
• Stable measurements are ensured by providing sufficient integration time (the default setting is 0.3 ms). (The integra-
tion time can be reduced to 0.1 ms to support even higher speed (B).)
• Before measuring, the Contact Improver circuit (D) optimizes contact when the probes touch the DUT.
• By also performing contact checking (E), short circuits between CUR and POT terminals caused by a clogged probe tip
can be detected (probe short-circuit detection function).
• When measurement starts, the contact check circuit (E) and constant current monitor (F) are activated to monitor for
fault conditions while measuring. The dual-CPU (C and G) design provides ultra-high-speed measurements and fast
system response.
• Immunity from electrical noise is provided by isolation between the Measurement and Control blocks (H).
• The auto-ranging 100-to-240 V switching power supply (I) can provide stable measurements even in poor power quality
environments.
Page 21
15
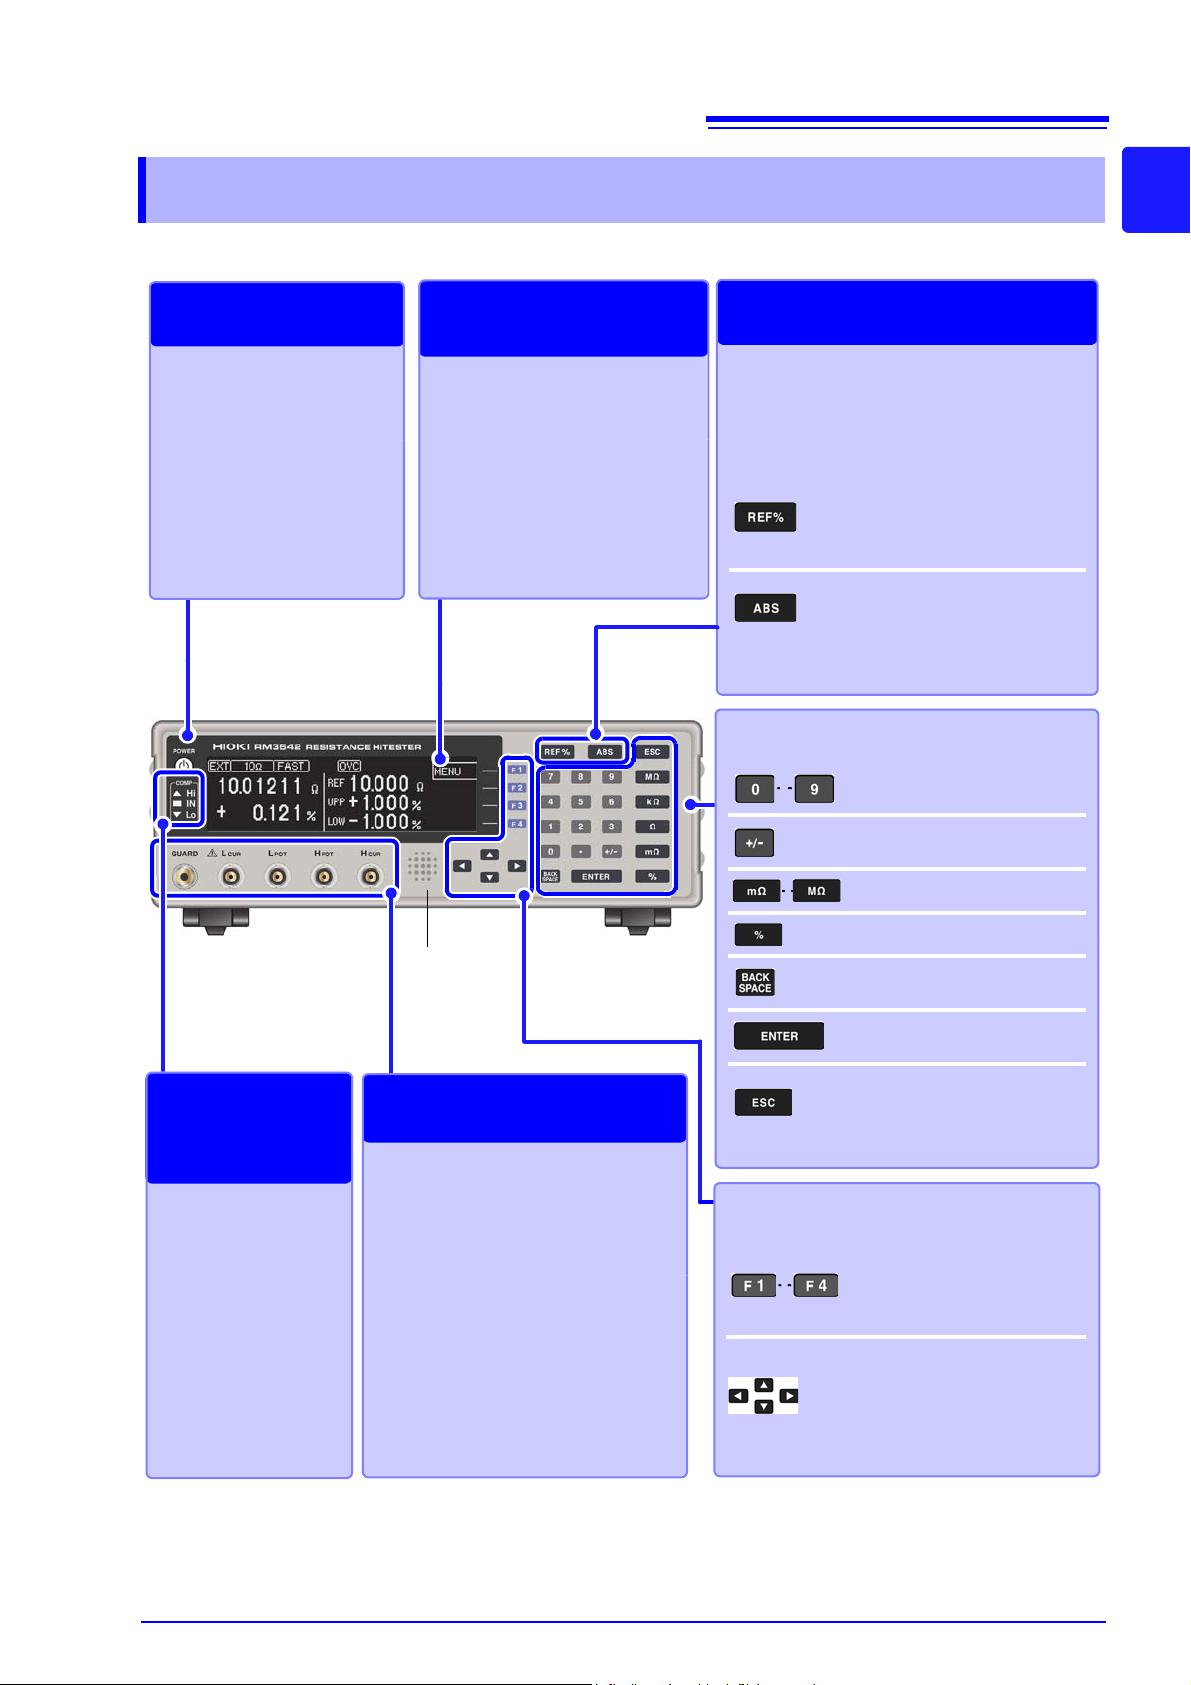
Display Screen
Monochrome graphical LCD
There are three general screen
types: Measurement, Basic Settings and Detailed Settings.
Screen Configurations (p. 17)
F1 to F4ÉLÅ[
(FÉLÅ[: ëçèÃ)
âÊñþâEë§Ç…ï\é¶ÇŠÇÍÇÈçÄ
ñÇšëIëšÇµÇ‹Ç²ÅB
Judging measured values (p. 34)
(Comparator function)
Set a reference value and range for judging
measurements, which can be confirmed by
the COMP indicators.
Select this to judge measured values relative to a reference value
and tolerance (%). The REF% setting display appears.
Press to judge measured values
relative to upper/lower thresholds.
The ABS setting display appears.
Setting
POWER Button
Turns the instrument on and
off (p. 25).
• Unlit: power off
(when no power supplied)
• Red light: power off
(while power is supplied)
• Green light: power on
Power On/Off
Entering numerical values
Enter a numerical value.
(we call these the “tenkeys”)
Switches the sign of a numerical value.
Selects the unit of measure.
Sets the tolerance values.
Deletes the value in the selected field.
Accepts the displayed comparator threshold values.
Aborts comparator setting
and returns to the previous
display.
Measurement Terminals
Connect measurement cables or a fixture (p. 23).
• H
CUR
jack: Current source terminal
• H
POT
jack: Detected voltage high
terminal
• L
POT
jack: Detected voltage low ter-
minal
• L
CUR
jack: Measurement current
detected terminal
• GUARD jack: Shield (measurement
ground) terminal
Connecting Probes
COMP indicator
LEDs
Indicate the decision result of the measured
value (p. 34).
Hi Measured value is
above upper limit
IN Pass (meets crite-
ria)
Lo Measured value is
below lower limit
Viewing
Comparator
Results
Viewing Measured
Values and Settings
Audible Alarm
(beeper)
Selecting the setting contents
(“the F keys”) F1 to F4 keys
Selects the corresponding
item on the right side of the
display.
Cursor keys
Move among the displayed
setting items.
The cursor location is indicated by reverse characters.
1.2 Names and Functions of Parts
1.2 Names and Functions of Part s
Front Panel
1
Page 22
16
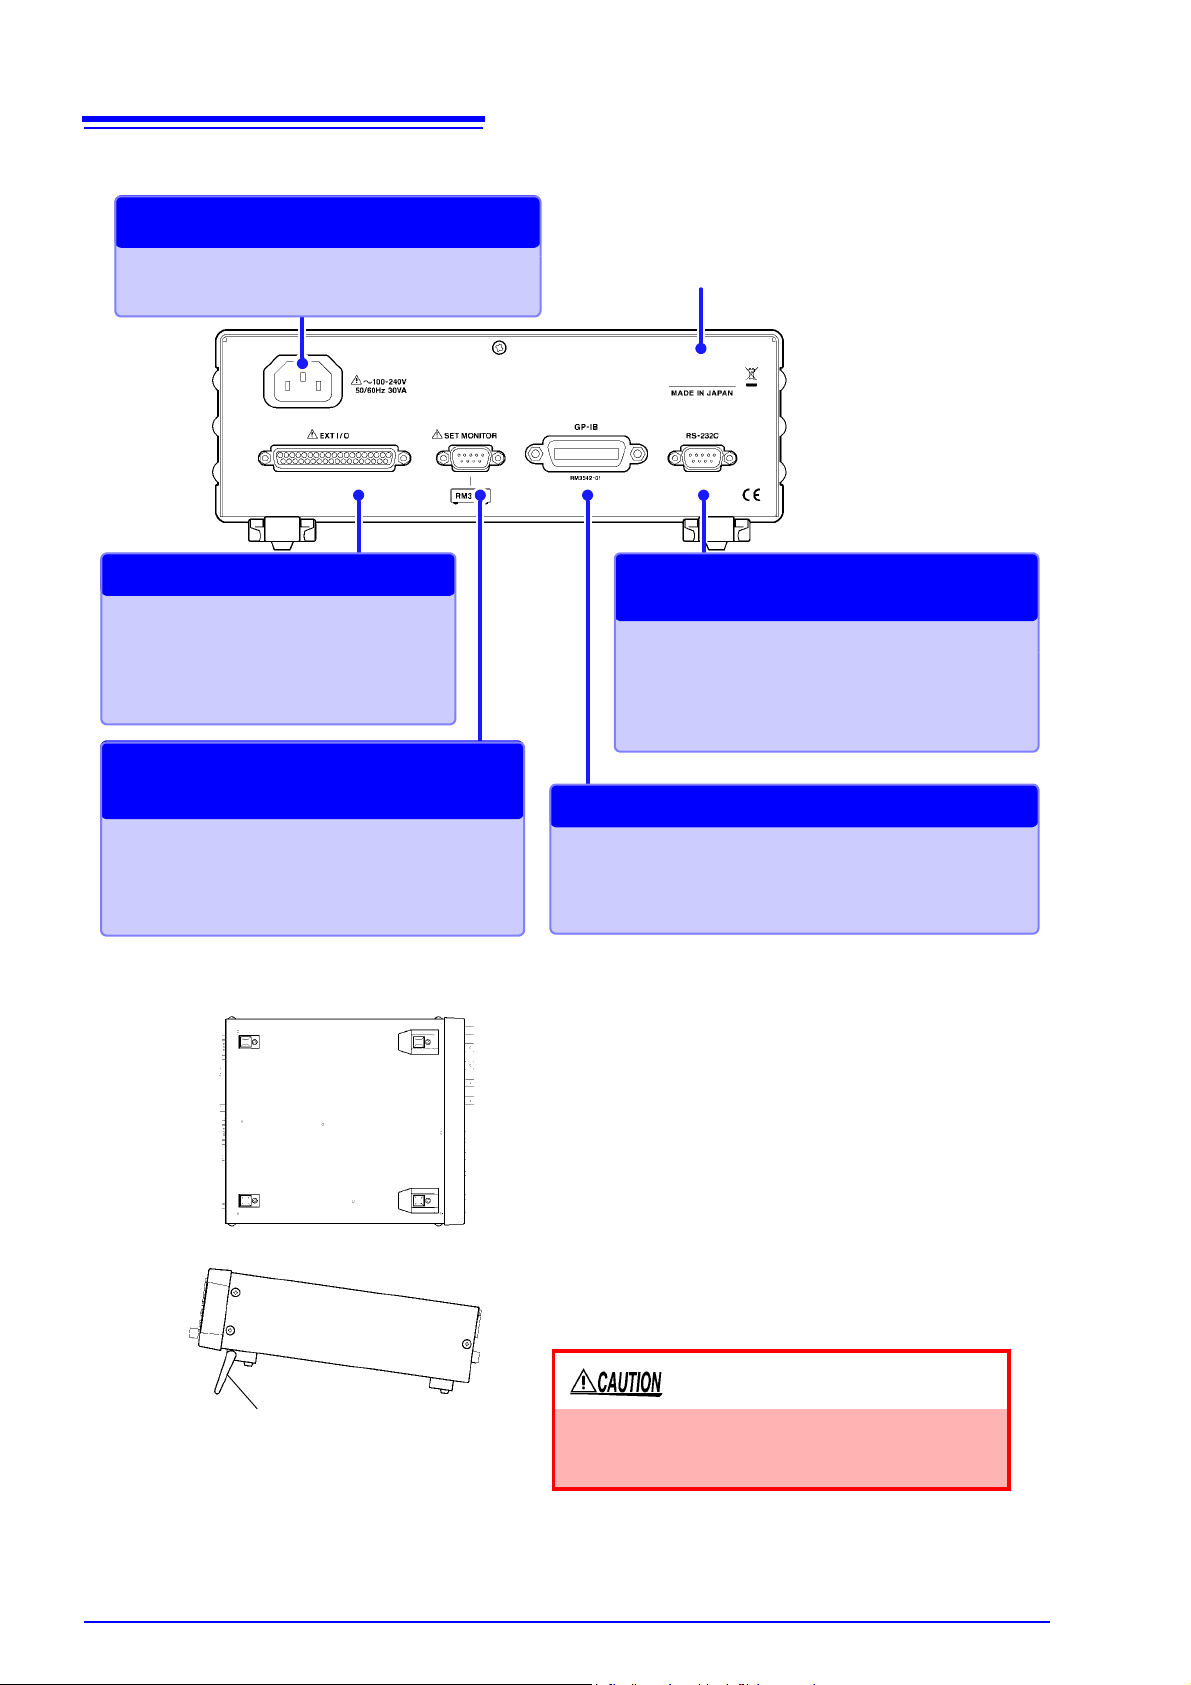
Manufacturer's Serial Number
Shows the serial number. Do not remove this label, as
it is required for product support.
Connect the supplied power cord (p. 22).
Connecting the Power Cord
RS-232C Connector
The RS-232C interface can be used to connect to
a PLC or computer (p. 97).
It is also used by the commercially available printer
with a serial interface (p. 79).
RS-232C Communications
Printer Output
GP-IB Connector (RM3542-01 only)
The GP-IB interface can be used to connect to a computer
(p. 97).
GP-IB Communications
SET MONITOR Connector
Connect another RM3542 here to compare instrument settings (p. 53).
Compare Two Instruments’
Settings
EXT I/O Connector
Connect to a PLC or I/O board to control
measurement start, and to acquire comparator results (p. 85).
External Control
Bottom Panel
Stand
When using the stand
Extend the stand until it clicks into place.
Make sure to extend both legs of the stand.
Collapsing the stand
Fold in the stand until it clicks into place.
This instrument can be rack mounted.
See: "Appendix 4 Rack Mounting" (p. A8)
Parts removed from this instrument should be stored in
a safe place to enable future reuse.
Do not apply heavy downward pressure with the
stand extended. The stand could be damaged.
1.2 Names and Functions of Parts
Rear Panel
Page 23
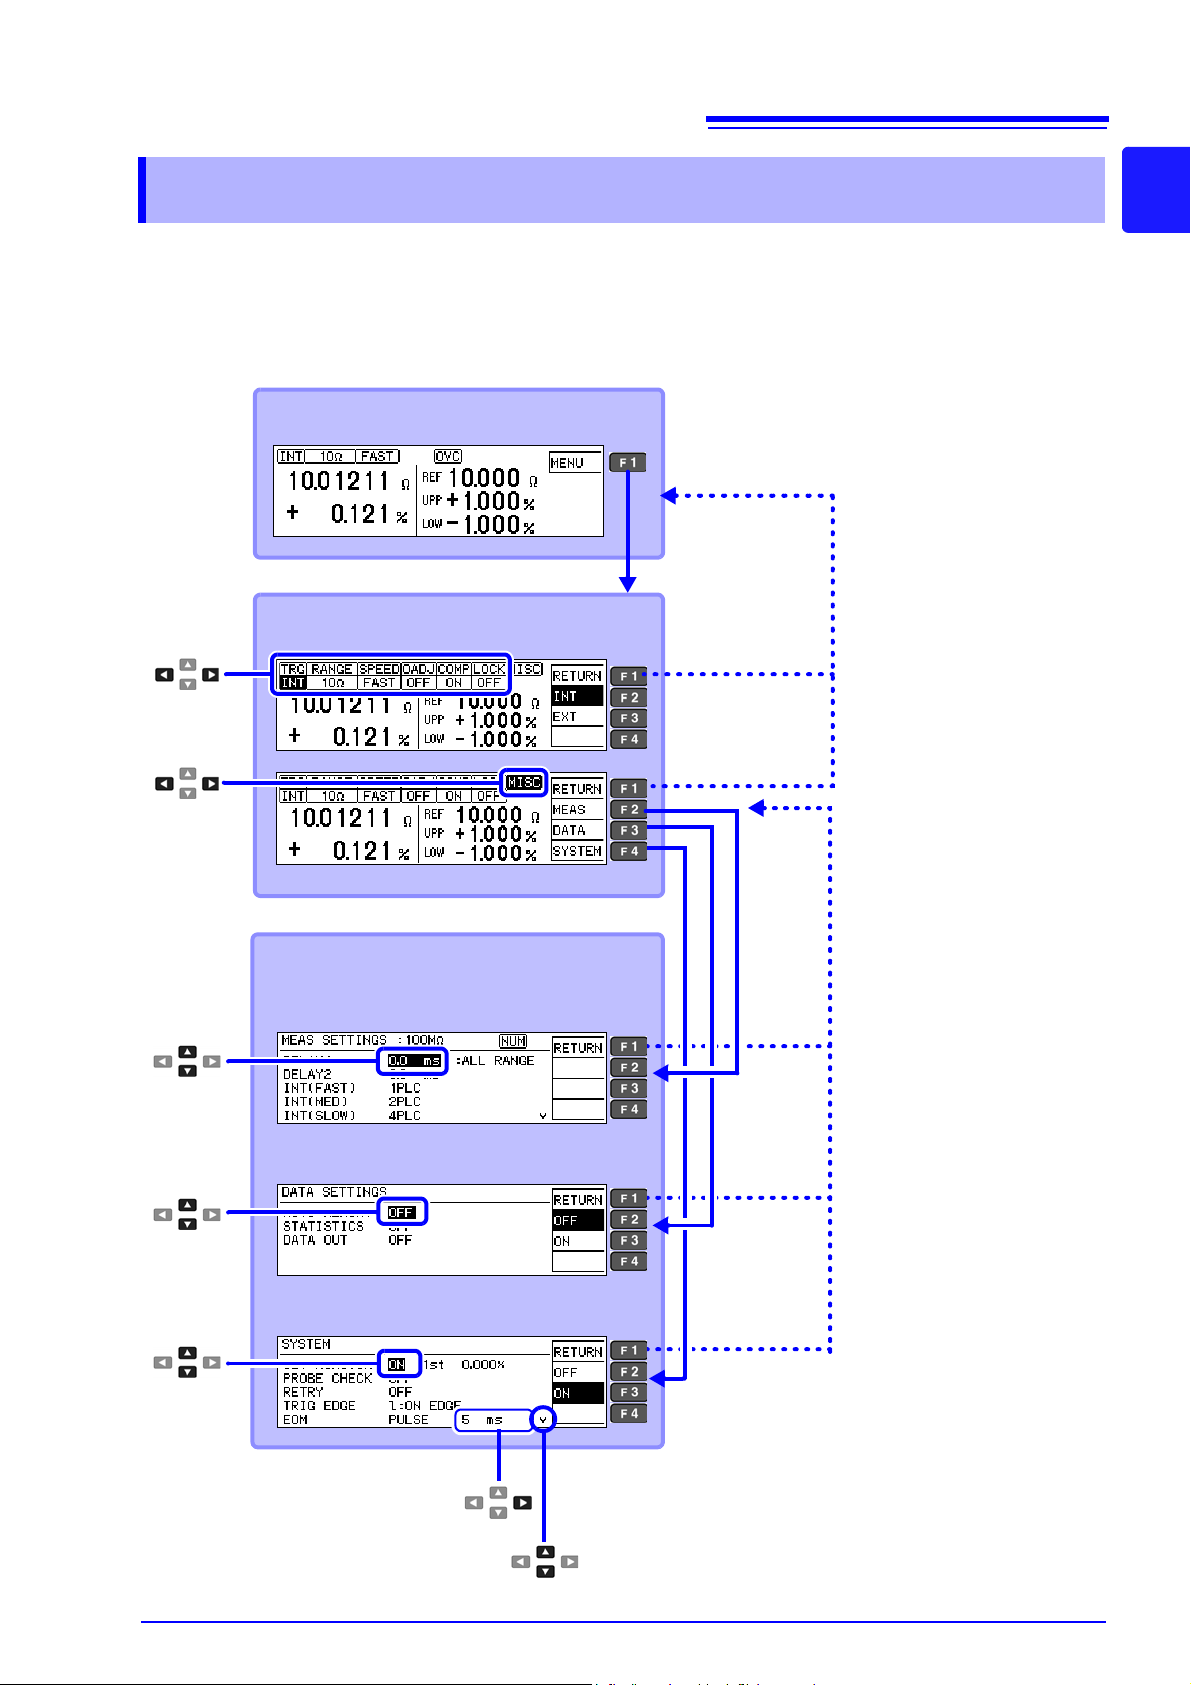
17
Detailed Settings Screens (p. 19)
Measurement Settings Screens
[MEAS SETTINGS]
Data Settings Screens
[DATA SETTINGS]
System Screens
[SYSTEM]
Measurement Screen (p. 18)
Basic Settings Screen (p. 18)
Return to Previous Screen
Indicates a Continued Screen
Return to Previous Screen
1.3 Screen Organization
1.3 Screen Organization
The instrument has three general display screen types: Measurement, Basic Settings and Detailed
Settings.
Refer to "11.3 Error Displays and Re medies" (p. 181) for error displays.
The screen examples in this guide appear reversed (black on white) for best visibility on the printed page.
However, the instrument screens can actually be displayed only as white characters on black background.
1
Page 24
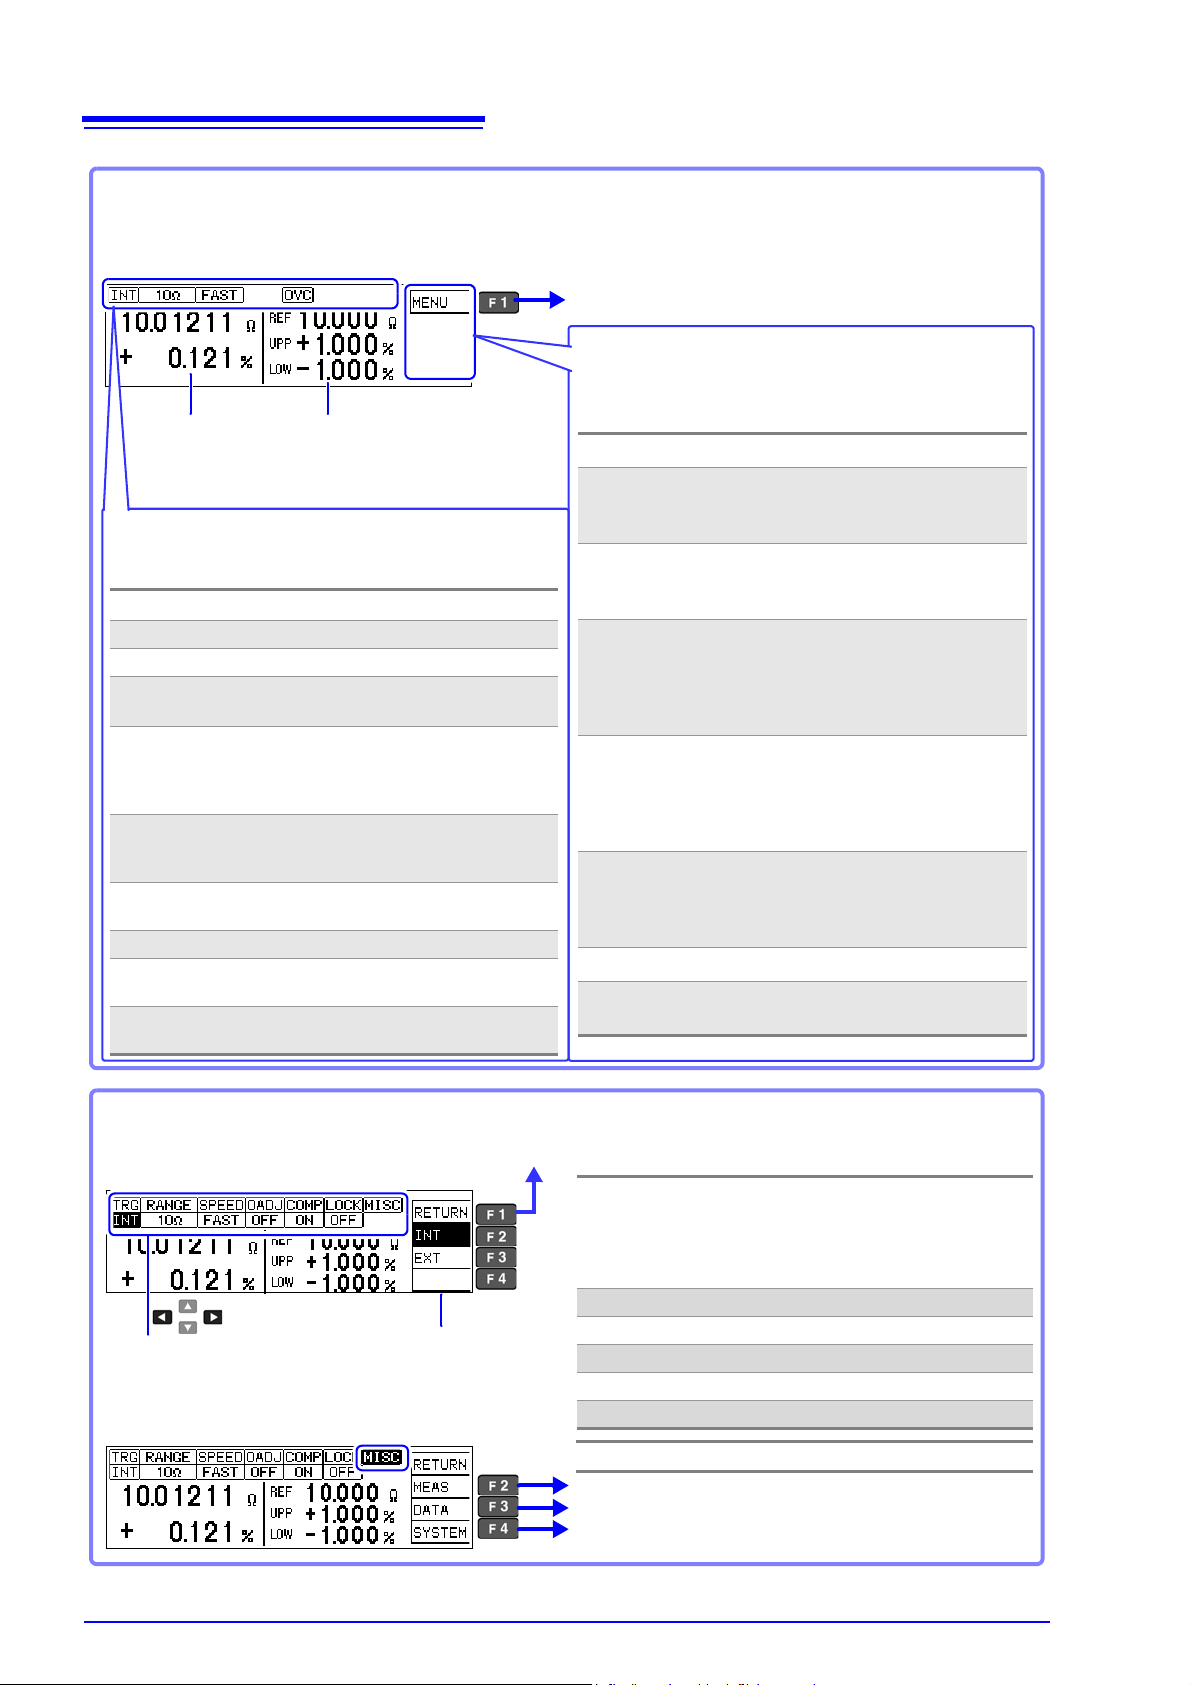
18
Measurement Screen
This screen normally appears while measuring. View currently measured values and measurement conditions.
Some parts of the display depend on the comparator
mode and other settings.
Measured Value
Settings Menu (corresponding to F keys)
Displayed contents depend on the curre nt function settings.
Parentheses ( ) indicate the corresponding F-key
MENU (F1) Displays the Basic Settings screen
PRINT (F2) Print (p. 81)
Appears only when the interface is
set for the printer
ST AT (F3) Statistical calculation results (p. 74)
Appears only when statistical calculation is enabled
NUMBER (F4) Set Auto-Memory number (quantity)
(p. 71)
Displays the number of stored data
items and the number of passed and
failed products at the lower left.
UNDO (F3) Deletes the previously stored mea-
surement and calculation result (only
one can be deleted) (p. 76)
Appears only when calculation results are displayed
ALLCLR (F4) Clears all memory and calculation
(p. 76)
Appears only when calculation results are displayed
LOCAL (F1) Enables local controll (p. 104)
UNLOCK (F1) Cancels the key-lock state (hold 1s)
(p. 60)
Criteria Setting Values (p. 34)
Displayed contents depend on the
selected comparator mode.
(Ex.: REF% mode)
To display the Basic Settings screen
Measurement Conditions
Shows current setting contents. Displayed contents depend on the current settings.
INT/ EXT Trigger source type (p. 30)
Measurement range (p. 31)
FAST/ MED/ SLOW Measurement speed (p. 29)
0ADJ/
OFF (not shown)
Appears only when zero-adjust is
enabled (p. 32)
OVC/
OFF (not shown)
(OVC: Offset Voltage Compensation)
Appears only when OVC is enabled (p. 57)
LP/
OFF (not shown)
Appears only when the Low- Power
Resistance function is enabled
(p. 28)
NUM Appears only when tenkey input is
enabled
RMT Remote control (p. 104)
M.LOCK Disables all operations except
comparator settings (p. 59)
F.LOCK Disables all operations including
comparator settings (p. 59)
Basic Settings Screen
Make basic measurement condition settings on this
screen. Measurement speed and range can be changed
while viewing measured values. (Trigger source: INT)
TRG
Change trigger source (measurement start
control method) (p. 30)
When EXT triggering is enabled, [MANU] ap-
pears beside the F4 key (press to trigger
measurement manually).
RANGE Change range (p. 31)
SPEED Change measurement speed (p. 29)
0ADJ Turn zero-adjust on/off (p. 32)
COMP Turn comparator on/off (p. 34)
LOCK Enable/disable key lock (p. 59)
Select measurement
condition settings
Move with cursor keys.
Measurement condition
setting selections
Return to previous screen
To display the [MEAS SETTINGS] screen
To display the [DATA SETTINGS] screen
To display the [SYSTEM] screen
MISC To display the Detailed Settings screen
1.3 Screen Organization
Page 25
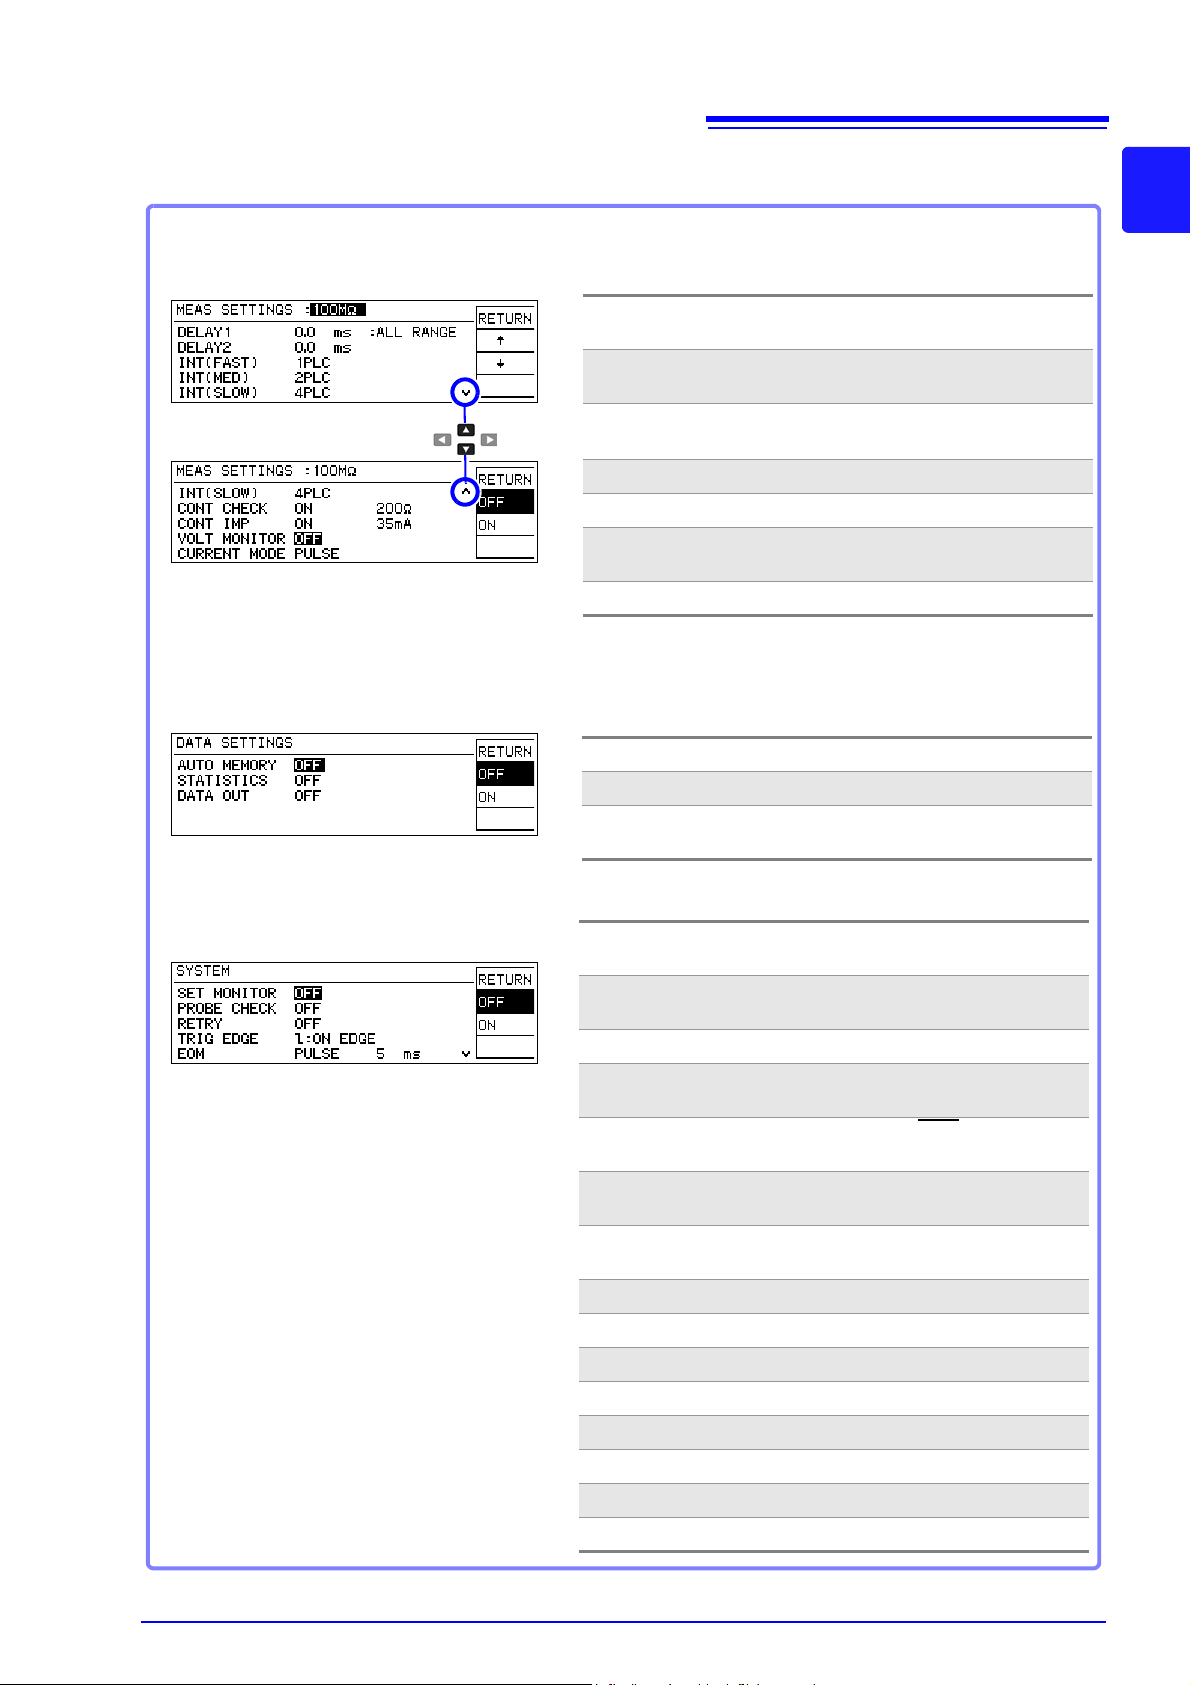
Measurement Settings Screen
[MEAS SETTINGS]
Set instrument system-related settings on this screen.
SET MONITOR Turn two-instrument setting comparison
on/off (p. 53)
PROBE CHECK Turn probe short-circuit detection on/off
(p. 51)
RETRY Retry function setting (p. 56)
TRIG EDGE (External I/O) Set trigger rising/falling
edge (p. 94)
EOM (External I/O) Set EOM
(end-of-mea-
surement) signal (p. 93)
INTERFACE Communications interface settings
(p. 101)
LOW POWER Low-power resistance component mea-
surement on/off (p. 28)
JUDGE BEEP Comparator beeper settings (p. 62)
KEY BEEP Key beeper on/off (p. 61)
CLOCK (Y-M-D) Set internal clock (p. 64)
LINE FREQ Set power source frequency (p. 63)
CONTRAST Adjust screen contrast (p. 65)
BACKLIGHT Adjust screen backlight (p. 66)
RESET Initialize (p. 67)
ADJUST Instrument Adjustment (p. A13)
System Screen
[SYSTEM]
Shows detailed settings for measurements.
Adjust the measurement speed, stability and measurement fault
detection functions.
DELAY1 Adjust the delay from probing to trigger
input (p. 42)
DELAY2 Adjust measurement object electrical re-
sponse (p. 42)
INT (FAST/ MED/
SLOW)
Make fine adjustment to integration time
(p. 44)
CONT CHECK Contact check threshold setting (p. 46)
CONT IMP Contact Improver function setting (p. 47)
VOL T MONITOR Voltage level monitor function setting
(p. 49)
CURRENT MODE Current mode setting (p. 50)
Data Settings Screen
(Save, Analysis, and Output)
[DATA SETTINGS]
These are settings for memory and statistical calculation functions.
AUTO MEMORY Turn Auto-Memory on/off (p. 71)
STATISTICS Statistical calculation on/off (p. 74)
DATA OUT Automatically output measured values
(communications) (p. 77)
Detailed Settings Screens
19
1.3 Screen Organization
1
Page 26

20
1.3 Screen Organization
Page 27
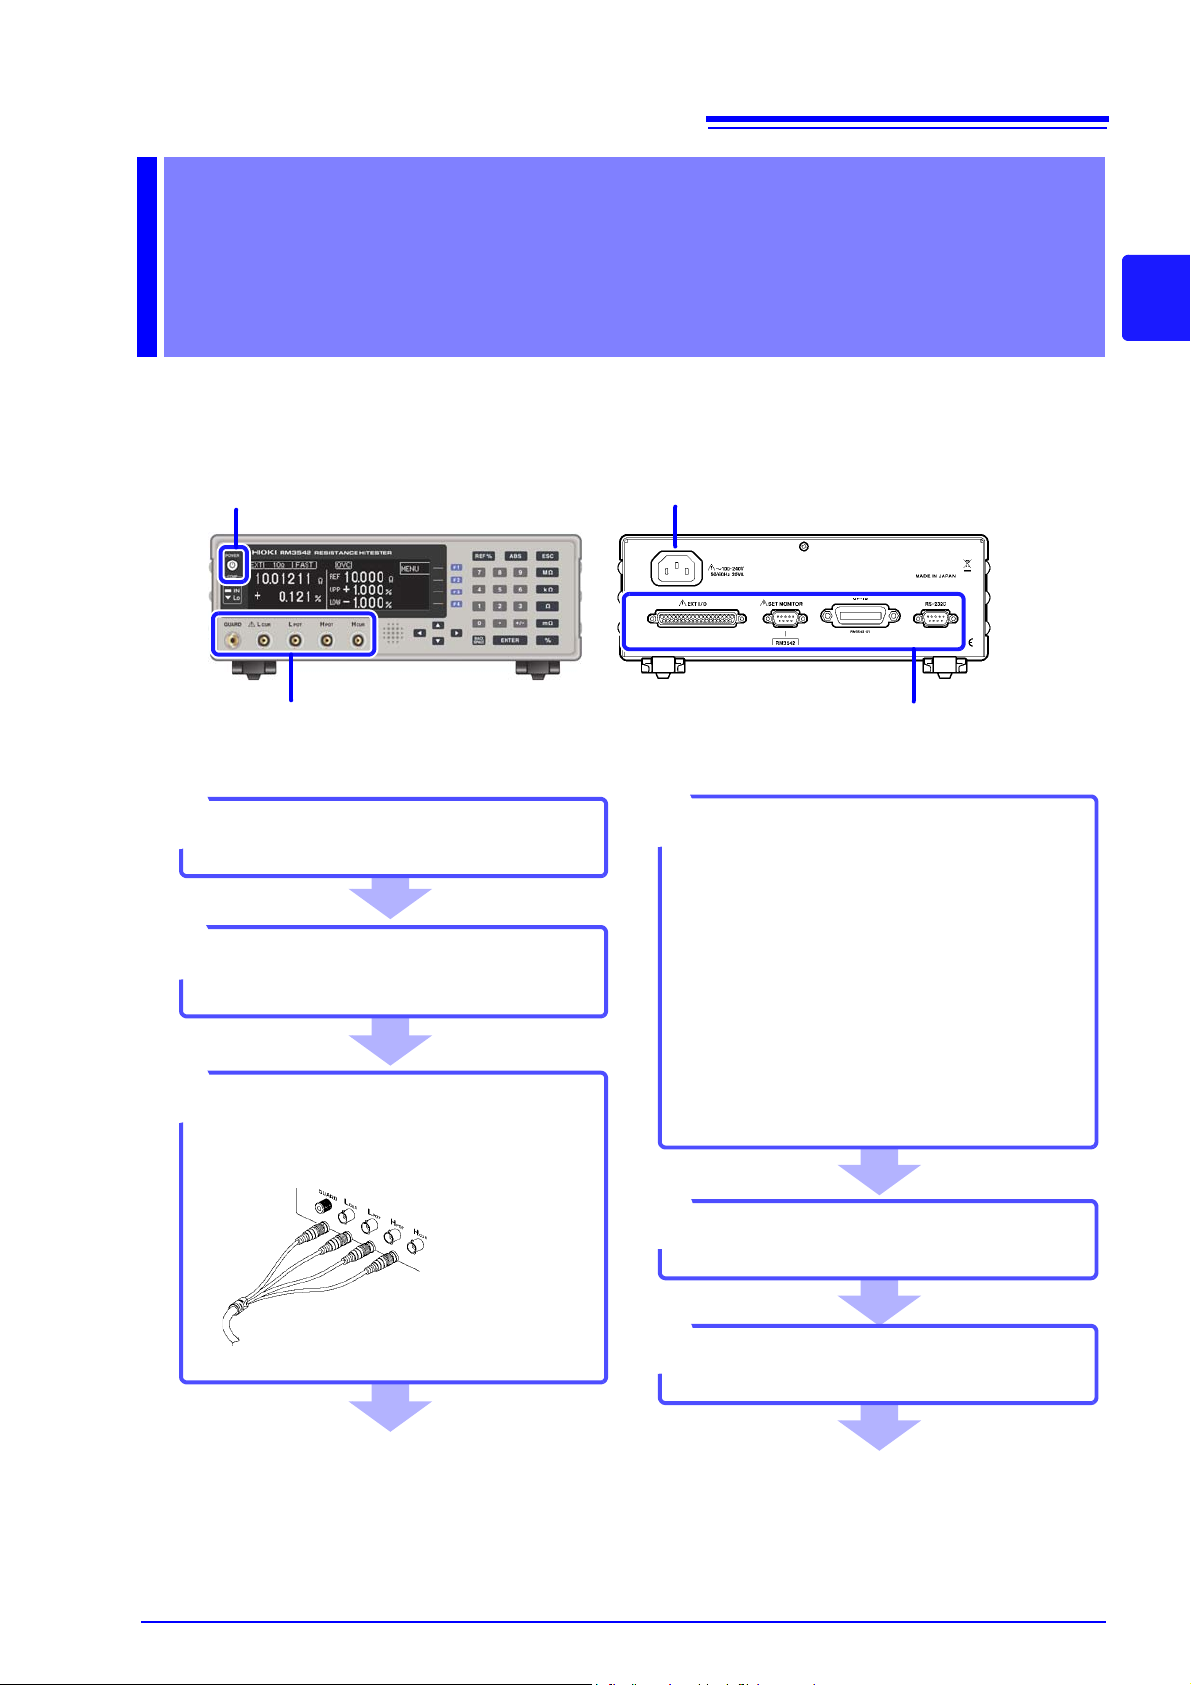
21
Install this instrument (p. 7)
1
Rear PaneFront Panel
Connect measurement cables
(p. 23)
Turn the power on (p. 25)
5
Connect to the test sample
When finished measuring, turn the
power off (p. 25).
Connect the external interface
(as needed)
4
• Using the printer (p. 79)
• Using the RS-232C or GP-IB interface
(p. 97)
• Connecting to a PLC or I/O board
(p. 85)
• Automatically comparing the settings
of two instruments (Settings Monitor
function) (p. 53)
Connect the power cord (p. 22)
2
3
2
3
4
5
Make instrument settings (p. 27)
6
Measurement
Preparations Chapter 2
Be sure to read the "Operating Precautions" (p.7) before installing and connecting this instrument.
Refer to "Appendix 4 Rack Mounting" (p. A8) for rack mounting.
2
Page 28
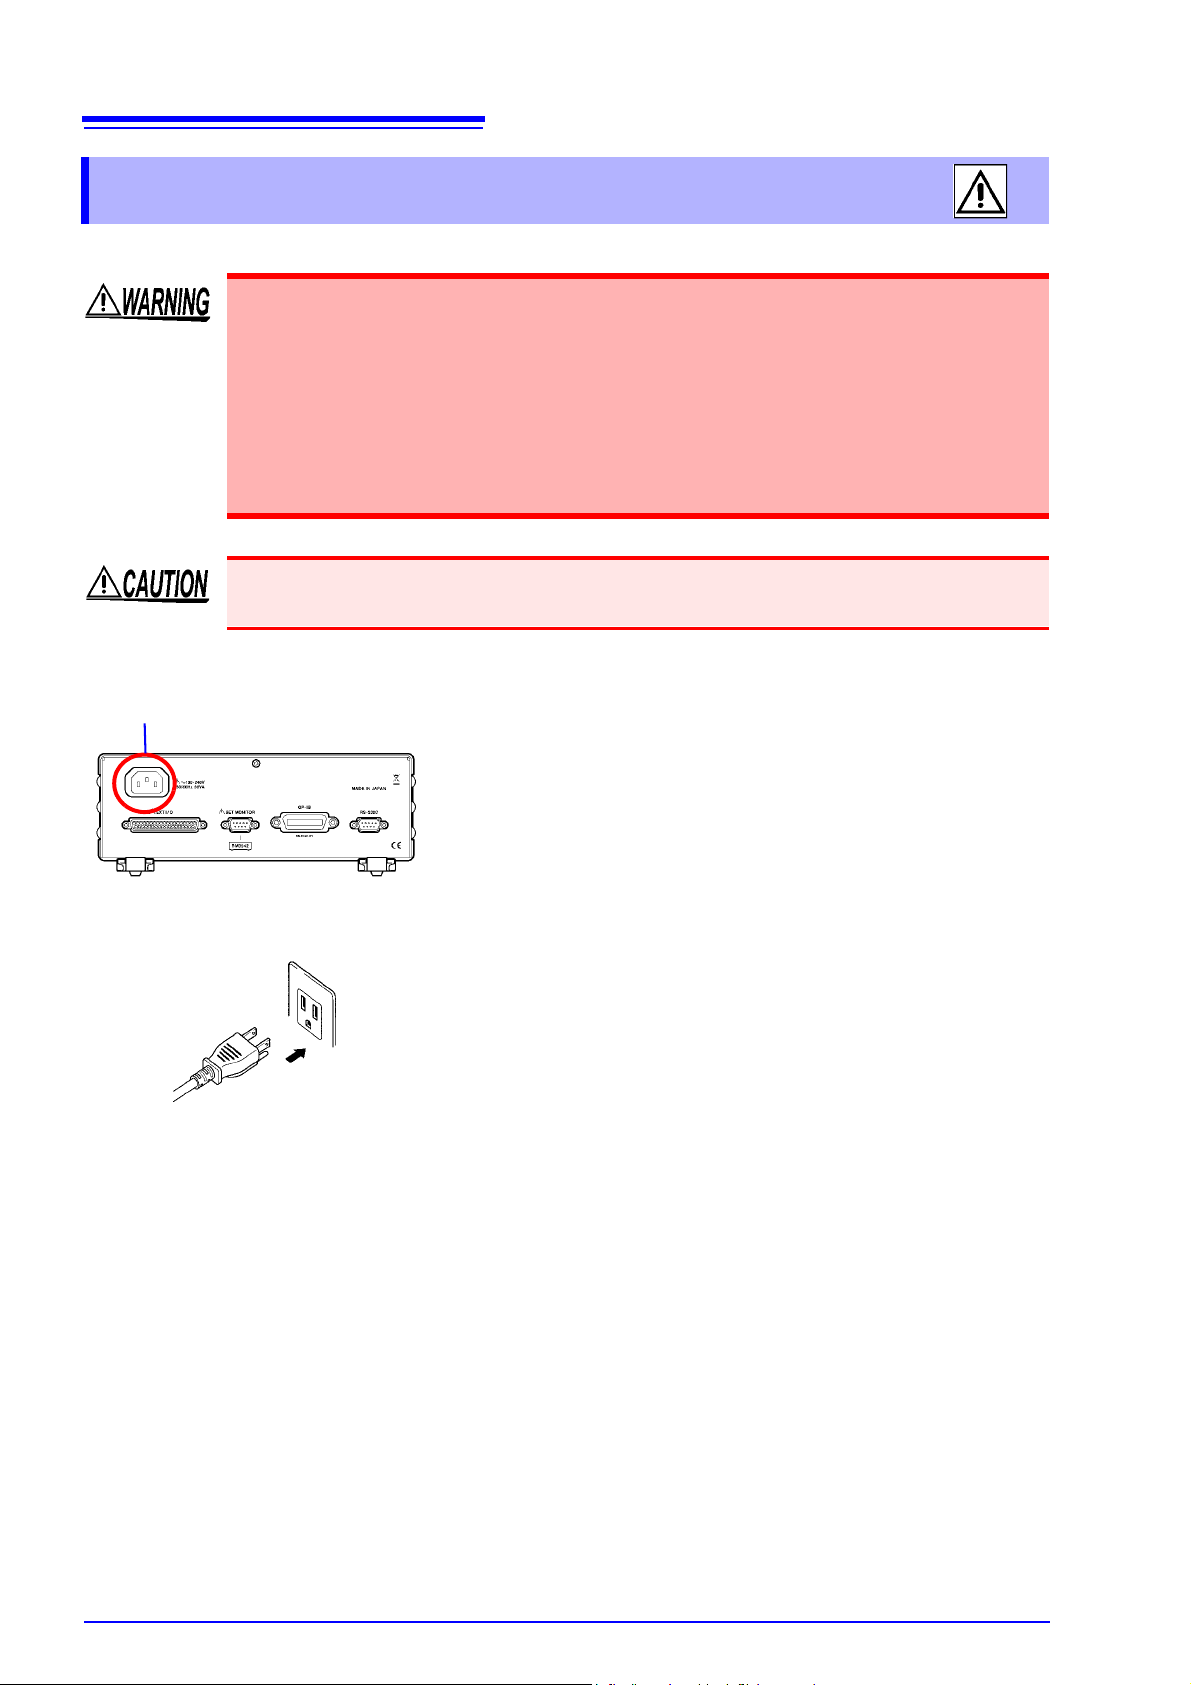
22
Rear Panel
1 Confirm that the mains supply voltage matches the
instrument, and connect the power cord to the power
inlet on the instrument.
2 Plug the power cord into the mains outlet.
The POWER button on the front panel lights red.
In event of a power outage, operation resumes with the same
settings when power is restored (breaker reset, etc.).
Power inlet
2.1 Connecting the Power Cord
2.1 Connecting the Power Cord
• Before turning the instrument on, make sure the supply voltage matches that indi-
cated on its power connector. Connection to an improper supply voltage may damage the instrument and present an electrical hazard.
• To avoid electrical accidents and to maintain the safety specifications of this instru-
ment, connect the power cord only to a 3-contact (two-conductor + ground) outlet.
• Before using the instrument, make sure that the insulation on the power cord is
undamaged and that no bare conductors are improperly exposed. Any damage
could cause electric shock, so cont act your dealer or Hioki representative.
To avoid damaging the power cord, grasp the plug, not the cord, when unplugging it from the
power outlet.
Page 29
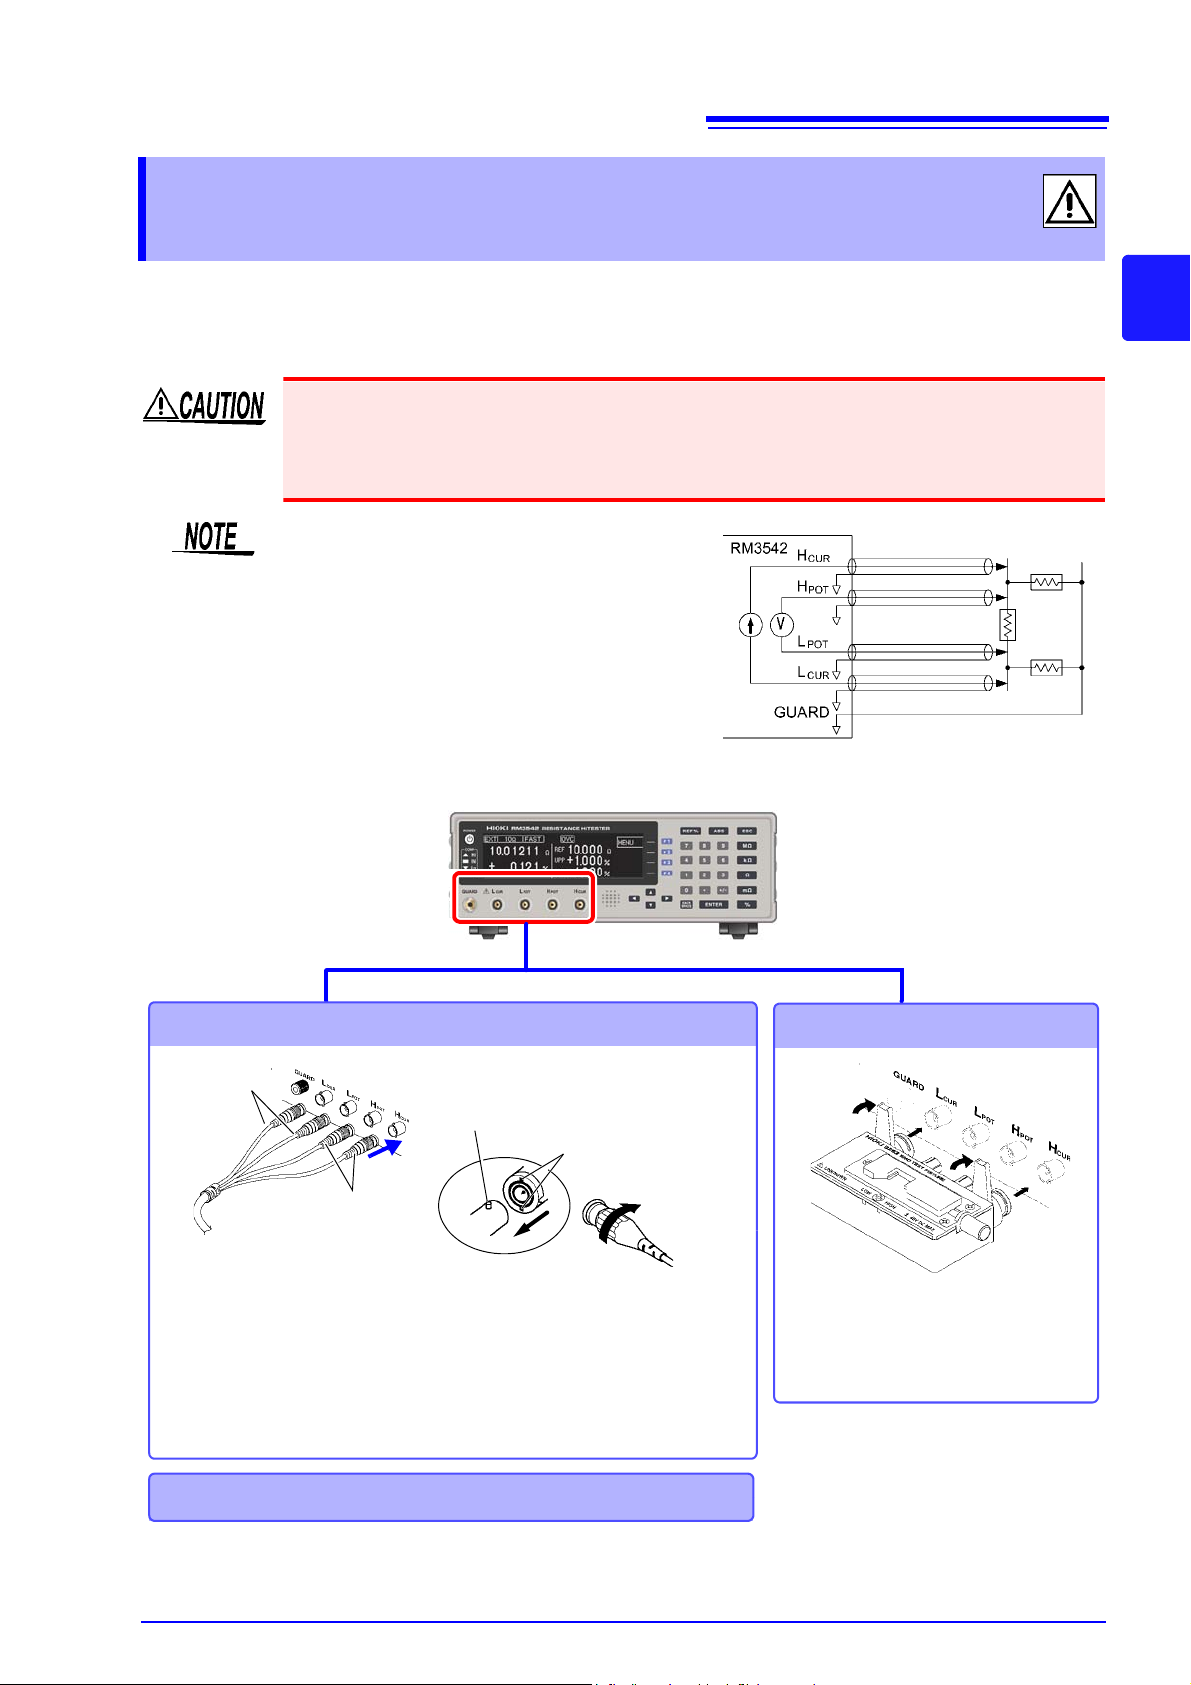
2.2 Connecting Measurement Cables and Test Fixtures
Example of defeated guard measurement
Connecting measurement cables
Connecting a fixture
Connect directly to the measurement
jacks with the label side up, and affix
with the levers on the left and right.
Connect the red plugs to the
H
CUR
and H
POT
jacks, and the
black plugs to the L
CUR
and
L
POT
jacks.
Black plugs
Red plugs
BNC Jack Guide Pins
(on the instrument)
Lock
BNC plug slots
2
1
Align the slots in the BNC plug with the
guide pins on the jack on the instrument,
then push and twist the plug clockwise
until it locks.
Disconnecting BNC connectors
Push the BNC plug, twist it counterclockwise, and pull it out.
Making your own probes and extenders (p. 24)
Connection Methods
2.2 Connecting Measurement Cables and
Test Fixtures
23
Connect your measurement cables, optional Hioki probes or test fixture to the measurement jacks.
Refer to "Options" (p.4) for details. See the instructions provided with the fixture for operating
details.
• Do not apply a voltage to the measurement terminals. Doing so may damage the unit.
• When disconnecting the BNC connector, be sure to release the lock before pulling off the
connector. Forcibly pulling the connector without releasing the lock, or pulling on the cable,
can damage the connector.
• We recommend using optional Hioki fixtures.
• Use the GUARD jack only for Faraday
shield, and avoid more than 10 mA current flow. This jack is not for guarding
network resistance measurements.
2
Page 30
24
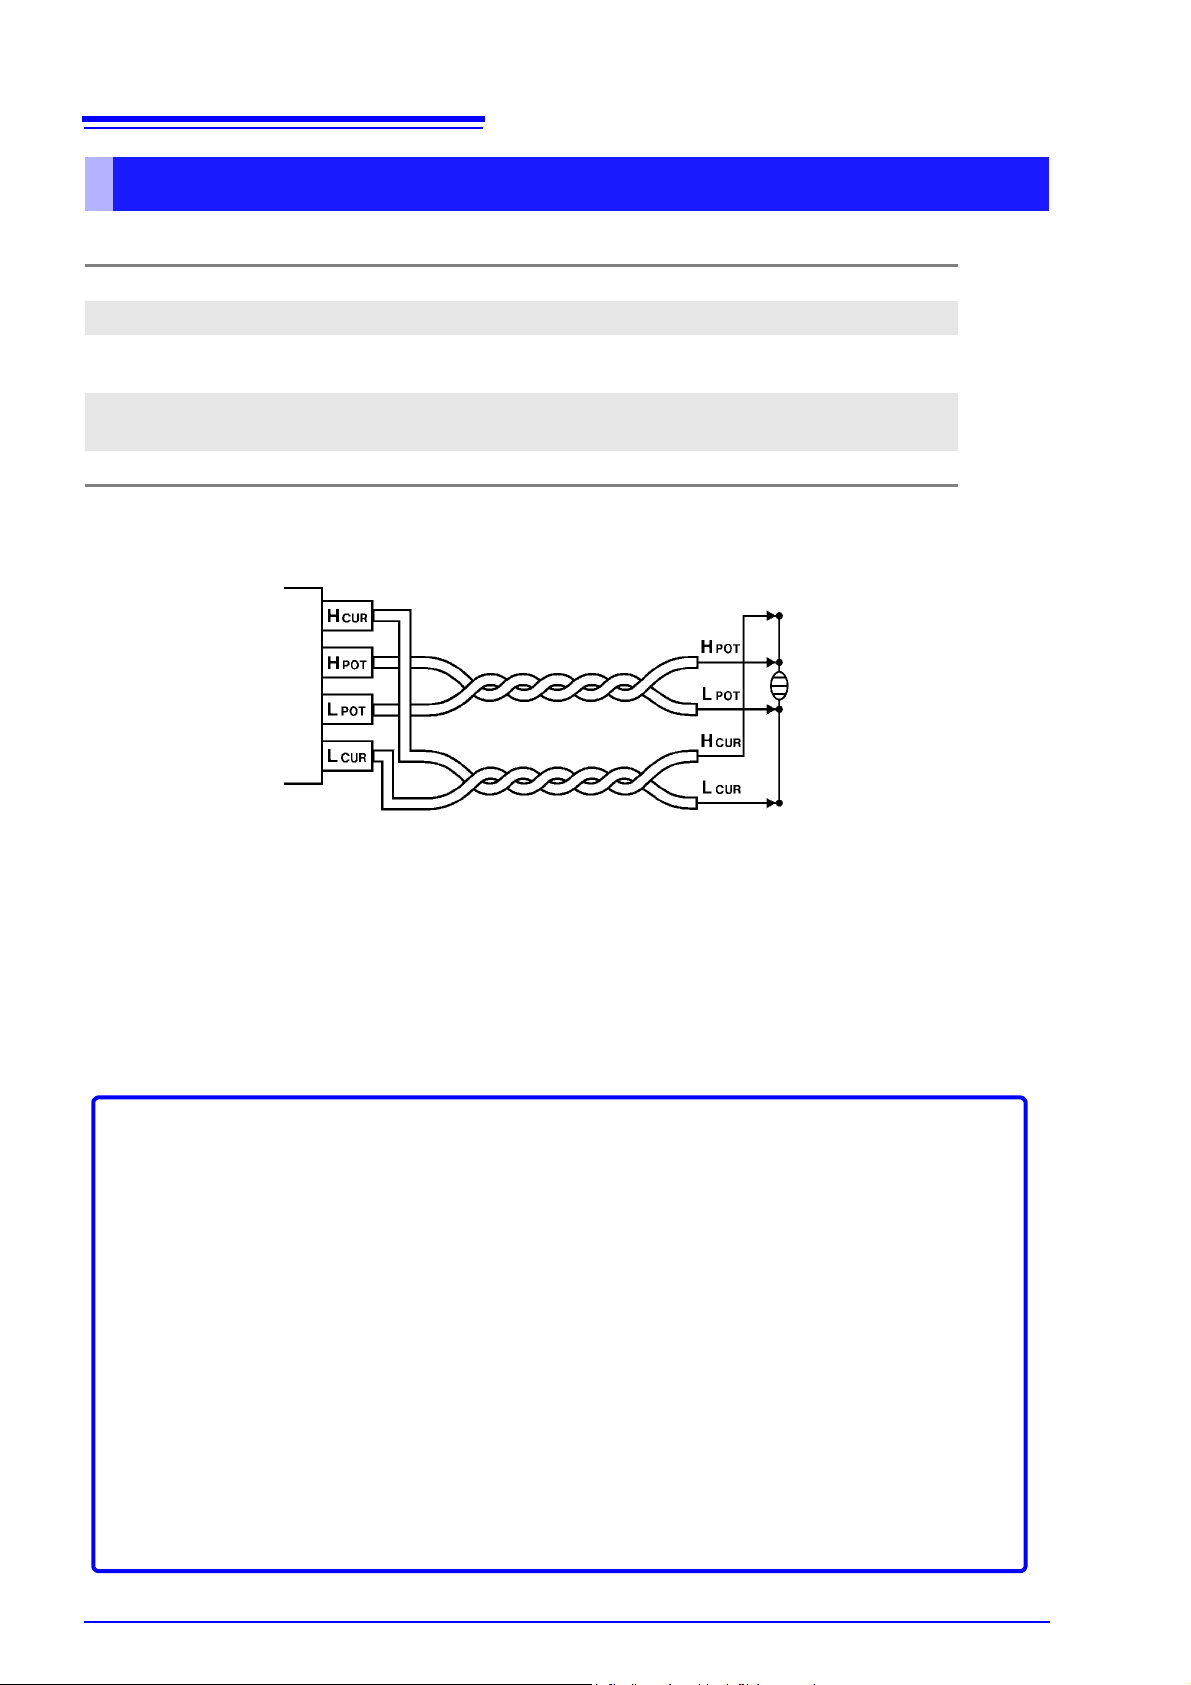
Wiring Diagram
Before Wiring
• Twist together the H
POT
and L
POT
wires, and the H
CUR
and L
CUR
wires. If not twisted together, measured values may be unstable and errors occur whe n measuring with low-power resistan ce, or low resistance values.
• Refer to the block diagram (p. 14) for internal circuit details.
• Probes and measurement objects should be shielded at BNC or GUARD jack potential.
• Measurement cable length should not exceed 2 m (with conductor resistance 500 m/m or less).
Long cables are more susceptible to noise, and measured values may be unstable.
• Extensions should maintain the four-terminal structure. If con verted to a two-te rminal circuit in the
wiring, correct measurement may not be possible due to the effects of wiring and contact resistance.
• Cables and measurement objects should be shielded.
• After extending measurement cables, confirm operation and accuracy ("Measurement Specifications" (p.176)).
• If cutting the ends off of optional measurement cables, make sure that the shield does not touch
the center conductor of the H
CUR
, H
POT
, L
POT
and L
CUR
cables. Correct measurem ent is n ot pos -
sible with a shorted cable.
Extending Measurement Cables
Observe the following when extending measurement cables:
2.2 Connecting Measurement Cables and Test Fixtures
Making Your Own Measurement Cables
Recommended Measurement Cable Specifications
Conductor resistance
Capacitance 150 pF/m or less
Cable dielectric material Polyethylene (PE), Teflon* (TFE), polyethylene foam (PEF)
Connector insulating material Teflon* (TFE ), polybutylene terephtalate (PBT)
Length 2 m or less
500 m
/m or less
Insulation resistance at least 10 G
Insulation resistance at least 10 G
Example: JIS standard 3C-2V, 1.5D-2V MIL standard RG-58A/U
* Teflon is a registered trademark of E. I. du Pont de Nemours and Company.
Page 31

2.3 Turning the Power On and Off
Press the POWER button (it lights green).
Self-test
Indicates an error (p. 181).
After Power-On
A self-test (instrument diagnostic routine) is performed.
During the self-test, the following information is displayed while the hardware is verified.
Error
No Errors
Normal display (measurement screen)
The following information is displayed during self-testing:
• Manufacturer and model name
• Firmware versions (main, and measurement)
• Communication setting
• Line frequency setting
2.3 Turning the Power On and Off
Turning Power On
25
2
When the power is turned on, the same setting as when the power was last turned off
Turning Power Off
appears (backup function).
When powered up for the first time, the default settings appear.
See: "Default Settings" (p.68)
Before Starting Measurement
To obtain precise measurements, provide about 30 minutes warm-up after turning power on.
Measurement settings are recalled from when the power was previously turned off (settings
backup).
However, measurement settings made through the RS-232C or GP-IB interface are not
retained, although they can be stored using the
Press the POWER button (it lights red when the inst rument is off).
Disconnect the power cord from the outlet to extinguish the POWER button light.
When power is turned on again, operation resumes with the same settings as when last
turned off.
If a power outage (e.g., breaker trip) occurs when the instrument is on, it will automatically
turn on again when power is restored (without pressing the POWER button).
:SYSTem:BACKup command (p. 135).
Page 32

26
2.3 Turning the Power On and Off
Page 33

27
Do not use the instrument if damage is
found, as electric shock or short-circuit
accidents could result. Contact your
dealer or Hioki representative.
Metal Exposed
Is the power cord insulation torn, or is
any metal exposed?
1
Before using the instrument for the first time, verify that it operates normally to ensure that no damage occurred during storage or shipping. If you find any damage, contact your dealer or Hioki representative.
Peripheral Device Inspection
Is the insulation on a measurement
cable torn, or is any metal exposed?
No Metal Exposed
If there is any damage, measured values may be unstable and measurement errors may occur. Replace the
cable with an undamaged one.
Metal Exposed
No Metal Exposed
If damage is evident, request repairs.
Yes
Is damage to the instrument evident?
Instrument Inspection
When turning power on
Does the self-test screen appear
(model no., version no.)? (p. 25)
No
2
The power cord may be damaged, or
the instrument may be damaged internally. Request repairs.
Does the Measurement screen appear
after self-test?
No
Yes
The instrument may be damaged internally. Request repairs.
See: "11.1 Troubleshooting" (p. 179)
"11.3 Error Displays and Remedies" (p. 181)
An error indication
occurs (ERR)
Yes
Inspection complete
Please read the "Operating Precautions" (p. 7) before use.
3.1 Pre-Operation Inspection
Measurement Settings
(Basic Measurements)
Chapter 3
See "Measurement Flow" (p. 2) for an outline of the measurement process from preparation to endof-measurement.
3.1 Pre-Operation Inspection
3
Page 34

28
Measurement range: 0.0000 m(100 m range) to
120.0000 M (10 ranges)
Normal Resistance Measurement
General-purpose resistors
Measurement range: 0.000 m (1000m range) to
1200.000 (4 ranges)
Low-Power Resistance Measurement
Hard-to-measure components such
as ferrite bead or layered inductors,
or other elements sensitive to measurement current
LP
LP appears at the top of the screen.
The Basic Settings screen appears.
1
The System screen appears.
[SYSTEM]
Selection
2
Selection
1
2
Normal resistance measurement (default)
Low-power resistance measurement
Return to the setting screen.
Save setting and return to
previous screen.
Discard setting and return to
previous screen.
The confirmation screen appears.
3.2 Measurement Object Types
3.2 Measurement Object Types
The instrument provides two measurement methods: resistance measurement, and low-power
resistance measurement. Select the appropriate measurement method for the type o f compo nent to
be measured. For general-purpose resistor measurements, use the factory defaults. The power
applied to the DUT = Resistance Value
See: "(6) DUT Becomes Warm" (p. A6)
(Example)If the resistance to be measured is 100
(Measurement Current) (Measurement Method)
10 mA 100
1 mA 100
× 0.01
× 0.001
2
= 10 mW Normal Resistance Measurement, 100 Range
2
= 100 W Low-Power Resistance Measurement, 100 Range
× (Measurement Current)
2
.
The 1000 and higher ranges (with LOW POWER: OFF) are not usable for inductor measurements.
Open the Basic Settings screen.
1
Open the System screen.
2
Select the low-power mode, as needed.
3
Return to the Measurement screen.
4
Page 35

29
The Basic Settings screen appears.
1
Selection
2
See table below
(default)
Press the up/down cursor keys to change the
setting.
3.3 Setting the Measurement Speed
3.3 Setting the Measurement Speed
The measurement speed can be set to FAST, MED (medium), or SLOW. A slower measurement
speed provides greater measurement precision, and a faster measurement speed results in greater
susceptibility to environmental noise. Ensure that measurement cables and the sample are sufficiently shielded.
Open the Basic Settings screen.
1
Select the measurement speed.
2
3
Return to the Measurement screen.
3
Relationship Between Measurement Range and Speed
(factory defaults)
Measure-
ment Range
100m 3.8 ms 13 ms
1000m 2.0 ms 6.4 ms
10
100
1000
10k
100k
1000k
10M
100M
LOW POWER: OFF LOW POWER: ON
FAST MED SLOW FAST MED SLOW
1.6 ms 6.0 ms
0.9 ms 3.6 ms
0.9 ms 3.6 ms
1.0 ms 3.6 ms
1.3 ms 3.8 ms
2.5 ms 6.0 ms
5.3 ms
26 ms
22 ms
23 ms
20 ms
46 ms
39 ms
43 ms
36 ms
41 ms
35 ms
41 ms
34 ms
21 ms
17 ms
21 ms
17 ms
21 ms
17 ms
21 ms
18 ms
21 ms
18 ms
23 ms
20 ms
86 ms
72 ms
2.5 ms 12 ms
2.5 ms 12 ms
1.7 ms 6.1 ms
7.2 ms 12 ms
Integration time can be optionally set
for each range (p. 44).
42 ms
35 ms
42 ms
35 ms
41 ms
34 ms
47 ms
40 ms
Upper value:
for 50-Hz power line frequency
Lower value:
for 60-Hz power line frequency
Tolerance:
±10%±0.2 ms
Page 36

30
Trigger signals are automatically generated internally for continuous
measurement.
Measure with internal (INT) triggering
To measure automatically
Measurements are triggered by an external signal.
Manual measurement triggering is also available.
• Apply a trigger signal at the EXT I/O connector (p. 85)
• Send the TRG command by communications interface (p. 126)
• Press F4 [MANU] (only appears when EXT is selected)
Measure with external (EXT) triggering
To measure at specific times
To retain measured values
• When internal triggering is enabled, the EXT I/O TRIG signal and the “TRG” command are ignored
(except for memory storage and statistical calculations).
• To measure samples such as inductors that require time to settle, adjust delay time DELAY2. Start with
a long delay, and gradually shorten it while watching for the measured value to settle.
See: "4.2 Setting Pre-Measurement Delay" (p. 42)
• When external triggering is enabled, the Auto-Memory function is disabled by force.
The Basic Settings screen appears.
1
Selection
2
Internal trigger
External trigger
(default)
Press F3 [EXT] to display the F4 [MANU] indicator.
Press to trigger a measurement manually.
Press the up/down
cursor keys to
change the setting.
3.4 Setting Measurement Start Conditions (Trigger Source)
3.4 Setting Measurement Start Conditions
(Trigger Source)
Measurements can be started in two ways.
Open the Basic Settings screen.
1
Select internal (INT) or external (EXT) triggering.
2
Return to the Measurement screen.
3
Continuous measurement (:INITIATE:CONTINUOUS ON) is the n ormal trigger state when operatin g from
the front panel. Selecting the internal (INT) trigger source activates continuous triggering ("free-run"). When
external (EXT) triggering is selected, each external trigger event initiates one measure ment. Continuous measurement can be disabled by sending the
IB. When continuous measurement is disabled, trigger acceptance is controlled only by the host (computer or
PLC).
See: for trigger command: "Triggering" (p. 138), "9.8 Data Exporting Methods" (p. 148)
:INITIATE:CONTINUOUS OFF command via RS-232C or GP-
Page 37

31
The Basic Settings screen appears.
1
Selection
2
Press the up/down
cursor keys to
change the setting.
Increments the
range
Decrements the
range
3.5 Selecting the Measurement Range
3.5 Selecting the Measurement Range
The measurement range can be set as follows. When making comparator settings with the panel
keys, the measurement range is selected automatically according to the settings (reference/tolerance or upper/lower thresholds, see the following table). When the comparator settin gs are made by
remote control commands, the measurement range is unaffected.
Changing the Range
Measurement error is larger when measuring values nearer the bottom of a measurement range.
The 1000 and higher ranges (with LOW POWER: OFF) are not usable for inductor measurements.
Auto-Ranging (when making comparator settings)
Low Power OFF (p. 28) Low Power ON (p. 28)
Reference (REF%) and
Upper/Lower Threshold (ABS) Ranges
0 to 100.09 m 100 m
100.1 to 1000.9 m 1000 m 0 to 1000.9 m 1000 m
1.001 to 10.009 10 1.001 to 10.009 10
10.01 to 100.09 100 10.01 to 100.09 100
100.1 to 1000.9 1000 100.1 to 1200.0 1000
1.001 to 10.009 k 10 k
10.01 to 100.09 k 100 k
100.1 to 1000.9 k 1000 k
1.001 to 10.009 M 10 M
10.01 to 120.00 M 100 M
Selected
Range
Reference (REF%) and
Upper/Lower Threshold (ABS) Ranges
Selected
Range
3
Manual Range Selection
Open the Basic Settings screen.
1
Select the range.
2
Selectable ranges depend on the low-power resistance setting (p. 28).
• When low-power resistance measurement is disabled (OFF)
100m, 1000m, 10, 100, 1000, 10k, 100k, 1000k, 10M, 100M(default)
• When low-power resistance measurement is enabled (ON)
1000m, 10, 100, 1000
Return to the Measurement screen.
3
Page 38

32
The Basic Settings screen appears.
1
Selection
2
Internal trigger
Press the up/down cursor keys to change the
setting.
1
Selection
2
Disable zero adjustment (cancel)
Execute zero adjustment
3.6 Zero Adjustment
3.6 Zero Adjustment
When four-terminal measurement (Kelvin connection) is impractical such as when measuring very
small samples, the additional inherent resistance of the two-terminal wiring should be canceled out.
The zero-adjustment function can cancel out up to 10 additional resistance.
Before Zero Adjustment
• The guaranteed accuracy of the instrument applies to four-terminal connections without zero adjustment.
When using four-terminal connections, do not execute zero adjustment. Executing zero adjustment with
incorrect wiring may amplify measurement error. However, zero adjustment may be needed even with fourterminal measurements if they are affected by a large offset voltage, such as due to thermal emf (LOW
POWER OFF, in 100 to 100 M ranges).
• Execute zero adjustment when the ambient temperature has changed, or when a probe is replaced.
Execute zero adjustment after the warm-up period following power on.
Open the Basic Settings screen.
1
Select the internal (INT) trigger mode.
2
Short the probes together.
3
Confirm that the measured value does not exceed 10 .
4
If no measured value is displayed, increment the measurement range (p. 31).
Select whether to enable or disable zero adjustment.
5
After confirming that the measured value does not exceed 10 , execute zero adjustment.
6
Return to the Measurement screen.
Page 39

Zero Adjustment Faults
If zero adjustment fails, the following error message appears.
33
3.6 Zero Adjustment
Before attempting zero adjustment again, confirm the following:
• With the 10 range selected, confirm that the displayed value does not exceed 10 .
• Confirm that the probe connections are correct.
3
Page 40

34
Measured value is above
upper limit
Pass (meets criteria)
Measured value is below
lower limit
Select the REF% (relative values) decision
mode
Decide whether a measured value is
within specified tolerance limits relative to a specified reference value
(p. 35)
Select the ABS (absolute values) decision
mode
Decide whether a measured value is
between specified upper and lower
threshold values (absolute values)
(p. 37)
12.000 k ..... reference value
+0.080%........ positive tolerance
-0.080%......... negative tolerance
example
100.00 m .... upper threshold
80.00 m ...... lower threshold
example
Hi
IN
IN
Lo
Hi
IN
Lo
Positive
tolerance [%]
Reference value [
]
Negative
tolerance [%]
Upper
threshold [
]
Lower
threshold [
]
3.7 Judging Measured Values (Comparator Function)
3.7 Judging Measured Values
(Comparator Function)
Comparator results are available as external output (at the
EXT I/O connector) when the comparator reference/tolerance
or upper/lower threshold values have been set.
See: "Chapter 8 External Co ntrol" (p. 85)
Comparator results are also indicated by the COMP Hi/IN/Lo
panel lamps, and by audible beeper (disabled by default).
See: "Setting the Comparator Decision (“JUDGE”) Beeper" (p. 62)
The comparator decision mode can be set as one of the following:
Before Using the Comparator Function
• When the measured value is out of the selected measurement range, comparator decision indicators
appear as follows. In the event of a measurement fault, no decision is made.
See:"3.8 Confirming Faulty Measurements" (p. 38)
Out-of-Range Display Comparator Decision Indicator
• If power is turned off during comp arator setting, changes to settings are lost as they revert to their previous
values. To accept the settings, press the ENTER key.
• When setting comparator criteria, the appropriate range is selected automatically. Refer to "Auto-Ranging
(when making comparator settings)" (p. 31) for range settings.
+OvrRng Hi
-OvrRng Lo
Page 41

3.7 Judging Measured Values (Comparator Function)
The Basic Settings screen appears.
1
Selection
2
Disable the function
Enable the function
Press the up/down
cursor keys to
change the setting.
(When the function is disabled)
Comparator decisions are indicated only when the function is enabled .
Relative Value =
(tolerance)
Reference
Value
Measured
Value
- 1
X 100 [%]
Setting range:
-9.999% to +9.999% (When 10% or less)
-99.99% to +99.99% (When more than 10%)
Reference value
Positive tolerance (upper decision threshold)
Negative tolerance (lower decision threshold)
Enabling and Disabling the Comparator Function
The comparator function is enabled by default.
When the function is disabled, comparator settings are ignored.
Open the Basic Settings screen.
1
Enable or disable the comparator function.
2
35
3
Return to the Measurement screen.
3
Decide According to Reference Value and Tolerance (REF% Mode)
Example: Set a reference value of 10.5
To abort the setting process, press . Settings are abandoned and the display returns to the previous
screen.
with ±4.5% decision tolerance.
Open the relative tolerance setting screen.
1
Page 42

36
Selection
1
To Reset Numerical Values
Deletes entered digits.
This key is enabled only when entering numerical values.
To change the value after selecting the
units, use the cursor keys to select
the item to change, then enter the new value with the tenkeys.
1_ 10_ 10._ 10.5_ 10.50
(Example: 10.5)
2
Selection
To Reset Numerical Values
Deletes entered digits.
This key is enabled only when entering numerical values.
To change the value after selecting the
units, use the cursor keys to select
the item to change, then enter the new value with the tenkeys.
To Set a Negative Value
Press this key to change the sign,
as needed.
1
+4_ +4._ +4.5_ +4.500%
(Example: 4.5%)
2
Selection
• Internal calculations are performed on floating-point values, and decisions round up any fraction of the
least-significant digit.
• Displayed values of the reference and tolerances are rounded according to the selected range. Internal
calculations use unrounded data, so decisions are based on the entered (setting) values.
• An error message appears if you press ENTER with the positive tolerance set lower than the negative
tolerance.
See: "11.3 Error Displays and Remedies" (p. 181) (ERR:001)
3.7 Judging Measured Values (Comparator Function)
Set the reference value.
2
Pressing an inoperative key during setting sounds a low-pitch beep (when the key beeper is enabled).
Press the units key to accept the setting and move the cursor to the positive tolerance.
Set the positive tolerance.
3
Press the % key to accept the setting and move the cursor to the negative tolerance value.
The negative tolerance is initially set to the same amplitude as the positive tolerance (change as needed).
Set the negative tolerance in the same way (as needed).
4
Accept the settings and return to the Measurement screen.
5
Page 43

37
Upper threshold
Lower threshold
1_ 15_ 150_ 150.0m
(Example: 150 m)
Selection
To Reset Numerical Values
Deletes entered digits.
This key is enabled only when entering numerical values.
To change the value after selecting the
units, use the cursor keys to select
the item to change, then enter the new value with the tenkeys.
1
2
1
2
Selection
(Example: 50 m)
5_ 50_ 50.0m
• Internal calculations are performed on floating-point values, and decisions round up any fraction of the
least-significant digit.
• Displayed values of the reference and tolerances are rounded according to the selected range. Internal
calculations use unrounded data, so decisions are based on the entered (setting) values.
• An error message appears if you press ENTER with the positive tolerance set lower than the negative
tolerance.
See: "11.3 Error Displays and Remedies" (p. 181) (ERR:001)
3.7 Judging Measured Values (Comparator Function)
Decide According to Upper/Lower Thresholds (ABS Mode)
Setting example: Upper threshold 150 m, lower threshold 50 m
To abort the setting process, press . Settings are abandoned and the display returns to the
previous screen.
Open the absolute value threshold setting screen.
1
Set the positive tolerance.
2
Pressing an inoperative key during setting sounds a low-pitch beep (when the key beeper is enabled).
No error message is displayed.
3
Press the units key to accept the setting and move the cursor to the lower threshold value.
Set the negative tolerance in the same way.
3
Press the units key to accept the setting and move the cursor to the upper threshold.
Accept the settings and return to the Measurement screen.
4
Page 44

38
Appears when the measured value is outside of the measurement or display range.
Check for a broken sample component.
The comparator result is Hi when +OvrRng is displayed, and Lo when -OvrRng is displayed.
No external measurement fault signal (ERR
) is output.
Out-of-Range
The resistance between the H
POT
and H
CUR
probe contacts, and between the L
POT
and L
CUR
probe contacts, are measured and compared with specified contact fault values.
An error message appears when the measured value reaches or exceeds the specified contact fault
values.
If this error persists, probe wear or cable failure may be the cause.
If the error is not cleared by shorting the tips of a known-good measurement cable, the instrument
requires repair.
Contact Check Fault
This method monitors the stability of the voltage between H
POT
and L
POT
probe contacts.
An error message appears when voltage instability is detected due to chattering of the probe contacts.
If this error persists, the probes may be degraded due to wear.
C.E. Volt may also be displayed when external noise is strong.
Voltage Level Monitor Fault
See: "Out-of-Range Detection Function" (p. 39)
See: "4.4 Checking for Poor or Improper Contact
(Contact Check Function)" (p. 46)
See: "4.6 Detecting Measurement Voltage Faults
(Voltage Level Monitor Function)" (p. 49)
This display appears after changing measurement settings and before the next measurement is
performed.
- - - - - - -
Display Examples: Display Measurement State and Appearance with Open-Circuit Probe
Display Measurement State
Current Monitor Results
Normal (PASS) Fault (FAIL)
Contact Check Results
Voltage Level Monitor
Results
Normal
(PASS)
Display: Measured Value
COMP indicator: According to the
measured value
Display: +OvrRng/ -OvrRng
COMP indicator: Hi/ Lo
(when connection to the measurement object is broken)
Fault
(FAIL)
Display: C.E. Hi/ C.E. Lo/ C.E. Volt
COMP indicator: No decision
EXT I/O: ERR
signal output
Display: C.E. Hi/ C.E. Lo/ C.E. Volt
COMP indicator: No decision
EXT I/O: ERR signal output
+OvrRng
-OvrRng
C.E. Hi
C.E. Lo
C.E. Volt
Display
Display
Display
This method monitors the regulated measurement current for normal flow through the DUT.
An error is detected mainly when a measurement fault occurs due to an open-circuit DUT or between the H
CUR
and
L
CUR
probe's poor contacts.
The error display depends on the contact check and voltage level monitor states (see the table below).
Current Monitor Fault
See: "Current Monito r Function" (p. 39)
The measurement fault display differs according to detection order
and settings.
3.8 Confirming Faulty Measurements
3.8 Confirming Faulty Measurements
When a measurement is not performed correctly, a measurement fault indicator appears and a
measurement fault signal is output at the ERR
detection).
The instrument detects measurement faults by the following four methods.
pin of the EXT I/O connector (except for out-of-range
Page 45

3.8 Confirming Faulty Measurements
NoNoNoNoNo
No
No
Measurement Fault Detection Order
Measurement Fault Detection Display EXT I/O signal
39
Probe Short Circuit
Hi Wiring Contact Error
Lo Wiring Contact Error
Voltage Level Monitor Error
Constant-Current Error
Below Lower Limit
Above Upper Limit
No Measurement Data
Yes
Yes
Yes
Yes
Yes
Yes
Yes
ERR: 021
C.E. Hi
C.E. Lo
C.E. Volt
+OvrRng
-OvrRng
+OvrRng
- - - - - - - -
PRB_SHORT output,
ERR output
ERR output,
CE_HI output
ERR output,
output
CE_LO
ERR output
HI output
LO output
HI output
Measurement fault detection
proceeds in the order shown at
the left, ending with display of
the first detected error.
Corresponding measurement
fault signals are also output at
the EXT I/O connector.
3
Out-of-Range Detection Function
Examples of Out-of-Range Faults
Out-of-Range Detection Measurement Example
The measured value is outside of the
measurement range.
The relative tolerance (%) display of
the measured value exceeds the display range (999.999%).
The zero-adjusted value is outside of
the display range.
While measuring, input voltage exceed the A/D converter input range.
Attempting to measure 13 k with the 10 k range selected
Measuring 500 (+2400%) with a reference value of 20
In the 1 range with 0.5 zero-adjustment in effect, measuring 0.1 provides
a zero-adjusted value of -0.4 , which is outside of the display range.
Measuring a large resistance value in an electrically noisy environment
Current Monitor Function
The instrument supplies constant measurement current through the DUT via the H
current monitor fault occurs if constant current cannot be attained. If the contact check and voltage level monitor results are normal, the out-of-range and comparator result displays indicate “Hi”.
Example of Current Monitor Fault
• Broken DUT (open work)
•H
•H
CUR
CUR
or L
or L
probe contact fault
CUR
cable break
CUR
CUR
and L
probes. A
CUR
Page 46

40
3.8 Confirming Faulty Measurements
Page 47

4.1 Making Range-Specific Measurement Settings
The Basic Settings screen appears.
The Measurement Settings Screen
appears.
[MEAS SETTINGS]
1
Selection
2
1
2
Selection
Customizing Measurement
Settings Chapter 4
(set as needed)
Change measurement settings as appropriate for your application.
Refer to "Detailed Settings Screens" (p. 19) for the available settings.
4.1 Making Range-Specific Measurement
Settings
41
4
These settings can be made for each range (except for the DELAY1 setting).
Open the Basic Settings screen.
1
Open the Measurement Settings Screen.
2
Select the range to use.
3
Set the items as needed.
4
Page 48

42
The DELAY1 setting is common to all ranges. The default setting is 0 ms (corresponding to trigger signal input at the same
time as probe contacts become stable). Setting DELAY1 affects
measurements in all ranges.
Set DELAY1
Adjust this setting to allow for
probe contact mechanical stabilization.
Set DELAY2 to the time needed for stabilization after measurement current is applied, such as may be required for inductive
components. The setting affects only the selected range. The
default setting is 0 ms (corresponding to resistance measurement of non-inductive components).
Set DELAY2
Adjust this setting to allow for stabilization of the measurement
sample.
DELAY1 and DELAY2 Timing Chart
* Internal delay is provided to suit purely resistive (non-reactive) DUTs,
and is different for each measurement range.
Acquisition
Stable Contact
Internal
Delay*
Probe Contact
Condition
Start
TRIG
Measurement
Current
Acquisition of
Measured Value
End of Measurement
Signal
EOM
4.2 Setting Pre-Measurement Delay
4.2 Setting Pre-Measurement Delay
This setting specifies the delay between trigger signal input and the start of measurement.
Adjust this setting to delay measurement until the measured value has time to st abilize, so that even
if the sample is connected after triggering, measurement starts only after the specified delay. The
delay can be set by two methods, as follows.
Page 49

43
The Basic Settings screen appears.
The Measurement Settings Screen
appears.
[MEAS SETTINGS]
1
2
Selection
1
2
Setting range: 0.0 ms (default) to 100.0 ms
DELAY1 is common to all ranges, while
DELAY2 can be set for each range independently (p. 41).
Tenkeys
3
Selection
The confirmation screen appears.
Return to the setting screen.
Save setting and return to
previous screen.
Discard setting and return to
previous screen.
4.2 Setting Pre-Measurement Delay
Determining the Delay Time
Set the delay so that inductance does not affect measurements.
To fine tune the delay, begin with a longer delay than necessary, then gradually shorten it while watching the
measured value.
Open the Basic Settings screen.
1
Open the Measurement Settings Screen.
2
Set DELAY1 or DELAY2.
3
Return to the Measurement screen.
4
4
Page 50

44
The Basic Settings screen appears.
The Measurement Settings Screen
appears.
[MEAS SETTINGS]
(The settings for the current measurement range are displayed.)
1
Selection
2
4.3 Setting the Measurement Integration Time Option
4.3 Setting the Measurement Integration Time
Option
The integration time can be optionally set for each range by selecting FAST, MED, or SLOW measurement speed. Integration time can be set in ms or PLC* units.
* PLC = Power Line Cycle, where one PLC is the period of the power line waveform. At 50 Hz, one PLC = 1/50th of a sec-
ond, and at 60 Hz, one PLC = 1/60th of a second.
PLC setting units are useful where measurements may be affected by power line noise (high- or low-resistance measurements)
Default Settings
LOW POWER: OFF (p. 28) *1 LOW POWER: ON (p. 28) *1
Range
100m
1000m 0.3 ms 2.5 ms 1PLC
10 0.3 ms 2.5 ms 1PLC
100 0.3 ms 3.0 ms 1PLC OFF 0.3 ms 2.5 ms 1PLC
1000 0.3 ms 3.0 ms 1PLC OFF 0.3 ms 2.5 ms 1PLC
10k 0.3 ms 3.0 ms 1PLC OFF
100k 0.5 ms 3.0 ms 1PLC OFF
1000k 1.5 ms 5.0 ms 1PLC OFF
10M 2.5 ms 1PLC 1PLC OFF
100M 1PLC 2PLC 4PLC OFF
Integration Time [INT]
FAST MED SLOW FAST MED SLOW
0.5 ms 5.0 ms 1PLC ON
OVC
ON
ON
*2
*2
*2
Integration Time [INT]
0.5 ms 5.0 ms 1PLC
0.5 ms 5.0 ms 1PLC
OVC
ON
ON
ON
ON
*2
*2
*2
*2
*1. Low Power = Low-Power Resistance Measurement (p. 28)
*2. Two measurements are made within the above integration times.
Open the Basic Settings screen.
1
Open the Measurement Settings Screen.
2
Page 51

Select the integration setting units.
Selection
1
Set in units of time
Set in units of power line cycles
2
The setting is specific to the selected range
(p. 41)
Selection
1
Setting range:
• When setting in ms units: 0.1ms to 100.0ms
• When setting power-line-cycle units: 1 to 6PLC (60 Hz),
1 to 5PLC (50 Hz)
2
3
The confirmation screen appears.
Return to the setting screen.
Save setting and return to
previous screen.
Discard setting and return to
previous screen.
3
Select the integration time.
4
45
4.3 Setting the Measurement Integration Time Option
4
Return to the Measurement screen.
5
• The instruments accuracy specifications are applicable only with the default integration
times. Investigate your measurement requirements carefully before changing the integration time.
• When the ef fects of power line noise can be ignored, the integration time can be set longer
than the default to reduce scattering of measured values. On the other hand, if the inte gr ation time is too short, scattering increases. For high-or low-resista nce and low-po wer resistance measurements that are easily affected by power line noise, we suggest setting
according to the power line period (PLC units).
Page 52

46
The Basic Settings screen appears.
The Measurement Settings Screen
appears.
[MEAS SETTINGS]
1
Selection
2
Selection
1
2
Disables the function (go to step 5)
Enables the function (default)
The setting is specific to the selected range
(p. 41)
Selection
1
2
50, 100, 150, 200 (default), 300,
400, 500
A contact fault occurs when a measured
value exceeds the threshold setting.
The confirmation screen appears.
Return to the setting screen.
Save setting and return to
previous screen.
Discard setting and return to
previous screen.
4.4 Checking for Poor or Improper Contact (Contact Check Function)
4.4 Checking for Poor or Improper Contact
(Contact Check Function)
This function detects poor contact between the probes and DUT, and broken measurement cables.
The instrument continually monitors the resistance between the H
and L
L
CUR
When the resistance is outside of the specified value, a contact check fault occurs and the C.E. Hi
or C.E. Lo error message appears. No comp arator decision is applied to the me asured value. When
these error messages appear, check the probe contacts, and check for broken measurement
cables. If the error is not cleared by shorting the tips of a known-good measurement cable, the
instrument requires repair.
probes from the start of integration (including response time) and while measuring.
POT
CUR
and H
probes and the
POT
• During low-resistance measurement, poor contact of the H
range measurement.
• When contact checking is disabled, measured values may be displayed even when a probe is not contacting the DUT.
Open the Basic Settings screen.
1
Open the Measurement Settings Screen.
2
Enable the Contact Check function.
3
CUR
or L
probe may be detected as an out-of-
CUR
Select the contact check fault threshold resistance.
4
Return to the Measurement screen.
5
Page 53

47
OFF setting
ON setting
PULSE setting
* Internal delay is different for
each range.
Measurement
Measuring
Start
TRIG
Internal
delay *
Internal
delay *
Internal
delay *
Approx.
100
s
Measuring
Measuring
Start
TRIG
Start
TRIG
Measurement
Measurement
Contact Improver current: Off
Contact Improver current: On
Contact Improver current: Pulse
Probe Contact
Condition
Probe Contact
Condition
Probe Contact
Condition
Stable Contact
Stable Contact
Stable Contact
Timing Chart
(Contact Improver Function)
DELAY 2
DELAY 1
DELAY 2
DELAY 1
DELAY 2DELAY 1
4.5 Improving Probe Contact (Contact Improver Function)
4.5 Improving Probe Contact (Contact Improver
Function)
Probe contacts can be improved by applying current from the POT to the CUR probes before measuring.
The Contact Improver function applies voltage to the sample. Be careful when measuring
samples with characteristics that may be affected.
The current used for the Contact Improver functions can be selected as follows.
17 mA, 25 mA, 35 mA (default), 50 mA
Higher current provides more effect ive contact improvement, but at the cost of faster probe deterioration.
Contact Improver current can be set to be disabled (OFF), enabled (ON), or PULSE.
The PULSE setting applies the contact improvement current for about 100 µs immediately before meas urement. The PULSE setting is usefull to decrease Joule heating if the DUT is susceptible to its current.
100 m-range to 100 k-range 1 M to 100 M-range
DUT current * 2mA max. 60 mA max.
DUT voltage 20 V max. 15 V max.
*:It takes several microseconds for the DUT current to reach the steady-state value. Until the steady-state
value is reached, a transient current that is approximately equal to the contact improvement current setting
(default setting: 35 mA) will flow.
*1 Steady state value.
A rush current of approximately
100 mA flows for 100µs, when a
probe came in contact with DUT.
4
Page 54

48
The Basic Settings screen appears.
The Measurement Settings Screen
appears.
[MEAS SETTINGS]
1
Selection
2
Selection
2
Disable probe contact improvement
(go to step 4).
Enable probe contact improvement.
Apply contact improvement current for
about 100
µs immediately before mea-
surement.
1
The setting is specific to the selected range(p. 41)
Selection
1
2
17mA, 25mA, 35mA (default), 50mA
The confirmation screen appears.
Return to the setting screen.
Save setting and return to
previous screen.
Discard setting and return to
previous screen.
4.5 Improving Probe Contact (Contact Improver Function)
For ranges between 1000 k and 100 M, the [PULSE] setting is enabled by default.
Before measuring in the ranges from 1000 k to 100 M with the Contact Improver function set to [ON], verify
that measurements are not biased.
Open the Basic Settings screen.
1
Open the Measurement Settings Screen.
2
Set the Contact Improver current timing to disabled (OFF), enabled (ON), or PULSE.
3
(When selecting ON or PULSE)
Set the current limit value.
Return to the Measurement screen.
4
Page 55

49
The Basic Settings screen appears.
The Measurement Settings Screen
appears.
[MEAS SETTINGS]
1
Selection
2
Selection
1
2
Disables the function (go to step 5)
Enables the function (default)
The setting is specific to the selected range (p. 41)
Selection
1
2
Loose *
Normal*
Severe
*. Default setting: Loose is
the default for the 100 M
range, and Normal for all
other ranges.
The confirmation screen appears.
Return to the setting screen.
Save setting and return to
previous screen.
Discard setting and return to
previous screen.
4.6 Detecting Measurement Voltage Faults (Voltage Level Monitor Function)
4.6 Detecting Measurement Voltage Faults
(Voltage Level Monitor Function)
When a measurement voltage fault occurs due to probe chattering, the C.E. Volt error message
appears on the measurement screen and an
The C.E. Volt error may also appear when external noise is strong.
Check the following if errors occur frequently:
• Check for probe deterioration.
• Provide additional noise suppression. "Appendix 3 Unstable Measurement Values" (p. A3)
• Set the voltage level monitor to Loose, or OFF (disable).
Open the Basic Settings screen.
1
ERR signal is output.
4
Open the Measurement Settings Screen.
2
Enable or disable the function.
3
(When enabled (ON selected))
4
Select the voltage level monitor threshold.
Return to the Measurement screen.
5
Page 56

50
The Basic Settings screen appears.
The Measurement Settings Screen
appears.
[MEAS SETTINGS]
1
Selection
2
Selection
1
2
Measurement current is applied while
awaiting trigger.
Measurement current is applied only
while measuring (default).
The setting is specific to the selected range (p. 41)
The confirmation screen appears.
Return to the setting screen.
Save setting and return to
previous screen.
Discard setting and return to
previous screen.
4.7 Applying Current Only When Measuring (Current Mode Setting)
4.7 Applying Current Only When Measuring
(Current Mode Setting)
When the Contact Improver function is set to Pulse or disabled (CONT IMP: PULSE or OFF) and
measurement current is set for pulse output, open-circuit voltage when not measuring does not
exceed 20 mV.
See: "4.5 Improving Probe Contact (Contact Improver Function)" (p. 47)
When the Contact Improver function is enabled (CONT IMP: PULSE or ON setting), the current mode setting
is ignored even if set to contin u ous (CURRENT MODE: CONT setting). The Contact Improver function forces
pulse operation with measurement current applied only during measurement.
Open the Basic Settings screen.
1
Open the Measurement Settings Screen.
2
Select whether to apply current when not measuring.
3
To apply measurement current continuously (CONT setting) even when waiting for a trigger, confirm that
the Contact Improver function is disabled (CONT IMP: OFF, (p. 47)).
Return to the Measurement screen.
4
Page 57

4.8 Test for Short-Circuited Probe (Probe Short-Circuit Detection Function)
Foreign Object
POT
CUR
DUT Electrode
DUT
Timin g Chart
(Probe Short-Circuit Detection)
Probe short-circuit
PRB_SHORT
Comparator
Hi, IN, Lo
End of Measurement
EOM
Measurement
Start
TRIG
Contact
Transport
Measurement
stage
Available
Short-Circuit
Detection
Transport
DUT1 contact
DUT2 contactTransport
Probe short-circuit
DUT1
measurement
DUT2
measurement
Short-Circuit
No Decision
Detection timing setting
4.8 Test for Short-Circuited Probe
(Probe Short-Circuit Detection Function)
Four-terminal measurements are not possible when a conductive foreign object is present between the POT and CUR probe tips. To
detect short-circuited probes, this function measures the resistance
between the CUR and POT terminals after a specific time (initially 5
ms) following the end of measurement. Probe short-circuit detection
is disabled by default.
When a probe short-circuit is detected, an error message appears on
the measurement screen, and the
output. (
Short-circuit detection can also be controlled by asserting the active-low PRB_CHECK EXT I/O signal.
Asserting the PRB_CHECK
end of measurement (p. 85).
ERR:021 Probe short error)
signal while measuring causes short-circuit detection to be performed after the
PRB_SHORT and ERR signals are
51
4
About Probe Short-Circuit Detection
• If probes are connected to the DUT durin g probe shor t-circuit detection, the sho rt circuit is detected. Ensure
that the probes have sufficient time to separate from the measurement object.
• Probe short-circuit detection occurs within about 1 ms.
• The threshold for probe short-circuit dete ctio n is fixed at 500 , so if the resistance between CUR and POT
probes is larger, detection is not possible.
• Even while the probe short-circuit detection function is set to be disabled, short-circuit detection is performed when the
EXT I/O PRB_CHECK signal is asserted.
• When the internal trigger [TRG: INT] source is selected, short-circuit detection is not performed after the end of mea-
surement. However, short-circuit detection can still be executed by asserting the PRB_CHECK
signal.
Page 58

52
The Basic Settings screen appears.
The System screen appears.
[SYSTEM]
1
Selection
2
Selection
1
2
Disables the function (default)
(go to step 5)
Enables the function
Selection
1
2
Setting range: 1 to 100 ms, 5 ms (default)
Short-circuit detection is delayed for the specified time following the end of measurement.
3
The confirmation screen appears.
Return to the setting screen.
Save setting and return to
previous screen.
Discard setting and return to
previous screen.
4.8 Test for Short-Circuited Probe (Probe Short-Circuit Detection Function)
Probe Short-Circuit Detection Enable/Disable
Open the Basic Settings screen.
1
Open the System screen.
2
Enable or disable the function.
3
(When enabled (ON selected))
4
Set the probe detection timing.
Return to the Measurement screen.
5
Page 59

4.9 Comparing the Measurement Settings of Two Instruments (Settings Monitor Function)
1st Stage
2nd Stage
Transport Direction
ABCDE
Automatic
Comparison
The SET MONITOR connectors are identical
to RS-232C connectors. Be careful to avoid
connecting the wrong connectors.
The Basic Settings screen appears.
The System screen appears.
[SYSTEM]
1
Selection
2
Selection
1
2
Disables the function (default)
Enables the function
4.9 Comparing the Measurement Settings of
Two Instruments
(Settings Monitor Function)
This function automatically compares the settings of two
instruments to determine whether they are the same.
Only those measurement settings affecting the comparator and speed are compared. When the settings differ,
an alarm notification appears and subsequent
nal input is prevented from starting measurement.
When the settings of two instruments match, TRIG input is
accepted and measurement starts. However, if the range
defined by the upper and lower thresholds of the second
stage is broader than that of t he f irst st age, me asur ement still
starts despite the different threshold settings.
TRIG sig-
53
4
Connect the two instruments’ SET MONITOR connectors together using a Hioki 9637
1
RS-232C cable.
Open the Basic Settings screen.
2
Open the System screen.
3
Enable the function on both instruments.
4
Page 60

54
Selection
1
2
Selects this instrument as the 1st stage
Selects this instrument as the 2nd stage
3
Enter the difference in tolerance (%) to be allowed at the 2nd stage from the tolerance range set for the 1st stage.
Setting range: 0.000 to 9.999%
4
Example: If the 1st stage is set to measure
12
±0.800%, and the 2nd is to measure
12
±1.000%, enter the difference in toler-
ance of 0.300%.
Selection
1
2
Selects this instrument as the 1st stage
Selects this instrument as the 2nd stage
The confirmation screen appears.
Return to the setting screen.
Save setting and return to
previous screen.
Discard setting and return to
previous screen.
1st stage
2nd stage
UPP [%]
REF% setting ABS setting
REF [
]
LOW [%]
Tolerance
range [%]
UPP []
LOW [
]
2nd upper limit - 1st upper limit
1st upper limit
Tolerance range [%] > 2nd upper limit [%] - 1st upper limit [%]
Tolerance
range[%]
1st lower limit - 2nd lower limit
1st lower limit
(upper limit)
(
lower limit)
Permissible tolerance is calculated using floating-point values, so the setting must be at least 0.001% la rger
than the difference between 2
nd
and 1st stage ranges. Set the upper and lower comparator thresholds according to the following conditions:
1
st
stage upper threshold < 2nd stage upper threshold
1
st
stage lower threshold > 2nd stage lower threshold
(upper limit)
(
lower limit)
1st stage
2nd stage
Tolerance
range [%]
>
Tolerance
range[%]
>
x 100
x 100
4.9 Comparing the Measurement Settings of Two Instruments (Settings Monitor Function)
Select the instrument to serve as the 1st stage, and set its tolerance range.
5
Set the instrument to serve as the 2nd stage (another RM3542).
6
Return to the Measurement screen.
7
Tolerance Range Setting Conditions
Page 61

4.9 Comparing the Measurement Settings of Two Instruments (Settings Monitor Function)
1st Stage
TRIG Input Accepted
TRIG Input Inhibited
TRIG
Input Accepted
When changing the reference value
Change the reference value to match
the 1
st
stage
The error message appears when the
settings do not match.
2nd Stage
1st Stage
2nd Stage
1st Stage
2nd Stage
SET MONITOR: ON 1st 0.300%
(on the System screen)
SET MONITOR: ON 2nd
(on the System screen)
When an error is displayed
ERR:003
Setting monitor error. (COMP)
Comparator settings do not match. Please check.
ERR:004
Setting monitor error. (SPEED)
Measurement speed settings do not match. Please check.
Practical Example
55
4
Page 62

56
Retry
Chatter
Probe Contact
Condition
Start
TRIG
Contact
Improver
Measurement
Current
Contact Check
End of Measurement
EOM
The Basic Settings screen appears.
The System screen appears.
[SYSTEM]
1
Selection
2
Selection
1
2
Retry disabled (go to step 5)
Retry enabled (default)
Selection
1
2
Setting range: 1 to 50 ms (default: 50 ms)
3
The confirmation screen appears.
Return to the setting screen.
Save setting and return to
previous screen.
Discard setting and return to
previous screen.
4.10 Retrying Measurement After a Fault (Retry Function)
4.10 Retrying Measurement After a Fault
(Retry Function)
The Retry function causes measurement to be
automatically retried when a measurement fault
occurs due to probe chatter.
During Retry, all measurement operations including Contact Improvement and DELAY2 (but excluding DELAY1)
are restarted.
If a measurement fault persists after the specified continuous retry interval (e.g., if the DUT is not connected),
retrying is aborted and the
Retry is enabled, the maximum time to end-of-measurement occurs when recovering from a measurement fault
immediately before the retry interval expires, which
approaches the sum of the retry interval setting plus normal measurement time. Decreasing test throughput may
indicate probe maintenance is required.
EOM signal is output. When
Open the Basic Settings screen.
1
Open the System screen.
2
Select whether to enable or disable Retry.
3
(When enabled (ON selected))
4
Set the continuous retry interval.
5
Return to the Measurement screen.
Page 63

57
RpRN–
2
----------------------
4.11 Maintaining Measurement Precision (Self-Calibration)
4.11 Maintaining Measurement Precision
(Self-Calibration)
To maintain measurement precision, the instrument self-calibrates every ten minutes to compensate
for internal circuit offset voltage and gain drift. This function cannot be disabled.
During self-calibration, the subsequent measurement is delayed for about 6PLC + 10 ms (PLC =
Power Line Cycles) for internal circuit compensation .
Self-Calibration Timing
Within 130 ms at 50 Hz, or 110 ms at 60 Hz
• When the timing of self-calibration overlaps with a measurement, self-calibration is postponed until the end
of measurement.
• When a trigger signal is applied during self-calibr ation, th e start of the triggered measurement is postponed
until self-calibration is finished.
• Self-calibration executes automatically after changing comparator or measurement speed settings.
• During self-calibration, measureme nt curr en t an d th e Con tact Impr ov er curr e nt ar e inh ib ite d.
4.12 Compensating for Thermal EMF Offset (Offset Voltage Compensation - OVC)
This function automatically compensates for offset voltage resulting from thermal emf or internal
instrument bias. (OVC: Offset Voltage Compensation)
See: "Appendix 2 Effect of Thermal emf" (p. A2)
The following value is known to be a true resistance value from RP (>0), the value measured with
current flowing in the positive direction, and R
negative direction.
(<0), the value measured with current flowing in the
N
4
Offset voltage compensation is automatically enabled in the following conditions, and cannot be modified or
disabled:
• When a range from 100 m to 10 is selected.
• When low-power resistance measurement is enabled (LOW POWER: ON).
When the test object is inductive, some delay (DELAY2) is required (p. 42) to allow adequate current flow
before starting measurement.
Page 64

58
4.12 Compensating for Thermal EMF Offset (Offset Voltage Compensation - OVC)
Page 65

5.1 Disabling and Enabling Key Operations
Key operations other than comparator settings (REF%, ABS, units and tenkeys)
and F1 [UNLOCK] keys are disabled.
To disable key operations: select [MENU]
[M.LOCK] is displayed when returning to the measurement screen.
Disabling All Except Comparator Settings
Only comparator
settings are enabled.
All key operations except F1 [UNLOCK] are disabled.
To disable key operations: select [FULL]
[F.LOCK] is displayed when returning to the measurement screen.
Disabling All Key Operations Including Comparator
Settings
Key operations to
change settings are
disabled (although keylock can be canceled).
Asserting (Low) the EXT I/O KEY_LOCK signal disables all panel keys, including
F1 [UNLOCK] and F1 [LOCAL] (disables remote control) (p. 85).
To disable the key-lock function and re-enable the keys, de-assert (High) the
KEY_LOCK
signal.
Disabling All Panel Keys
All key operations are
disabled.
The Basic Settings screen appears.
1
Selection
2
Key operations enabled (default)
Disable all except key-lock cancel
Disable all except key-lock cancel and
comparator setting change
[UNLOCK] is displayed only
when key-lock is enabled by
front panel key operations.
System Settings Chapter 5
5.1 Disabling and Enabling Key Operations
Disabling Key Operations (Key-Lock Function)
Activate the key-lock function to disable the instrument’s front panel key operations.
Three key-lock levels are available to suit specific purposes.
59
5
1
2
3
Open the Basic Settings screen.
Enable or disable key operations.
Return to the Measurement screen.
Page 66

60
5.1 Disabling and Enabling Key Operations
Re-Enabling Key Operations (Key-Lock Cancel)
Key-lock can be canceled only when [UNLOCK] is displayed.
Press and hold F1 [UNLOCK] for one second.
If key operations are disabled by the KEY_LOCK
keys.
signal, de-assert (High) the signal to unlock the
Page 67

5.2 Setting the Comparator Decision and Key Beepers
The Basic Settings screen appears.
The System screen appears.
[SYSTEM]
1
Selection
2
Selection
1
2
Disables the beeper
Enables the beeper (default)
The confirmation screen appears.
Return to the setting screen.
Save setting and return to
previous screen.
Discard setting and return to
previous screen.
5.2 Setting the Comparator Decision and Key
Beepers
Enabling or Disabling the Key Beeper
The key beeper sound can be enabled and disabled.
The key beeper is enabled (ON) by default.
Open the Basic Settings screen.
1
61
5
Open the System screen.
2
Select whether to enable or disable the key beeper.
3
Return to the Measurement screen.
4
Page 68

62
The Basic Settings screen appears.
The System screen appears.
[SYSTEM]
1
Selection
2
Selection
1
2
Disables the beeper (default)
Enables the beeper
Selection
1
2
IN (beep when within range)
HI/LO (beep when out of range)
LOW (beep when below lower threshold)
HIGH (beep when above upper threshold)
The confirmation screen appears.
Return to the setting screen.
Save setting and return to
previous screen.
Discard setting and return to
previous screen.
5.2 Setting the Comparator Decision and Key Beepers
Setting the Comparator Decision (“JUDGE”) Beeper
The comparator decision beeper can be enabled and disabled.
The decision beeper is disabled (OFF) by default.
Open the Basic Settings screen.
1
Open the System screen.
2
Select whether to enable or disable the decision beeper.
3
(When enabled (ON selected))
4
Select the decision beep conditions.
Return to the Measurement screen.
5
Page 69

63
The Basic Settings screen appears.
The System screen appears.
[SYSTEM]
1
Selection
2
Selection
1
2
Automatically detect local line frequency
(default)
When the line frequency is 50 Hz
When the line frequency is 60 Hz
The confirmation screen appears.
Return to the setting screen.
Save setting and return to
previous screen.
Discard setting and return to
previous screen.
5.3 Power Line Frequency Manual Setting
5.3 Power Line Frequency Manual Setting
For proper electrical noise suppression, the instrument needs to be set to match the power line frequency. With the default setting (AUTO), the instrument attempts to automatically detect the line frequency, but manual setting is also available.
Unless the line frequency is set correctly, measured values may be unstable.
An error message appears if line noise is high enough to prevent correct frequency detection
(ERR:041(p. 181)). In that case, set the instrument’s line frequency manually.
When the AUTO setting is selected, the line frequency is automatically set to 50 or 60 Hz when the instrument
is turned on or reset.
However, automatic detection is not available when the line frequency changes after turning power on or
resetting.
If the actual line frequency deviates from 50 or 60 Hz, select the closest frequency.
Examples:
If the actual line frequency is 50.8 Hz, select the 50 Hz setting.
If the actual line frequency is 59.3 Hz, select the 60 Hz setting.
Open the Basic Settings screen.
1
Open the System screen.
2
Select the line frequency being used.
3
5
Return to the Measurement screen.
4
Page 70

64
The Basic Settings screen appears.
The System screen appears.
[SYSTEM]
1
Selection
2
Selection
1
2
Enter the last two digits of the year, and the month, day, hour, minutes and
seconds in that order (the cursor moves automatically).
Enter two digits for all values (e.g., 09).
Clock settings cannot be canceled.
5.4 Setting the Clock
5.4 Setting the Clock
To record and print the correct time when using statistical calculations (p. 74), the clock needs to be
set correctly. The time of printing is also output when printing statistical calculation results.
Open the Basic Settings screen.
1
Open the System screen.
2
Set the date and time.
3
Return to the Measurement screen.
4
Page 71

65
The Basic Settings screen appears.
The System screen appears.
[SYSTEM]
1
Selection
2
Selection
1
2
0 to 100%, 5% step
(default: 50%)
The confirmation screen appears.
Return to the setting screen.
Save setting and return to
previous screen.
Discard setting and return to
previous screen.
5.5 Adjusting Screen Contrast
5.5 Adjusting Screen Contrast
The screen may become hard to see when ambient temperature changes. In this case, adjust the
contrast.
Open the Basic Settings screen.
1
Open the System screen.
2
5
Adjust the contrast.
3
Return to the Measurement screen.
4
Page 72

66
The Basic Settings screen appears.
The System screen appears.
[SYSTEM]
1
Selection
2
Selection
1
2
0 to 100%, 5% step, (default: 80%)
The confirmation screen appears.
Return to the setting screen.
Save setting and return to
previous screen.
Discard setting and return to
previous screen.
5.6 Adjusting the Backlight
5.6 Adjusting the Backlight
Adjust backlight brightness to suit ambient illumination.
• When external (EXT) triggering is selected, backlight brightness is automatically reduced after non-operation for one minute.
• Be aware that the display may be hard to see when brightness is set too low (near 0%).
Open the Basic Settings screen.
1
Open the System screen.
2
Adjust the backlight.
3
Return to the Measurement screen.
4
Page 73

67
The Basic Settings screen appears.
The System screen appears.
[SYSTEM]
1
Selection
2
Selection
1
2
Returns all settings to their factory
defaults
Cancel the operation
Execute
5.7 Initializing (Reset)
5.7 Initializing (Reset)
The instrument can be reset by three methods.
• System reset from the System screen: Returns all settings (except the clock) to factory defaults.
• Turn the instrument on while simultaneously holding the REF% and ABS keys: Returns all settings (except
the clock) to factory defaults.
• Reset by remote control command: returns all settings (except communication and clock settings) to their
factory defaults.
RST command (non-backup, (p. 123))
:SYSTem:RESet command (p. 137)
This procedure describes system reset from the System screen.
Open the Basic Settings screen.
1
5
Open the System screen.
2
Select RESET.
3
Select whether to cancel or proceed to execute system reset.
4
The Measurement screen is displayed when system reset finishes.
Page 74

68
5.7 Initializing (Reset)
Default Settings
Display Setting value Default Settings Setting Description
INT/ EXT/ MANU EXT Trigger source selection (p. 30)
/
[Low Power: Off] 100m/
1000m/ 10/ 100/ 1000/
10k/ 100k/ 1000k/ 10M/
100M
[Low Power: On] 1000m/ 10/
100/ 1000
SLOW/ MED/ FAST FAST Measurement speed (p. 29)
OFF/ ON OFF Zero adjustment (p. 32)
OFF/ ON ON Comparator function(p. 34)
OFF/ FULL / MENU OFF Key-Lock function (p. 59)
MEAS/ DATA/ SYSTEM (Miscellaneous settings)
0 to 100 ms (all ranges) 0 ms Probe delay setting (p. 42)
0 to 100 ms 0 ms DUT response setting (p. 42)
0.1 ms to 100 ms
1PLC to 6PLC (60 Hz)
1PLC to 5PLC (50 Hz)
OFF/ ON
50 / 100 / 150 / 200 / 300
/ 400 / 500
OFF/ ON/ PULSE
17 mA/ 25 mA/ 35 mA/ 50 mA
OFF/ ON
LOOSE/ NORMAL/ SEVERE
CONT/ PULSE PULSE Current mode setting (p. 50)
OFF/ ON OFF Auto-Memory function (p. 71)
OFF/ ON OFF
OFF/ ON OFF Data output function (p. 77)
OFF/ ON,
1st/ 2nd, 0.000% to 9.999%
OFF/ ON, 0 to 100 ms OFF, 5 ms Probe short-circuit detection (p. 51)
OFF/ ON, 1 to 50 ms ON, 50 ms Retry function (p. 56)
OFF EDGE/ ON EDGE ON EDGE Start Logic Setting (p. 94)
PULSE/ HOLD
1 to 100 ms
GP-IB/ RS232C/ PRINT
OFF/ ON OFF
OFF/ ON
IN/ HI/LO/ LOW/ HIGH
OFF/ ON ON Key beeper (p. 59)
AUTO/ 50 Hz/ 60 Hz AUTO Line frequency (detection) (p. 63)
0 to 100 50 Screen contrast adjustment (p. 65)
0 to 100 80 Screen backlight adjustment (p. 66)
- - Reset (p. 67)
- - Calibration (p. A13)
100 M Range selection (p. 31)
Depends on measurement range Integration time (p. 44)
ON, 200 Contact-check (p. 46)
ON, 35 mA (range from 100 m to
100 k)
PULSE, 35 mA (range from1000
k to 100 M)
ON, NORMAL (LOOSE when
100 Range)
OFF, 1st, 0.000% Settings Monitor function (p. 53)
PULSE, 5 ms
RS232C, 9600bps
GP-IB, ADR01, LF
OFF, HI/LO Comparator decision beeper (p. 61)
Contact Improvement (p. 47)
Voltage level monitor (p. 49)
Statistical calculation function
(p. 74)
End-of-measurement pulse width
(p. 93)
Interface setting (p. 101)
Low-Power Resistance Measure-
ment (p. 28)
Clock setting (p. 64)
MENU
MISC
MEAS
DATA
SYSTEM
TRG
RANGE
SPEED
0ADJ
COMP
LOCK
MISC
DELAY1
DELAY2
INT (FAST)
INT (MED)
INT (SLOW)
CONT CHECK
CONT IMP
VOLT
MONITOR
CURRENT
MODE
AUTO MEMORY
STATISTICS
DATA OUT
SET MONITOR
PROBE
CHECK
RETRY
TRIG EDGE
EOM
INTERFACE
LOW POWER
JUDGE BEEP
KEY BEEP
CLOCK
LINE FREQ
CONTRAST
BACK LIGHT
RESET
ADJUST
Page 75

69
Store up to 30,000 measured values using the EXT I/O TRIG
signal or by pressing F4 [MANU] on the Basic Settings screen.
Data Memory Function (p. 70)
Store measured values at specific times.
This is convenient for batch exporting
data to a controller while switching
reels.
Measured values are automatically stored as they become stable.
When the specified number of data points (up to 99) is acquired,
the beeper sounds and auto-storing halts.
Auto-Memory Function (p. 71)
Store data after measured value
has stabilized.
This is convenient for sample inspection after printing (vapor deposition)
resistors on a board.
Minimizes transfer time by eliminating the need for transmit requests from the remote controller. (RS-232C interface only)
Data Output Function (p. 77)
Automatically output (export)
measurements at the end of
measurement.
Stored measurements are lost when the instrument is turned off.
Therefore, be sure to print out or export important data to a PC.
Storing and
Exporting Data Chapter 6
Measured values can be stored or automatically exported, according to application. Stored data can
be output to a printer, RS-232C or GP-IB. Also, statistical calculations can be applied to internally
stored data.
6
Page 76

70
6.1 Storing Data at Specific Times (Data Memory Function)
6.1 Storing Data at Specific Times
(Data Memory Function)
Measured values are stored in the instrument’s internal memory according to the following timings.
(up to 30,000 points)
• Every time a measurement is performed by external (EXT) triggering
• When a trigger is applied during internally (INT) triggered measurement
The following three storage methods are available:
• Store upon receiving an EXT I/O TRIG
• Store upon receiving a
• Store by pressing the F4 [MANU] key on the [MENU] – [TRG] setting screen.
• This function can only be enabled by remote control. The data memory function should be enabled by
remote control beforehand. This setting is not available from the front panel.
• Stored memory dat a cannot be viewed on the instrument’ s scr een. Use remote control commands to export
stored data.
TRG command (p. 126)
signal (p. 85)
Data Memory Function Operating Procedure
Enable data memory mode.
1
Send this remote command to enable the data memory function:
:MEMory:MODE MEMory (p. 142)
Store measured values.
2
Execute external trigger measurement, or apply a trigger during internally triggered measurement.
Export the stored data.
3
Send this remote command to export the measured values stored in the instrument:
:MEMory:DATA? (p. 143)
Clear measurement data from instrument memory.
4
Send this remote command to erase the data from instrument memory:
:MEMory:CLEar (p. 142)
Stored data is automatically erased at the following times:
• when the memory function setting (including auto-mem-
ory) is changed (p. 142)
• when the range is changed (p. 31)
• when changing comparator settings (p. 34)
• when printing the statistical calculations (p. 82)
• when the DUT is changed (p. 28)
• upon system reset (p. 67)
Page 77

71
Printing (p. 82)
Prepare the printer (p. 79).
Enable Auto-Memory and set
the number of values to store.
Set decision criteria
(p. 34).
Measure
Beeper notifies when the specified number of values is stored.
6.2 Store as soon as Measurement is Stable (Auto-Memory Function)
6.2 Store as soon as Measurement is Stable
(Auto-Memory Function)
This function automatically stores the value measured each time the probes cont act the sample with
internal triggering. When the specified number of values has been acquired, auto-storage operation
stops.
St atistical calculations are applied to the stored dat a, with result s output to the screen or printer (RS232C).
See: "6.3 Performing Statistical Calculations on Measured Values" (p. 74)
"Chapter 7 Printing" (p. 79)
Data storage and printing can be automatically controlled by the Auto-Memory function.
The Auto-Memory function is disabled by default.
Enable the Auto-Memory function before settin g the nu m ber of valu es to stor e.
Enabling the Auto-Memory function affects other functions as follows:
• Statistical calculation is forced on.
• The voltage level monitor function is forced off (although the setting itself is not set to OFF, the function is
actually disabled).
• The trigger source setting is forced to internal (INT).
When the trigger source is set to external (EXT), the Auto-Memory function is disabled by force.
Deleting Stored Data
Stored data is automatically erased at the following times:
• when the memory function setting (including auto-mem-
ory) is changed (p. 142)
• when the range is changed (p. 31)
• when changing comparator settings (p. 34)
• when the power is turned off
• when printing the statistical calculations (p. 82)
• when the DUT is changed (p. 28)
• upon system reset (p. 67)
• upon setting the auto-memory number of values to store
(p. 73)
6
Page 78

72
The Basic Settings screen appears.
The Data Settings screen appears.
[DATA SETTINGS]
1
Selection
2
Selection
1
2
Disable the function (default)
Enable the function
The confirmation screen appears.
When the function is enabled
Return to the setting screen.
Save setting and return to
previous screen.
Discard setting and return to
previous screen.
6.2 Store as soon as Measurement is Stable (Auto-Memory Function)
Enabling the Auto-Memory Function
Open the Basic Settings screen.
1
Open the Data Memory Settings screen.
2
Enable the function.
3
Return to the Measurement screen.
4
Page 79

6.2 Store as soon as Measurement is Stable (Auto-Memory Function)
Displays the Auto-Memory setting
screen
Total Count Pass Count (IN) Fail Count (Hi/Lo)
Setting range: 1 to 99
To Reset Numerical Values
Deletes entered digits.
This key is enabled only when entering numerical values.
(Example: 20 values set to be stored)
Setting the Number of Values to Store
Open the Auto-Memory Settings screen.
1
Enter the number of values to store.
2
73
To abort the setting process, press . Settings are abandoned and the display returns to the previous screen.
Accept the settings and return to the Measurement screen.
3
Acquiring Measured Values Automatically
Momentarily disconnect (open-circuit) the probes.
1
Connect the probes to the DUT.
2
6
When the measurement is stable, the value is automatically stored and the count is incremented.
When the count reaches the specified number of values, a long beep sounds, and subsequent measurements are not stored.
The (one) last acquired value can be deleted (Undo function (p. 76)).
Page 80

74
n
x
x
n
x2nx2–
n
---------------------------- -
=
n1–
x2nx2–
n1–
---------------------------- -
=
16
n
LoHi
Cp
1
6
2
n
xLoHiLoHi
CpK
6.3 Performing Statistical Calculations on Measured Values
6.3 Performing Statistical Calculations on
Measured Values
Statistical calculations can be performed on up to 30,000 measured values, with results displayed.
Printing is also available (p. 82).
Calculation types: average, maximum and minimum values, population standard deviation, sample
standard deviation, process compatibility indices
Maximum value
Minimum value
Average
Population standard
deviation
Standard deviation
of sample
Process capability
index (dispersion) *
Process capability
index (bias)*
• When only one valid data sample exists, standard deviation of sample and process capability indices are
not displayed.
• When
• The upper limit of Cp and CpK is 99.99. If Cp or CpK exceeds 99.99, the value 99.99 is displayed
• Negative values of CpK are handled as CpK = 0.
• If statistical calculation is turned off and then back on without first clearing calculation results, calculation
resumes from the point when it was turned off.
• Measurement speed is restricted when statistical calculation is enabled.
• When Auto-Memory is enabled (ON), statistical calculation is enabled (ON) by force.
• When statistical calculation is disabled (OFF), Auto-Memory is disabled (OFF) by force.
= 0, Cp and CpK are 99.99.
n-1
Xmax = MAX (x1, ....., xn)
Xmin = MIN (x1, ....., xn)
In these formulas, n represents the number of valid
data samples.
Hi and Lo are the upper and lower thresholds of the
comparator.
*. The process capability indices represent the quality
achievement capability created by a process, which
is the breadth of the dispersion and bias of the process' quality. Generally, depending on the values of
Cp and CpK, process capability is evaluated as follows:
Cp, CpK>1.33......... Process capability is ideal
Cp, CpK>1.00 Process capability is adequate
1.33
Cp, CpK.........Process capability is inade-
1.00
quate
Deleting Statistical Calculation Results
Stored data is automatically erased at the following times:
•
when the memory function setting (including data-memory) is changed (p. 142)
• when the range is changed (p. 31)
• when changing comparator settings (p. 34)
• when printing the statistical calculations (p. 82)
• when the DUT is changed (p. 28)
• upon system reset (p. 67)
• upon setting the auto-memory number of values to store
(p. 73)
Page 81

75
The Basic Settings screen appears.
The Data Settings screen appears.
[DATA SETTINGS]
1
Selection
2
Selection
1
2
Disable statistical calculation (default)
Enable statistical calculation
The confirmation screen appears.
Return to the setting screen.
Save setting and return to
previous screen.
Discard setting and return to
previous screen.
When statistical calculation is enabled, F3 [STAT] appears
on the Measurement screen.
Confirm calculation results (p. 76)
6.3 Performing Statistical Calculations on Measured Values
Using Statistical Calculations
When statistical calculation is enabled and an EXT I/O trigger signal is applied, operation is as follows depending on the trigger source setting:
• With external (EXT) triggering: One measurement is performed and subjected to statistical calculation.
• With internal (INT) triggering: The next measured value after the trigger signal is subjected to st atistical calculation.
Operation is the same in the following cases:
(Key Operations) (Remote Control)
• when pressing the F4 [MANU] key on the [MENU] [TRG] selection screen
• when pressing the F2 [PRINT] key on the Measurement
screen (with internal triggering and Auto-Memory disabled. Appears only when the interface is set for the
printer.)
• when acquiring measured values by the Auto-Memory
function (p. 71)
• when a TRG remote contro l command is
received
• when an EXT I/O print signal is applied on
the Measurement screen (with internal
triggering and Auto-Memory disabled)
Open the Basic Settings screen.
1
Open the Data Memory Settings screen.
2
Enable or disable statistical calculation.
3
Return to the Measurement screen.
4
6
Page 82

76
Displays the Calculation Results
screen (if statistical calculation is enabled).
Num
Total data count
Val
Number of valid measured values (error-free data)
Ave
Mean
Sn
Population standard deviation
Max
Maximum
Sn1
Standard deviation of sample
Min
Minimum
Cp
Process capability index (dispersion)
Cpk
Process capability index (bias)
Output to the printer.
"Example Printouts" (p. 83)
Statistical calculation results and stored data are erased when printing finishes.
Erases the last measurement and calculation result (executes only once).
Erases all measured values and statistical
calculation results.
After selecting, a confirmation screen appears.
6.3 Performing Statistical Calculations on Measured Values
Confirming, Printing, and Erasing Calculation Results
Statistical calculation results are displayed on the screen.
Printing is also available with the commercially available printer with a serial interface. Calculation
results are automatically erased after printing. Before printing, select the [PRINT] interface setting.
See: "7.2 Instrument Settings" (p. 81)
The number of valid samples can be confirmed on the Calculation Results screen.
• When the number of valid samples is zero, no calculation results are displayed.
• When only one valid data sample exists, no standard deviation or process capability indices are displayed.
Display the Calculation Results screen.
1
To print
2
To print, select the printer as the interface setting on the System screen (p. 81)
To erase
Page 83

77
The Basic Settings screen appears.
The Data Settings screen appears.
[DATA SETTINGS]
1
Selection
2
Selection
1
2
Disable auto-exporting (default)
Enable auto-exporting
The confirmation screen appears.
Return to the setting screen.
Save setting and return to
previous screen.
Discard setting and return to
previous screen.
6.4 Auto-Exporting Measured Values (at End of Measurement) (Data Output Function)
6.4 Auto-Exporting Measured Values (at End of
Measurement) (Data Output Function)
At the end of measurement, the measured value is exported to a computer via RS-232C.
See: "Chapter 9 Commu nications (RS-232C/ GP-IB Interface)" (p. 97)
• Set the interface to [RS232C] beforehand. This function is not applicable to the GP-IB Interface.
See:"9.4 Configuring the Communications Protocol" (p. 101)
• When internal (INT) triggering is selected, data is exported only when a TRIG signal is applied.
• Executing a
• For other queries, be careful to avoid overlapping query response timing with auto-exp orting mea sured va lues.
• The data format for measured values can be selected as ASCII (default) or BINARY. Transfer time is minimized when BINARY is selected.
See:":SYSTem:FORMat <ASCii/ BINary>" (p. 137)
:READ? query command exports duplicate measured values.
Open the Basic Settings screen.
1
Open the Data Memory Settings screen.
2
Enable or disable auto-exporting (DATA OUT)
3
6
Return to the Measurement screen.
4
Page 84

78
6.4 Auto-Exporting Measured Values (at End of Measurement) (Data Output Function)
Page 85

7.1 Connecting the Printer
Printing (p. 82)
• Measurement values and
comparator decisions
• Statistical calculation
results
Connecting the printer to
the instrument
Make instrument
settings (p. 81)
Make printer
settings
Printing Chapter 7
7.1 Connecting the Printer
79
Before connecting the printer
Because electric shock and instrument damage hazards are present, always follow
the steps below when connecting the printer.
• Always turn off the instrument and the printer before connecting.
• A serious hazard can occur if a wire becomes dislocated and contacts another con-
ductor during operation. Make certain connec tions are secure.
• As much as possible, avoid printing in h ot and humid environ ments. O therwis e, prin ter life
may be severely shortened.
• Use only compa tible recording p ap er in the printer. Using non-specified paper may not only
result in faulty printing, but printing may become impossible.
• If the recording paper is skewed on the roller, paper jams may result.
Compatible printer
The requirements for a printer to be connected to the instrument are as follows.
Confirm compatibility and make the appropriate settings on the printer before connecting it to
the instrument.
See: "7.2 Instrument Settings" (p. 81)
• Interface .... ... ... .... ... ... ... .... ... .. RS-232C
• Characters per line................ At least 45
• Communication speed........... 9600 bps
• Data bits................................ 8
• Parity..................................... none
• Stop bits................................. 1
• Flow control........................... none
7
Page 86

80
1 Confirm that the instrument and the printer
are turned off.
2 Connect the AC adapter to the printer, and
insert the power plug into an outlet.
3 Connect the RS-232C cable to the RS-232C
connectors on the instrument and printer.
4 Turn the instrument and printer on.
2
3
Printer (Example)
AC adapter
RS-232C Cable
25 ....................... 14
9670 Printer (25-pin) Connector (Example)
RM3542 (9-pin) Connector
Pin
Signal
Name
Function
2 TxD
Transmit Data
3 RxD
Receive Data
7 GND
Signal or Common Ground
4 RTS
Request to Send
5 CTS
Clear to Send
Function
Signal
Name
Pin
Receive Data
RxD 2
Transmit Data
TxD 3
Signal or Common Ground
GND 5
6 7 8 9
1 2 3 4 5
Connector Pinouts
13 ....................... 1
7.1 Connecting the Printer
Connecting the Printer to the Instrument
Connection Methods
Page 87

7.2 Instrument Settings
The Basic Settings screen appears.
The System screen appears.
[SYSTEM]
1
Selection
2
Selection
2
1
To use the printer
The confirmation screen appears.
Return to the setting screen.
Save setting and return to
previous screen.
Discard setting and return to
previous screen.
Open the Basic Settings screen.
1
Open the System screen.
2
81
7.2 Instrument Settings
Select PRINT as the interface type.
3
Return to the Measurement screen.
4
7
Page 88

82
(When statistical calculation is enabled)
7.3 Printing
7.3 Printing
Before Printing
Verify that the instrument and printer settings (p. 81) are correct.
Printing Measured Values and Comparator Decisions
Printing by key operation
Press the PRINT key to print the measured value currently displayed on the Measurement screen.
Printing by external control
Measured values and comparator decisions print when the (active-low) PRINT signal (EXT I/O connector) is connected to ISO_GND.
* ISO_GND is a pin in the instrument’s EXT I/O connector.
*
When statistical calculation is enabled [STATISTIC: ON] and internal triggering [TRG: INT] is selected, statistical calculations are performed and measured values are printed. When external (EXT) triggering is selected, o nly measured values
are printed. Use the TRIG
signal to perform statistical calculations with external triggering.
Printing Statistical Calculation Results
Statistical calculation results can be printed when auto-memory or statistical calculation is enabled
(ON). To print, select PRINT on the screen or connect the (active-low) PRINT
connector to ISO_GND.
To enable auto-memory:
See: "6.2 Store as soon as Measurement is Stable (Auto-Memory Function)" (p. 71)
To enable statistical calculation :
See: "6.3 Performing Statistical Calculations on Measured Values" (p. 74)
signal on the EXT I/O
If no valid data exists, only the data count is printed. When only one valid data sample exists, standar d deviation of sample and process capability indices cannot be printed.
Page 89

Example Printouts
Resistance measurements
1 0.8725mOhm Lo
2 0.484mOhm Lo
3 10.99998 Ohm IN
4 -10.0026 Ohm Lo
27 9.9986 Ohm Hi
28 9.996 Ohm Hi
29 0.01003kOhm Hi
30 0.00012MOhm Hi
Measurement fault values
1 OvrRng Hi
2 -OvrRng Lo
3 C.E.Hi - 4 C.E.Lo - 5 C.E.Volt - 6 -------- --
• The “Valid” st atistical calculation result indicates the number (count)
of data samples not subject to errors such as measurement faults.
• Among the comparator decision result counts (Hi, IN, Lo, and OR),
“OR” indicates the number (count) of out-of-range measurements.
Auto-memory data and statistical calculation results
Date: 09-02-01 Time: 06:18:00
Ref: 1000.000 Ohm Upp: +1.000% Low: -1.500%
1 999.885 Ohm -0.011% IN
2 1001.885 Ohm +0.189% IN
3 1002.394 Ohm +0.239% IN
4 1002.892 Ohm +0.289% IN
5 1012.894 Ohm +1.289% Hi
6 1000.897 Ohm +0.090% IN
7 998.902 Ohm -0.110% IN
8 994.888 Ohm -0.511% IN
9 1000.391 Ohm +0.039% IN
10 979.892 Ohm -2.011% Lo
Hi: 1 IN: 8 Lo: 1 OR: 0
Number: 10 Valid: 10
Max 1012.894 Ohm +1.289% ( 5)
Min 979.892 Ohm -2.011% ( 10)
Avg 999.492 Ohm -0.051%
Sn 7.83568 Ohm
Sn-1 8.25953 Ohm
Cp 0.50
CpK 0.42
83
7.3 Printing
7
Page 90

84
7.3 Printing
Page 91

85
Signal input/output
Connect the instrument’s EXT I/O
connector to the signal output or
input device.
Make instrument settings
(p. 93)
8.1 External Input/Output Connector and Signals
External Control Chapter 8
The EXT I/O connector on the rear of the instrument supports external control by providing outp ut of
the end-of-measurement and comparator decision signals, and accepting input of measurement
trigger and key-lock signals. All signals are isolated by optocouplers (inputs and outputs share a
common signal ground).
Confirm input and output ratings, understand the safety precautions for connecting a control system, and use accordingly.
8.1 External Input/Output Connector
and Signals
To avoid electric shock or damage to the equipment, always observe the following
precautions when connecting to the EXT I/O terminals.
• Always turn off the power to the instrument and to any devices to be connected
before making connections.
• During operation, a wire becoming dislocated and contacting another conductive
object can be serious hazard. Make sure that connections are secure and use
screws to secure the external connectors.
• Ensure that devices and syste ms to be connected to the EXT I/O ter minals ar e prop-
erly isolated.
To avoid damage to the instrument, observe the following cautions:
• Do not apply voltage or current to the EXT I/O terminals that exceeds their ratings.
• When driving relays, be sure to install diodes to absorb counter-electromotive force.
Be careful not to short-circuit ISO_5V to ISO_COM.
•
See: "Connector Type and Signal Pinouts" (p. 86)
8
Page 92

86
EXT I/O Connector (Instrument Side)
Connector: (Instrument Side)
37-pin D-sub female with #4-40 screws
Mating Connectors:
DC-37P-ULR (solder type) /
DCSP-JB37PR (pressure weld type)
Japan Aviation Electronics Industry Ltd.
TRIG
(Reserved)
KEY_LOCK
(Reserved)
(Reserved)
0ADJ
HOLD
ISO_5V
ISO_COM
ERR
HI
LO
CE_HI
(Reserved)
(Reserved)
(Reserved)
(Reserved)
(Reserved)
(Reserved)
(Reserved)
CAL
(Reserved)
(Reserved)
PRB_CHECK
(Reserved)
PRINT
ISO_COM
EOM
INDEX
IN
PRB_SHORT
CE_LO
(Reserved)
(Reserved)
(Reserved)
(Reserved)
(Reserved)
12345678910111213141516171819
202122232425262728293031323334353637
8.1 External Input/Output Connector and Signals
Connector Type and Signal Pinouts
Pos: positive, Neg: negative,: not applicable
Pin
Signal name I/O Function Logic Pin Signal name I/O Function Logic
1TRIG
(Reserved)
2
3
KEY_LOCK
(Reserved)
4
(Reserved)
5
6
0ADJ
7
HOLD
8
ISO_5V
9
ISO_COM
10
ERR
11
HI
12
LO
13
CE_HI
(Reserved)
14
(Reserved)
15
(Reserved)
16
(Reserved)
17
(Reserved)
18
(Reserved)
19
External trigger
IN
Key-Lock Neg Level
IN
Execute zero-ad-
IN
just
Enable external
IN
triggering
Isolated 5 V power
output
Isolated common
signal ground
Measurement fault Neg Level
OUT
HI comparator
OUT
decision
LO comparator
OUT
decision
Probe (HI side)
OUT
contact error
Pos/
Neg
Neg Edge
Neg Level
Neg Level
Neg Level
Neg Level
Edge
20 (Reserved)
21
CAL
(Reserved)
22
(Reserved)
23
24
PRB_CHECK
25
(Reserved)
26
PRINT
27
ISO_COM
28
EOM
29
INDEX
30
IN
31
PRB_SHORT
32
CE_LO
(Reserved)
33
(Reserved)
34
(Reserved)
35
36
37
(Reserved)
(Reserved)
Reserved pins are not connected inside the instrument.
Do not connect to reserved pins.
Execute self-calibra-
IN
tion
Execute probe short-
IN
circuit detection
Print measured val-
IN
ue
Isolated common
-
signal ground
End of measurement Neg Edge
OUT
Analog measure-
OUT
ment finished
IN comparator
OUT
decision
Probe short-circuit
OUT
error
Probe (LO side)
OUT
contact error
Neg Edge
Neg Edge
Neg Edge
Neg Edge
Neg Level
Neg Level
Neg Level
•The 0ADJ signal should be asserted (Low) for at least 10 ms.
• The connector shell is conductively connected to the metal instrument chassis and the protective earth pin
of the power plug. Be aware that it is not isolated from ground.
Page 93

Signal Descriptions
Input Signals
When external triggering (EXT) is enabled, one measuremen t is performed at the fall ing (ON)
or rising (OFF) edge of the TRIG
selected on the Settings screen (default: falling (ON) edge).
When internal triggering (INT) is enabled, external triggering is disabled. Also, when the Set-
TRIG
tings Monitor function is enabled and an error occurs, triggering is disabled (p. 53).
The TRIG
• Stores statistical calculation data (when statistical calculation is enabled)
• Stores measured data to internal memory (when the data memory function is enabled)
(also operates with internal triggering)
87
8.1 External Input/Output Connector and Signals
signal. Falling (ON) or rising (OFF) edge trigg ering can be
(p. 94)
signal performs the following operations in addition external triggering:
0ADJ
PRINT Asserting the PRINT signal prints the current measurement value.
CAL
HOLD
PRB_CHECK
KEY_LOCK
Asserting the 0ADJ signal executes zero adjustment once.
To avoid malfunction, this signal should be asserted (Low) for at least 10 ms.
Asserting the CAL signal executes self calibration. The time required for self calibration is as
follows:
Approximately 130 ms (with 60-Hz line frequency setting), or 110 ms (with 50-Hz setting)
If asserted during measurement, executes after the end of measurement.
Holding the HOLD signal low enables external triggering. When the HOLD signal is high, the
settings made on the Settings screen or by commands are re-enabled.
Asserting the PRB_CHECK signal executes probe short-circuit adjustment one time. If
asserted during measurement, executes after the specified time from the end of measurement.
While the KEY_LOCK signal is held low, all front panel keys (except POWER button) are disabled (key unlock and remote control cancellation operations are also disabled).
Output Signals
This signal indicates that a measurement fault has occurred (except out-of-range detection). It
ERR
CE_HI
is updated simultaneously with the EOM signal. At this time, comparator decision outputs are
all de-asserted (high).
This signal indicates that a contact check error has occurred between H
tacts. It is updated simultaneously with the EOM
puts are all de-asserted (high).
signal. At this time, comparator decision out-
CUR
and H
POT
(p. 32)
(p. 82)
(p. 57)
(p. 51)
(p. 59)
8
(p. 38)
con-
(p. 46)
CE_LO
PRB_SHORT
INDEX
EOM
HI, IN, LO
This signal indicates that a contact check error has occurred between L
tacts. It is updated simultaneously with the EOM
puts are all de-asserted (high).
This signal indicates that a foreign object is shorting the POT and C UR contacts in a four-ter-
minal probe tip. At this time, comparator decision outputs are all de-asserted (high).
This signal indicates that A/D conversion in the measurement circuit is finished.
When the asserted (low) state occurs, the measurement sample can be removed.
This signal indicates the end of a measurement. At this time, the states of the comparator deci-
sion outputs and ERR
These are the comparator decision output signals.
, CE_HI, CE_LO, and PRB_SHORT are all determined.
signal. At this time, comparator decision out-
CUR
and L
POT
con-
(p. 46)
(p. 51)
(p. 93)
• Input signals are ignored when the following are displayed: Basic, Detailed, and Comparator Settings
screens; Statistical Calculation Results screen (except for the print signal); and error messages (except
Setting Monitor errors).
• EXT I/O input and output signals are not usable while changing measurement settings.
Page 94

88
Contact check
Measurement
currents
Contact Improver
Checking
Measurement
processing
Available
End of
Measurement
8.2 Timing Chart
8.2 Timing Chart
Each signal level indicates a corresponding voltage level.
•The
EOM signal is operational when the trigger source setting is EXT and the EOM output setting is Pulse.
• A self-calibration measurement (approximately 130 ms) is automatically performed every 10 minutes
(between measurements).
TRIG signal input is accepted during that ti me, but the correspond ing measure-
ment is delayed until self-calibration is finished.
• Do not apply a
TRIG signal while measuring using external triggering (the signal is ignored).
• When changing settings such as measurement range, allow about 150 ms proc essin g time befor e applying
TRIG signal.
a
• Input signals are ignored when the following are displayed: Basic, Detailed, and Comparator Settings
screens; Statistical Calculation Results screen (except for the print signal); and error messages (except
Setting Monitor errors).
•The
• Output of comparator decisions and error signals are determ ined before the
• With internal (INT) triggering, the
INDEX and EOM signals are de-asserted simultaneously.
EOM signal is asserted.
EOM signal is fixed High (OFF). Also, comparator decisions and error sig-
nals are not de-asserted (OFF) when measurement starts.
EOM operation when the EOM
EOM signal is asserted (ON) at the end of measurement.
The
EOM signal continues to be asserted until measurement starts again with the next TRIG signal input.
The
See: "Setting End-of-Measurement Signal Output (EOM Signal Setting)" (p. 93)
Output setting is Hold
The EOM
signal is de-asserted when the next measurement is started by the next TRIG signal.
Page 95

89
Output Signal State at Power-On
All signals are low (asserted active-low) when power is turned on.
All output signals become high (de-asserted active-low) when ch anging from the
initial screen to the Measurement screen.
Operation is shown when the trigger source is set to external triggering (EXT).
Instrument
State
Power-On
Initial Screen Measurement Screen
8.2 Timing Chart
Timing Chart Interval Descriptions
Inter-
Description Duration Remarks
val
Trigger Pulse
t0
Asserted (ON)
Trigger Pulse
t1
De-asserted (OFF)
t2 Delay 1 0 to 100 ms Setting-dependent
t3 Delay 2 0 to 100 ms
t4 Measurement time 0.1 to 100 ms
t5 Calculation time 0.1 ms Calculation time is longer when memory storage is enabled.
t6 EOM pulse width 1 to 100 ms Setting-dependent
Internal Delay
Resistance Measurement
(LOW POWER OFF)
Range Internal Delay [ms] Range Internal Delay [ms]
100m 1.4 1000m 0.8
1000m 0.7 10 0.8
10 0.5 100 0.6
100 0.5 1000 3.3
1000 0.5
10k 0.5
100k 0.7
1000k 0.8
10M 2.6
100M 5.3
0.1 ms or more Falling (ON)-/rising (OFF)-edge selectable
0.1 ms or more
Setting-dependent (When the Contact Improver function is set to
Pulse, 0.1 ms is added.)
OVC OFF: Integration Time + Internal Delay (see following table)
OVC ON: (Integration Time + Internal Delay)
Low Power Resistance Measurement
(LOW POWER ON)
Total processing time before and after integration measurements
8
× 2 + Delay2
Page 96

90
Input Circuit
Output Circuit
PLC, etc. (Controller)
Internally Isolated
Common Signal Ground
Do not apply external power
Common
Output
PLC, etc. (Controller)
Input
Common
Internally Isolated
Common Signal Ground
Zener Voltage
30 V
Internally Isolated 5 V
Internally Isolated 5 V
8.3 Internal Circuitry
8.3 Internal Circuitry
Page 97

Electrical Specifications
91
8.3 Internal Circuitry
Input Signals
Output Signals
Internally Isolated
Power Output
Input type Optocoupler-isolated, non-voltage contact inputs
(source input, active-low)
Input asserted (ON) voltage 1 V or less
Input de-asserted (OFF) voltage Open or 5 to 30 V
Input asserted (ON) current 3 mA/ch
Maximum applied voltage 30 V
Output type Optocoupler-isolated npn open-collector outputs
(current sink, active-low)
Maximum load voltage 30 V
Maximum output current 50 mA/ch
Residual voltage 1 V (10 mA), 1.5 V (50 mA)
Output Voltage 4.5 to 5.0 V
Maximum output current 100 mA
External power input none
8
Page 98

92
Input Circuit
Connection Examples
Output Circuit
Connection Examples
Input
Input
Input
Output
Output
Common
Input
Common
Output
Output
Output
Output
Output
Output
Output
Input
Common
Input
Common
Active-Low Logic Output
Wired OR
Relay Connections
LED Connection
PLC Output (Source Output) Connections
PLC Output (Sink Output) Connections
Relay Connections
Switch Connections
PLC Input (Sink Input) Connections
PLC Input (Source Input) Connections
Active-Low
Logic Output
8.3 Internal Circuitry
Connection Examples
Page 99

93
The Basic Settings screen appears.
The System screen appears.
[SYSTEM]
1
Selection
2
Selection
1
2
The specified pulse is output after endof-measurement (default).
The EOM signal remains asserted after
end-of-measurement (to step 5).
Setting range: 1 ms to 100 ms (default: 5 ms)
2
3
Selection
1
The confirmation screen appears.
Return to the setting screen.
Save setting and return to
previous screen.
Discard setting and return to
previous screen.
8.4 External I/O Settings
8.4 External I/O Settings
These settings affect the logic of the end-of-measurement and trigger signals.
Setting End-of-Measurement Signal Output (EOM Signal Setting)
The selected EOM output level is retained until the next trigger input, or for the specified pulse
width.
Open the Basic Settings screen.
1
Open the System screen.
2
Select the EOM signal output type.
3
(When PULSE is selected)
4
Select the pulse width.
8
Return to the Measurement screen.
5
Page 100

94
The Basic Settings screen appears.
The System screen appears.
[SYSTEM]
1
Selection
2
Selection
1
2
Measurement starts at the rising (OFF)
edge of the (active-low) signal.
Measurement starts at the falling (ON)
edge of the (active-low) signal. (default)
The confirmation screen appears.
Return to the setting screen.
Save setting and return to
previous screen.
Discard setting and return to
previous screen.
8.4 External I/O Settings
Setting the Trigger (TRIG) Signal Logic
Select whether triggering occurs on the falling (ON) or rising (OFF) edge.
Open the Basic Settings screen.
1
Open the System screen.
2
Select the triggering logic edge.
3
Return to the Measurement screen.
4
 Loading...