

Page 1
Page 2

Page 3

Contents
Contents
Measurement Process .............................. 1
System Architecture .................................. 2
Example Measurement Setups................. 3
Introduction ................................................ 5
Verifying Package Contents ..................... 6
Options .........................................................7
Safety Information ..................................... 9
Operating Precautions .............................11
1 Overview 17
1.1 Product Overview ........................... 17
1.2 Features .......................................... 17
1.3 Part Names and Functions ............ 19
1.4 Basic Operation (Screen Display
and Layout) ..................................... 25
Screen Operation ........................................25
Common Screen Display ............................28
Measurement Screen Display .....................29
Screen Layouts ...........................................30
2 Preparing for
Measurement 33
2.1 After Purchase ................................ 33
Wrapping voltage cords in spiral tubes .......33
2.2 Inspecting the Instrument
before Use ....................................... 34
2.3 Connecting the Power Cord .......... 35
2.4 Connecting the Voltage Cords ...... 35
2.5 Connecting the Current Sensors .. 36
Connecting a current sensor to the
Probe1 terminal ..........................................37
Connecting a current sensor to the
Probe2 terminal ..........................................38
If the measurement range exceeds
(using a VT and CT) ...................................39
2.6 Turning the Instrument On/Off ...... 40
2.7 Setting the Connection Mode
and Current Sensors ...................... 41
2.8 Connecting the Instrument to
the Measurement Lines (Zero-
adjustment) ..................................... 43
Zero-adjustment and degaussing (DMAG) .43
Connecting the voltage cords to the
measurement lines .....................................44
Connecting the current sensor to the
measurement lines .....................................44
Using the quick conguration function ........45
2.9 Verifying Proper Connections
(Connection Check) ....................... 47
3 Viewing Measured
Values 49
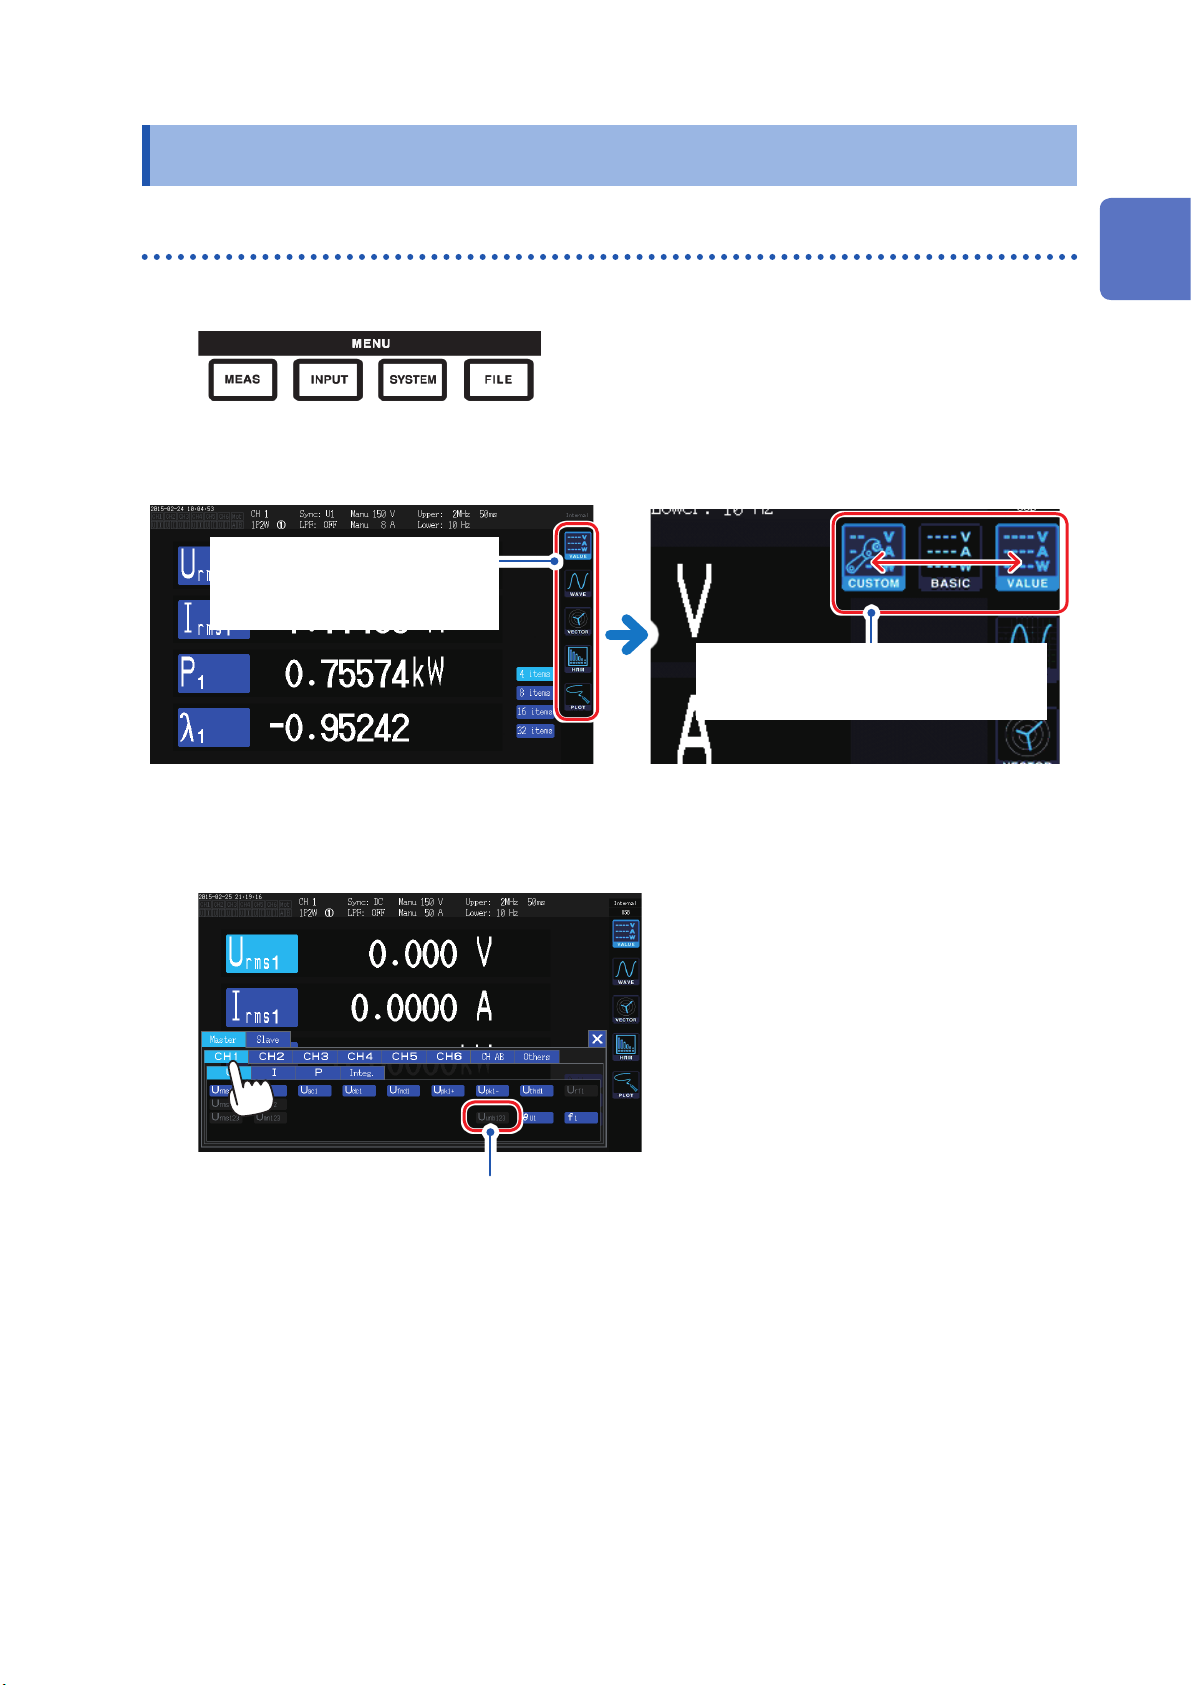
3.1 Displaying Measured Values ......... 49
Selecting display parameters ......................49
3.2 Viewing Power Measured Values
and Changing Measurement
Conditions ...................................... 52
Displaying power measured values ............52
Displaying voltage and current ...................53
Setting the ranges .......................................53
Conguring zero-suppression .....................56
Setting the data update rate .......................57
Setting the synchronization source .............58
Setting the low-pass lter (LPF) ..................59
Conguring frequency measurement ..........60
Setting the frequency source ......................60
Setting the measurement upper limit
frequency and the lower limit frequency .....61
Setting the rectier ......................................62
Conguring scaling (when using a VT
[PT] or CT) ..................................................62
3.3 Viewing Integration Values ............ 63
Displaying integration values ......................63
Setting the integration mode .......................66
Using manual integration ............................67
Performing integration while using the
time control function ....................................68
3.4 Viewing Harmonic Measured
Values .............................................. 69
Displaying harmonics ..................................69
Setting the harmonic measurement mode ..72
Setting the THD calculation method ...........73
THD calculation order .................................73
Setting the grouping method .......................74
3.5 Viewing Measured Values for
Power Factor and Loss .................. 75
Displaying efciency and loss .....................75
Setting the calculation formulas for
efciency and loss ......................................76
Example measurements .............................77
3.6 Viewing Motor Measured
Values (Motor Analysis and D/
A-equipped Models) ....................... 80
Displaying motor measured values .............80
Performing zero-adjustment of motor input 81
Setting motor input ......................................82
Measuring a motor’s electrical angle ..........89
Detecting the motor’s direction of rotation ..91
1
2
3
4
5
6
7
8
9
10
Appx. Ind.
PW6001A961-04
i
Page 4

Contents
4 Viewing Waveforms 93
4.1 Displaying Waveforms ................... 93
Displaying waveforms on the WAVE
screen .........................................................93
Displaying waveforms and measured
values on the WAVE+VALUE screen ..........94
Initializing the display position ....................94
4.2 Changing the Waveform Display
and Conguring Recording ........... 96
Vertical axis zoom factor and display
position settings ..........................................96
Time axis setting .........................................97
Detailed display settings .............................99
Vertical axis scale display ...........................99
Trigger settings .........................................100
4.3 Recording Waveforms ................. 102
Recording a waveform continuously .........102
Recording a waveform once .....................102
Activating the trigger manually ..................102
4.4 Analyzing Displayed Waveforms 103
Viewing displayed waveform values
(Cursor measurement) ..............................103
Enlarging waveforms (zoom function) ......104
4.5 Viewing FFT Analysis Results .... 105
Displaying waveforms and FFT analysis
results .......................................................105
Changing the window size and position ....106
Displaying FFT analysis results as values 108
Turning the display of FFT analysis
results on and off ......................................108
Setting the lower limit frequency for the
FFT peak value display .............................109
Setting the window function ...................... 110
Changing the scale of the vertical axis
on the FFT analysis results display .......... 111
5 Using the Instrument’s
Functionality 113
5.1 Time Control Function ..................113
Interval time control .................................. 11 3
Timer time control .....................................113
Actual time control .................................... 113
5.2 Averaging Function .......................115
Simple average (ADD) .............................. 11 5
Exponential average (EXP) ...................... 11 5
5.3 Hold and Peak Hold Functions ....117
Hold function ............................................. 11 7
Peak hold function .................................... 119
5.4 Delta Conversion Function ......... 122
-Y conversion ..........................................122
∆
Y-∆ conversion ..........................................123
5.5 Selecting the Power Calculation
Formula ......................................... 124
5.6 Current Sensor Phase Shift
Function ........................................ 125
5.7 User-dened Calculations (UDF) 127
5.8 Simple Graph Function ................ 129
D/A monitor graph .....................................129
Detailed display settings ...........................130
Vertical axis scale display .........................130
X-Y plot function .......................................131
Vertical axis/horizontal axis scale
settings, integration full-scale setting ........133
6 Changing System
Settings 135
Checking and changing settings ...............135
Correcting the touch panel ........................136
6.1 Initializing the Instrument ............ 136
System reset .............................................136
Boot key reset ...........................................136
6.2 Default Settings ............................ 137
7 Saving Data and
Manipulating Files 139
7.1 Inserting and Removing USB
Flash Drives .................................. 139
7.2 File Operations Screen ................ 141
7.3 Saving Measurement Data .......... 142
Setting which measurement parameters
to save ......................................................142
Manually saving measurement data .........144
Automatically saving measurement data ..145
Automatic save operation using time
control .......................................................147
7.4 Saving Waveform Data ................ 148
7.5 Saving FFT Data ........................... 150
7.6 Saving Screenshots ..................... 152
7.7 Saving Settings Data ................... 153
7.8 Loading Screenshots ................... 154
7.9 Loading Settings Data ................. 154
7.10 File and Folder Operations .......... 155
Creating a folder .......................................155
Deleting les and folders ..........................155
Changing the name of a le or folder ........156
Copying les .............................................156
Formatting a USB ash drive ....................156
7.11 Measured Value Data Format ...... 157
Header structure .......................................157
Status data ................................................160
Measured value data format .....................162
7.12 Waveform Binary Data Format .... 163
ii
Page 5

Contents
Data format ...............................................163
8 Connecting External
Devices 169
8.1 Synchronization Interface
(Two-instrument Synchronized
Measurement) ............................... 169
Connecting 2 instruments with the
L6000 Optical Connection Cable ..............170
8.2 Using D/A Output (Motor
Analysis and D/ A-equipped
Models Only) (Analog and
Waveform Output) ........................ 173
Connecting an application-specic
device to the instrument ............................173
Selecting output parameters .....................175
Output rates ..............................................178
Examples of D/A output ............................180
8.3 Using Motor Analysis (Motor
Analysis and D/ A-equipped
Models Only) ................................. 182
Connecting a torque meter and
tachometer ................................................182
8.4 Controlling Integration with
External Signals ........................... 185
8.5 Connecting an LR8410 Link-
compatible Logger ....................... 188
9 Connecting the
Instrument to a
Computer 189
9.1 Using the LAN Interface .............. 190
Conguring LAN settings and building a
network environment ................................190
Connecting the LAN cable ........................192
Controlling the instrument remotely with
an Internet browser ...................................193
9.2 Performing Instrument File
Operations from a Computer
(Using FTP) ................................... 195
Using FTP to connect to the instrument ...196
Performing le operations with FTP ..........197
9.3 Using GP-IB .................................. 198
Connecting the GP-IB cable .....................199
Setting the GP-IB address ........................199
9.4 Using RS-232C ............................. 200
Conguring the D-sub 9-pin connector .....201
Connecting the RS-232C cable ................202
9.5 Canceling the Remote State
(Reverting to the Local State) ..... 203
10 Specications 205
10.1 General Specications ................ 205
10.2 Basic Specications .................... 206
10.3 Functional Specications ............ 221
10.4 Measurement Parameter
Detailed Specications ................ 231
10.5 Calculation Formula
Specications ............................... 239
11 Maintenance and
Service 251
11.1 Repairs, Inspections, and
Cleaning ........................................ 251
11.2 Disposing of the Instrument ....... 253
Removing the lithium battery ....................253
11.3 Replacement Parts and Their
Service Lives ................................ 254
Replacing the fuse ....................................254
12 Troubleshooting 255
12.1 Frequently Asked Questions ....... 255
12.2 Error Displays ............................... 257
Startup errors and operating errors ..........257
Control errors ............................................257
USB ash drive and le operation errors ..259
Appendix Appx.1
Appx. 1 Rack-mounting the
Instrument ........................ Appx.1
Rack-mounting hardware .....................Appx.1
Installation instructions ........................Appx.4
Appx. 2 Outline Drawings ............. Appx.6
Index Ind.1
11
12
3
4
5
6
7
8
9
10
Appx.
Appx. Ind.
iii
Page 6

iv
Page 7
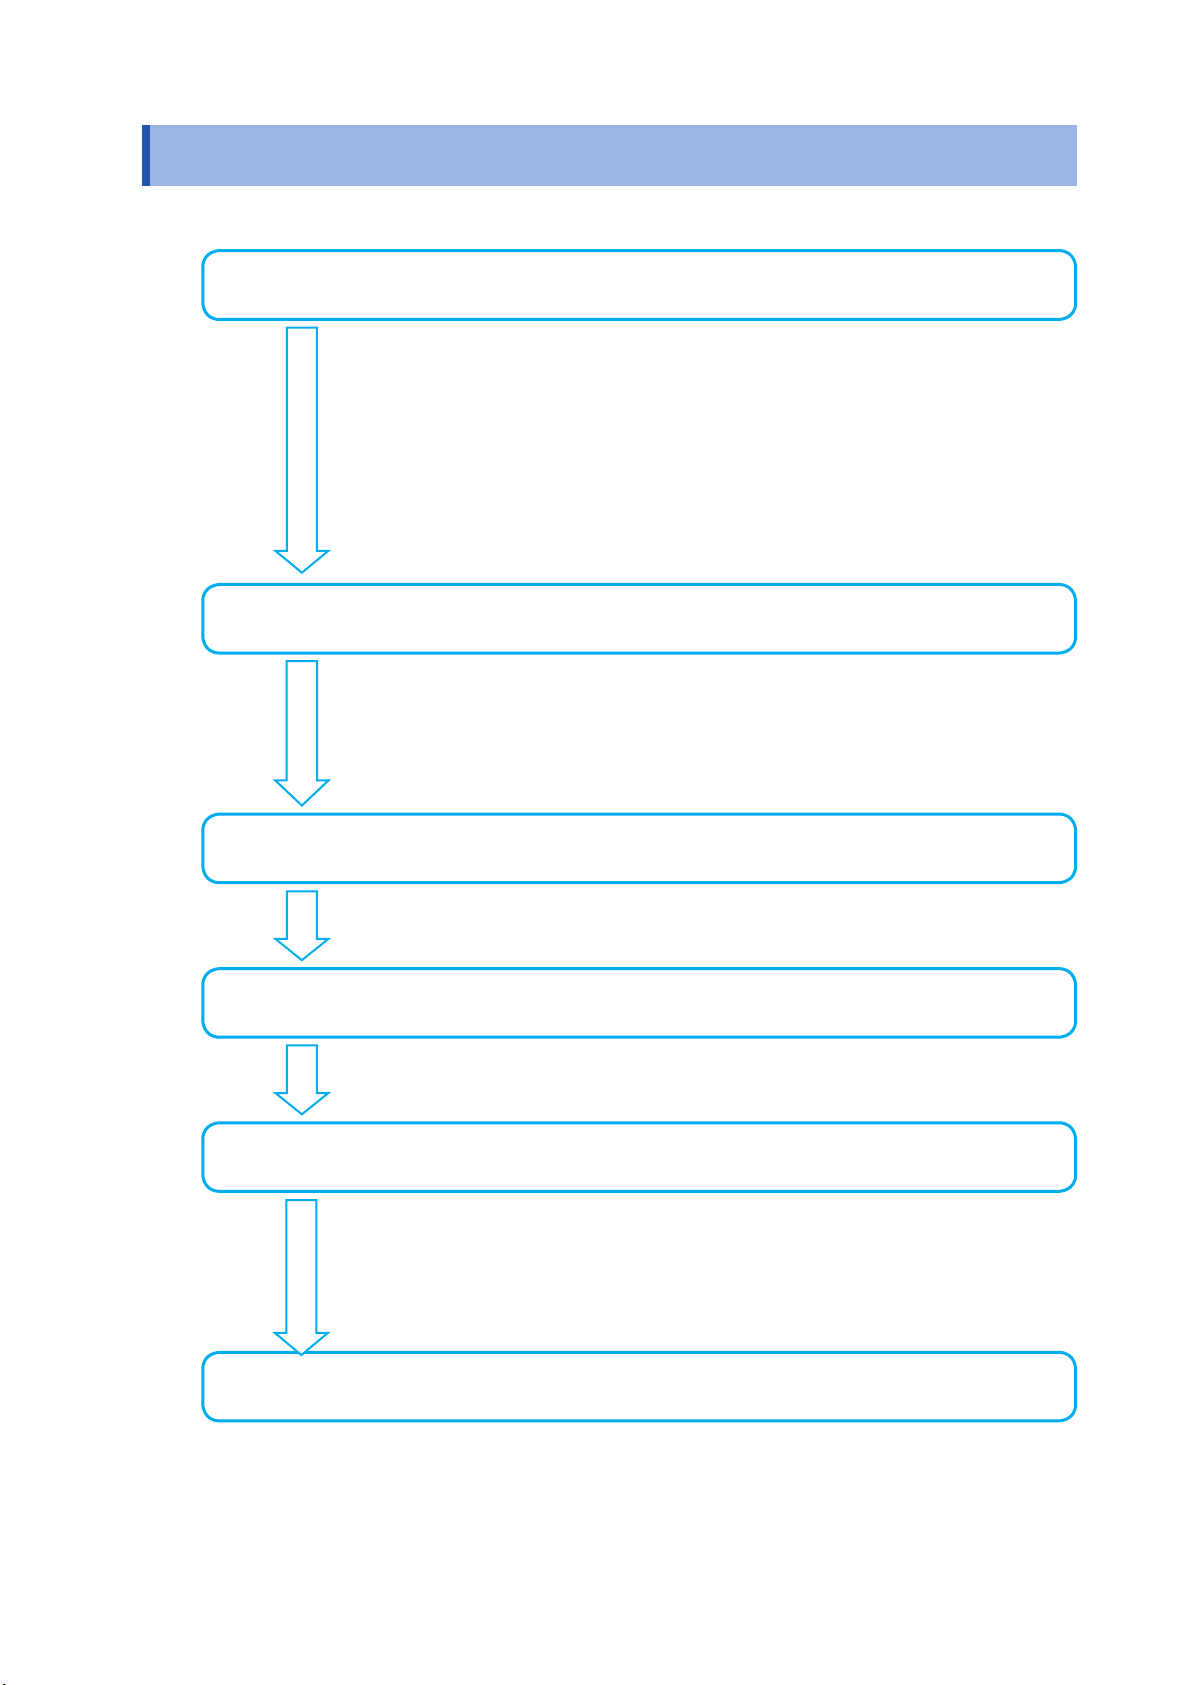
Measurement Process
Be sure to read “Operating Precautions” (p. 11) before use.
Setting up the instrument
• “Instrument placement” (p. 12)
• “2.1 After Purchase” (p. 33)
• “2.2 Inspecting the Instrument before Use” (p. 34)
• Be sure to inspect the instrument before connecting it or turning it on.
• “2.3 Connecting the Power Cord” (p. 35)
• “2.6 Turning the Instrument On/Off” (p. 40)
To ensure accurate measurement, allow a warm-up period of at least
30 minutes to elapse after turning on the instrument before performing
zero-adjustment.
Connecting the instrument
Measurement Process
• “2.7 Setting the Connection Mode and Current Sensors” (p. 41)
• Be sure to perform zero-adjustment before connecting the instrument.
• “2.8 Connecting the Instrument to the Measurement Lines (Zero-
adjustment)” (p. 43)
• “2.9 Verifying Proper Connections (Connection Check)” (p. 47)
Setting the measurement conditions
• “3 Viewing Measured Values”(p. 49)
• “4 Viewing Waveforms”(p. 93)
Viewing measured values
• “3 Viewing Measured Values”(p. 49)
• “4 Viewing Waveforms”(p. 93)
Saving data
• “Manually saving measurement data” (p. 144)
• Saving data with actual time control (p. 147)
Saving data with timer control (p. 147)
•
Saving data with interval control (p. 147)
•
• USB ash drive and the instrument’s internal memory (p. 139)
Analyzing data
• “8 Connecting External Devices”(p. 169)
• “9 Connecting the Instrument to a Computer”(p. 189)
1
Page 8
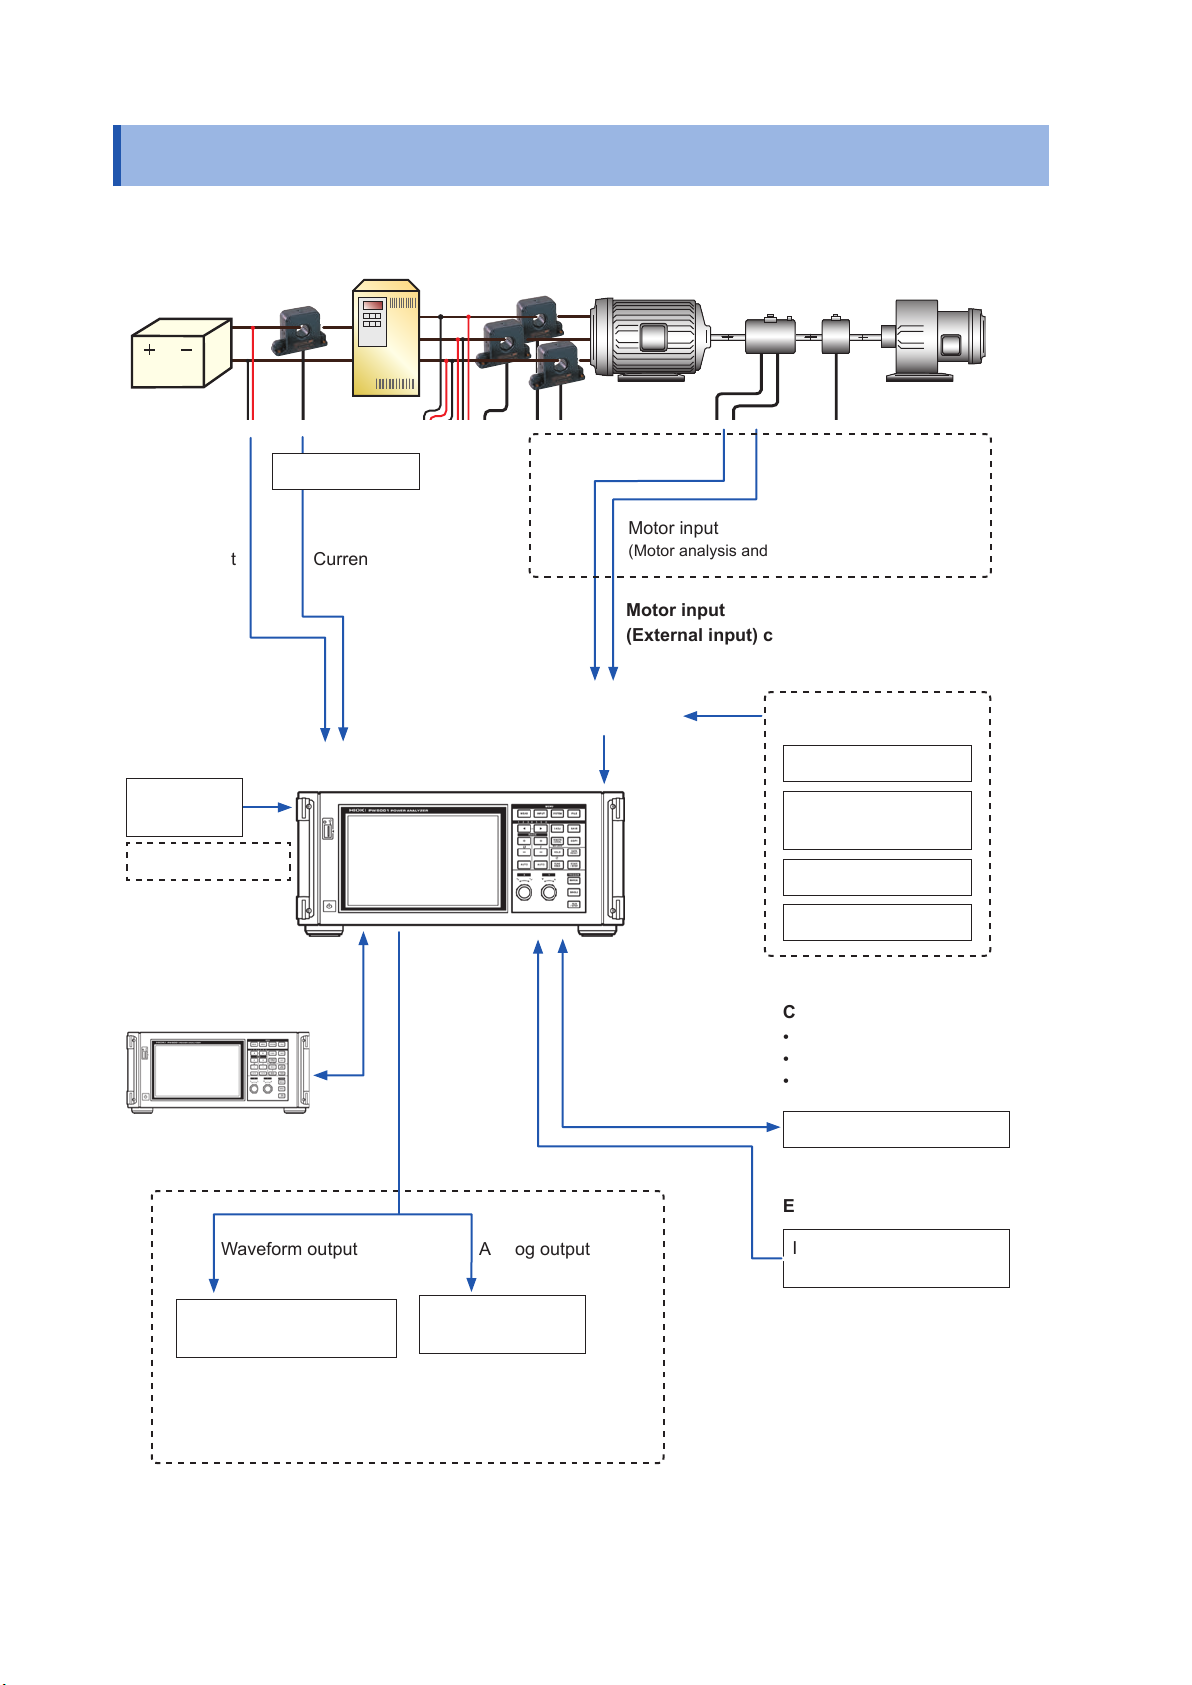
System Architecture
System Architecture
Inverter
Battery
sensor
EncoderTorque
Current sensor
Voltage input Current input
Input channels
USB ash
drive
Internal memory
Motor
Motor input
(Motor analysis and D/A-equipped models only)
Motor input
(External input) channels
Some combination
of inputs
Load
Encoder signalTorque sensor signal
External input
Pyranometer output
Thermometer analog
output
Pulse signal
Waveform trigger
Two-instrument
synchronization
Waveform output Analog output
Oscilloscope, memory
recorder, etc.
Communications interfaces
• LAN
• GP-IB
• RS-232C
Computer, controller, etc.
External control
Integration control
Start/stop/reset
Logger,
comparator, etc.
D/A output
Motor input
(Motor analysis and D/A-equipped models only)
2
Page 9

Example Measurement Setups
Example Measurement Setups
Conversion efciency measurement of inverters with built-in SiC
3-phase
power
supply
Measuring the efciency of PV power conditioners
DC measurement
Converter
Power conditioner
Solar panel
Inverter
AC measurement
Motor
Power system
Load
EV/HEV motor analysis
Battery
Inverter Motor
Torque
sensor
Pulse
encoder
Load
3
Page 10

Example Measurement Setups
4
Page 11
Introduction
Thank you for purchasing the Hioki PW6001 Power Analyzer. To obtain maximum performance
from the product, please read the instruction manual rst, and keep it handy for future reference.
• One or more clamp-on sensors, AC/DC current sensors, or other sensors are required in order
to provide current input to the instrument. (These devices are referred to collectively as “current
sensor(s)” in this manual.) For more information, see the instruction manual for the current
sensor(s) you are using.
• One or more voltage cords (voltage measurement option) or other similar cords are required
in order to provide voltage input to the instrument. The instrument’s voltage input terminals
use standard φ 4 mm CAT II (1000 V) or CAT III (600 V) compatible safety banana connectors.
Provide voltage cords as appropriate for your application.
Trademarks
• Microsoft and Windows are either registered trademarks or trademarks of Microsoft Corporation
in the United States and other countries.
• Adobe and Adobe Reader are trademarks of Adobe Systems Incorporated.
• Bluetooth® is a registered trademark of Bluetooth SIG, Inc.(USA). The trademark is used by
HIOKI E.E. CORPORATION under license.
• ParaniTM is a registered trademark of Sena Technologies, Inc.
Introduction
Product model numbers
Right side
Product model number
PW6001-01 1 n/a
PW6001-02 2 n/a
PW6001-03 3 n/a
PW6001-04 4 n/a
PW6001-05 5 n/a
PW6001-06 6 n/a
PW6001-11 1 Motor analysis and D/A output
Number of input
channels
Product model number
Additional functionality
PW6001-12 2 Motor analysis and D/A output
PW6001-13 3 Motor analysis and D/A output
PW6001-14 4 Motor analysis and D/A output
PW6001-15 5 Motor analysis and D/A output
PW6001-16 6 Motor analysis and D/A output
In this manual, models equipped with motor analysis and D/A output functionality are referred to as “motor
analysis and D/A-equipped models.”
5
Page 12
Verifying Package Contents
Verifying Package Contents
Once you have received the instrument, verify that it has not suffered any damage during shipment
before using it. Pay particular attention to accessories, panel switches, and terminals. If you discover any
damage or nd that the instrument does not operate as stipulated in its specications, please contact your
authorized Hioki distributor or reseller. When transporting the instrument, use the original packaging.
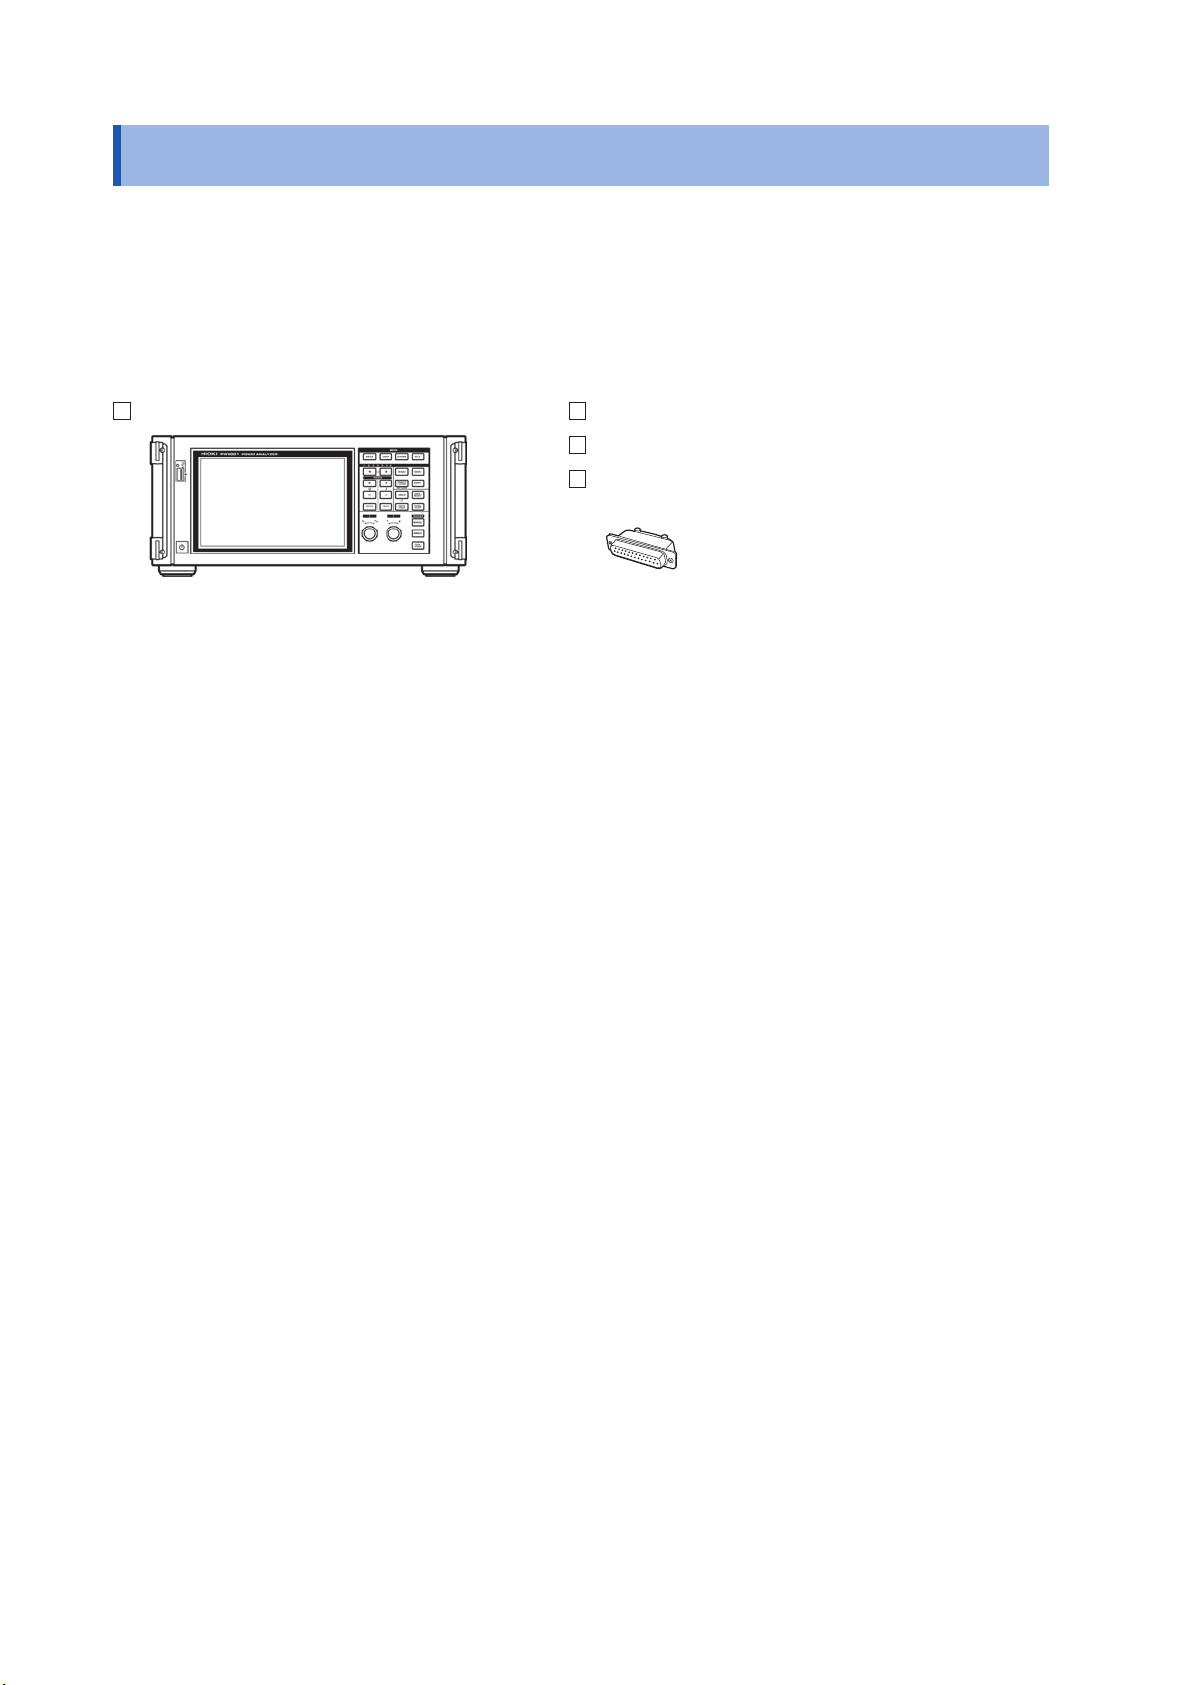
Verify that the packaging includes all contents.
PW6001 Power Analyzer Instruction manual
Power cord
D-sub 25-pin connector
(Motor analysis and D/A-equipped models only)
6
Page 13
Options
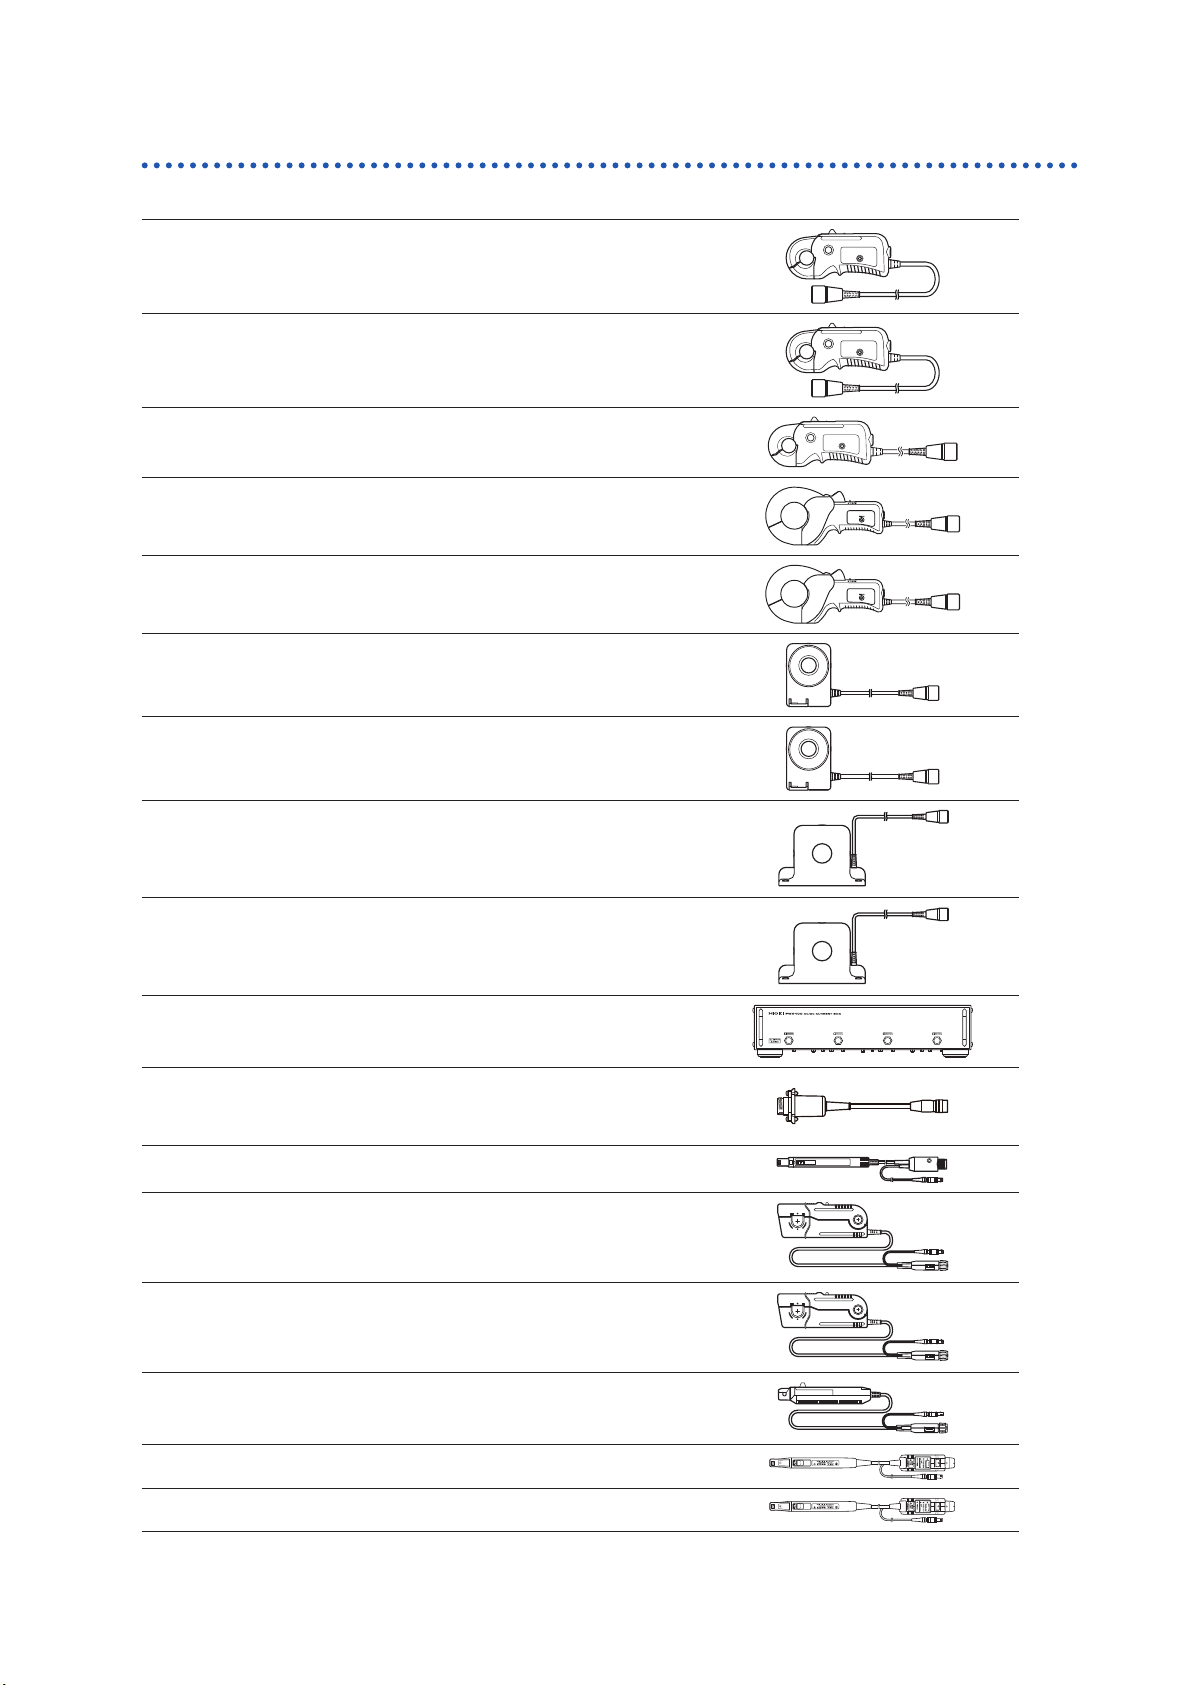
Current measurement options
CT6841 AC/DC Current Probe (20 A)
CT6843 AC/DC Current Probe (200 A)
CT6844 AC/DC Current Probe (500 A)
CT6845 AC/DC Current Probe (500 A)
CT6846 AC/DC Current Probe (1000 A)
Verifying Package Contents
CT6862 AC/DC Current Sensor (50 A)
Cord length: 3m
CT6863 AC/DC Current Sensor (200 A)
Cord length: 3 m
9709 AC/DC Current Sensor (500 A)
Cord length: 3 m
CT6865 AC/DC Current Sensor (1000 A)
Cord length: 3 m
PW9100 AC/DC Current Box (50 A)
CT9900 Conversion Cable
(PL23 receptacle/ME15W plug)
3273-50 Clamp On Probe (30 A)
3274 Clamp On Probe (150 A)
3275 Clamp On Probe (500 A)
3276 Clamp On Probe (30 A)
CT6700 Current Probe (5 A)
CT6701 Current Probe (5 A)
7
Page 14
Verifying Package Contents
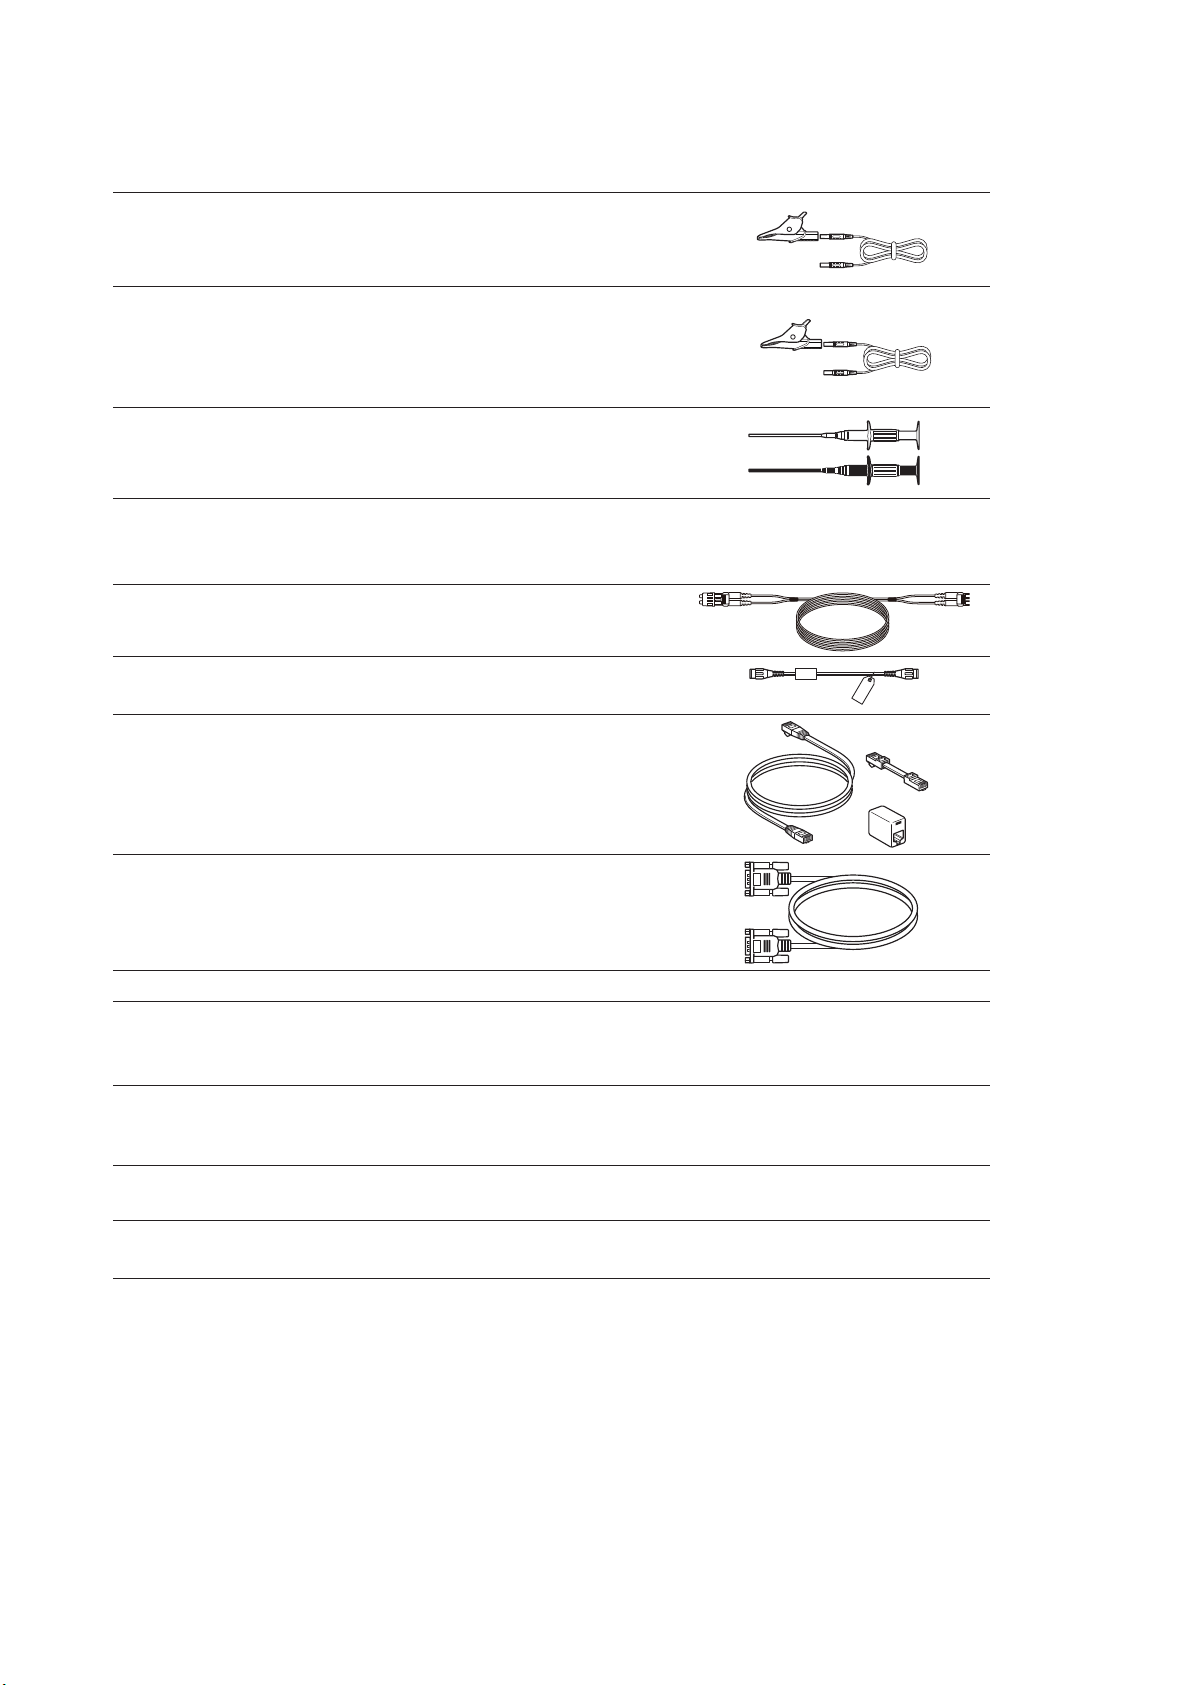
Voltage measurement options
L9438-50 Voltage Cord
(Banana connector/banana connector; red and
black × 1 ea.; cord length: approx. 3 m)
L1000 Voltage Cord (banana connector/banana
connector; red, yellow, blue, and gray × 1 ea.;
black × 4; cord length: approx. 3 m with alligator
clips)
9243 Grabber Clip (red and black × 1 ea.)
Connection options
L6000 Optical Connection Cable (10 m)
L9217
9642
9637 RS-232C Cable (9-pin/9-pin; cross; 1.8 m)
9151-02 GP-IB Connector Cable (2 m)
9444
Connection Cord (isolated BNC; 1.7 m; for motor
input)
LAN Cable
(CAT 5e with cross conversion connector; 5 m)
Connection Cable
(For external control use; 9-pin/9-pin; straight;
1.5 m)
Other options
Specialorder
Specialorder
Rack mount hardware (for EIA or JIS)
Carrying case
(Rigid trunk type; with casters)
8
Page 15
Safety Information
Safety Information
The PW6001 has been designed and tested in accordance with the IEC 61010 safety standard and
shipped in a safe state. However, failure to adhere to the precautionary information and follow the
instructions provided in this instruction manual may render safety-related functionality provided by
the instrument inoperable.
Before using the instrument, be sure to carefully review the following important safety information.
DANGER
Improper use of the instrument may result in bodily injury or equipment damage.
Read this instruction manual carefully and ensure that you understand its contents
before operating the instrument.
WARNING
Electricity poses a number of hazards, including electric shock, overheating, re,
and arc discharge (caused by a short). Individuals using an electrical measuring
instrument for the rst time should be supervised by a technician who has experience
in electrical measurement.
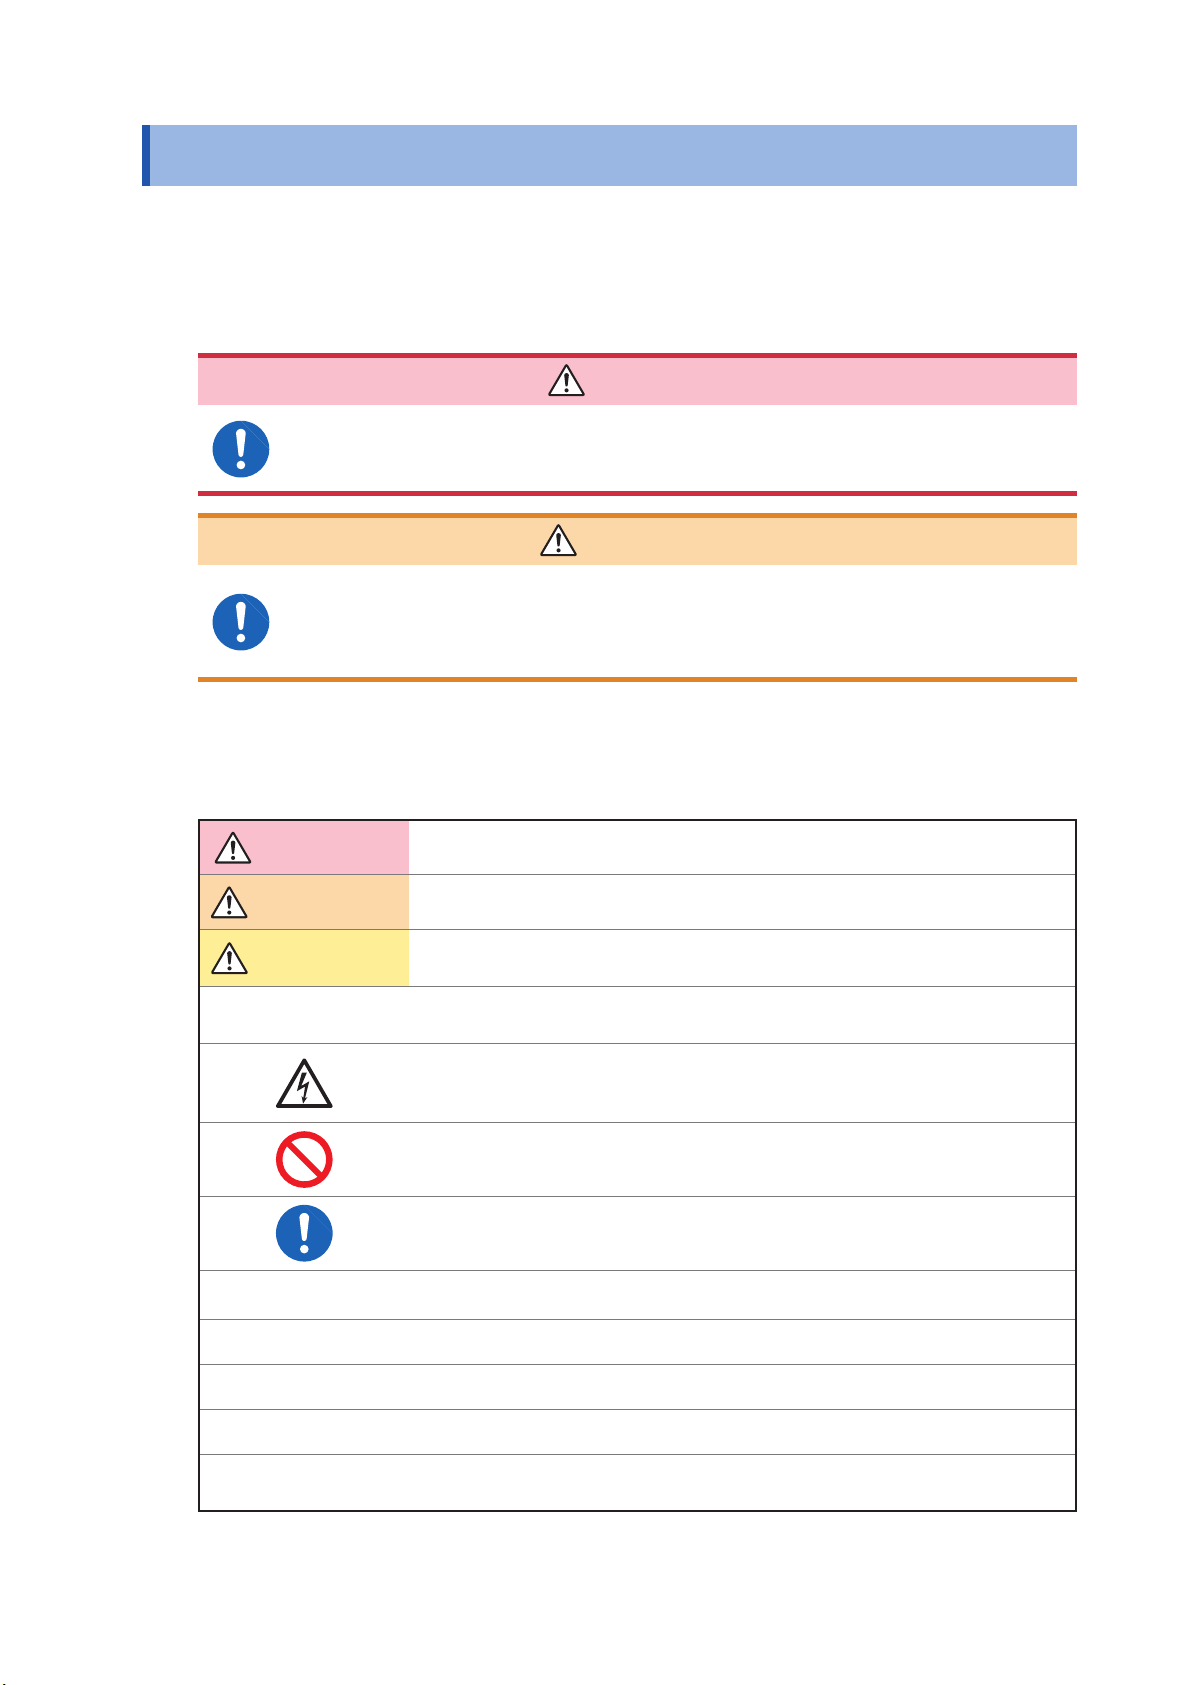
Safety-related notations
This manual classies safety information on the basis of the severity of the associated risk and
hazard level using the following categories.
DANGER
WARNING
CAUTION
IMPORTANT
*
Indicates an imminent hazard that could lead to serious injury or death.
Indicates a hazard that could lead to serious injury or death.
Indicates a hazard that could lead to minor injury or that could be expected to
result in equipment or other damage.
Indicates information or content that is especially important to keep in mind when
operating the instrument or performing maintenance work.
Indicates a high-voltage hazard.
Warns that failure to verify safety or improper use of the instrument could lead to
electric shock, burns, or death.
Indicates an action that you must refrain from performing.
Indicates an action that you must perform.
Indicates that there is additional information below.
p.
[ ]
ON
Unless otherwise noted, the term “Windows” is used in this manual to refer to Windows XP, Windows Vista,
and Windows 7.
Indicates a reference page number.
Key names are enclosed in parentheses.
Text shown on the instrument’s screen is formatted in bold.
9
Page 16
Safety Information
Symbols displayed on the instrument
Indicates the need for caution or a hazard.
When this symbol is displayed on the
instrument, refer to the corresponding
section of the instruction manual.
Indicates the ground terminal.
Indicates AC (Alternating Current)
Indicates the power supply’s “on” and “off”
positions.
Symbols related to standards
Indicates the Waste Electrical and
Electronic Equipment Directive (WEEE
Directive) in EU member states.
Indicates that the product conforms to
regulations set out by the EC Directive.
Accuracy
We dene measurement tolerances in terms of f.s. (full scale), rdg. (reading) and dgt. (digit) values, with
the following meanings:
f.s.
rdg.
dgt.
(Maximum display value)
The maximum displayable value. This is usually the name of the currently selected range.
(Reading or displayed value)
The value currently being measured and indicated on the measuring instrument.
(Resolution)
The smallest displayable unit on a digital measuring instrument, i.e., the input value that causes
the digital display to show a “1” as the least-signicant digit.
Measurement categories
To ensure safe operation of measurement instruments, IEC 61010 establishes safety standards
for various electrical environments, categorized as CAT II to CAT IV, and called measurement categories.
DANGER
• Never use a measuring instrument whose measurement category is lower than the
location in which it will be used. Doing so may result in a serious accident.
• Never use a measuring instrument with no category labeling in a CAT II to CAT IV
measurement category. Doing so may result in a serious accident.
The PW6001 conforms to the safety requirements for CAT II (1000 V) and CAT III (600 V) measuring instruments.
CAT II: When directly measuring the electrical outlet receptacles of the primary electrical circuits in equipment
connected to an AC electrical outlet by a power cord (portable tools, household appliances, etc.)
CAT III: When measuring the primary electrical circuits of heavy equipment (xed installations) connected directly to
the distribution panel, and feeders from the distribution panel to outlets
CAT IV: When measuring the circuit from the service drop to the service entrance, and to the power meter and
primary overcurrent protection device (distribution panel)
Distribution panel
Service entrance
Service drop
CAT IV
Power meter
Internal wiring
CAT III
CAT II
T
Outlet
10
Fixed installation
Page 17
Operating Precautions
Operating Precautions
Please observe the following precautions to ensure that you can use the instrument safely and fully utilize
its functionality.
Checking the instrument before use
Before using the instrument, check the instrument for any damage that may have been sustained
while in storage or transit, inspect it, and verify that it is operating properly. If you discover any
malfunction or damage, contact your authorized Hioki distributor or reseller.
DANGER
Damage to voltage cords or the instrument may result in electric shock. Check
voltage cords for worm insulation and exposed metal before use. If you nd
damage, replace the cords with those specied by our company. Failure to do so
may result in electric shock.
WARNING
To prevent electric shock, verify that the white or red portion of the cable
(insulation layers) are not exposed. If any color is visible from the inside of the
cable, do not use the instrument.
Installation
Installing the instrument in inappropriate locations may cause a malfunction of instrument or may
give rise to an accident. Avoid the following locations.
WARNING
• Exposed to direct sunlight or high temperature
• Exposed to corrosive or combustible gases
• Exposed to water, oil, chemicals, or solvents
• Exposed to high humidity or condensation
• Exposed to a strong electromagnetic eld or electrostatic charge
• Exposed to high quantities of dust particles
• Near induction heating systems (such as high-frequency induction heating
systems and IH cooking equipment)
• Susceptible to vibration
CAUTION
• Do not place the instrument on an unstable bench or inclined surface. Doing so may
cause the instrument to fall off the surface or to fall over, resulting in bodily injury or
equipment damage.
• Do not use an uninterruptible power supply (UPS) or a DC-AC inverter that produces
rectangular waves or pseudo-sine-wave output to power the instrument. Doing so
may damage the instrument.
11
Page 18
Operating Precautions
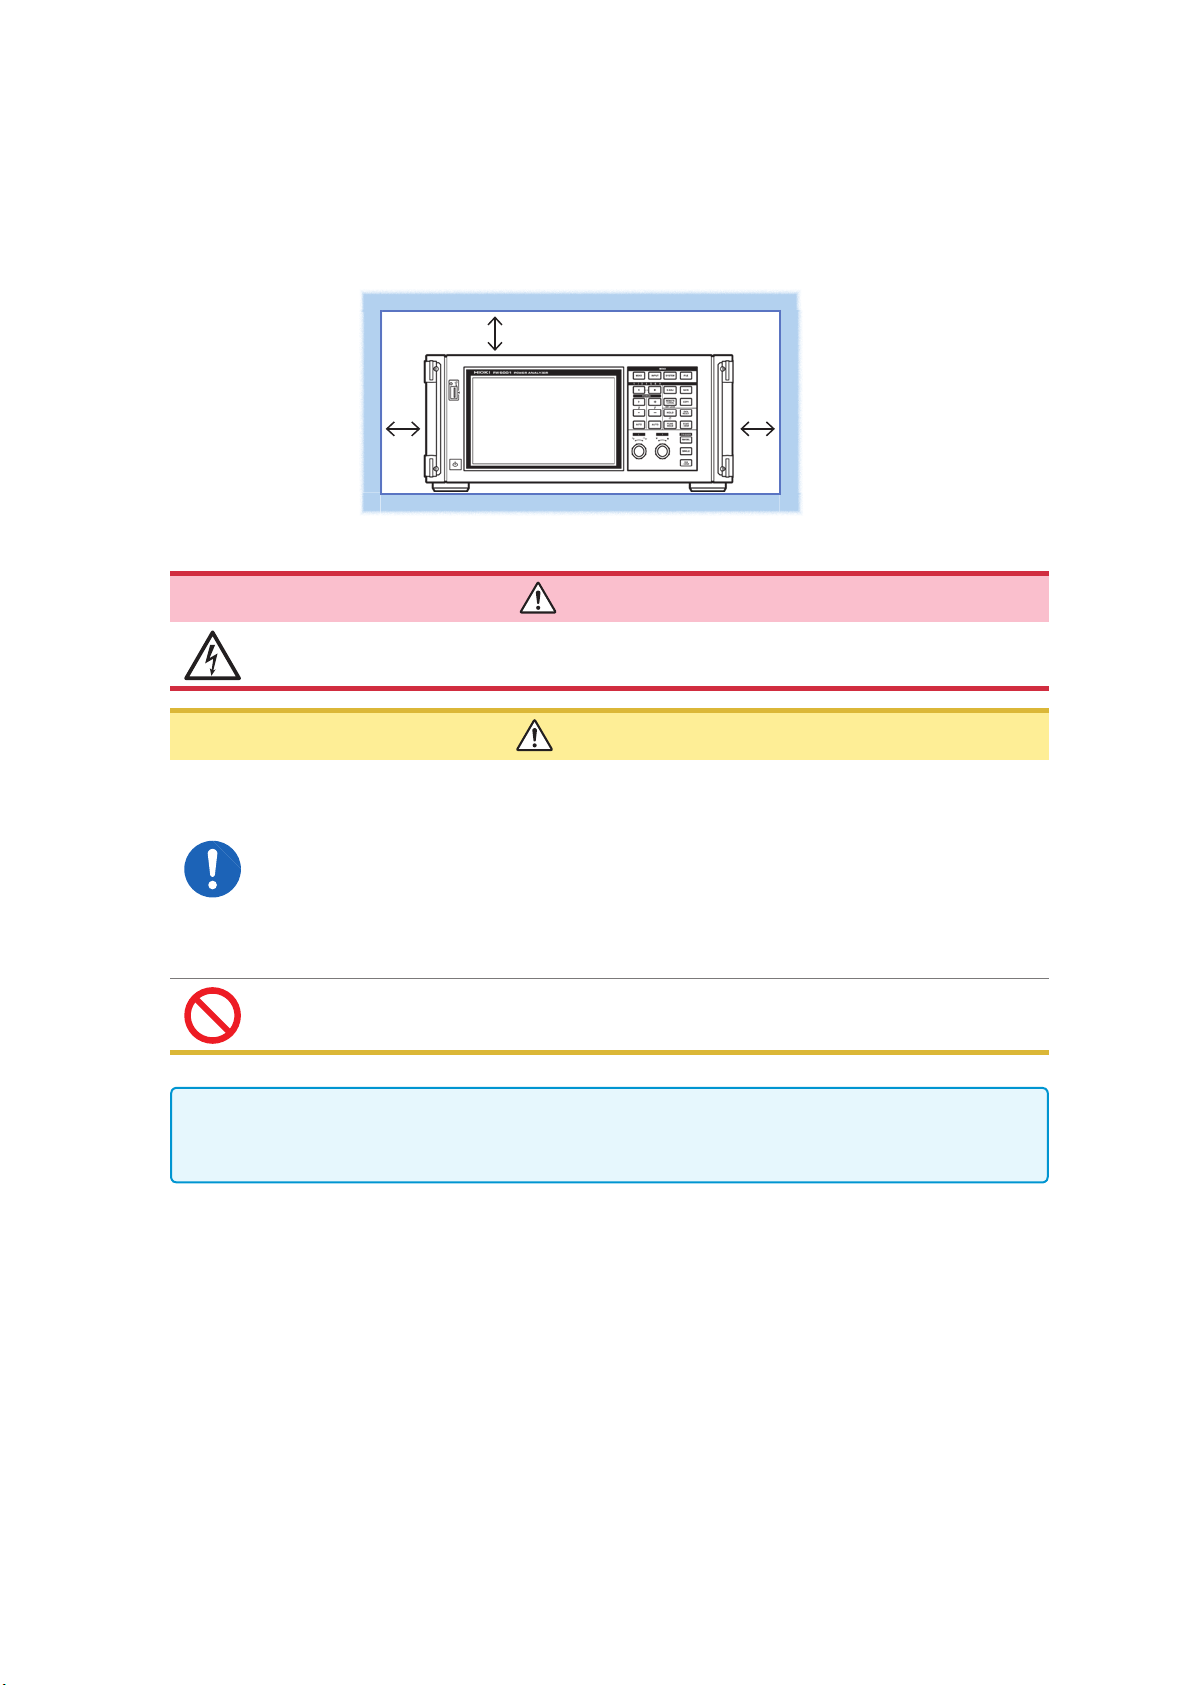
Instrument placement
• Place the instrument right-side up.
• Do not block the instrument’s air vents.
• Leave at least 20 mm between the instrument’s air vents and surrounding surfaces.
See “1.3 Part Names and Functions” (p. 19).
Handling of the instrument
At least 20 mm on all sides
DANGER
To prevent electric shock, never remove the instrument’s enclosure. There are
high-voltage and high-temperature parts inside the instrument.
CAUTION
• To prevent damage to the instrument, avoid exposing it to vibration or mechanical
shock when transporting or otherwise handling it. Exercise particular care not to drop
the instrument.
• If the instrument malfunctions or displays an error during use, consult
“12 Troubleshooting” (p. 255) and then contact your authorized Hioki distributor or
reseller.
• Carry the instrument using its handle after disconnecting all cords and removing the
USB ash drive.
• Do not press down on the touch panel with excessive force or use hard or sharp
objects to press down on the touch panel. Doing so may result in equipment damage.
This instrument may cause interference if used in residential areas. Such use must be avoided
unless the user takes special measures to reduce electromagnetic emissions to prevent
interference to the reception of radio and television broadcasts.
12
Page 19
Cord and current sensor handling
• Always connect voltage cords and current sensors to the secondary side of a
circuit breaker. The secondary side will be protected by the breaker in the event
of a short. Do not measure the primary side of a circuit breaker as it will carry a
larger current, increasing the amount of damage in the event of a short-circuit.
• When using the instrument, always use the designated power cord. Use of a
power cord other than the designated cord may result in re.
• Connect current sensors and voltage cords to the instrument before connecting
them to a live measurement line. Observe the following precautions to prevent
short-circuits and electric shock:
• Do not place the metal part of the tips of voltage cord clips across two
measurement lines at the same time. Never touch the metal part of the tips of
voltage cord clips.
• When a current sensor is in the open position, do not place the metal part
of its clamp tip across two measurement lines at the same time or use the
sensor on a bare conductor.
• Do not connect voltage cords unnecessarily.
Operating Precautions
DANGER
• To prevent short-circuit or bodily injury, use current sensors with circuits
whose voltage is less than or equal to the sensor’s maximum rated input-toground voltage. Do not use current sensors with bare conductors. (For more
information about a current sensor’s maximum rated input-to-ground voltage,
refer to its instruction manual.)
WARNING
• When using an AC/DC Current Sensor such as the CT6862, it is necessary to
cut the measurement line in order to route it through the sensor. To prevent
an electric shock or short-circuit, turn off all equipment before connecting the
sensor.
• To prevent an electric shock or short-circuit, use the designated voltage cords
to connect the measurement lines to the instrument’s voltage input terminals.
CAUTION
• To ensure safety, use only voltage cords designated by our company.
• To prevent a break in instrument wiring, grip the plug (not the cord) when unplugging
the power cord from an outlet or disconnecting it from the instrument.
• Exercise caution as conductors being measured may become hot.
• To avoid damaging cord insulation, do not step on cords or allow them to be pinched
between other objects.
• If a voltage cord melts, its metal conductor may be exposed. Do not use a cord whose
metal conductor is exposed. Doing so may result in electric shock, burns, or other
injury.
• Do not drop current sensors or subject them to mechanical shock. Doing so may
damage the core joint and adversely impact measurement. When disconnecting a
connector, always release the lock and then grip the connector to pull it out. Pulling
on connectors with excessive force before releasing the lock or pulling on cables will
cause damage to connectors. (p. 36)
• Do not connect or disconnect connectors while the instrument is on or while a sensor
is clamped to the conductor being measured. Doing so may damage the instrument or
current sensor.
13
Page 20
Operating Precautions
Handling of the L6000 Optical Connection Cable
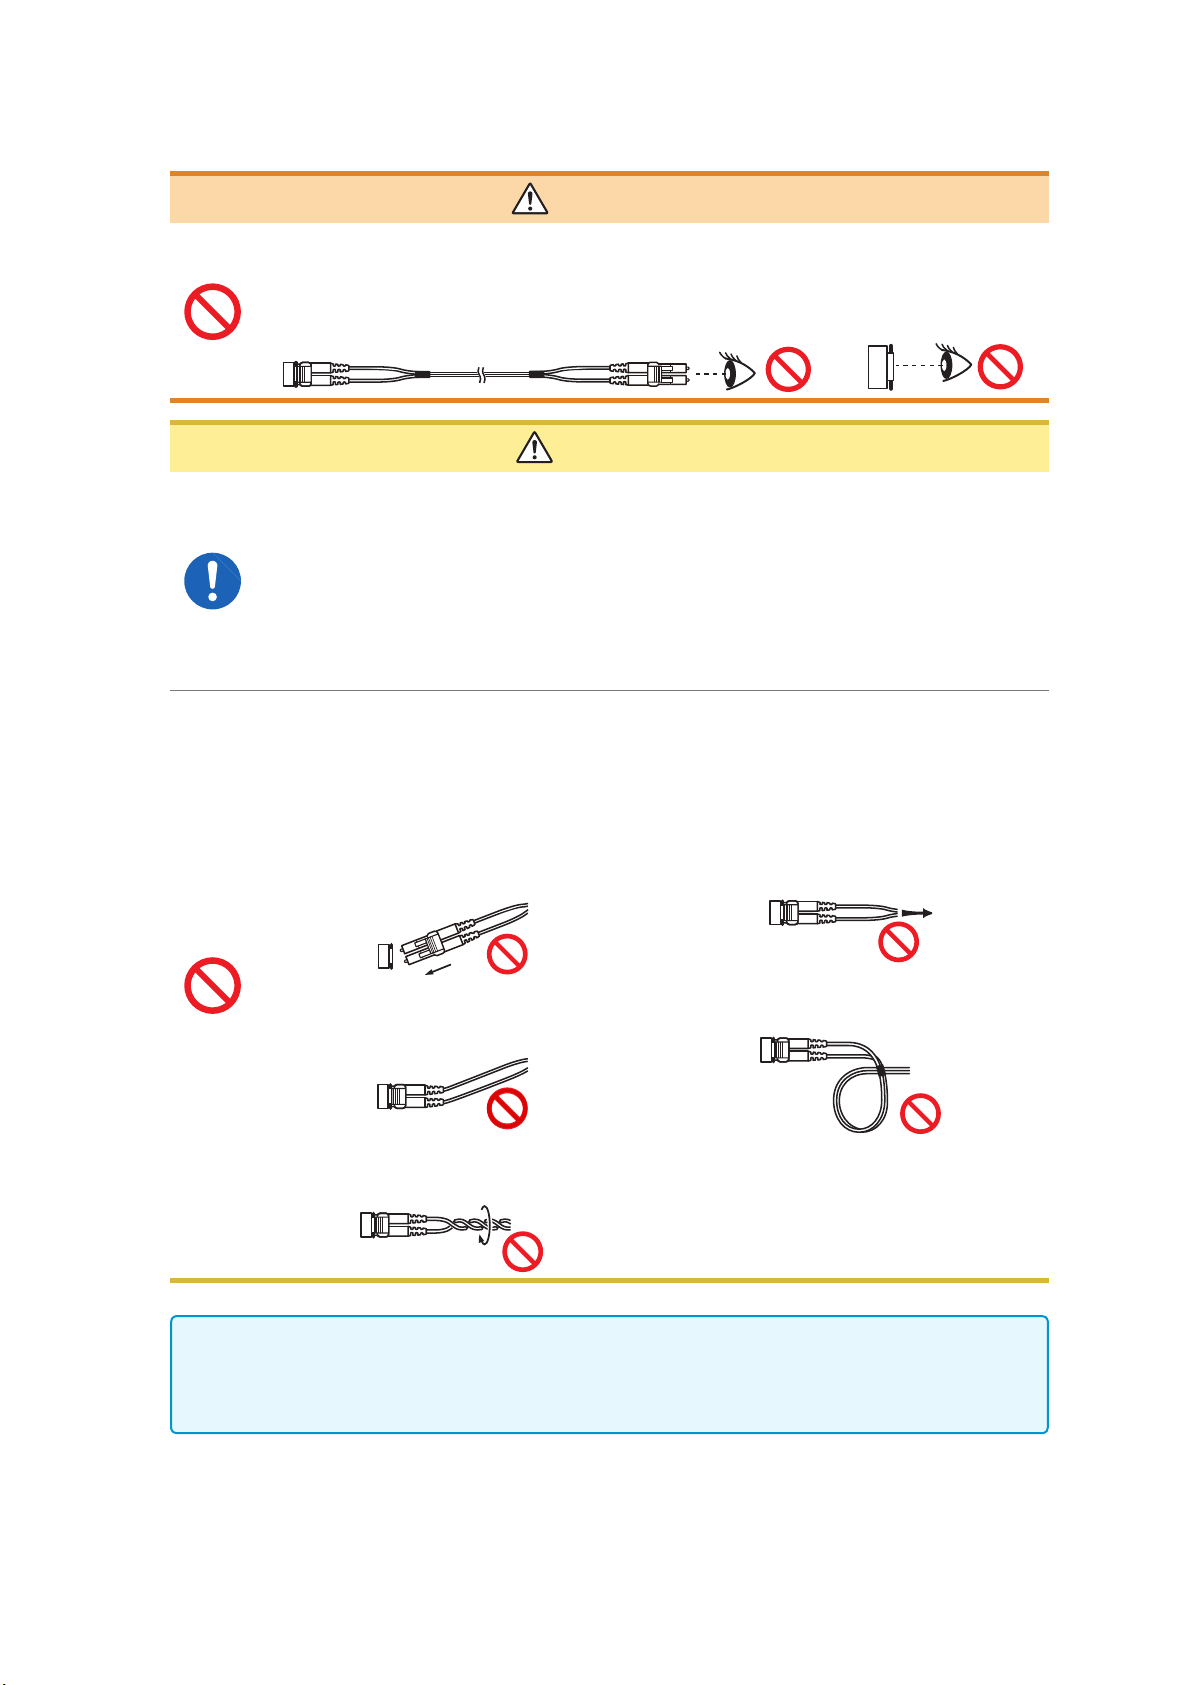
WARNING
When connecting an L6000 Optical Connection Cable that is already connected
to an operating optical output to the instrument, never look directly at the tip of
the cable or observe it with a device such as a magnifying glass. Doing so may
adversely affect your eyes or damage your vision.
CAUTION
• When connecting an L6000 Optical Connection Cable to the instrument, exercise care
to ensure that there is no dirt or dust in the optical connector. In particular, exercise
caution concerning the end face (ferrule). Accurate measurement may be impossible
if the cable is connected while there is dirt or other foreign matter on the face, or if the
face is scratched or otherwise damaged.
• The instrument’s two-instrument synchronization connector and the L6000 Optical
Connection Cable’s optical connector are precisely machined parts. When not in use,
always attach the included dust cap to each.
• When cleaning the center of an optical connector, do not apply excessive force to the
cleaning cloth. Doing so may damage the connector, preventing it from performing to
specications.
• To prevent damage to the L6000 Optical Connection Cable, observe the following
precautions:
• Do not insert the optical connector at an
angle.
• Do not bend the cable at the neck of the
optical connector.
• Do not bend or twist the cable. • Do not touch the end face (ferrule).
• Do not pull on the cable with excessive
force.
• Do not allow the cable to become kinked.
14
• Clean the optical connector end face (ferrule) of the L6000 Optical Connection Cable each time
it is connected.
• To clean the L6000 Optical Connection Cable’s optical connectors, use the 9738 Optical
Connector Cleaner.
Page 21
Before connecting the instrument
• Do not measure voltages that exceed the rating indicated on the instrument
labeling or the measurement range listed in the specications. Doing so may
result in damage to the instrument or bodily injury.
• The maximum rated input-to-ground voltages for the instrument’s voltage
inputs are as follows:
CAT II: 1000 V DC, 1000 V AC rms
CAT III: 600 V DC, 600 V AC rms
Do not measure a voltage in excess of these limits. Doing so may result in
damage to the instrument or bodily injury.
• The Probe1 and Probe2 terminals are not isolated. These input terminals are
provided for use with optional current sensors only. Connections of input other
than output from an optional current sensor may damage the instrument or
result in bodily injury.
• To avoid electric shock and instrument damage, do not input a voltage in
excess of the maximum input voltage to the instrument’s external input
terminals.
Operating Precautions
DANGER
• Before turning on the instrument, verify that the supply voltage being used is
the same as that noted on the instrument’s power inlet. Use of a voltage outside
the specied supply voltage range may result in damage to the instrument or
an electrical accident.
• To avoid an electric shock or short-circuit, verify that all connections have been
made securely. Loose terminals may result in increased contact resistance,
causing overheating, equipment burnout, or re.
• Connect voltage cords to input terminals securely. Loose terminals may result
in increased contact resistance, causing overheating, equipment burnout, or
re.
To ensure safety, always disconnect the power cord from the instrument and isolate the
instrument from the power supply completely when not in use.
Measurement precautions
WARNING
CAUTION
WARNING
If you notice smoke, an unusual sound, an unusual odor, or other anomaly,
halt measurement immediately, disconnect measurement lines, turn off the
instrument, unplug the power cord from the outlet, and disconnect the instrument
from the measurement target. Then contact your authorized Hioki distributor or
reseller. Continued use may result in re or electric shock.
15
Page 22

Operating Precautions
Precautions when transporting the instrument
CAUTION
• To transport the instrument safely, use the packing box and cushioning material in
which the product was shipped from Hioki. However, do not use the packing box if it is
torn or deformed, and do not use the cushioning material if it has been crushed. If you
are unable to use the packing box and cushioning materials in which the product was
shipped from Hioki, consult your authorized Hioki distributor or reseller.
• Be sure to disconnect any voltage cords and current sensors as well as power cords
from the instrument before packing it. When transporting, avoid dropping or other
excessive impact.
• Pack the instrument so that it will not be damaged during shipment and note the
nature of the malfunction. Damage occurred during transportation is not covered by
warranty.
16
Page 23

Product Overview
1
Overview
1.1 Product Overview
The PW6001 series of power analyzers comprises models with simultaneous measurement capabilities
for targets ranging from one 1-phase/2-wire circuit to two 3-phase/4-wire circuits, enabling them to
accommodate a variety of measurement lines. Variants offer from one to six channels.
For use in the development and evaluation of increasingly efcient inverter motors
• The PW6001 can perform high-precision, high-stability, wideband inverter power measurement that is highly
reproducible.
• The instrument can perform electrical angle measurement, which is a necessary part of motor analysis.
• When connected to a high-precision torque meter and encoder, the instrument can measure motor efciency.
For use in the development and evaluation of alternative energy technologies,
including solar power, wind power, and fuel cells
• The PW6001 can simultaneously measure AC power and DC power at a high level of precision and calculate
efciency.
• The instrument can measure power drawn from the grid, power sold to the grid, and power by consumption/
generation by means of DC mode and RMS mode current and power integration.
1
Overview
For use in the measurement of high-frequency power in wireless power feeds
and DC/DC converters
• The PW6001 can measure power at frequencies of up to 1 MHz.
• The instrument can measure and analyze harmonic distortion of switching waveforms at frequencies of up to
300 kHz.
1.2 Features
Simultaneous measurement of multiple circuits incorporating various types
of power lines (p. 41)
• For 3-phase/3-wire circuits, users can select a Hioki model 3193-compatible 3V3A connection or a Hioki
model 3390-compatible 3P3W3M connection in addition to the two-wattmeter method. The 3P3W3M
connection is particularly well suited to measuring power with inverter motors that have high-frequency leak current.
High accuracy and highly stable circuitry for high measurement reproducibility (p. 75)
The instrument delivers best-in-class basic accuracy and DC accuracy for active power and therefore provides
support for DC/AC conversion efciency with high-accuracy measurement performance.
High-bandwidth, high-speed opto-isolated sampling
• The PW6001 can measure increasingly high-speed switching waveforms accurately thanks to wideband
voltage and current input circuits (DC, 0.1 Hz to 2 MHz) and 5 MS/s, 18-bit high-speed, high-resolution
sampling capability.
• Thanks to its use of voltage inputs that use new optical devices to implement isolation with a high dielectric
strength, the instrument delivers a CMRR of 80 dB (at 100 kHz), enabling it to aggressively reject highfrequency common-mode noise when measuring inverters.
Support for a variety of current sensors (p. 36)
• In addition to conventional power measurement sensors, the PW6001 supports wideband current probes
designed for use with megahertz-order frequencies.
• The instrument ships standard with a power supply for 3270 series clamp-on probes.
17
Page 24

Features
New functionality to take full advantage of current sensor performance (p. 125)
The instrument’s phase compensation calculations can correct current sensor’s high-frequency phase
characteristics.
Complete six-channel + dual mode harmonic analysis function (p. 69)
The PW6001 supports simultaneous harmonic analysis for all channels. By performing simultaneous harmonic
analysis for multiple circuits with different frequencies, the instrument can perform simultaneous harmonic
analysis for both the primary and secondary sides of an inverter.
Waveform observation functionality on par with that of an oscilloscope (p. 93)
The PW6001 can record waveforms of up to 100 sec. in duration (10 kS/s sampling) or 10 sec. in duration (at
100 kS/S sampling) thanks to its large waveform storage memory (1 Mword × 6 voltage/current channels).
Standard USB ash drive support and large internal memory (p. 139)
• Thanks to its large, 64 MB internal memory capacity, the PW6001 can continuously record data for numerous
parameters even when using a high-speed interval.
• Data can be saved directly on a USB ash drive, screens can be copied to a USB ash drive, and data can
be copied from the internal memory to a USB ash drive.
Easy-to-understand touch panel and key operation (p. 19)
• The PW6001 can be controlled using either dedicated hardware keys or an easy-to-understand touch panel.
• Comments can be entered on the touch panel when saving screen copies and measurement data.
Robust motor analysis functionality (option) (p. 182)
• When fed output from a torque meter and tachometer, the PW6001 can measure motor power and motor
efciency.
• The instrument supports A-phase/B-phase pulse output from a rotary encoder as rotation input and can
detect the direction of rotation.
• It also supports Z-phase output from the encoder and can measure the motor’s electrical angle.
• A single PW6001 can simultaneously accept two sets of torque and RPM input, leveraging its six channels of
input to allow simultaneous analysis of two motors.
• The instrument can simultaneously display either the torque waveform or the encoder pulse waveform along
with voltage and current waveforms.
• Since all inputs are functionally isolated, they can be used for two-channel voltage measurement at up to
±10 V or pulse waveform measurement across four channels at up to 1 MHz.
High-speed D/A output with waveform capability (option) (p. 173)
The PW6001 incorporates 20 channels of D/A output, enabling it to generate analog output for 20 userselected measurement parameters.
• When using waveform output mode, voltage and current waveforms for the number of channels with which
the instrument is equipped are output in order at 1 MS/s and 16 bits. Safe, isolated voltage and current
waveforms can be input to another waveform measuring instrument for analysis.
High-performance remote synchronization function using optical ber (p. 169)
• Optical ber can be connected to the synchronization interface to enable synchronized measurement at
multiple locations with different instrument power supply potentials.
• Up to two instruments separated by up to 500 m can be synchronized to perform measurement.
Dedicated communications application software (downloadable from Hioki’s
website) (p. 189)
• A dedicated PC application that can control the instrument remotely, acquire data in real time, and display it
on the screen can be downloaded free of charge from our website.
• The following communications interfaces are supported: LAN, GP-IB, RS-232C.
18
Page 25
1.3 Part Names and Functions
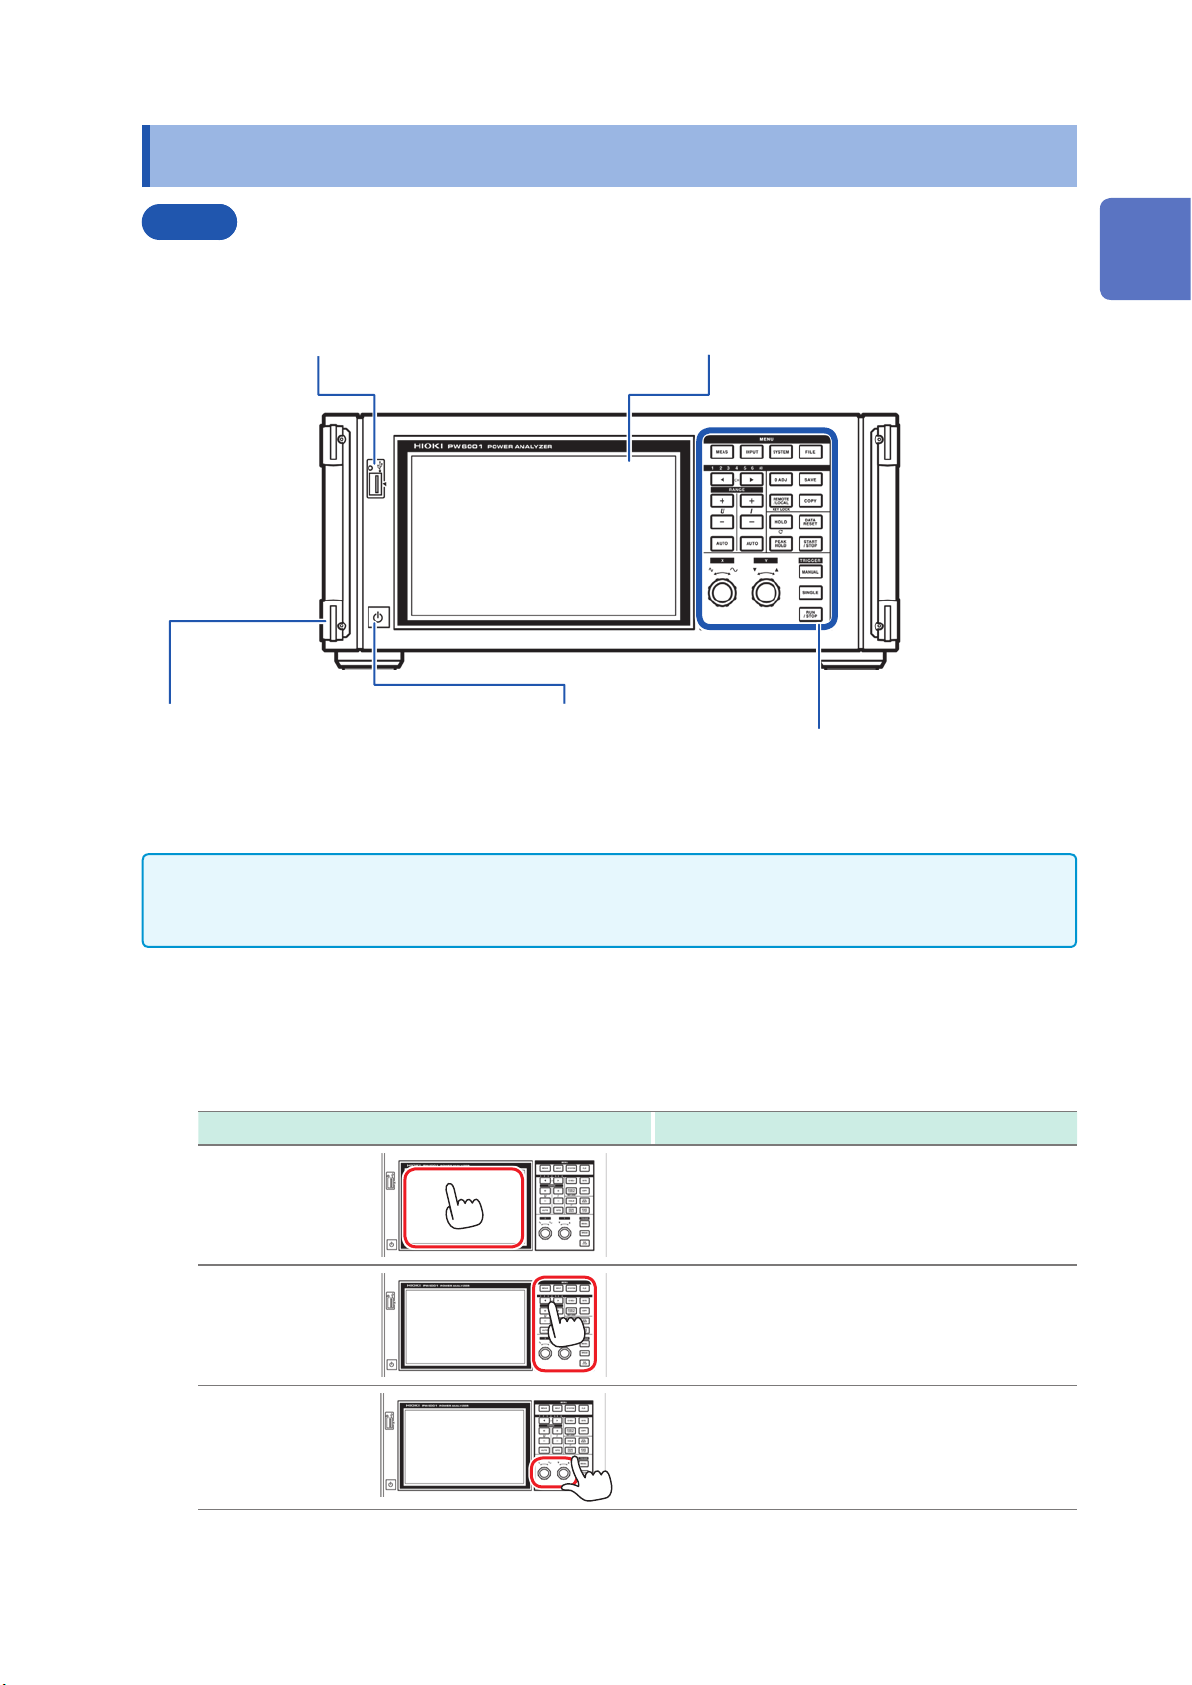
Front
Part Names and Functions
USB ash drive interface (p. 139)
Connect a USB ash drive to save measurement data,
settings, screenshots, and other data. This interface does
not support use of a mouse, keyboard, or other device.
Handle
Use the handle to carry the
instrument.
Power switch (p. 40)
Turn the instrument on and off.
Display
Touch the touch panel to display measured values and
change settings.
Control area (p. 20)
1
Overview
• Both key operation and touch panel operation are completely disabled while the key lock function is
active, with the exception of key operation used to cancel the key lock state (p. 21).
• The key lock state will persist even if the instrument’s power is cycled.
Instrument operation
The instrument is controlled by means of the MENU keys and rotary knobs in the control area and
the display’s touch panel.
Operation Description
Touch
Press
Turn
Touch the touch panel.
Press a control key.
Turn a rotary knob.
19
Page 26
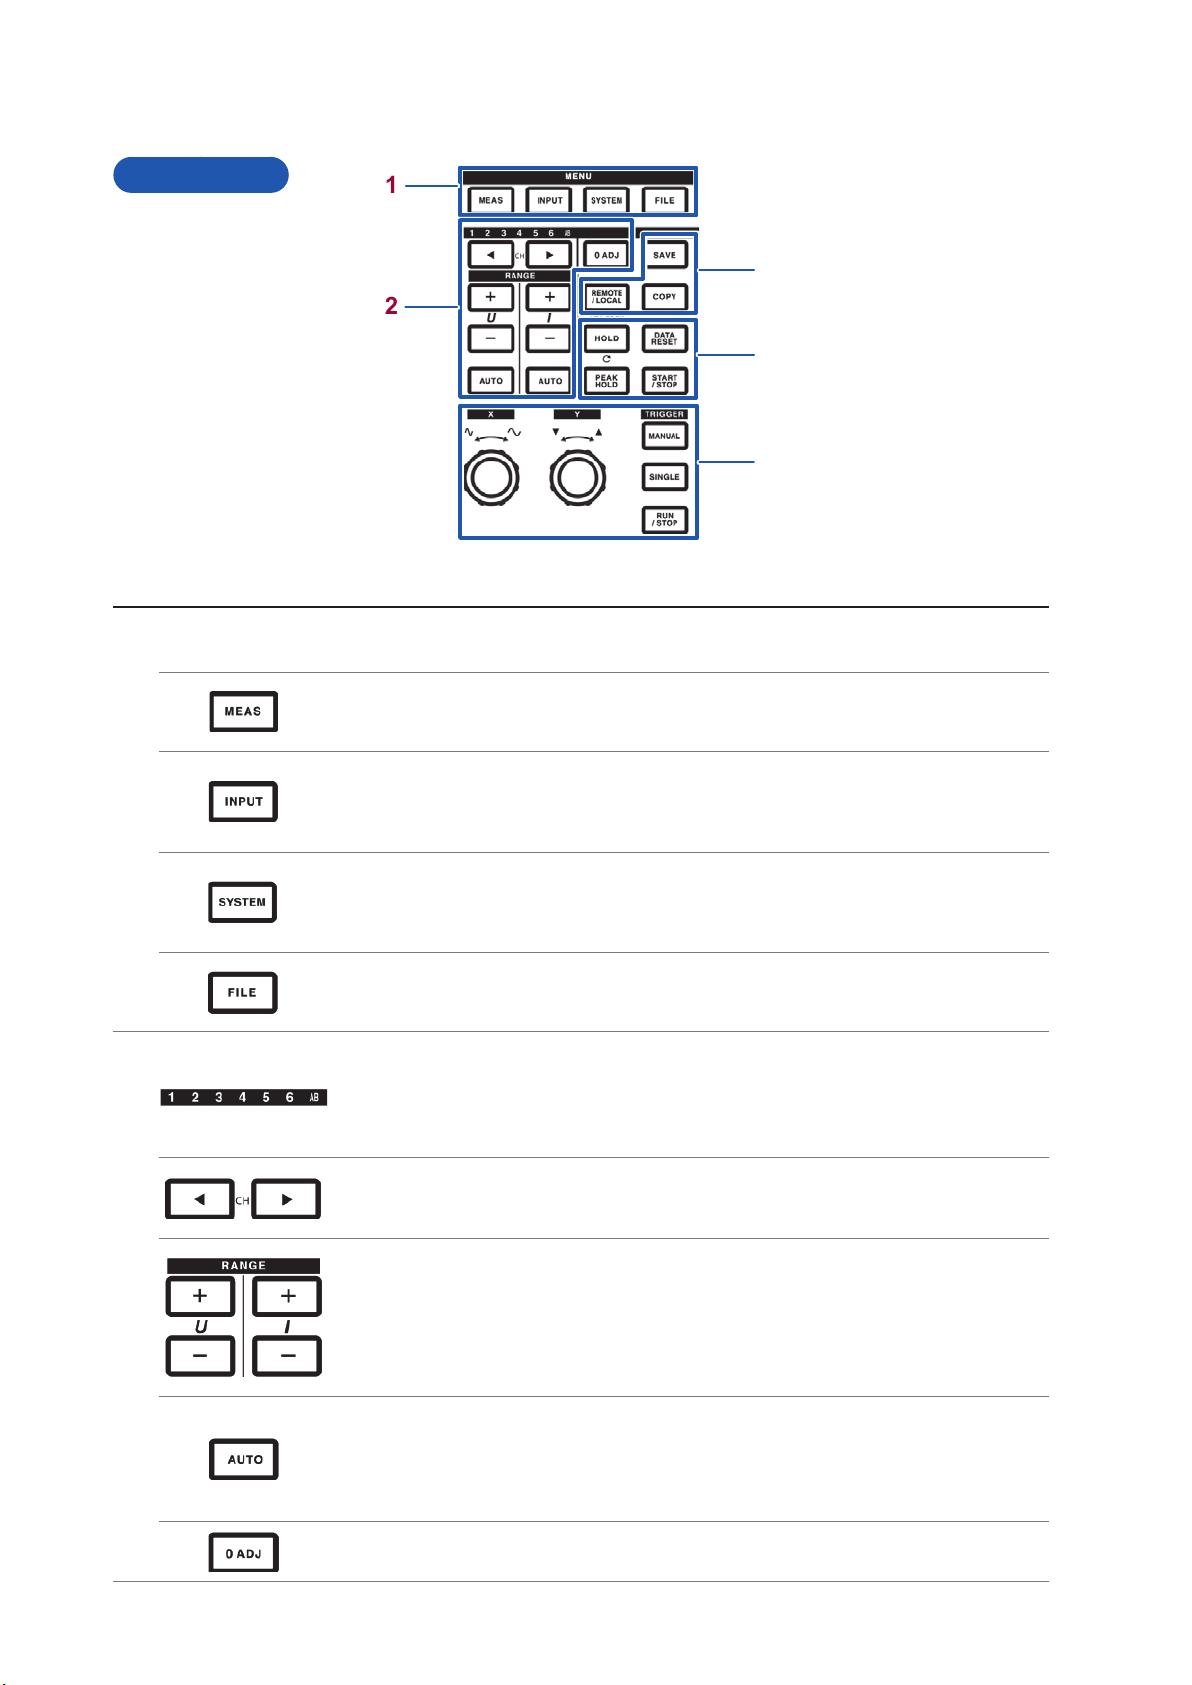
Part Names and Functions
Control area
1
3
2
4
5
MENU keys (switching screens)
1
Pressing a key causes the selected key to light up and the screen to change to the selected screen.
[MEAS] key (p. 30)
Displays the Measurement screen.
The Measurement screen is used to display measured values and waveforms.
[INPUT] key (p. 31)
Displays the Input Settings screen.
The Input Settings screen is used to congure settings related to input, connections, measurement,
and calculations.
[SYSTEM] key (p. 135)
Displays the System Settings screen.
The System Settings screen is used to congure settings related to time control, interfaces, and
overall instrument parameters.
[FILE] key (p. 139)
Displays the File Operations screen.
The File Operations screen is used to manipulate les.
2
Channel indicator LED
• Lights up to indicate the input channel to which the [RANGE] key and setting indicators apply.
• Channels that have been grouped into a connection based on connection settings will light up at
the same time.
• The AB LED corresponds to CH A and CH B on motor analysis and D/A-equipped models.
[CH] keys
• Used to switch the channel whose channel indicator LED is lit up.
• Used to switch the channel on the Basic Settings screen and Harmonic screen.
[RANGE] keys
• The U [+/-] keys change the voltage range, while the I [+/-] keys change the current range.
• Changes apply to the channel whose channel indicator LED is lit up.
• When the AB LED is lit up, the U buttons apply to CH A analog input, while the I buttons apply to
CH B analog input.
• When the [AUTO] key is lit up, AUTO range operation is canceled when the range is changed.
20
[AUTO] keys
• The U [AUTO] key enables the AUTO range function for voltage, while the I [AUTO] key enables
the AUTO range function for current. The key will light up. It will go out if pressed again, and the
range will be xed to the current setting at that time.
• Changes apply to the channel whose channel indicator LED is lit up.
[0ADJ] key (p. 43)
Performs zero adjustment for the input channel.
Page 27
Part Names and Functions
3
Measurement control keys
4
The measurement control keys function primarily to control power measurement functions. They do not affect the waveform
display.
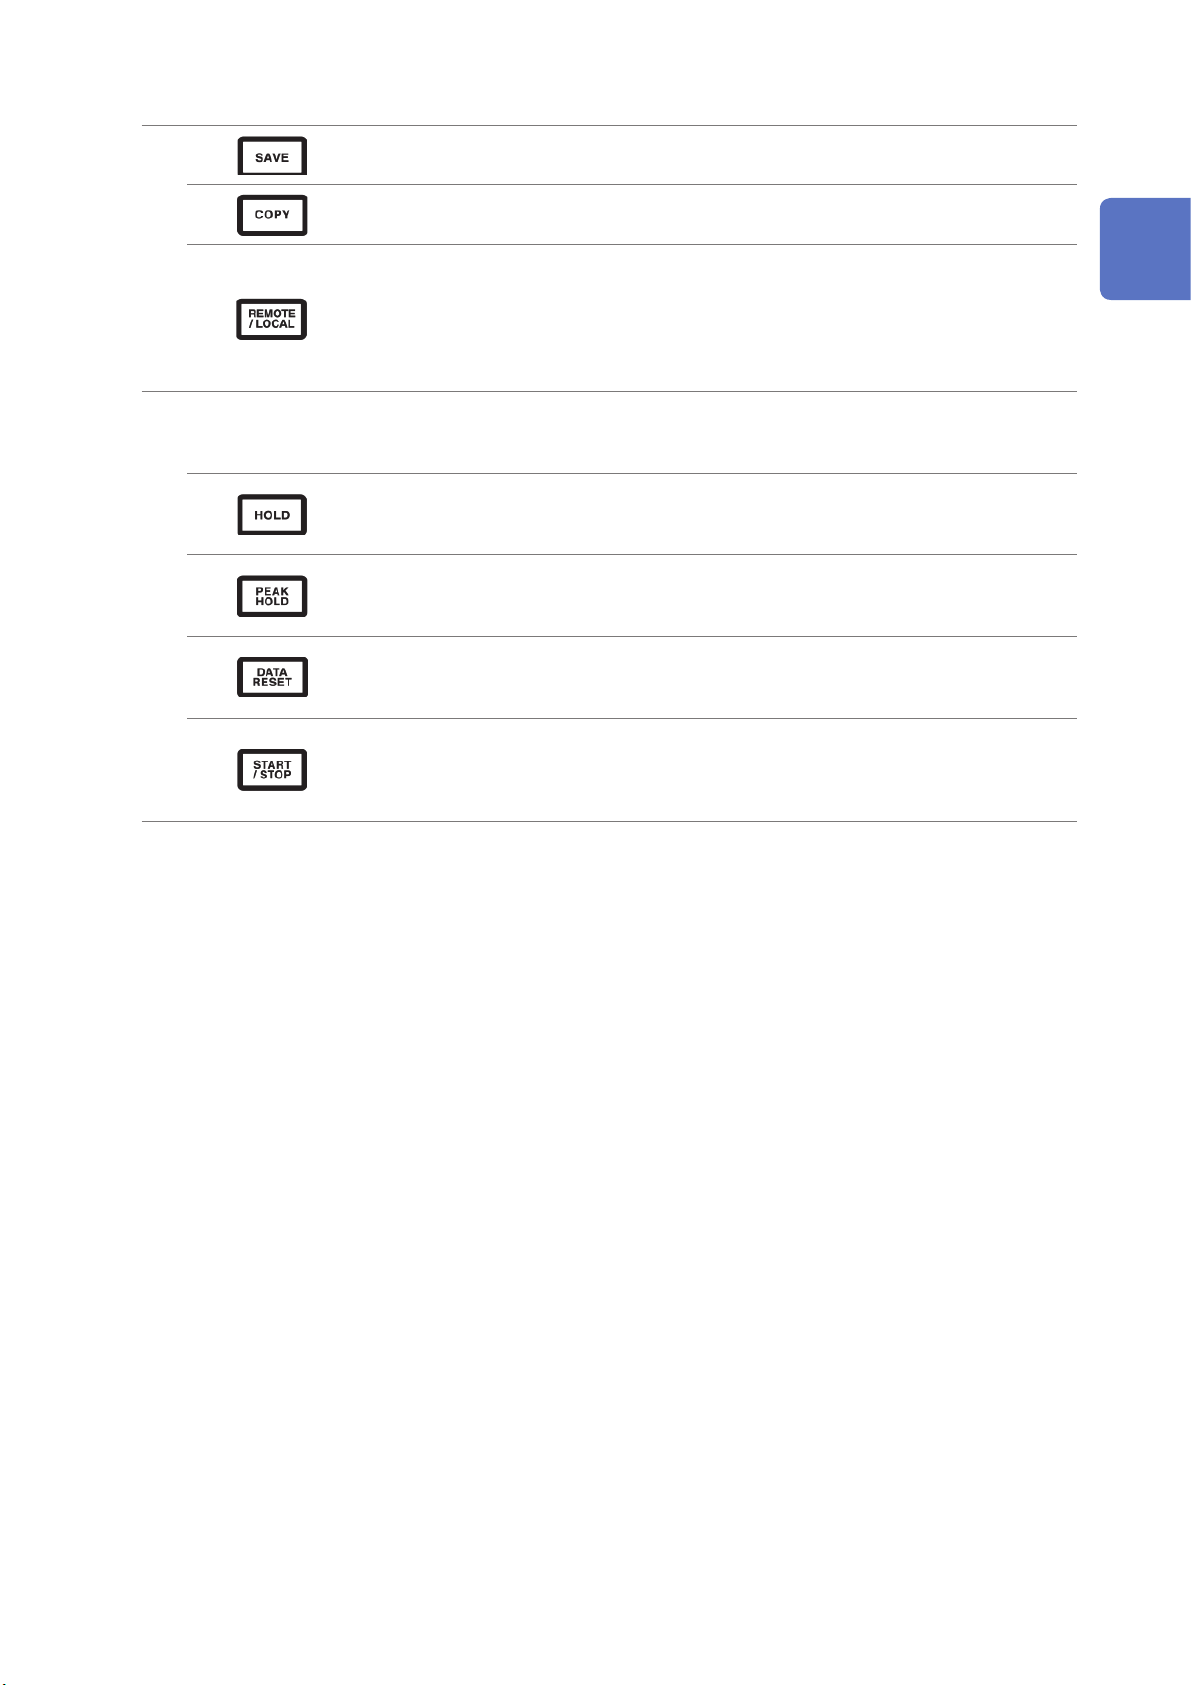
[SAVE] key
Saves the measurement data at the time the key is pressed to the USB ash drive.
[COPY] key
Saves a screenshot of the screen at the time the key is pressed to the USB ash drive.
[REMOTE/LOCAL] key (key lock)
• Lights up when in the remote state for GP-IB communications. Pressing the key again will return
to the local state, causing the light to turn off.
• Pressing and holding the key for 3 sec. or more will enable the key lock function, causing the key
lock icon to be displayed on the screen. Pressing and holding the key again for 3 sec. or more will
cancel the key lock, causing the light to turn off.
[HOLD] key
• Toggles the hold function on and off. The key lights up when the hold function is on.
• Pressing the [HOLD] key while the peak hold function is on will clear the peak hold data.
[PEAK HOLD] key
• Toggles the peak hold function on and off. The key lights up when the peak hold function is on.
• Pressing the [PEAK HOLD] key while the hold function is on will update the hold data.
[DATA RESET] key
• Resets integration data.
• The key functions while the [START/STOP] key is lit up (red).
1
Overview
[START/STOP] key
• Controls starting and stopping of the integration and automatic save functions.
• It lights up when operation starts (green) and when operation stops (red).
• It turns off when the [DATA RESET] key is pressed.
21
Page 28
Part Names and Functions
Waveform control keys (rotary knobs)
5
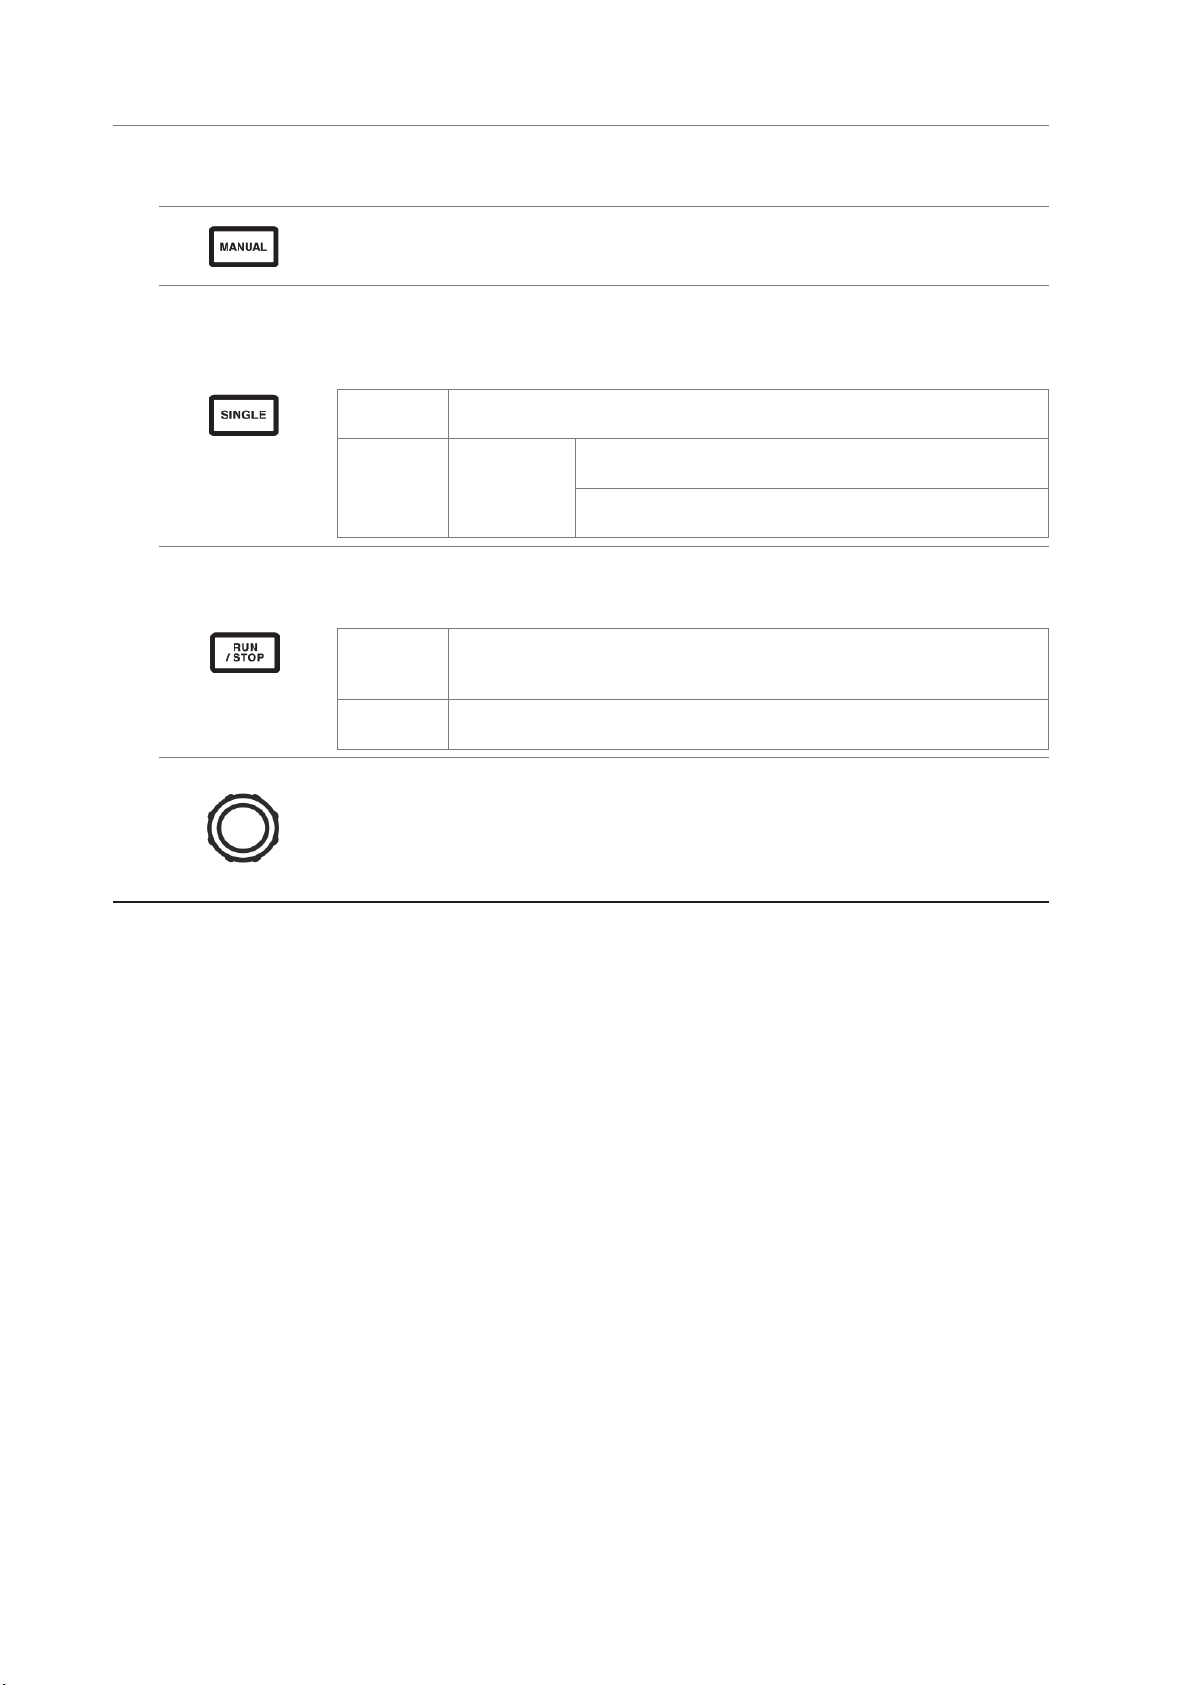
The waveform control keys function primarily to control waveform capture. They operate independently of the instrument’s
power measurement functionality.
[MANUAL] key (manual trigger function)
• Forcibly applies a trigger while waiting for a trigger.
• The trigger is applied when the key is pressed, causing recording to start.
[SINGLE] key
• Performs one waveform capture.
• The key lights up (green) when pressed. Once the trigger is applied and the waveform captured, it
turns off.
Lit up (green)
Off
The instrument is waiting for a trigger.
Recording will start when the trigger is applied.
Recording will stop once data has been recorded for the
[RUN/STOP]:
Lit up (red)
recording length.
Pressing [RUN/STOP] while the instrument is waiting for a trigger
will cause recording to stop.
[RUN/STOP] key
• Causes waveform to be recorded continuously.
• The key lights up (turns green) when pressed and then turns red when pressed again.
Lit up
(green)
Lit up
(red)
The instrument enters the trigger standby state.
Recording will start when the trigger is applied.
The instrument will repeatedly wait for a trigger.
Recording will stop.
Rotary knobs
• The rotary knobs function primarily to zoom waveforms in or out and to change the position or
cursor.
• They are also used with certain settings to vary (increase/decrease) values.
• Each knob operates as appropriate when turned or pressed while lit up but does nothing if the
light is off.
22
Page 29
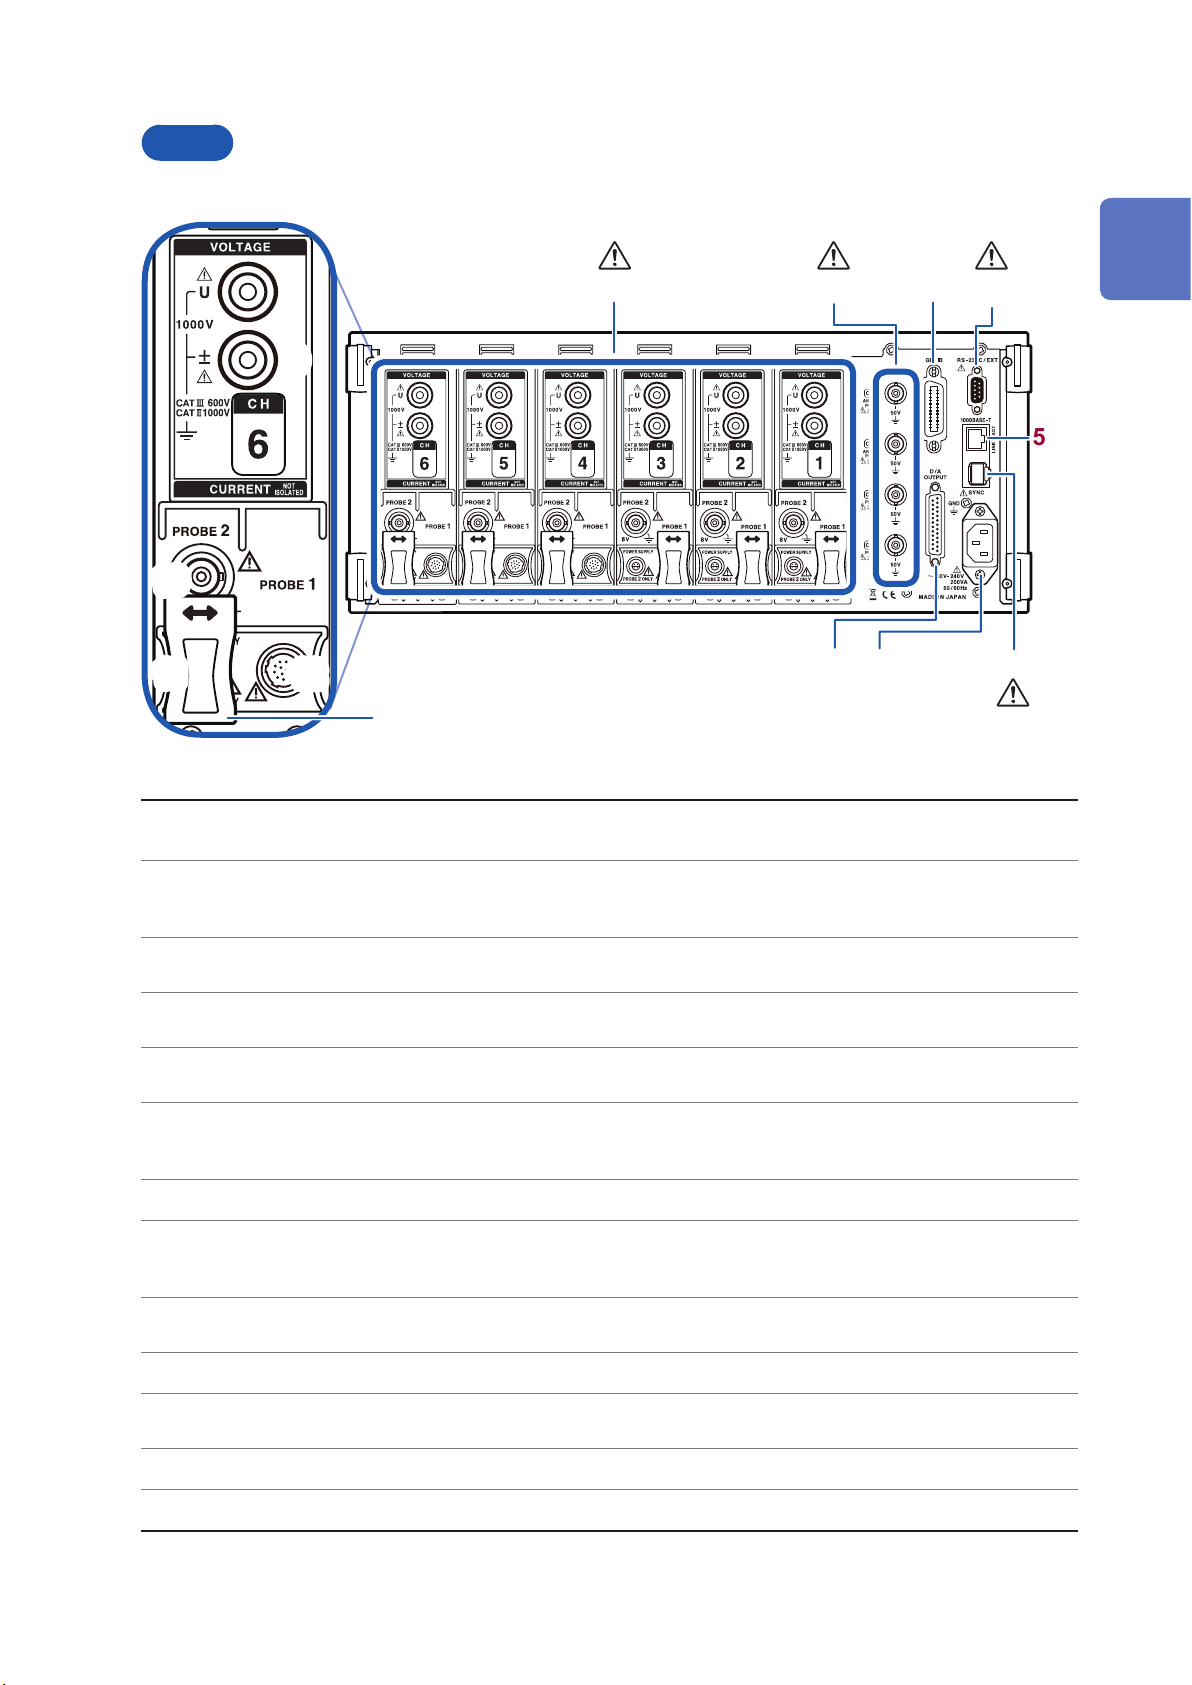
Back
10
Part Names and Functions
(p. 13) ,
(p. 15)
(p. 201)(p. 13)
1
1 2
9
3 4
Overview
5
11
12
13
Input channels 1 through 6
1
Motor input (external
2
input) channels (p. 80)
GP-IB connector (p. 198)
3
D-sub 9-pin connector
4
(p. 201)
LAN connector (p. 190)
5
Two-instrument
synchronization connector
6
(p. 169)
Power inlet (p. 35) Connect the included power cord.
7
D/A output connector
8
(p. 173)
Voltage input terminal
9
(p. 35)
Insert up to six channels in the form of units that accept input of voltage and current for one
phase of power.
(Motor analysis and D/A-equipped models only)
• Measure motor efciency.
• Input torque sensor and tachometer output to measure motor output.
• Control the instrument remotely using GP-IB.
• Transfer data to a computer.
• Control the instrument remotely from a computer or controller via serial RS-232C communications.
• Control starting and stopping of integration with a contact switch.
• Control the instrument remotely over a LAN.
• Acquire data.
Perform measurements using two synchronized instruments.
(Motor analysis and D/A-equipped models only)
• Input the instrument’s output into a recorder to record data over an extended period of time.
• Input to an oscilloscope to observe the waveform.
Connect a Hioki-designated voltage cord.
8
7
6
p.14
Probe2 terminal (p. 38) Connect a Hioki 3270 series current probe for wideband current measurement.
10
Probe2 power supply
11
terminal (p. 38)
Probe1 terminal (p. 37) Connect a CT6800 series current sensor for high-precision current measurement.
12
Sliding cover Slide open the cover to select the current sensor being used.
13
Connect a 3270 series current probe.
23
Page 30
Part Names and Functions
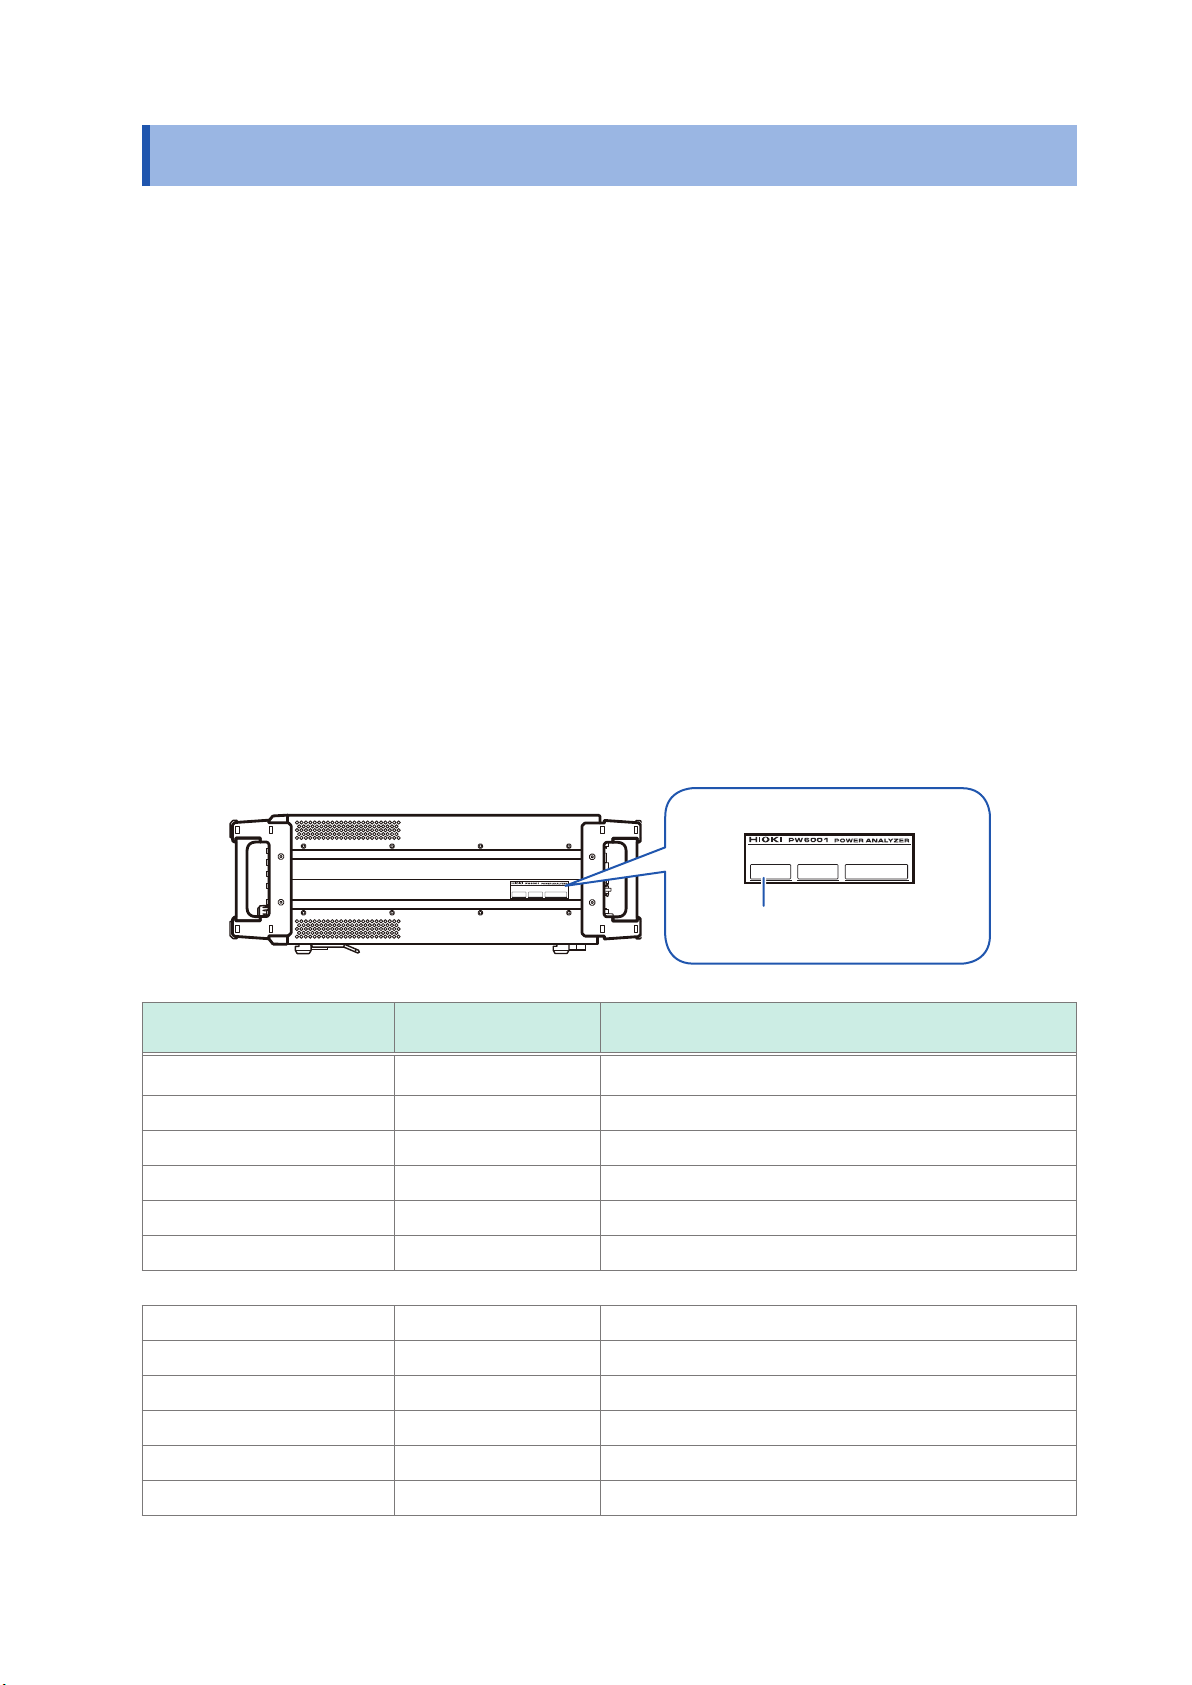
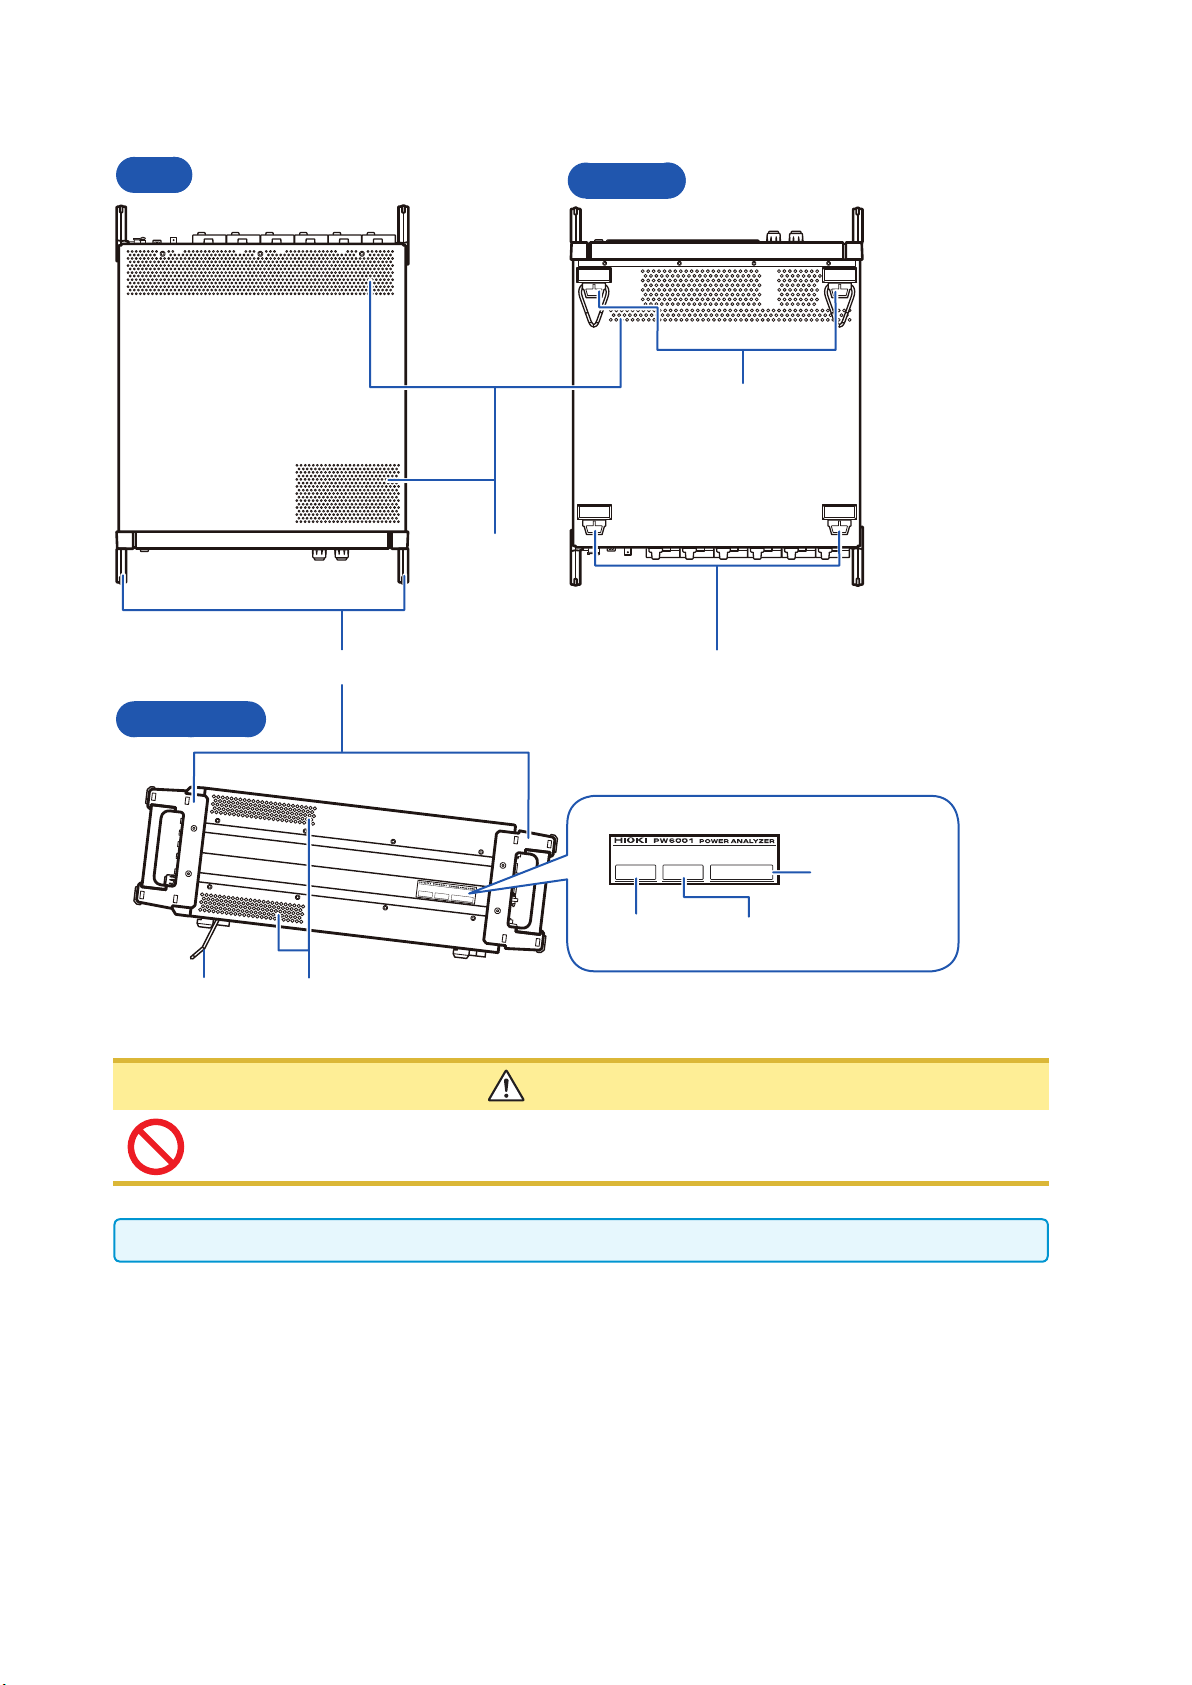
Top
Right side
Handles
Bottom
Support legs
(With stand)
Air vents
Support legs
Serial number
Model number MAC address
Stand
Air vents
CAUTION
Do not subject the instrument to excessive force from above while using the stand. Doing so
may damage the stand.
Leave at least 20 mm between the instrument’s air vents and surrounding surfaces.
24
Page 31
Basic Operation (Screen Display and Layout)
1.4 Basic Operation (Screen Display and Layout)
Screen Operation
Switching screens (p. 30)
1
Selecting the display screen
2
Touch the display icons to switch
screens. The icon for the currently
selected screen is shown with a blue
background.
1
Overview
Changing display contents and settings
3
Touch active areas of the screen to control it.
Settings that cannot be changed will be grayed out.
(They cannnot be touched.)
Touching the display icon for the Measurement
screen (MEAS) causes multiple display icons
to be shown to its left.
25
Page 32

Basic Operation (Screen Display and Layout)
Screen Description
Touch [+] to display a list of
options.
ON/OFF
Touch the button to toggle it between the “on” and “off”
states.
Combo box
Touch an option to select it. Touching outside the list of
options will close the list without changing the setting.
Touch this area to display the
window shown below.
Window (p. 27)
• While the window is being displayed, the control area and
touch panel keys outside the window may be temporarily
disabled.
• Once you have nished conguring the settings as desired,
touch [x] to close the window.
There are three types of window:
• Parameter selection windows (p. 50)
• Keyboard windows
• Numeric keypad windows
Changing values with rotary knobs
Touch the screen. When the edge of one of the instrument’s
rotary knobs lights up, you can turn that knob to change the
value or manipulate the waveform.
“Instrument operation” (p. 19)
26
Page 33

Keyboard windows
Screen Description
Esc Cancels text entry and closes the window.
Clr Clears all entered text.
A/a Toggles between uppercase and lowercase keyboards.
(123) Switches among letters, numbers, and symbols.
BS Deletes the character before the cursor position.
Del Deletes the character at the cursor position.
Ent Accepts the entered text and closes the window.
← → Moves the cursor position left and right.
Basic Operation (Screen Display and Layout)
Enter comments, units, and folder names using the keyboard.
While this window is open, you can only touch inside the
window.
1
Overview
Numeric keypad windows
Screen Description
Esc Cancels text entry and closes the window.
Clr Clears all entered text.
BS Deletes the number before the cursor position.
Del Deletes the number at the cursor position.
Ent Accepts the entered numbers and closes the window.
← → Moves the cursor position left and right.
+/- This button is displayed when a sign can be entered.
T, G, M, k,
_, m, u, n
These buttons are displayed when a prex such as k (kilo) or M (mega) can be entered. Choosing [ _ ]
will clear the prex. These buttons are displayed when a prex cannot be entered.
Enter numerical values.
While this window is open, you can only touch inside the
window.
27
Page 34

Basic Operation (Screen Display and Layout)
Common Screen Display
The following is an example screen. Actual screens vary depending on the instrument’s settings.
This section describes the screen elements that are shown on all screens.
1 432 5
meas_indicator.bmp
Time display Displays the time (year, month, date, hours, minutes, seconds).
1
Displays the synchronization state and range-/peak-over state for each input
channel.
1 In the example to the left, CH2 is in the synchronization unlocked state.
Channel(s) with which instrument is
not equipped
Channel(s) in the synchronization
unlocked state
Red Peak-over
Warning indicators
2
CH1 to CH6 Input channels Gray
Mot Motor input channels Yellow
2 In the lower portion of the display, the range-/peak-over state for [U] and [I] or
1
2
[A] and [B] is shown for each channel.
U Voltage input A CH A analog DC input Gray
I Current input B CH B analog DC input Yellow Range-over
Normal
measurement
In the above example, CH1 current input is in the range-over state, while CH3
voltage input is in the peak-over state.
Setting indicators See “Measurement Screen Display” (p. 29)
3
Operating state indicators
Lights up when in the hold state.
4
Lights up when in the peak hold state. Lights up when in the key lock state.
Lights up when serving as the master during
two-instrument synchronization operation.
Lights up when serving as the slave during twoinstrument synchronization operation.
Media indicators
5
Displays usage of the internal memory and USB ash drive using level meters. The
indicators will turn red when utilization reaches 95%.
Indicates the integration function’s operating
state.
Yellow: Standby
Green: Integration in progress
Red: Integration stopped
Lights up when connected to a network via
the LAN interface.
28
Page 35

Basic Operation (Screen Display and Layout)
Measurement Screen Display
The following is an example screen. Actual screens vary depending on the instrument’s settings.
This section describes screen displays that are shown only on the Measurement screen. This area
provides what are known as setting indicators.
1
1
2 3 4 5 6
7 8 9 10 1211
Combined channels Displays channels that have been combined as part of the same connection.
1
Synchronization
2
source
Auto-range operation
3
Scaling Shown when the VT ratio and CT ratio have been set.
4
Measurement upper
limit and lower limit
5
frequencies
Displays the setting for the source that determines the period (zero-cross) that
serves as the basis for measurement.
Auto Auto-range function on
Manu Auto-range function off
The top row indicates the voltage setting, while the bottom row indicates the current
setting.
Upper Measurement upper limit frequency setting
Lower Measurement lower limit frequency setting
Overview
Data update rate Displays the data update rate setting.
6
Connection mode
7
Current sensor
8
connection terminals
Delta conversion
9
setting
LPF Displays the low-pass lter setting.
10
Range
11
Averaging
12
Displays the set connection mode. Sets the method for combining channels in a
connection pattern and the connection mode according to the measurement lines.
1 When Probe1 is selected as the current sensor
2 When Probe2 is selected as the current sensor
Displays the operating state of the delta conversion function.
∆ Delta conversion on
No display Delta conversion off
Displays the set range. The top number indicates the voltage range, while the
bottom number indicates the current range.
Displays the averaging setting.
Add Simple averaging
Exp Exponential averaging
No display Off
29
Page 36

Screen Layouts
Measurement screen (displayed with [MEAS] key)
VALUE
Measured Value
screen
WAVE
Waveform
screen
VECTOR
Vector screen
HRM
Harmonic screen
BASIC
Basic display
CUSTOM
Selection display
WAVE
Waveform display
WAVE + ZOOM
Waveform + zoom
display
WAVE + VALUE
Waveform +
measured value
display
WAVE + FFT
Waveform + FFT
analysis
VECTOR 1
1 vector
VECTOR 2
2 vector
LIST
List display
BAR GRAPH
Graph display
Displays power measured values for each channel and
motor input measured values for each connection.
Displays measured values for user-selected basic
measurement parameters.
Displays voltage, current, and motor input waveforms.
Displays an enlarged view of the waveform.
Displays numerical measured values for 12 parameters
together with waveforms.
Performs FFT analysis based on the waveform and
displays the analysis results.
Displays the user-selected order component of a harmonic
measured value as a numerical value and vector.
Displays vectors for two user-selected connections.
Displays the user-selected harmonic measurement
parameter as a list of values.
Displays harmonic data for the user-selected channel as
bar graphs for voltage, current, and active power.
PLOT
Plot screen
D/A MONITOR
D/A monitor display
X-Y PLOT
X-Y Plot display
Displays the selected D/A output parameters as a graph
and as values.
Creates and displays a total of two XY graphs for the four
selected parameters.
30
Page 37

Input screen (displayed with the [INPUT] key)
WIRING
Connection settings
CHANNEL
Channel-specic settings
COMMON
Common input settings
EFFICIENCY
Efciency calculation
settings
UDF
User-dened calculation
settings
MOTOR
Motor input settings
Allows the user to set the connection pattern that determines how input
channels will be combined based on the measurement lines.
Allows the user to set detailed measurement conditions for each
connection selected based on the connection pattern.
Allows the user to set measurement conditions that are used by (that
apply to) all channels.
Allows the user to set the formula to use to calculate efciency.
Allows you to set a calculation formula combining measured values from
the instrument along with values and functions.
Allows the user to congure motor input.
1
System Settings screen (displayed with the [SYSTEM] key)
CONFIG
System settings
TIME CTRL
Time control settings
DATA SAVE
Data save settings
COM
Communications settings
OUTPUT
D/A output settings
Allows the user to review and congure the system environment.
Allows the user to congure time control.
Allows the user to congure how data is saved on the USB ash drive
and in the instrument’s internal memory.
Allows the user to congure the communications interface.
Allows the user to congure settings related to D/A output.
File Operations screen (displayed with the [FILE] key)
The File Operations screen is used to manipulate les on the USB ash drive and to save and load settings les.
31
Page 38

32
Page 39

After Purchase
2
Preparing for Measurement
2.1 After Purchase
Complete the following tasks before using the instrument to make measurements.
Wrapping voltage cords in spiral tubes
The L9438-50 Voltage Cord comes with ve spiral tubes. Use each of these tubes to wrap two
cords (red and black) as necessary.
You will need
L9438-50 Voltage Cord
The following supplies are included:
Banana/banana cord × 2
(Red)
Attaching the spiral tubes
Align two cords (red and
1
black).
Align the ends of two cords (red
and black) so that they can be
wrapped easily.
2
Preparing for Measurement
(Black)
Alligator clip × 2
(Red)
(Black)
Spiral tube (for wrapping cords) × 5
Wrap the cords with a
2
spiral tube.
Wrap the spiral tube around the
two cords so that they are held
together.
The set comes with ve spiral tubes. Use them at an
appropriate interval.
Example: With ve spiral tubes attached
Spiral tubes
33
Page 40

Inspecting the Instrument before Use
2.2 Inspecting the Instrument before Use
Be sure to read “Operating Precautions” (p. 11) before use.
Before using the instrument, check the instrument for any damage that may have been sustained
while in storage or transit, inspect it, and verify that it is operating properly. If you discover any
malfunction or damage, contact your authorized Hioki distributor or reseller.
Inspecting accessories and options
Inspection item Action
Is the power cord’s insulation worn, or is any metal
exposed?
Is the current sensor clamp cracked or otherwise
damaged?
If you nd any damage, do not use the instrument as the
damage may result in an electric shock or short-circuit. The
instrument will not be able to perform normal measurement
in its current state. Contact your authorized Hioki distributor
or reseller.
Inspecting the instrument
Inspection item Action
Is the instrument damaged? If you nd any damage, have the instrument repaired.
Does the instrument display the self-test screen
(showing the model number and version) when it is
turned on? (The version shown will depend on the
most recent version of rmware installed at the time
the screen is displayed.)
Display when the instrument is turned on
If the screen is not displayed, the power cord may have
a break in it, or the instrument’s internal circuitry may be
damaged. Contact your authorized Hioki distributor or
reseller.
After the self-test is complete, does the instrument
display [WIRING] on the Input screen or the screen
that was being shown when it was last turned off?
[WIRING]
Is the instrument’s time accurate?
34
If the screen is not displayed, the instrument’s internal
circuitry may be damaged. Contact your authorized Hioki
distributor or reseller.
Set the instrument’s time to the current time “Changing
System Settings” (p. 135).
Page 41

Connecting the Power Cord
2.3 Connecting the Power Cord
Turn off the instrument’s power before connecting or disconnecting its power cord.
Verify that the instrument’s power switch is in the “off” position.
1
Connect the power cord to the instrument’s power inlet after verifying that the supply
2
voltage falls within the instrument’s rated range (100 V to 240 V AC)
2
Rear
Connect the power cord’s plug to an outlet.
3
2.4 Connecting the Voltage Cords
Be sure to read “Operating Precautions” (p. 11) before connecting any voltage cords.
Connect the optional voltage cords to the instrument’s voltage input terminals. (Connect as many
cords as are required by the measurement lines and connection type.)
See “2.8 Connecting the Instrument to the Measurement Lines (Zero-adjustment)” (p. 43).
Preparing for Measurement
Connect a voltage cord of the same color to the voltage
input terminal’s channel label.
Insert the plug as far as it will go.
35
Page 42

Connecting the Current Sensors
2.5 Connecting the Current Sensors
Be sure to read “Operating Precautions” (p. 11) before connecting any current sensors. For
detailed specications and instructions for the current sensors being used, refer to the instruction
manual that came with each device.
Rear
The instrument provides two dedicated terminals for current sensors: Probe1 and Probe2. Use the
Probe1 terminal when performing high-precision current measurement with the model 9709 and
CT6860 series of AC/DC Current Sensors or the CT6840 series of AC/DC Current Probes. Use the
Probe2 terminal when performing wideband current measurement with the 3270 series of Clamp
On Probes. Connect each sensor after moving the sliding cover.
Current sensors cannot be connected to both Probe1 and Probe2 on the same channel.
Rear
When using Probe1
When using Probe2
Slide
36
Page 43

Connecting a current sensor to the Probe1 terminal
CAUTION
Do not connect or disconnect any current sensors while the instrument is on. Doing so
may damage the current sensors.
Connecting the Current Sensors
Connecting a current sensor
Align the guides on the connector.
1
Insert the connector straight until it
2
locks in place.
The instrument will automatically detect the
type of current sensor being used.
Align the connector so that the wide
part is at the top of the instrument.
Grip the top of the metal part.
Current sensors in the model 9709, CT6860, and CT6840 series are available in two variants.
Model numbers ending with -05 have a metal connector, while those that do not end in -05 have
a black plastic connector. Models with a metal connector can be connected directly to the Probe 1
terminal.
Current sensors with a black plastic connector whose model numbers do not end with -05 can be
connected to the Probe1 terminal using the optional CT9900 Conversion Cable.
Disconnecting a current sensor
Grip the metal part of the connector and
1
slide it towards you.
The lock will disengage.
Pull out the connector.
2
Grip the metal part.
2
Preparing for Measurement
CT9900 Conversion Cable
Rear
When the CT6865 (rated for 1000 A) is connected with the CT9900 Conversion Cable, it will be
recognized by the instrument as a 500 A AC/DC sensor. Use the sensor with the CT ratio set to
2.00.
37
Page 44

Connecting the Current Sensors
Connecting a current sensor to the Probe2 terminal
Connecting a current sensor
Align the recessed part of the 3270
1
series termination connector with
the protruding part of the Probe2
terminal (BNC connector) and insert the
connector.
Twist the connector to the right to lock
2
it in place.
Align the guide position of the 3270
3
series power supply cable’s plug with
the Probe2 power supply terminal.
Insert the connector straight until it
4
locks in place with a clicking sound.
Disconnecting a current sensor
Twist 3270 series termination connector
1
to the left.
The lock will disengage.
Pull out the connector.
2
Although the instrument can accommodate up to six channels of 3270 series current probes, it
may not be possible to measure the current on the channel in question if a current in excess of
the rating is input. If this occurs, immediately remove the current sensors for all channels from
the measurement lines and turn off the instrument.
38
Page 45

Connecting the Current Sensors
If the measurement range exceeds (using a VT and CT)
Use an external instrumentation-use voltage transformer (VT [PT]) or instrumentation-use current
transformer (CT). The VT ratio and CT ratio can be set on the instrument to allow primary-side input
values to be read directly. See “Conguring scaling (when using a VT [PT] or CT)” (p. 62).
DANGER
Do not touch the VT (PT), CT, or instrument input terminals while in the connected
state. Doing so may result in electric shock or bodily injury due to the presence
of exposed live parts.
WARNING
• When using an external VT (PT), do not short the secondary side. Applying a
voltage to the primary side while in the shorted state may cause a large current
to ow to the secondary side, resulting in equipment damage or re.
• When using an external CT, do not leave the secondary side open. If a current
ows to the primary side while in the open state, a high voltage may result on
the secondary side, resulting in extreme danger.
• When using a VT (PT) and CT, one secondary-side terminal should be grounded
for safety.
IMPORTANT
The phase difference between the external VT (PT) and CT may introduce a large error
component into power measurements. If you wish to make more accurate power measurements,
use a VT (PT) and CT with a small phase error in the frequency band of the circuit being used.
2
Preparing for Measurement
39
Page 46

Turning the Instrument On/Off
2.6 Turning the Instrument On/Off
Be sure to read “Operating Precautions” (p. 11) before turning on the instrument. Connect the
power cord, voltage cords, and current sensors before tuning on the instrument.
To ensure accurate measurement, allow a warm-up period of at least 30 minutes to elapse after
turning on the instrument before performing zero-adjustment. See “2.8 Connecting the Instrument
to the Measurement Lines (Zero-adjustment)” (p. 43).
Front
ON/OFF
Turning on the instrument
Turn on the power switch.
The instrument will perform a self-test. (This
process will take about 10 seconds.)
See “2.2 Inspecting the Instrument before Use”
(p. 34).
Once the self-test is nished, the Input screen’s
WIRING page will be displayed (default setting).
If the startup screen is set to LAST (p. 34), the
screen when the instrument was last turned off
will be displayed.
IMPORTANT
If an issue is found with any of the self-test
steps, the startup process will stop on the
self-test screen. If the process stops again
after you cycle the power, the instrument is
malfunctioning. Perform the following steps:
1. Stop measurement, cut off the supply of power
to the measurement lines or disconnect the
voltage cords and current sensors from the
measurement lines, and turn off the instrument.
2. Disconnect the power cord and all wiring
connections.
3. Contact your authorized Hioki distributor or
reseller.
Turning off the instrument
Turn off the power switch.
CAUTION
Do not turn off the instrument while
the voltage cords and current sensors
are still connected to measurement
lines. Doing so may damage the
instrument.
40
Page 47

Setting the Connection Mode and Current Sensors
2.7 Setting the Connection Mode and Current Sensors
This section describes how to set the connection mode based on the number of channels with which the
instrument is equipped and the measurement lines.
First, select a connection pattern from the seven available choices.
Then, for a two-channel combination, select either 1P3W or 3P3W2M. For a three-channel combination,
select 3P3W3M, 3V3A, or 3P4W.
CH1 CH2 CH3 CH4 CH5 CH6
Pattern 1 1P2W 1P2W 1P2W 1P2W 1P2W 1P2W
Pattern 2 1P3W / 3P3W2M 1P2W 1P2W 1P2W 1P2W
Pattern 3 1P3W / 3P3W2M 1P2W 1P3W / 3P3W2M 1P2W
Pattern 4 1P3W / 3P3W2M 1P3W / 3P3W2M 1P3W / 3P3W2M
Pattern 5 3P3W3M / 3V3A / 3P4W 1P2W 1P2W 1P2W
Pattern 6 3P3W3M / 3V3A / 3P4W 1P3W / 3P3W2M 1P2W
Pattern 7 3P3W3M / 3V3A/ 3P4W 3P3W3M / 3V3A / 3P4W
The available connection patterns will vary with the number of channels with which the instrument is
equipped. Only the connection patterns for which a check mark () is shown in the following table can be
chosen. However, when combining multiple channels, the same current sensor model must be connected
to each.
2
Preparing for Measurement
Number of instrument
channels
Pattern 1
Pattern 2 –
Pattern 3 – – – – –
Pattern 4 – – –
Pattern 5 – –
Pattern 6 – – – –
Pattern 7 – – – – –
1 2 3 4 5 6
Connections
A connection diagram is provided in the specications (p. 246).
Connection Description
1P2W 1-phase/ 2-wire
1P3W 1-phase/ 3-wire
3P3W2M 3-phase/ 3-wire
3V3A 3-phase/ 3-wire
3P3W3M 3-phase/ 3-wire
3P4W 3-phase/ 4-wire
Select this connection when measuring a DC line. The current sensor can be connected to either
the source or ground terminal. The connection diagram includes an example of both.
‒
Select this connection when using the two-wattmeter method with two channels to measure a
3-phase delta connection line. It enables accurate measurement of active power even when the
waveform is distorted due to an unbalanced state. Apparent power, reactive power, and power
factor values for unbalanced lines may differ from corresponding values obtained from other
measuring instruments. In this case, use a 3V3A or 3P3W3M connection.
Select this connection when using the two-wattmeter method with three channels to measure a
3-phase delta connection line when compatibility with legacy power meters such as the 3193 is a
priority. It allows accurate measurement of not only active power, but also apparent and reactive
power and power factor even with unbalanced lines.
Select this connection when using the three-wattmeter method with three channels to measure a
3-phase delta connection line. It allows accurate measurement even when the 3V3A connection
yields an error due to large high-frequency component leak current when measuring a PWM
inverter, making it well suited to motor power measurement.
Select this connection when using the three-wattmeter method with three channels to measure a
3-phase Y (star) connection line.
–
41
Page 48

Setting the Connection Mode and Current Sensors
3
4
Press the [INPUT] key.
1
2
Touch [WIRING].
2
Set the current sensor you wish to use
3
for each channel.
Select when connecting the current
Probe 1
Probe 2
Touch [+] and set the connection
4
pattern.
sensor to the Probe1 terminal. The
rate will be set automatically.
Select when connecting the current
sensor to the Probe2 terminal. Touch
Rate and select the connected
current sensor’s rate or model.
If using a combination of two or more
5
channels, set the connections.
Once you accept the settings by touching the
connection mode, a connection diagram for the
selected connection mode will be displayed.
5
• When measuring a power line using multiple channels, the same current sensor model must be
used for each line.
(For example, when measuring a 3-phase/4-wire line, the same current sensor must be
connected to each of channels 1 through 3.)
• When using a current sensor whose sensor rating can be switched, for example the model
9272-10, use the same rating for the same line.
• When selecting a connection pattern that uses multiple channels, the parameters that can be
set for each channel (voltage range, etc.) will be set to the same values as for the rst channel.
42
Page 49

Connecting the Instrument to the Measurement Lines (Zero-adjustment)
2.8 Connecting the Instrument to the Measurement Lines (Zero-adjustment)
Be sure to read “Operating Precautions” (p. 11) before connecting the instrument to the
measurement lines. In addition, be sure to perform zero-adjustment before connecting the
instrument.
Next, connect the voltage cords and current sensors to the measurement lines as indicated in the
connection diagram shown on the instrument’s screen. To ensure accurate measurement, connect
the instrument exactly as shown in the diagram. The connection diagram will be displayed when
you select the connection mode.
See “2.7 Setting the Connection Mode and Current Sensors” (p. 41).
IMPORTANT
The phases are labeled as “A,” “B,” and “C” on the connection diagram screen. Connect
the instrument based on whatever names you are using, for example “R/S/T” or “U/V/W” as
appropriate.
2
Preparing for Measurement
Zero-adjustment and degaussing (DMAG)
To ensure that the instrument satises its accuracy specications, perform zero-adjustment of
voltage and current measured values after allowing the instrument to warm up for about 30 minutes
or more. If a current sensor that can measure both AC and DC currents is connected, the current
sensor will be degaussed (DMAG) at the same time.
Press the [MEAS] key.
1
If CH1 through CH6 is lit up, zero-adjustment
3
will be performed for voltage and current. If the
AB indicator is lit up, zero-adjustment will be
performed for the motor input channels.
The displayed channel will
change each time / is
pressed.
Press [0ADJ].
2
A conrmation dialog box will be displayed.
Accept input on the conrmation
3
dialog box.
Yes
Performs zero-adjustment.
No Cancels zero-adjustment.
The screen will display “Now adjusting…”
and the process will be complete in about 30
seconds.
43
Page 50

Connecting the Instrument to the Measurement Lines (Zero-adjustment)
OK
NO
NO
NO
NO
NO
• Perform zero-adjustment after connecting the current sensors to the instrument.
(Adjustment of current measured values must include the current sensors.)
• When a current sensor for which zero-adjustment can be performed using a zero-adjustment
knob or other switch, adjust the current sensor rst and then perform zero-adjustment with the
instrument.
• Perform zero-adjustment before connecting the instrument to the measurement lines.
(Zero-adjustment must be performed without any voltage or current input.)
• To ensure precise measurement, it is recommended to perform zero-adjustment at an ambient
temperature that falls within the specied range.
• Zero-adjustment is performed for all ranges and for all input channels at the same time.
Connecting the voltage cords to the measurement lines
Example: Secondary side of a circuit breaker
Clip the cords securely to a metal part such as a screw or busbar on the power
supply side.
L9438-50 Voltage Cord
Connecting the current sensor to the measurement lines
IMPORTANT
Clamp the sensor so that the current direction mark faces the load side.
Clamp the sensor to only one conductor. If you simultaneously clamp a sensor to two (1-phase) or
three (2-phase) wires, the instrument will not be able to make a measurement.
Load side
Conductor
44
OK
NO
Power
supply side
Current
direction mark
Page 51

Connecting the Instrument to the Measurement Lines (Zero-adjustment)
Using the quick conguration function
The following settings will be congured with representative values according to the selected line
type: synchronization source, voltage and current auto-range, measurement upper and lower limit
frequencies, integration mode, rectier, and LPF. This functionality is useful when you are using the
instrument for the rst time or when you need to measure lines that differ from those measured last.
Press the [INPUT] key.
1
3
Touch WIRING.
2
2
Touch the connection diagram for
3
the lines being measured and set the
measurement line type.
A conrmation dialog box will be displayed.
Conrm the settings on the
4
conrmation dialog box.
Yes
No Cancels quick conguration.
50/60 Hz Use to measure a commercial power line over a broad range of frequencies.
• Use to measure a commercial power line at high denition.
50/60 Hz HD
DC
DC HD
PWM
HIGH FREQ.
GENERAL
LOW PF
• Use when measuring a line whose current level varies greatly with a single range. It is especially effective
at providing higher resolution with low-level input.
• Use to measure a DC line over a broad range of frequencies.
• This setting can only be selected when using the 1P2W connection mode.
• Use to measure a DC line at high denition.
• Use when measuring a line whose current level varies greatly with a single range. It is especially effective
at providing higher resolution with low-level input.
• Can only be selected when using the 1P2W connection mode.
• Use to measure a PWM line.
• A fundamental frequency of 1 Hz to 1kHz is used so that it does not synchronize with the carrier frequency
of 1 kHz or greater.
• It is recommended to use the sensor phase correction function to facilitate more accurate measurement.
• Use to measure a high-frequency source with a frequency of at least 10 kHz.
• It is recommended to use the sensor phase correction function to facilitate more accurate measurement.
• Use to measure lines other than those listed above.
• It is recommended to use the sensor phase correction function to facilitate more accurate measurement.
• Use to measure the power consumption of inductive loads (at low power factors) such as transformers
and inductors.
• It is recommended to use the sensor phase correction function to facilitate more accurate measurement.
Preparing for Measurement
Performs quick conguration.
45
Page 52

Connecting the Instrument to the Measurement Lines (Zero-adjustment)
Settings
50/60 Hz
50/60 Hz HD
DC
DC HD
PWM
HIGH FREQ.
GENERAL
LOW PF
Synchronization
source
Voltage Auto 100 Hz 10 Hz RMS RMS/RMS OFF
Voltage Manual 100 Hz 10 Hz RMS RMS/RMS 50 kHz
DC Auto 100 Hz 10 Hz DC RMS/RMS OFF
DC Manual 100 Hz 10 Hz DC RMS/RMS 5 kHz
Voltage Auto 1 kHz 1 Hz RMS MEAN/RMS 500 kHz
Voltage Auto 2 MHz 10 kHz RMS RMS/RMS OFF
Voltage Auto 2 MHz 0.1 Hz RMS RMS/RMS OFF
Voltage Auto 2 MHz 1 Hz RMS RMS/RMS OFF
Auto range
Upper limit
frequency
Lower limit
frequency
Integration
mode
Check settings before starting measurement and change values as needed.
Rectier (U/I) LPF
46
Page 53

Verifying Proper Connections (Connection Check)
2.9 Verifying Proper Connections (Connection Check)
To ensure accurate measurement, it is necessary to verify that the voltage cords and current
sensors are connected properly to the measurement lines. Based on the measured values and
vectors, you can check whether the instrument has been connected properly.
1P2W connection
Verify that the measured values are shown.
Voltage measured value
Current measured value
Active power measured
value
Problem Things to check
The voltage measured value is too
high or too low.
The current measured value is not
appropriate.
The active power measured value
is negative.
The active power is not displayed
(i.e., is shown as zero).
The vector arrow is too short, or the
vector lengths differ.
The vector direction (phase) and
color differ.
• Have the voltage cord connectors been inserted rmly into the instrument’s voltage input
terminals? (p. 35)
• Have the voltage cords been connected properly? (p. 44)
• Have the current sensor connectors been inserted rmly into the instrument’s current
sensor input terminals? (p. 36)
• Have the current sensors been connected properly? (p. 44)
• Does the Probe1/Probe2 setting match the terminal into which the current sensor
connector has been inserted? (p. 36)
• Have the voltage cords been connected properly? (p. 44)
• Have the current sensors been connected with the direction mark facing the load side?
• Turn off the zero-suppression setting.
Voltage vector:
Have the voltage cords been connected properly? (p. 44)
Current vector:
• Have the current sensors been connected properly? (p. 44)
• Are the connected current sensors appropriate for the measurement line currents?
• Has the synchronization source been set properly?
Have the voltage cords and current sensors been connected to the appropriate terminals?
(See the connection diagram.)
Connection other than 1P2W
• Verify that the measured values are shown.
• Verify that the vector lines are shown within the
range.
Voltage Current
Vector line range
Vector lines are displayed using the same colors as
the connection diagram lines.
2
Preparing for Measurement
• The indication range used in vector diagrams assumes an inductive load (from a motor, etc.).
• Vectors may exceed the range when the power factor approaches 0 or when measuring a capacitive
load.
• The active power P measured value for individual channels may be negative for 3P3W2M and 3V3A
lines.
47
Page 54

Verifying Proper Connections (Connection Check)
48
Page 55

Displaying Measured Values
3
Viewing Measured Values
All measurement data is displayed on the Measurement screen. If the [MEAS] key is not lit up,
press the [MEAS] key to activate the Measurement screen.
3.1 Displaying Measured Values
Press the [MEAS] key.
3, 2
4
1
Touch VALUE.
2
Touch BASIC.
3
CUSTOM
Touch one of the screen patterns.
4
See "Selecting display
parameters"(p. 49).
3
Viewing Measured Values
Selecting display parameters
The CUSTOM screen allows you to select any combination of the basic measurement parameters
being measured and display them on a single screen.
4-parameter display
16-parameter display 32-parameter display
8-parameter display
49
Page 56

Displaying Measured Values
Touch the name of parameter to open the basic measurement parameter selection window. Touch
to select the parameters to display.
Screen Description
1. When operating in the two-instrument
synchronization function’s numerical
synchronization mode, selects whether to display
Master or Slave rst.
2. Selects the channel.
Select CH AB for motor analysis parameters or Others
for parameters set as calculation formulas.
3. Selects the U, I, P, and Integ. parameters
for CH1 to CH6.
4. Touching a parameter in the list of
parameters to select it.
50
Closing the window
Touch the × button at the top right of the window.
Page 57

Displaying Measured Values
Effective measurement range and display range
In general, the instrument’s effective measurement range (the range in which measurement
accuracy is guaranteed) is 1% to 110% of the measurement range. The instrument’s display range
is dened as the zero-suppression range to 150% of the measurement range.
See "10.4 Measurement Parameter Detailed Specications"(p. 231).
Exceeding either of these ranges will trigger the following display, which indicates an over-range
event.
3
The value display area will be left blank when OFF is selected as the display parameter and when
the selected parameter is invalid due to the values of other settings.
Example: Selecting P123 while using the 3P4W setting and then reverting the connection mode to
1P2W so that P123 is invalid, etc.
When input of 0.5% or less of the measurement range is measured, the measured value may remain
zero and not change. If you wish to display low-level measured values, set the zero-suppression setting
to 0.1% or OFF.
See "Conguring zero-suppression"(p. 56).
Viewing Measured Values
51
Page 58

Viewing Power Measured Values and Changing Measurement Conditions
3.2 Viewing Power Measured Values and Changing Measurement Conditions
The Basic screen is used to view power measured values for each measurement line. The screen
provides functionality for listing power measured values by set connection and displaying detailed
measured values for voltage and current. You can change the displayed channels using the
channel control keys as well as the voltage and current range.
Touch the measured value icon and select the Basic screen.
Select P (Power screen), U (Voltage screen), I (Current screen), or Integ. (Integration screen) from
the screen icons.
Displaying power measured values
Press the [MEAS] key.
1
23
Voltage RMS value
Current RMS value
Active power
Power factor
• Depending on the rectier setting, mean value rectier RMS equivalent values (mean values)
will be displayed in the voltage RMS value (Urms) and current RMS value (Irms) display areas.
See "Setting the rectier"(p. 62).
• The polarity sign for power factor (λ), reactive power (Q), and power phase angle (φ) indicates
the lead/lag polarity, with no sign indicating lag and a negative sign indicating lead.
• The polarity sign for fundamental wave power factor (λfnd) and fundamental wave reactive
power (Qfnd), which are calculated using harmonic measured values, indicates the sign of the
calculation, which is the opposite of the signs of power factor (λ) and reactive power (Q) (when
using the Type1 power calculation formula).
See "Calculation Formula Specications"(p. 239)
• The polarity sign for power factor, reactive power, and power phase angle may not stabilize
when there is a large difference between the voltage and current levels or when the power
phase angle approaches 0°.
• Active power (P), reactive power (Q), apparent power (S), and power factor (λ) are undened
for all channels when using a 3P3W2M or 3V3A connection. Use only the sum value*.
• Measured values may be displayed for channels without input due to the effects of surrounding
noise.
Apparent power
Reactive power
Power phase angle
Frequency source frequency
Touch VALUE.
2
Touch BASIC.
3
4
Touch P.
4
Switch the displayed channel using the
5
[CH] / keys.
The displayed channel will
change every time/ is
pressed.
* When using a connection other than 1P2W, power measured value calculated as the sum of
measured values for at least two channels (for example, P123, S456, Q34, etc.).
52
Page 59

Viewing Power Measured Values and Changing Measurement Conditions
Displaying voltage and current
Example: Voltage
Press the [MEAS] key.
1
23
Voltage RMS value
Voltage mean value
rectication RMS equivalent
Voltage fundamental
wave component
Total harmonic distortion
When the connection mode is 3V3A, 3P3W3M, or 3P4W,
the unbalance rate Uunb / Iunb [%] will be displayed.
When DC has been selected as the integration mode, the ripple
rate will be displayed instead of the total harmonic distortion.
Voltage waveform peak +
Voltage waveform peak –
Voltage simple average (DC)
Voltage AC component (DC)
Frequency source
frequency
Touch VALUE.
2
Touch BASIC.
3
Touch U (voltage) or I (current).
4
4
Switch the displayed channel using the
5
[CH] / keys.
The displayed channel will
change every time / is
pressed.
Setting the ranges
Set the optimal voltage range and current range according to the measurement target’s voltage and
current. To ensure precise measurement, select the smallest range that is larger than the input level for
both voltage and current.
3
Viewing Measured Values
DANGER
• If the maximum input voltage or maximum input current is exceeded, halt
measurement immediately, disconnect the measurement line power supply, and
disconnect the instrument from the measurement lines.
• Continuing measurement after the maximum input has been exceeded may
damage the instrument and result in bodily injury.
WARNING
• The maximum input voltage is 1000 V ±2000 Vpeak (10 ms or less). Avoid
measuring voltages in excess of this voltage as doing so may damage the
instrument and result in bodily injury.
• Do not input a current in excess of the current sensor’s maximum input current
as doing so may damage the instrument and result in bodily injury.
53
Page 60

Viewing Power Measured Values and Changing Measurement Conditions
Range settings on the Measurement screen
Select the channel you wish to change with the [CH] / keys (it
1
will light up).
The displayed channel will change every time / is
pressed.
Manipulate the range with the [RANGE] key and the [AUTO] key.
2
See "1.3 Part Names and Functions"(p. 19).
Auto range and manual range operation
The instrument provides the following two range control methods:
Manual range
([AUTO] key off)
Auto range
([AUTO] key lit up)
Allows the operator to set the range as desired.
(Press the [+] and [-] keys under [RANGE] for both voltage U and current I until
the desired range is shown.)
Sets the optimal voltage and current range for each connection automatically
based on the input.
(Press the [AUTO] keys under [RANGE].)
Display of ranges
The voltage and current ranges are displayed in the settings indicator area at the following position
on the Measurement screen at all times. The range and other information displayed are for the
channel whose LED is lit up.
Power range
The power range is used to measure active power P, apparent power S, and reactive power Q. The
power range is determined as follows based on the voltage range, current range, and connection.
See "Power range breakdown"(p. 236).
54
Example: For active power P (same applies
to S and Q)
P1/P2/P3/P4/P5/P6 Voltage range × current range
P12/P34/P45/P56 2 × voltage range × current range
P123/P456 (3V3A, 3P3W3M) 2 × voltage range × current range
P123/P456 (3P4W) 3 × voltage range × current range
Power range
Page 61

Viewing Power Measured Values and Changing Measurement Conditions
Setting the range on the Input Settings screen
When using a connection other than 1P2W that combines multiple channels, all combined channels
are forced to use the same range.
Press the [INPUT] key.
1
3
2
Touch CHANNEL.
2
Touch the connection’s U Range or
3
I Range as desired and select the
desired setting.
Auto-range breadth
This setting changes the auto-range operation pattern.
3
Viewing Measured Values
• Select when you wish to perform measurements with a high level of precision using
the optimal range at all times.
Narrow
(Default setting)
Wide
When ∆-Y conversion is enabled, the range reduction is determined by multiplying the range by
3
[1/
] (multiplying by approximately 0.57735).
3
• The range is increased by one if the peak value is exceeded (peak-over) for the
connection or if there is an RMS value that is greater than or equal to 105% f.s.
• The range is lowered by one if all RMS values for the connection are less than 40%
f.s. (However, the range is not lowered if the peak value would be exceeded with the
lower range.)
• Select when the range is switched frequently due to large uctuations.
• The range is increased by one if the peak value is exceeded for the connection or if
there is an RMS value that is greater than or equal to 110% f.s.
• The range is lowered by two if all RMS values for the connection are less than 10%
f.s. (However, the range is not lowered if the peak value would be exceeded with the
lower range.)
Press the [INPUT] key.
1
Touch COMMON.
2
2
Touch Auto Range.
3
• If the range continues to be switched frequently after you set the Auto-range to Wide, it is
recommended to set the range manually. See "Setting the ranges"(p. 53).
• When integration starts, the ranges at that point will be fixed, and auto-range operation will be
canceled.
55
Page 62

Viewing Power Measured Values and Changing Measurement Conditions
Conguring zero-suppression
Values that are less than the set value relative to the measurement range are treated as zero. Set
this setting to OFF if you wish to measure input that is low relative to the range.
OFF Disables zero-suppression.
0.1% f.s., 0.5% f.s. Treats values that are less than the set value relative to the range as zero.
Press the [INPUT] key.
1
Touch COMMON.
2
2
3
Touch Zero Suppress and select the
3
desired setting.
56
Page 63

Viewing Power Measured Values and Changing Measurement Conditions
Setting the data update rate
Set the interval at which to calculate measured values from the voltage and current waveforms and
update measurement data.
Select this setting when you wish to measure high-speed power uctuations. Even
when 10 ms is selected, harmonic analysis operates at 50 ms. When this setting
10 ms
is selected, you will be unable to use the two-instrument synchronization function’s
numerical synchronization mode. For frequencies lower than 100 Hz, an update rate
that is a whole-number multiple of 10 ms may be used.
50 ms
(Default setting)
200 ms
Data acquired via communications functionality, analog data generated by D/A output, and data
saved using the interval save function will be updated using the update interval set here.
3
Select this setting for general operation. It balances speed and accuracy. For
frequencies lower than 20 Hz, an update rate that is a whole-number multiple of 50 ms
may be used.
Select this setting when large uctuations prevent measured values from stabilizing
with the 50 ms setting. Select this setting when using IEC mode during harmonic
measurement. The data update rate will be approximately the same as the display
update rate. For frequencies lower than 5 Hz, an update rate that is a whole-number
multiple of 200 ms may be used.
Press the [INPUT] key.
1
Touch COMMON.
2
2
Touch Meas. Interval to switch the
3
setting.
3
Viewing Measured Values
• The setting cannot be changed by connection or channel.
• The display update rate is xed at approximately 200 ms, regardless of this setting.
• If selecting 200 ms does not cause measured values to stabilize, use in combination with the
averaging function.
• To obtain D/A output similar to the smooth analog output generated by the previous 3193
model, select 10 ms and use in combination with the averaging function’s exponential
averaging mode.
57
Page 64

Viewing Power Measured Values and Changing Measurement Conditions
Setting the synchronization source
This section describes how to set the source for each connection, which determines the period
(zero-cross interval) that serves as the basis for various calculations. In general use, select the
measurement channel’s voltage for channels measuring AC current or DC for channels measuring
DC current. If using the instrument to make measurements based on pulses in a motor analysis
application or to measure electrical angle, select Ext*1.
Select Zph.*2 if you wish to obtain measurement results that are synchronized to one cycle of the
motor’s mechanical angle during motor analysis.
Select CH C or CH D*3 if you wish to perform measurement that is synchronized to an external
signal (pulse input).
*1: Ext can only be selected when RPM input is set to pulse and the pulse count has been set
to a whole-number multiple of the number of motor pole pairs (half the motor pole number) on
D/A-equipped models. Note that Ext2 can only be selected when the motor analysis operating
mode is set to Dual. (p. 82)
*2: Zph. can only be selected when the operating mode on a motor analysis and D/A-equipped
model is set to Single and the CH D measurement parameter to Origin (Zph. Stands for “Z-phase”).
*3: CH C and CH D can only be selected when the operating mode on a motor analysis and D/
A-equipped model is set to Indiv.
Press the [INPUT] key.
3
1
2
Touch CHANNEL.
2
Touch the Sync. Src. for the
3
connection.
Sync.Src.
(Synchronization
source)
The set synchronization source will be
displayed by the Sync setting indicator at the
top of the Measurement screen.
• The same synchronization source will be set for each channel’s voltage and current.
• The same synchronization source will be used for each channel’s harmonic measurement.
• For channels measuring AC current, select input with the same frequency as the measurement
channel’s frequency as the synchronization source. If the frequency of the signal selected as the
synchronization source differs signicantly from the measurement channel’s frequency, the instrument
may display a frequency that differs from the input, and measured values may become unstable.
• Segments for which DC has been selected will be matched with the data update rate (10 ms, 50
ms, 200 ms). If AC input is measured using the DC setting, the display value may uctuate, making
accurate measurement impossible.
• If a frequency that is lower than the measurement lower limit frequency setting or higher than
the measurement upper limit frequency setting is input as the synchronization source while the
synchronization source is set to a setting other than DC, the instrument may display a frequency that
differs from the input, and measured values may become unstable.
• Selecting Ext1 or Ext2 makes it easier to achieve synchronization when the motor's RPM varies over
short periods of time, making it useful in power analysis. (p. 89)
• Selecting Zph. allows you to perform harmonic analysis based on one motor revolution (one cycle of
the mechanical angle).
U1 to U6 (default setting),
I1 to I6, DC, Ext1, Ext2, Zph.,
CH C, CH D
58
Page 65

Viewing Power Measured Values and Changing Measurement Conditions
• Since the zero-cross interval cannot be acquired when the synchronization source for a channel to
which DC is being input is set to voltage or current, the instrument will operate with a synchronization
frequency equivalent to approximately one period of the measurement lower limit frequency.
• Synchronization unlock may occur for frequencies lying close to the measurement lower limit
frequency setting, causing measured values to become unstable.
• By inputting a pulse signal to the CH C or CH D motor analysis and D/A output option and then
selecting CH C or CH D as the synchronization source, you can set the measurement timing as
desired. Note that the rising edge of the input pulse is detected for both CH C and CH D.
Synchronization unlock
Channels that cannot be synchronized to the synchronization source will experience
synchronization unlock, preventing accurate measurement. Check synchronization source input.
The synchronization unlock state will be indicated by a warning indicator.
See "1.4 Basic Operation (Screen Display and Layout)"(p. 25).
3
Viewing Measured Values
Setting the low-pass lter (LPF)
The instrument provides a low-pass lter function to limit the frequency band. This lter can be
used to eliminate frequency components and unnecessary external noise components that exceed
the set frequency.
The frequencies listed below can be chosen as the low-pass lter’s cutoff frequency, which can be
set independently for each connection.
Frequency 500 Hz, 1 kHz, 5 kHz, 10 kHz, 50 kHz, 100 kHz, 500 kHz, OFF
Press the [INPUT] key.
1
2
Touch CHANNEL.
3
2
Touch LPF for the connection you wish
3
to congure and select the desired
setting.
The set low-pass lter will be displayed by
the LPF setting indicator at the top of the
Measurement screen.
59
Page 66

Viewing Power Measured Values and Changing Measurement Conditions
Conguring frequency measurement
The instrument allows you to select U or I for each input connection in order to simultaneously
measure multiple circuits’ frequency values. Frequency measurement includes a measurement
lower limit frequency setting and a measurement upper limit frequency setting so that you can limit
the range of frequencies you wish to measure for each connection. When measuring waveforms
with multiple frequency components such as a PWM waveform’s fundamental frequency and carrier
frequency, congure the settings based on the input frequencies you wish to measure.
Frequency measurement display format
The position of the decimal point for frequency measured values is varied automatically as shown
below based on the frequency:
0.10000 Hz to 9.99999 Hz, 9.9000 Hz to 99.9999 Hz, 99.000 Hz to 999.999 Hz,
0.99000 kHz to 9.99999 kHz, 9.900 kHz to 99.9999 kHz, 99.000 kHz to 999.999 kHz,
0.99000 MHz to 2.00000 MHz
Setting the frequency source
Press the [INPUT] key.
1
2
Touch CHANNEL.
2
3
Touch the channel detailed display
3
area.
Detailed settings for each channel will be
displayed.
Touch Mode in the frequency area and
4
select the desired setting.
4
60
Page 67

Viewing Power Measured Values and Changing Measurement Conditions
Setting the measurement upper limit frequency and the lower limit frequency
Press the [INPUT] key.
1
2
Touch CHANNEL.
2
3
Touch the channel detailed display
3
area.
Detailed settings for each channel will be
displayed.
3
Touch Upper and Lower in the
4
frequency area and select the desired
setting.
4
Measurement upper
limit frequency (Upper)
Measurement lower
limit frequency (Lower)
• Accuracy for frequency measurement is guaranteed for sine wave input that is greater than or
equal to 30% of the frequency source voltage or current measurement range. The instrument
may not be able to measure input outside that range.
• When receiving input at a frequency that is lower than the data update rate setting’s period, the
data update rate will vary with the input frequency.
• The instrument may display a frequency that differs from the input if a frequency that is
signicantly higher than the measurement upper limit frequency or a frequency that is lower
than the measurement lower limit frequency is input.
• If the frequency of the signal selected as the synchronization source differs signicantly from
the measurement channel’s frequency, the instrument may display a frequency that differs from
the input, and measured values may become unstable, regardless of the measurement upper
limit frequency setting and the measurement lower limit frequency setting.
See "Setting the synchronization source"(p. 58).
100 Hz, 500 Hz, 1 kHz, 5 kHz, 10 kHz, 50 kHz, 100 kHz, 500 kHz, 2 MHz
0.1 Hz, 1 Hz, 10 Hz, 100 Hz, 1 kHz, 10 kHz, 100 kHz
Viewing Measured Values
Zero-cross high pass lter (ZC HPF)
• This high pass lter setting is used to detect waveform zero-cross events.
• When the measurement lower limit frequency setting is 0.1 Hz or 1 Hz, the ZC HPF setting can
be turned on or off. For other settings, it is xed to ON.
• If the frequency does not stabilize while measuring low frequencies, changing this setting to OFF
may cause the frequency to stabilize.
• Set the ZC HPF to ON while measuring ripple current.
61
Page 68

Viewing Power Measured Values and Changing Measurement Conditions
Setting the rectier
This section describes how to select the voltage value and current value rectiers used to calculate
apparent power, reactive power, and power factor. Two rectier settings are available and can be
selected independently for each connection’s voltage and current.
RMS
(default setting)
MEAN
True RMS
Select this setting for ordinary use.
Mean value rectication RMS equivalent
In general, this setting is only used when measuring line voltage with a PWM waveform
on the secondary side of an inverter.
Touch U-RECT or I-RECT and select the
desired rectier.
Current rectierVoltage rectier
Conguring scaling (when using a VT [PT] or CT)
This section describes how to set the ratio (VT ratio, CT ratio) when using an external VT (PT) or
CT. When a VT ratio or CT ratio has been set, VT or CT will be displayed with the setting indicators
at the top of the Measurement screen.
Touch VT or CT and use the "Numeric
keypad windows"(p. 27) to enter the
desired value.
The valid input range is 0.00001 to
9999.99. The settings cannot be
congured such that (VT × CT) is greater
than 1.0E+06.
VT ratio CT ratio
When a VT ratio has been set, all voltage measurement parameters, including voltage peak
values, harmonics, and waveforms, and all measured values for power measurement parameters
calculated using voltage will be multiplied by the set ratio.
When a CT ratio has been set, all current measurement parameters, including current peak
values, harmonics, and waveforms, and all measured values for power measurement parameters
calculated using current will be multiplied by the set ratio.
When set to OFF, a ratio of 1.00000 is used.
62
Page 69

Viewing Integration Values
3.3 Viewing Integration Values
Displaying integration values
The instrument simultaneously integrates the current (I) and active power (P) for all channels and displays
positive, negative, and total values.
Displaying integration information
23
Voltage RMS
values
Current RMS
values
Active power
Integration times
Current integration values
Active power
integration values
4
Power factor
Positive-direction current integration value for CH1*
Ih1+
Ih1- Negative-direction current integration value for CH1*
Ih1 Total current integration value for CH1
*Displayed only when the integration mode is set to DC.
• The parameters that can be integrated vary with the connection mode and the integration mode.
See "Setting the Connection Mode and Current Sensors"(p. 41) and "Setting the integration
mode"(p. 66).
• This information can also be selected and displayed on the CUSTOM screen.
See "Displaying Measured Values"(p. 49).
Frequency source
frequencies
WP1+
WP1-
WP1 Total active power integration value for CH1
Press the [MEAS] key.
1
Touch VALUE.
2
Touch BASIC.
3
Touch Integ.
4
Switch the displayed channel using the
5
[CH] / keys.
The displayed channel will
change every time/ is
pressed.
Positive-direction active power integration value for CH1
Negative-direction active power integration value for CH1
3
Viewing Measured Values
Before starting integration
Set the time.
1
See "Set the time" (p. 135).
Set the integration mode.
2
See "Setting the integration mode"(p. 66).
Set the necessary control times (interval time, timer time, and actual time control time).
3
See "Performing integration while using the time control function"(p. 68).
Set the time settings to OFF when performing integration manually or with an external signal.
When saving data to a USB ash drive or the instrument’s internal memory or
4
generating D/A output, congure associated settings.
See "Formatting a USB ash drive"(p. 156) and "8.2 Using D/A Output (Motor Analysis and
D/ A-equipped Models Only) (Analog and Waveform Output)"(p. 173).
63
Page 70

Viewing Integration Values
Starting and stopping integration and resetting integration values
These operations can be performed using the instrument’s control keys, external signals, or
communications.
Always reset integration values when changing settings.
When integration is in the stopped state (the [START/STOP]
key will be red), pressing the [DATA RESET] key will cause
integration values to be reset.
Start integration:
Stop integration*:
Press once.
The key will turn green.
Press again.
The key will turn red.
*When using the timer control or actual-time control settings, integration will stop automatically at
the set end time.
64
Page 71

Viewing Integration Values
Precautions when starting and stopping integration and resetting integration values
• Control using LAN communications can be performed using the same procedure on the remote
control application window.
See "9 Connecting the Instrument to a Computer"(p. 189).
• Integration will stop automatically when the integration time reaches its maximum value of 9999
hr. 59 min. 59 sec.
• Starting and stopping of integration and resetting of integration values performed using the
instrument’s control keys or external control apply to all parameters being integrated.
• The following parameters can be integrated depending on the connection mode and integration
mode:
Mode Parameters that can be integrated
1P2W, DC mode Ih+, Ih-, Ih, WP+, WP-, WP
1P2W Ih, WP+, WP-, WP
1P3W, 3P3W
(When using CH1, CH2)
3V3A, 3P3W3M, 3P4W
(When using CH1, CH2, CH3)
• Integration of each channel’s calculation results is timed based on the data update rate.
Consequently, integration values may differ from those of an instrument whose response
speed, sampling speed, or calculation methods differ.
• When integration begins, parameters that are set to the auto range are xed to the range at
that point in time. Set ranges as desired so that an over-range event does not occur.
• In current integration, the instantaneous current is integrated when the integration mode is DC
mode, and RMS values are integrated when the integration mode is RMS mode.
• In power integration, the instantaneous power is integrated when the integration mode is DC
mode, and active power is integrated when the integration mode is RMS mode.
• While integration is being performed (including when the instrument is in standby mode during
actual time control integration), the instrument will not accept any settings changes other than
screen changes and hold/peak hold function operation.
• Although the display is held during hold operation, integration operation continues internally.
However, D/A output consists of display data.
• The integration display is not affected by peak hold operation.
• If a power outage occurs while integration is being performed, integration values will be reset,
and integration operation will stop.
Ih1, Ih2, WP12+, WP12-, WP12
Ih1, Ih2, Ih3, WP123+, WP123-, WP123
3
Viewing Measured Values
65
Page 72

Viewing Integration Values
Setting the integration mode
This section describes how to set the integration mode for each channel. The following two
integration modes are available and can be selected separately for each connection.
• Integrates instantaneous current values and instantaneous power values by polarity
for each sampling period.
DC mode
RMS mode
3
• Can be selected only when the connection mode is 1P2W.
• Integrates six parameters for current (Ih+, Ih-, Ih) and active power (WP+, WP-, WP)
simultaneously.
• Integrates current RMS values and active power values for each data update rate
interval.
• Only active power is integrated by polarity.
Press the [INPUT] key.
1
2
Touch CHANNEL.
2
Touch the channel detailed display
3
area.
Detailed settings for each channel will be
displayed.
Touch the Integration setting and
4
select the desired mode.
4
66
Page 73

Using manual integration
This section describes how to start and stop integration manually.
Viewing Integration Values
Manual integration operation
Integration display value
Start Stop Reset
Hold
Time
Cumulative integration operation
Integration display value
Start Stop Addition start
Hold
Before starting integration
Set the interval time, timer time, and actual time control to OFF.
See "Performing integration while using the time control function"(p. 68).
Starting integration
Press the [START/STOP] key.
The [START/STOP] key will turn green, and the Integ. indicator at the top of the screen will turn green to
indicate that integration is being performed.
Addition
Time
3
Viewing Measured Values
Stopping integration
Press the [START/STOP] key again.
The [START/STOP] key will turn red, and the Integ. indicator at the top of the screen will turn red.
Performing cumulative integration (integration by adding values to previous
integration values)
Press the [START/STOP] key again.
The [START/STOP] key will turn green, and the Integ. indicator at the top of the screen will turn
green.
Resetting integration values
Stop integration and press the [DATA RESET] key.
67
Page 74
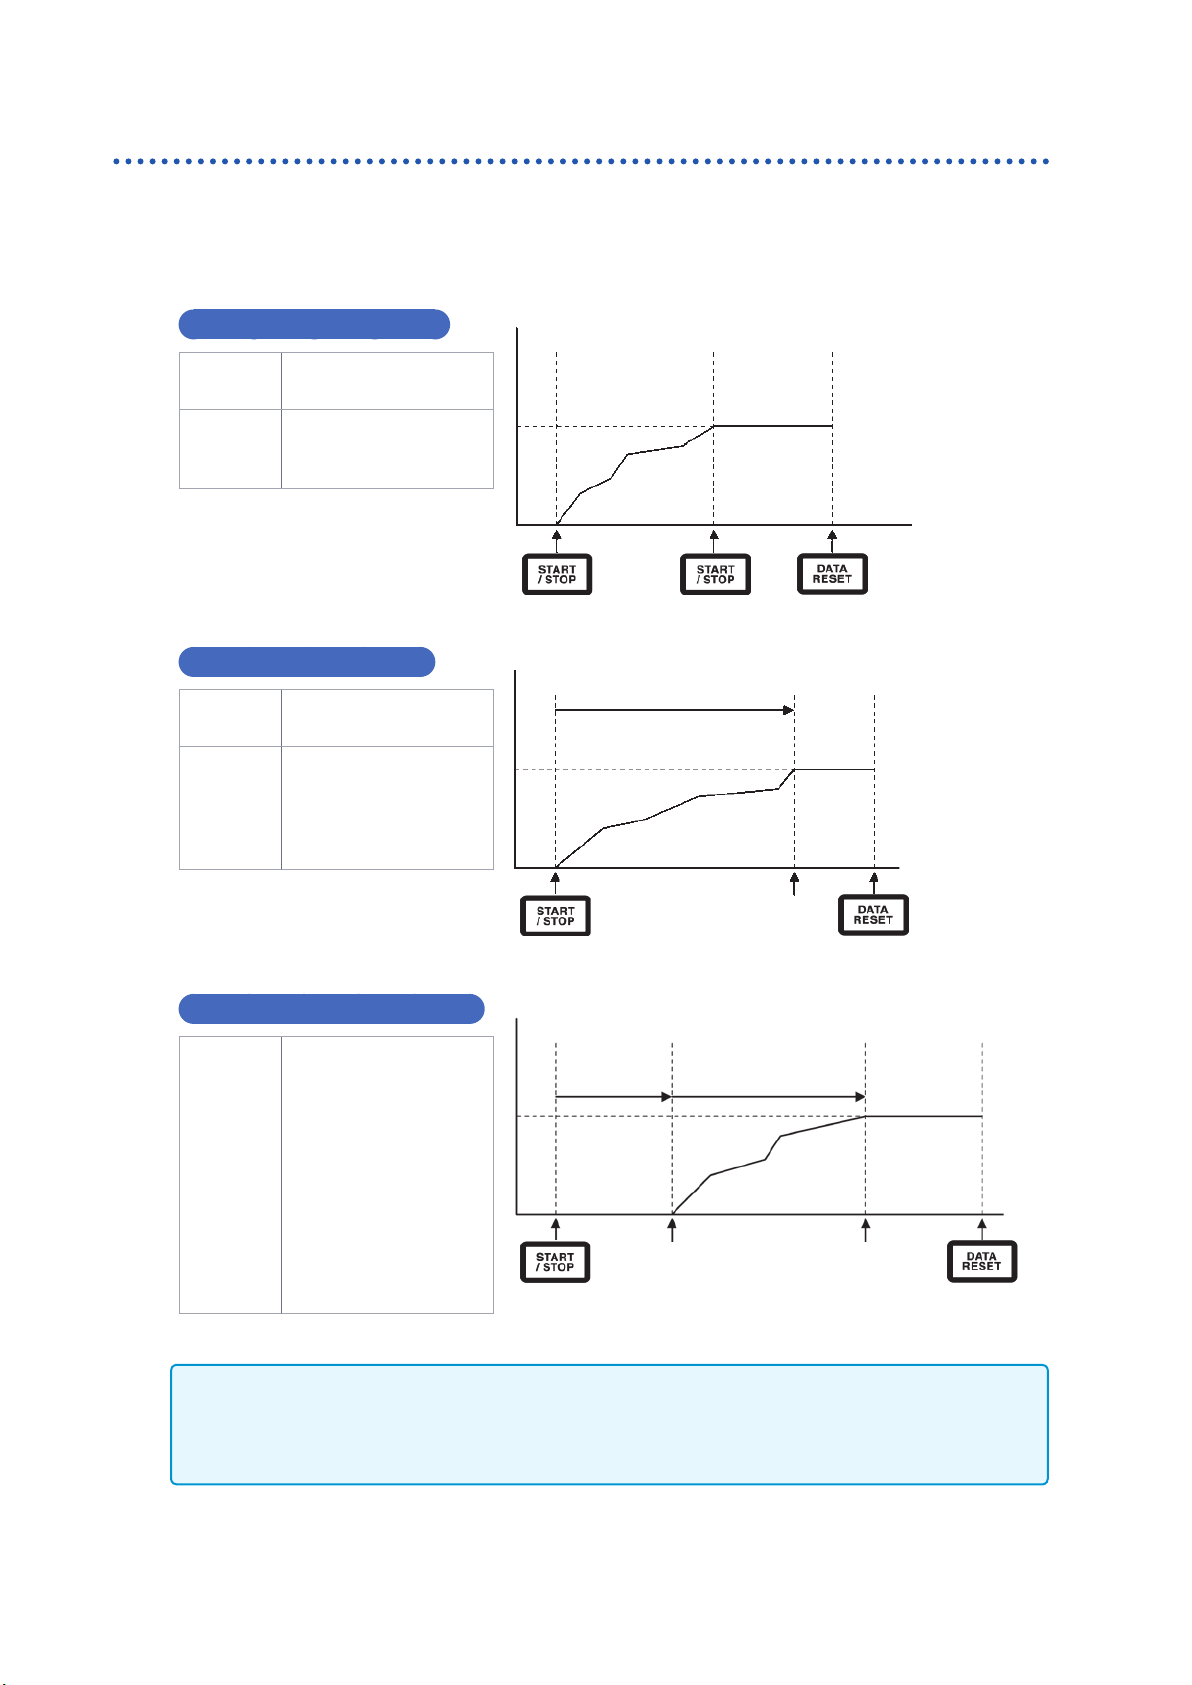
Viewing Integration Values
Performing integration while using the time control function
If you set the timer time and actual time control time in advance and then press the [START/STOP]
key, you can start and stop integration at the set times.
The following three time settings can be used to control integration:
Manual integration setting
Start
integration
Stop
integration
Press the
[START/STOP] key.
Press the
[START/STOP] key
again.
See "Using manual
integration"(p. 67).
Timer integration setting
Start
integration
Stop
integration
Press the
[START/STOP] key.
Integration will stop
automatically once
values have been
integrated for the set
timer time.
Integration display value
Start Stop Reset
Hold
Integration display value
Start Stop Reset
Timer setting time
Time
Hold
Time
Automatic stop
Actual time control integration setting
Press the
[START/STOP] key
places the instrument
in the standby state.
Start
integration,
stop
integration
Integration will then start
and stop at the set start
time and stop time.
To stop integration while
the instrument is in the
standby state, press
the [START/STOP] key
again.
Integration display value
Start Stop time
Standby time Actual time control time
Start time
Automatic stopAutomatic start
Reset
Hold
Operation in the hold state or peak hold state
• When an interval time has been set, the display will be updated at the set interval time.
• When a timer time or actual time control time has been set, the instrument will display the nal
data once the set time has elapsed.
Time
68
Page 75

Viewing Harmonic Measured Values
3.4 Viewing Harmonic Measured Values
The instrument includes harmonic measurement functionality as a standard feature and can provide
harmonic measured values that are synchronous with power measured values for all channels.
These harmonic measured values are used to calculate the fundamental wave component
(fnd value) and total harmonic distortion (THD), which are included in the instrument’s basic
measurement parameters.
See "10.5 Calculation Formula Specications"(p. 239).
Displaying harmonics
Harmonics can be displayed using a bar graph, list, or vectors.
Displaying a harmonics bar graph
Harmonic analysis is performed on the voltage, current, and active power values for the same
channel, and the results are displayed as a bar graph. Numerical data for the display order is also
displayed at the same time.
3
Viewing Measured Values
1
Harmonic voltage
Display order measured values
W: Amplitude value (level)
%:
Content percentage (% of Fnd)
°: Phase angle (phase)
2
3
4
Harmonic current
23
Harmonic active power
• The vertical axis scale is displayed as a percentage of the range when the amplitude value is
selected.
• When the phase angle is selected, a gray bar may be displayed to indicate that the
corresponding amplitude value is small (0.01% or less of the range).
Changing the display settings and display order
Changing the display settings
Touch each setting and change it as desired.
Press the [MEAS] key.
Touch HRM.
Touch BAR GRAPH.
Switch the displayed channel using the
[CH] / keys.
The displayed channel will
change every time / is
pressed.
Measured values for the selected order are
displayed here.
The bar graph for the selected order will turn green.
Changing the display order
Touching the order value will cause the Y rotary knob
(vertical axis display position setting) to turn green.
Turn rotary knob: Select
Press rotary knob: Enter → The
knob’s light will turn off.
69
Page 76

Viewing Harmonic Measured Values
Displaying a harmonics list
This section describes how to display the results of harmonic analysis as a numerical list for each
parameter.
Press the [MEAS] key.
1
Synchronization
source frequency
Display parameter RMS value
5
3, 2
Total harmonic distortion
Touch HRM.
2
Touch LIST.
3
Switch the displayed channel using the
4
[CH] / keys.
Touch a parameter to select it.
5
The same settings apply to the bar graph screen and the list screen.
Display setting Settings Description
CH
Item
Example: For a 3P4W connection
CH1, CH2, CH3, CH123
U Voltage
I Current
P Active power
Changes the display channel within the same connection. To
display a different connection, switch the channel lit up on the
channel display LED shown by CH.
Changes the displayed measurement parameter (list only). If
a SUM value such as CH123 has been selected with the CH
setting, only the P setting will be available to select.
The displayed channel will
change every time / is
pressed.
Level Amplitude value
Content
Scale
MAX Order 25th, 50th, 100th
% of Fnd Content percentage
Phase Phase angle
Log Logarithmic display
Linear Linear display
(Can be displayed down to small levels.)
Changes the displayed content. The phase angle for harmonic
active power refers to the harmonic voltage/current phase
difference.
Changes the vertical axis display (bar graph only). Only Linear
can be selected when the display content is set to phase
angle.
Changes the maximum display order. The instrument may
not be able to display data up to the set maximum order
depending on the synchronization frequency being measured.
See "Maximum analysis order and the window wave number"
(p. 213).
70
Page 77

Viewing Harmonic Measured Values
Displaying harmonic vectors
This section describes how to display the voltage, current, and phase angle for each harmonic order as a
vector graph.
VECTOR1
VECTOR2 Displays the graphs for the selected connections on two vector graphs.
VECTOR1 display
Vector graph
Changing the display settings
Displays vectors for all channels on a single vector graph.
Synchronization source frequency
Measurement
data
3, 2
Press the [MEAS] key.
1
Touch VECTOR.
2
Touch VECTOR1.
3
3
Viewing Measured Values
Touch the channel you wish to display to toggle it on and off.
When the display order (Order) is a value other than 1, the display area will turn red to indicate
that the vector being displayed is not the fundamental wave vector.
Changing the display order
Touching the Order value will cause the Y rotary knob
(vertical axis display position setting) to turn green.
The order can be changed with the rotary knob.
Turn rotary knob: Select
Press rotary knob: Enter → The
knob’s light will turn off.
Changing the zoom factor
Touching the scale value will cause the Y rotary knob
(vertical axis display position setting) to turn green.
Change the zoom factor with the rotary knob.
71
Page 78

Viewing Harmonic Measured Values
VECTOR2 display
4 4
3, 2
1
2
3
4
Setting the harmonic measurement mode
The following two harmonic measurement modes are available:
Press the [MEAS] key.
Touch VECTOR.
Touch VECTOR2.
Set the connections whose vectors you
wish to display on the left and right
graphs.
IEC
WideBand
(Default setting)
3
• This mode is the IEC standard mode.
• When the measurement line’s frequency is 50 Hz or 60 Hz, harmonic measurement
complies with the IEC 61000-4-7:2002 standard.
• Even when the data update rate setting is 10 ms or 50 ms, harmonic measured values
will be updated at a 200 ms interval.
• Harmonic measurement will not be performed if the frequency being measured falls
outside the range of 45 Hz to 66 Hz.
• Analysis can be performed up to the 50th order.
• This mode is the wideband mode.
• It can be used with a wide range of frequencies from 0.1 Hz to 300 kHz.
• The analysis order varies with the frequency being measured.
• When the data update rate is 10 ms, harmonic measured values will be updated at a
50 ms interval.
Press the [INPUT] key.
1
Touch COMMON.
2
2
Touch Mode under Harmonic and
3
select the desired measurement mode.
72
• This setting cannot be changed by connection or channel.
• The harmonic synchronization source is the same as the synchronization source used to
measure power for the same connection.
• Accurate harmonic measurement is not possible when the frequency of the input signal set as
the synchronization source uctuates or when the input signal exhibits a low level relative to
the range.
Page 79

Viewing Harmonic Measured Values
Setting the THD calculation method
This section describes how to set the total harmonic distortion (THD) calculation method. You can
select whether to use the THD-F or THD-R method as well as the maximum order to which to
calculate THD. This setting is valid for all voltage and current harmonic measurement for all channels.
THD calculation method
THD-F
(Default setting)
THD-R
Ratio of the total harmonic component to the fundamental wave
This setting is typically used in applications such as IEC standard-compliant measurement.
Ratio of the total harmonic component to the total harmonic component including the
fundamental wave
This setting yields a lower value than THD-F for waveforms with a large amount of distortion.
Press the [INPUT] key.
1
Touch COMMON.
2
Touch THD Type and select the desired
3
2
method.
3
Viewing Measured Values
What is THD?
3
Total harmonic distortion is a measurement of the
amount of harmonic distortion in a signal.
THD calculation order
This section describes how to set the upper limit order to which to calculate the total harmonic component.
Press the [INPUT] key.
1
Touch COMMON.
2
Touch [THD order] and change the
3
2
setting using the rotary knob (from 2nd
order to 100th order).
3
Touching the order value will cause the Y
rotary knob (vertical axis display position
setting) to turn green.
Turn rotary knob: Select
Press rotary knob: Enter →
The knob’s light will turn off.
• If the analysis order does not reach the set upper limit value due to the harmonic measurement
mode and fundamental frequency, the calculation will be performed using the analysis order as
the upper limit.
• Harmonic measurement values displayed in list and graph form and harmonic measured
values obtained via the instrument’s communications functionality are not constrained by the
upper limit order set here.
73
Page 80

Viewing Harmonic Measured Values
Setting the grouping method
This section describes how to set the intermediate harmonic calculation method for harmonic
measured values.
OFF
TYPE1
(Default setting)
TYPE2
Treats only whole-number multiples of the fundamental wave as the harmonic for the
order in question.
Treats the harmonic sub-group as the harmonic for the order in question. This setting
provides compatibility with the Hioki PW3198’s harmonic measurement functionality.
Treats the harmonic group as the harmonic for the order in question.
Press the [INPUT] key.
1
Touch COMMON.
2
2
Touch Grouping and select the desired
3
3
What is grouping?
In harmonic measurement, the window wave number is determined based on the harmonic mode and the fundamental
wave frequency. When the window wave number is a value other than 1, there is a spectrum line (output bin) for a
number (window wave number - 1) that is proportional to the window wave number in the harmonic component that is
a whole-number multiple (n multiple) of the fundamental wave, and that is known as the intermediate harmonic (inter-
order harmonic). Since measured values yielded by harmonic measurement differ depending on how this intermediate
harmonic is treated, IEC and other standards dene grouping rules.
calculation method.
(n-1)th order harmonic
Intermediate harmonic
In general, the TYPE1 range is known as the harmonic sub-group, and the TYPE2 range is known as the
harmonic group. The output pin within the range can be calculated by means of the average-of-squares method.
If no intermediate harmonic exists, or the window wave number is 1 in wideband mode, measured values will
agree regardless of what grouping method has been chosen. If an intermediate harmonic exists, harmonic
measured values will generally exhibit the following relationship to this setting:
OFF < TYPE1 < TYPE2
nth harmonic
(n+1)th order harmonic
nth order harmonic when set to OFF
nth order harmonic when set to
TYPE1
nth order harmonic when set to
TYPE2
74
Page 81

Viewing Measured Values for Power Factor and Loss
3.5 Viewing Measured Values for Power Factor and Loss
The instrument can calculate and display efciency η [%] and loss [W] using active power values
and motor power values. For example, a single instrument can simultaneously calculate efciency
and loss across the input and output sides of a power conversion device such as an inverter or
power conditioner, or the efciency, loss, and total efciency across a motor’s inputs and outputs.
Alternatively, the two-instrument synchronization function can be used to allow the master
instrument to calculate the efciency and loss for the slave instrument’s power measured values.
Displaying efciency and loss
Press the [MEAS] key.
1
23
Touch VALUE.
2
3
Viewing Measured Values
4
Selecting basic measurement parameters
2
3
Touch CUSTOM.
3
Select the screen pattern.
4
Touch the parameter name and select
1
the desired display parameter.
The basic measurement parameter selection
window will open.
When using the two-instrument
synchronization function’s value
synchronization mode, rst select whether
the parameter will be measured using the
master instrument or the slave instrument.
Touch Others.
2
Select one of η1 to η4 (efciency) or
3
Loss1 to Loss4 (loss).
75
Page 82

Viewing Measured Values for Power Factor and Loss
Setting the calculation formulas for efciency and loss
This section describes how to set one formula each for calculating efciency (η1 to η4) and loss
(Loss1 to Loss4).
Press the [INPUT] key.
1
Touch EFFICIENCY.
Calculation formula 1 Calculation formula 2
2
2
Select the input and output parameters
3
for the calculation formula.
Calculation formula 4Calculation formula 3
Most recent efciency calculated value
Input parameter
Pin1
Pin2
Pin3
Pin4
Most recent loss calculated value
Output parameter
Pout1
Pout2
Pout3
Pout4
Select the input-side power measured value on the left and the output-side power measured value
on the right for each gure on the screen. Up to four inputs and outputs can be selected for each
efciency calculation formula. Efciency is calculated using the sum of the four.
Input side: Pin = Pin1 + Pin2 + Pin3 + Pin4
Output side: Pout = Pout1 + Pout2 + Pout3 + Pout4
η: 100 × |Pout| / |Pin|
Loss: |Pin| - |Pout|
• Motor power (Pm) measurement can only be selected on motor analysis and D/A-equipped
models. Motor analysis and D/A-equipped models without power (Pm) measurement cannot
perform this calculation. See "Setting motor input"(p. 82).
• Measured values may exhibit variations when measuring loads characterized by severe
uctuation or transient variations. In this case, reduce the data update rate (to 200 ms) and
combine with the averaging function’s simple averaging mode.
• When either the input or output is DC, variation in efciency measured values can be limited by
using the same synchronization source setting for the channel used for DC measurement as
for the AC side.
• Calculations across connections with different power ranges are performed using data for the
larger of the two power ranges.
• Calculations across connections with different synchronization sources are performed using
the most recent data at the time of calculation.
76
Page 83

Viewing Measured Values for Power Factor and Loss
3P3W
DC
Example measurements
This section illustrates some example efciency and loss measurements. When performing actual
measurements, read "2 Preparing for Measurement"(p. 33) before connecting and conguring
the instrument.
Measuring the efciency and loss of a power conditioner (PCS)
Example: Inputs 3 DC channels from 3 solar panel strings and outputs power to a 3-phase line
Connection example
You will need
• L9438-50 Voltage Cord × 6
• CT6863 AC/DC Current Sensor × 6
3
S1
DC
S2
DC
S3
U
±
Probe2
Probe1
CH 4
Connection settings
Probe2
CH 5
U
±
Probe1
Probe2
CH 6
U
±
Probe1
PCS
U
±
Probe2
Probe1
CH 1
Probe2
CH 2
U
±
Probe2
Probe1
CH 3
Connection pattern: Pattern 5
3P3W3M + 1P2W × 3CH
Viewing Measured Values
Line A
Line B
Line C
U
±
Probe1
77
Page 84

Viewing Measured Values for Power Factor and Loss
3P3W
Probe2
U
±
Probe1
CH 4
Probe2
U
±
Probe1
CH 5
Probe2
U
±
Probe1
CH 6
Probe2
U
±
Probe1
CH 1
Probe2
U
±
Probe1
CH 2
Probe2
U
±
Probe1
CH 3
Inverter Motor
Line A
Line B
Line C
Torque meter
Tachometer
A
Motor input
B
C
D
Calculation formula settings
Use only η1 and Loss1.
Pin1
Pin2
Pin3
Pin4
Pout1
Pout2
Pout3
Pout4
Measuring the efciency and loss of an inverter device and motor
Example: When inputting the input side of an inverter to the instrument’s CH1 to CH3, the
output side of the inverter to the instrument’s CH4 to CH6, analog output from a tachometer to
the instrument’s CH B rotation signal terminal, and analog output from a torque meter to the
instrument’s CH A torque signal input terminal
See "8.3 Using Motor Analysis (Motor Analysis and D/ A-equipped Models Only)"(p. 182).
Use a torque meter and tachometer with extremely fast analog output response times.
Connection example
You will need (assuming use of a motor analysis and D/A-equipped model)
• L9438-50 Voltage Cord × 6
• 9709 AC/DC Current Sensor × 6
• Tachometer × 1
• Torque meter × 1
• L9217 Connection Cord × 2
78
Page 85

Connection mode settings
Viewing Measured Values for Power Factor and Loss
Connection pattern: Pattern 7
3P3W3M × 2 circuits
Calculation formula settings
Use η1 to η3 and Loss1 to Loss3.
Inverter efciency and loss
Pin1
Pin1
Pout1 Pin1
3
Viewing Measured Values
Motor efciency and loss
Pout1
Pout1
Total efciency and loss
79
Page 86

Viewing Motor Measured Values (Motor Analysis and D/A-equipped Models)
3.6 Viewing Motor Measured Values (Motor Analysis and D/A-equipped Models)
Motor analysis and D/A-equipped models of the instrument can perform motor analysis when used
in combination with an external torque sensor and tachometer. In addition, the motor inputs used in
motor analysis can be used as two-channel independent analog DC inputs and four-channel pulse
inputs, which can also be used as waveform measurement triggers.
See "Trigger settings"(p. 100).
Displaying motor measured values
Displaying motor measured values on the BASIC screen
Press the [MEAS] key.
Motor input synchronization source
Filter settingsCH A and CH B inputs
1
Touch VALUE.
2
2
Switch the channel to AB using the [CH]
Torque
3
/ keys.
RPM
The displayed channel will
Motor power
Slip
change every time / is
pressed.
The following information will be displayed at the top of the screen when displaying motor input:
CH A, CH B input
Motor input
synchronization source
Filter settings
Displays the input settings for CH A and CH B on the top and bottom, respectively.
The display will indicate Analog, Freq, or Pulse.
Displays the source setting used to display the period (zero-cross) that serves as the basis
for measurement.
During dual-mode operation, this information will be shown on two lines.
Displays the range and lter setting for CH A and CH B on the top and bottom, respectively.
When using the Analog setting, the display will indicate whether the range or the lter is on
or off.
When using the Freq or Pulse setting, the display will indicate the lter type (Weak/Strong/
OFF).
When the motor input operating mode is set to Dual
80
Torque 1
RPM 1 RPM 2
Motor power 1 Motor power 2
Slip 1 Slip 2
Torque 2
Page 87

Viewing Motor Measured Values (Motor Analysis and D/A-equipped Models)
Displaying motor measured values on the CUSTOM screen
When using the two-instrument
1
synchronization function’s numerical
synchronization mode, select whether
to display the master’s parameter or
1
2
3
the slave’s parameter rst.
Touch CH AB.
2
Select the parameter to display.
3
Tq Torque value
Spd RPM
Pm Motor power
Slip Slip
Performing zero-adjustment of motor input
In the following circumstances, perform zero-adjustment to eliminate errors caused by input signal
offsets:
• When an analog DC voltage is being input to CH A or CH B
• When torque is being input using frequency
In the following circumstances, perform zero-adjustment while the instrument is receiving zero input
for the torque and RPM signals:
• When a torque value is displayed even though no torque is occurring
• When an RPM value is displayed even though no rotation is occurring
Press the [MEAS] key.
1
2
3
1
Switch the channel to AB using the [CH]
2
/ keys.
3
Viewing Measured Values
The displayed channel will
change every time / is
pressed.
Press the [0ADJ] key.
3
Accept the settings on the conrmation
4
dialog box.
Yes Performs zero-adjustment.
No Cancels the operation.
• You can also perform motor input zero-adjustment by pressing the [0ADJ] key while the AB
channel display LED is lit up on any MEAS screen.
• Zero-adjustment cannot be performed for CH C, CH D, or CH A/CH B if set as pulse input.
• Zero-adjustment can be performed within an input range of ±10% f.s. Compensation cannot be
performed while the instrument is receiving input outside that range.
81
Page 88

Viewing Motor Measured Values (Motor Analysis and D/A-equipped Models)
Setting motor input
Connect the torque sensor and tachometer as described in "8.3 Using Motor Analysis (Motor
Analysis and D/ A-equipped Models Only)"(p. 182). Congure the motor analysis settings based
on those connections.
Setting the operating mode
Set the motor analysis operating mode to one of the following three options:
Single motor
(Single)
(Default setting)
Dual motor
(Dual)
Independent
input (Indiv.)
3
This mode is used to measure one motor circuit. It can perform advanced analysis such
as electrical angle measurement and forward/reverse operation detection.
This mode is used to simultaneously measure two motor circuits. Two circuits of torque
and RPM input are connected to, and measured simultaneously by, the instrument.
This mode uses motor input as independent analog DC input and pulse input.
Press the [INPUT] key.
1
Touch MOTOR.
2
Touch Op. Mode and select the desired
3
mode.
2
When the operating mode is set to dual motor (Dual)
Motor 1 settings
Combination of CH A and CH C
Motor 2 settings
Combination of CH B and CH D
82
Page 89

Viewing Motor Measured Values (Motor Analysis and D/A-equipped Models)
Setting the upper limit frequency and lower limit frequency
When inputting a pulse signal to the instrument’s
motor input, set upper and lower limits for the
pulse frequency.
100 Hz, 500 Hz, 1 kHz, 5 kHz, 10 kHz, 50 kHz, 100 kHz, 500 kHz, 2 MHz
Sets the lowest frequency that exceeds the maximum frequency of the input
pulse signal. When using Independent input (Indiv.) mode, this value is used as
the upper limit value for D/A output.
Upper limit frequency
(Upper Freq.)
Lower limit frequency
(Lower Freq.)
When using Single motor (Single) or Dual motor (Dual) mode, this value is
used as the pulse frequency that is used to calculate the upper limit value for the
RPM and motor power displays and for D/A output.
RPM upper limit value =
Motor power upper limit value = Maximum torque value ×
0.1 Hz, 1 Hz, 10 Hz, 100 Hz
Sets the lower limit frequency at which to measure the input pulse signal. This
value is also used as the lower limit frequency for measurement when the
synchronization source is set to Ext1, Ext2, Zph, CH C, or CH D.
60 × set upper limit frequency
Pulse count setting
2 × π × RPM upper limit value
60
Setting the motor synchronization source
This section describes how to set the source that determines the period that serves as the basis for
calculating motor analysis parameters. Motor analysis parameters are measured using intervals of
the source selected here.
See "Setting the synchronization source"(p. 58).
3
Viewing Measured Values
Syn. Src.
(Synchronization
source)
U1 to U6, I1 to I6, DC (default setting), Ext1, Ext2, Zph., CH C, CH D
The set motor synchronization source is displayed under Sync at the top of the Motor screen.
• The interval when DC is selected matches the data update rate (10 ms, 50 ms, 200 ms).
• When measuring motor efciency under a uctuating load, select the same synchronization
source as for the motor input measurement channel. Efciency can be measured more
accurately by using the same calculation interval for motor input and motor output.
83
Page 90

Viewing Motor Measured Values (Motor Analysis and D/A-equipped Models)
Setting measurement parameters
Set how to use CH A through CH D in single
motor (Single) mode. You can select from the
following four patterns:
CH A CH B CH C CH D
1 Torque (Torque) RPM (Speed)
2 Torque (Torque) RPM (Speed)
3 Torque (Torque) RPM (Speed) Unused (Off) Origin signal (Origin)
4
(Default setting)
• Measurement parameters cannot be set when using dual motor (Dual) mode or independent input (Indiv.)
mode.
• When CH D is set to the origin signal (Origin), Zph. can be selected as the synchronization source.
Torque (Torque) RPM (Speed) Unused (Off) Unused (Off)
Direction of rotation
(Direction)
Direction of rotation
(Direction)
Origin signal (Origin)
Unused (Off)
Setting the low-pass lter (LPF)
You can turn the low-pass lter on or off to eliminate high-frequency noise when the CH A or CH
B input is set to analog DC. Set the lter to ON if external noise in analog DC input destabilizes
measurement. The LPF setting has no effect on input when input is not set to analog DC input.
Setting the pulse noise lter (PNF)
You can set the pulse noise lter to eliminate pulse noise from CH C and CH D and when CH A and
CH B input are set to either Pulse or Frequency. Use this setting when the measured values for
frequency or RPM data input using a pulse signal are unstable due to noise.
84
Pulse noise lter OFF (Default setting), Weak, Strong
• The lter does not affect channels whose input is set to analog DC.
• The instrument will not be able to detect pulses of 500 kHz or greater when set to Weak or 50
kHz or greater when set to Strong.
Page 91

Viewing Motor Measured Values (Motor Analysis and D/A-equipped Models)
Setting the slip input frequency source
Parameter Settings Description
Slip f1, f2, f3, f4, f5, f6
Slip calculation formula
r/min
Select the voltage or current supplied to the motor, whichever is more stable, as the input frequency
source.
100 ×
2 × 60 × input frequency - |RPM| × pole number setting
Sets the frequency of the measurement channel input
to the motor in order to calculate the motor’s slip.
2 × 60 × input frequency
Setting the torque input
Parameter Settings Description
Selects the type of signal used by the torque sensor connected to the instrument.
Input setting
The available settings will vary as described below depending on the selected setting.
Analog
Frequency
For sensors that output a DC voltage signal proportional
to the torque
For sensors that output a frequency signal proportional
to the torque
3
Viewing Measured Values
When Analog is selected
When Torque input is set to Analog, set the
following three settings based on the sensor:
Volt. Rng. (voltage range), Scaling (scale
value), and Unit of TQ (torque unit).
Example: For a torque sensor with a rated
torque of 500 Nm and an output scale of ±10 V
Volt. Rng. 10 V
Scaling 50.00
Unit of TQ Nm
85
Page 92

Viewing Motor Measured Values (Motor Analysis and D/A-equipped Models)
Parameter Settings Description
Select according to the output voltage of the torque
Volt. Rng.
(voltage range)
Scaling
(scale value)
1 V range, 5 V range, 10 V range
Set to a value from 0.01 to 9999.99. Enter using the numeric keypad window.
Torque measured values are displayed as the result of multiplying the input voltage by the
scaling value. Set the torque value per 1 V of output from the connected torque sensor in
conjunction with the Unit of TQ setting.
(Scaling value = Torque sensor rated torque value / Output full-scale voltage value)
In the example, the scaling value would be 50.
(50 = 500 Nm / 10)
Set based on the connected torque sensor.
sensor being connected to the instrument.
The torque input voltage range can also be set with the
voltage range keys while the AB channel indicator LED
is lit up.
mNm
Unit of TQ
(torque unit)
Nm
kNm
When Frequency is selected
Select if the connected torque sensor’s output rate is 1
mN·m to 999 mN·m per 1 V.
Select if the connected torque sensor’s output rate is 1
N·m to 999 N·m per 1 V.
Select if the connected torque sensor’s output rate is 1
kN·m to 999 kN·m per 1 V.
If the Input is set to Frequency, set the
following four parameters based on the sensor:
Center Freq., Freq. Rng., Scaling, and Unit of
TQ.
Example 1: For a torque sensor with a rated
torque of 500 N·m and output of 60 kHz ±20 kHz
Center Freq. 60000
Freq. Rng. 20000
Scaling 500.00
Unit of TQ Nm
Example 2: For a torque sensor with a rated
torque of 2 kN·m, positive rated torque of 15
kHz, and negative rated torque of 5 kHz
86
Center Freq. 10000
Freq. Rng. 50000
Scaling 2.00
Unit of TQ kNm
Page 93

Viewing Motor Measured Values (Motor Analysis and D/A-equipped Models)
Parameter Settings Description
Unit of TQ
(torque unit)
Scaling
(scale value)
Center Freq.
Freq. Range
mNm, Nm, kNm
Set to a value from 0.01 to 9999.99.
Set to a value from 1 kHz to 500 kHz
in 1 Hz steps.
Set according to the torque sensor being connected to
the instrument.
Set to the rated torque of the connected torque sensor
in conjunction with the torque unit setting.
Set the center frequency to the center frequency
corresponding to a torque value of 0. Also set the
frequency range to the difference between the
frequency corresponding to the sensor rated torque
and the center frequency. The settings must satisfy the
following constraints:
(Center frequency + frequency range) ≤ 500 kHz
(Center frequency - frequency range) ≥ 1 kHz
Setting rotation signal input
Parameter Settings Description
Selects the type of rotation signal being connected.
For a DC voltage signal that is proportional to the RPM
Input
Analog
Pulse For a pulse signal that is proportional to the RPM
This setting is only used for measurement parameter
pattern 4.
3
Viewing Measured Values
The setting parameters vary with the selected input setting.
When Analog is selected
If the Input is set to Analog, set the Volt. Rng.
(voltage range) and Scaling (scale value)
based on the rotation signal.
Parameter Settings Description
Select according to the output voltage of the rotation
Volt. Rng.
(voltage range)
Scaling
(scale value)
1 V range, 5 V range, 10 V range
Set to a value from 0.01 to 99999.9. Enter using the numeric keypad window.
RPM measured values are displayed as the result of multiplying the input voltage by the scaling
value. Set the value per 1 V of output for the connected rotation signal.
signal being connected to the instrument.
The rotation signal input voltage range can also be
set with the current range keys while the AB channel
indicator LED is lit up.
87
Page 94

Viewing Motor Measured Values (Motor Analysis and D/A-equipped Models)
When Pulse is selected
Parameter Settings Description
This value is used in slip calculation and to convert
Num. Poles
(motor pole
number)
Set to the pole number for the motor
being measured (an even number
from 2 to 254).
the RPM signal as a frequency corresponding to the
mechanical angle to a frequency corresponding to the
electrical angle.
Enter using the numeric keypad window.
Num. Pulses
(pulse count)
Set to the number of pulses per
mechanical angle rotation (1 to
60000).
If an incremental-type rotary encoder with 1000 pulses
per rotation is connected, set to 1000.
Enter using the numeric keypad window.
Setting this parameter to a whole number that is half of
the motor's pole number setting will enable selection of
Ext as the synchronization source.
88
Page 95

Viewing Motor Measured Values (Motor Analysis and D/A-equipped Models)
Measuring a motor’s electrical angle
When a pulse signal is used as rotation signal input, you can view changes in the voltage and
current phase using the pulse as the reference by setting the Sync. Src (synchronization source)
for input channels 1 through 6 to Ext1 or Ext2.
Fundamental wave
frequency (U1)
Calculation period
Phase
difference
External synchronization
Reference Reference
signal
Reference Reference
Fundamental wave
frequency (U1)
Calculation period
External synchronization
signal
When measuring the electrical angle using multiple pulses
• It is recommended to use the origin signal (Z-phase). When the origin signal (Z-phase) is used,
the reference pulse is determined based on the origin signal, allowing phase measurement to be
carried out using a xed pulse as the reference at all times.
• When not using the origin signal (Z-phase), the pulse that serves as the reference is determined
during synchronization. If synchronization is lost, a different pulse may be used as the reference
each time resynchronization is performed.
3
Viewing Measured Values
• Performing harmonic analysis in synchronization with the rotation signal input pulse requires
a pulse count that is a whole-number multiple of the input frequency. For example, a four-pole
motor would require a pulse count that is a whole-number multiple of 2, while a six-pole motor
would require a pulse count that is a whole-number multiple of 3.
• When measuring a motor that uses a Y connection internally with a 3P3W3M connection, the
phase voltage and phase current phase angles can be measured by using the Δ-Y conversion
function.
89
Page 96

Viewing Motor Measured Values (Motor Analysis and D/A-equipped Models)
Phase zero-adjustment (PHASE ADJ)
This section describes how to perform zero-adjustment to correct the phase difference between the
synchronization source’s pulse and the voltage fundamental wave component of the connected rst
channel.
Press the [MEAS] key.
Synchronization source of the displayed channel
1
Touch VECTOR.
2
4
Select the Vector screen (VECTOR1).
3
3, 2
Select the channel for which to perform
4
phase angle zero-adjustment with the
[CH] keys and touch Adjust under
Phase ADJ.
• Phase zero-adjustment can only be performed when the Sync. Src. (synchronization source)
is set to Ext1 or Ext2. Initiating the function has no effect when other settings are in use.
• Initiating the function has no effect when the instrument is in the synchronization unlocked
state.
• Compensation values will be maintained even if the instrument is turned off.
• Touching Reset will clear the compensation values and revert to operation in which the
instrument displays the phase difference with the pulse being used as the reference.
• Compensation values will be cleared if the system is reset.
Example of electrical angle measurement
With the motor is an un-energized state, operate the motor from the load side and
1
measure the inductive voltage that occurs across the motor’s input terminals.
Perform phase zero-adjustment.
2
Zero-adjustment will zero out the phase difference between the fundamental wave component
of the inductive voltage waveform input to U1 and the pulse signal.
Energize and operate the motor.
3
Voltage and current phase angles measured with the instrument will indicate electrical angle
based on the inductive voltage phase.
90
Because the phase difference includes the effects of the rotation input signal’s pulse waveform
and the instrument’s internal circuit delay, it will appear as measurement error when measuring a
frequency that differs greatly from the frequency at which phase zero adjustment was performed.
Page 97

Viewing Motor Measured Values (Motor Analysis and D/A-equipped Models)
Detecting the motor’s direction of rotation
If an incremental-type rotary encoder’s A-phase pulse and B-phase pulse are input to the rotation
signal CH B and CH C input terminals, it is possible to detect the direction in which the shaft is
rotating and to assign the corresponding polarity sign to the RPM value.
Direction of rotation is detected when Pattern 1 or Pattern 2 is selected for the measurement
parameters. Direction of rotation is judged based on the level of the other pulse (high/low) when the
A-phase pulse and B-phase pulse rising and falling edges are detected.
Forward
A-phase
operation
RPM polarity sign: +
B-phase
Backward
A-phase
operation
RPM polarity sign: −
B-phase
The detected direction of rotation is reected in the polarity sign that is assigned to RPM measured
values as well as to motor power (Pm) measured values.
3
Viewing Measured Values
91
Page 98

Viewing Motor Measured Values (Motor Analysis and D/A-equipped Models)
Setting Zph. as the synchronization source for input channel 1 through 6 while a pulse signal is being
provided as rotation signal input and the origin signal (Origin) is being input to CH D allows you to view
voltage and current measured values based on one motor rotation (one cycle of the mechanical angle).
Fundamental wave
frequency (U1)
Calculation period
External synchronization
signal (Z-phase)
Reference Reference
Example for a 4-pole motor
• Since one motor rotation is always used as the calculation period regardless of the number of poles the
motor has, measurements can be performed by averaging the variations for each pole that are caused
by the motor’s mechanical characteristics.
• Fundamental wave measured values appear as nth order for voltage and current harmonic measured
values, where n is dened as “number of motor poles / 2.” Subsequently, the nth-order harmonics for
voltage and current appear as “number of motor poles / 2 × n.”
• The voltage and current fundamental frequency is measured to obtain voltage and current frequency
measured values.
• This capability is available when the motor analysis operating mode (p. 82) is set to Single.
• Provide input as appropriate based on the CH A through CH D measurement parameters (p. 84). In
addition to inputting the origin signal to CH D (Z-phase pulse), it is necessary that the rotation signals be
properly input to CH B (A-phase pulse) and CH C (B-phase pulse when using direction).
• To use another pulse as the calculation period reference instead of the pulse output from a rotary
encoder, it is recommended to set the motor analysis operating mode to Indiv. and then to set CH C or
CH D as the synchronization source for input channels 1 through 6. Input the reference pulse as the
selected synchronization source.
92
Page 99

Displaying Waveforms
4
Viewing Waveforms
The instrument can display the voltage and current waveforms measured by all channels, along
with motor input waveforms. Since the waveform display is completely independent of power
measurement, the operations described in this chapter have no effect on power or harmonic
measured values.
4.1 Displaying Waveforms
Displaying waveforms on the WAVE screen
The WAVE screen displays only waveforms.
Press the [MEAS] key.
1
2
Touch WAVE.
2
Press the [RUN/STOP] key.
3
([RUN/STOP]: Turns green.)
4
Viewing Waveforms
Waveform recording will start, and the
screen display will be updated.
Waveform display area Settings area
Waveform recording status display
The waveform recording status display provides useful information in the event that it takes time for
the instrument to display waveforms or that waveforms are not displayed.
Waveform recording statusTrigger position (p. 100)
(Recording will start if a trigger is activated
[p. 102].)
Press the [RUN/STOP] key again.
4
([RUN/STOP]: Turns red.)
Waveform recording and screen display
updates will stop.
Display Description of status
STOP Recording has stopped.
WAIT
PTR
STRG
CMP
ABRT
The instrument is in the trigger standby
state.
The instrument is recording pre-trigger
waveforms.
The instrument is recording post-trigger
waveforms.
The instrument is creating waveforms for
display.
The instrument is performing processing
to stop waveform recording.
93
Page 100

Displaying Waveforms
Displaying waveforms and measured values on the WAVE+VALUE screen
The WAVE+VALUE screen displays waveforms and measured values.
Waveform display area
3
Measured value display area
• Timing of recording and measured value measurement
for the displayed waveform is not synchronized.
• Pressing the [HOLD] key will stop only display updates
for measured values. Waveform recording will not stop.
2
Press the [MEAS] key.
1
Touch WAVE.
2
Touch WAVE+VALUE.
3
Press the [RUN/STOP] key.
4
([RUN/STOP]: Turns green.)
The waveforms will be displayed on the
screen.
(Recording will start if the trigger is
activated [p. 102].)
Press the [RUN/STOP] key again.
5
([RUN/STOP]: Turns red.)
Display of the waveforms will stop.
You can choose 12 basic measurement
parameters to display in the measured
value display area.
See “Selecting display parameters”
(p. 49).
Initializing the display position
The vertical axis display position in the waveform display area can be initialized using any of three
patterns.
Under Arrange Waveforms, touch one
1
2
1
of the patterns.
A conrmation dialog box will be
displayed.
Select whether to initialize the display
2
position.
Yes Initializes the display positions.
No Cancels the initialization.
94
 Loading...