

Page 1
Page 2

Page 3

Contents
Contents
i
1
Introduction.....................................................1
Confirming Package Contents........................2
Safety Information ..........................................3
Operating Precautions....................................5
Chapter 1 Overview 11
1.1 Product Overview ............................... 11
1.2 Features .............................................11
1.3 Names and Functions of Parts ........... 13
1.4 Measurement Workflow ..................... 22
Chapter 2 Measurement
Preparations 27
2.1 Installation and Connection Procedures
............................................................27
2.2 Connecting the Measurement Lines .. 28
2.3 Connecting the Power Cord ...............34
2.4 Turning On the Instrument ................. 35
2.5 Performing Zero-adjustment .............. 36
2.6 Activating Power to the Measurement
Lines ..................................................37
2.7 Turning Off the Instrument ................. 37
Chapter 3 Configuration and
Measurement 39
3.1 Pre-Measurement Inspection .............39
3.2 Configuring Settings ........................... 40
3.2.1 Selecting the Wiring Mode ................. 40
3.2.2 Selecting the Current Input Method ... 42
3.2.3 Selecting Display Content ..................44
Selecting display parameters ....................44
Selecting display channels .......................46
Selecting the rectifier ................................47
3.2.4 Selecting the Voltage and Current
Ranges ...............................................48
Selecting the desired range ......................48
PW3336A981-04
Automatically setting the range
(auto-range operation) ............................ 49
3.2.5 Setting the Synchronization Source
(SYNC) ...............................................51
3.2.6 Setting the Frequency Measurement
Range .................................................53
3.2.7 Setting the Timeout ............................55
3.2.8 Displaying Measured Values as an
Average (AVG: Averaging) .................57
3.2.9 Setting the VT and CT Ratio ..............59
Setting the VT ratio .................................. 60
Setting the CT ratio .................................. 61
3.3 Integration ..........................................62
Starting integration ................................... 64
Stopping integration ................................. 64
Starting integration while adding to previous
integrated values (additional integration) . 65
Canceling integration
(resetting integrated values) ................... 65
Performing integration after setting an
integration time (timer integration) .......... 66
Integration precautions ............................ 68
3.3.1 Integrated Value Display Format ........70
3.4 Viewing Harmonic Measured Values .71
3.4.1 Setting the Synchronization Source ...71
3.4.2 Method for Displaying Harmonic
Measurement Parameters ..................71
3.4.3 Setting the Analysis Order Upper Limit
............................................................76
3.4.4 About the HRM ERROR lamp ............77
3.5 Measuring Efficiency ..........................78
Examples of efficiency measurement ...... 79
3.6 Performing Synchronized Measurement
with Multiple Instruments (Multipleinstrument Synchronized Measurement)
81
Connecting 2 instruments (PW3336/PW3337)
with a synchronization cable ................... 82
Configuring synchronized measurement . 83
EXT SYNC terminal internal circuitry ....... 84
3.7 External Control ..................................85
3.7.1 External control terminal .....................85
Connecting wires to the external control
terminals ................................................. 87
3.8 Using D/A Output ................................................ 88
Connecting wires to D/A output terminals 90
3.8.1 Analog Level Output, Waveform Output,
and High-speed Active Power Level
Output .................................................91
2
3
4
5
6
7
8
9
10
11
12
付
録
索
引
Page 4

ii
Contents
Switching between analog output and
waveform output ...................................... 92
Setting the rectifier for analog output ....... 93
3.8.2 D/A Output ..........................................95
Setting D/A output parameters ................. 95
Example uses .......................................... 97
Examples of analog output ...................... 98
Example waveform output ..................... 101
3.9 Using a Current Sensor ....................102
Before connecting a current sensor ....... 103
Connecting a Type 1 current sensor ...... 104
Connecting a Type 2 current sensor ...... 104
Setting external current sensor input ..... 106
Using an external CT ............................. 107
3.10 Other Functions ................................108
3.10.1Fixing Display Values (Display Hold) 108
Activating display hold ........................... 108
Canceling the display hold state ............ 108
3.10.2Displaying Peak, Minimum, and Maximum Values (Maximum Value Hold) 109
Displaying maximum values .................. 109
Displaying minimum values ................... 109
Returning to the instantaneous value display
109
Clearing maximum and minimum values 109
3.10.3Disabling Control Keys (Key Lock) ..111
Enabling the key lock state .................... 111
Canceling the key lock state .................. 111
3.10.4Initializing the Instrument
(System Reset) .................................112
3.11 When PEAK OVER, o.r, or the Unit
Indicator Flashes ..............................114
3.11.1If the PEAK OVER U or PEAK OVER I
Lamp Lights Up ................................114
3.11.2When o.r (over-range) Is Displayed .115
3.11.3When the Unit Indicator Flashes .....116
Chapter 4 Connection to a PC
117
Setting the LAN’s default gateway ......... 125
Displaying the LAN’s MAC address ....... 126
Connecting the instrument to a computer
with a LAN cable .................................... 127
4.3 Operating the Instrument from a
PC's Browser ................................... 129
Operating the instrument remotely ......... 130
4.4 GP-IB Interface Settings and Connection
(Before Using Command
Communications) .............................................131
Connecting the cable to the GP-IB connector
................................................................................................... 132
Setting the GP-IB address ............................... 133
4.5 Canceling the Remote State
(Activating the Local State) .............. 134
Canceling the remote state .................... 134
Chapter 5 Specifications 135
5.1 Environmental and Safety Specifications
.......................................................... 135
5.2 General Specifications ..................... 136
5.3 Measurement specifications ............ 139
5.4 Functional Specifications ................. 156
5.5 Calculation Formulas Specifications 161
Voltage channel and sum value calculation
formula ................................................... 161
Current channel and sum value calculation
formulas ................................................. 163
Power channel and sum value calculation
formulas ................................................. 164
Power channel and sum value calculation
formulas ................................................. 167
5.6 Wiring Specifications ....................... 168
Wiring diagrams for direct input
(connections to instrument’s terminal block)
................................................................ 168
4.1 RS-232C Settings and Connection
(Before Using Command
Communications) .............................118
Setting the RS-232C communications speed
................................................................ 119
Connecting the RS-232C Cable ............. 120
4.2 LAN Settings and Connection
(Before Using Command
Communications) .............................122
Setting the LAN’s IP address ................. 123
Setting the LAN’s subnet mask .............. 124
Chapter 6 Maintenance and
Service 177
6.1 Trouble Shooting ............................. 177
6.2 Error Indication ................................ 179
Page 5

iii
Contents
Appendix A1
Appendix 1Detailed Specifications of
Measurement Items
(Display Items) ................................A1
Appendix 2Detailed Specifications
of Output..........................................A5
Appendix 2.1Detailed Specifications of Level
Output .............................................A5
Appendix 2.2Detailed Specifications of
Waveform Output ...........................A6
Appendix 2.3Detailed Specifications of
Selectable Items for D/A Output .....A7
Appendix 3Rack Mounting .........................A11
Appendix 4Dimensional Diagram...............A13
Index Index1
1
2
3
4
5
6
7
8
9
10
11
12
付
録
索
引
Page 6

iv
Contents
Page 7
1
Introduction
Introduction
Thank you for purchasing the Hioki Model PW3336, PW3336-01, PW3336-02, PW3336-03, PW3337,
PW3337-01, PW3337-02, PW3337-03 Power Meter. To obtain maximum performance from the instrument
software, please read this manual first, and keep it handy for future reference.
The following documents are provided with this instrument. Refer to them as appropriate for your application.
Measurement
1
Guide
Offers an introduction to the instrument's basic measuring method for first time users.
Instruction Manual
2
(This document)
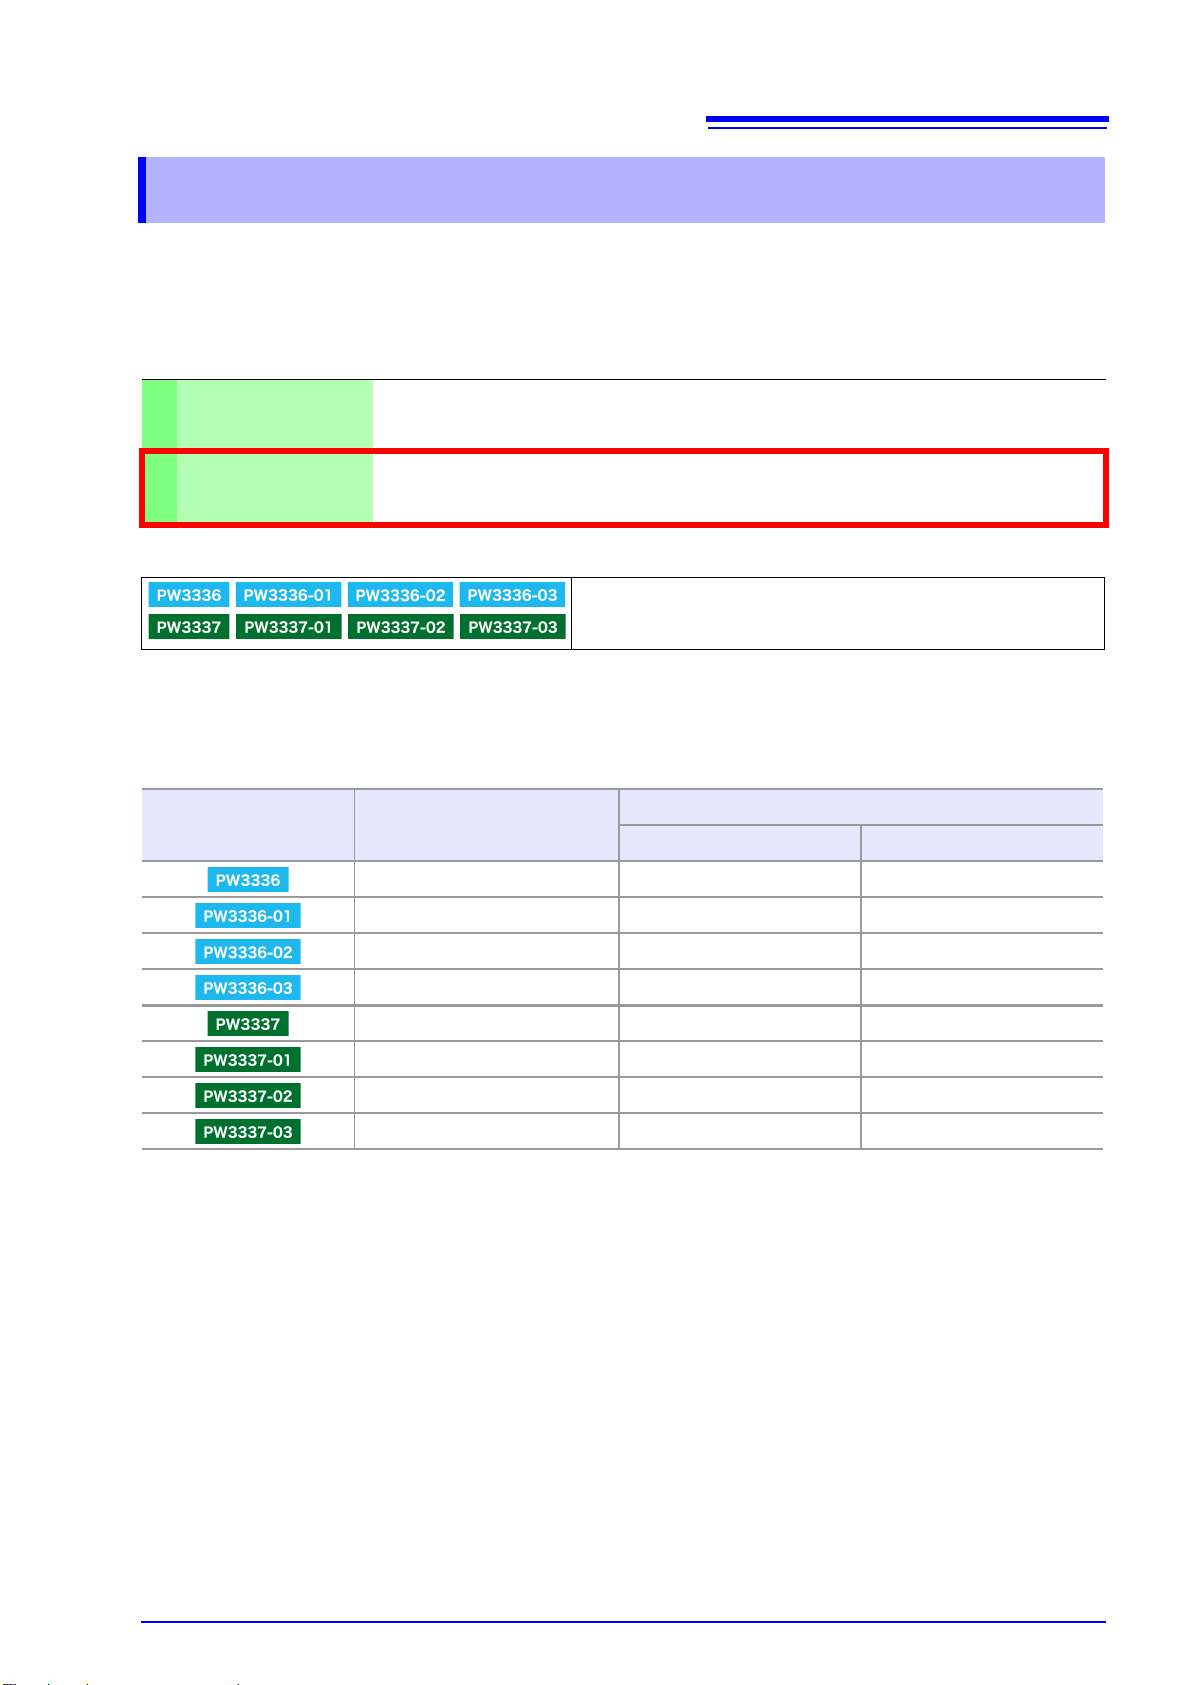
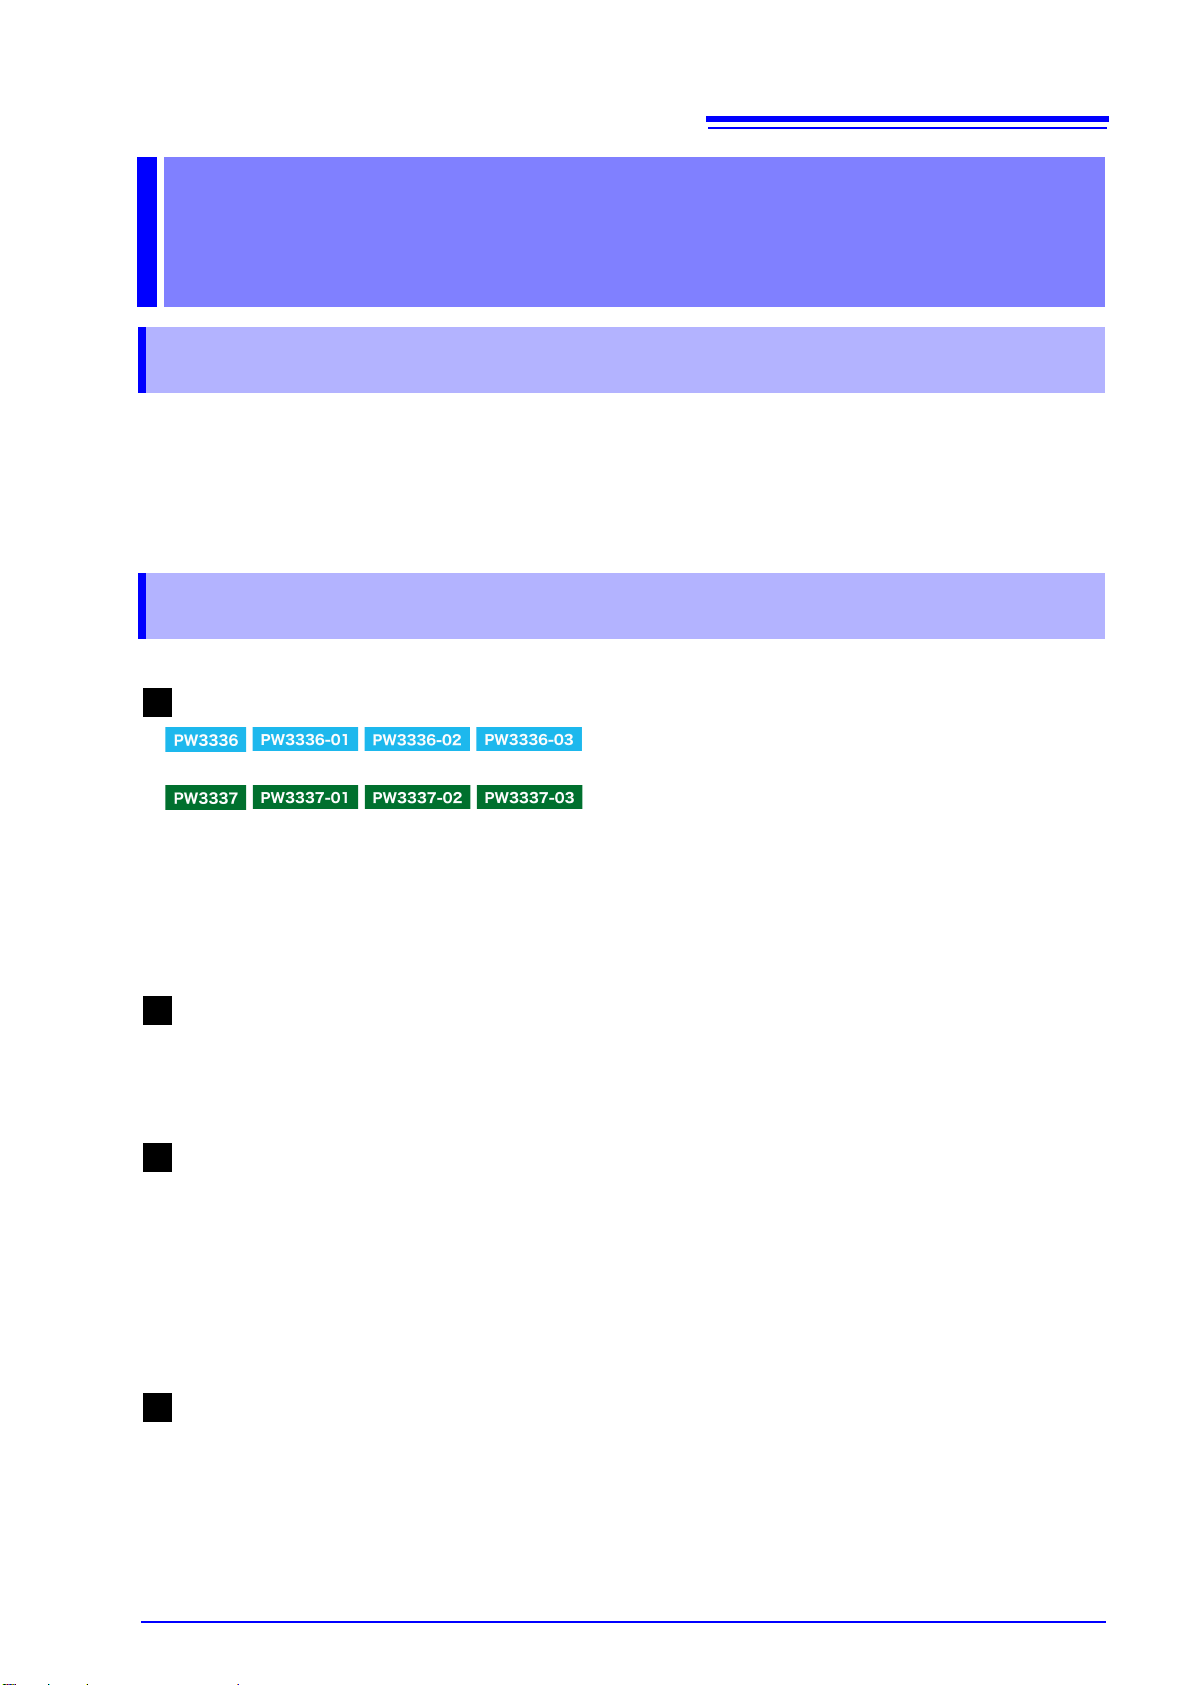
The models are classified according to the number of the input channels and the factory-installed options as
follows.
Model Number of input channels
Contains explanation and instructions regarding the instrument's operating method and
functions.
Show the model that is equipped with each function as the icon.
z : Installed − : Not installed
Factory-installed options
GP-IB D/A output
2 −−
2 z −
2 − z
2 zz
3 −−
3 z −
3 − z
3 zz
The instrument can measure relatively high current with the use of HIOKI Clamp on Sensors (clamp sensors),
which are option, or current sensors. Hereafter, those sensors are collectively referred to as "current sensors". Please read the instruction manuals of each sensor for details before using.
The current sensors are classified as either "TYPE1" or "TYPE2" according to the output specifications.
Using a TYPE2 current sensor requires Model CT9555 series Sensor Unit, which is option. Please refer to
the instruction manual of Model CT9555 series for details.
Trademark
Microsoft and Internet Explorer are either registered trademarks or trademarks of Microsoft Corporation in the
United States and other countries.
Page 8
2
PW3336, PW3336-01, PW3336-02, PW3336-03,
PW3337, PW3337-01, PW3337-02, PW3337-03
Power Meter
Instruction manual
Measurement guide
Power cord
Voltage and current input terminal safety
cover
PW3336, -01, -02, -03..................... 4
PW3337, -01, -02, -03..................... 6
Safety
cover installation screws (M3 ×6 mm)
PW3336, -01, -02, -03..................... 8
PW3337, -01, -02, -03..................... 12
e.g.) PW3337
Confirming Package Contents
Confirming Package Contents
When you receive the instrument, inspect it carefully to ensure that no damage occurred during shipping. In
particular, check the accessories, panel switches, and connectors. If damage is evident, or if it fails to operate
according to the specifications, contact your dealer or Hioki representative.
Confirm that these contents are provided.
Options
Communications and control options
Model 9637 RS-232C Cable (1.8 m, 9pin-9pin, crossover cable)
Model 9638 RS-232C Cable (1.8 m, 25pin-9pin, crossover cable)
Model 9642 LAN Cable (5 m, Supplied with Cross-Over Adapter)
Model 9151-02 GP-IB Connector Cable (2 m)
Model 9165 Connection Cord (1.5 m, metal BNC to metal BNC, not CE marked, for the synchronized mea-
Current sensor options
Model 9661 Clamp on Sensor (500 A AC)
Model 9669 Clamp on Sensor (1000 A AC)
Model 9660 Clamp on Sensor (100 A AC)
Model CT9667 Flexible Clamp on Sensor (500 A/5000 A AC)
Model CT6862-05 AC/DC Current Sensor (50 A AC/DC)
Model CT6863-05 AC/DC Current Sensor (200 A AC/DC)
Model 9709-05 AC/DC Current Sensor (500 A AC/DC)
Model CT6865-05 AC/DC Current Sensor (1000 A AC/DC)
Model CT6841-05 AC/DC Current Probe (20 A AC/DC)
Model CT6843-05 AC/DC Current Probe (200 A AC/DC)
Model CT6844-05 AC/DC Current Probe (500 A AC/DC)
Model CT6845-05 AC/DC Current Probe (500 A AC/DC)
Model CT6846-05 AC/DC Current Probe (1000 A AC/DC)
Model 9272-05 Clamp on Sensor (20 A/200 A AC/DC)
Model CT9555 Sensor Unit
Model CT9556 Sensor Unit
Model CT9557 Sensor Unit
Model L9217 Connection Cord
surements)
Page 9
Safety Information
This instrument is designed to comply with IEC 61010 Safety Standards, and has been
thoroughly tested for safety prior to shipment. However, mishandling during use
could result in injury or death, as well as damage to the instrument .
Using the instrument in a way not described in this manual may negate the provided
safety features.
• Be certain that you understand the instructions and precautions in the manual
before use. We disclaim any responsibility for accidents or injuries not resulting
directly from instrument defects.
• Mishandling during use could result in injury or death, as well as damage to the
instrument. Be certain that you understand the instructions and precautions in the
manual before use.
With regard to the electricity supply, there are risks of electric shock, heat generation,
fire, and arc discharge due to short circuits. If persons unfamiliar with electricity measuring instruments are to use the instrument, another person familiar with such
instruments must supervise operations.
3
Safety Information
This manual contains information and warnings essential for safe operation of the instrument and for maintaining it in safe operating condition. Before using it, be sure to carefully read the following safety precautions.
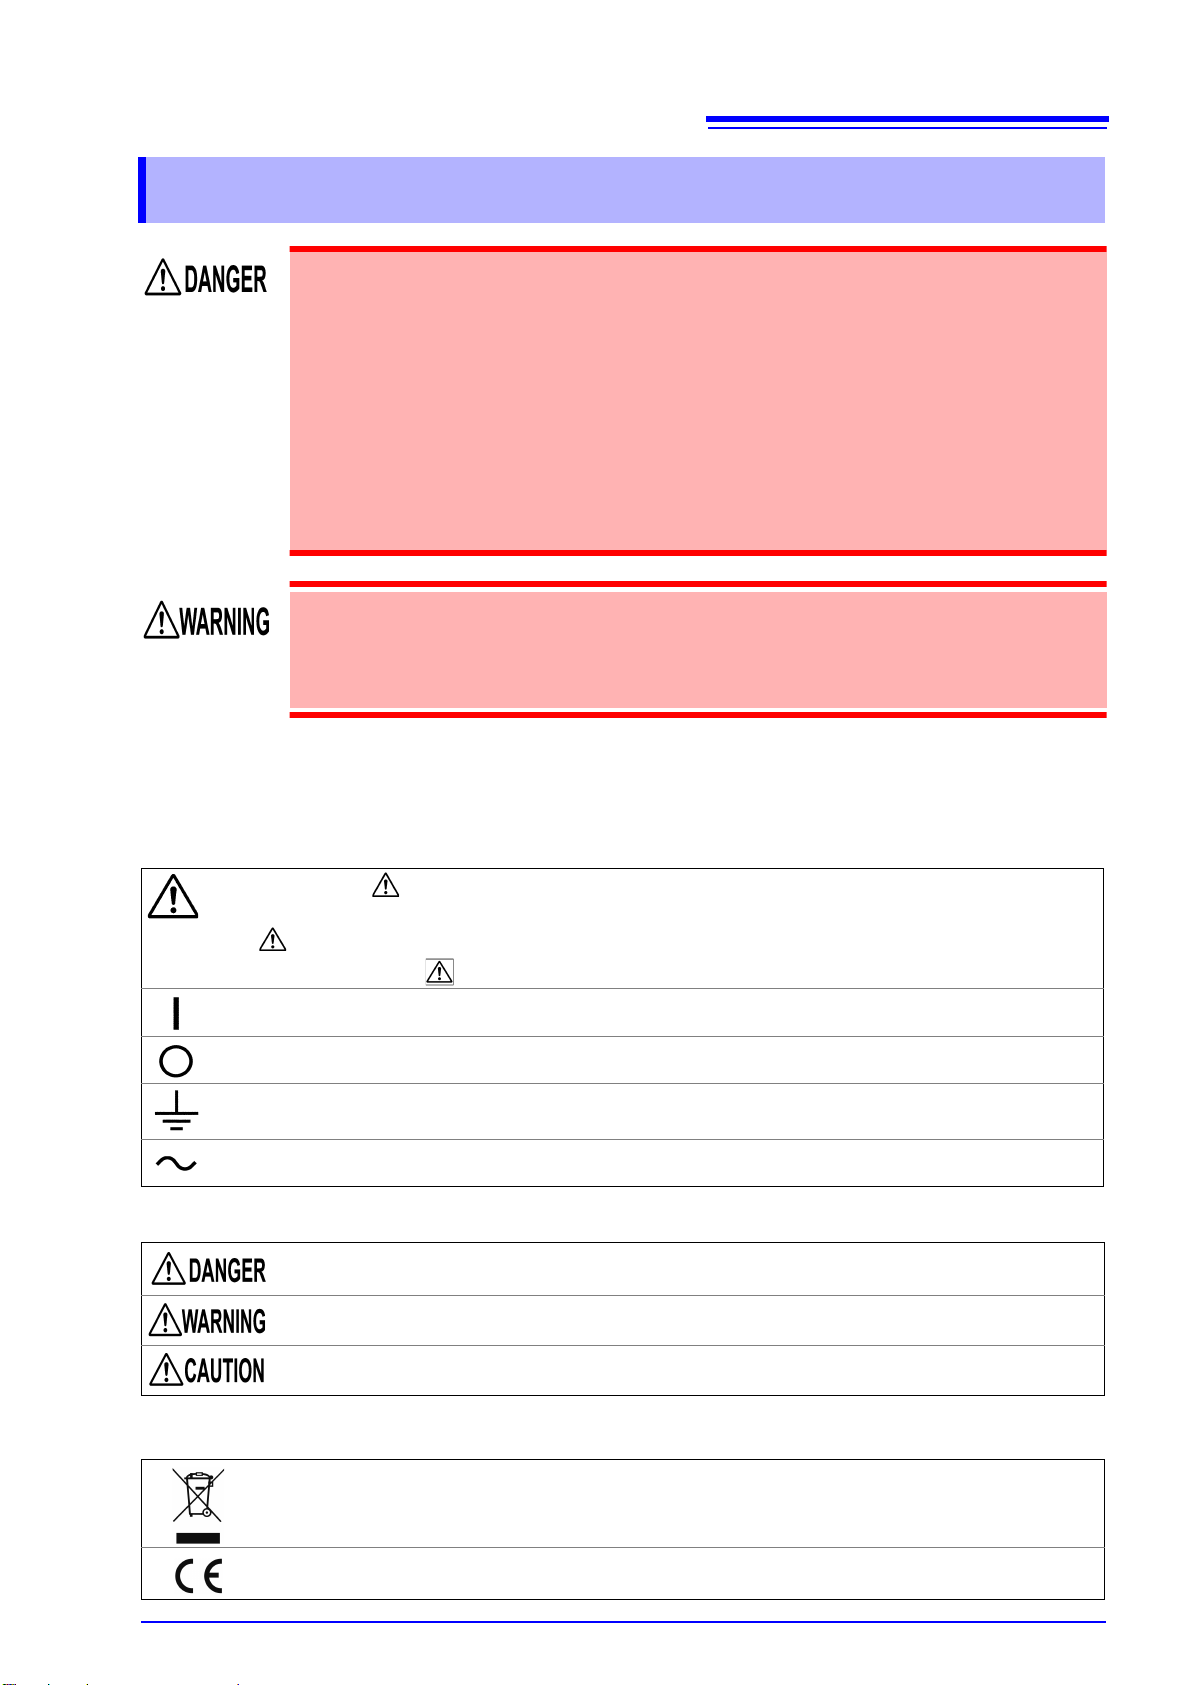
Safety Symbols
In the manual, the symbol indicates particularly important information that the user should read before
using the instrument.
The symbol printed on the instrument indicates that the user should refer to a corresponding topic in the
manual (marked with the
Indicates the ON side of the power switch.
Indicates the OFF side of the power switch.
Indicates a grounding terminal.
Indicates AC (Alternating Current).
The following symbols in this manual indicate the relative importance of cautions and warnings.
Indicates that incorrect operation presents an extreme hazard that could result in serious injury or
death to the user.
Indicates that incorrect operation presents a significant hazard that could result in serious injury or
death to the user.
symbol) before using the relevant function.
Indicates that incorrect operation presents a possibility of injury to the user or damage to the instrument.
Symbols for Various Standards
WEEE marking:
This symbol indicates that the electrical and electronic appliance is put on the EU market after August 13,
2005, and producers of the Member States are required to display it on the appliance under Article 11.2 of
Directive 2002/96/EC (WEEE).
This symbol indicates that the product conforms to regulations set out by the EU Directive.
Page 10
4
Safety Information
Notation
Indicates the prohibited action.
(p. ) Indicates the location of reference information.
* Indicates that descriptive information is provided below.
SET
(Bold character)
The screen of this instrument displays characters in the following manner.
Names of settings, buttons, and other screen elements are enclosed in brackets.
Accuracy
We define measurement tolerances in terms of f.s. (full scale), rdg. (reading) and dgt. (digit) values, with the
following meanings:
f.s. (range) This is usually the name of the currently selected range.
rdg. (reading or displayed value) The value currently being measured and indicated on the measuring instrument.
dgt. (resolution)
The smallest displayable unit on a digital measuring instrument, i.e., the input value that causes the digital display to show a "1" as the least-significant digit.
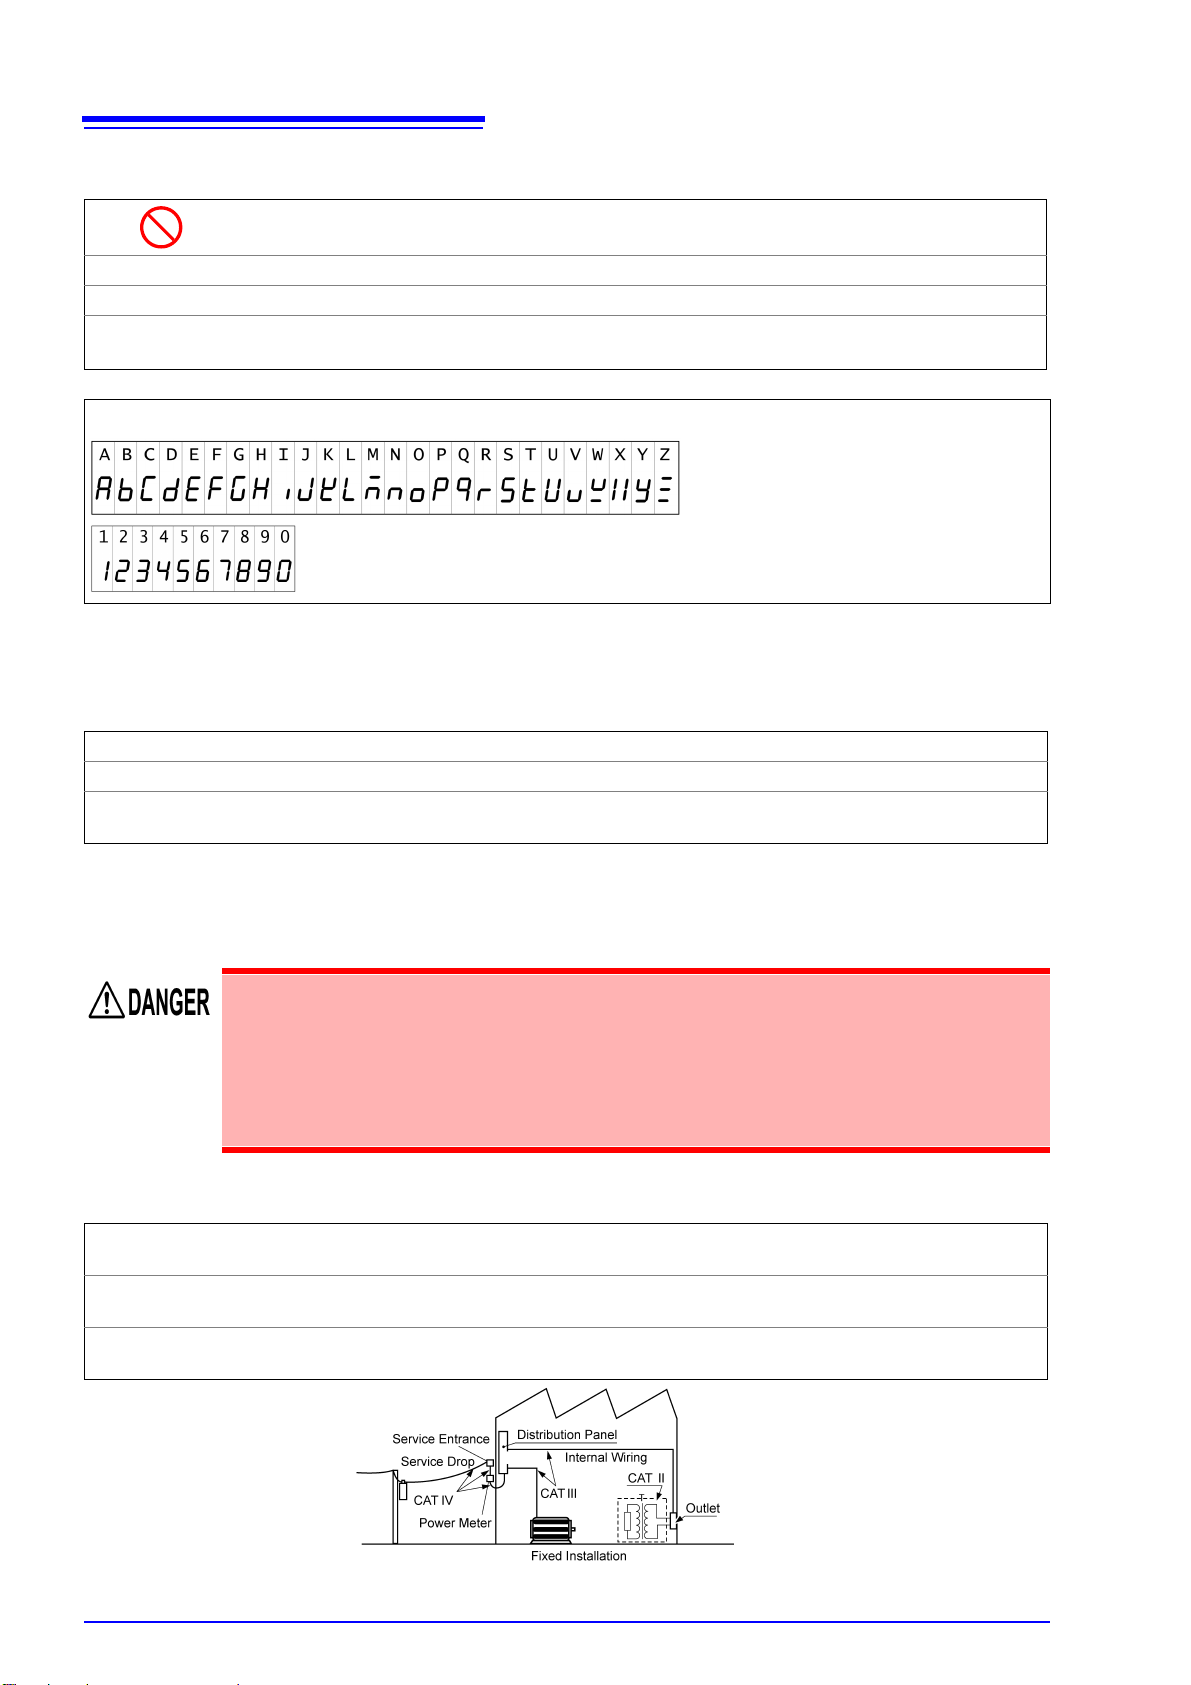
Measurement categories
To ensure safe operation of measuring instruments, IEC 61010 establishes safety standards for various electrical environments, categorized as CAT II to CAT IV, and called measurement categories.
• Using a measuring instrument in an environment designated with a higher-numbered
category than that for which the instrument is rated could result in a severe accident,
and must be carefully avoided.
• Using a measuring instrument without categories in an environment designated with
the CAT II to CAT IV category could result in a severe accident, and must be carefully
avoided.
This instrument conforms to the safety requirements for CAT II 1000 V, CAT III 600 V measuring instruments.
CAT II
CAT III
CAT IV
When directly measuring the electrical outlet receptacles of the primary electrical circuits in equipment connected to an AC electrical outlet by a power cord (portable tools, household appliances, etc.)
When measuring the primary electrical circuits of heavy equipment (fixed installations) connected directly to
the distribution panel, and feeders from the distribution panel to outlets.
When measuring the circuit from the service drop to the service entrance, and to the power meter and primary
overcurrent protection device (distribution panel).
Page 11
5
50 mm or more
50 mm or more
Operating Precautions
Operating Precautions
Follow these precautions to ensure safe operation and to obtain the full benefits of the various functions.
Before Use
• Before using the instrument for the first time, verify that it operates normally to ensure that no damage
occurred during storage or shipping. If you find any damage, contact your dealeror Hioki representative.
• Before using the instrument, make sure that the insulation on the connection cable is undamaged and that
no bare conductors are improperly exposed. Using the instrument in such conditions could cause an electric shock, so contact your dealer or Hioki representative for replacements.
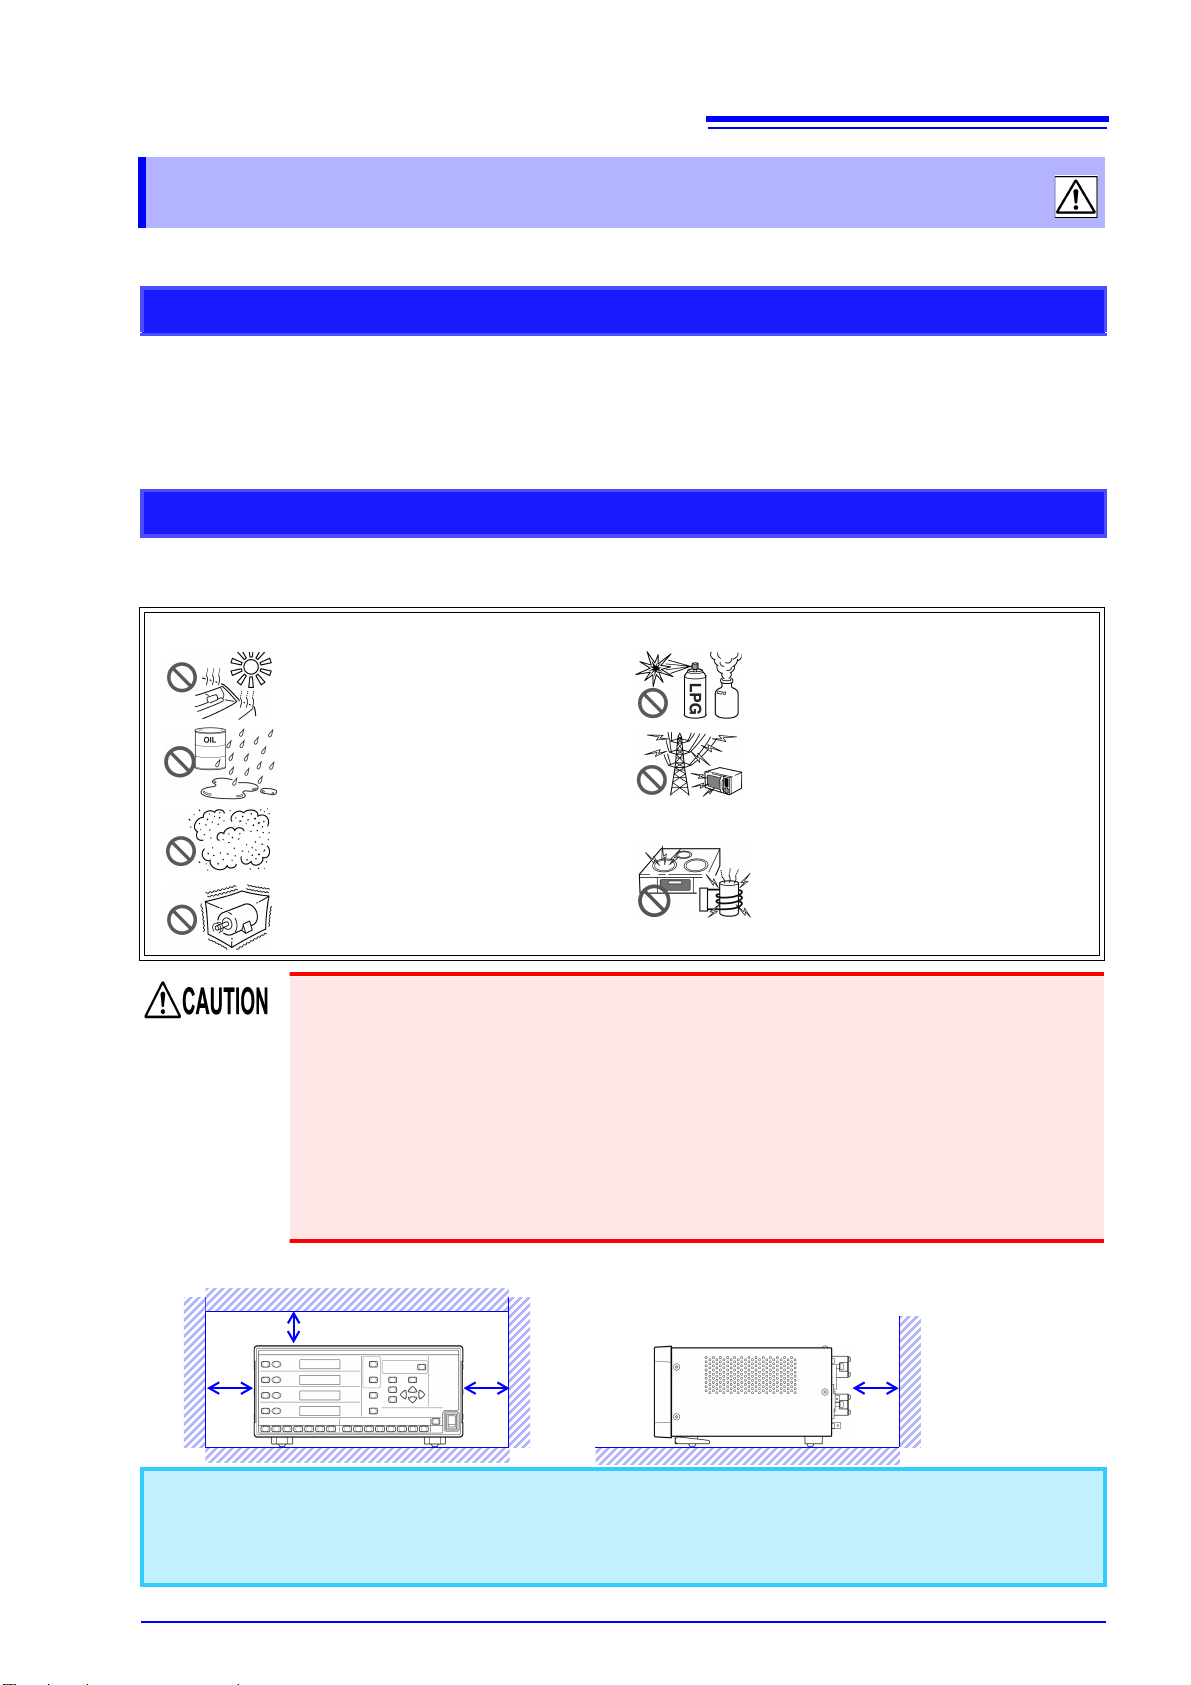
Instrument Installation
Operating temperature and humidity: 0°C to 40°C (32°F to 104°F) at 80% RH or less (non-condensating)
Temperature and humidity range for guaranteed accuracy: 23°C±5°C (73°F±9°F), 80%RH or less
Avoid the following locations that could cause an accident or damage to the instrument.
Exposed to direct sunlight
Exposed to high temperature
Exposed to water, oil, other chemicals,
or solvents
Exposed to high humidity or condensation
Exposed to high levels of particulate
dust
Subject to vibration
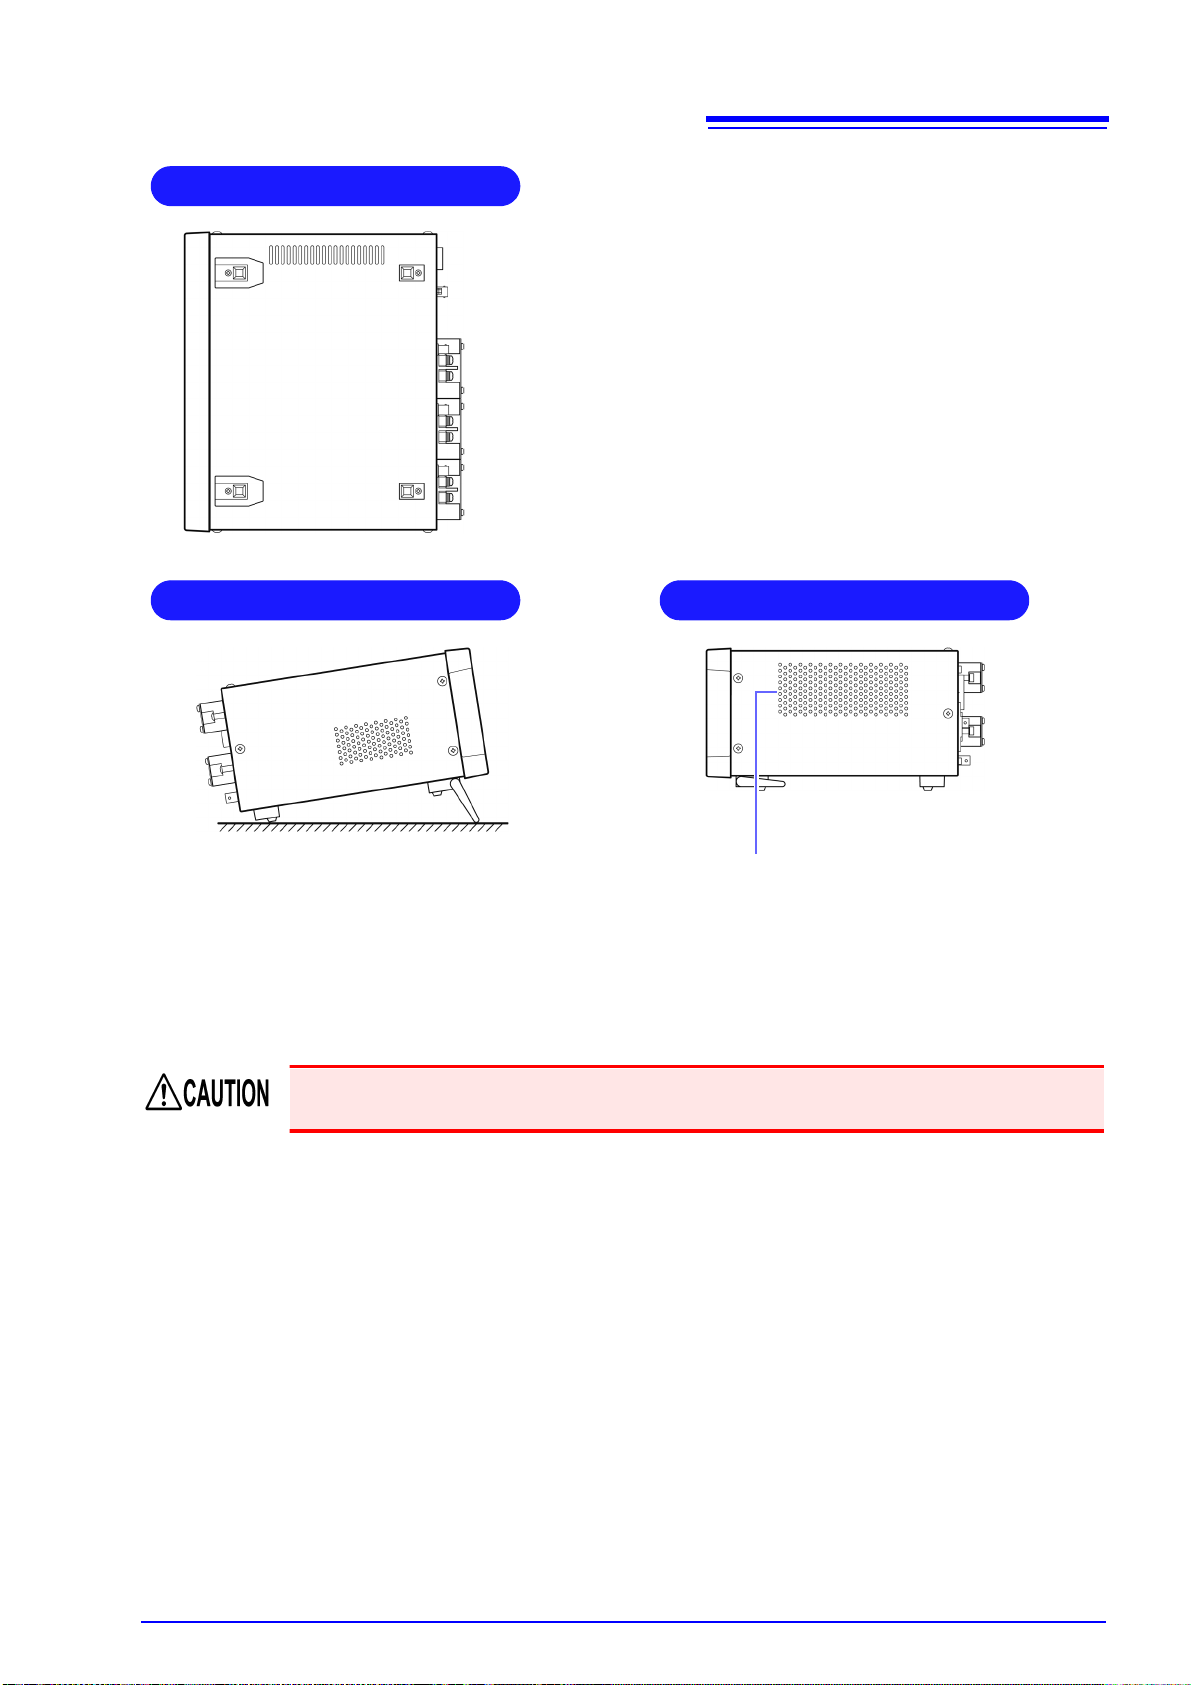
• Ventilation holes for heat radiation are provided on the side and rear panels of the
instrument. Leave sufficient space around the ventilation holes and install the
instrument with the holes unobstructed. Installation of the instrument with the ventilation holes obstructed may cause a malfunction or fire.
• Do not place another PW3336 or measuring instrument or other heat-generating
device underneath or on top of this instrument. Doing so may damage the instrument or cause burns or fire.
•
•
In the presence of corrosive or explosive
gases
Exposed to strong electromagnetic fields
Near electromagnetic radiators
Near induction heating systems
(e.g., high-frequency induction heating
systems and IH cooking utensils)
To prevent overheating, be sure to leave the specified clearances around the unit.
• Unplugging the power cord kills power to the instrument. Be sure to provide enough unobstructed space to
unplug the power cord immediately in an emergency.
• The instrument can be used with the stands flipped out.(p.21)
• To mount the instrument in a rack, refer to "Appendix 3 Rack Mounting" (p. A11)
Page 12
6
Operating Precautions
Handling the Instrument
To avoid electric shock, do not remove the instrument's case.
The internal components of the instrument carry high voltages and may become very
hot during operation.
• Do not allow the instrument to get wet, and do not take measurements with wet
hands. This may cause an electric shock.
• Touching any of the high-voltage points inside the instrument is very dangerous.
Do not attempt to modify, disassemble or repair the instrument ; as fire, electric
shock and injury could result.
• To avoid damage to the instrument, protect it from physical shock when transporting and
handling. Be especially careful to avoid physical shock from dropping.
• After use, always turn OFF the power.
• Do not allow any conductive foreign objects to enter through the vents. Doing so may
cause damage to the instrument.
This instrument may cause interference if used in residential areas. Such use must be avoided unless the
user takes special measures to reduce electromagnetic emissions to prevent interference to the reception of
radio and television broadcasts.
Handling the Cables
• The maximum input voltage is 1000 V DC/AC and the maximum input current to the
current direct input terminals is 70 A DC/AC.
Attempting to measure a voltage or current in excess of each of the maximum inputs
could destroy the instrument and result in personal injury or death.
• The maximum rated voltage between input terminals and the ground is as follows;
(CAT II) 1000 V DC, 1000 V AC
(CAT III) 600 V DC, 600 V AC
Attempting to measure voltages exceeding this level with respect to ground could
damage the instrument and result in personalnjury.
• The external current sensor input terminals are not insulated. The terminals are
exclusive to the optional current sensors. Attempting to input a voltage or current
other than the output from the optional clamp sensors into the external current sensor terminals could destroy the instrument and result in personal injury or death.
• When using the optional current sensors, do not measure a current in excess of the
current rating. This could destroy the instrument, the current sensor, or both. Also
this coud result in personal injury or death.
• This instrument should only be connected to the secondary side of a breaker, so the
breaker can prevent an accident if a short circuit occurs. Connections should never
be made to the primary side of a breaker, because unrestricted current flow could
cause a serious accident if a short circuit occurs.
• To avoid electrical accidents, confirm that all terminals are secure. The increased
resistance of loose connections can lead to overheating and fire.
(Tightening torque of the input terminals: 3 N·m)
Page 13

7
Operating Precautions
Observe the following to avoid electric shock and short circuits.
• Turn off the power to lines to be measured before making connections to terminals
to be measured and turning on the instrument.
• Be sure to connect the voltage input and current input terminals correctly. An incorrect connection could damage or short circuit this instrument.
• When connecting wires to the voltage input terminals, be careful to avoid shorting
between one terminal and another with the wires.
• Since the screws of the terminals could be loosened, do not move the cables connected to the terminals more than neccessary.
• Do not tie the cables connected to the input terminals in a bundle with the power
supply cord, the communication cables, the external I/O cables, or the current sensor cables. This may cause damage.
• Avoid stepping on or pinching cables, which could damage the cable insulation.
• To avoid breaking the cables, do not bend or pull them.
• To avoid damaging the power cord, grasp the plug, not the cord, when unplugging it from
the power outlet.
• Keep the cables well away from heat sources, as bare conductors could be exposed if the
insulation melts.
Before Connecting
• Before turning the instrument on, make sure the supply voltage matches that indicated on its power connector. Connection to an improper supply voltage may damage the instrument and present an electrical hazard.
• To avoid electrical accidents and to maintain the safety specifications of this instrument, connect the power cord provided only to a 3-contact (two-conductor + ground)
outlet.
See:Connection Methods : 2.3 Connecting the Power Cord (p.34)
• Use only the designated power cord with this instrument. Use of other power cords
may cause fire.
• Avoid using an uninterruptible power supply (UPS) or DC/AC inverter with rectangular wave or pseudo-sine-wave output to power the instrument. Doing so may damage the instrument.
When connecting cables to the input terminals, the communication connectors, or the
external I/O terminals, observe the following to avoid electric shock and short circuits.
• Always turn off the power to the instrument and any device to be connected before
making connections.
• Be careful to avoid exceeding the ratings of the input terminals or external control
terminals.
• During operation, a wire becoming dislocated and contacting another conductive
object can be serious hazard. Use the screws to secure the communication connectors.
Page 14

8
Operating Precautions
Input and Measurement
• The maximum input voltage is 1000 V DC/AC and the maximum input current to the
current direct input terminals is 70 A DC/AC.
Attempting to measure a voltage or current in excess of each of the maximum inputs
could destroy the instrument and result in personal injury or death.
• The maximum rated voltage between input terminals and the ground is as follows;
(CAT II) 1000 V DC, 1000 V AC
(CAT III) 600 V DC, 600 V AC
Attempting to measure voltages exceeding this level with respect to ground could
damage the instrument and result in personal injury.
• The external current sensor input terminals are not insulated. The terminals are
exclusive to the optional current sensors. Attempting to input a voltage or current
other than the output from the optional clamp sensors into the terminals could
destroy the instrument and result in personal injury or death.
• To avoid the danger of electric shock, do not input a signal in excess of the ratings
to the external I/O terminals.
• This instrument should only be connected to the secondary side of a breaker, so the
breaker can prevent an accident if a short circuit occurs. Connections should never
be made to the primary side of a breaker, because unrestricted current flow could
cause a serious accident if a short circuit occurs.
When connecting
Observe the following to avoid electric shock and short circuits.
• Turn off the power to lines to be measured before making connections to input terminals and turning on the instrument.
• When making connections, do not mix up the voltage input terminals (U) and the
current input terminals (I). In particular, do not input a voltage into the current input
terminals (between I and ±). Using the instrument with a faulty wiring will damage
the instrument or cause injury.
• Be careful to avoid shorting between the voltage input terminals with the wires.
When abnormalities such as smoke, unusual noise, or unusual odor are observed
Stop the measurement immediately, and observe the following procedure. Using the
instrument in such a abnormal condition could cause death or injury.
1. Turn off the power switch of the instrument.
2. Disconnect the power cord from the outlet.
3. Turn off the power to the line to be measured.
Remove the measurement cables.
4. Contact your dealer or Hioki representative.
Page 15

9
Operating Precautions
• For safety reasons, disconnect the power cord when the instrument is not used and before
connecting it to a device to be tested.
• To avoid damage to the instrument, do not input the voltage to the output terminals. Also do
not short between any terminals.
• When the instrument is turned off, do not apply voltage or current to the instrument. Doing
so may damage the instrument.
• Do not connect or disconnect connection cords from the current sensor or CT9555 series
Sensor Unit while the instrument is turned on. Doing so may damage the instrument, current sensor, or CT9555 series Sensor Unit.
• Do not input current to the current sensor when it is not connected to the instrument or
when the instrument and CT9555 series Sensor Unit are turned off. Doing so may damage
the current sensor, instrument, or CT9555 series Sensor Unit.
• Correct measurement may be impossible in the presence of strong magnetic fields, such as near transformers and high-current conductors, or in the presence of strong electromagnetic fields such as near
radio transmitters.
To measure accurately
• Warm up the instrument for more than 30 minutes before use.
• To maintain sufficient measurement accuracy of the instrument, be sure to help heat radiation.
e.g.) Keeping away the instrument from a heat, leaving sufficient clearances around the instrument,
installing cooling fans to the rack in which the instrument is mounted, or other measures.
• The recommended calibration interval of the instrument is one year.
• The warranty period of the instrument is three years.
Page 16

10
Operating Precautions
Page 17
11
Support for all power lines
Guaranteed accuracy up to 65 A with direct input
High-accuracy, wide-band performance
Standard harmonic measurement function complying with
IEC 61000-4-7:2002 (p.71)
1.1 Product Overview
Overview Chapter 1
1.1 Product Overview
The PW3336/ PW3337 is a power meter with power measurement capabilities for the full range of electrical
equipment, from single-phase devices such as battery-driven devices and household electronics to industrialuse and three-phase electrical equipment.
The instrument provides coverage from DC to inverter frequencies with support for voltages up to 1000 V and
direct-input currents of up to 65 A. It can also measure currents of up to 5000 A using an optional current sensor.
1.2 Features
• : These instruments provide two channels each of voltage
input and current input.
• : These instruments provide three channels each of voltage
input and current input.
• Since all channels are isolated, the instrument can simultaneously measure multiple circuits.
• It supports measurement lines from single-phase to 3-phase/4-wire.
• With 3-phase/3-wire measurement lines, the instrument can measure either voltage between lines (3V3A)
or phase voltage (3P3W3M) using vector calculations simply by switching its line setting (input terminal
connections remain the same).
• Accuracy is guaranteed for currents of up to 65 A with direct input.
• (The maximum input current is 70 A, ±100 Apeak.)
• An optional current sensor can be used to measure currents in excess of 65 A. (p.102)
• The instrument delivers a high fundamental accuracy of ±0.15% rdg. (at less than 50% of range, ±0.1% rdg.
±0.05% f.s.).
• Over a wide band from DC and 0.1 Hz to 100 kHz, the instrument covers not only the fundamental frequency band for inverter-driven equipment, but also the carrier frequency band.
• Power factor effects are low at ±0.1% f.s. (with a internal circuit voltage/current phase difference of
±0.0573°), allowing high-accuracy measurement of active power during low power-factor operation, for
example during no-load testing of transformers and motors.
• The instrument can perform harmonic measurement in compliance with the IEC 61000-4-7:2002 international standard on harmonic measurement methods.
• You can set an upper limit for the analyzed order from the 1st to 50th order according to the harmonic measurement standard in use.
Page 18
12
Extensive measurement functionality, standard
High-speed D/A output to capture harsh load variations (p.88)
Building a system with 3 interfaces (p.117)
Synchronized control function with support for measurement of even
more channels (p.81)
1.2 Features
• Since processing for functions such as AC+DC (RMS), AC+DC Umn (voltage average value rectified RMS
equivalent), DC (DC component), AC (AC component), FND (fundamental wave component), and harmonic measurement as well as integration measurement can be performed internally and in parallel, it is
possible to obtain simultaneous measured values simply by switching the display.
• Since the measurement range and other parameters can be set independently for each channel, it is possible to measure input-output efficiency for inverters and other power supply devices. (p.78)
• The active power level can be output for each cycle for the voltage or current assigned to the synchronization source.
• Variations over extended periods of time can be recorded by using the instrument in conjunction with equipment such as a recorder or data logger using level output (updated every 200 ms) for each channel’s voltage, current, and active power as well as associated sum values and three user-selected parameters.
• Safe, insulated waveforms can be observed using waveform output (equivalent to a sampling rate of
approximately 87.5 kHz) for each channel’s instantaneous voltage, instantaneous current, and instantaneous power.
• You can control the instrument or capture data from it using a computer by using the standard RS-232C or
LAN interface. (You can also communicate with a computer over USB by using a commercially available
USB serial conversion cable.)
• The instrument also provides a GP-IB interface, an essential capability when building such systems.
( )
• Simultaneous measurement can be performed by connecting two instruments with an optional BNC cable.
• Calculations, display updates, data updates, integration control, display hold timing, zero-adjustment, and
key lock operation of the instrument set as the slave (IN setting) are matched to the master instrument
(OUT setting).
Page 19

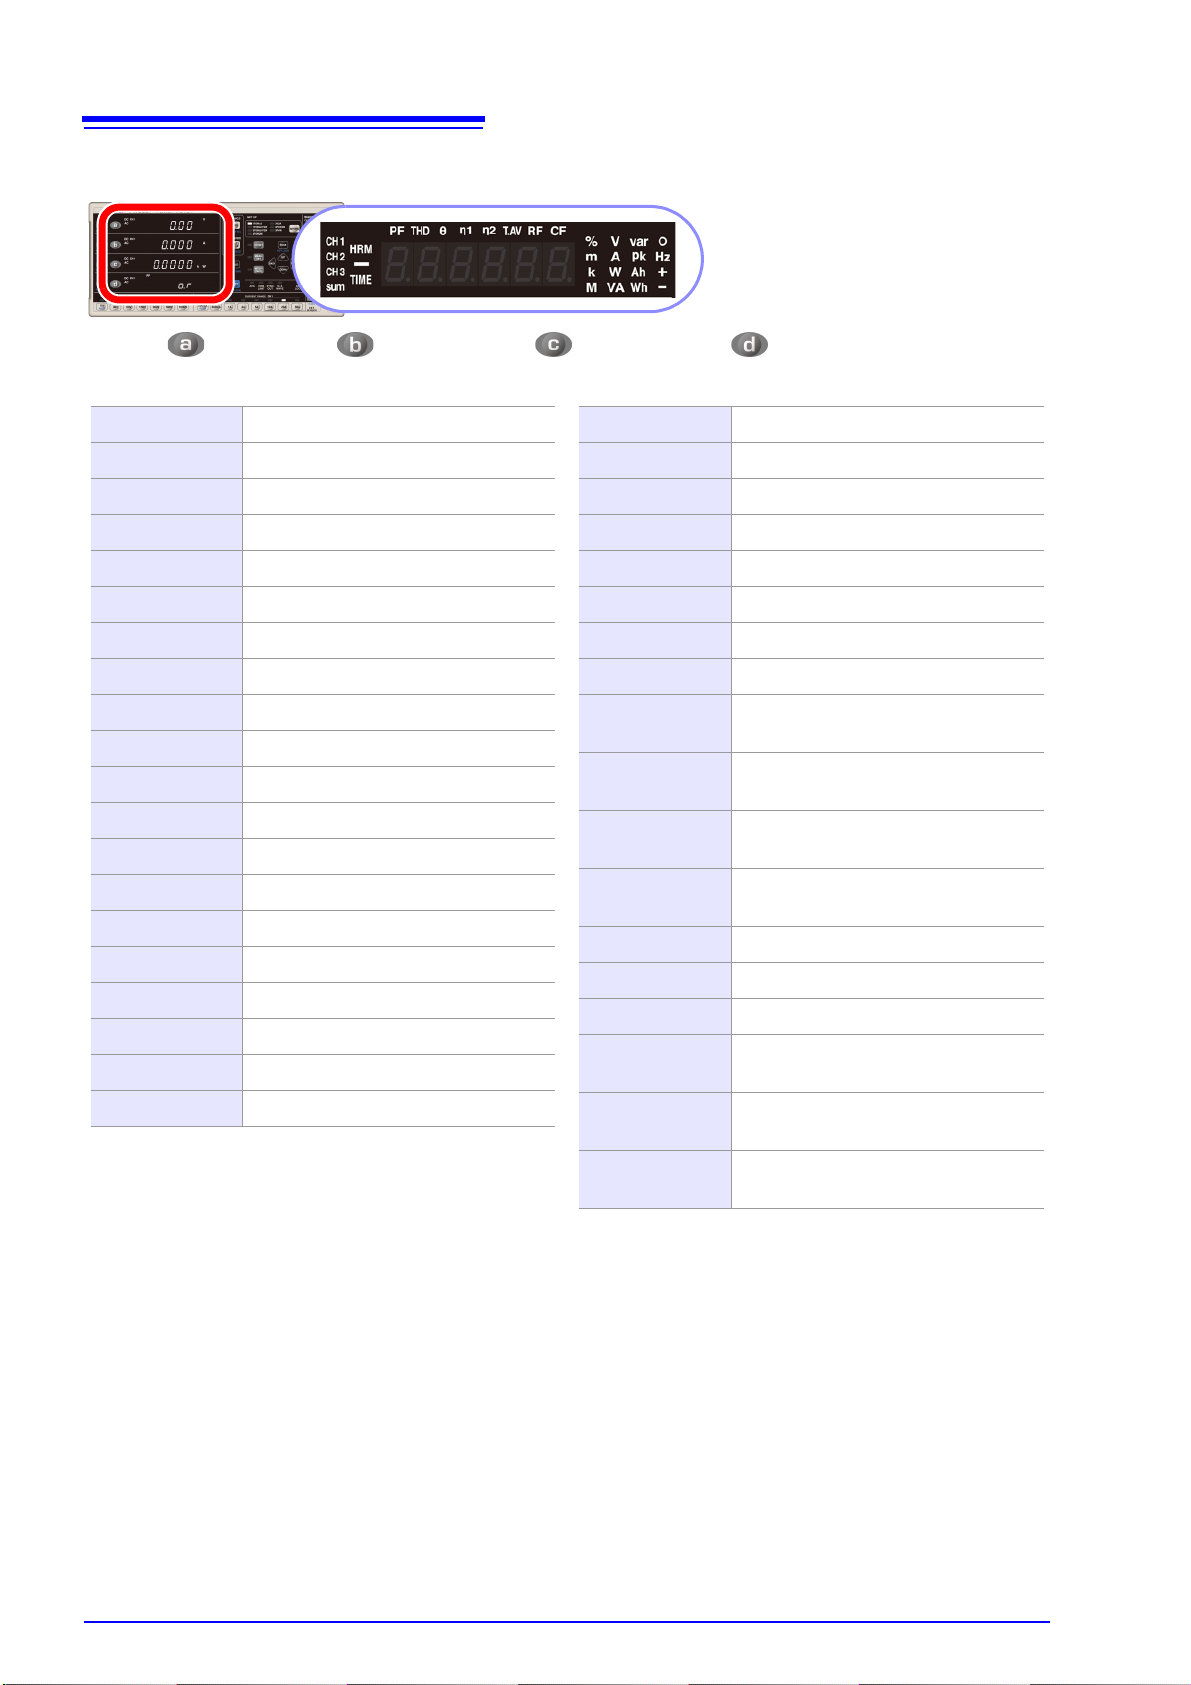
1.3 Names and Functions of Parts
Function setting status lamps
(for each channel) (p.18)
Light up to indicate when settings differ
from default settings.
CH/ RECTIFIER (p.46)
Switches the displayed channel and
rectifier (in the shift state).
Parameter keys (p.14)
Switch display parameters.
Warning lamps
(for each channel)
(p.19)
Current range (p.48)
(Pressing 200 mA in the
shift state selects autorange operation.)
CH
Switches the channel to configure.
(For both voltage
and current)
POWER switch (p.35)
Turns the instrument on and off.
Front Panel
Display
Switches between measured
values and setting values.
Voltage range (p.48)
(Pressing 15 V in the
shift state selects autorange operation.)
e.g.) PW3337-03
HRM/ ORDER SEL
Harmonic display (switch among level, content percentage, and
normal display)
HOLD/ MAX/ MIN
Holds display values, switches between maximum and minimum
values (in the shift state).
SHIFT/ EXIT/ LOCAL
Activates/deactivates the shift state; exits settings mode or remote
mode.
START/STOP /DATA RESET
Starts/stops integration, resets integrated values (in the shift state).
Function setting
keys (p.40)
Configure functions.
Function setting status lamps
(p.18)
Light up to indicate activated functions.
1.3 Names and Functions of Parts
13
The shift state is automatically canceled after Approx. 10 seconds. When the RECTIFIER key or a parameter
key is pressed, the shift state is canceled after Approx. 2 seconds.
Page 20
14
Pressing on the first row, on the second row, on the third row, or on the fourth row of the measured
value display switches the display parameter, causing the selected display parameter to light up.
V Voltage (U)
A Current(I)
W Active power (P)
VA Apparent power (S)
Var Reactive power (Q)
PF Power factor (λ)
° Phase angle (φ)
V Hz Voltage frequency (f)
A Hz Current frequency (f)
Ah + Positive current integration
Ah - Negative current integration
Ah Current integration sum
Wh + Positive active power integration
Wh - Negative active power integration
Wh Active power integration sum
TIME Integration time
V pk Voltage waveform peak value (Upk)
A pk Current waveform peak value (Ipk)
η1 % Efficiency (η)
η2 % Efficiency (η)
CF V Voltage crest factor (Ucf)
CF A Current crest factor (Icf)
T.AV A Time average current (T.AV I)
T.AV W Time average active power (T.AV P)
RF V % Voltage ripple rate(Urf)
RF A % Current ripple rate(Irf)
THD V % Total harmonic voltage distortion (Uthd)
THD A % Total harmonic current distortion (Ithd)
θ V ° CH1 CH2
Inter-channel voltage fundamental
wave phase difference (θU2-1)
θ V ° CH1 CH3
Inter-channel voltage fundamental
wave phase difference (θU3-1)
θ A ° CH1 CH2
Inter-channel current fundamental
wave phase difference (θI2-1)
θ A ° CH1 CH3
Inter-channel current fundamental
wave phase difference (θI3-1)
HRM V LEVEL Harmonic voltage RMS value (Uk)
HRM A LEVEL Harmonic current RMS value (Ik)
HRM W LEVEL Harmonic active power (Pk)
HRM V % HD%
Harmonic voltage content percentage
(UHDk)
HRM A % HD%
Harmonic current content percentage
(IHDk)
HRM W % HD%
Harmonic active power content percentage (PHDk)
1.3 Names and Functions of Parts
Display parameters
Page 21
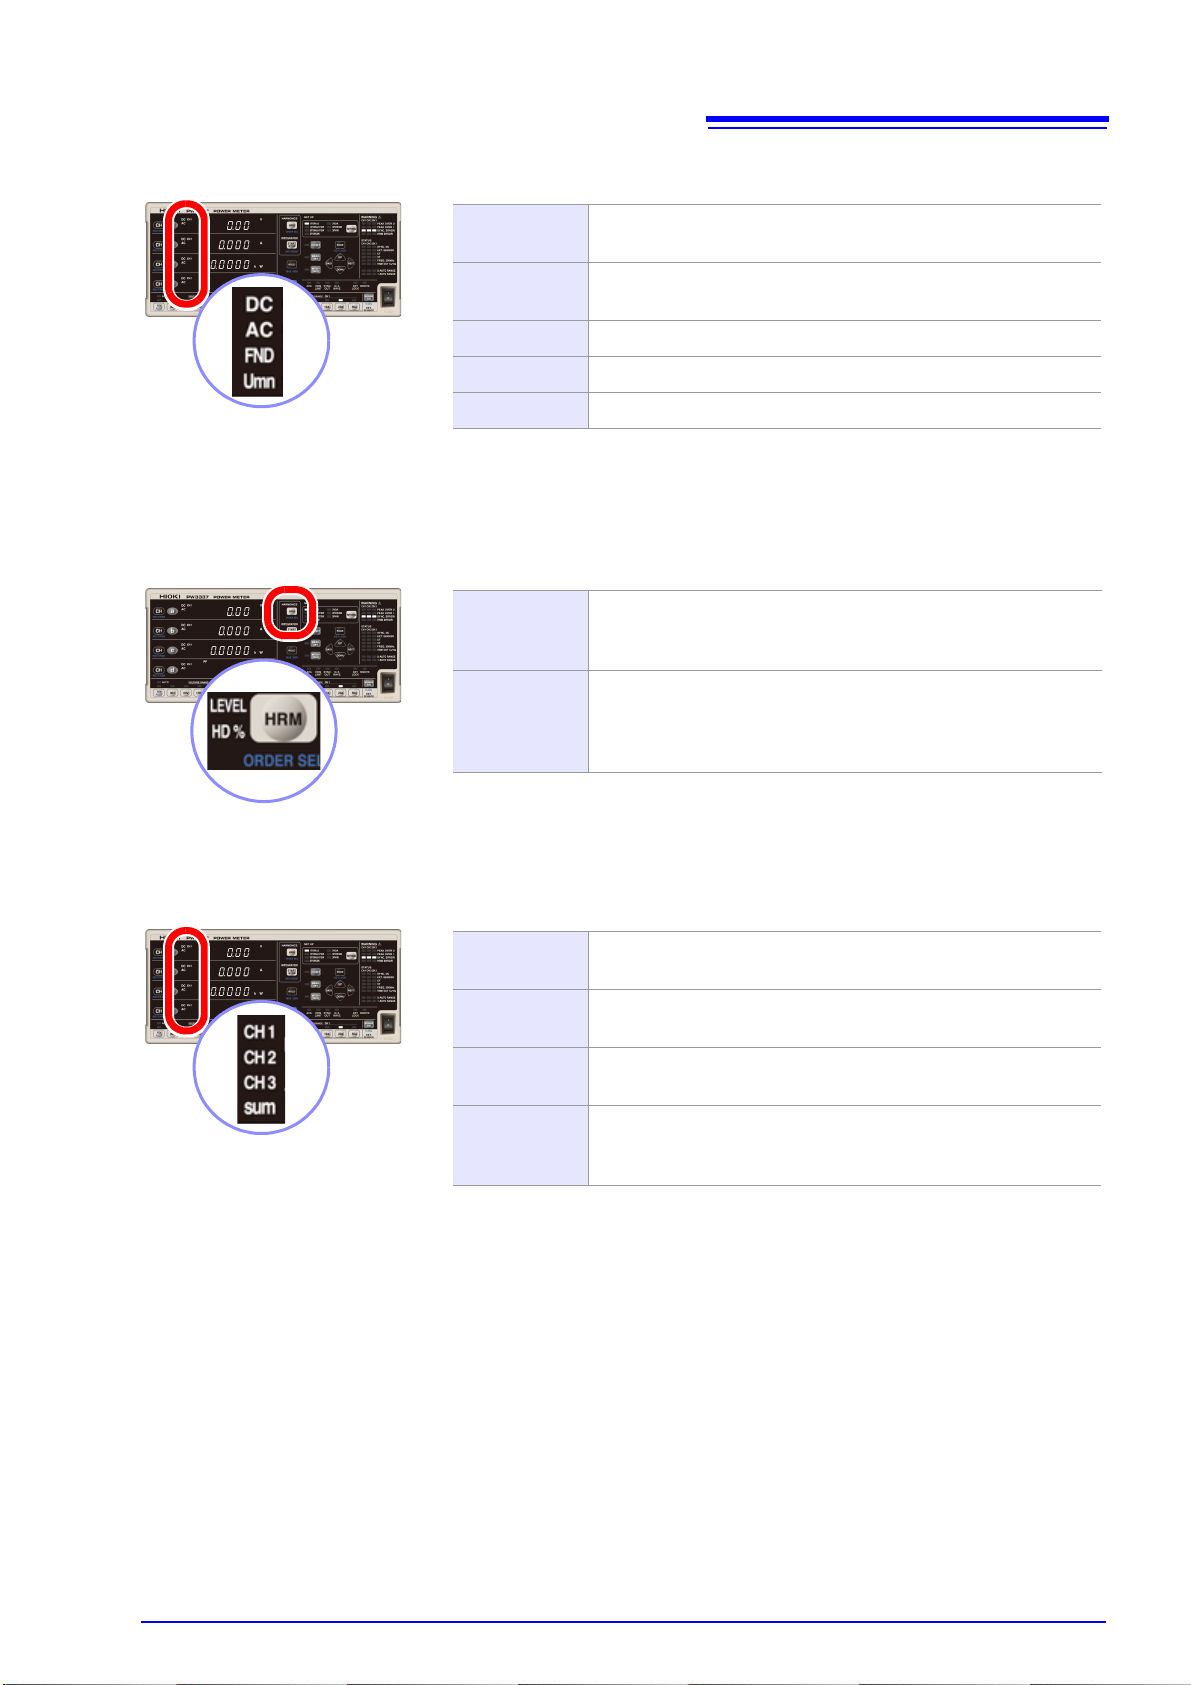
1.3 Names and Functions of Parts
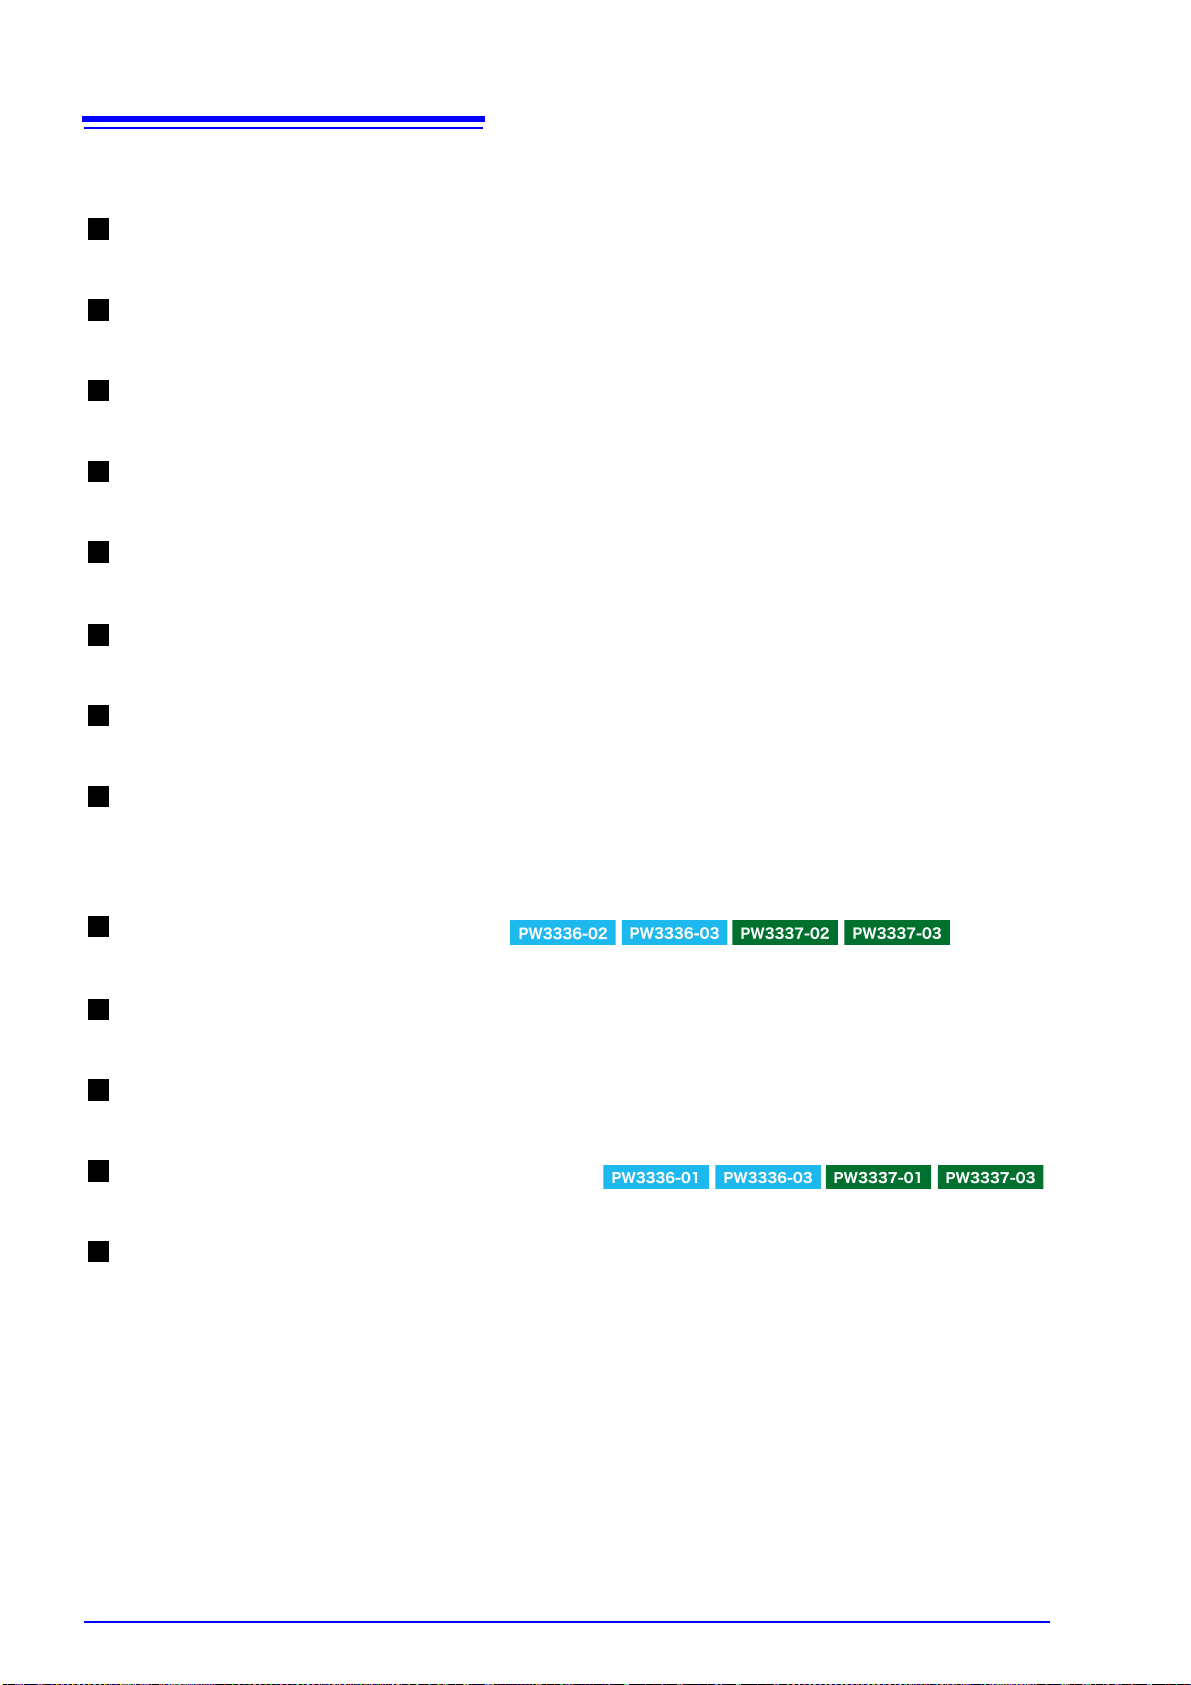
DC AC
When using the AC+DC rectifier, both the DC and AC lamps light
up.
DC AC Umn
When using the AC+DC Umn rectifier, the DC, AC, and Umn
lamps light up.
DC Lights up when using the DC rectifier.
AC Lights up when using the AC rectifier.
FND Lights up when using the FND rectifier.
LEVEL
Lights up when the instrument is displaying a harmonic component level (harmonic voltage RMS value, harmonic current RMS
value, or harmonic active power).
HD%
Lights up when the instrument is displaying a harmonic content
percentage (harmonic voltage content percentage, harmonic
current content percentage, or harmonic active power content
percentage).
CH1
Lights up when the instrument is displaying the CH1 measured
value for the selected display parameter.
CH2
Lights up when the instrument is displaying the CH2 measured
value for the selected display parameter.
CH3
Lights up when the instrument is displaying the CH3 measured
value for the selected display parameter.
sum
Lights up when the instrument is displaying the measured value
for the sum of the selected display parameters when using a wiring mode other than 1P2W.
Rectifier indicator lamps (p.47)
Harmonic measurement (HARMONICS) lamps (p.71)
15
CH1, CH2, CH3, and sum lamps
Page 22
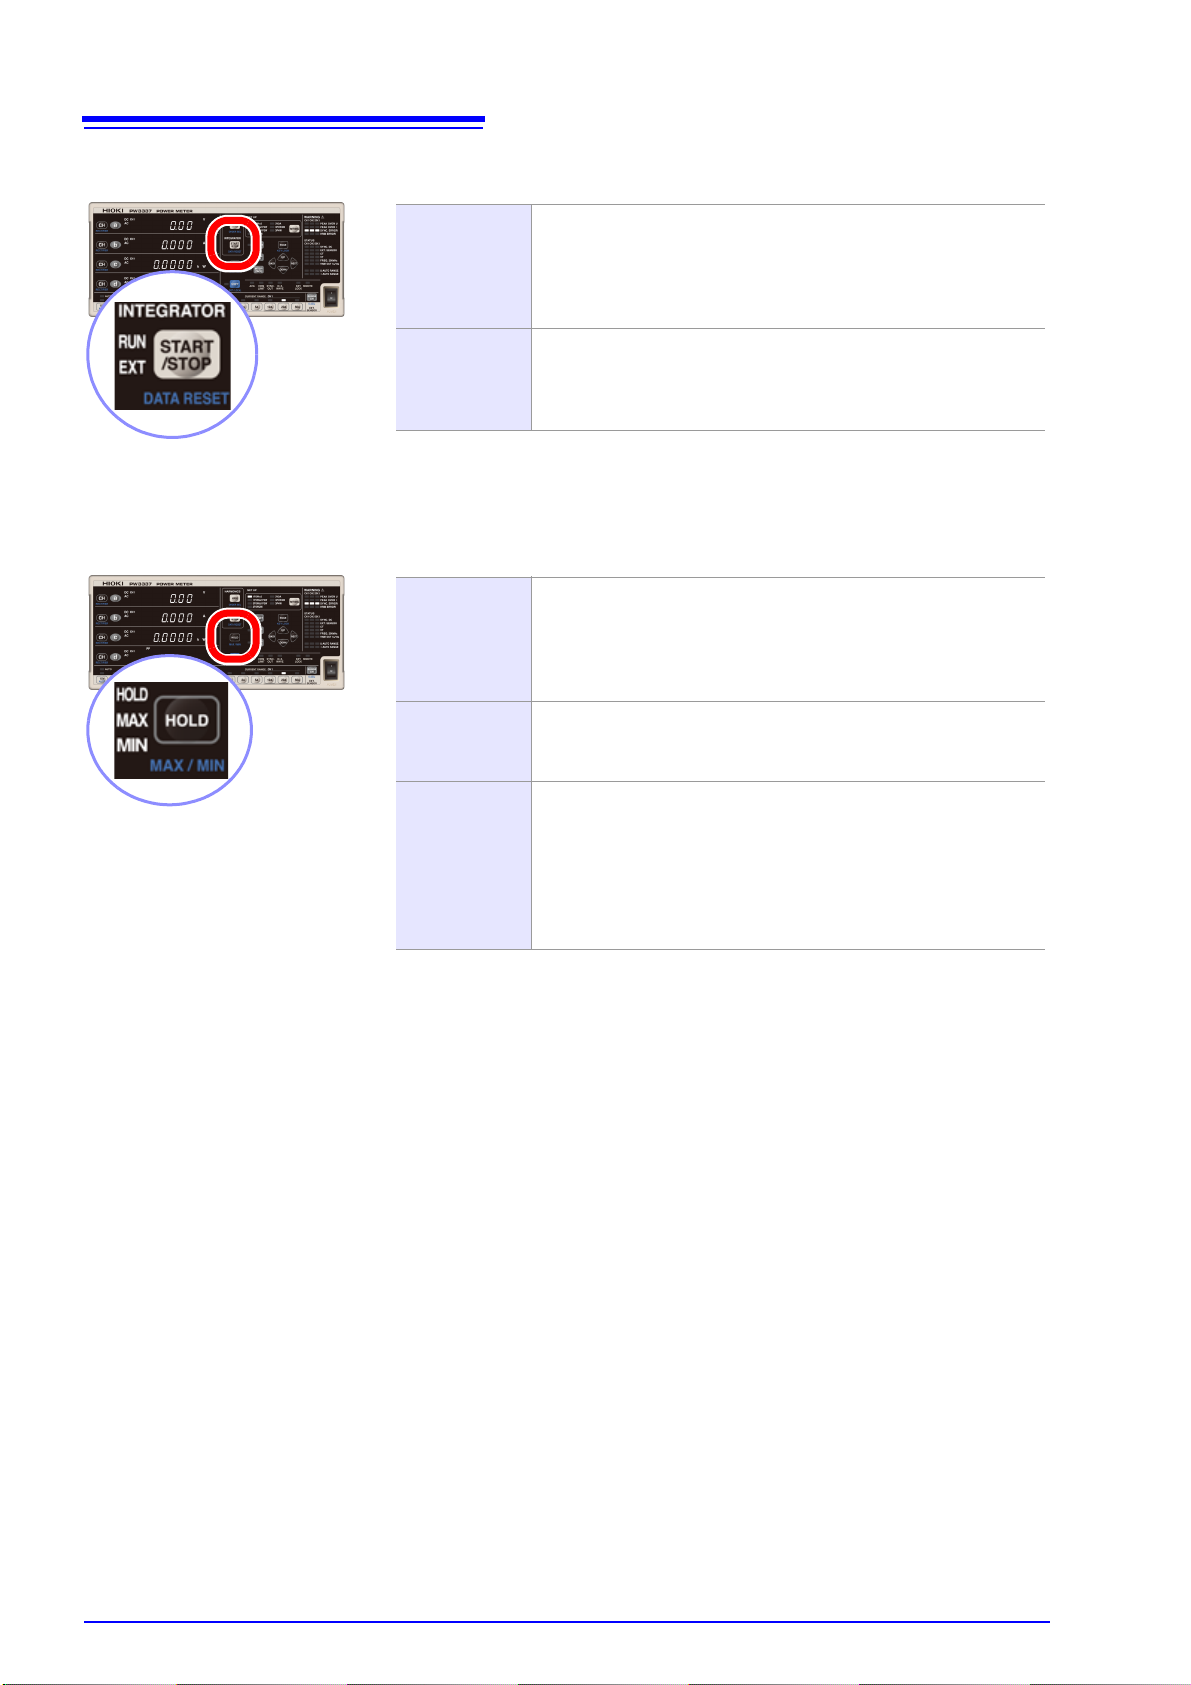
16
RUN
Indicates the status of integration based on START/STOP key
operation or communications.
RUN lamp on: Integration active
RUN lamp flashing: Integration stopped
RUN lamp off: Integration reset
RUN EXT
Indicates the status of integration based on external control.
RUN lamp on, EXT lamp on: Integration active
RUN lamp flashing, EXT lamp on: Integration stopped
RUN lamp and EXT lamp off: Integration reset
HOLD
Lights up when display hold is activated by pressing the HOLD
key.
To cancel display hold: Pressing the HOLD key once more
causes the display hold state to be canceled and the HOLD lamp
to be turned off.
MAX
When the HOLD, MAX, and MIN lamps are all off, pressing the
SHIFT key and then the HOLD key causes the maximum value
to be held and the MAX lamp to light up.
MIN
Pressing the HOLD key while the MAX lamp is lit up (indicating
that the maximum value is being held) causes the minimum value to be held and the MIN lamp to light up.
Pressing the HOLD key while the MIN lamp is lit up (indicating
that the minimum value is being held) causes the minimum value
hold to be canceled, returning to the normal measured value display.
1.3 Names and Functions of Parts
Integration (INTEGRATOR) status indicator lamps (p.62)
Hold (HOLD) status indicator lamp (p.108)
Page 23
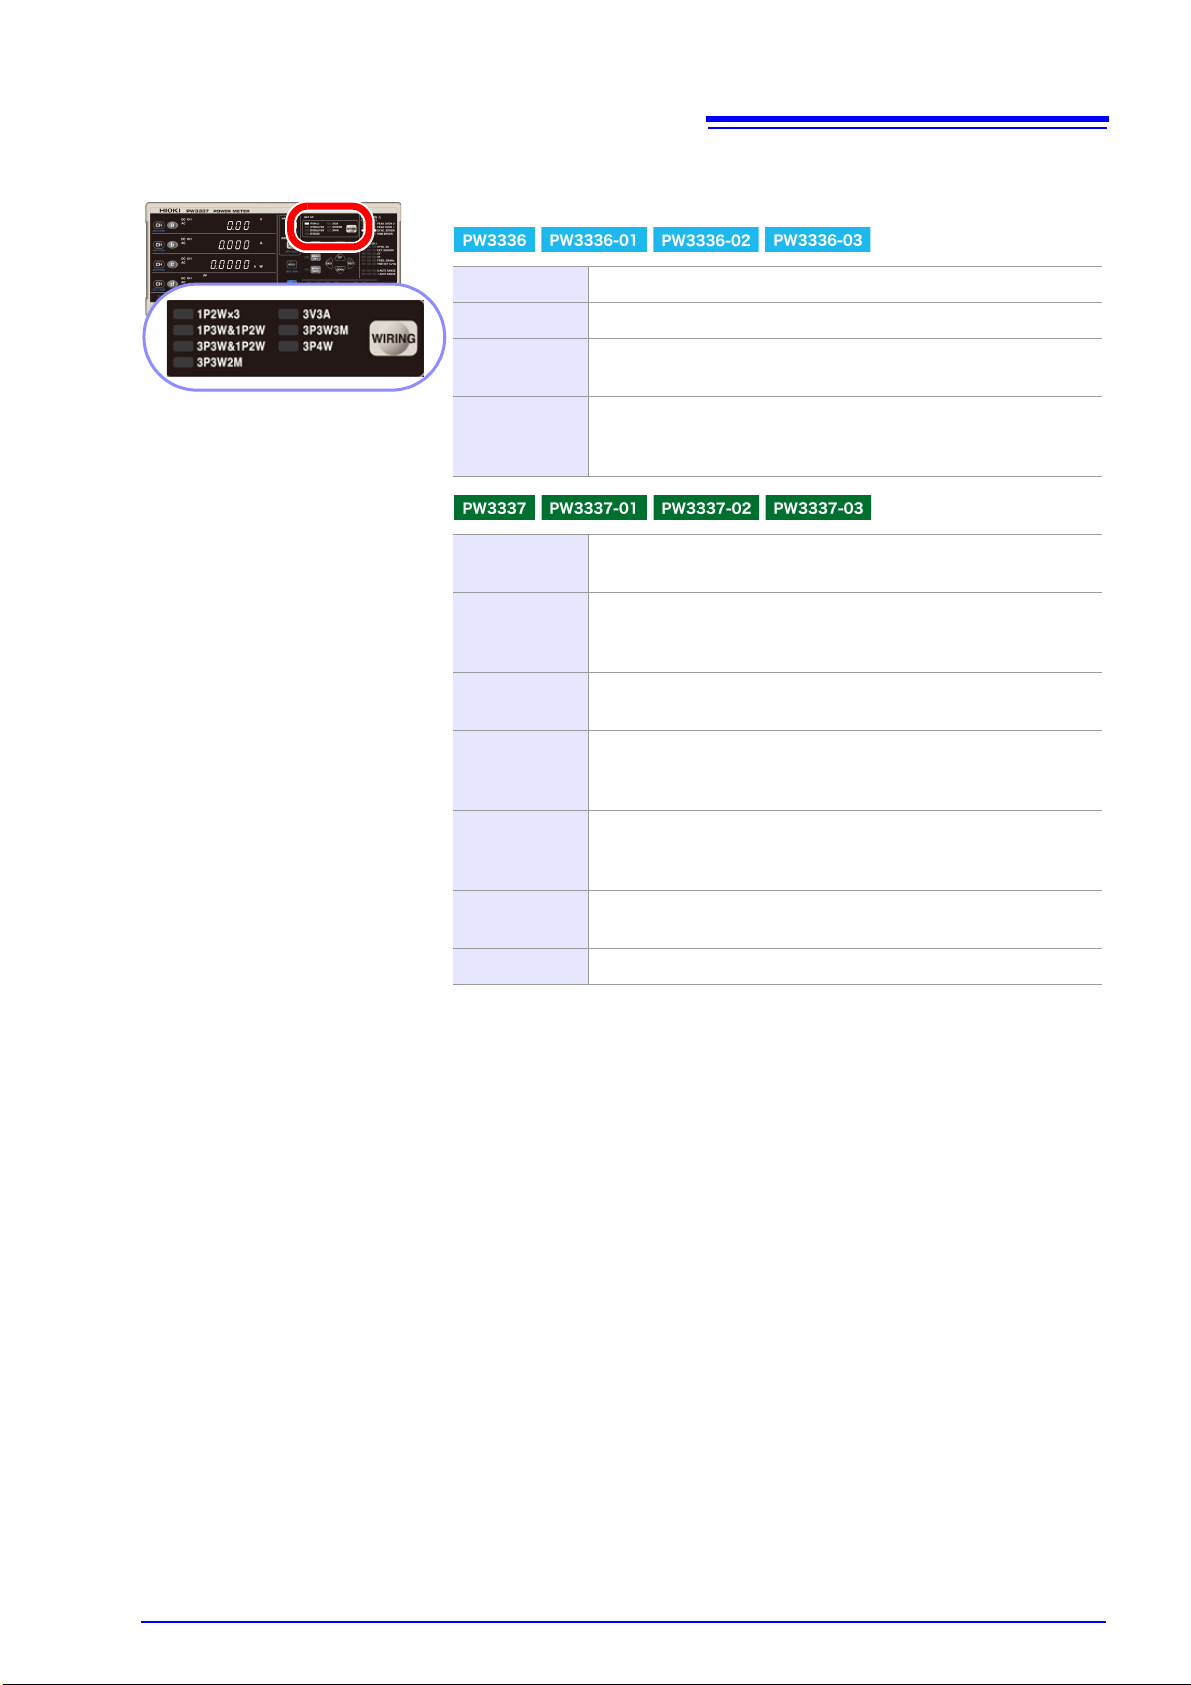
Wiring (WIRING) mode indicator lamps (p.40)
These lamps light up when the following wiring modes are selected:
1P2W×2 1-phase/2-wire × 2 circuits (CH1 and CH2 are 1-phase/2-wire.)
1P3W 1-phase/3-wire
3P3W
3-phase/3-wire, active power measurement using the two-power-meter method
3P3W2M
3-phase/3-wire, active power measurement using the two-power-meter method (Displays line voltage and phase current, which
are not measured, using vector calculations.)
1P2W×3
1-phase/2-wire × 3 circuits (CH1, CH2, and CH3 are 1-phase/2wire)
1P3W&1P2W
1-phase/3-wire & 1-phase/2-wire (CH1 and CH2 are 1-phase/3wire, Active power is measured by 2-power measurement method, and CH3 is 1-phase/2-wire.)
3P3W&1P2W
3-phase/3-wire & 1-phase/2-wire (CH1 and CH2 are 3-phase/3wire, and CH3 is 1-phase/2-wire.)
3P3W2M
3-phase/3-wire, active power measurement using the two-power-meter method (Displays wire voltage and phase current,
which are not measured, using vector calculations.)
3V3A
3-phase/3-wire, active power measurement using the two-power-meter method (Actually measures and displays all wire voltages and phase currents.)
3P3W3M
3-phase/3-wire (Converts and displays wire voltages and phase
voltages using vector calculations with 3V3A wiring.)
3P4W 3-phase/4-wire
17
1.3 Names and Functions of Parts
Page 24
18
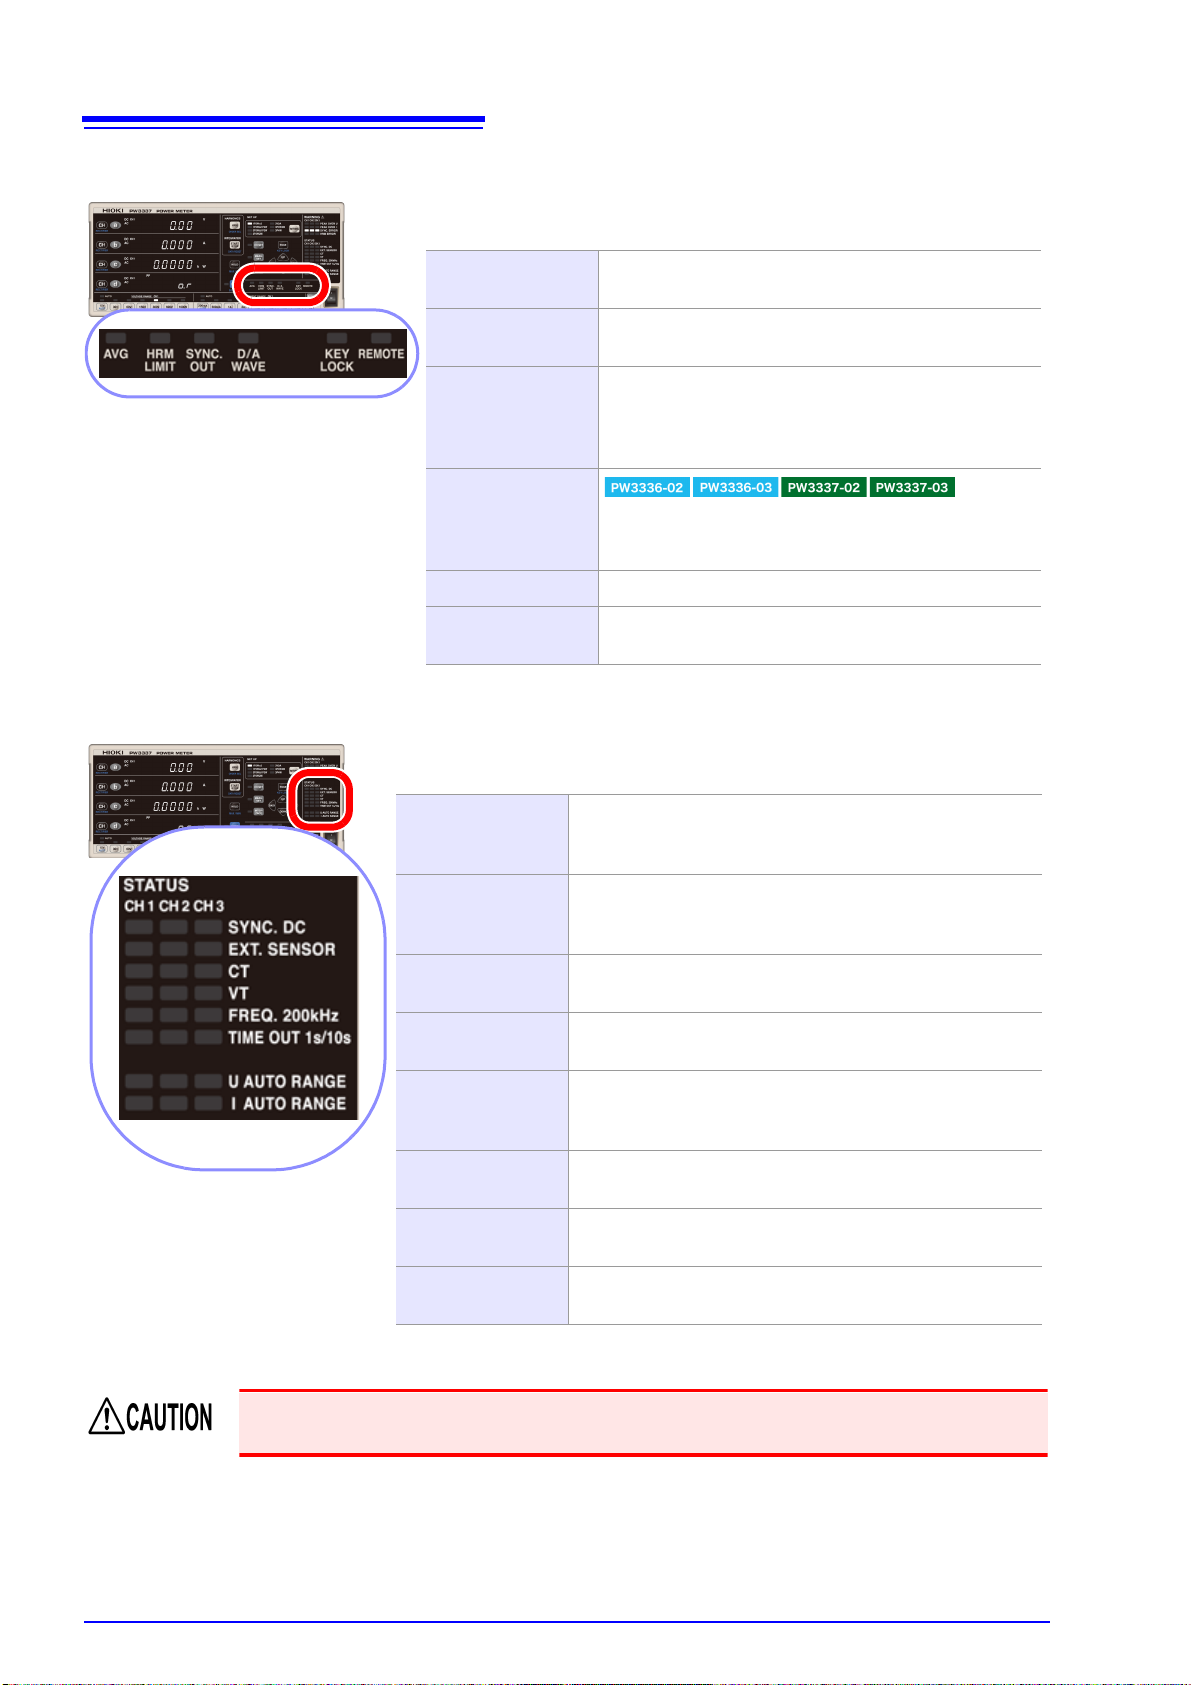
These lamps indicate the instrument’s overall setting status. They light up
when the corresponding function is ON.
AVG
Lights up when the number of averaging iterations is
set to a value other than the default value of 1.(p.57)
HRM LIMIT
Lights up when the harmonic analysis order upper limit
is set to a value other than the default value of 50.(p.71)
SYNC. OUT
Lights up when the synchronized measurement I/O setting is set to OUT (Master). Flashes with external synchronized signal input when set to IN (Slave). Turns off
when set to OFF.(p.81)
D/A WAVE
Lights up when the D/A output setting is set to waveform/high-speed active power level output (the default
setting is level output). (p.88)
KEY LOCK Lights up when key operation is disabled. (p.111)
REMOTE
Lights up when the instrument is in remote operation
mode. (p.134)
These lamps indicate the setting status for each channel. Function lamps light up
when set to a value other than the default setting.
SYNC. DC
Lights up when the synchronization source is set to DC (the
default setting is each channel’s voltage: U1, U2, and U3).
(p.51)
EXT. SENSOR
Lights up when the current input method setting is set to
TYPE1 or TYPE2 (current sensor input) (the default setting
is OFF [current value direct input]). (p.42)
CT
Lights up when the CT ratio setting is set to a value other
than the default setting of 1. (p.59)
VT
Lights up when the VT ratio setting is set to a value other
than the default setting of 1. (p.59)
FREQ. 200kHz
Lights up when the zero-cross and frequency measurement
filter setting is set to 100 Hz, 5 kHz, or 200 kHz (the default
setting is 500 Hz). (p.53)
TIME OUT 1s/10s
Lights up when the synchronization detection timeout is set
to 1 sec. or 10 sec. (the default setting is 0.1 sec.). (p.55)
U AUTO RANGE
Lights up when the voltage measurement range is set to
auto range (the default setting is auto range OFF). (p.48)
I AUTO RANGE
Lights up when the current measurement range is set to
auto range (the default setting is auto range OFF). (p.48)
1.3 Names and Functions of Parts
Setting status indicator lamps
When the VT and CT lamps are lit up, note that voltage and current inputs differ from the
displayed measured values.
Page 25
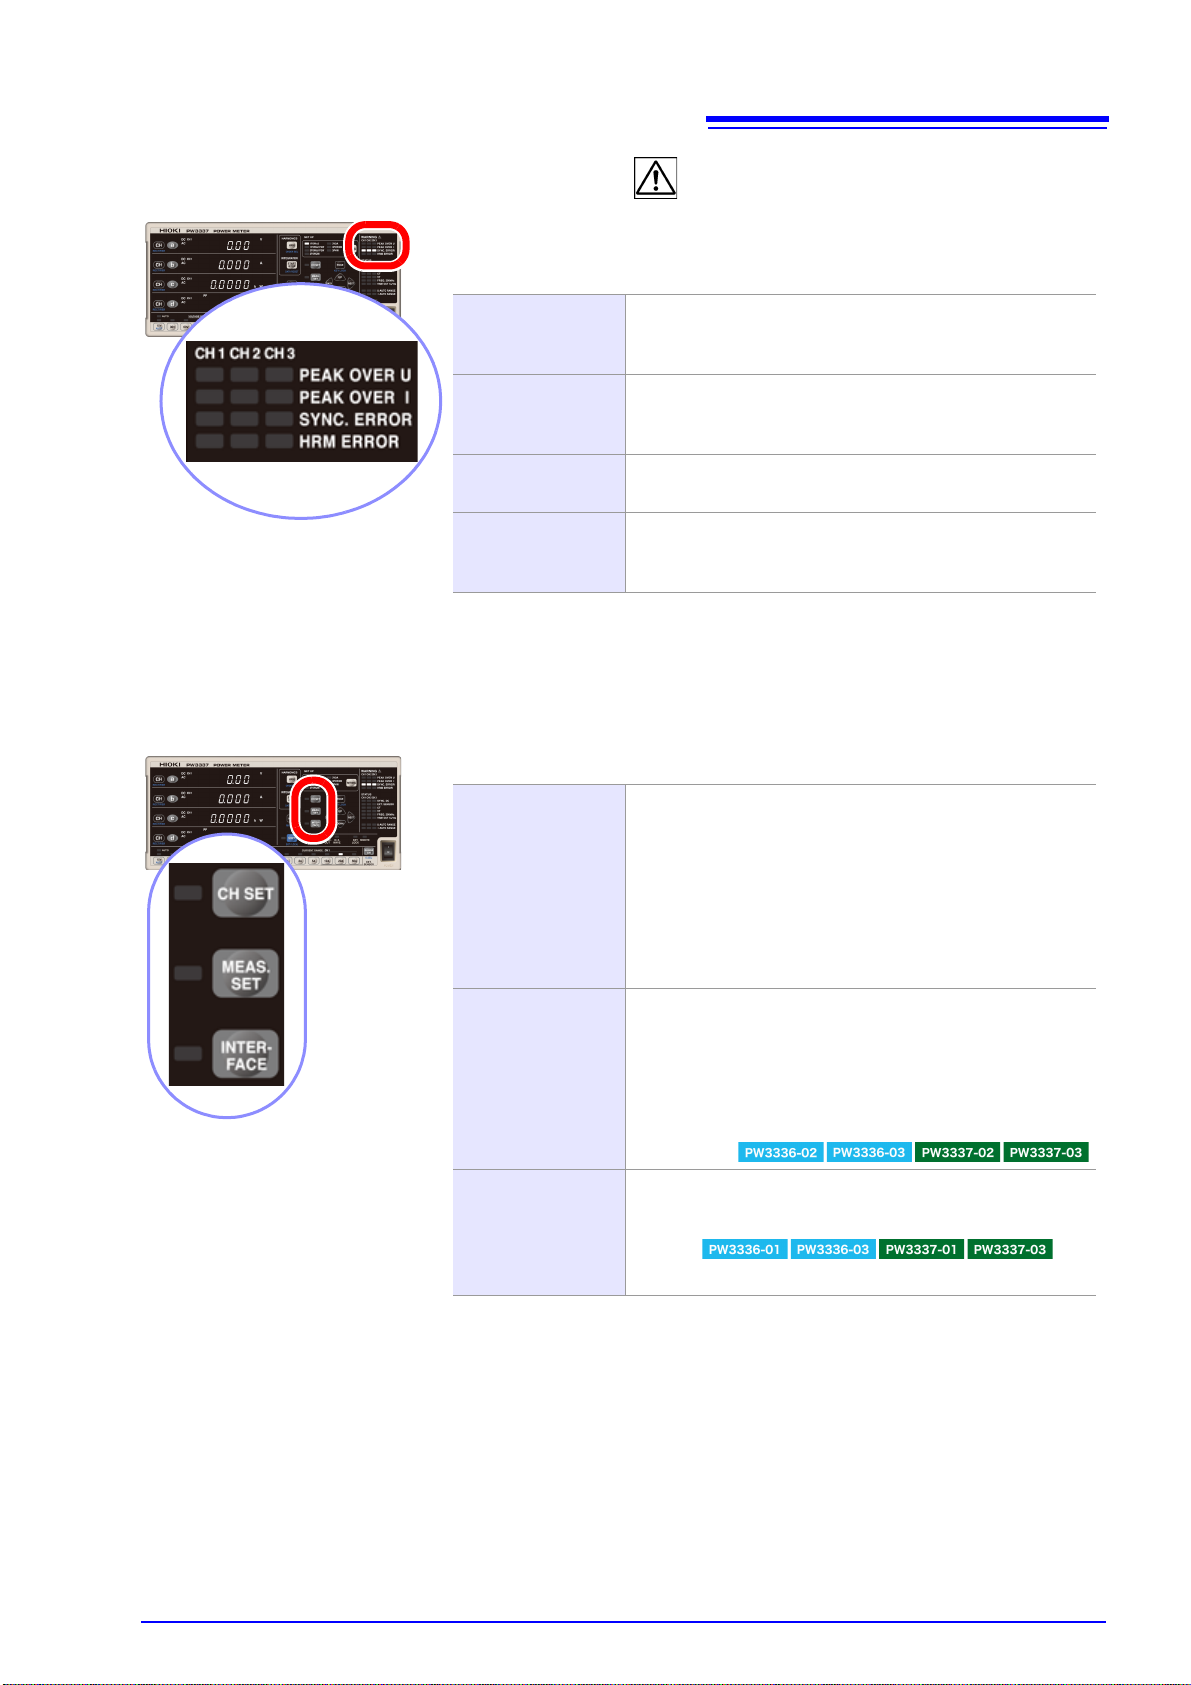
Warning (WARNING) indicator lamps
These lamps indicate channel warnings. When the following warning lamps and error lamps are lit up, they indicate a hazardous state or inability to perform measurement accurately:
PEAK OVER U
Lights up when an overvoltage input warning occurs, indicating that the input voltage peak value has exceeded
±1500 V or ±600% of the voltage measurement range.
PEAK OVER I
Lights up when an overcurrent input warning occurs, indicating that the input current peak value has exceeded ±100
A or ±600% of the current measurement range.
SYNC. ERROR
Lights up when a synchronization error occurs, indicating
that synchronization cannot be detected.
HRM ERROR
Lights up when a harmonic measurement synchronization
error occurs, indicating that the harmonic measurement
synchronization frequency range was exceeded.
These lamps light up in response to settings on the following setting screens:
CH SET
Channel settings
• Synchronization source
• Current input method
•CT ratio
•VT ratio
• Zero-cross and frequency measurement filter
• Synchronization detection timeout
MEAS. SET
Shared settings that apply to all channels
• Integration time
• Number of averaging iterations
• Harmonic analysis upper limit order
• Synchronized measurement I/O (master, slave)
• D/A output
INTERFACE
Interface settings
• RS-232C
•GP-IB
•LAN
19
1.3 Names and Functions of Parts
Setting screen indicator lamps
Page 26
20
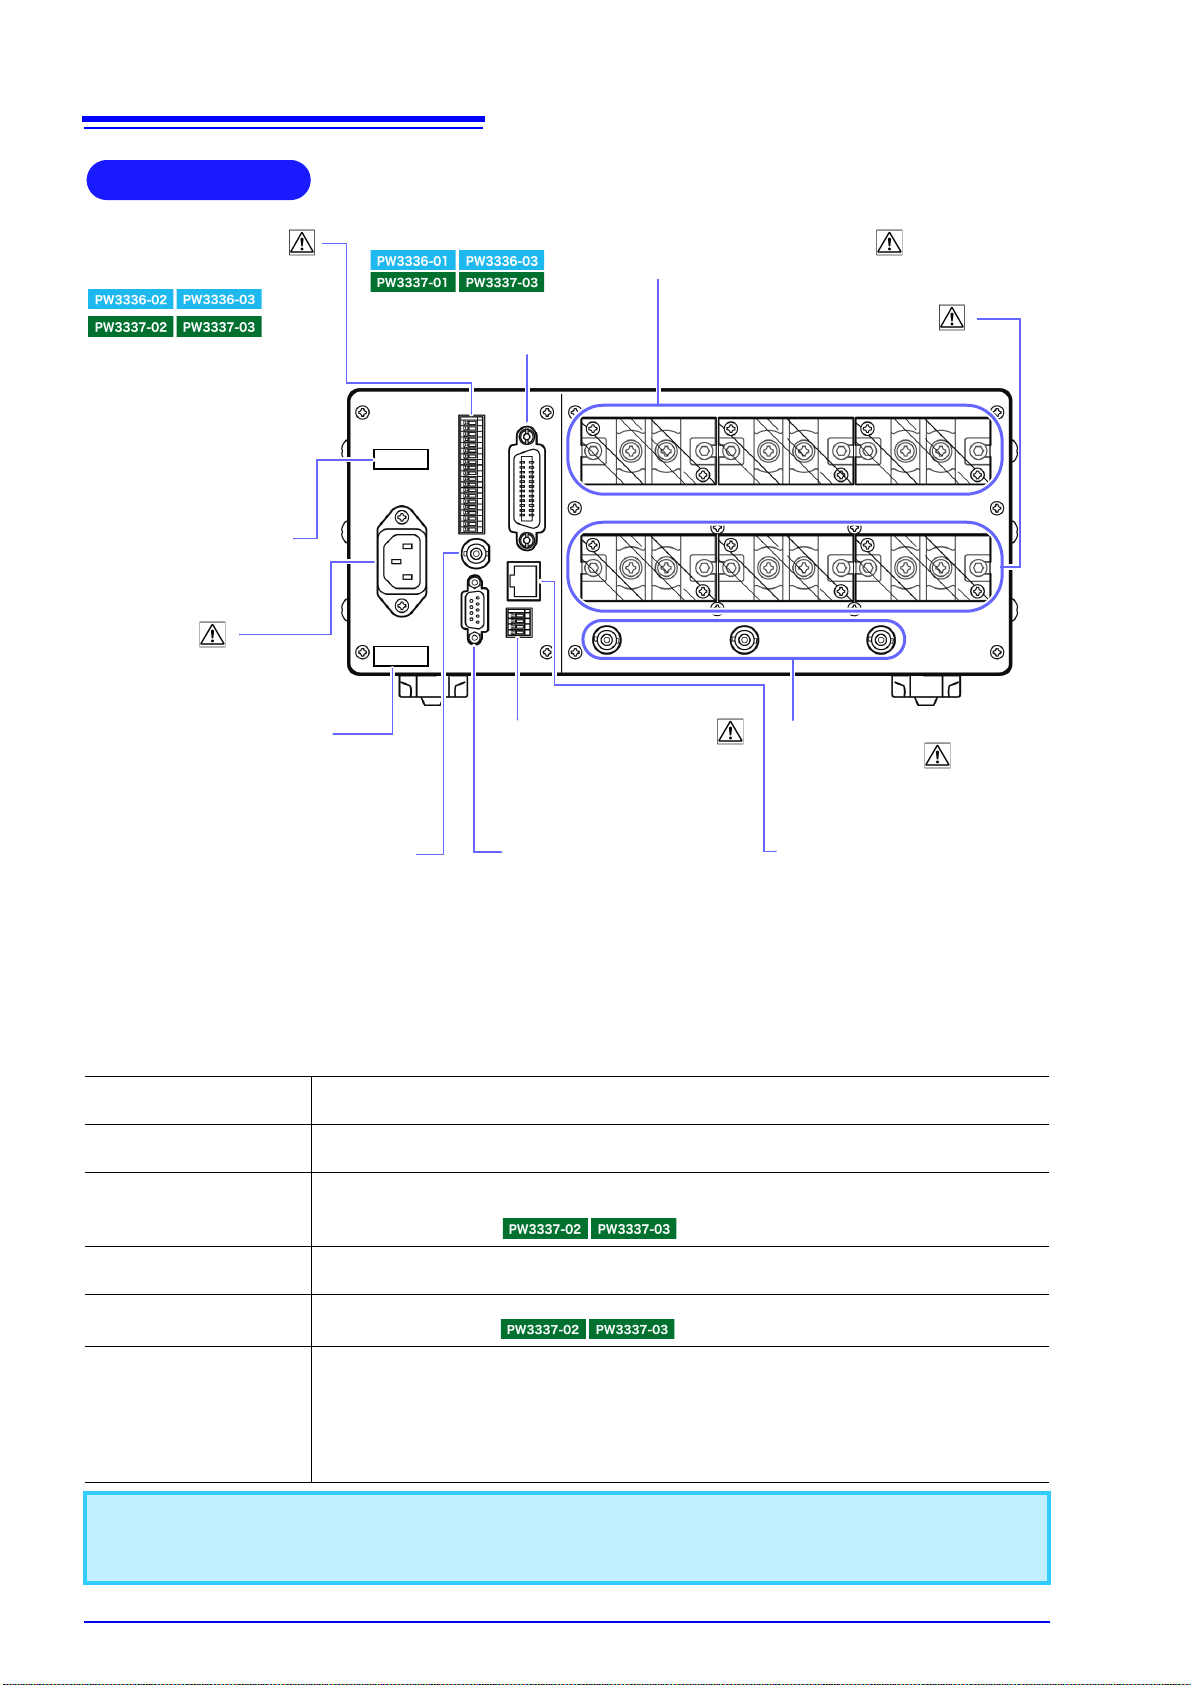
Manufacturer's Serial No.
Model name number
Shows the serial number.
Do not remove this label, as it is
required for product support.
Voltage input terminal (U )
Input voltage signals. (p.28)
Rear
MAC address of the
LAN
e.g.) PW3337-03
GP-IB connector
Connect a communications cable when using the
GP-IB interface. (p.131)
External synchronization terminal
Connect a cable for synchronized
measurement. (p.81)
Power Inlet
(p.34)
D/A Output terminal
*
(D/A OUTPUT)
The voltages listed below
are output from each
terminal. (p.88)
RS-232C connector
Connect a communications
cable when using the RS232C interface. (p.118)
External current sensor
input terminal
(CURRENT SENSOR)
Connect current sensors. (p.102)
LAN connector
Connect a communications cable when using the LAN interface. (p.122)
External control terminal
(EXT. CONTROL)
Input signals from an integration
external control function. (p.85)
Current input terminal ( I )
Input current signals. (p.28)
1.3 Names and Functions of Parts
*D/A OUTPUT terminals
The following voltages are output from each terminal.
Level output: Level (analog) output is updated at an interval of approximately 200 ms.
Instantaneous waveform output: The input waveform as sampled at a frequency of approximately 87.5 kHz is output.
High-speed active power level output: The active power for every cycle for the voltage or current set as the synchronization
source is output.
U1/u1, U2/u2, U3/u3
I1/i1, I2/i2, I3/i3
P1/p1, P2/p2, P3/p3
Psum/Hi-Psum
Hi-P1, Hi-P2, Hi-P3
DA1, DA2, DA3
Key processing is embedded in the instrument for production and verification purposes. For example, this
processing includes transitioning to an adjustment mode. If key operation causes a message or indication
that is not described in this manual to be displayed, immediately cycle the instrument’s power.
Generates voltage level output or instantaneous voltage waveform output (set to one or the
other) for each channel.
Generates current level output or instantaneous current waveform output (set to one or the
other) for each channel.
Generates active power level output or instantaneous power waveform output (set to one or
the other) for each channel.
(P3/p3 is generated by only.)
Generates active power sum level output or high-speed level output (set to one or the other)
for wiring modes other than 1P2W.
Generates active power high-speed level output for each channel.
(Hi-P3 is generated by only.)
Generates level output for three of the following parameters for each channel and as a sum
(sum value) as selected by the user:
Voltage, current, active power, apparent power, reactive power, power factor, phase angle,
voltage total distortion, current total distortion, voltage crest factor, current crest factor, voltage ripple rate, current ripple rate, voltage frequency, current frequency, efficiency, current
integration, and active power integration
Page 27
21
Bottom panel
This instrument can be rack mounted.
See: Appendix 3 Rack Mounting(p. A11)
Parts removed from this instrument should be stored in a
safe place to enable future reuse.
Left side
When using the stands
Open the stands until they clicks into place. Be sure
to use both stands.
When folding up the stands
Fold up the stands until they click into place.
Right side
Vents
Keep clear of obstructions.
1.3 Names and Functions of Parts
Do not apply heavy downward pressure with the stand extended. The stand could be damaged.
Page 28
22
Installing the Instrument (p.5)
CHECKS
• Are the wires from the measurement targets shut off?
• Is the instrument turned off, and has the power cord been disconnected?
• Using D/A output (p.88)
• Using synchronized control to conduct measurements with 2
instruments simultaneously (p.81)
• Using external control to control integration (p.62)
• Sending and receiving data with the RS-232C, LAN, and GP-IB
interfaces (p.117)
Connecting Wires and Cords
Connect the measurement lines to the instrument and then connect the power cord to the instrument.
CHECKS
• Is the instrument connected on the secondary side of the circuit
breaker?
• Does the circuit being used exceed 1000 V?
• Does the voltage or current being measured exceed 1000 V or 70
A, respectively?
If so, use VT and CT.
• Are appropriate types of wire being used to connect to the voltage
and current input terminals?
Use solderless terminals that cover wiring with insulation. When
using solderless terminals with exposed metallic parts, use wire
with adequate dielectric strength and current capacity.
• Has the wiring been shorted?
• Are the input terminals loose?
• Have wires been connected properly?
Connect wires. (p.28)
e.g.)
Connect the power cord. (p.34)
When using one or more current sensors, see "3.9 Using a Current Sensor" (p.102).
Turning on the instrument (p.35)
Before turning on the instrument, verify that the wires have been connected properly one more time.
After displaying the initial screen, the instrument will display input values under the current settings.
Allow the instrument to warm up for at least 30 minutes.
Perform zero-adjustment.
To fulfill the instrument’s accuracy specifications, be sure to perform zero-adjustment for the voltage
and current measured values.
1.4 Measurement Workflow
1.4 Measurement Workflow
1 Install the instrument, connect wires and cords, and
turn on the instrument.
Page 29
23
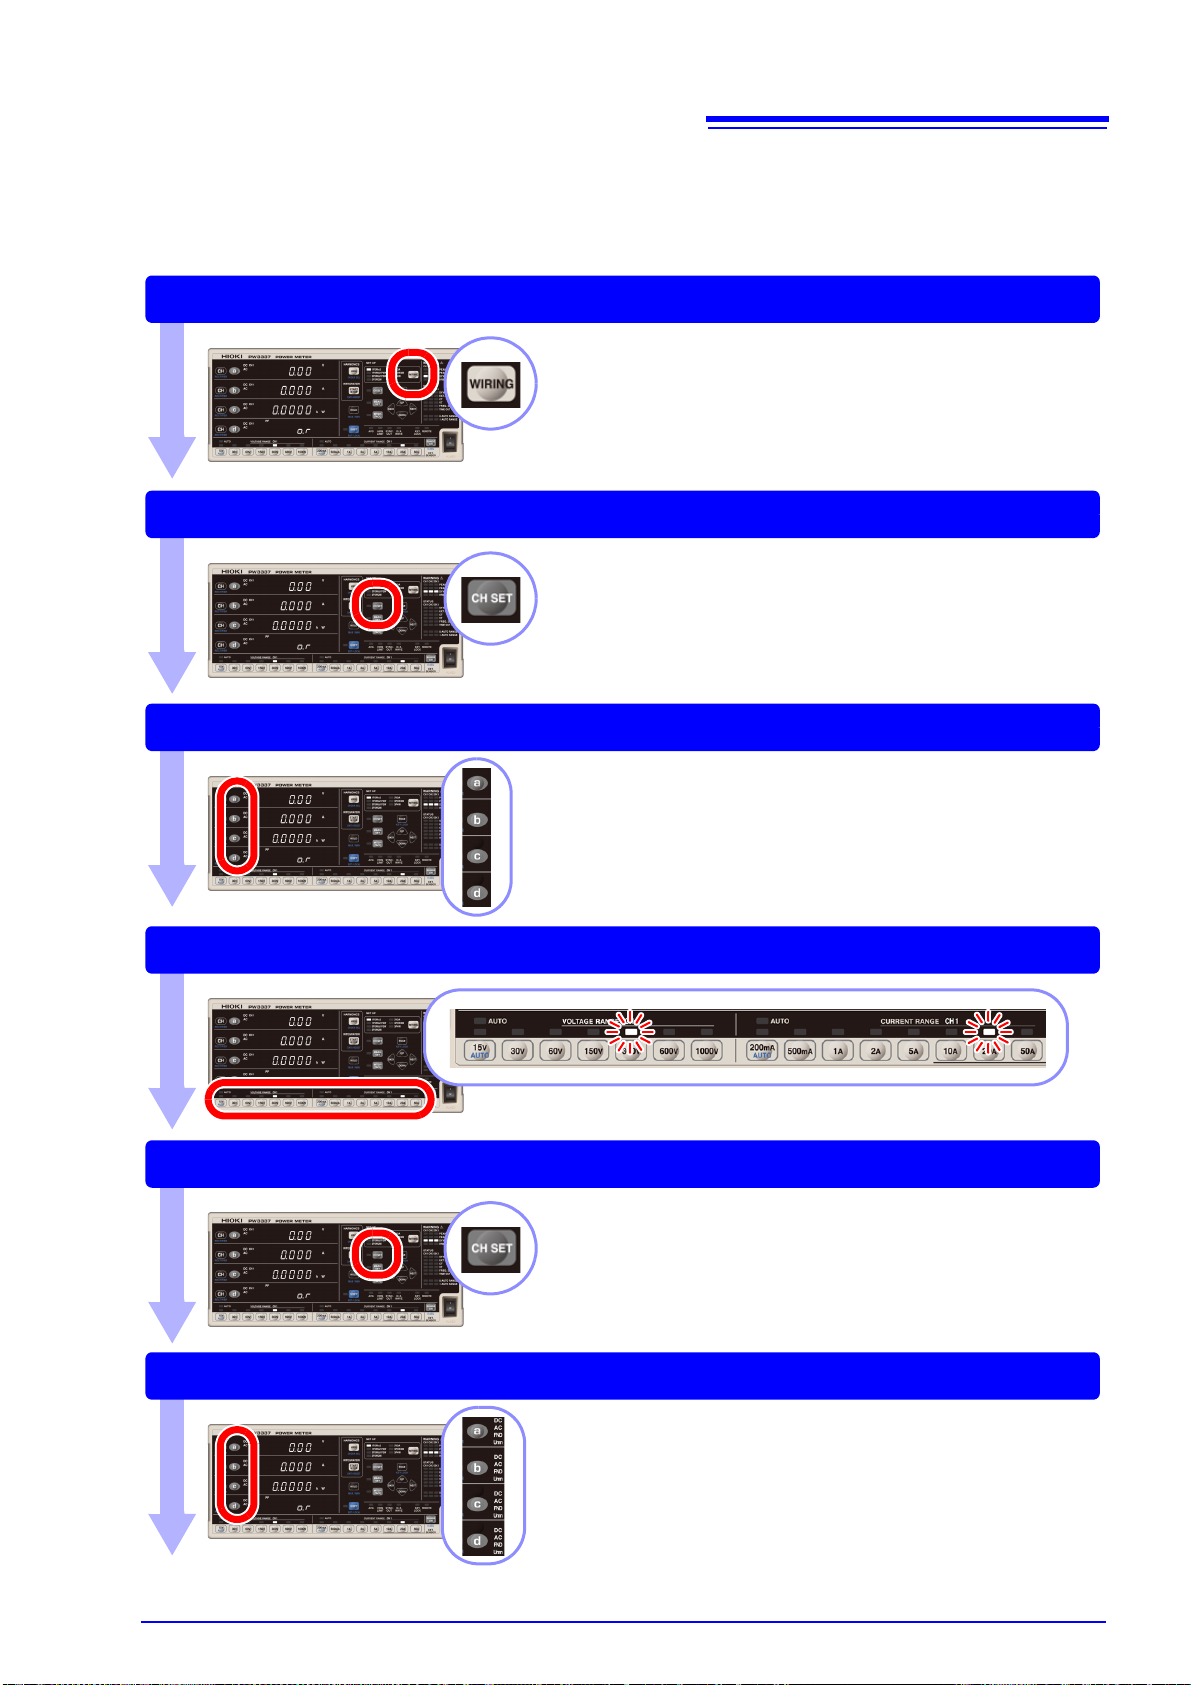
Selecting the wiring mode (p.40)
Setting the current input method (p.42)
Selecting display parameters (p.44)
Selecting voltage and current ranges (p.48)
Setting the synchronization source (p.51)
Selecting rectifiers (p.47)
1.4 Measurement Workflow
2 Configure instrument settings. (These settings can
also be changed during measurement.)
Page 30
24
Configure the following settings as necessary:
Setting the frequency measurement range
See: "3.2.6 Setting the Frequency Measurement Range" (p.53)
Addressing display value variation: Displaying average measured values
See: "3.2.8 Displaying Measured Values as an Average (AVG: Averaging)" (p.57)
Measuring voltages in excess of 1000 V: Using VT (PT) to make measurements
See: "3.2.9 Setting the VT and CT Ratio" (p.59)
Measuring currents in excess of 65 A: Using CT to make measurements
See: "3.2.9 Setting the VT and CT Ratio" (p.59)
When you wish to perform integration
See: "3.3 Integration" (p.62)
When you wish to measure harmonics
See: "3.4 Viewing Harmonic Measured Values" (p.71)
When you wish to measure efficiency
See: "3.5 Measuring Efficiency" (p.78)
When you wish to use the display hold, maximum value hold, and minimum value
hold functions
See: "3.10.1 Fixing Display Values (Display Hold)" (p.108)
"3.10.2 Displaying Peak, Minimum, and Maximum Values (Maximum Value Hold)" (p.109)
When you wish to use D/A output
See: "Examples of analog output"(p.98)
When you wish to use the RS-232C interface
See: "Setting the RS-232C communications speed"(p.119)
When you wish to use the LAN interface
See: "Setting the LAN’s IP address"(p.123)
When you wish to use the GP-IB interface
See: "Setting the GP-IB address"(p.133)
When you wish to perform synchronized measurement with multiple instruments
See: "3.6 Performing Synchronized Measurement with Multiple Instruments (Multiple-instrument Syn-
chronized Measurement)" (p.81)
1.4 Measurement Workflow
Page 31

3 Start measurement.
Activating power to the measurement lines
Measuring and outputting data
The instrument will display the measured values.
You can change the voltage and current range as well as display parameters during measurement.
Example:
When you wish to hold display
values (p.108)
Press .
Displaying maximum and minimum
values (p.109)
Press while holding down .
Voltage
Current
Active power
Power factor
Turning off the instrument
After disconnecting the cords from the object under measurement, turn off the instrument.
See: "2.4 Turning On the Instrument" (p.35)
25
1.4 Measurement Workflow
4 Stop measurement.
About measured values
• The instrument’s apparent power (S), reactive power (Q), power factor (λ), and phase angle (φ) are calculated based on the measured voltage (U), current (I), and active power (P). For the actual equations used,
see "5.5 Calculation Formulas Specifications" (p.161). Values displayed by the instrument may differ from
values displayed by measuring instruments that use different operating principles or equations.
• Display values are forcibly set to zero for voltage and current when the input is less than 0.5% of the measurement range and for the voltage peak value and current peak value when the input is less than 0.3% of
the peak range (this is known as zero-suppression).
• Measured values may include an error component in measurements in which a terminal-to-ground voltage
with a high frequency is input.
• Display values may exhibit variation in applications in which the frequencies of the voltage and current
being measured differ.
• Measured values may include an error component when the instrument is used near a strong magnetic
field such as that generated by a transformer or high-current path, a strong electric field generated by a
radio or similar device, or a high-frequency magnetic field generated by a high-frequency current.
Page 32

26
1.4 Measurement Workflow
Page 33

27
Install the instrument
(p.5)
1
After use, deactivate power
to the measurement lines,
disconnect cables, and
turn off the instrument.
Connect the connection
cables to the voltage input
terminals and current input
terminals. (p.28)
3
Connect the power cord.
(p.34)
5
Turn the power on
(p.35)
6
Activate power to the
measurement lines.
7
Remove the safety
covers.
2
Reattach the safety
covers.
4
1
2
3
4
5
6
7
Configure the following settings as desired:
1: When you wish to use D/A output (p.88)
2: When you wish to perform synchronized measurement (p.81)
3: When you wish to use the RS-232C interface (p.118)
4: When you wish to use the GP-IB interface (p.131)
5: When you wish to use the LAN interface (p.122)
6: When you wish to use external control (p.85)
7: When you wish to use an external current sensor (p.102)
2.1 Installation and Connection Procedures
Measurement Preparations Chapter 2
2.1 Installation and Connection Procedures
Please read "Operating Precautions" (p.5) carefully before installing or connecting
the instrument.
Page 34

28
e.g.) 1P2W
Corresponding with Method 1 (1)
Corresponding with Method 2 (1)
• Phase differences between an
external VT (PT) and CT can introduce a large error component into
power measurements.
To ensure accurate power measurement, use a VT (PT) and CT
with a small phase error in the frequency band of the circuit being
used.
• To ensure safe operation, always
ground the secondary side of the
VT (PT) and CT (see figure below)
2.2 Connecting the Measurement Lines
2.2 Connecting the Measurement Lines
Please read "Handling the Cables" (p.6) carefully before installing, connecting the
instrument, or connecting the measurement LINES.
Verify that power to the measurement lines has been cut off before connecting the
instrument to them.
To ensure accurate measurement
• When measuring power, the polarity of the voltage and current affects readings, so it is essential to connect the instrument to the measurement lines properly. Accurate measurement will not be possible if these
connections are not made properly.
• Keep power supply wiring away from the instrument so that it is not affected by external magnetic fields.
If the object under measurement’s voltage and current levels exceed the instrument’s measurement range
You can then read primary-side input values directly by setting the VT ratio and CT ratio on the instrument.
See: "3.2.9 Setting the VT and CT Ratio"(p.59)
• To prevent electrical shock and personnel injury, do not touch any input terminals
on the VT (PT), CT or the instrument when they are in operation.
• When using an external VT (PT): Do not short the secondary side.
Applying a voltage to the primary side while the secondary side is shorted will cause
a large current to flow to the secondary side, causing it to burn up and resulting in a
fire.
• When using an external CT: Do not leave the secondary side open.
Allowing a current to flow to the primary side while the secondary side is open will
cause a high voltage to occur on the secondary side, which is extremely dangerous.
Page 35

2.2 Connecting the Measurement Lines
Wire materials (Voltage input terminal, Current input terminal)
To avoid electric shock or a short-circuit at the input terminals, use solderless terminals that cover wiring with insulation.
(Screws for voltage input terminals and current input terminals: M6)
To avoid electric shock, use wiring with adequate dielectric strength and current capacity.
29
Page 36

30
Remove the safety cover.
2
Remove the screws. (M3 × 6 mm)
1
Input terminal tightening torque: 3 N
•m
1 Remove the screws with the Phillips head screwdriver.
2 Position each wire as shown in the figure and secure in
place with the screw. (M6 × 12 mm)
Screw
(M6 × 12 mm)
Wire
• Use solderless terminals with a width of 13 mm or less.
• Tighten screws securely.
e.g.) Voltage input terminal
e.g.) Current input terminal
Solderless terminal
(Width 13 mm or less and
capable of accommodat-
ing an M6 screw)
Attach each cover securely.
2.2 Connecting the Measurement Lines
Connecting the measurement lines
Please read "Handling the Instrument" (p.6) carefully before connecting the instrument to the measurement lines.
• Verify that power to the measurement lines has been cut off before connecting the
instrument to them.
• To avoid electric shock or a short-circuit at the input terminals, use solderless terminals that cover wiring with insulation.
• To prevent instrument damage or electric shock, use only the screws (M6
for securing the voltage input terminals and current input terminals in place and the
screws (M3
uct. If you loose any screw or find that any screws are damaged, please contact your
Hioki distributor for a replacement.
×6 mm) for securing the safety cover in place that shipped with the prod-
Safety covers
• The safety covers play a protective role by preventing contact with the terminals. Always attach the covers
before using the instrument.
• Verify that no voltage is being applied to the measurement lines before attaching or removing the safety
covers.
×12 mm)
Connect cables to the instrument’s voltage and current input terminals.
You will need: A Phillips head screwdriver with a No. 3 tip
Remove the safety covers from the voltage input terminals and current input terminals.
1
Connect the cables to the voltage input terminals and current input terminals.
2
Attach the safety covers.
3
Page 37

2.2 Connecting the Measurement Lines
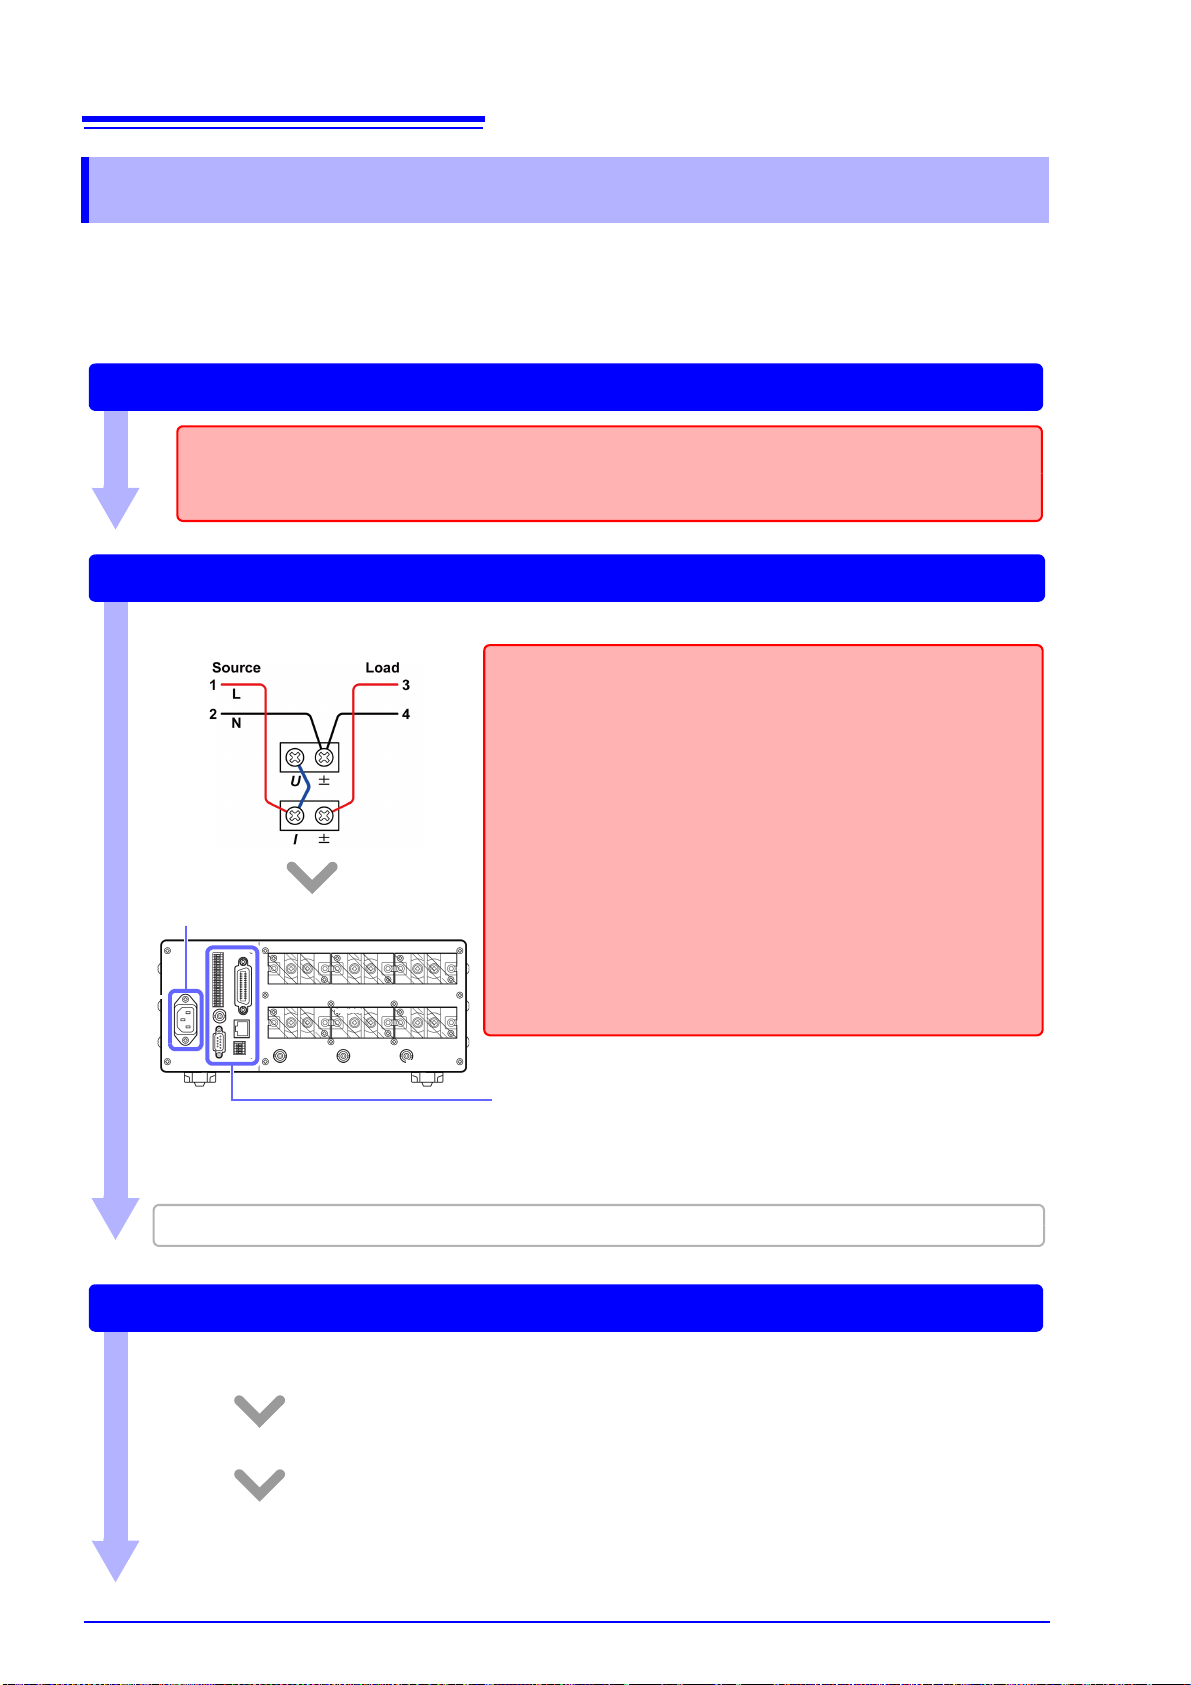
When measuring measurement lines that are within the maximum input range,
connect the instrument to the measurement lines directly.
(For wiring modes other than 1P2W, see "Wiring diagrams for direct input (connections
to instrument’s terminal block)" (p.168) in "5.6 Wiring Specifications".)
Referring to "Selecting the connection method (Example: 1P2W connection)" (p.33), select the
connection method with the lower power meter loss.
Method 1: Connect the voltage input terminals to the load side.
(1) (2)
1
Voltage input
terminal
Current direct
input terminal
Current direct
input terminal
Voltage input
terminal
Method 2: Connect the current input terminals to the load side.
• When the instrument is affected by common-mode voltage, the error can be reduced by connecting the ammeter as shown in (2) under Method 1 and (2) under Method 2.
• If leaving the connections in place after measurement is complete, be sure to conduct a pre-measurement inspection (p.39) before making the next measurement. Such an inspection will enable
you to prevent electric shock and measurement errors caused by breaks in cables, short-circuits,
instrument failures, and other issues.
Voltage input
terminal
Current direct
input terminal
Voltage input
terminal
Current direct
input terminal
(1) (2)
Connect the instrument to the measurement lines. (Example: 1P2W connection)
4
There are three types of connection methods:
31
Page 38

32
2
When measuring measurement lines that exceed the maximum input current
Connect the instrument using a current sensor.
(For wiring modes other than 1P2W, see "Wiring diagrams when using an external current sensor" (p.173) in "5.6 Wiring Specifications".)
2
(1) (2)
2
When measuring measurement lines that exceed the maximum input, connect
the instrument using a VT (PT) and CT.
3
Corresponding with Method 1 (1) Corresponding with Method 2 (1)
2.2 Connecting the Measurement Lines
Page 39

33
Method 1
Connect the voltage input terminals to the
load side.
Method 2
Connect the current input terminal to the
load side.
Loss = (Input voltage [V])
2
÷ 2 [MΩ]
Loss = (Input current [A])
2
x 1 [mΩ]
Power measurement includes loss from the
voltage input terminals’ input resistance.
Power measurement includes loss from the current input terminals’ input resistance.
Power
supply
Load
Current input resistance
Voltage input resistance
Load
Power
supply
Current input resistance
Voltage input resistance
1 mΩ 1 mΩ
2 MΩ
2 MΩ
Power
supply
Load
Current input resistance
Voltage input resistance
Load
Power
supply
Current input resistance
Voltage input resistance
1 mΩ 1 mΩ
2 MΩ2 MΩ
U
L
N
±
±
I
±U
±
I
L
N
U
U
±
±
±
I
±
I
±
LL
NN
2.2 Connecting the Measurement Lines
Selecting the connection method (Example: 1P2W connection)
Depending on the input level, the power meter’s instrument loss may affect measured values. Select the connection method below with the lower loss.
2
/ 2 [MΩ] = 0.000072 [W]
2
× 1 [mΩ] = 4.225 [W]
2
2
/ 2 [MΩ] = 0.5 [W]
× 1 [mΩ] = 0.0000001 [W]
Example:
When measuring 12 V, 65 A
Method 1: Loss = (12 [V])
Method 2: Loss = (65 [A])
Method 1 is characterized by lower loss and therefore allows more accurate measurement.
When measuring 1000 V, 10 mA
Method 1: Loss = (1000 [V])
Method 2: Loss = (10 [mA])
Method 2 is characterized by lower loss and therefore allows more accurate measurement.
Page 40

34
Rear
1 Check that the instrument’s power switch is turned off.
2 Connect a power cord that matches the line voltage to
the power inlet on the instrument.
3 Plug the other end of the power cord into an outlet.
Turn off the power before disconnecting the power cord.
2.3 Connecting the Power Cord
2.3 Connecting the Power Cord
• Before turning the instrument on, make sure the supply voltage matches that indicated on the its power connector. Connection to an improper supply voltage may
damage the instrument and present an electrical hazard.
(Voltage fluctuations of ±10% from the rated supply voltage are taken into account.)
• To avoid electrical accidents and to maintain the safety specifications of this instrument, connect the power cord provided only to a 3-contact (two- conductor +
ground) outlet.
Page 41

35
: Power ON
The product model and version number
are displayed.
Self-test (example: PW3337-03)
Any errors are displayed.
See: "6.2 Error Indication"(p.179)
Error(s)No errors
Normal display (Measurement
screen)
Do not press any keys during the self-test.
Display during zero-adjustment
2.4 Turning On the Instrument
2.4 Turning On the Instrument
Check the following once more before turning on the instrument:
• Are the instrument and peripheral equipment connected properly?
• Are any wires shorted between the voltage input terminals?
If so, an electric shock or short-circuit may result.
Turn the POWER switch on ( | ).
When the instrument is turned on, it will start a self-test. During the self-test, all indicators will light up, and
then the model and version number will be displayed. Finally, hardware and saved data will be checked.
• The current settings when the instrument was last turned off will be restored when it is turned on (backup
function).
• If you’re using the instrument for the first time, the default settings will be used. (p.112)
• To ensure high-precision measurement, allow the instrument to warm up for at least 30 minutes after turning it on.
Page 42

36
1 Deactivate power to measurement
lines and ensure that no input is
being supplied to the instrument.
2 Press to place the instrument in
the shift state and then press .
3 Zero-adjustment will be performed,
and the display will show [
- - - - -] for
approximately 40 sec.
Once zero-adjustment is complete, the instrument will change to the normal measured value display and be ready for
measurement.
2.5 Performing Zero-adjustment
2.5 Performing Zero-adjustment
Zero-adjustment (offset adjustment) is performed for voltage and current measured values after the instrument has warmed up for approximately 30 minutes in order to ensure that its measurement accuracy specifications are satisfied. Zero-adjustment consists of degaussing (DEMAG) its internal current input unit and
performing offset adjustment for the voltage and current internal circuitry.
Although the zero-adjustment function operates automatically when the instrument is turned on, it should
always be performed before starting measurement after the instrument has warmed up.
• Perform zero adjustment when there is no input to the instrument, for example after deactivating power to
measurement lines. If zero-adjustment is performed while there is input to the instrument, the process will
not complete normally, and you will be unable to make accurate measurements.
• Optional current sensors are not degaussed. Degauss current sensors as described in the instruction
manual that came with each current sensor before performing the instrument’s zero-adjustment process.
Zero-adjustment adjusts offsets within the following ranges:
Voltage circuitry: ±10% of the measurement range
Current direct input circuitry: ±10% of the measurement range
External current sensor input circuitry: ±10% of the measurement range
Operating time: Approx. 40 sec. (No measured values are displayed during zero-adjustment.)
• Zero-adjustment is performed for all channels, regardless of wiring mode or current input method.
• Settings cannot be changed, and integration cannot be started, during zero-adjustment.
• Zero-adjustment cannot be performed while integration is being performed or during display hold or maximum value/minimum value hold operation.
• To enable high-precision measurement, it is recommended to perform zero-adjustment at an ambient temperature that falls within the range specified in the specifications.
• Perform the zero-adjustment process with no input. The instrument will display [Err.18] if input is present
when performing zero-adjustment. If this occurs, remove the input and then repeat the zero-adjustment
process.
• It may be impossible to completely degauss the instrument’s current input unit if current input in excess of
the maximum input current is flowing to its current direct input terminals. In this case, perform zero-adjustment multiple times or cycle the instrument’s power.
Page 43

2.6 Activating Power to the Measurement Lines
: Power OFF
Once measurement is complete, turn
off the instrument and disconnect any
connection cables and other wiring.
2.6 Activating Power to the Measurement Lines
Before activating power to the measurement lines
Before activating power to the measurement lines, turn on the instrument and verify
that no errors are displayed.
If any measurement target lines are live before the instrument is turned on, the instrument may be damaged, or an error may be displayed when it is turned on.
See: "2.4 Turning On the Instrument"(p.35), "6.2 Error Indication"(p.179)
2.7 Turning Off the Instrument
37
Turn the POWER switch off ( ).
Disconnect any connection cables and other wiring.
When power is turned on again, the display appears with the settings that existed when power was last turned
off.
If leaving the connections in place after measurement is complete, be sure to conduct a pre-measurement
inspection (p.39) before making the next measurement. Such an inspection will enable you to prevent electric shock and measurement errors caused by breaks in cables, short-circuits, instrument failures, and other
issues.
Page 44

38
2.7 Turning Off the Instrument
Page 45

3.1 Pre-Measurement Inspection
Before using the instrument the first time, verify that it operates normally to ensure that the no damage
occurred during storage or shipping. If you find any damage, contact your dealer or Hioki representative.
If there is any damage or the screws
are loose, there is a risk of electric
shock or short-circuit. Do not use the
instrument. Replace the probe or cable
with an undamaged equivalent. Securely retighten screws.
Metal Exposed?
Screws are loose.
Is the insulation of the probe or connection
cable to be used damaged, or is bare metal
exposed?
Are any of the input terminal screws loose?
When using connection cables
1
No Metal Exposed
Screws are tight.
Peripheral Device Inspection
If damage is evident, request repairs.
Yes
Is there any damage to the instrument?
Instrument Inspection
Turn on the instrument.
Is self-test information (model, version number)
displayed?
No
2
There may be a break in the power
cord, or there may be internal damage
to the instrument. If the instrument is
damaged, have it repaired.
Is the Measurement screen displayed after the
self-test completes?
No
Yes
The instrument may be damaged internally. Request repairs.
See: "6.2 Error Indication" (p.179)
An error indication
occurs (ERR)
Yes
Inspection complete
Allow the instrument to warm up for at
least 30 minutes after turning it on.
Supply power to the measurement target.
There may be a break in a connection
cable or internal damage to the instrument, or the instrument may have
been connected improperly. Stop supplying power to the measurement target immediately and repeat the
inspection. If there is no problem with
the wiring, have the instrument repaired.
No measured value
is displayed.
Measured value error
Perform zero-adjustment.
Configuration and Measurement Chapter 3
Please read Operating Precautions (p.5) carefully before using the instrument.
For more information about the measurement process, see "1.4 Measurement Workflow" (p.22).
3.1 Pre-Measurement Inspection
39
Page 46

40
Display order
1P2W×2 → 1P3W → 3P3W → 3P3W2M ⋅⋅⋅
1P2W×3 → 1P3W&1P2W → 3P3W&1P2W → 3P3W2M → 3V3A → 3P3W3M → 3P4W ⋅⋅⋅
The wiring mode cycles through the
values described below each time
is pressed.
In the shift state, the wiring mode cycles
through the values in reverse order. The shift
state is canceled approx. 2 seconds after
pressing .
3.2 Configuring Settings
3.2 Configuring Settings
3.2.1 Selecting the Wiring Mode
This section describes how to select the wiring mode according to the line being measured.
Measurement characteristics
Can be used to measure two 1-phase/2-wire circuits (default setting).
1P2W×2
1P3W Can be used to measure one 1-phase/3-wire circuit.
3P3W
3P3W2M
1P2W×3
1P3W&1P2W
3P3W&1P2W
3P3W2M
Can be used to measure the efficiency given by the CH2 active power relative to the CH1 active power,
or the efficiency given by the CH1 active power relative to the CH2 active power.
Can be used to measure one 3-phase/3-wire circuit.
Active power is measured by 2-power measurement method.
Can be used to measure one 3-phase/3-wire circuit.
Active power is measured by 2-power measurement method.
The line voltage and phase current, which are not actually measured, are calculated using vector computation internally and displayed as the CH3 voltage and current.
Can be used to measure three 1-phase/2-wire circuits (default setting).
Can be used to measure the efficiency given by the CH3 active power relative to the CH1 active power,
or the efficiency given by the CH1 active power relative to the CH3 active power.
Can be used to measure a total of two circuits: one 1-phase/3-wire circuit with CH1 and CH2, and one
1-phase/2-wire circuit with CH3.
Can be used to measure the efficiency given by the CH3 active power relative to the sum of the CH1 and
CH2 active power, or the efficiency given by the sum of the CH1 and CH2 active power relative to the
CH3 active power.
Can be used to measure a total of two circuits: one 3-phase/3-wire circuit with CH1 and CH2, and one
1-phase/2-wire circuit with CH3. For one 3-phase/3-wire circuit, active power is measured by 2-power
measurement method. Can be used to measure the efficiency given by the CH3 active power relative to
the sum of the CH1 and CH2 active power, or the efficiency as given by the sum of the CH1 and CH2
active power relative to the CH3 active power.
Can be used to measure one 3-phase/3-wire circuit.
Active power is measured by 2-power measurement method.
The line voltage and phase current, which are not measured with the 3P3W wiring mode, are calculated
using vector computation internally and displayed as the CH3 voltage and current.
: Measurements are performed using the instrument’s CH1
and CH2.
:Measurements are performed using the instrument’s CH1,
CH2, and CH3.
Page 47

41
3.2 Configuring Settings
Can be used to measure one 3-phase/3-wire circuit. Active power is measured by 2-power measurement
3V3A
3P3W3M
3P4W Can be used to measure one 3-phase/4-wire circuit.
• When using a wiring mode other than 1P2W, parameters that can be set for individual channels (for example, measurement range) will be standardized using the CH1 settings.
• The wiring mode cannot be changed while integration is being performed or during display hold or maximum value/minimum value hold operation.
method. The line voltage and phase current, which are not measured with the 3P3W wiring mode, are
actually connected to CH3, measured, and displayed.
Can be used to measure one 3-phase/3-wire circuit.
Using the 3V3A connection as-is, the measured line voltage (Δ) is converted to the phase voltage (Y) by
means of vector computation and displayed.
Page 48

42
Current direct input method
External current sensor input method (p.102)
3.2 Configuring Settings
3.2.2 Selecting the Current Input Method
This section describes how to select the current input method. The instrument can perform measurement using
the current input methods listed below. The default setting is the current direct input method (setting: OFF).
• The external current sensor input terminals are not isolated. You must connect an
optional current sensor in order to use them.
• Inputting a voltage other than output from an optional current sensor or inputting a
primary-side voltage may damage the instrument or cause electric shock, a short-circuit, or bodily injury.
When using external current sensor input, disconnect all wiring from the current direct input
terminals. Similarly, when using the current direct input terminals, disconnect all wiring from
the external current sensor inputs.
The current input method serves to switch the input signals to the instrument’s internal circuitry.
Improperly configuring the current input method will make it impossible to make accurate measurements.
• Connect wires and input current directly to the current direct input terminals.
• The input terminals are isolated.
• The maximum input current is 70 A, ±100 Apeak.
• Connect optional current sensors (voltage output) to the external current sensor input terminals to measure
current.
• The input terminals are not isolated. Isolation is accomplished by the connected current sensors.
• The maximum input voltage for the external current sensor input terminals is 5 V, ±7.1 Vpeak.
• TYPE1 and TYPE2 input is supported, depending on the current sensor specifications.
TYPE1 current sensors (p.104)
• 9661 Clamp on Sensor (rated current: 500 A AC)
• 9669 Clamp on Sensor (rated current: 1000 A AC)
• 9660 Clamp on Sensor (rated current: 100 A AC)
• CT9667 Flexible Clamp on Sensor (rated current: 500 A/5000 A AC range switchable)
TYPE2 current sensors (p.104)
Requires optional CT9555 series Sensor Unit and L9217 Connection Cord.
• CT6862-05 AC/DC Current Sensor (rated current: 50 A AC/DC)
• CT6863-05 AC/DC Current Sensor (rated current: 200 A AC/DC)
• 9709-05 AC/DC Current Sensor (rated current: 500 A AC/DC)
• CT6865-05 AC/DC Current Sensor (rated current: 1000 A AC/DC)
• CT6841-05 AC/DC Current Probe (rated current: 20 A AC/DC)
• CT6843-05 AC/DC Current Probe (rated current: 200 A AC/DC)
• CT6844-05 AC/DC Current Probe (rated current: 500 A AC/DC)
• CT6845-05 AC/DC Current Probe (rated current: 500 A AC/DC)
• CT6846-05 AC/DC Current Probe (rated current: 1000 A AC/DC)
• 9272-05 Clamp on Sensor (rated current: 20 A/200 A AC range switchable)
Page 49

Example: When the PW3337 wiring mode is 1P2W×3
1 Press .
2 Press to display the settings
screen shown to the left.
:
The screen varies depending on whether the wiring mode is
1P2W×2 or a mode other than 1P2W.
:
The screen varies depending on whether the wiring mode is
1P2W×3, 1P3W&1P2W and 3P3W&1P2W, 3P3W2M, or 3V3A
and 3P3W3M and 3P4W.
3 Press or to select the channel
to set.
Areas b, c, and d on the display correspond to CH1, CH2,
and CH3, respectively. The selected channel parameter will
flash.
4 Press or to set the current
input method.
Settings: OFF (direct input) → TYPE1 (BNC
terminal direct connection [using
external sensors]) → TYPE2 (con-
nection via the CT9555 series and
L9217 [using external sensors])
(When set to TYPE1 or TYPE2, the EXT.SENSOR lamp for
the set channel will light up.)
5 Set the current input method for other
channels as necessary.
6 Press to exit the settings.
The instrument will return to the normal measurement state.
43
3.2 Configuring Settings
• When using a wiring mode other than 1P2W, the current input method will be standardized using the CH1
settings.
• The current input method cannot be changed while integration is being performed or during display hold or
maximum value/minimum value hold operation.
Page 50

44
Every time , , , or is
pressed, the each relevant display is
switched in the following order.
V → A → W → VA → Vpk → Apk → VHz → AHz
→ var → Ah+ → Ah- → Ah → Wh+ → Wh- → Wh
→ ° → PF → THD-V → THD-A → θ-V → θ-A → η1
→ η2 → T. AV- A → T. AV- W → RF-V → RF-A → CF-
V
→ CF-A → TIME ⋅⋅⋅
In the shift state, the display parameters cycle through the
values in reverse order. The shift state is canceled approx.
2 seconds after , , , or is released.
3.2 Configuring Settings
3.2.3 Selecting Display Content
This section describes how to select the information shown on the instrument’s display.
• Selecting display parameters
• Selecting display channels
• Selecting rectifiers
See: "Appendix 1 Detailed Specifications of Measurement Items (Display Items)" (p. A1)
Default settings
: Voltage (V), CH1, AC+DC
: Current (A), CH1, AC+DC
: Active power (W), CH1, AC+DC
: Power factor (PF), CH1, AC+DC
Selecting display parameters
This section describes how to select the parameters that are shown on the instrument’s display.
• The voltage and current are displayed from 0.5% to 140% of the range.
(When input is less than 0.5% of the range, zero-suppression forces a value of zero to be displayed.)
• Active power is displayed from 0% to 196% of the range.
(There is no zero-suppression function.)
• Some display parameters do not have measured values depending on the rectifier and wiring mode. In
this case, the display will show [- - - - -].
See:"Appendix 1 Detailed Specifications of Measurement Items (Display Items)" (p. A1)
Page 51

Display of integration elapsed time
SYNC. ERROR
See: "3.2.6 Setting the Frequency Measurement
Range" (p.53)
If a warning lamp or “o.r” is displayed
PEAK OVER
See: "3.11 When PEAK OVER, o.r, or the Unit
Indicator Flashes" (p.114)
HRM ERROR
See: "3.4.4 About the HRM ERROR lamp" (p.77)
over-range
See: "3.11 When PEAK OVER, o.r, or the
Unit Indicator Flashes" (p.114)
From 0 sec. to 99 hr. 59 min. 59 sec. From 100 hr. to 999 hr. 59 min.
From 1000 hr. to 9,999 hr. 59 min.
10,000 hr.
From 0.1000 Hz to 9.9999 Hz From 10 Hz to 99.999 Hz
From 100 Hz to 999.99 Hz
From 1 kHz to 9.9999 kHz
From 10 kHz to 99.999 kHz
From 100 kHz to 220 kHz
45
3.2 Configuring Settings
Display of frequency measurements
Because measured values become difficult to read near the point at which the display switches, the resolution is lowered by one digit.
Example: When changing from 1.0000 kHz to 999 Hz, values that would have been displayed as 999.00 Hz
will be shown as 0.9990 kHz. When the frequency falls to 990 Hz or below, the display will switch
to 990.00 Hz.
See: Specifications - Frequency measurement (p.143)
Page 52

46
Default setting: CH1
Each time is pressed, the display will change
as follows:
The indication “sum” refers to the sum for wiring modes other than 1P2W.
CH1 → CH2 → CH3 → sum ⋅⋅⋅
3.2 Configuring Settings
Selecting display channels
This section describes how to select the channels for which the selected parameters are displayed.
Some display parameters do not have measured values depending on the rectifier and wiring mode. In this
case, the display will show [- - - - -].
Page 53

47
Extracts and displays the fundamental wave component only using harmonic measurement.
5.
Displays calculated values given by the following equation as RMS values for the AC component
only for voltage and current:
The calculated value given by (active power AC+DC value) - (active power DC value) is displayed as the active power value for the AC component only.
(AC+DC value)2 - (DC value)
2
4.
Displays simple average values (DC components only) for voltage and current.
The calculated value (voltage DC value) × (current DC value) is displayed as the DC component
for active power.
3.
Displays true RMS values for all frequency bands that can be measured by the instrument for DC
only, AC only, and mixed DC and AC voltage and current.
1.
Displays mean value rectified RMS equivalents for all frequency bands that can be measured by
the instrument for DC only, AC only, and mixed DC and AC voltage.
2.
Default setting: AC+DC
Each time is pressed after pressing
to activate the shift state, the display will change
as follows:
AC+DC → AC+DC Umn → DC→ AC → FND ⋅⋅⋅
The shift state is canceled 2 seconds after is released.
3.2 Configuring Settings
Selecting the rectifier
The instrument provides the five rectifiers listed below. Since data for all rectifiers is processed in parallel
internally, the rectifier can be switched during measurement.
• When the DC rectifier is selected, the voltage (U) and current (I) polarity will also be displayed (as a simple
average).
• When the AC+DC or AC rectifier is selected, the voltage and current display values will always be positive.
• Some display parameters do not have measured values depending on the rectifier and wiring mode. In
this case, the display will show [- - - - -].
Page 54

48
Default settings: 300 V voltage
20 A current
CH1
Voltage range Current range
3.2 Configuring Settings
3.2.4 Selecting the Voltage and Current Ranges
When input exceeds 1000 V, ±1500 Vpeak, or 70 A, ±100 Apeak
The maximum input voltage and maximum input current are 1000 V, ±1500 Vpeak, and
70 A, ±100 Apeak. If the maximum input voltage or maximum input current is exceeded,
immediately halt measurement, deactivate power to the measurement lines, and disconnect the cables from the instrument. Continuing measurement with maximum input
exceeded will damage the instrument and cause bodily injury.
Do not input a voltage or current in excess of each measurement range. Doing so will damage
the instrument.
Selecting the desired range
Press the range key to select the desired range. The lamp for the selected range key will light up, and the display value will change to reflect the selected range.
• When using a wiring mode other than 1P2W, the voltage and current ranges will be standardized using the
CH1 settings.
• Allow the following amount of time to elapse before reading measured values after changing the range:
• When the frequency of input set to the synchronization source is 10 Hz or greater
Approx. 0.6 s
• When the frequency of input set to the synchronization source is less than 10 Hz
See: "3.2.7 Setting the Timeout" (p.55)
• Channels for which the range has changed will use the invalid data display [- - - - -] until the data is
updated.
• When measuring frequencies of 10 Hz or less, it is necessary to set the timeout to a value other than 0.1 sec.
See: "3.2.7 Setting the Timeout" (p.55)
• When using external current sensor input as the current input method, only the 10 A, 20 A, and 50 A keys
are valid for selecting the current range. Pressing another range key will cause TYPE1 or TYPE2, indicating the type of external current sensor, to be displayed, and the range will not be changed.
• Ranges cannot be changed while integration is being performed or during display hold or maximum value/
minimum value hold operation.
Page 55

49
Setting auto-range operation
1 Press to activate the shift state.
2 Press (to set the voltage range) or (to set the current range).
3 The AUTO lamp and the lamp for the range being measured will light up.
You can check the auto-range setting for individual channels with the STATUS, U AUTO RANGE lamp and
I AUTO RANGE lamp.
e.g.) CH1
Canceling auto-range operation
3.2 Configuring Settings
Automatically setting the range (auto-range operation)
Selecting auto-range operation causes the range to be switched automatically according to the measured
value. This feature is convenient when you do not know the range.
See: Auto-range operation (p.50)
Press any range key or again and then press (voltage range) or (current
range).
• When the measurement range is set to auto-range operation, the output rate for analog and waveform
output will vary with the range. When measuring lines for which measured values fluctuate excessively,
exercise care so as not to mistake range conversions. It is recommended to use a fixed range for this type
of measurement.
• Voltage and current are displayed from 0.5% to 140% of the range.
• Active power is displayed from 0% to 196% of the range.
• Display range values have an error of ±1 dgt. due to calculation precision.
• When integration is started, auto-range operation will be canceled, and the range at that point will be fixed.
• The range will not change during display hold or maximum value/minimum value hold operation.
Page 56

50
These errors indicate that the instrument was unable to switch ranges. Take the following action to
address the error:
Error display Status Solution and reference for more information
During integration operation
(RUN lamp lit up or flashing)
The range cannot be switched until the integrated value is reset
(so that the
RUN lamp turns off).
See: Canceling integration (resetting integrated values) (p.65)
During display hold operation
or maximum value/minimum
value hold operation
(HOLD, MIN, or MAX lamp lit
up)
The range cannot be switched until this operation is canceled
(so that the
HOLD, MIN, or MAX lamp turns off).
See: Canceling the display hold state (p.108)
Returning to the instantaneous value display (p.109)
When or is displayed
3.2 Configuring Settings
Auto-range operation
During auto-range operation, the range is switched as described below:
Range increased Range decreased
• When the measured value exceeds 130% of
the range
• When the PEAK OVER lamp lights up
The voltage and current display range is 0.5% to 140% of the range.
When the measured value is less than 0.5% of the range, the zero-suppression function forces the value to be
displayed as zero.
When the measured value is less than 15% of the range
(The range will not be decreased when the value would exceed the
peak value for the next lower range.)
• When performing measurement using multiple channels, for example as with the 1P3W or 3P3W wiring
modes, the range will be increased when any of the range increase conditions are satisfied.
• The range will be decreased when all of the range decrease conditions are satisfied.
Page 57

51
When the synchronization source is set to DC, the
SYNC. DC lamp for the set channel will light up. When
set to the voltage U or current I, the SYNC. DC lamp
will not light up.
e.g.) CH1
1 Press .
2 Press to display the setting
screen shown to the left.
:
The screen varies depending on whether the wiring mode is
1P2W×2 or a mode other than 1P2W.
:
The screen varies depending on whether the wiring mode is
1P2W×3, 1P3W&1P2W and 3P3W&1P2W, 3P3W2M, or 3V3A
and 3P3W3M and 3P4W.
3 Press or to select the channel
to set.
Areas b, c, and d on the display correspond to CH1, CH2,
and CH3, respectively. The selected channel parameter will
flash.
3.2 Configuring Settings
3.2.5 Setting the Synchronization Source (SYNC)
This section describes how to set the synchronization source used to determine the cycle (between zerocross events) that will be used as the basis for calculations. You can select from the following parameters for
each connection: U1, U2, U3, I1, I2, I3, DC (fixed at 200 ms)
Page 58

52
4 Press or to set the
synchronization source.
Settings: U1 → I1 →U2 → I2 → U3 → I3 →
DC ⋅⋅⋅
(Setting the source to DC will cause the SYNC. DC lamp for
the set channel to light up.)
5 Set the synchronization sources for the
other channels as necessary.
6 Press to exit the settings.
The instrument will revert to the normal measurement state.
3.2 Configuring Settings
• When using a wiring mode other than 1P2W, the synchronization source will be standardized using the
CH1 settings.
• Setting the synchronization source to DC when using AC input will cause display values to fluctuate, preventing accurate measurement. Set the synchronization source to a value other than DC when using AC
input.
• The voltage and current for each channel will use the same synchronization source as set.
• Input for the parameters selected as synchronization sources must be at least 1% of the range.
• When the SYNC. ERROR lamp is lit up, accurate measurement cannot be performed.
• Even when the SYNC. ERROR lamp is not lit up, accurate measurement cannot be performed if the synchronization source input signal is in any of the following states:
1. When a signal with a frequency higher than the frequency measurement range (zero-crossing filter) is
being input
2. When a measured voltage or current of an AC component of an input signal is less than 1% of each
relevant range.
3. When a measured voltage or current of an AC component of an input signal is greater than 130% of
each relevant range.
4. When a signal with a frequency component within the frequency measurement range (zero-crossing
filter) other than the measurement signal’s fundamental wave frequency is superposed
Example: When the frequency measurement rage (zero-crossing filter) is 500 Hz, if a signal for which
zero-crosses occur at a frequency of less than 500 Hz (a modulation signal, noise, etc.) is
input on top of a 50 Hz input signal
• The synchronization source cannot be changed while integration is being performed or during display hold
or maximum value/minimum value hold operation.
• When using a timeout setting other than 0.1 sec. (1 sec. or 10 sec.) for channels with the 1P2W×2 or
IP2W×3, 1P3W&1P2W, and 3P3W&1P2W wiring modes, set the synchronization source to the voltage or
current for a channel whose timeout has been set to 1 sec. or 10 sec.
Example: If the CH1 and CH3 timeout setting is 0.1 sec. and the CH2 timeout is 10 sec. while using the
1P2W×3 wiring mode, set the CH2 synchronization source to U2 or I2.
Page 59

53
The zero-cross filter is linked to the frequency measurement
range. If you are unable to perform frequency measurement,
change this zero-cross filter setting. The default value is 500
Hz. Setting it to 100 Hz, 5 kHz, or 200 kHz will cause the lamp
to light up.
Accurate measurement cannot be performed if the SYNC. ER-
ROR lamp is lit up.
Setting the timeout to 1 sec. to 10 sec. will cause the lamp to
light up. The default value is 0.1 sec.
1 Press .
3.2 Configuring Settings
3.2.6 Setting the Frequency Measurement Range
When the synchronization source is set to voltage (U) or current (I), the SYNC. ERROR lamp will light up if the
synchronization signal cannot be acquired. When the SYNC. ERROR lamp is lit up, the instrument will not be
able to perform accurate measurement.
The instrument incorporates 100 Hz, 500 Hz, 5 kHz, and 200 kHz low-pass filters for use in switching the cutoff frequency (i.e., as a zero-crossing filter). These filters also vary with the frequency measurement range. If
the SYNC. ERROR lamp lights up, change this zero-cross filter setting.
Additionally, accurate measurement also cannot be performed when using input of a low frequency of less
than 10 Hz (with a repeating period of greater than 0.1 sec.) because each input cycle will exceed the instrument’s calculation processing interval (causing a timeout). The SYNC. ERROR lamp will also light up at this
time. In this case, set the instrument’s timeout setting to 1 sec. (for an input frequency of less than 10 Hz) or
10 sec. (for an input frequency of less than 1 Hz).
Zero-cross filter setting
100 Hz *
500 Hz
5 kHz *
200 kHz
* Setting the frequency measurement range to 100 Hz or 5 kHz requires that the firmware with the version
number 1.10 or later be installed.
See "2.4 Turning On the Instrument" (p.35) on how to check the installed firmware version number.
Example: 1P2W×3
Description
Use this setting primarily when measuring standard AC power supply equipment (50 Hz, 60
Hz) and when using the fundamental wave (100 Hz or less) on the secondary side of an inverter as the synchronization signal.
FREQ. 200kHz lamp on
Use this setting primarily when measuring standard AC power supply equipment (50 Hz, 60
Hz, 400 Hz) and when using the fundamental wave on the secondary side of an inverter as
the synchronization signal. (Default setting)
FREQ. 200kHz lamp off
Use this setting when using frequency input in excess of 500 Hz as the synchronization signal.
FREQ. 200kHz lamp on
Use this setting when using frequency input in excess of 5 kHz as the synchronization signal.
FREQ. 200kHz lamp on
Page 60

54
2 Press to display the setting
screen shown to the left.
:
The screen varies depending on whether the wiring mode is
1P2W×2 or a mode other than 1P2W.
:
The screen varies depending on whether the wiring mode is
1P2W×3, 1P3W&1P2W and 3P3W&1P2W, 3P3W2M, or 3V3A
and 3P3W3M and 3P4W.
3 Press or to select the channel
to set.
Areas b, c, and d on the display correspond to CH1, CH2,
and CH3, respectively. The selected channel parameter will
flash.
4 Press or to set the zero-
cross filter (100 Hz/ 500 Hz/ 5 kHz/
200 kHz).
Settings: 500Hz→200kHz→100Hz→5kHz ⋅⋅⋅
5 Set the zero-cross filter for other chan-
nels as necessary.
6 Press to exit the settings.
The instrument will revert to the normal measurement state.
3.2 Configuring Settings
• When using a wiring mode other than 1P2W, the frequency range will be standardized using the CH1 settings.
• When measuring an AC signal with a frequency lower than 500 Hz, it is recommended to set the frequency measurement range (zero-crossing filter) to 100 Hz or 500 Hz to reduce the noise component at
500 Hz and higher. Select the frequency measurement range depending on frequencies of signals to be
measured.
• Frequency measurement accuracy is guaranteed for sine wave input that is at least 20% of the frequency
measurement source’s measurement range. The instrument may not be able to perform frequency measurement accurately for other inputs (when the measurement signal is distorted, when there is a superposed noise component, etc.).
• The frequency measurement range cannot be changed while integration is being performed or during display hold or maximum value/minimum value hold operation.
• If a frequency of a signal to be measured is above the selected frequency measurement range, the instrument may not be able to perform frequency measurement accurately. Change the frequency measurement range to an appropriate one.
(Example) If a signal with a frequency above 500 Hz is input into the instrument with the frequency measurement range that is set to 500 Hz, change the range to 5 kHz or higher.
Page 61

3.2.7 Setting the Timeout
1 Press .
2 Press to display the setting
screen shown to the left.
:
The screen varies depending on whether the wiring mode is
1P2W×2 or a mode other than 1P2W.
:
The screen varies depending on whether the wiring mode is
1P2W×3, 1P3W&1P2W and 3P3W&1P2W, 3P3W2M, or 3V3A
and 3P3W3M and 3P4W.
3 Press or to select the channel
to set.
Areas b, c, and d on the display correspond to CH1, CH2,
and CH3, respectively. The selected channel parameter will
flash.
4 Press or to set the timeout
(0.1 sec., 1 sec., or 10 sec.).
Settings: 0.1 → 1 → 10 ⋅⋅⋅
5 Set the timeout for other channels as
necessary.
6 Press to exit the settings.
The instrument will revert to the normal measurement state.
55
3.2 Configuring Settings
Setting
0.1 sec.
1 sec.
10 sec.
Example: 1P2W×3
Description
Use this setting when the frequency of the input set as the synchronization source is 10 Hz or higher. (Default setting)
TIME OUT 1s/10s lamp off
Use this setting when the frequency of the input set as the synchronization source is less than 10 Hz.
TIME OUT 1s/10s lamp on
Use this setting when the frequency of the input set as the synchronization source is less than 1 Hz.
TIME OUT 1s/10s lamp on
Page 62

56
3.2 Configuring Settings
• When using a wiring mode other than 1P2W, the timeout setting will be standardized using the CH1 setting.
• When using a timeout setting other than 0.1 sec. (1 sec. or 10 sec.) for channels with the 1P2W×2 or
IP2W×3, 1P3W&1P2W, and 3P3W&1P2W wiring modes, set the synchronization source to the voltage or
current for a channel whose timeout has been set to 1 sec. or 10 sec.
Example: If the CH1 and CH3 timeout setting is 0.1 sec. and the CH2 timeout is 10 sec. while using the
1P2W×3 wiring mode, set the CH2 synchronization source to U2 or I2.
• When the frequency of the input to the set synchronization source is less than 5 Hz, the data update (display update) timing will vary with the frequency of the input to the synchronization source.
Example: If the frequency of the input to the synchronization source is 0.8 Hz, the data (display) will be
updated every 1/0.8 = 1.25 sec.
• If the SYNC. ERROR lamp lights up when the timeout has been set to a value other than 0.1 sec., the display will be updated once every time the timeout set time elapses.
• The timeout cannot be changed while integration is being performed or during display hold or maximum
value/minimum value hold operation.
• The instrument is equipped with the high-pass filters to avoid influences from DC components of input signals during detecting cycles.
The characteristics (time constant) of high-pass filters are switched with the settings of timeout.
If the range is changed, or an input voltage or current including a DC component rapidly changes, it will
take a time until a measured value becomes stable.
Please wait and read the measured value after the following time. The required time varies depending on
the timeout setting.
• When the timeout is set to 0.1 s: approximately 0.6 sec
• When the timeout is set to 1 s: approximately 10 sec
• When the timeout is set to 10 s: approximately 40 sec
Page 63

57
Xk: Measured value every 200 ms (instrument display update rate)
n: Number of averaging iterations
Average value =
Xk
n
k
∑
=1
1 Press .
2 Press to display the setting
screen shown to the left.
3 Press or until the number in
the area flashes.
3.2 Configuring Settings
3.2.8 Displaying Measured Values as an Average (AVG: Averaging)
In averaging operation, the number of averaging iterations for measured values is set, and averaged data is displayed.
Used when measured values fluctuate, causing excessive variation in the display, this setting provides a way to reduce
variation in display values.
The instrument uses simple averaging to average measured values. The display update interval varies with the number of
averaging iterations setting.
n
Number of averaging iterations and display update interval
Number of averaging iterations 1 (OFF) 2 5 10 25 50 100
Display update interval 200 msec. 400 msec. 1 sec. 2 sec. 5 sec. 10 sec. 20 sec.
Parameters that are averaged
The five parameters of voltage, current, active power, apparent power, and reactive power are averaged,
while the power factor and phase angle are calculated form averaged data.
Parameters that are not averaged
Voltage frequency, current frequency, current integration, active power integration, integration time, voltage
waveform peak value, current waveform peak value, efficiency, voltage crest factor, current crest factor, time
average current, time average active power, voltage ripple rate, current ripple rate, all harmonic measurement
parameters
Example: Set the number of average iterations to 2
Page 64

58
4 Press or and set the num-
ber in the area to 2.
The number 2 will flash, and the
AVG
lamp will light up.
When the setting is changed to a value other than
the default setting of 1, the AVG lamp will light up.
5 Press to exit the settings.
The instrument will revert to the normal measurement state.
This indicates that the number of averaging iterations cannot be changed.
After pressing to exit the setting, perform the following procedure:
Status Solution and reference for more information
During integration operation
(
RUN lamp lit up or flashing)
Averaging cannot be changed until the integrated value is reset (so that the
RUN
lamp turns off).
See: Canceling integration (resetting integrated values) (p.65)
During display hold operation or
maximum value/minimum value
hold operation (HOLD, MIN,
or MAX lamp lit up)
Averaging cannot be changed until this operation is canceled (so that the
HOLD
lamp turns off).
See: Canceling the display hold state (p.108)
Returning to the instantaneous value display (p.109)
If the number of average iterations does not flash
3.2 Configuring Settings
• Averaging will restart when there is a change that affects measured values, for example in the wiring
mode, range, integration reset, or number of averaging iterations. Since no average value exists immediately after the start of averaging, the invalid data display [- - - - -] will be shown. During this period of time,
the AVG lamp will flash.
• If the instantaneous value changes to [o.r] while average values are being displayed, the display will
change to [o.r].
• The unit may flash during measurement.
See: "3.11.3 When the Unit Indicator Flashes" (p.116)
• Averaging processing is performed for voltage, current, active power, apparent power, and reactive power.
• The power factor and phase angle are calculated from the averaged active power and apparent power.
Page 65

59
This indicates that the VT or CT ratio cannot be changed.
After pressing to exit the setting, perform the following procedure:
Status Solution and reference for more information
During integration operation
(RUN lamp lit up or flashing)
The VT and CT ratios cannot be changed until the integrated value is reset
(so that the RUN lamp turns off).
See: Canceling integration (resetting integrated values) (p.65)
During display hold operation or
maximum value/minimum value
hold operation (HOLD, MIN, or
MAX lamp lit up)
The VT and CT ratios cannot be changed until this operation is canceled
(so that the HOLD lamp turns off).
See: Canceling the display hold state (p.108)
Returning to the instantaneous value display (p.109)
If the VT or CT ratio does not flash
3.2 Configuring Settings
3.2.9 Setting the VT and CT Ratio
When inputting a voltage in excess of the instrument’s maximum input voltage of 1000 V or a current in
excess of its maximum input current of 70 A, use an external VT (PT) or CT, respectively. This section
describes how to set the ratio (VT ratio or CT ratio) when using an external VT or CT. Even when using an
external current sensor, it is necessary to set the CT ratio.
The VT and CT ratios can be set separately for each wiring mode.
By setting the VT and CT ratios, you can read primary-side current and voltage input values directly.
Exercise caution if the VT or CT lamp lights up as this state indicates that a voltage or current that differs from the indicated measured value is being input.
VT ratio setting range
0.1 to 0.9, 1.0 to 9.9, 10.0 to 99.9, 100.0 to 999.9, (1000)
(If the VT ratio display changes to 0.0, 00.0, 000.0, the instrument internally multiplies measured values by a
VT ratio of 1000.
CT ratio setting range
0.001 to 0.009, 0.010 to 0.099, 0.100 to 0.999, 1.000 to 9.999, 10.00 to 99.99, 100.0 to 999.9 (1000)
(If the CT ratio display changes to 0.0, 00.0, 000.0, the instrument internally multiplies measured values by a
CT ratio of 1000.
When using a wiring mode other than 1P2W, the CT and CT ratios will be standardized using the CH1 setting.
Page 66

60
1 Press .
2 Press to display the setting
screen shown to the left.
3 Press or until the first digit of
the VT ratio for the channel you wish to
set flashes.
4 Press or to set the VT ratio.
To change digits:
Press or until the digit you wish to set
flashes and then set the digit.
To set the VT ratio for another channel:
Return to Step 3.
5 Press to exit the settings.
The instrument will revert to the normal measurement state.
3.2 Configuring Settings
Setting the VT ratio
Page 67

Setting the CT ratio
1 Press .
2 Press to display the setting
screen shown to the left.
3 Press or until the first digit of
the CT ratio for the channel you wish to
set flashes.
To move the decimal point:
Press or until the decimal point flashes,
and press or to exit the setting.
4 Press or to set the CT ratio.
To change digits:
Press or until the digit you wish to set
flashes and then set the digit.
To set the VT ratio for another channel:
Return to Step 3.
5 Press to exit the settings.
The instrument will revert to the normal measurement state.
61
3.2 Configuring Settings
Page 68

62
3.3 Integration
3.3 Integration
The instrument performs integration for the current and active power in the positive direction (Ah+, Wh+), in the
negative direction (Ah-, Wh-), and as sums (Ah, Wh) simultaneously for all channels and can display the integrated value for each. Integration can be started and stopped, and the integrated value can be reset, using either
the instrument’s keys or the external control function. Additionally, by setting the integration time, it is possible to
perform timer integration in 1-minute units from 1 minute to 10,000 hours (approximately 417 days). Furthermore, it is also possible to measure the time average current and time average active power as calculated from
the integrated value at that point in time and the integration elapsed time while integration is being performed.
The effective measurement range for integration is the effective measurement range for current or active
power, and values up to the maximum effective peak voltage or maximum effective peak current (until the
PEAK OVER U or PEAK OVER I lamp lights up) are integrated as valid data.
Maximum effective peak voltage: ±600% of the voltage range (up to ±1500 Vpeak for the 300 V, 600 V,
and 1000 V ranges)
Maximum effective peak current: ±600% of the current range (up to ±100 Apeak for the 20 A and 50 A ranges)
Example: When performing DC current integration using the 1 A range, the current display value (A) will change
to [o.r] when 1.4 A is exceeded, but the effective measurement range for current integration (Ah)
extends from ±10 mA (1% of the 1 A range) to ±6 A, so the values will be integrated as valid data.
Display parameters and descriptions related to integration
Display parameter Description
Ah + Positive current integrated value
Ah - Negative current integrated value
Ah Sum of current integrated values
Wh + Positive active power integrated value
Wh - Negative active power integrated value
Wh Sum of active power integrated values
TIME Integration elapsed time
T.AV A Time average current (obtained by dividing the sum of current integrated values by the integration elapsed time)
T.AV W
Time average active power (obtained by dividing the sum of active power integrated values by the integration elapsed time)
Displaying the rectifier and integrated values
Internally, the following integrated values are all integrated simultaneously, regardless of the rectifier. Consequently, integrated value data with simultaneity can be obtained simply by switching the display parameter.
Current (Ah+, Ah-, Ah)
Rectifier Integration operation and display
AC+DC
AC+DC Umn
DC The results of integrating sampled instantaneous data separately by polarity are displayed as integrated values.
AC
FND
The results of integrating current RMS value data (display values) once every display update interval (200
ms) are displayed as integrated values.
[
- - - - -] (no integrated data) is shown.
Active power (Wh +, Wh -, Wh)
Rectifier Integration operation and display
AC+DC
AC+DC Umn
DC
AC
FND
The results of integrating active power values calculated once for every cycle of the selected synchronization source separately by polarity are displayed as integrated values. This rectifier is used to integrate active power values of cyclic waveforms.
The results of integrating sampled instantaneous data separately by polarity are displayed as integrated
values. This rectifier is used to integrate active power values of non-cyclic waveforms such as a DC or others. (When a waveform to be measured includes both a DC and an AC component, the integrated value
will not be an integration of only a DC component.)
[
- - - - -] (no integrated data) is shown.
Page 69

3.3 Integration
Wiring mode and displayed integrated values
z : Installed?- : Not installed
Wiring mode Rectifier Channel Ah+ Ah- Ah Wh+ Wh- Wh
1, 2 −−zzzz
sum −−−−−−
1, 2 zzzzzz
sum −−−−−−
1, 2 −−zzzz
sum −−−zzz
1, 2 zzzzzz
sum −−−−−−
1, 2
sum −−−zzz
1, 2, 3 −−z −−−
sum −−−zzz
−
− z −−−
1P2W
×2
1P3W
3P3W
3P3W2M
AC+DC
AC+DC Umn
DC
AC+DC
AC+DC Umn
DC
AC+DC
AC+DC Umn
DC 1, 2, sum −−−−−−
AC+DC
AC+DC Umn
DC 1, 2, 3, sum −−−−−−
63
z : Installed?- : Not installed
Wiring mode Rectifier Channel Ah+ Ah- Ah Wh+ Wh- Wh
1, 2, 3 −−zzzz
sum −−−−−−
1, 2, 3 zzzzzz
sum −−−−−−
1, 2 −−zzzz
sum −−−zzz
3 −−zzzz
1, 2, 3 zzzzzz
sum −−−−−−
1, 2 −−z −−−
sum −−−zzz
3 −−zzzz
1, 2, sum −−−−−−
3 zzzzzz
1, 2, 3 −−z −−−
sum −−−zzz
1, 2, 3 −−zzzz
sum −−−zzz
1P2W
×3
1P3W&1P2W
3P3W&1P2W
3P3W2M
3V3A
3P3W3M
3P4W
AC+DC
AC+DC Umn
DC
AC+DC
AC+DC Umn
DC
AC+DC
AC+DC Umn
DC
AC+DC
AC+DC Umn
DC 1, 2, 3, sum −−−−−−
AC+DC
AC+DC Umn
DC 1, 2, 3, sum −−−−−−
The display will indicate invalid data [- - - - -] for combinations for which no integrated value exists.
Page 70

64
Press through to select the display parameter.
See: "3.2.3 Selecting Display Content" (p.44)
1 Verify that the instrument is in the
integration reset state (RUN and
EXT lamps off).
2 Press .
3 Integration will start, and the RUN
lamp will light up.
1 Press while the RUN lamp is
lit up (indicating that the instrument
is performing integration).
2 Integration will stop, and the RUN
lamp will flash.
3.3 Integration
Display method
Method for starting and stopping integration and resetting integrated values
The following four methods are used to start and stop integration and reset integrated values:
• Using
• Using communications (see the Communications Command Instruction Manual)
• Using external control (p.85)
• Using synchronized control (p.81)
This section describes use of .
For more information about integration using communications, external control, or synchronized control, refer
to each section indicated above.
Starting integration
Stopping integration
Page 71

65
1 Press while the RUN lamp is
flashing.
2 Additional integration will start, and
the RUN lamp will light up.
1 Press to stop integration.
2 Integration will stop, and the RUN
lamp will flash.
3 Press to place the instrument
in the shift state and then press
.
4 Integration will be reset, and the
RUN lamp will turn off.
3.3 Integration
Starting integration while adding to previous integrated values (additional integration)
Pressing while the RUN lamp is flashing (indicating that integration is stopped) causes integration to
start while adding to previous integrated values.
As long as the integrated values are not reset, integration will be repeated using the previous state.
Canceling integration (resetting integrated values)
Settings cannot be changed while integration is being performed (while the RUN lamp is lit up or flashing).
To cancel integration, use the following procedure. When integration is canceled, measurement results up to
that point will be reset.
Page 72

66
Hours Minutes
(Default setting)
1 Press .
2 Press to display the settings
screen shown to the left.
3 Press or to select the digit of
the time you wish to set, which will start
flashing.
3.3 Integration
Performing integration after setting an integration time (timer integration)
You can perform integration for a certain period of time by setting the integration time. The instrument allows
the integration time to be set in 1-minute increments from 1 minute to 10,000 hours.
Example integration time setting displays
Integration time Setting display
1 min.
59 min.
1 hr. 8 min.
9,999 hr. 59 min.
10,000 hr.
Page 73

67
4 Press or to set the integra-
tion time.
Setting range: 0 to 9,999.59
(When the setting display indicates 0000.00, integration will be performed until 10,000 hours has
elapsed.)
5 Press to exit the settings.
The instrument will return to the normal measurement state.
This indicates that the integration time cannot be changed. Take the following action to address the issue:
Status Solution and reference for more information
During integration operation
(RUN lamp lit up or flashing)
The integration time cannot be changed until the integrated value is reset (so that
the RUN lamp turns off).
See: Canceling integration (resetting integrated values) (p.65)
During display hold operation or
maximum value/minimum value
hold operation (HOLD, MIN, or
MAX lamp lit up)
The integration time cannot be changed until this operation is canceled (so that the
HOLD lamp turns off).
See: Canceling the display hold state (p.108)
Returning to the instantaneous value display (p.109)
If the integration time does not flash
3.3 Integration
Page 74

68
3.3 Integration
Integration precautions
(1) When integration starts, the voltage and current auto-range setting will be canceled, and measurement
will be fixed to the range in effect when integration started. Set the range so that the PEAK OVER U
(overvoltage input alarm) lamp and PEAK OVER I (overcurrent input alarm) lamp do not light up during
integration.
If the PEAK OVER U lamp or PEAK OVER I lamp lights up during integration, the integrated value will
not be accurate. In this case, the Ah or Wh unit will flash until integrated values are reset (DATA
RESET).
(Even if the current or active power measured value is [o.r] [over-range], measured values falling within
the range such that the PEAK OVER U and PEAK OVER I lamps do not light up will be integrated.)
(2) Equipment constraints due to the integrating meter
Some parameters cannot be set or changed in the integration state (when the RUN lamp is lit up) or in
the integration stopped state (when the RUN lamp is flashing). If a change is not supported, [Err.12] will
be displayed for approximately 1 second.
See: Constraints during integration operation (p.145)
(3) If an integrated value reaches 999,999 MWh, or if the integration elapsed time reaches 10,000 hours,
integration will stop, and you will not be able to restart it. ([Err.14] will be displayed for approximately 1
second.) In this case, restart integration after pressing the SHIFT key followed by the START/STOP
(DATA RESET) key to reset integrated values (causing the RUN lamp to turn off).
See: Canceling integration (resetting integrated values) (p.65)
(4) Maximum value and minimum value measurement will also restart when integration starts. If an integra-
tion reset is performed, maximum value and minimum value measurement will also restart. Averaging
will also restart when integration is reset.
(5) When a system reset is performed, integration operation will stop, and the instrument will revert to its fac-
tory settings.
See: "3.10.4 Initializing the Instrument (System Reset)" (p.112)
(6) If the power goes out during integration, integration will stop when power is restored.
(7) If the timeout is set to 10 seconds and a signal of 1 Hz or less is input, a single measurement may take
about 10 seconds.
(8) Before starting integration synchronized measurement, reset integrated values on both the master and
slave. To perform a reset that is synchronized to the master, it is necessary for integration operation on
the slave to be in the stopped or reset state.
(9) Starting integration without first performing a reset results in additional integration.
(10) Synchronization- and external control-based integration cannot be mixed on the slave. Always terminate
external control and reset integration when performing synchronization-based integration.
(11) When the slave’s integration time setting is shorter than the master’s integration time setting, stop timing
cannot be synchronized since the slave’s integration will stop first.
(12) When performing synchronized measurement, once integration start/stop is performed on the slave, it
may not be possible to synchronize operation, even if the same operation is performed on the master.
(13) When performing integrated measurement using synchronized control, a difference of up to 0.7 sec. per
hour may occur between the master’s integration elapsed time display value (TIME) and the slave’s integration elapsed time display value.
Page 75

69
3.3 Integration
• When performing integration for an extended period of time, it is recommended to back up the instrument
with an uninterruptible power supply (UPS). The instrument’s maximum rated power is 40 VA or less.
Ensure that you use a UPS with adequate capacity. When using a UPS to power the instrument, do not use
a unit that produces rectangular wave or pseudo-sine wave output. Doing so may damage the instrument.
• After power is restored, measured values may be offset for reasons related to the instrument’s internal circuitry. In this case, perform zero-adjustment after eliminating all input to the instrument, for example by
deactivating power to measurement lines.
• Continuing to input voltage or current signals after an outage has caused the instrument to lose power
may damage the instrument.
Page 76

70
3.3 Integration
3.3.1 Integrated Value Display Format
The following tables describe the format of integrated values after they have been reset. When the number of
digits in an integrated value increases, the number of digits in the format will also increase. Similarly, when the
number of digits in an integrated value decreases, the number of digits in the format will also decrease.
No fewer digits may be used than in the format in the integration reset state.
Current integration format
Current range 200 mA, 500 mA 1 A, 2 A, 5 A 10 A, 20 A, 50 A
Reset value 00.0000 mAh 000.000 mAh 0.00000 Ah
Power integration format (1P2W, 150 V range)
Current range
Voltage range
150 V 0.00000 Wh 00.0000 Wh 000.000 Wh
200 mA, 500 mA 1 A, 2 A, 5 A 10 A, 20 A, 50 A
Approach to integration reset values
One-tenth of the value of the display format for the current range or active power range is used as the integrated value format at reset.
Display format Integrated value format Reset value
3 W range 3.0000 W 300.000 mWh 000.000 mWh
9 kW range 9.0000 kW 900.000 Wh 000.000 Wh
Even when a VT ratio and CT ratio are set, 1/10 of the corresponding display format is used as the integrated
value format.
Display format Integrated value format Reset value
600 W range
15 V × 10 (VT) × 200 mA × 20 (CT)
600.00 W 60.0000 Wh 00.0000 Wh
Page 77

71
1 Press .
2 You can check the display mode
based on the LEVEL lamp and HD%
lamp state.
Example: LEVEL lamp on
3.4 Viewing Harmonic Measured Values
3.4 Viewing Harmonic Measured Values
The instrument displays the results of harmonic analysis for each channel’s voltage, current, and active
power. Since all calculation processing is performed in parallel internally, you can obtain harmonic measured
values with simultaneity with other measured values simply by switching display parameters.
Additionally, when the synchronization frequency is 45 Hz to 66 Hz, the instrument can perform harmonic
measurement that complies with IEC 61000-4-7:2002.
3.4.1 Setting the Synchronization Source
Set the synchronization source for the harmonic measurement to be performed with the instrument as
described in "3.2.5 Setting the Synchronization Source (SYNC)" (p.51). The source can be set separately for
each wiring mode.
3.4.2 Method for Displaying Harmonic Measurement Parameters
The following table summarizes the instrument’s harmonic measurement parameters and corresponding display methods:
Harmonic content percentage
display
LEVEL lamp off
HD% lamp on
• Harmonic voltage content
percentage
• Harmonic current content
percentage
• Harmonic active power
content percentage
• 0th to 50th order
Display mode
Measurement
items
Normal display
LEVEL lamp off
HD% lamp off
• Total harmonic voltage distortion
• Total harmonic current distortion
• Fundamental wave voltage RMS value
• Harmonic current RMS value
• Fundamental wave active power
• Fundamental wave apparent power
• Fundamental wave reactive power
• Fundamental wave power factor
• Fundamental wave voltage/current phase
difference
• Inter-channel voltage fundamental
wave phase difference
• Inter-channel current fundamental
wave phase difference
Harmonic level display
LEVEL lamp on
HD% lamp off
• Harmonic voltage RMS value
• Harmonic current RMS value
• Harmonic active power
• 0th to 50th order
Switching display modes
LEVEL lamp HD% lamp
Normal display Off Off
Harmonic level display On Off
Harmonic content percentage display Off On
Page 78

72
Example: If [odr 1] or similar is shown in area a on the display while displaying harmonics
1 Press to display LEVEL.
2 Press or to change the
order.
The component for the order that is
specified in the area a will be shown for
areas b, c, and d on the display.
Settings: 0 to 50
1 Press after pressing to
place the instrument in the shift state.
2 Press or to change the
order.
If all display areas indicate [--], the “display the
same order component” setting will be used.
Settings: 0 to 50 → - - → 0 to 50
To move areas a, b, c, or d on the display :
Press or to select the display area
you wish to set so that it flashes and then set
as desired.
3 Press or to exit the Order
Setting screen.
By allocating different orders to areas a
through d on the display and then setting all
the areas to the same measurement parameter, you can observe changes in each order.
3.4 Viewing Harmonic Measured Values
The following two harmonic display methods are available:
Displaying components for the same order as the display parameter (default state)
Allocating components for different orders to areas a, b, c, and d on the display
Page 79

73
Parameters shown with normal display parameters
Example: THD V%
Press through to display THD V
% or THD A % in the display area.
Parameters shown as fundamental wave parameters (displayed as RECTIFIER FND)
1 Press to place the instrument
in the shift state and then press
to display FND.
2 Press through to change
the display parameter.
Example: FND V
3.4 Viewing Harmonic Measured Values
Total harmonic voltage distortion (THD V %), total harmonic current distortion (THD A %)
Fundamental wave voltage (FND V), fundamental wave current (FND A), fundamental wave active power
(FND W), fundamental wave apparent power (FND VA), fundamental wave reactive power (FND var), funda-
mental wave power factor (FND PF), fundamental voltage/current phase difference (FND °), inter-channel
voltage fundamental wave phase difference (FND θ V °), inter-channel current fundamental wave phase difference (FND θ A °)
Measurement parameters displayed using harmonic analysis (harmonic level, content percentage, rectifier
FND [fundamental wave component]) are not averaged by the averaging function.
Page 80

74
Parameters shown as harmonic level (LEVEL)
1 Press to display LEVEL.
2 Press , , or to
change the harmonic order.
After pressing or :
01 (1st order: fundamental wave compo-
nent) → 02 (2nd order) → … → 49 (49th
order) → 50 (50th order) → 00 (0th order:
DC component) → 01
After pressing or
01
→ 00 → 50 → 49 → ⋅⋅⋅ → 02 → 01
3 The harmonic level will be dis-
played in areas through
on the display.
(Default display)
Display area b: CH1 harmonic voltage RMS value
Display area c: CH1 harmonic current RMS value
Display area d: Harmonic active power
4 Press to change the channel
being shown.
5 Press through to change
the display parameter.
3.4 Viewing Harmonic Measured Values
Harmonic voltage RMS value (HRM V), harmonic current RMS value (HRM A), harmonic active power (HRM
W)
Page 81

75
Parameters displayed as harmonic content percentage (HD %)
1 Press to display HD %.
2 Press , , or to
change the harmonic order.
After pressing or :
01 (1st order: fundamental wave compo-
nent) → 02 (2nd order) → … → 49 (49th
order) → 50 (50th order) → 00 (0th order:
DC component) → 01
After pressing or
01
→ 00 → 50 → 49 → ⋅⋅⋅ → 02 → 01
3 The harmonic content percentage
will be displayed in areas
through on the display.
(Default display)
Display area b: CH1 harmonic voltage content
percentage
Display area c: CH1 harmonic current content
percentage
Display area d: Harmonic active power content
percentage
4 Press to change the channel
being shown.
5 Press through to change
the display parameter.
Parameters that can be downloaded with communications functionality
3.4 Viewing Harmonic Measured Values
Harmonic voltage content percentage (HRM V %), harmonic current content percentage (HRM A %), harmonic active power content percentage (HRM W %)
Display method
Harmonic voltage phase angle, harmonic current phase angle, harmonic voltage/current phase difference
These parameters cannot be displayed. They can only be downloaded using communications functionality.
(See the Communications Command Instruction Manual.)
Page 82

76
1 Press .
2 Press to display the settings
screen shown to the left.
3 Press or to set the upper
limit value for analysis.
The HRM LIMIT lamp will light up if you set a value
other than 50.
4 Press to exit the settings.
The instrument will return to the normal measurement state.
3.4 Viewing Harmonic Measured Values
3.4.3 Setting the Analysis Order Upper Limit
The instrument allows you to set an upper limit value for the harmonic analysis order. One example of how
this setting can be used is to set a limit on the uppermost order during total harmonic distortion (THD) measurement. The setting applies to all channels.
Example: To set the harmonic analysis order upper limit value to 13
The harmonic level and content percentage displays will include data up to the 50th order, even if the upper
limit is set to a value other than 50.
Page 83

77
Failure of the value to flash indicates that the upper limit value cannot be changed. Take the following
action to address the issue:
Status Solution and reference for more information
During integration operation
(RUN lamp lit up or flashing)
The upper limit value cannot be changed until the integrated value is reset (so that
the RUN lamp turns off).
See: Canceling integration (resetting integrated values) (p.65)
During display hold operation or
maximum value/minimum value
hold operation (HOLD, MIN, or
MAX lamp lit up)
The upper limit value cannot be changed until this operation is canceled (so that
the HOLD, MIN, or MAX lamp turns off).
See: Canceling the display hold state (p.108)
Returning to the instantaneous value display (p.109)
If the upper limit does not flash
Accurate harmonic measurement cannot be performed
while the HRM ERROR lamp is lit up.
3.4 Viewing Harmonic Measured Values
3.4.4 About the HRM ERROR lamp
The HRM ERROR lamp lights up to indicate that the synchronization frequency range has been exceeded
when unable to synchronize during harmonic measurement.
The HRM ERROR lamp lights up when the instrument is unable to perform harmonic analysis due to the frequency range being exceeded, noise, or for other reasons. The invalid data display [- - - - -] will be shown at
this time.
Page 84

78
3.5 Measuring Efficiency
3.5 Measuring Efficiency
The instrument can calculate the ratio of active power values for different wires and display the result as the
efficiency η [%]. This function can be used to measure the efficiency across inputs and outputs of devices
such as power supply equipment and inverters.
This section details the wiring modes for which efficiency can be measured as well as the calculation formulas
used.
When performing synchronized measurement using two instruments, efficiency cannot be
measured between the two instruments. Efficiency can only be measured on a single instrument between the wires listed below.
Wiring mode Efficiency calculation formula Description
η1=|P2|/|P1|×100 [%]
1P2W×2
η2=|P1|/|P2|×100 [%]
The ratio of the CH2 (1-phase/2-wire) active power to the
CH1 (1-phase/2-wire) active power
The ratio of the CH1 (1-phase/2-wire) active power to the
CH2 (1-phase/2-wire) active power
Wiring mode Efficiency calculation formula Description
η1=|P3|/|P1|×100 [%]
1P2W×3
η2=|P1|/|P3|×100 [%]
η1=|P3|/|Psum|×100 [%]
1P3W&1P2W
η2=|Psum|/|P3|×100 [%]
η1=|P3|/|Psum|×100 [%]
3P3W&1P2W
η2=|Psum|/|P3|×100 [%]
The ratio of the CH3 (1-phase/2-wire) active power to the
CH1 (1-phase/2-wire) active power
The ratio of the CH1 (1-phase/2-wire) active power to the
CH3 (1-phase/2-wire) active power
The ratio of the CH3 (1-phase/2-wire) active power to the
sum of the CH1 and CH2 (1-phase/2-wire) active power
The ratio of the sum of the CH1 and CH2 (1-phase/3-wire)
active power to the CH3 (1-phase/2-wire) active power
The ratio of the CH3 (1-phase/2-wire) active power to the
sum of the CH1 and CH2 (3-phase/3-wire) active power
The ratio of the sum of the CH1 and CH2 (3-phase/3-wire)
active power to the CH3 (1-phase/2-wire) active power
• Efficiency values η1 and η2 are calculated from the (absolute values of the) active power values with the
AC+DC rectifier.
• The display range is 0.00 [%] to 200.00 [%]. Results that exceed this range will trigger the over-range display [o.r].
• If the active power value being used as the numerator or denominator in the calculation equation is [o.r],
or the active power value being used as the denominator is 0, the efficiency will be displayed as [o.r].
• The invalid data display [- - - - -] will be shown for wiring modes for which efficiency measurement is not
performed, for example 3V3A, 3P3W3M, 3P4W, etc.
Page 85

79
Measuring the input and output efficiency of a switching power supply
1 Press and set the wiring mode to
[1P2W×2].
In this case, the switching power supply’s input and
output efficiency can be calculated as
η1(=|P2|/|P1|×100 [%]), so set the display parameter
to η1.
2 Press or to display [CH2] [W]
(P2) for [
ACDC] in area a on the display.
Press or to display [
CH1] [W]
(P1) for [
ACDC] in area b on the display.
Press to display [η1] in area c on
the display.
Output side (DC, 1P2W)Input side (AC, 1P2W)
Switching
power
supply
3.5 Measuring Efficiency
Examples of efficiency measurement
The following provides examples of efficiency measurement. Before making actual measurements, connect
and configure the instrument as described in "Chapter 2 Measurement Preparations" (p.27).
When making actual measurements, select how to connect the measurement target to the instrument based
on its voltage and current so as to minimize the effects of instrument loss. (p.30)
In this example, we will measure the input and output efficiency of a switching power supply with 1-phase/2wire AC input and a single DC output circuit. The input side of the power supply will be input to CH1 of the
instrument, and the output side of the power supply will be input to CH2 of the instrument. The 1P2W×2 wiring
mode will be used.
Page 86

80
Measuring the input-output efficiency of a DC-to-AC (3-phase/3-wire)
inverter
1 Press and set the wiring mode to
[3P3W&1P2W].
In this case, the switching power supply’s input and
output efficiency can be calculated as
η2(=|Psum|/|P3|×100 [%]), so set the display parameter to η2.
2 Press or to display [sum]
[W] (Psum) for [ACDC] in area a on the
display.
Press or to display [CH3]
[W] (P3) for [ACDC] in area b on the display.
Press to display [η2] in area c on
the display.
Output side (AC, 3P3W)Input side (DC, 1P2W)
Inverter
3.5 Measuring Efficiency
In this example, we will measure the input-output efficiency (energy conversion efficiency) of a 3-phase/3-wire
inverter with DC input and AC output. The input side of the inverter will be input to CH3 of the instrument, and
the output side will be input to CH1 and CH2 of the instrument.
Page 87

81
3.6 Performing Synchronized Measurement with Multiple Instruments (Multiple-instrument Synchronized Measurement)
3.6 Performing Synchronized Measurement with
Multiple Instruments (Multiple-instrument
Synchronized Measurement)
You can perform synchronized measurement by connecting multiple (up to eight: one master and up to seven
slaves) instruments (PW3336/PW3337) with optional 9165 Connection Cord (BNC cable).
This functionality can be used to perform simultaneous measurement of multiple circuits by operating only the
instrument (PW3336/PW3337) set up as the master (instrument setting of OUT) and thereby controlling the
instrument (PW3336/PW3337) set up as the slave (instrument setting of IN).
The instrument (PW3336/PW3337) set up as the slave will match the timing of the instrument (PW3336/
PW3337) set up as the master for the following operations:
• Internal calculations
• Display updates
• Data updates
• Integration start, stop, and reset
• Display hold
• Zero-adjustment
•Key lock
• To avoid damaging the instruments, do not connect or disconnect cables while the instruments are turned on.
• Use a common ground for instruments (PW3336/PW3337) that are performing simultaneous
measurement. If different grounding is used, a potential difference will occur between the
master ground and the slave ground. Connecting the connection cable (for synchronization)
while there is such a difference may result in malfunction or damage.
• Dedicated signals are used in synchronized measurement. Do not input signals other than
those designed for synchronized measurement. Doing so may result in malfunction or damage.
Page 88

82
9165 Connection Cord
9165 Connection Cord
BNC T-adaptor (jack-plug-jack)
Connect to the instrument
3.6 Performing Synchronized Measurement with Multiple Instruments
(Multiple-instrument Synchronized Measurement)
Connecting 2 instruments (PW3336/PW3337) with a synchronization cable
You will need: Two instruments, one 9165 Connection Cord
Verify that both instruments (PW3336/PW3337) have been turned off.
1
Connect the instruments’ EXT SYNC terminals with the 9165 Connection Cord.
2
Turn on the two instruments (PW3336/PW3337). (The order in which the instruments are
3
turned on does not matter.)
• When performing synchronized measurement with more than three instruments, connect the instrument in
parallel using a BNC adaptor such as a BNC T-adaptor (jack-plug-jack).
• During synchronized measurement, control signals are sent using the 9165 Connection Cord. Never dis-
connect the connection cable during synchronized measurement. Doing so will prevent these signals from
being properly supplied.
Page 89

3.6 Performing Synchronized Measurement with Multiple Instruments
1 Press .
2 Press to display the settings
screen to the left.
3 Press or to select the syn-
chronized control I/O setting.
4 Press or to configure the
synchronized control I/O setting.
Setting: oFF → oUt → in ⋅⋅⋅
The SYNC.OUT lamp will light up when set to oUt.
5 Press to exit the settings.
The instrument will return to the normal measurement state.
(Multiple-instrument Synchronized Measurement)
Configuring synchronized measurement
You can set the master and slave by configuring the synchronized control input and output settings.
Turns off the synchronized control function.
OFF
IN
OUT
The EXT SYNC terminal setting is [IN], but input signals are ignored. This is the default state. External
synchronized operation is not performed. The
Sets the instrument as the slave.
The EXT SYNC terminal is set to [IN], and dedicated synchronization signals can be input. Synchronization signals will be received from the BNC terminal, and processing will be performed accordingly. When
synchronization signals are received from an external source, the
Sets the instrument as the master.
The EXT SYNC terminal will be set to [OUT], and dedicated synchronization signals will be output. Synchronization signals will be output from the BNC terminal. The
SYNC.OUT lamp is off.
SYNC.OUT lamp will flash.
SYNC.OUT lamp will light up.
83
Page 90

84
Synchronized control terminal input Synchronized control terminal output
3.6 Performing Synchronized Measurement with Multiple Instruments
(Multiple-instrument Synchronized Measurement)
• When drawing external synchronization from two or more instruments, be sure to set only one as the oUt
power meter. Use of two or more oUt instruments may cause damage or malfunction.
• When an instrument is set to oUt, the synchronization signal is output from the BNC terminal according to
the internal processing timing (200 ms).
• When an instrument is set to in, it will wait for the synchronization signal from the power meter set to oUt.
If no synchronization signal is received before 210 ms or more elapses, the instrument will display [Err.20].
See: "6.2 Error Indication" (p.179)
Synchronized operations
Internal calculations
Display updates
Data updates
Integration start/stop and reset
Display hold
Zero Adjustment
Key-lock
The slave matches the master’s timing.
Integration starts, stops, and is reset at the same timing as the master on the slave by
means of START and STOP key operation on the master.
When the HOLD key is pressed on the master, the master and slave both enter the hold
state. To cancel the display hold state, press the HOLD key again.
Zero-adjustment is performed on the slave in synchronization with zero-adjustment on the
master.
When the key lock is activated on the master, it is also activated on the slave. When the key
lock is canceled on the master, it is also canceled on the slave.
• Before starting integration synchronized measurement, reset integrated values on both the master and
slave. To perform a reset that is synchronized to the master, it is necessary for integration operation on the
slave to be in the stopped or reset state.
• Starting integration without first performing a reset results in additional integration.
• If the number of averaging iterations settings on the master and slave differ, display updates will not be
synchronized.
• Synchronization- and external control-based integration cannot be mixed on the slave. Always terminate
external control and reset integration when performing synchronization-based integration.
• When the slave’s integration time setting is shorter than the master’s integration time setting, stop timing
cannot be synchronized since the slave’s integration will stop first.
• When performing synchronized measurement, once integration start/stop, display hold, zero-adjustment,
or key lock operation is performed on the slave, it may not be possible to synchronize operation, even if
the same operation is performed on the master.
• When performing integrated measurement using synchronized control, a difference of up to 0.7 sec. per
hour may occur between the master’s integration elapsed time display value (TIME) and the slave’s integration elapsed time display value.
EXT SYNC terminal internal circuitry
Page 91

85
5 V (open)
0 V (shorted)
At least 400 msec.
Integration is performed during this interval.
Integration start Integration stop
3.7 External Control
3.7 External Control
External control uses the EXT. CONTROL terminals.
External control terminals and description of control
Terminal name Description
START/STOP Starts/stops integration.
When a high (5 V or open) or low (0 V or shorted) signal is input to this terminal, integration starts. When the
signal changes from low to high, integration stops.
RESET Resets integrated values.
HOLD Holds the display when this terminal changes from high to low. The display hold is canceled when the terminal
GND Connect to the external device's GND terminal.
When this terminal is set to low for at least 200 ms, integrated values are reset during that period.
changes from low to high.
3.7.1 External control terminal
The external control terminals are input terminals for controlling the instrument by means of either 0/5 V logic
signals or short/open contact signals.
External control signals are detected using the intervals illustrated in the following timing diagrams, but there
may be a delay in the display depending on the input signal frequency, synchronization signal, timeout, and
other settings.
Integration start/stop (START/STOP terminal)
Page 92

86
5 V (open)
0 V (shorted)
Integrated values are reset during this interval.
At least 200 msec.
5 V (open)
0 V (shorted)
At least 200 msec.
The display is held during this interval.
Display hold cancelDisplay hold start
3.7 External Control
• When integration is started with external control, it can only be stopped by external control. The integration
set time is ignored. If you attempt to stop integration with , [Err.11] will be displayed.
• A delay (data update interval) of up to 200 msec. will occur between input of the integration start signal
and the actual start of integration.
•The EXT lamp will light up while integration triggered by external control is being performed.
Integrated value reset (RESET terminal)
• While integration is being performed (while the RUN lamp is lit up), integrated values cannot be reset.
Attempting to do so will cause [Err.15] to be displayed.
• A delay (date update interval) of up to 200 msec. will occur between input of the integration reset signal
and the actual integration reset.
Display hold (HOLD terminal)
A delay (data update interval) of up to 200 msec. will occur between input of the hold signal and the actual
hold.
Page 93

External control terminal internal circuit schematic
+5 V
10 kΩ
100 Ω
49.9 kΩ
1000 pF
3
2
1
Release the button.
The electric wire is locked in place.
To remove the wire:
Hold the button while pulling the wire out.
Connecting wires to the external control terminals
Before connecting wires to the terminals, see Handling the Instrument (p.6).
87
3.7 External Control
To avoid an electrical accident, use the specified wire type.
Connect the wires to the terminals for the parameter you wish to control. Connect the GND terminal on the
instrument's external control terminals to the Lo (0 V) side of the contact signal or logic signal.
See: " External control terminals and description of control" (p.85)
Press down on the terminal button using a tool, such as a flat head screwdriver.
1
While the button is depressed, insert the wire into the electric wire connection hole.
2
3
Page 94

88
3.8 Using D/A Output
3.8 Using D/A Output
The PW3336-02, PW3336-03, PW3337-02, and PW3337-03 generate voltage output in response to input
from the D/A OUTPUT terminals.
Analog (level) output
Converts the instrument’s measured values into signal levels and outputs them as a DC voltage. The output
voltage is updated in response to display updates (data updates). It is possible to record fluctuations over
extended periods of time by combining this functionality with a data logger or recorder.
Waveform output
Samples the voltage and current input to the instrument at approximately 87.5 kHz, performs D/A conversion,
and outputs them as an instantaneous voltage waveform, instantaneous current waveform, and instantaneous power waveform. It is possible to observe equipment rush current and instantaneous power waveforms
by combining this functionality with an oscilloscope or other instrument.
High-speed active power level output
Calculates the active power every cycle for the voltage or current set as the synchronization source, converts
the resulting values to signal levels, and outputs them as a DC voltage. It is possible to observe power consumption and other properties for abruptly fluctuating loads one wave at a time by combining this functionality
with a recorder or other instrument.
When the frequency of input to the set synchronization source is less than 5 Hz, the output update rate for
analog output and high-speed active power level output varies with the frequency of the input to the synchronization source.
Example: If the frequency of input to the synchronization source is 0.8 Hz, the output update rate will be
1/0.8 = 1.25 sec.
Page 95

3.8 Using D/A Output
Output
terminal
The output impedance of each output terminal is approximately 100 Ω. When connecting a recorder, DMM, or other
instrument, use a device with high input impedance (1 MΩ or
greater).
Output terminals and description of output
Terminal name Description
U1/u1 CH1 voltage level output / instantaneous voltage waveform output (selected with settings)
U2/u2 CH2 voltage level output / instantaneous voltage waveform output (selected with settings)
U3/u3 CH3 voltage level output / instantaneous voltage waveform output (selected with settings)
I1/i1 CH1 current level output / instantaneous current waveform output (selected with settings)
I2/i2 CH2 current level output / instantaneous current waveform output (selected with settings)
I3/i3 CH3 current level output / instantaneous current waveform output (selected with settings)
P1/p1 CH1 active power level output / instantaneous power waveform output (selected with settings)
P2/p2 CH2 active power level output / instantaneous power waveform output (selected with settings)
P3/p3 CH3 active power level output / instantaneous power waveform output (selected with settings)
Psum/Hi-Psum Active power sum level output / high-speed active power sum level output (selected with settings)
DA1 Level output for selected parameter
DA2 Level output for selected parameter
DA3 Level output for selected parameter
Hi-P1 CH1 high-speed active power level output (fixed output)
Hi-P2 CH2 high-speed active power level output (fixed output)
Hi-P3 CH3 high-speed active power level output (fixed output)
GND GND
89
Output circuits
A maximum voltage of approximately ±12 V may be output from D/A output terminals.
Page 96

90
Wires
Recommended cablesSingle strand diameter:φ 0.65 mm (AWG22)
Multi-strand: 0.32 mm
2
(AWG22)
Strand diameter: At least φ0.12 mm or greater
Usable cables Single strand diameter: φ0.32 mm to φ0.65 mm (AWG28 to AWG22)
Multi-strand: 0.08 mm
2
to 0.32 mm2 (AWG28 to AWG22)
Strand diameter: At least φ0.12 mm or greater
Standard insulation stripping length : 9 mm
Flathead screwdriver
Shaft diameter:φ 3 mm
tip width: 2.6 mm
3
2
1
Release the button.
The electric wire is locked in place.
To remove the wire:
Hold the button while pulling the wire out.
3.8 Using D/A Output
Required item:
Connect wires to the terminals for the measured value you wish to output. Connect the instrument’s GND terminal to the GND terminal of the data logger, recorder, or other output device.
Connecting wires to D/A output terminals
Before connecting wires to the terminals, see Before Connecting (p.7).
• To avoid damaging the instrument, do not input voltage to the output terminals or short the
terminals.
• To avoid an electrical accident, use the specified wire type.
Connect wires to the terminals for the measured value you wish to output. Connect the instrument’s GND terminal to the GND terminal of the data logger, recorder, or other output device.
Press down on the terminal button using a tool, such as a flat head screwdriver.
1
While the button is depressed, insert the wire into the electric wire connection hole.
2
3
After connecting the wires, voltage output will be generated when power is connected
4
to the measurement line.
Page 97

91
3.8 Using D/A Output
3.8.1 Analog Level Output, Waveform Output, and High-speed Active Power Level Output
The instrument provides dedicated terminals for analog level output/waveform output for voltage, current, and
active power as well as active power sum level output/high-speed active power sum level output.
There are also terminals for high-speed active power level output (fixed output) for each channel as well as
active power sum level output and high-speed active power sum level output.
Terminals can be switched between analog output and waveform output and between active power sum level
output and high-speed active power sum level output on the Settings screen. Additionally, the rectifier can be
set for analog output.
When output is set to Std. (analog output), the rectifier can be selected.
Output voltages
Level output, high-speed level output: ±2 V DC for ±100% of the range
Waveform output: 1 V f.s. for 100% of the range
Terminal Std. (level output) FASt (waveform output, high-speed output)
U1/u1 U1 CH1 voltage u1 CH1 instantaneous voltage waveform
U2/u2 U2 CH2 voltage u2 CH2 instantaneous voltage waveform
U3/u3 U3 CH3 voltage u3 CH3 instantaneous voltage waveform
I1/i1 I1 CH1 current i1 CH1 instantaneous current waveform
I2/i2 I2 CH2 current i2 CH2 instantaneous current waveform
I3/i3 I3 CH3 current i3 CH3 instantaneous current waveform
P1/p1 P1 CH1 active power p1 CH1 instantaneous power waveform
P2/p2 P2 CH2 active power p2 CH2 instantaneous power waveform
P3/p3 P3 CH3 active power p3 CH3 instantaneous power waveform
Psum/Hi-Psum Psum active power sum HiPsum high-speed active power sum
Hi-P1 CH1 high-speed active power (fixed) -
Hi-P2 CH2 high-speed active power (fixed) -
Hi-P3 CH3 high-speed active power (fixed) -
Page 98

92
1 Press .
2 Press to display the settings
screen shown to the left.
3 Press or to change the out-
put method.
Std.: Standard output (analog output)
FASt: Fast output (waveform output)
4 Press to exit the settings.
The instrument will return to the normal measurement state.
3.8 Using D/A Output
Switching between analog output and waveform output
Page 99

Setting the rectifier for analog output
1 Press .
2 Press to display the settings
screen shown to the left.
3 Press or to select Std.
4 Press or to select the channel
for which you wish to set the rectifier.
Settings: U1 → 2 → 3 → I1 → 2 → 3 → P1 → 2
→ 3 → 0…
(U: voltage; I: current; P: power; 1, 2, 3: channel number; 0: sum)
5 Press or to set the rectifier.
The rectifier lamp will light up to reflect the setting location.
Settings: AC+DC → AC+DC Umn → DC →
AC → FND…
6 Press to exit the settings.
The instrument will return to the normal measurement state.
93
3.8 Using D/A Output
Page 100

94
3.8 Using D/A Output
• The rectifier cannot be changed when using the FASt setting (waveform output). (The cursor cannot be
moved.)
• Output of 0 V will be generated for channels without data, if a rectifier is selected, or if a change in the settings causes the measured value to be shown as invalid data [- - - - -].
• Never supply input to an output terminal. Doing so may damage the instrument.
Active power high-speed analog output terminals
The instrument’s Hi-P1, Hi-P2 and Hi-P3 terminals continuously output the active power level in 1-wave
units. These terminals can be used to observe variations in active power that track input.
 Loading...