

Hioki PW3198 Instruction Manual

Instruction Manual
PW3198
POWER QUALITY
ANALYZER
July 2012 Revised edition 2 PW3198A981-02 12-07H


Contents
Contents
i
1
Introduction ..................................................1
Confirming Package Contents....................2
Safety Notes..................................................4
Usage Notes..................................................6
Chapter 1 Overview 11
1.1 Product Overview ............................11
1.2 Features ............................................ 12
1.3 Measurement Flowchart ..................13
Starting and Stopping Recording .........14
Chapter 2 Names and Functions
of Parts
Basic Operations
& Screens 15
2.1 Names and Functions of Parts .......15
2.2 Basic Operations .............................19
2.3 Display Items and Screen Types ....20
Common Display Items........................ 20
Warning Indicators ...............................22
Screen Types.............................. ......... 23
3.7 Connecting the Clamp Sensors ......34
3.8 Turning the Power On and Off
(Setting the Default Language) .......36
Chapter 4 Configuring the
Instrument before
Measurement
(SYSTEM - SYSTEM
screen) and Wiring37
4.1 Warm-up and Zero-adjust
Operation ..........................................37
4.2 Setting the Clock ..............................38
4.3 Configuring the Connection Mode and
Clamp Sensors .................................39
Connection diagram ............................ 40
4.4 Setting the Vector Area
(Tolerance Level) ..............................45
4.5 Connecting to the Lines to be
Measured (Preparing for Current
Measurement) ...................................46
4.6 Verifying Correct Wiring
(Connection Check) .........................48
4.7 Quick setup .......................................50
2
3
4
5
Chapter 3 Measurement
Preparations 27
3.1 Preparation Flowchart .....................27
3.2 Initial Instrument Preparations .......28
Attaching input cable labels to the
voltage cords and clamp sensors ........28
Attaching the strap............................... 28
Bundle the voltage cord leads with the spi-
ral tubes............................................... 29
Installing the battery pack ....................30
3.3 Pre-Operation Inspection ................31
3.4 Connecting the AC Adapter ............32
3.5 Inserting (Removing) an SD Memory
Card ................................................... 32
3.6 Connecting the Voltage Cords .......34
4.8 Verifying Settings and Starting
Recording ..........................................53
4.9 Using the Instrument during a
Power Outage ...................................54
Chapter 5 Changing Settings
(as necessary) 55
5.1 Changing Measurement Conditions 55
5.2 Changing the Measurement Period 58
5.3 Changing the Recording Settings ..61
5.4 Changing Hardware Settings ..........64
5.5 Changing Event Settings .................66

ii
Contents
5.6 Initializing the Instrument
(System Reset) .................................73
5.7 Factory Settings ...............................74
Chapter 8 Checking Events
(EVENT screen) 119
8.1 Using the EVENT screen ............... 120
Chapter 6 Monitoring
Instantaneous Values
(VIEW Screen) 75
6.1 Using the VIEW screen ....................75
6.2 Displaying Instantaneous
Waveforms ........................................76
6.3 Displaying Phase Relationships
([VECTOR] Screen) ..........................80
6.4 Displaying Harmonics ......................83
Displaying harmonics as a bar graph.. 83
Displaying harmonics as a list ............. 86
6.5 Displaying Measured Values
Numerically (DMM Screen) ..............89
Chapter 7 Monitoring
Fluctuations in
Measured Values
(TIME PLOT
Screen) 91
8.2 Displaying the Event List .............. 121
8.3 Analyzing the Measurement Line
Status When Events Occur ........... 124
8.4 Analyzing Transient Waveforms .. 126
8.5 Viewing High-order Harmonic
Waveforms ..................................... 129
8.6 Checking Fluctuation Data ........... 132
Chapter 9 Data Saving and File
Operations
(SYSTEM-MEMORY
screen) 135
9.1 [MEMORY] Screen ......................... 135
9.2 Formatting SD Memory Cards ...... 138
9.3 Save Operation and File Structure 139
9.4 Saving, Display and Deleting
Measurement Data ......................... 141
9.5 Saving, Displaying, and Deleting
Screen Copies ................................ 144
7.1 Using the [TIMEPLOT] Screen ........93
7.2 Displaying Trends ............................94
7.3 Displaying detailed trends .............101
Displaying a detailed trend graph for
each TIMEPLOT interval.................. 101
7.4 Displaying Harmonic Trends .........107
7.5 Displaying Flicker Values in Graph
and List Form ..................................111
IEC flicker meters and V10 flicker
meters .............................................. 111
Displaying an IEC flicker fluctuation
graph .................................... ............. 111
Displaying an IEC flicker list.............. 114
Displaying a V10 flicker fluctuation
graph .................................... ............. 115
Displaying a V10 flicker list............. 118
9.6 Saving and Deleting Settings Files
(Settings Data) ...............................145
9.7 Loading Settings Files
(Settings Data) ...............................146
9.8 File and Folder Names .................. 146
Changing file and folder names ........ 146
Chapter 10 Analyzing Data
Using the Computer
Application
(9624-50) 147
10.1 Computer Application (9624-50) Capa-
bilities ............................................. 147
10.2 Downloading Data from the SD Memo-
ry Card ............................................ 148

Chapter 11 Connecting
External Devices149
11.1 Using the External Control
Terminal .......................................... 149
Connecting to the External Control
Terminal ..................................... ........150
Using the event input terminal
(EVENT IN) .......................................151
Using the event input terminal
(EVENT OUT) ............ ........................152
iii
Contents
13.8 GPS Time Synchronization
Function ..........................................197
13.9 Other Functions ..............................197
13.10Calculation Formula .......................198
13.11Clamp Sensors and Ranges ..........211
13.12Block Diagram ................................213
Chapter 14 Maintenance
and Service 215
13
14
3
Chapter 12 Operation with a
Computer 155
12.1 Downloading Measurement Data Using
the USB Interface ...........................156
12.2 Control and Measurement via Ethernet
("LAN") Interface ............................157
LAN Settings and Network Environment
Configuration ........... ... ... .... ... ... ... .... ... 158
Instrument Connection .......................160
12.3 Remote Control of the Instrument by
Internet Browser ............................162
Connecting to the Instrument .............162
Operating Procedure .........................163
12.4 Converting Binary Data to Text
Data .................................................164
Chapter 13 Specifications 165
13.1 Environmental Safety
Specifications ................................165
14.1 Cleaning ..........................................215
14.2 Trouble Shooting ............................216
14.3 Error Indication ...............................218
14.4 Disposing of the Instrument ..........221
Appendix A1
Appendix 1 Procedure for Investigating
Power Supply Quality ..........A1
Appendix 2 Explanation of Power Supply
Quality Parameters and
Events....................................A4
Appendix 3 Event Detection Methods ....A7
Appendix 4 Recording TIMEPLOT Data
and Event Waveforms........A14
Appendix 5 Detailed Explanation of IEC
Flicker and
Appendix 6 Making Effective Use of
Channel 4............................A21
Appendix 7 Terminology........................A24
V10 Flicker ....A18
4
5
6
7
8
9
10
13.2 General Specifications ..................165
13.3 Measurement Specifications ........169
13.4 Event Specifications ......................189
13.5 Operating Specifications ...............190
13.6 Measurement and Analysis
Function Specifications ................191
13.7 Configuration Function
Specifications ................................194
Index Index1
11
12
Appendix
Index

iv
Contents
Introduction
Introduction
Thank you for purchasing the HIOKI PW3198 Power Quality Analyzer. To obtain maximum performance from the product, please read this manual first, and keep it handy for future reference.
Clamp-on sensors (optional; see p.3) are required in order to input current to the instrument.
(Clamp-on sensors are called "clamp sensors" throughout this manual.) For more information,
see the instruction manual for the clamp sensors being used.
Registered trademarks
• Windows is a registered trademark of Microsoft Corporation in the United States and/or other countries.
• Sun, Sun Microsystems, Java, and any logos containing Sun or Java are trademarks or registered
trademarks of Sun Microsystems, Inc. in the United States and other countries.
• The SD logo is a trademark of SD-3C, LLC.
1
Symbols
Symbols in this manual
Indicates the prohibited action .
(p. )
*
[ ]
CURSOR
(Bold character)
Windows
Dialogue
Mouse action terminology
Click: Press and quickly release the left button of the mouse.
Indicates the location of reference information.
Indicates quick references for operation and remedies for troubleshooting.
Indicates that descriptive information is provided below.
Bold characters within the text indicate operating key labels.
Unless otherwise specified, "Windows" represents Windows 2000, Windows XP, Windows Vista,
or Windows 7.
Dialogue represents a Windows dialog box.
Accuracy
We define measurement tolerances in terms of f.s. (full scale), rdg. (reading) and dgt. (digit) values, with
the following meanings:
f.s.
(maximum display value
or scale length):
rdg.
(reading or displayed
value):
dgt.
(resolution):
The maximum displayable value or scale length. This is usually the name
of the currently selected range.
The value currently being measured and indicated on the measuring instrument.
The smallest displayable unit on a digital measuring instrument, i.e., the
input value that causes the digital display to show a "1" as the least-significant digit.
2
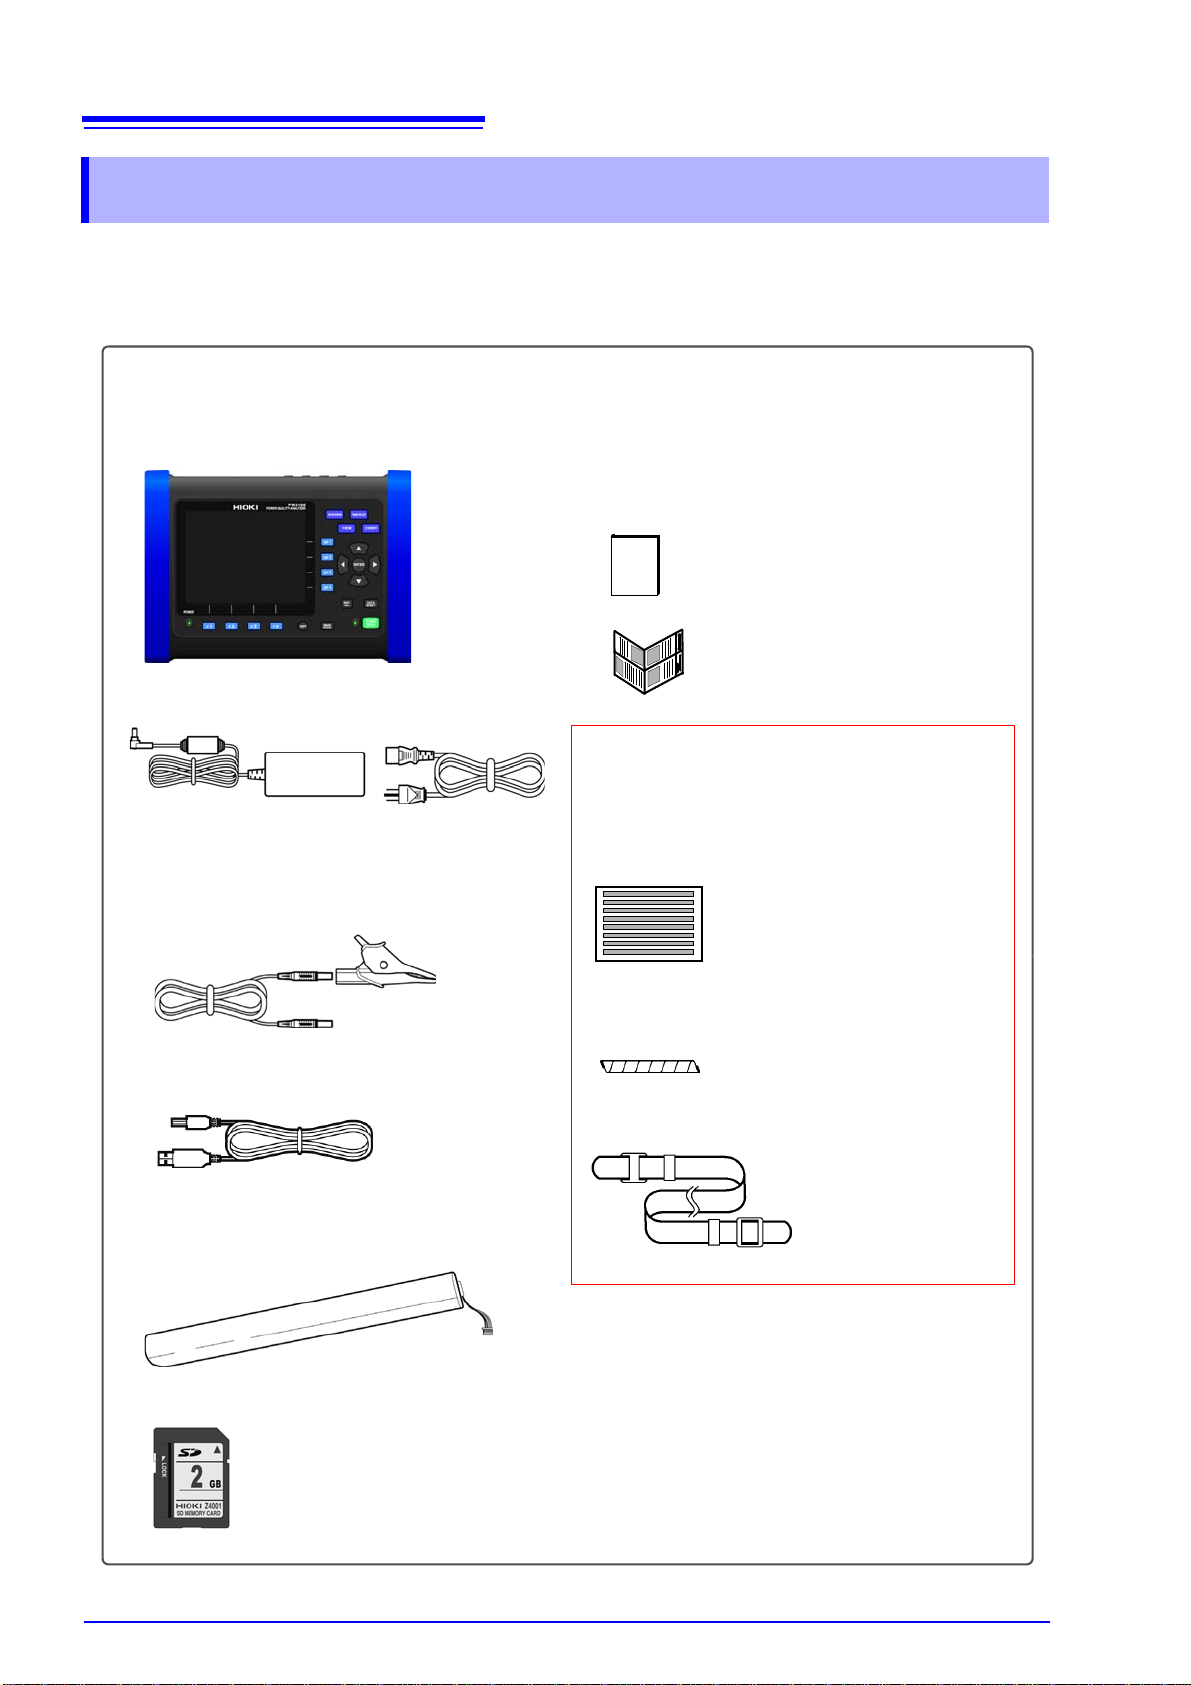
PW3198 Power Quality Analyzer....... 1
Confirm that these contents are provided.
Accessories
Instruction Manual... ... ... ... .... ... ... ... ... ...1
Measurement Guide............................1
Z1002 AC Adapter (includes power cord)1
L1000 Voltage Cord........ .... ... ... ... ... .... 1
(Cords: One each red, yellow, blue, and gray as well as
4 black; alligator clips: 1 each red, yellow, blue, and
gray as well as 4 black)
USB Cable.......................................... 1
Z1003 Battery Pack............................ 1
(Ni-MH, 7.2 V/4500 mAh)
Z4001 SD Memory Card 2GB............. 1
Input Cable Labels.............................. 1
(to identify voltage cable leads and input
channels)
Spiral Tubes........................................20
(to identify voltage cable leads and input
channels)
Strap...................................................1
(attach to instrument)
Please attach to the instrument before use.
(p.28)
Confirming Package Contents
Confirming Package Contents
When you receive the instrument, inspect it carefully to ensure that no damage occurred during
shipping. In particular, check the accessories, panel switches, and connectors. If damage is evident, or if it fails to operate according to the spe cifications, cont act your d ealer or Hioki rep resentative.

Options
Contact your dealer or Hioki representative for details.
3
Confirming Package Contents
Clamp sensors (current measurement)
9660 Clamp-On Sensor
(100 A rms rated)
9661 Clamp-On Sensor
( 500 A rms rated)
9667 Flexible Clamp-On Sensor
(5000 A rms/500 A rms rated)
9669 Clamp-On Sensor
(1000 A rms rated)
9694 Clamp-On Sensor
(5 A rms rated)
9695-02 Clamp-On Sensor
(50 A rms rated)
9695-03 Clamp-On Sensor
(100 A rms rated)
9290-10 Clamp-On Adapter
9219 Connection Cable
(For use with Model 9695-02/9695-03)
9657-10 Clamp-On Leak Sensor
(10 A rms rated)
9675 Clamp-On Leak Sensor
(10 A rms rated)
CT9691 Clamp on AC/DC Sensor
(100 A/10 A rated)+CT6590 Sensor Unit
CT9692 Clamp on AC/DC Sensor
(200 A/20 A rated)+CT6590 Sensor Unit
CT9693 Clamp on AC/DC Sensor
(2000 A/200 A rated)+CT6590 Sensor Unit
CT9667 Flexible Clamp on Sensor
(5000 A rms/500 A rms rated)
Carrying cases
C1001 Carrying Case (Soft type)
C1002 Carrygin Case (Hard type)
Recording media
Z4001 SD Memory Card 2GB
Communications
9642 LAN Cable
9624-50 PQA-HiView Pro
(Computer application software)
Other
Z1002 AC Adapter
Z1003 Battery Pack
PW9000 Wiring Adapter
(For use with 3-phase
3-wire (3P3W3M) voltages)
PW9001 Wiring Adapter
(For use with 3-phase 4-wire
voltages)
PW9005 GPS Box
(Build-to-order)
Voltage measurement
9804-01 Magnetic Adapter
9804-02 Magnetic Adapter
9243 Grabber Clip
L1000 Voltage Cord
4
Ni-MH
Safety Notes
Safety Notes
This manual contains information and warnings essential for safe operation of the product and
for maintaining it in safe operating condition. Before using the product, be sure to carefully read
the following safety notes.
This instrument is designed to comply with IEC 61010 Safety Standards, and has
been thoroughly tested for safety prior to shipment. However, mishandling during use could result in injury or death, as well as damage to the instrument. However, using the instrument in a way not described in this manual may negate the
provided safety features.
Be certain that you understand the instructions and precautions in the manual
before use. We disclaim any responsibility for accidents or injuries not resulting
directly from instrument defects.
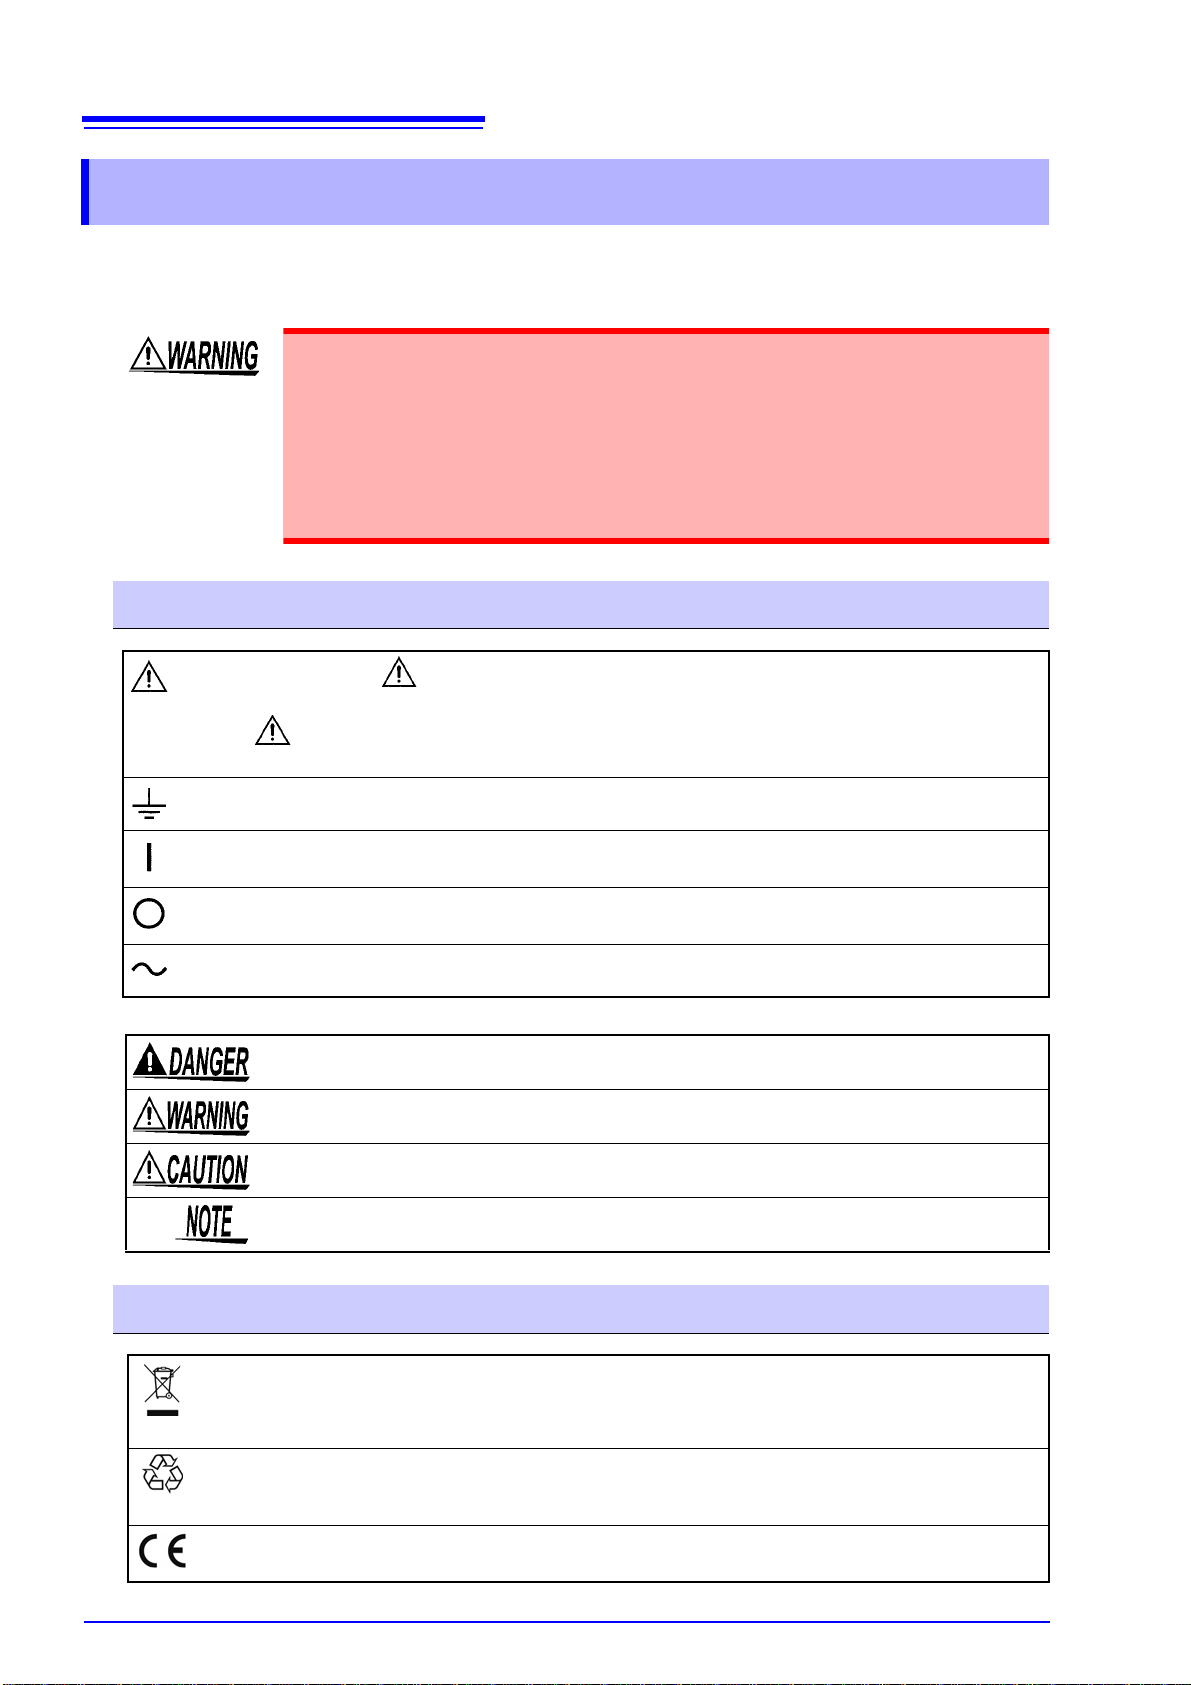
Safety Symbols
In the manual, the symbol indicates particularly important information that the user
should read before using the product.
The symbol printed on the product indicates that the user should refer to a corr esponding
topic in the manual (marked with the symbol) before using the relevant function.
Indicates a grounding terminal.
Indicates the ON side of the power switch.
Indicates the OFF side of the power switch.
Indicates AC (Alternating Current).
The following symbols in this manual indicate the relative importance of cautions and warnings.
Indicates that incorrect operation presents a significant hazard that coul d result in serious injury
or death to the user.
Indicates that incorrect operation presents a significant hazard that coul d result in serious injury
or death to the user.
Indicates that incorrect operation presents a possibility of injury to the user or damage to the
product.
Advisory items related to performance or correct operation of the product.
Symbols for Various Standards
WEEE marking:
This symbol indicates that the electrical and electronic appliance is put on the EU market after August
13, 2005, and producers of the Member States are required to display it on the appliance under Article
11.2 of Directive 2002/96/EC (WEEE).
This is a recycle mark established under the Resource Recycling Promotion Law (only for Japan).
This symbol indicates that the product conforms to safety regulations set out by the EC Directive.
5
Safety Notes
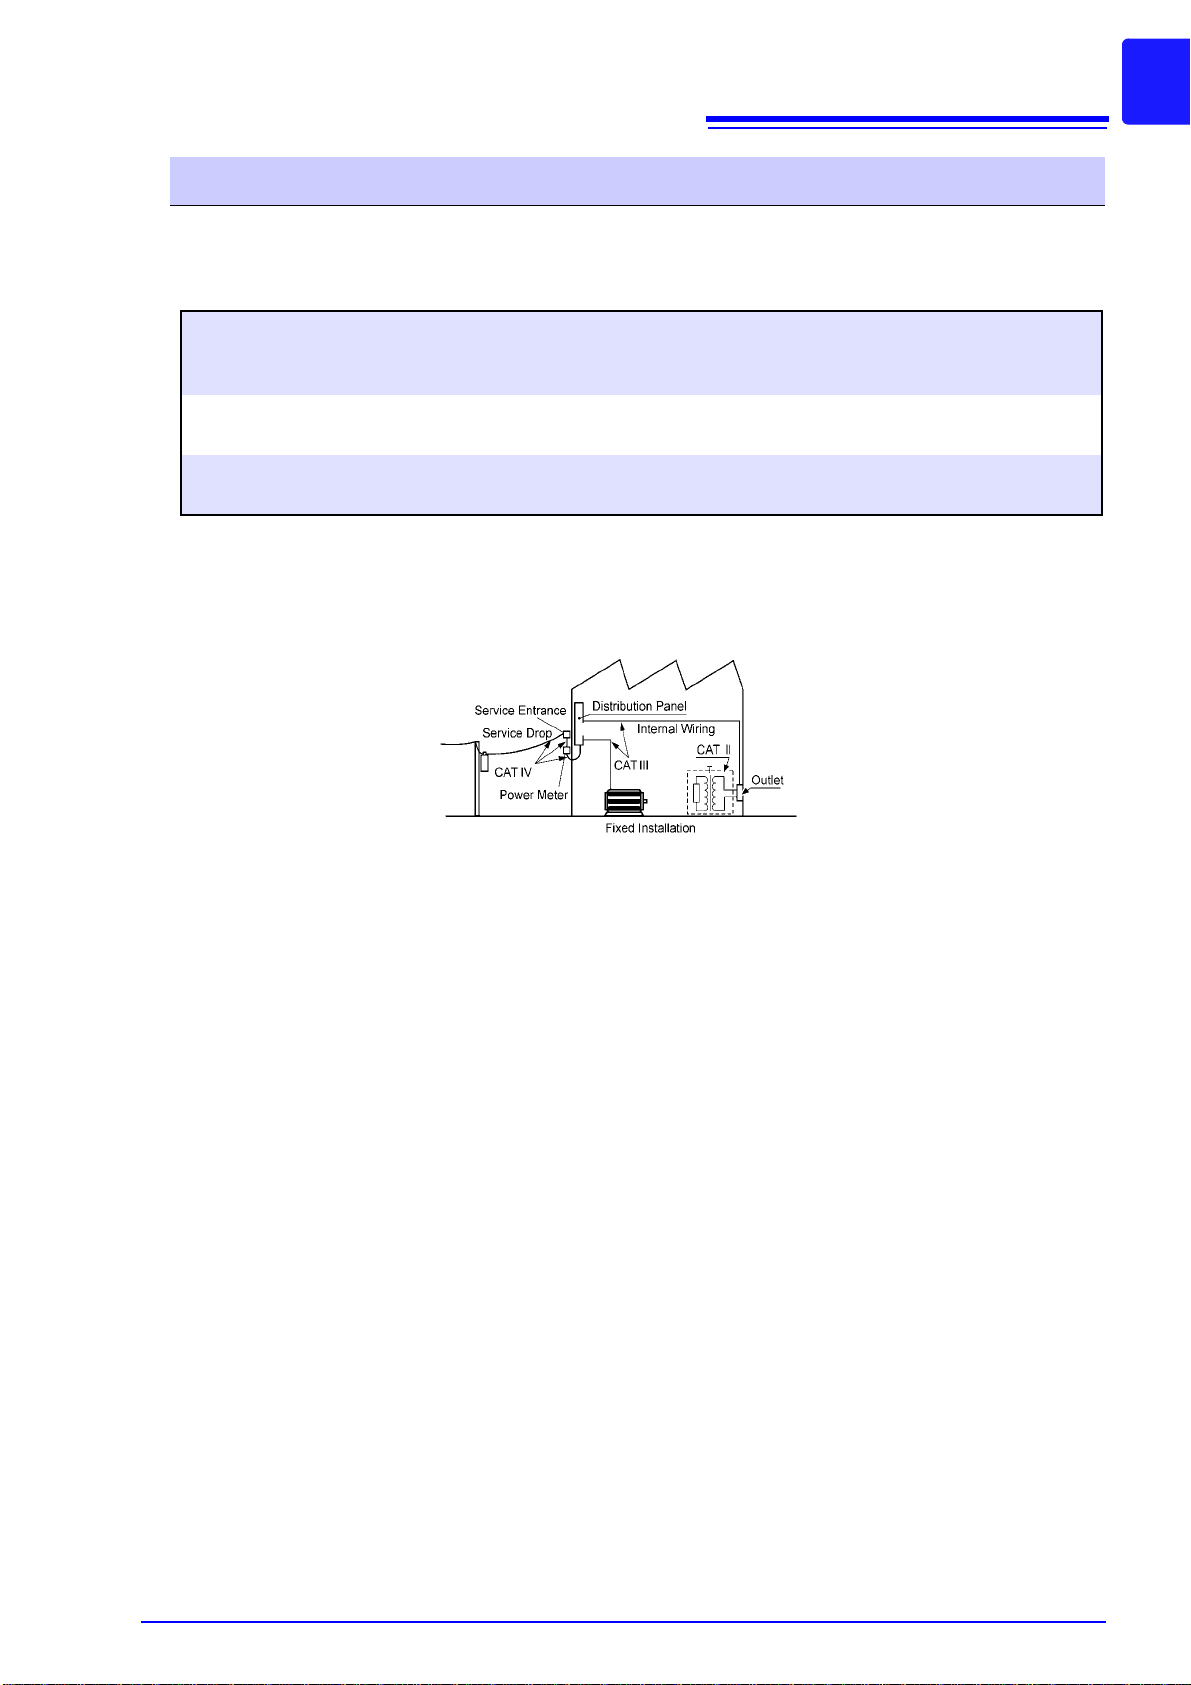
Measurement categories
This instrument complies with CAT IV (600 V) safety requirements.
To ensure safe operation of measurement instruments, IEC 61010 establishes safety standards for various electrical environments, categorized as CAT II to CAT IV, and called measurement categories.
CAT II: Primary electrical circuits in equipment connected to an AC electrical outlet by a power cord
(portable tools, household applianc es , etc .)
CAT II covers directly measuring electrical outlet receptacles.
CAT III: Primary electrical circuits of heavy equipment (fixed installations) connecte d directly to the
distribution panel, and feeders from the distribution panel to outlets.
CAT IV: The circuit from the service drop to the service entrance, and to the power meter and pri-
mary overcurrent protection device (distribution panel).
Using a measurement instrument in an environment designated with a higher-numbered category than
that for which the instrument is rated could result in a severe accident, and must be carefully avoided.
Use of a measurement instrument that is not CAT-rated in CAT II to CAT IV measurement applications
could result in a severe accident, and must be carefully avoided.
6
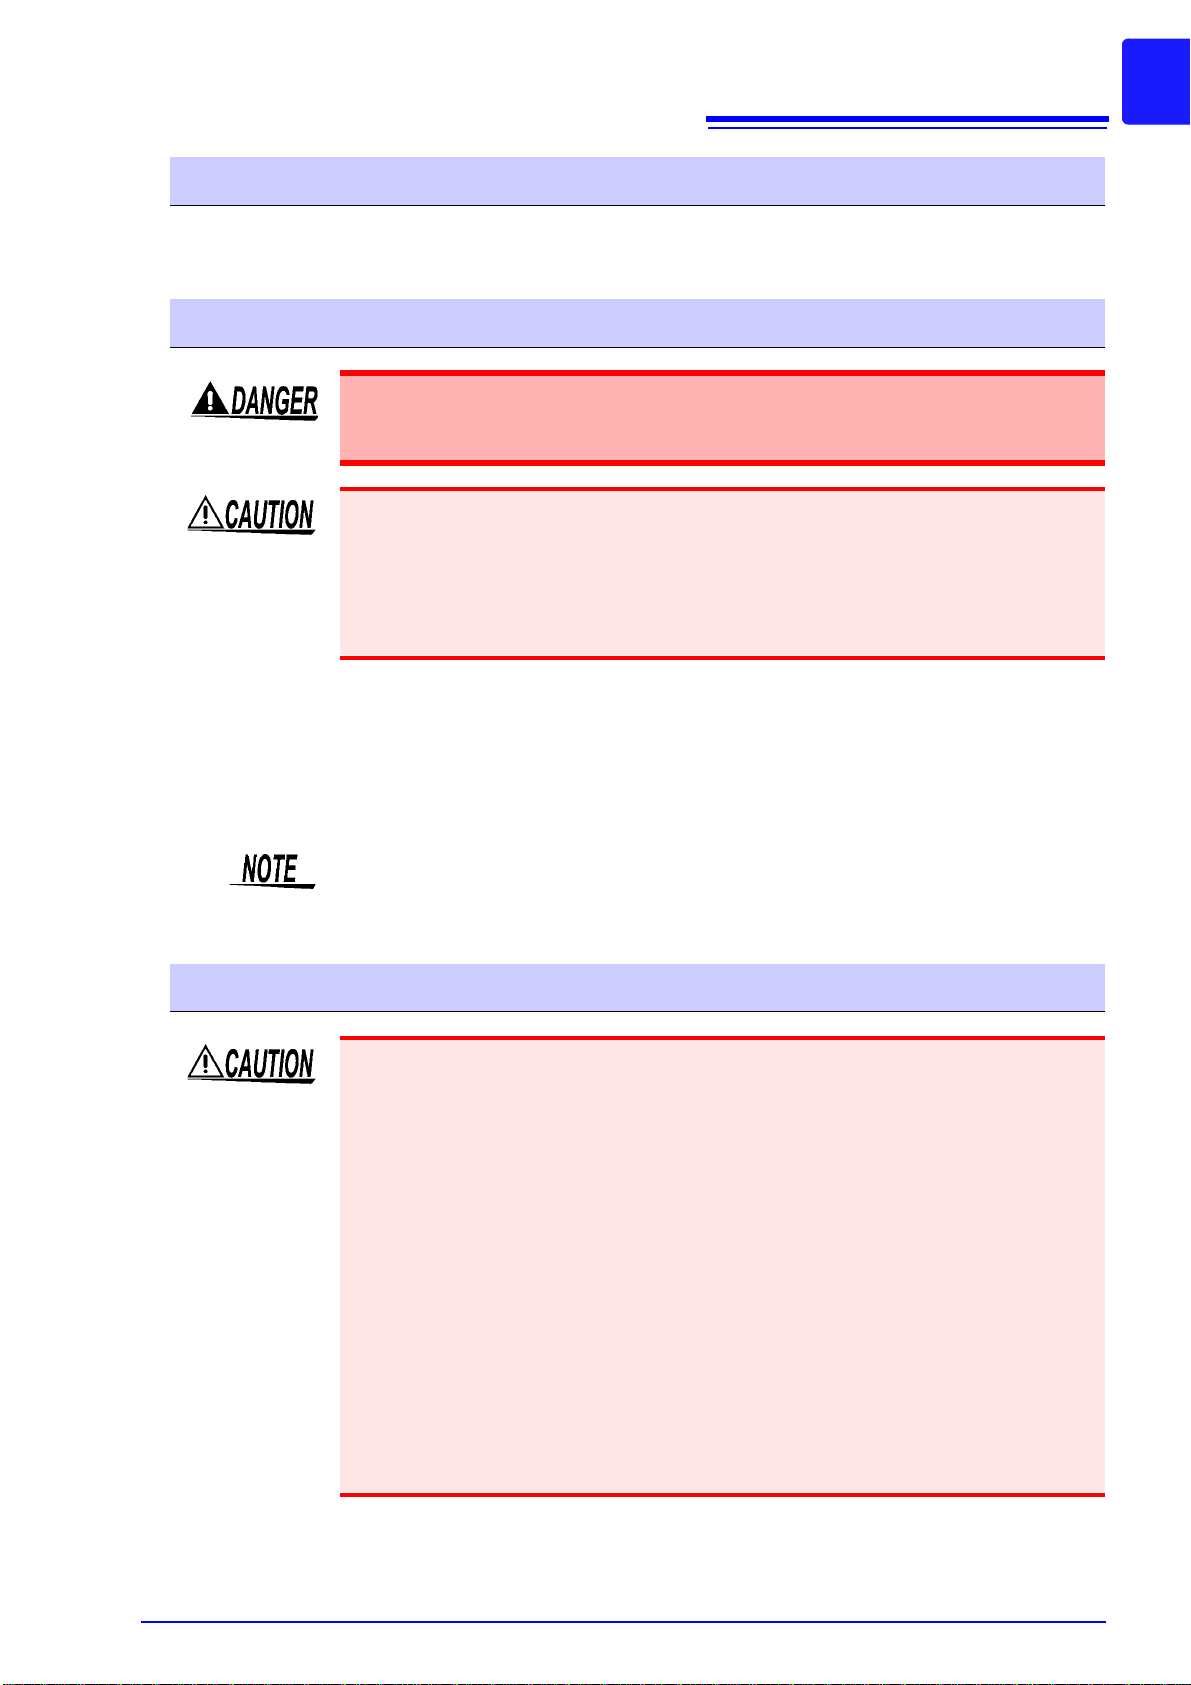
50 mm or more
Usage Notes
Usage Notes
Follow these precautions to ensure safe operation and to obtain the full benefits of the various
functions.
Before Use
Before using the instrument the first time, verify that it operates normally to ensure that the no damage
occurred during storage or shipping. If you find any damage, contact your dealer or Hioki representative.
Before using the instrument, make sure that the insulation on the voltage cords
is undamaged and that no bare conductors are improperly exposed. Using the
instrument in such conditions could cause an electric shock, so contact your
dealer or Hioki representative for replacements.
Instrument Installation
Operating temperature and humidity: 0 to 50°C, 80%RH or less, Indoors only (non-condensating)
Storing temperature and humidity: -20 to 50° C, 80 %RH or less, Indo o rs only (non-condensating)
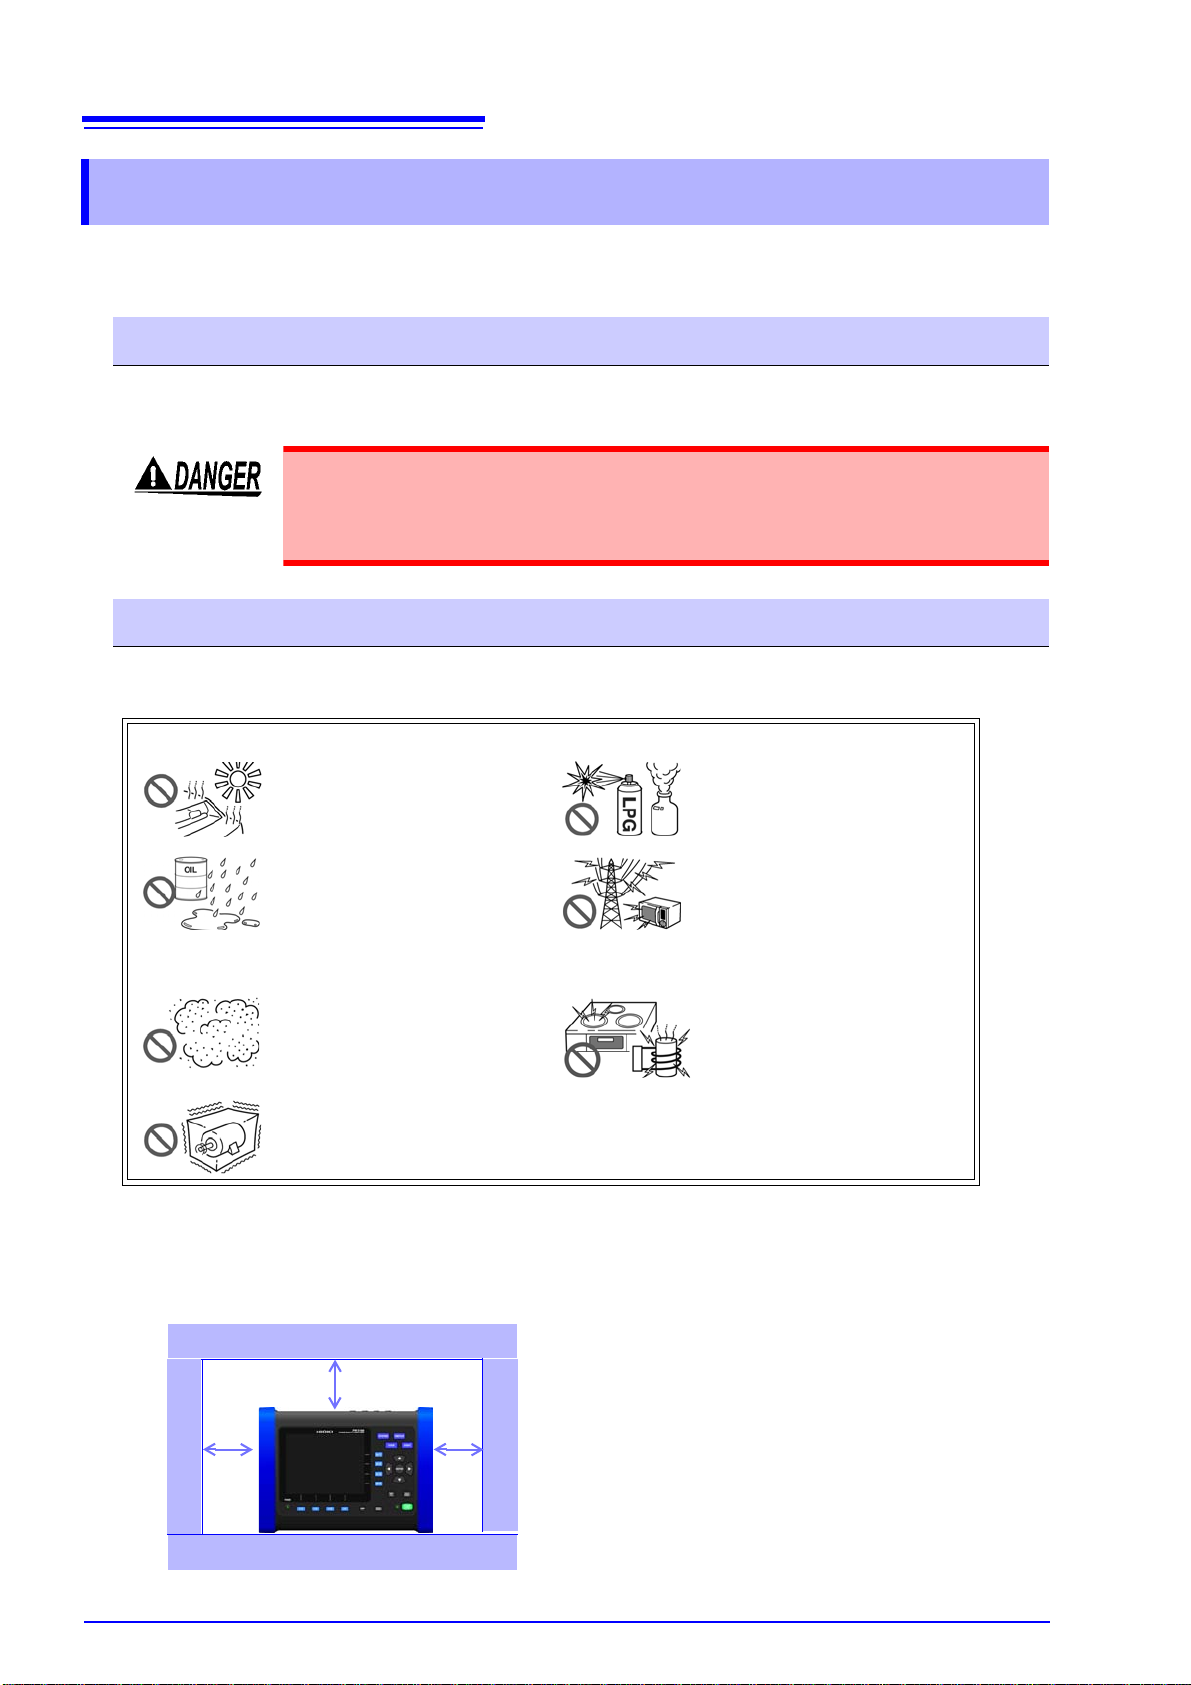
Avoid the following locations that co uld cause an accident or damage to the instrument.
Exposed to direct sunlight
Exposed to high temperature
Exposed to water, oil, other
chemicals, or solvents
Exposed to high humidity or
condensation
Exposed to high humidity or
condensation
Exposed to high levels of particulate dust
Subject to vibration
Installing
• The instrument should be operated only with the bottom or rear side down wards.
• Vents (on the left and right side of the instrument) must not be obstructed.
In the presence of corrosive or
explosive gases
Exposed to strong electromagnetic fields
Near electromagnetic radiators
Near induction heating systems
(e.g., high-frequency induction
heating systems and IH cooking utensils)
7
Usage Notes
Shipping precautions
Hioki disclaims responsibility for any direct or indirect damages that may occur when this instrument has
been combined with other devices by a systems integrator prior to sale, or when it is resold.
Handling the Instrument
To avoid electric shock, do not open the instrument's case. The internal components of the instrument carry high voltages and may become very hot during
operation.
• If the instr ument exhibits abnormal oper ation or display during use, review the information in "14.2 Trouble Shooting" (p.216) and "14.3 Error Indication" (p.218) before
contacting your dealer or Hioki representative.
• To avoid damage to the instrument, protect it from phys ical shock when tra nsporting
and handling. Be especially careful to avoid physical shock from dropping.
• The protection rating for the enclosure of this device (based on EN60529) is *IP30.
*IP30:
This indicates the degree of protection provided by the enclosure of the device against use in hazardous locations, entry of solid foreign objects, and the ingress of water.
3: Protected against access to hazardous parts with tools more than 2.5 mm in diameter. The
equipment inside the enclosure is protected against entry by solid foreign objects larger than
2.5 mm in diameter.
0: Not protected against use in hazardous locations. The enclosure does not protected against
entry by solid foreign objects.
This instrument may cause interference if used in residential areas. Such use must be
avoided unless the user takes special measures to reduce electromagnetic emissions
to prevent interference to the reception of radio and television broadcasts.
Handling the cords and clamp sensors
• To prevent damage to the instrument and clamp sensors, never connect or disconnect a sensor while the clamp sensor is clamped around a conductor.
• To avoid damaging the power cord, grasp the plug, not the cord, when unplugging it
from the power outlet.
• To avoid breaking the cables, do not bend or pull them.
• For safety reasons, when taking measurements, only use the L1000 Voltage Cord.
• Avoid stepping on or pinching cables, which could damage the cable insulation.
• Keep the cables well away from heat sources, as bare conductors could be exposed
if the insulation melts.
• When disconnecting the BNC connector, be sure to release the lock before pulling off
the connector. Forcibly pulling the connector without releasing the lock, or pulling on
the cable, can damage the connector.
• To avoid damaging the output cable, grasp the connector, not the cable, when
unplugging the cable.
• When disconnecting the clamp sensor from the instrument, be sure to grip the part of
the connector with the arrows and pull it straight out. Gripping the connector elsewhere or pulling with excessive force may damage the connector.
8
Usage Notes
• Use the 9217 Connection Cord (resin) when connecting to insulated BNC connector
(resin), and the 9165 Connection Cord (metal) when connecting to metallic BNC connector (metal). If you connect metal BNC cable to insulated BNC connector, the insulated BNC connector can be damaged and the connection equipment may be
damaged.
• Be careful to avoid dropping the clamp sensors or otherwise subjecting them to
mechanical shock, which could damage the mating surfaces of the core and
adversely affect measurement.
• Keep the clamp jaws and core slits free from foreign objects, which could interfere
with clamping action.
• Keep the clamp closed when not in use, to avoid accumulating dust or dirt on the
mating core surfaces, which could interfere with clamp performance.
Use only the specified voltage cords and inpu t cables. Usin g a non-sp ecified cable may
result in incorrect measurements due to poor connection or other reasons.
Before Connecting Measurement Cables
• To avoid electric shock, turn off the power to all devices before plugging or
unplugging any cables or peripherals.
• Be sure to connect the voltage input and current input terminals correctly. An
incorrect connection could damage or short circuit this instrument.
• In order to prevent electric shock or device damage, observe the following precautions when making connections to the external control terminals and other
interface connectors.
• Turn off the instrument and any equipment being connected before connecting
the measurement cables.
• Exercise care not to exceed the ratings of external control terminal and interface connector signals.
• Make connections securely to avoid the risk of connections coming loose during instrument operation and bringing wires into contact with other electrically
conductive parts.
• Ensure that devices and systems to be connected to the exte rnal control ter minals are properly isolated.
• To avoid electric shock and short-circuit accidents, use only the supplied voltage
cords to connect the instrument input terminals to the circuit to be tested.
Always turn both devices OFF when connecti ng and disconnecting an interfac e
connector.
About the AC adapter
• To avoid electrical accidents and to maintain the safety specifications of this
instrument, connect the power cord only to a 3-contact (two-conductor +
ground) outlet.
• Turn the instrument off bef ore connecting the AC adapter t o the instrument an d
to AC power.
• Use only the supplied Model Z1002 AC Adapter. AC adapter input voltage range
is 100 to 240 VAC (with ±10% stability) at 50/60 Hz. To avoid electrical hazards
and damage to the instrument, do not apply volt age outside of this range.
9
Usage Notes
About the battery pack
For battery operation, use only the HIOKI Model Z1003 Battery Pack. We do not
take any responsibility for accidents or damage related to the use of any other
batteries.
• The battery pack is subject to self-discharge. Be sure to charge the battery pack
before initial use. If the battery capacity remains very low after correct recharging , the
useful battery life is at an end.
• To avoid problems with battery operation, remove the batteries from the instrument if
it is to be stored several week or more.
Others
Avoid using an uninterruptible power supply (UPS) or DC/AC inverter with rectangular
wave or pseudo-sine-wave output to power the instrument. Doing so may damage the
instrument.
Before Connecting to the Lines to be Measured
• To avoid short circuit s a nd potentially life-thre atening hazards, never att ach the
clamp sensor to a circuit that operates at more than the maximum rated voltage to earth
(See your clamp sensor's instruction manual for its maximum ratings.)
• The maximum input voltage is 1000 VAC, ±600 VDC. Attempting to measure
voltage in excess of the maximum input could destroy the instrument and
result in personal injury or death.
• To avoid electrical hazards and damage to the ins trume nt , do not a pply voltage
exceeding the rated maximum to the input terminals.
• The maximum rated voltage between input terminals and ground is 600 VDC/
AC. Attempting to measure voltages exceeding 600 V with respect to ground
could damage the instrument and result in personal injury.
• Connect the clamp sensors or voltage cords to the instrument first, and then to
the active lines to be measured. Observe the following to avoid electric shock
and short circuits.
• Do not allow the voltage cord clips to touch two wires at the same time.
• Never touch the edge of the metal clips.
• When the clamp sensor is opened, do not allow the metal part of the clamp to
touch any exposed metal, or to short between two lines, and do not use over
bare conductors.
• When connecting a clip-type input cord, you will need to clip the line to the terminal while it is hot. Bringing two wires into contact with each other while connecting the clips will cause a short-circuit.
• To prevent electrical shock and personnel injury, do not touch any input terminals on the VT (PT), CT or the instrument when they are in operation.
10
Usage Notes
While Measuring
• To avoid electrical accidents, confirm that all connections are secure. The
increased resistance of loose connections can lead to overheating and fire.
• Ensure that the input does not exceed the maximum input volt age or cu rren t to
avoid instrument damage, short-circuiting and electric shock resulting from
heat building.
• To avoid electric shock when measuring live lines, wear appropriate protective
gear, such as insulated rubber gloves, boots and a safety helmet.
When the instrument's power is turned off, do not apply voltage to the instrument.
Doing so may damage the instrument.
If an abnormality such as smoke, strange sound or offensive smell occurs, stop
measuring immediately, disconnect from the measurement lines, turn off the
instrument, unplug the power cord from the outlet, and undo any changes to the
wiring. Contact your dealer or Hioki repr esen tative as soon as possible. Continuing to use the instrument may result in fire or electric shock.
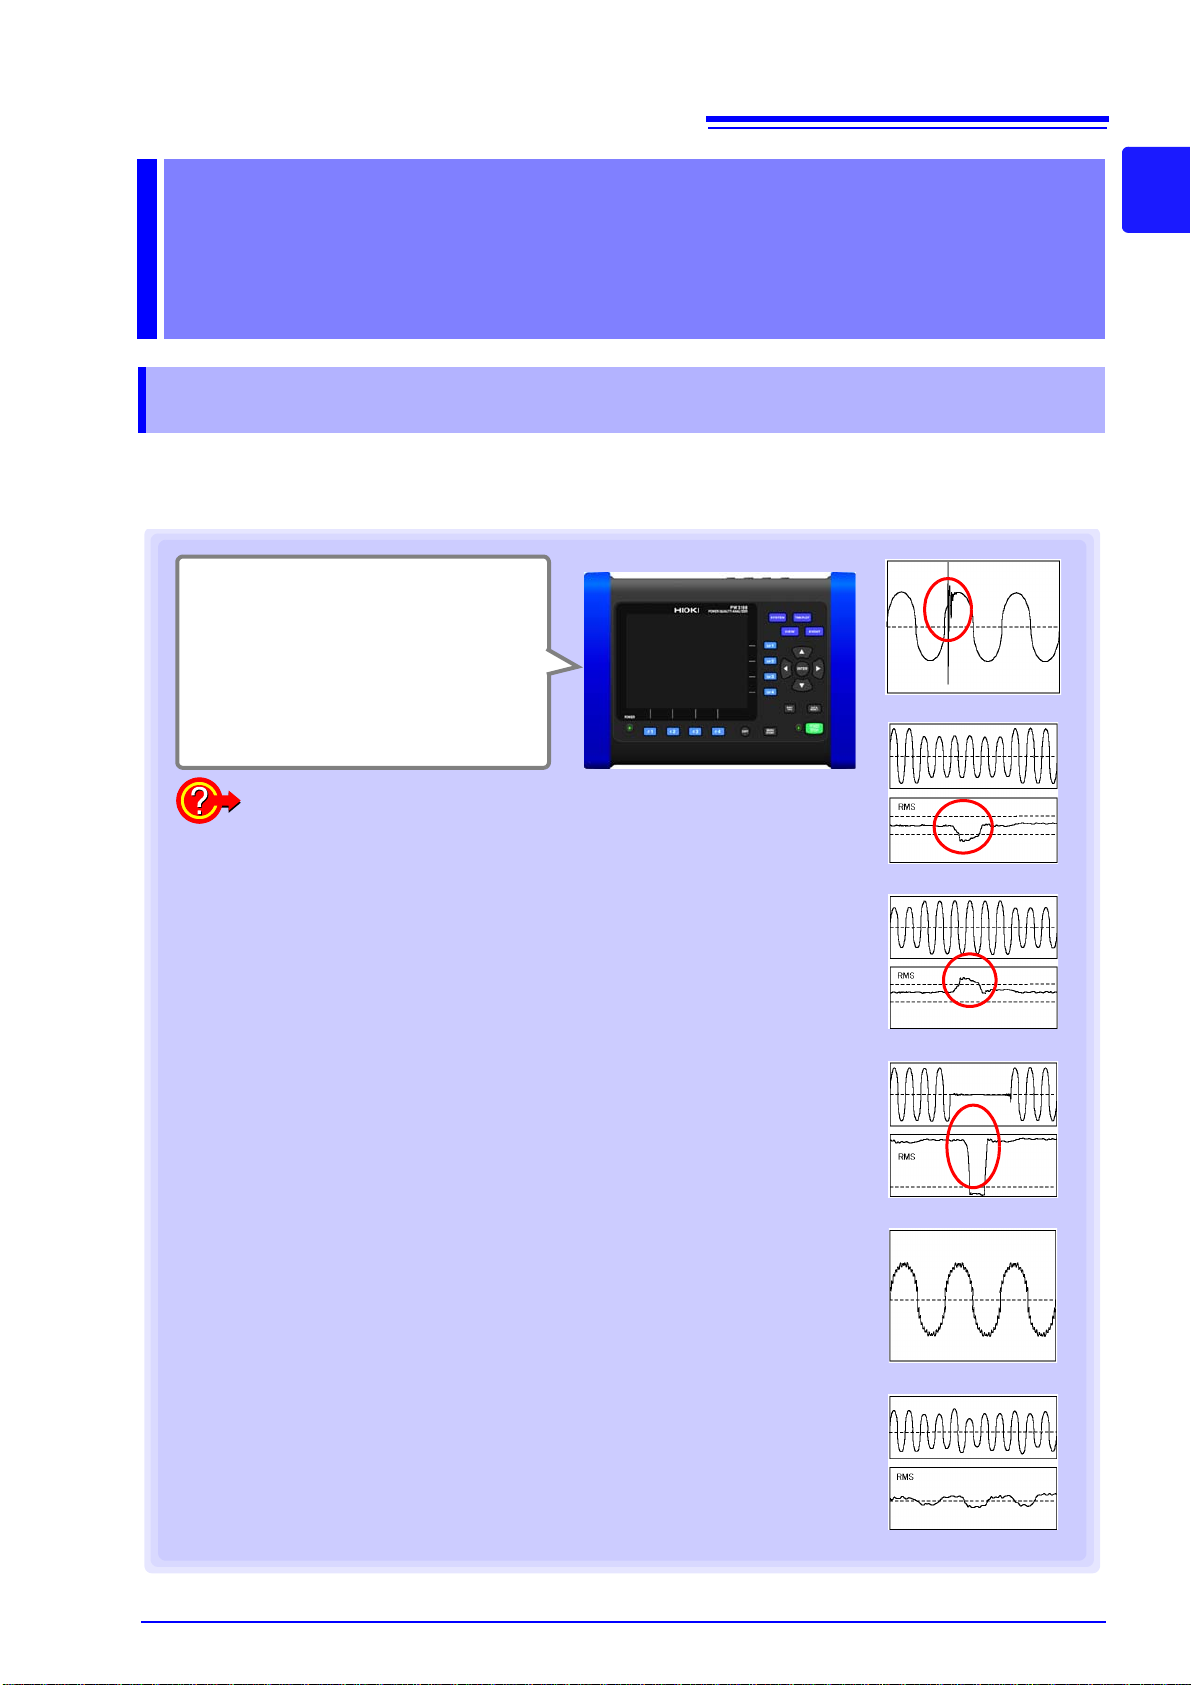
1.1 Product Overview
Record abnormal waveforms
Record voltage fluctuations
Observe power supply waveforms
Measure harmonics
Measure flicker
Measure power
One instrument does it all!
How does the PW3198 record abnormal waveforms?
The instrument automatically judges and records a range of problems:
Transient voltages
Transient voltages are caused by lightning strikes, circuit-breaker and relay
contact obstructions and tripping, and other phenomena. They are often characterized by precipitous voltage variations and a high peak voltage.
Flicker (V10, IEC)
Flicker is caused by blast furnace, arc welding, and thyristor control loads. The
resulting voltage fluctuations cause flicker in light bulbs and similar phenomena.
Voltage dips (falling voltage)
Short-lived voltage drops are caused by the occurrence of a inrush current with
a large load, such as when a motor starts.
Interruptions
In an interruption, the supply of power stops momentarily or for a short or long
period of time due to factors such as a circu it breaker tripping as a result of a
power company accident or power supply short-circuit.
Voltage swells (rising voltage)
In a voltage swell, the voltage rises momentarily due to a lightning strike or the
switching of a high-load power line.
Harmonic and high-order harmonic elements
Harmonics are caused by distortions in the voltage and current caused by the
semiconductor control devices that are frequently used in equipment power
supplies.
Transient voltages
Voltage dips
Voltage swells
Interruptions
Harmonic
Flicker
Overview Chapter 1
1.1 Product Overview
The PW3198 Power Quality Analyzer is an analytical instrument for monitoring and recording
power supply anomalies, allowing their causes to be quickly investigated. The instrument can
also be used to assess power supply problems (voltage drops, flicker, harmonics, etc.).
11
1
1
Chapter 1 Overview
12
Extensive selection
of clamp sensors
(Available rated for use with signals ranging from leak currents
to a maximum of 5,000 A.)
High precision
Voltage measurement
accuracy of ±0.1%rdg.
Complies with the new IEC610004-30 Class A international power
quality standard.
Safety
Cat IV 600 V compliant.
Capable of measuring lead-in
wires on their primary side.
Measurement of
transient voltages of
up to 6,000 V from
5 kHz to 700 kHz
SD memory card data storage
By allowing the PW3198 to record data continuously for up to one year, the ability to use highcapacity 2 GB memory cards inspires peace of
mind.
Easy downloading of data to a
computer via USB or LAN
Separately available software simplifies analysis.
Support for 400 Hz
lines
Simultaneous
3-channel measurement of V10 flicker
Ability to measure all
parameters
necessary for power
quality measurement
Measurement of
high-order harmonic
components from
2 kHz to 80 kHz
Reliable
Quick setup functionality
ensures you won't miss
the occurrence of any
abnormal phenomena.
Capable of accommodating 1-phase 2-wire, 1-phase 3-wire, 3-phase 3-wire,
and 3-phase 4-wire power supplies.
Features isolated channels for equipment analysis, neutral line ground fault
measurement, and measurement of power supply lines from separate systems.
Lets you select line voltage or phase voltage. Includes -Y conversion and Y-
conversion functionality.
Features a TFT color LCD that is easily visible in both bright and dark settings.
Capable of true simultaneous measurement with gap-less continuous operation, assuring your ability to reliably capture target phenomena.
Capable of accurately assessing the time at which phenomena occur. A GPS
option allows time correction.
Can be operated with peace of mind during an extended power outage thanks
to a generous battery drive time of 180 minutes.
1.2 Features
1.2 Features
13
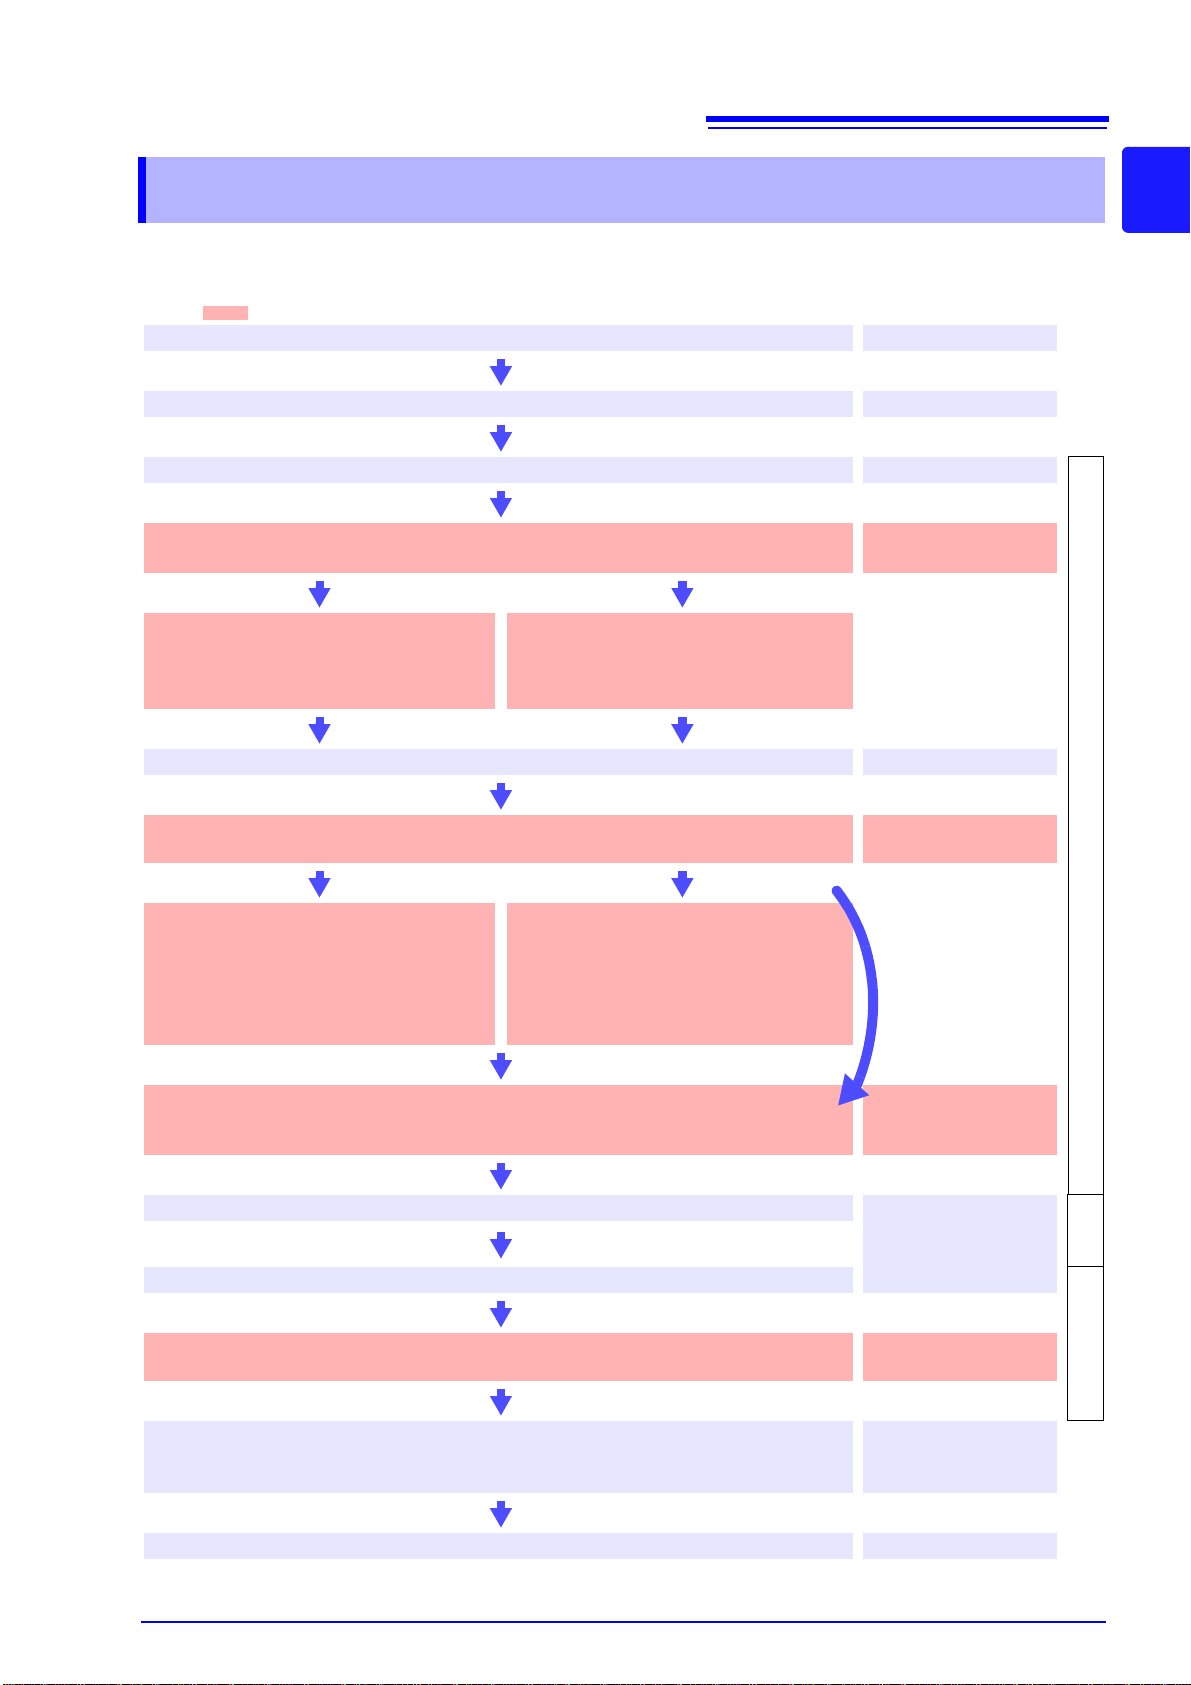
Note: shaded areas indicate settings configured on the instrument's screen.
Perform the pre-measurement inspection.
3.3 (p.31)
PW3198
operating state
Connect the AC adapter, voltage cords, and current clamps.
3.4 (p.32) to 3.7 (p.34)
Turn on th e in st rum en t.
3.8 (p.36)
[SETTING]
Perform zero adjustment after allowing the instrument to warm up for 30
minutes.
4.1 (p.37)
Configure initial settings.
Configure connection and clamp sensor
settings.
See: 4.3 (p.39)
Load a settings file (setting s data).
Load a settings file from the SD memory
card.
See: 9.7 (p.146)
Connect to the measurement line.
4.5 (p.46)
Verify connections.
Note: If waveforms, measured values, or vector diagrams appear incorrect, reconnect the lines.
4.6 (p.48)
9.7 (p.146)
Configure settings using quick
setup.
Select quick setup and configure the con-
nection, clamp sensor, VT and CT, and
TIMEPLOT interval settings.
See: 4.7 (p.50)
Configure the settings as desired.
Set thresholds and other values as desired.
Settings can be configured as desired even
after using quick setup functionality.
See: Chapter 5 (p.55)
Verify settings, event count, and memory capacity.
Note: If waveforms or settings appear incorrect, or if the event count is unusually high,
change the settings.
4.8 (p.53)
Start recording.
"Starting and Stopping
Recording" (p.14)
[RECOR
DING]
Stop recording.
[ANALYZING]
Check and analyze measurement data.
(Data can also be checked while recording is in progress.)
Chapter 6 (p.75) to
Chapter 8 (p.119)
Disconnect the voltage cords and clamp sensors from the measurement
line and turn off the instrument.
(The display data will be erased. It cannot be redisplayed.)
3.8 (p.36)
Analyze the data on a computer using the computer applica tion.
Chapter 12 (p.155)
See:
If you have loaded a
settings file
(settings data)
1.3 Measurement Flowchart
1.3 Measurement Flowchart
Be sure to read "Usage Notes" (p.6) before measuring.
Measurement is performed using the following process:
1
1
Chapter 1 Overview
14
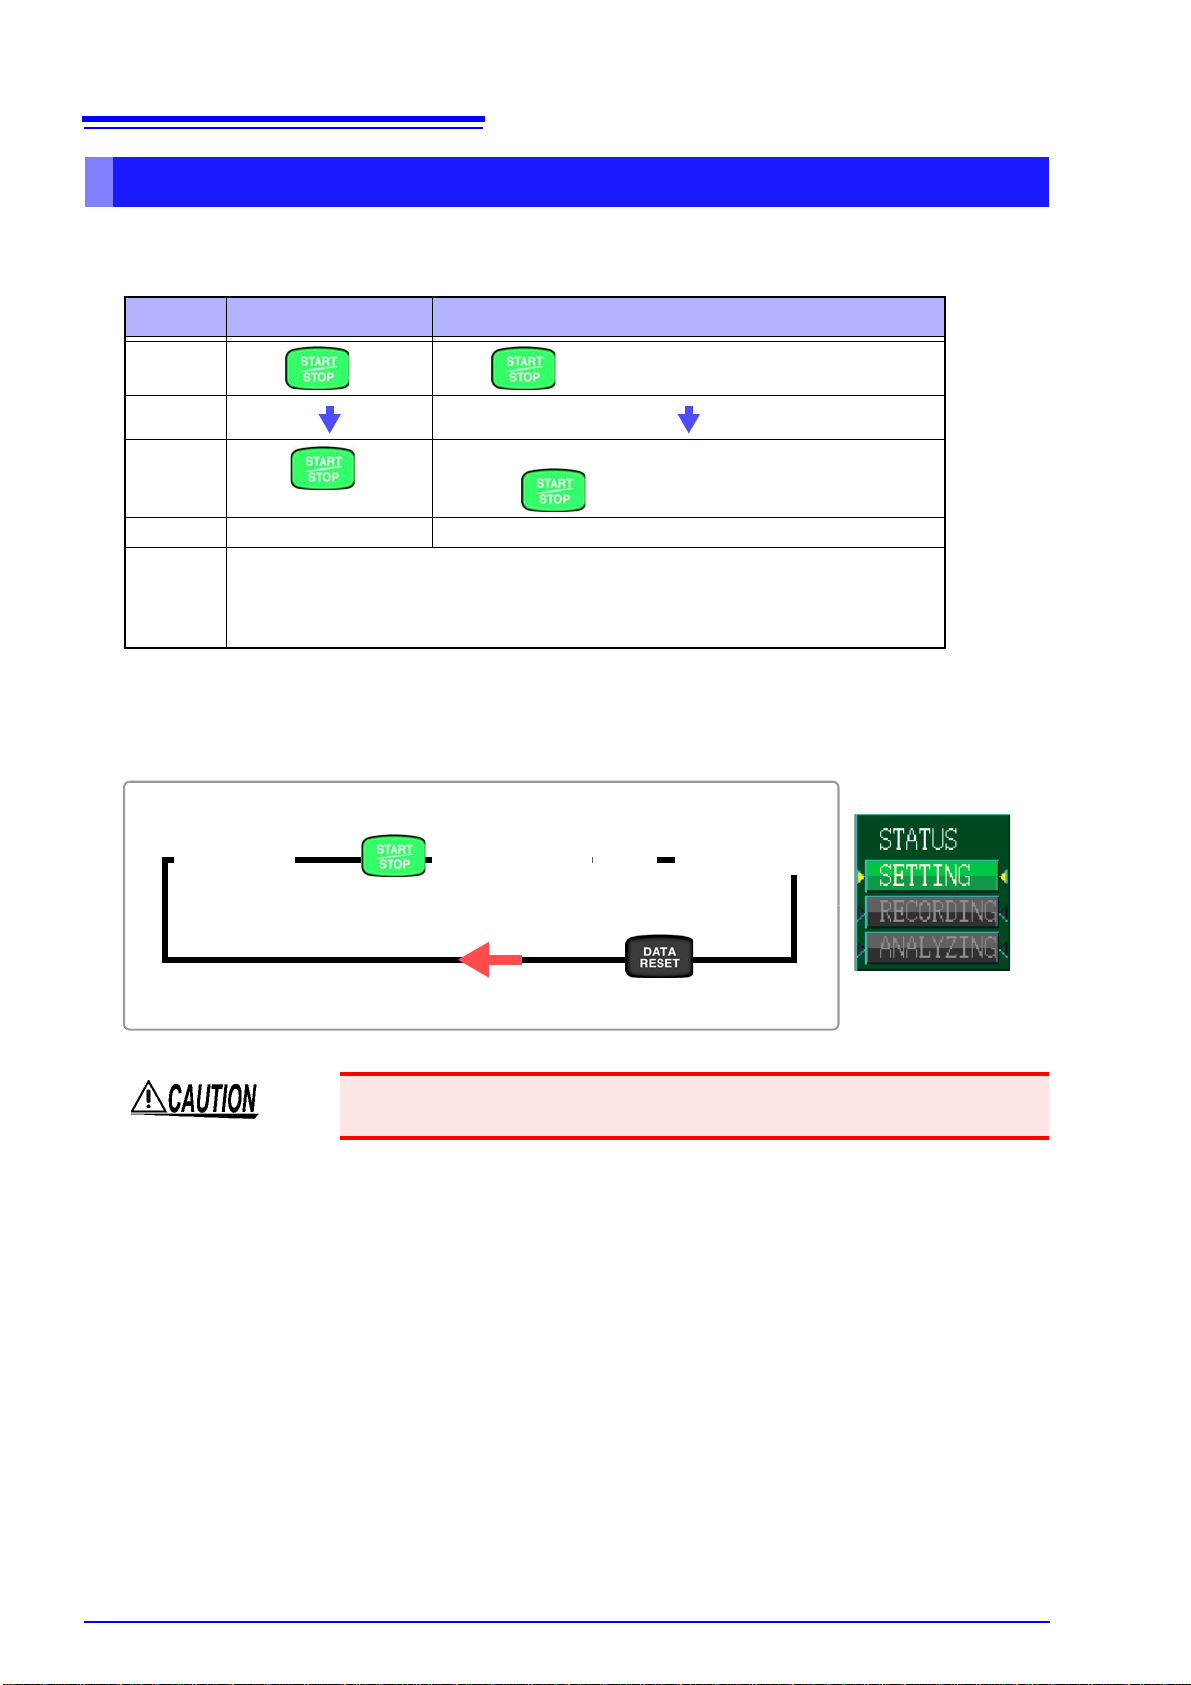
Relationship between the operation status and key operations
[SETTING] [RECORDING]
[ANALYZING]
Start
recording
Stop
recording
Revert to [SETTING] mode
Set
1.3 Measurement Flowchart
Starting and Stopping Recording
You can start and stop recording either manually or using real-time control. In either case, repeat recording can be used.
Manual Real-time control
Start
Stop
Notes See: "Time Start" (p.58)
Repeated
recording
Press . Press to start recording at the set time and date.
Press to stop
recording.
Recording is performed at the specified interval (once a week or once a day), and files
containing measurement data are created at the specified interval. Repeated recording
can be used to record for up to 55 weeks (approx. 1 year).
See: "Repeat Record" (p.59)
Stops automatically at the specified stop time.
Press the to force stop.
To start a new recording session after recording has ended, press the DATA RESET key, set the instru-
ment to [SETTING] mode, and then press the START/STOP key. (Note that pressing the DATA RESET
key will erase the displayed measurement data.)
Do not remove the SD memory card while recording or analyzing data. Doing so
may cause data on the card to be corrupted.
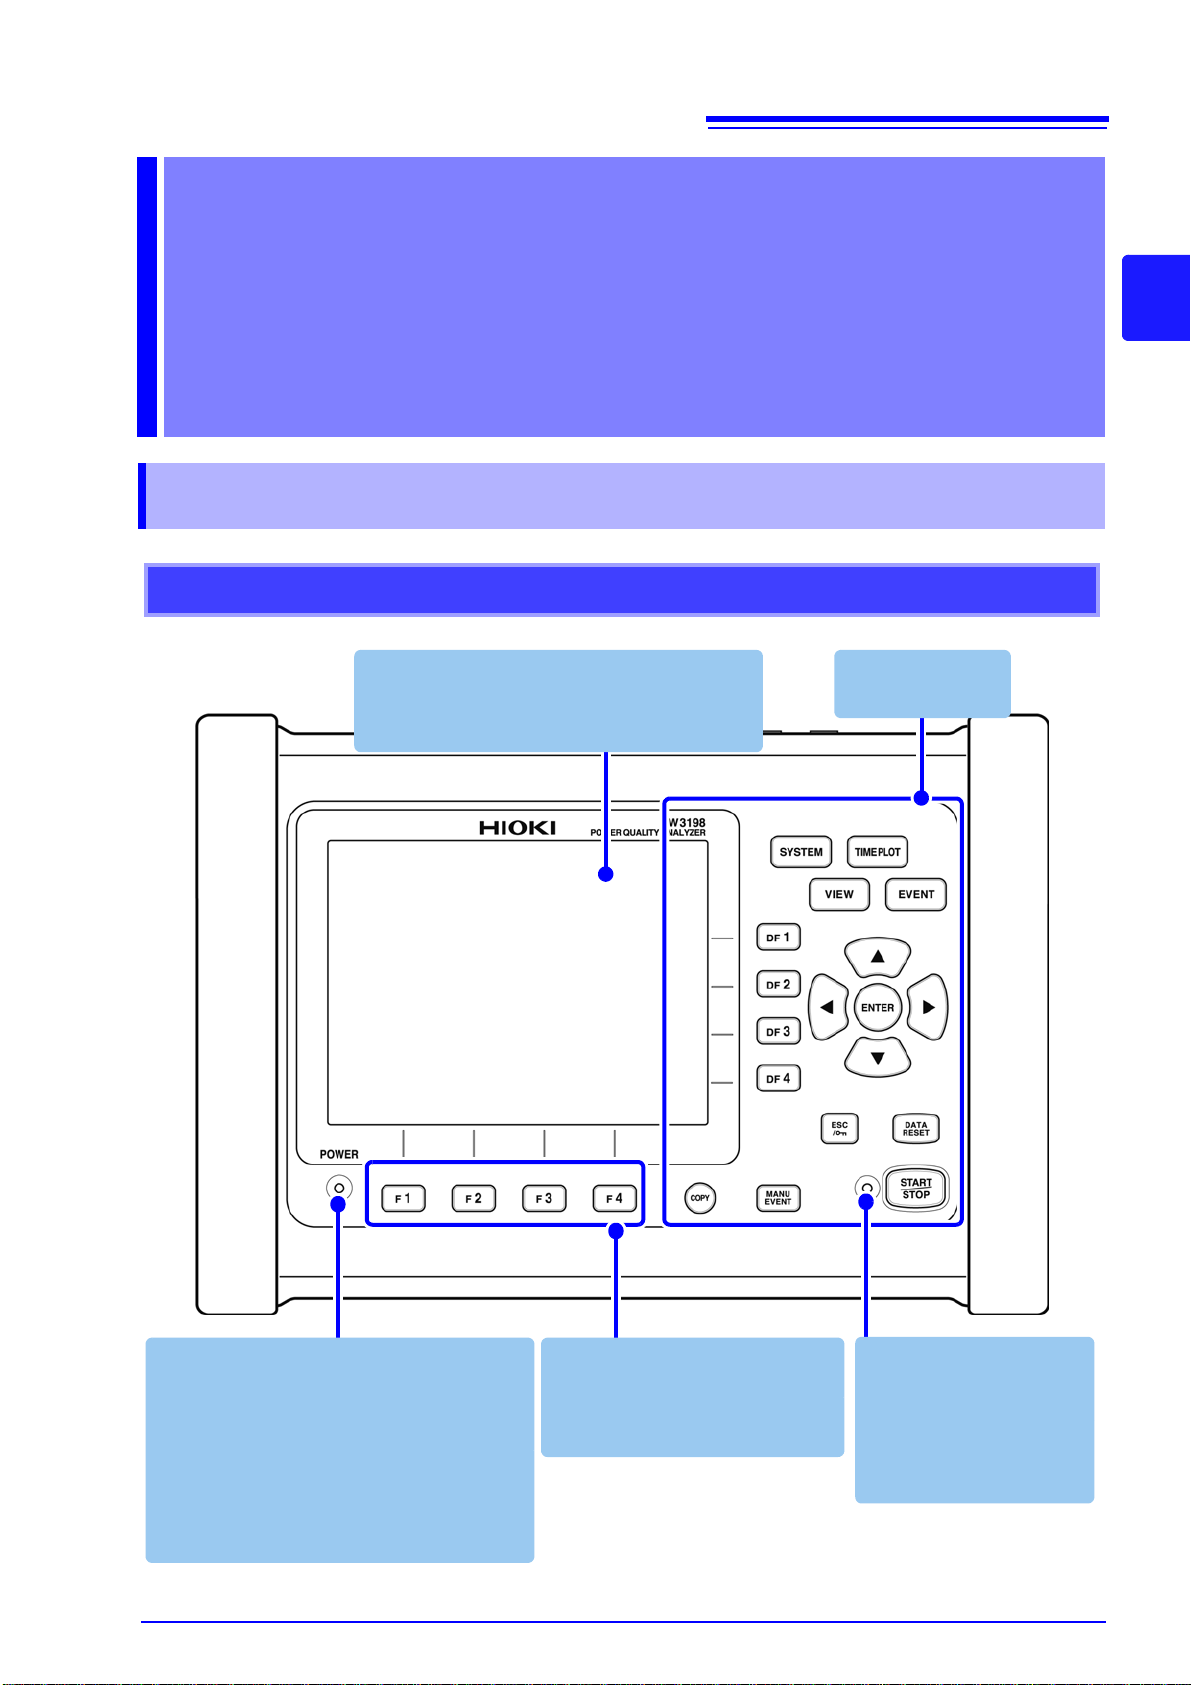
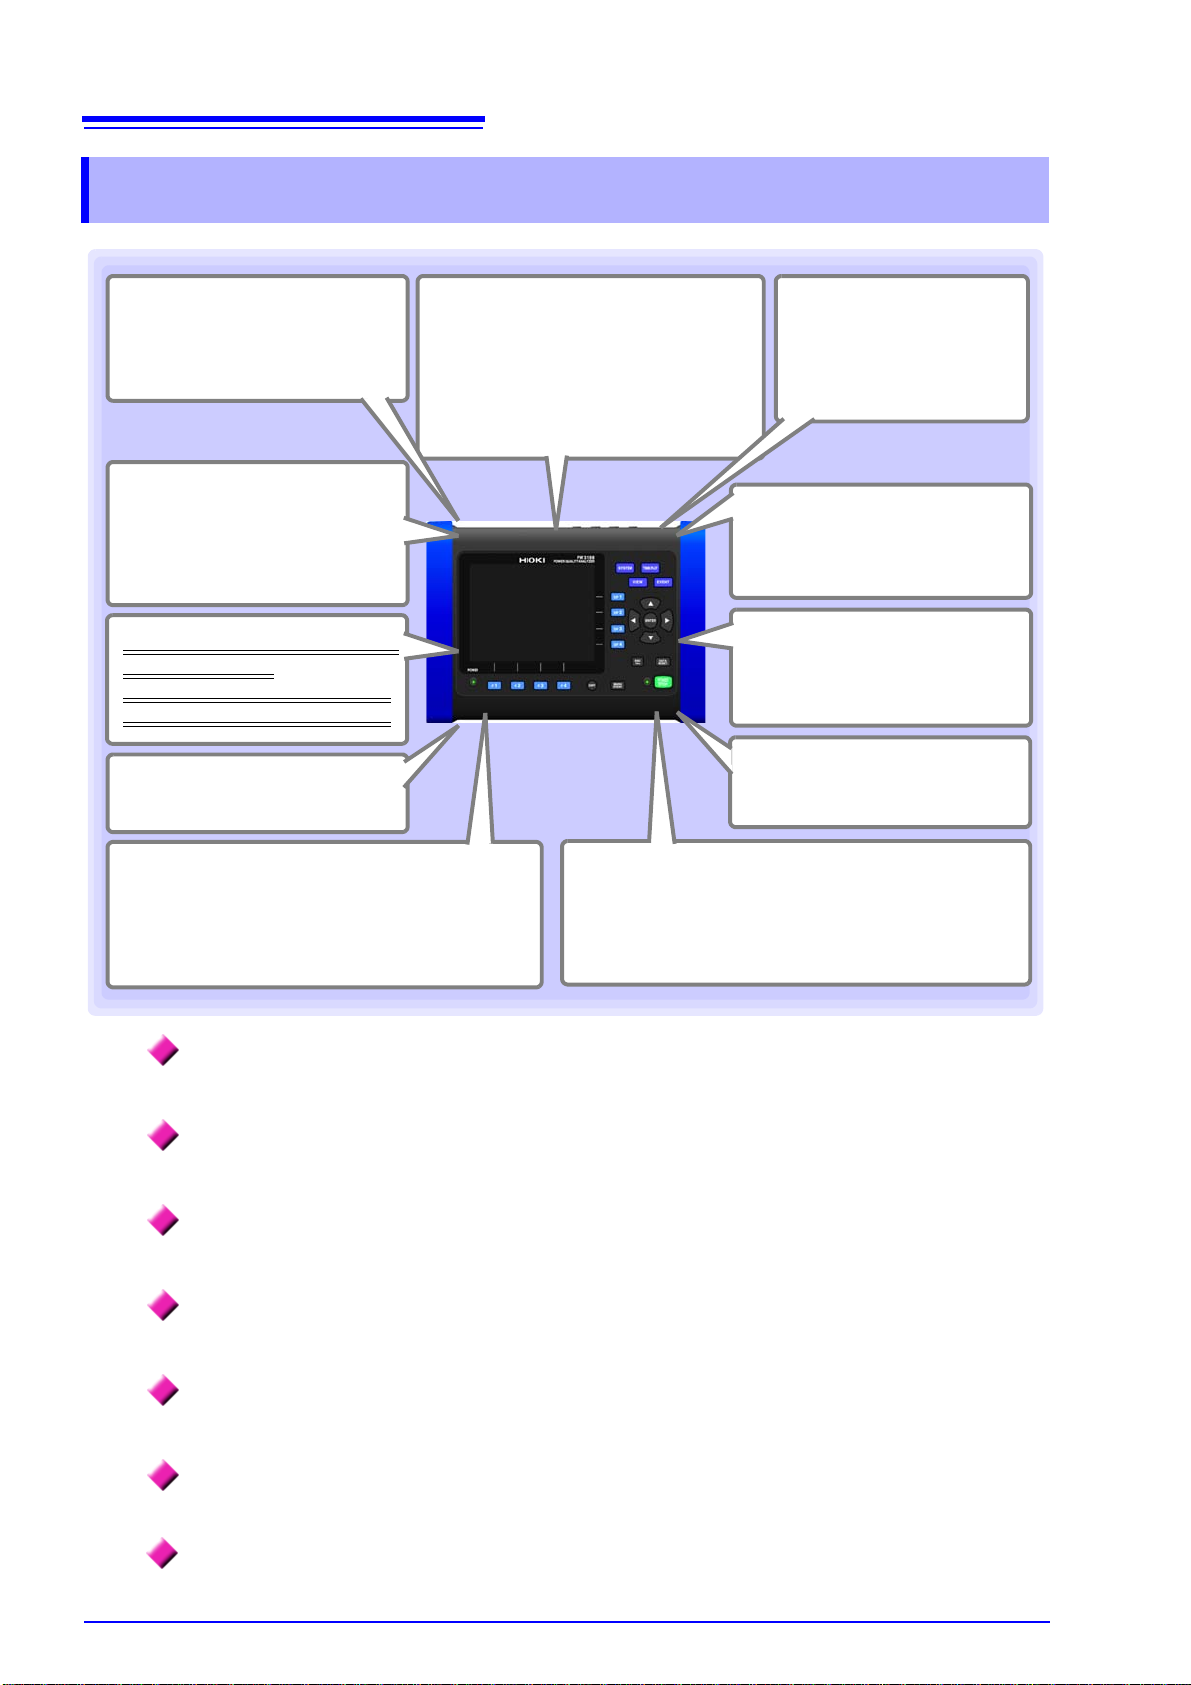
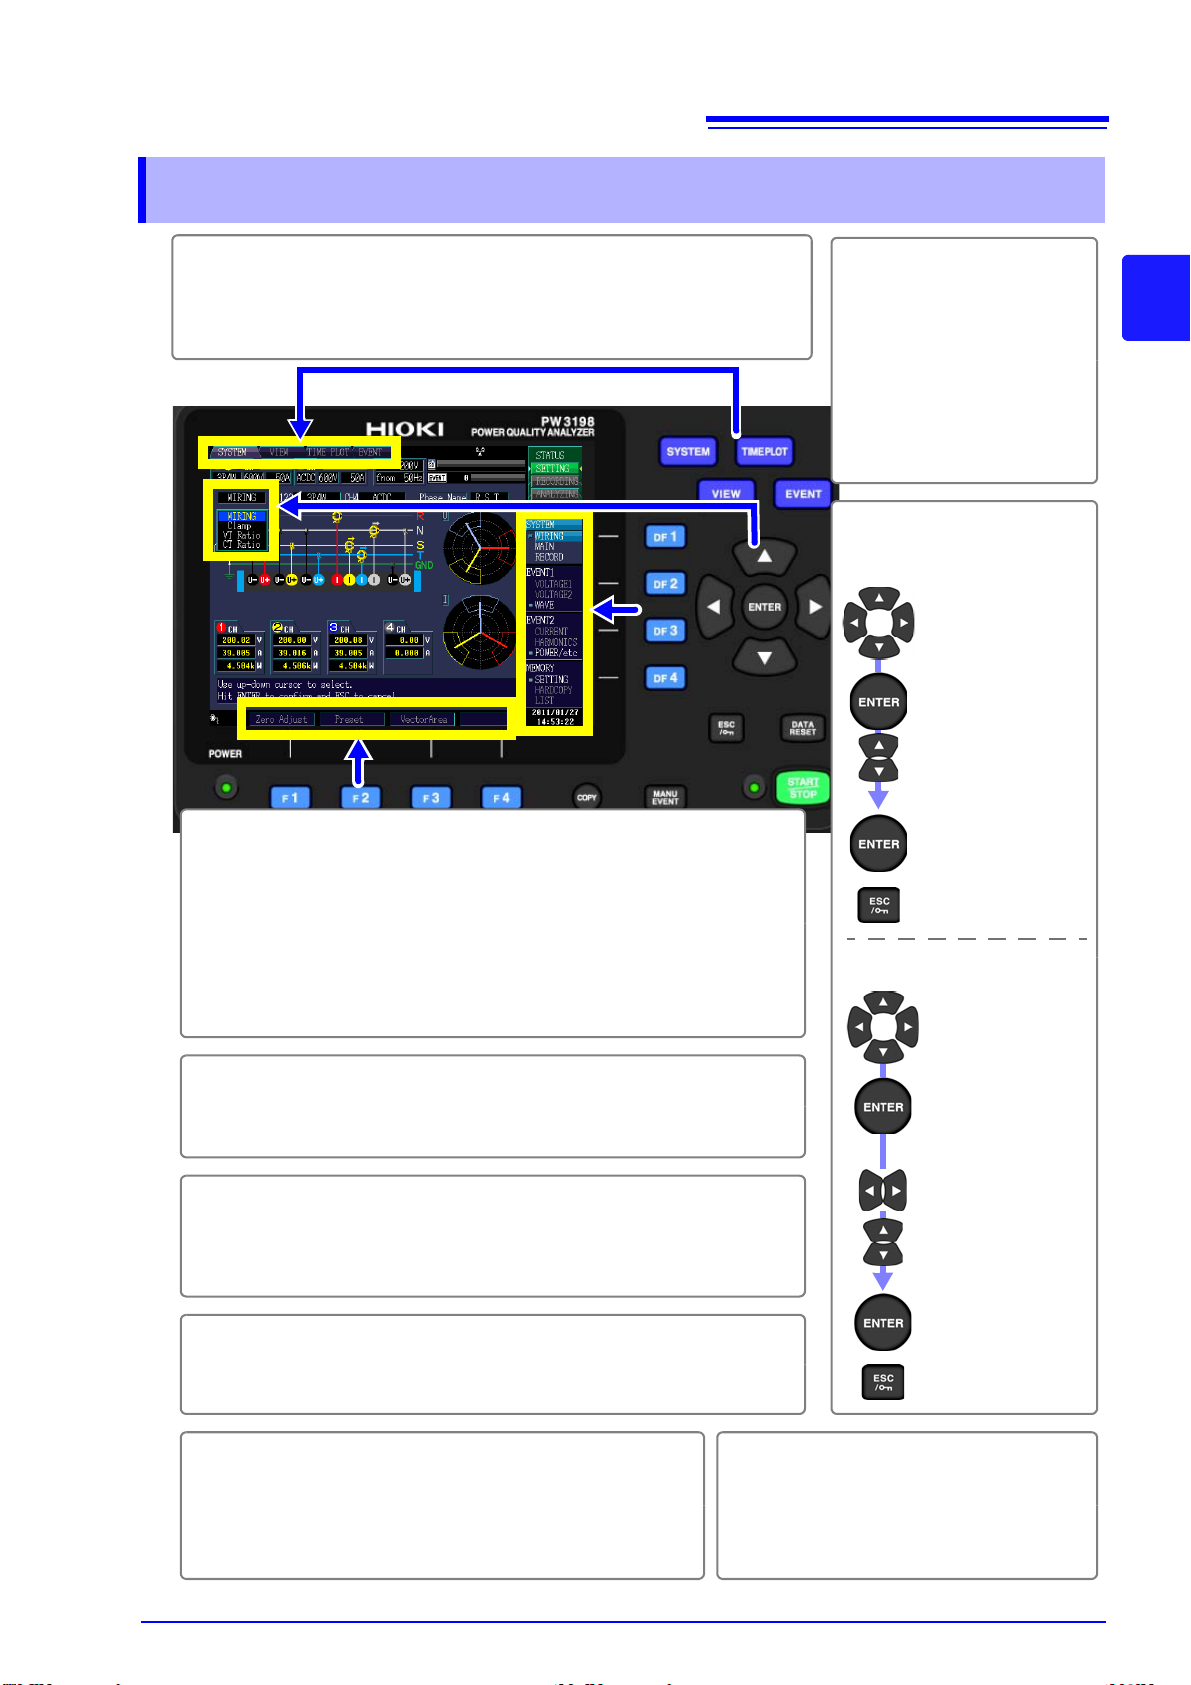
2.1 Names and Functions of Parts
Display
6.5" TFT color LCD display
See: "Display Items and Screen Types" (p.20)
Front
F key (Function key)
Select and change display contents and settings.
See:"2.2 Basic Operations" (p.19)
Operation keys
See:(p.16)
POWER LED
Lights up when the
POWER switch is
turned on and power is supplied to the instrument.
Normal operation: Solid green
When using battery pack: Solid red
See: "3.8 Turning the Power On and Off (Set-
ting the Default Language)" (p.36)
START/STOP LED
When in the recording
standby state:
Flashing green
When recording:
Solid green
Names and Functions of Parts
Basic Operations
15
2
& Screens Chapter 2
2.1 Names and Functions of Parts
Chapter 2 Names and Functions of Parts Basic Operations & Screens

16
START/STOP key
Starts and stops recording. To resume recording, press the DA T A RESET key to reset the data followed by the START/STOP
key.
Operation keys
Menu keys (Screen selection)
Press a key to select a screen (the lit key indicates the current selection).
Displays the [SYSTEM] screen (which provides a list of system settings, event
settings, recording condition settings, and memory [file] options [settings data,
screen copy, measurement data]). (p.23)
Displays the [VIEW] screen (which displays waveform and measured values).
(p.24)
Displays the [TIMEPLOT] screen (which displays time series graphs). (p.25)
Displays the [EVENT] screen (which displays an event list). (p.26)
Cursor keys
Move the cursor on the
screen. The cursor keys
are also used to scroll
through graphs or waveforms.
ENTER key
Finalizes the selected or
changed item.
DF keys (display function keys)
Selects which screen to
display from the selected
[SYSTEM], [VIEW],
[TIMEPLOT], or
[EVENT] screen.
MANU EVENT key
Generates an event, initiating recording of measured values and event
waveforms.
COPY key
Outputs data from the
currently displayed
screen to the SD memory card or printer.
ESC key
Cancels any selections or
changes made and reverts
to the previous settings.
Pressing and holding this
key for at least 3 seconds
activates the key lock function. (To cancel the key
lock, press and hold for at
least 3 seconds again.)
DATA RESET key
Erases all currently displayed measurement data .
(Data that has been recorded to the SD memory card
is not erased.) To start a
new recording session,
press this key to reset the
data.
2.1 Names and Functions of Parts
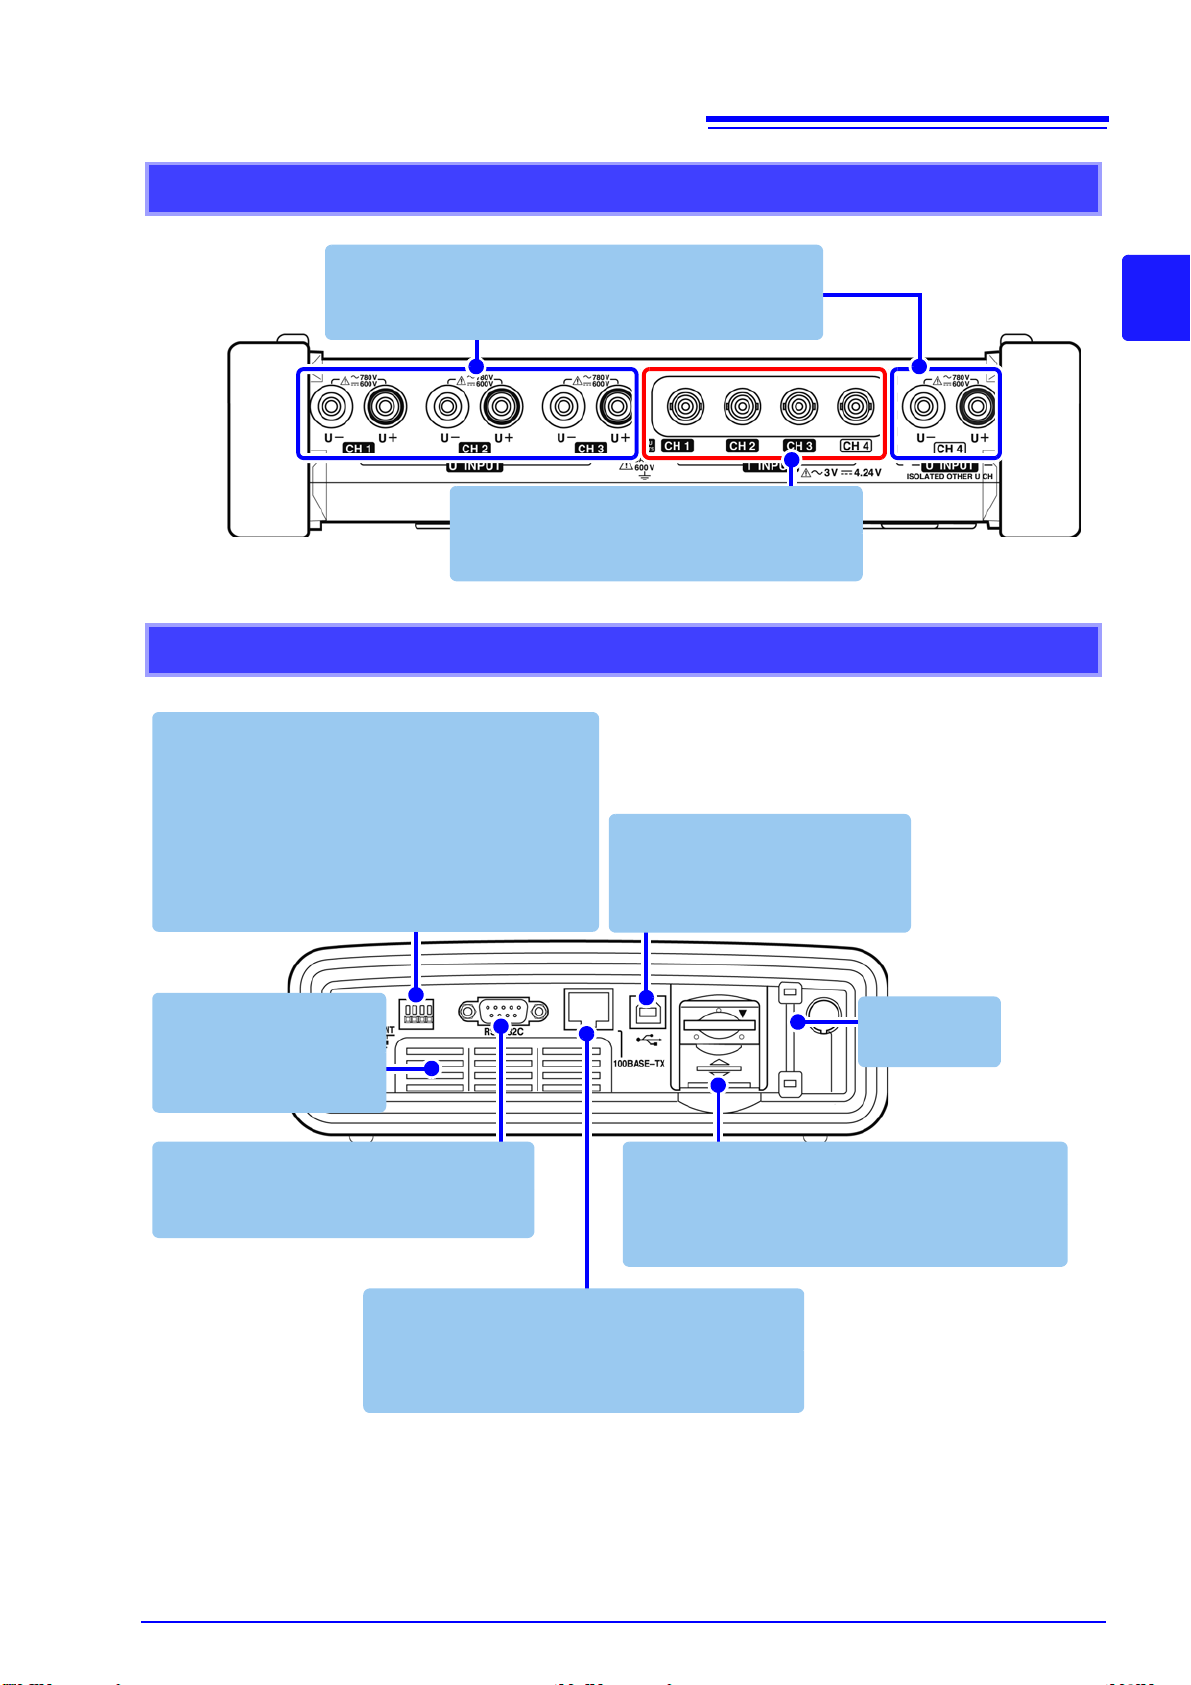
17
Upper side
Current input jacks
Connect optional clamp sensors here.
See: (p.34)
Voltage input jacks
Connect the included L1000 Voltage Cord here.
See: (p.34)
Right side
LAN interface
Connect a computer here using the optional
9642 LAN Cable.
See: (p.160)
RS-232C interface
Connect a GPS box or printer using an
RS-232C cable.
External control terminal
IN : Allows use of external input as an event
trigger.
OUT : Outputs a signal when an internal event
occurs.
GND : Serves as the ground terminal for the
external event input and output terminals.
See: (p.149)
Air vents
Do not block these
vents.
See: (p.6)
USB interface
Connect a computer here using
the included USB cable.
See: (p.156)
Strap eyelet
See: (p.28)
SD memory card slot
Insert an SD memory card here. Be sure to close
the cover when recording.
See: (p.32)
2.1 Names and Functions of Parts
2
Chapter 2 Names and Functions of Parts Basic Operations & Screens
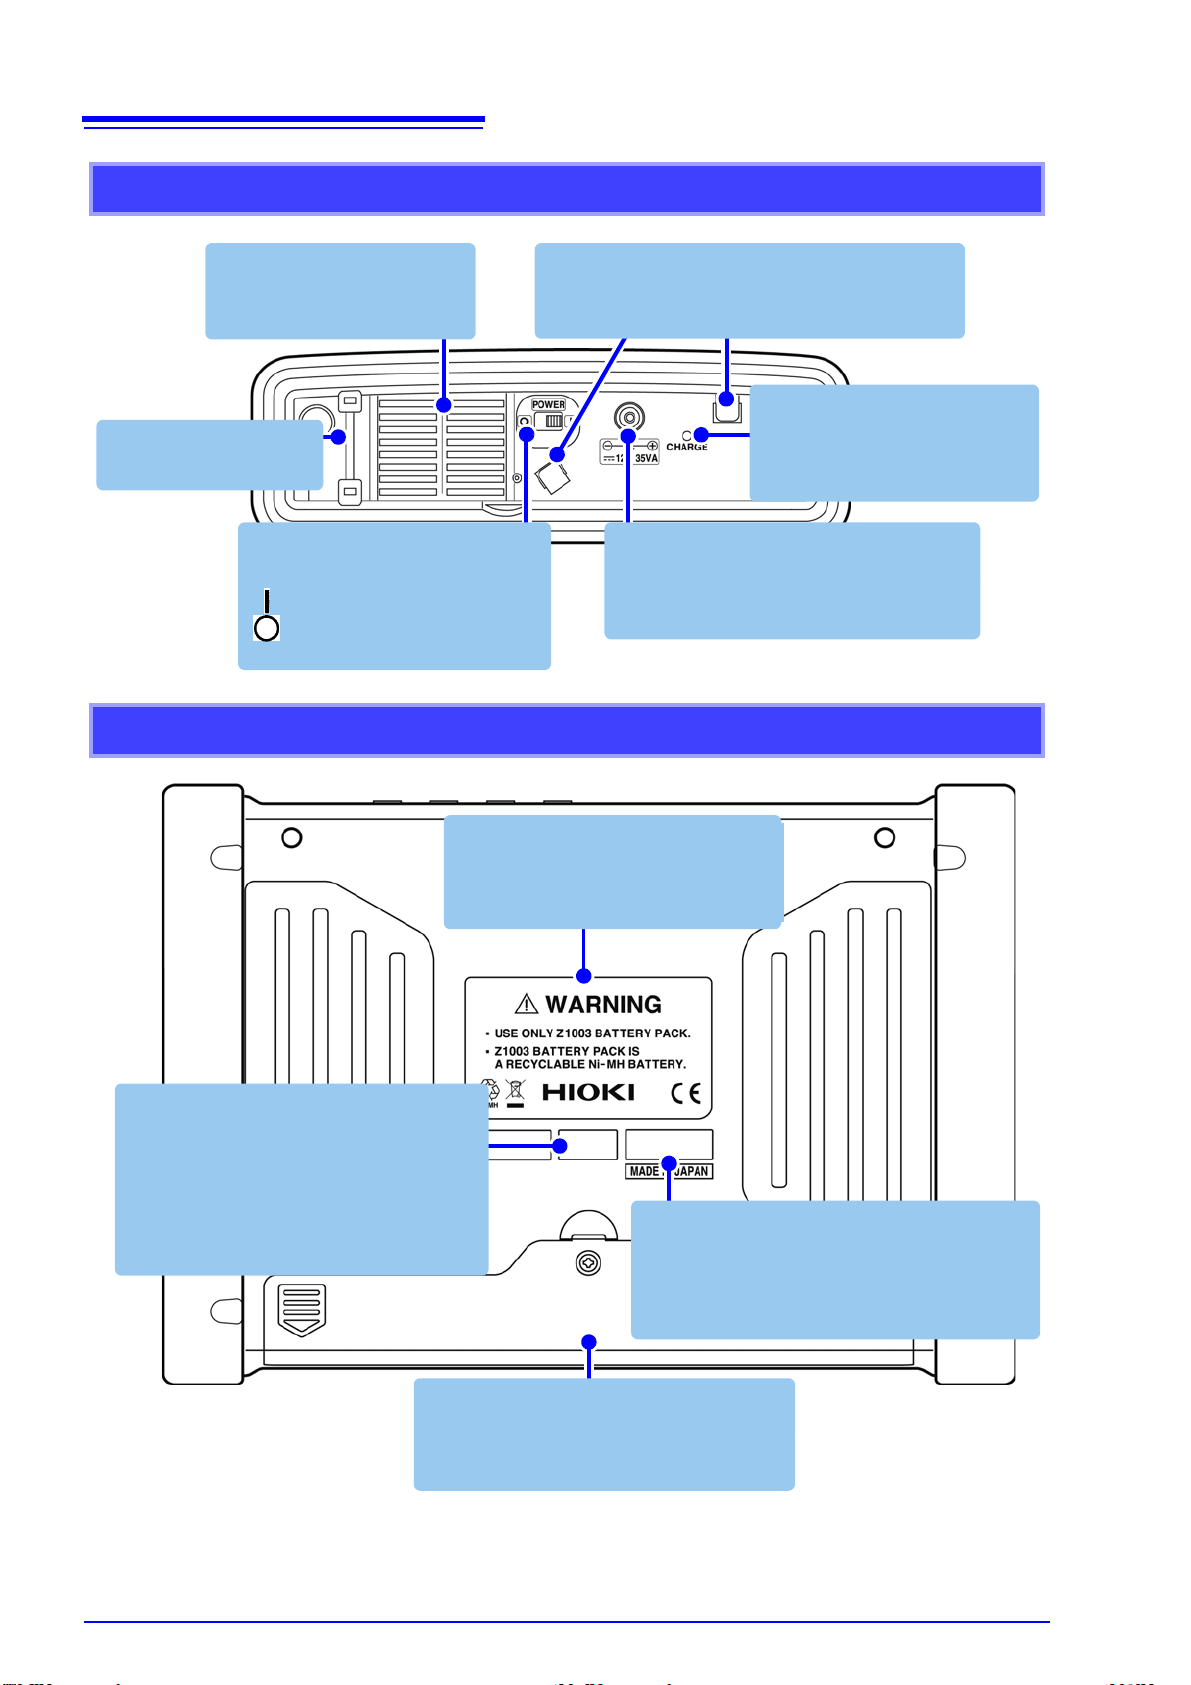
18
Left side
AC adapter connection jack
Connect the included Z1002 AC Adapter
here.
See: (p.32)
Power switch
Turns the instrument on and off.
See: (p.36)
Power ON
Power OFF
CHARGE LED
Lights up while the Z1003 Battery Pack is charging.
See: (p.30)
Strap eyelet
See: (p.28)
AC adapter hook
Loop the AC adapter cord through this hook.
See: (p.32)
Air vents
Do not block these vents.
See: (p.6)
Back
Label
Contains important warnings as well
as the CE mark, country of manufacture, and manufacturer.
Serial No.
Displays the instrument's serial number. Do
not remove the label as the information is
contains is necessary in order to manage the
device.
MAC address label
Displays the instrument's unique MAC
address, which is used when configuring
a LAN connection. Do not remove the label as the information it contains is necessary in order to manage the devic e.
Battery compartment
Install the included Z1003 Battery Pack
here.
See: (p.30)
2.1 Names and Functions of Parts
2.2 Basic Operations
2
3
4
5
67
89
1
4 Select and finalize
the desired settings.
Display a pulldown menu
Select the
desired setting
Accept setting
Move the
cursor to the
desired setting
1 To select a display screen
Press SYSTEM, VIEW,TIME PLOT, or EVENT to display the correspo nd ing screen.
See: "2.3 Display Items and Screen Types" (p.20)
To chan g e a va lu e
Select the
value so that it
can be
changed
Select a digit
Select a value
Accept setting
Move the
cursor to the
desired setting
5 Start/stop recording.
Press the START/STOP key to start/stop recording.
See: "Starting and Stopping Recording" (p.14)
6 Revert to [SETTING] mode after stopping recording.
Press the DATA RESET key to reset the measurement data.
The instrument will return to [SETTING] mode from [ANALYZ-
ING] mode.
3 To select and change display contents and
settings
Press one of the F keys to select and change display contents
and settings. The displayed function labels depend on the currently displayed screen.
Freeze the waveform or value display.
On the [VIEW] screen, you can freeze the waveform or value
display by pressing the F4 [HOLD] key.
Cancel
Cancel
the setting
7 Engage the key lock.
Press and hold the ESC key for at least 3 seconds. To cancel
the key lock, press and hold the key for at least 3 seconds.
8 Save screen data (output it to a printer).
Press the COPY key. Data will be saved to the SD
card (or output to the printer).
See: "9.5 Saving, Displaying, and Deleting Screen Copies"
(p.144)
9 Generate an event manually.
Press the MANU EVENT key. Measured values and event waveforms
at that time will be recorded.
See: "Manual Events" (p.13)
2 Select the screen to
display.
Press one of the DF keys
to select and change display contents and settings. The displayed
function labels depend
on the currently displayed screen.
19
2.2 Basic Operations
2
Chapter 2 Names and Functions of Parts Basic Operations & Screens
20
5
Screen T ypes
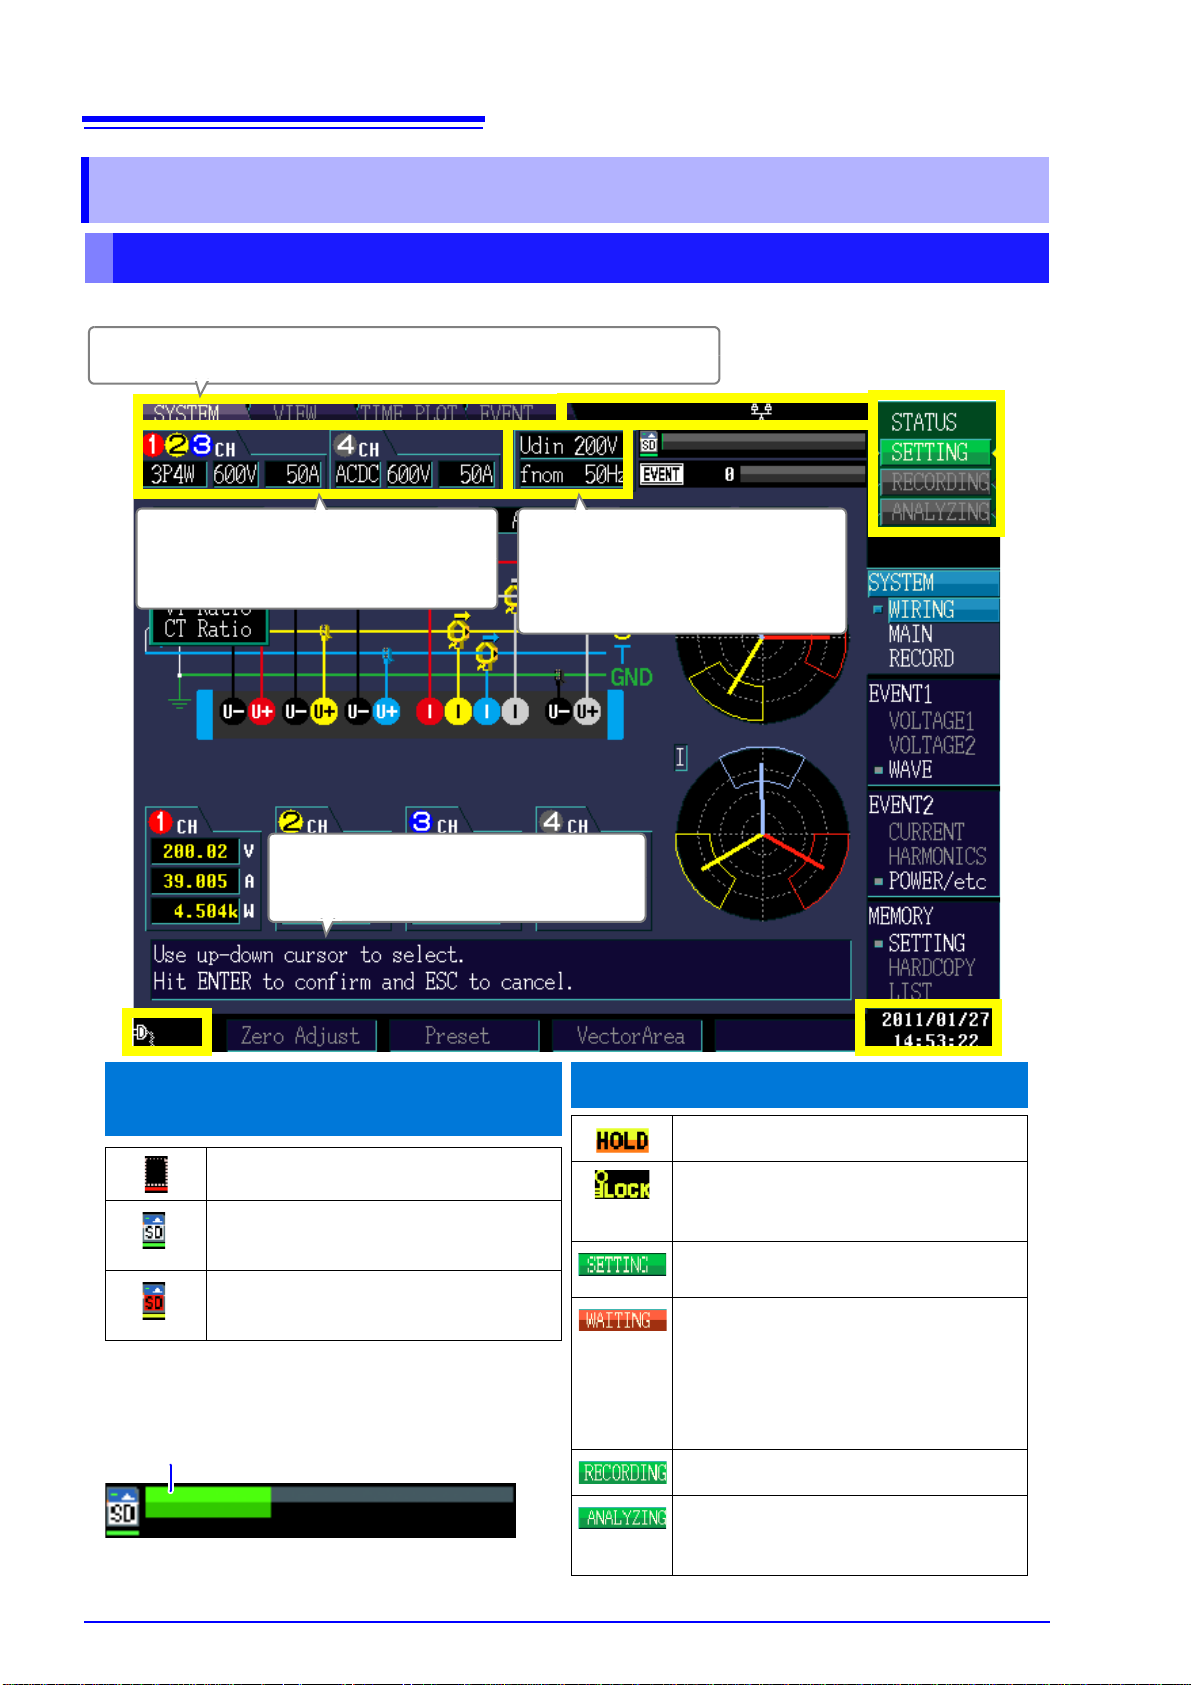
The tab for the currently displayed screen is shown brighter than the rest.
2
1
2, 3
4
1SD memory card operation and
usage status display
Lights up when no SD card is inserted.
(White)
Lights up when an SD memory card is
inserted.
(Red)
Lights up when the SD memory card is
being accessed.
2Operating State Indicators
Indicates Data Hold is active.
Lights to indicate Key Lock is active
(keys are locked), after holding the
ESC key for three seconds.
Lights up when settings can be configured.
The [SETTING] indicator shows
[WAITING] from the time that the
START/STOP key is pressed until
recording actually starts. During
repeated recording, [WAITING] is also
displayed when recording is stopped.
Lights up when data is being recorded.
Lights up when the instrument is in
[ANALYZING] mode after recording
stops.
Current CH1 to CH4 connection state, voltage range, current range settings
Nominal input voltage and
measurement frequency
(nominal frequency) settings
TIMEPLOT data capacity
Once the memory is full, no additional data can be
recorded.
Help comment
Displays an explanation for the item
highlighted by the cursor.
6
2.3 Display Items and Screen Types
2.3 Display Items and Screen Types
Common Display Items
These items are displayed on every screen.
21
Displays the current year, month, day, hour, minute,
and second.
See: Setting the Clock: (p.65)
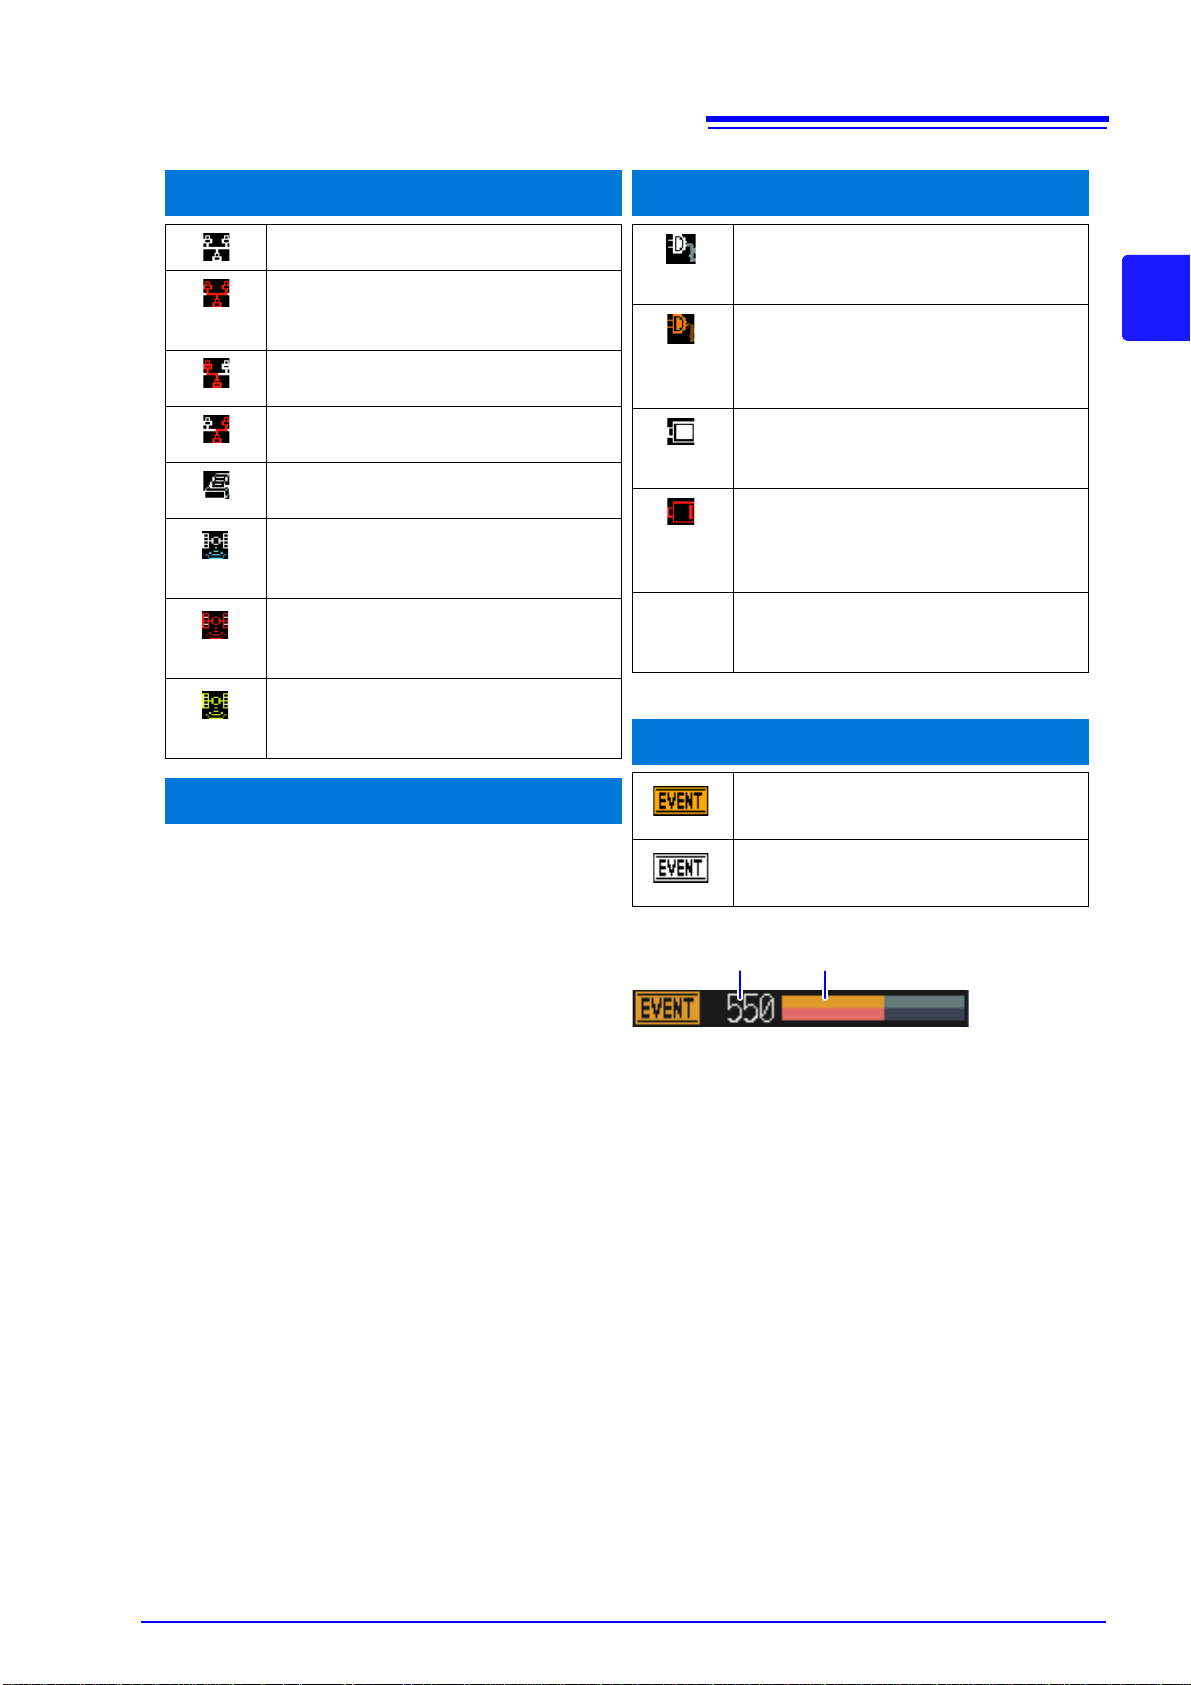
3 Interface status display
Lights up during normal operation.
Lights up when the instrument is b oth
connected to an HTTP server and
downloading data.
Lights up when the instrument is
downloading data.
Lights up when the instrument is connected to an HTTP server.
Lights up when a printer is conne cted
to the RS-232C terminal.
(Blue)
Lights up when GPS positioning is
active while connected to the PW9005
GPS Box.
(Red)
Lights up when the RS connected
device is set to GPS but the PW9005
GPS Box is not yet connected.
(Yellow)
Lights up when the PW9005 GPS Box
is connected but GPS positioning is
not yet active.
4Real-time clock display
5 Power supply status display
(White)
Lights up when the instrument is being
powered by the AC adapter.
The POWER LED will turn green.
(Orange)
Lights up when the instrument is being
powered by the AC adapter and the
battery is charging. The POWER LED
will turn green.
(White)
Lights up when the instrument is being
powered by the battery. The POWER
LED will turn red.
(Red)
Lights up when the instrument is being
powered by the battery and the
remaining battery life is limited. The
POWER LED will turn red.
No display
No display indicates that the instrument is off or charging.
The CHARGE LED will light up.
6 Event generation status display
(Orange)
An event has been detected.
(White)
No event has been detected.
Event indicator
Full bar indicates 1,000 events.
No. of events recorded
(Max. 1,000)
2.3 Display Items and Screen Types
2
Chapter 2 Names and Functions of Parts Basic Operations & Screens
22
1
2
1
1
2.3 Display Items and Screen Types
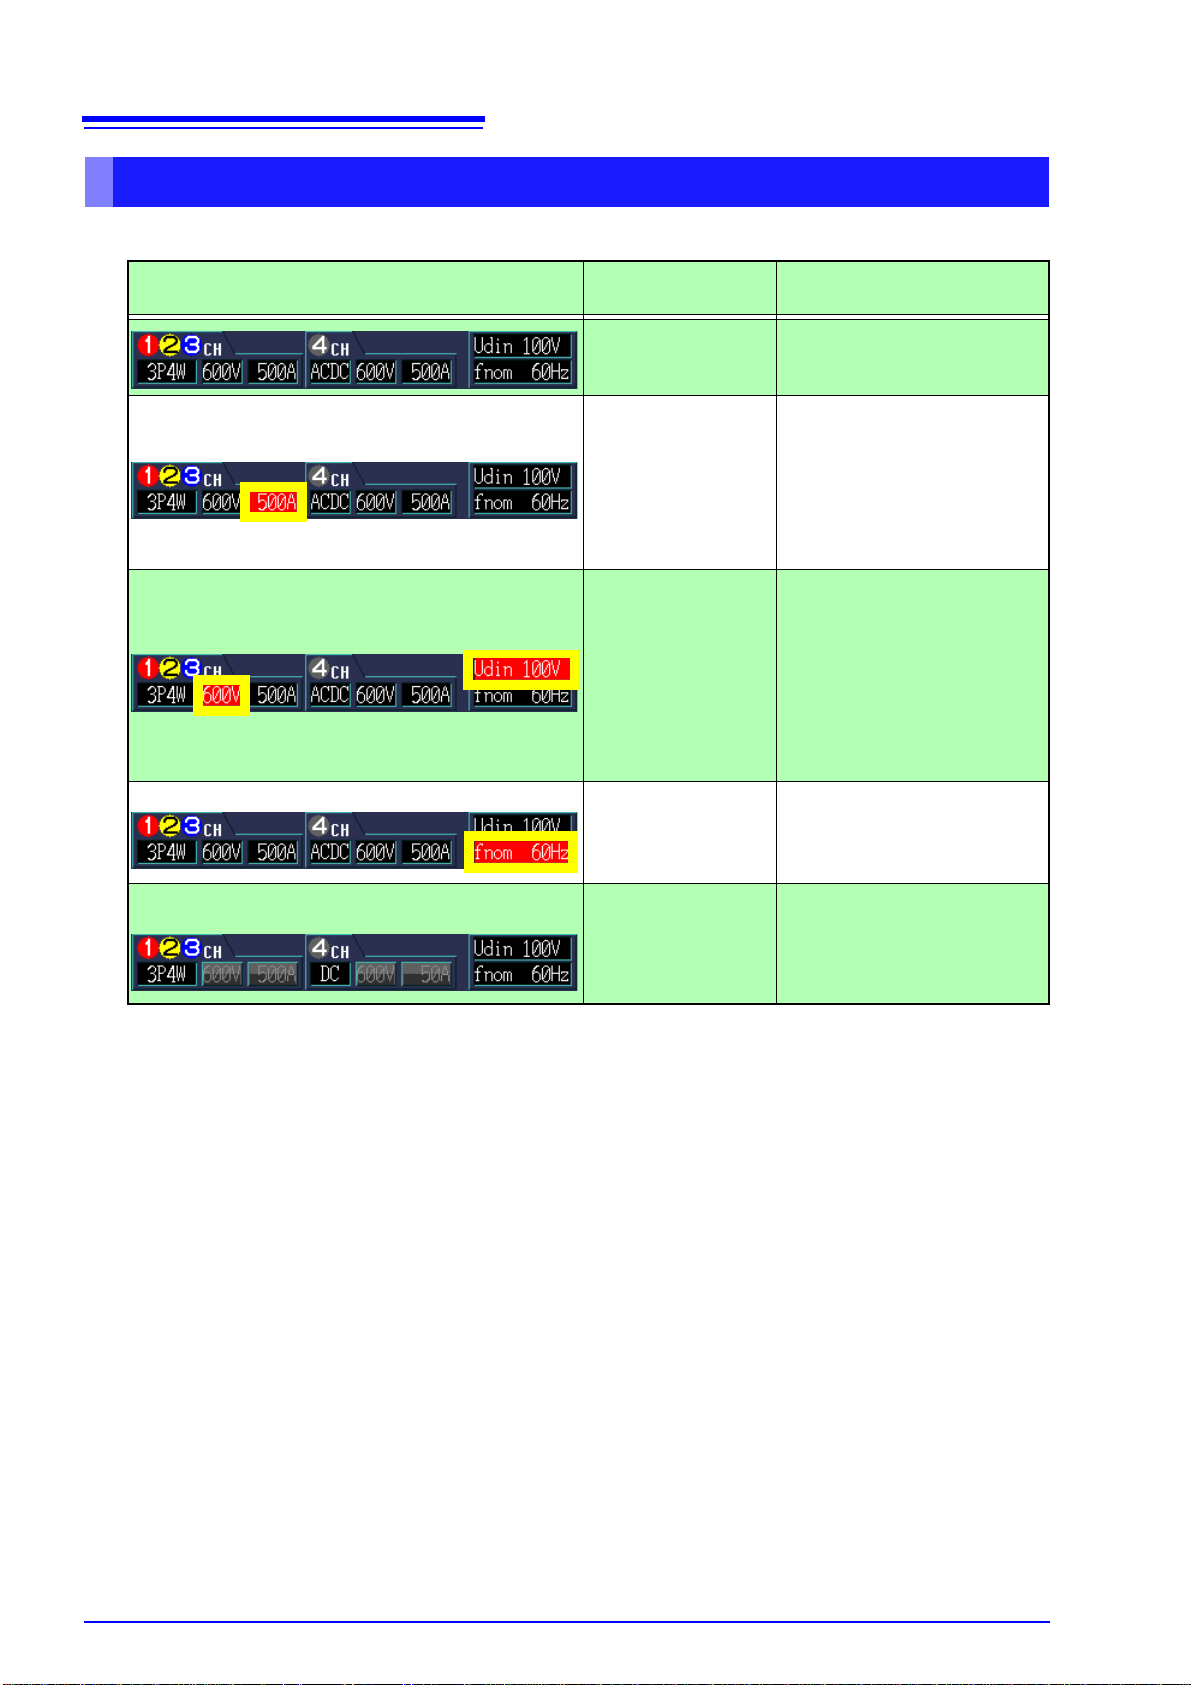
Warning Indicators
The instrument may display the following warnings:
Display Cause
(Current range indicator turns red.)
(Volt a ge indi cator turns red.) ([Udin] indicator turns red.)
([fnorm] indicator turns red.)
(The voltage range indicator and current range indicator
are grayed out.)
Solution and page number for
more information
Normal screen display -
Switch to an appropriate clamp
sensor.
Range or crest factor
exceeded (current).
1. Range or crest factor exceeded (voltage).
2. The measured value
and nominal input
voltage ([Udin])* differ.
The measurement frequency (nominal frequency [fnom]) and
measured value differ.
VT (PT) and CT have
been set.
See: "Options" (p.3)
Change the settings to an appropriate range.
See: "5.1 Changing Measure-
ment Conditions" (p.55)
For (1), the measured value has
exceeded the voltage value that
the instrument is capable of measuring. Use VT (PT) to make the
measurement. If only (2) applies,
change the nominal input voltage
to an appropriate value.
See: "5.1 Changing Measure-
ment Conditions" (p.55)
Change the measurement frequency to an appropriate value.
See: "5.1 Changing Measure-
ment Conditions" (p.55)
-
*: The nominal input voltage (Udin), which is calculated from the nominal supply voltage using the trans-
former ratio, indicates the voltage that is actually input to the instrument.
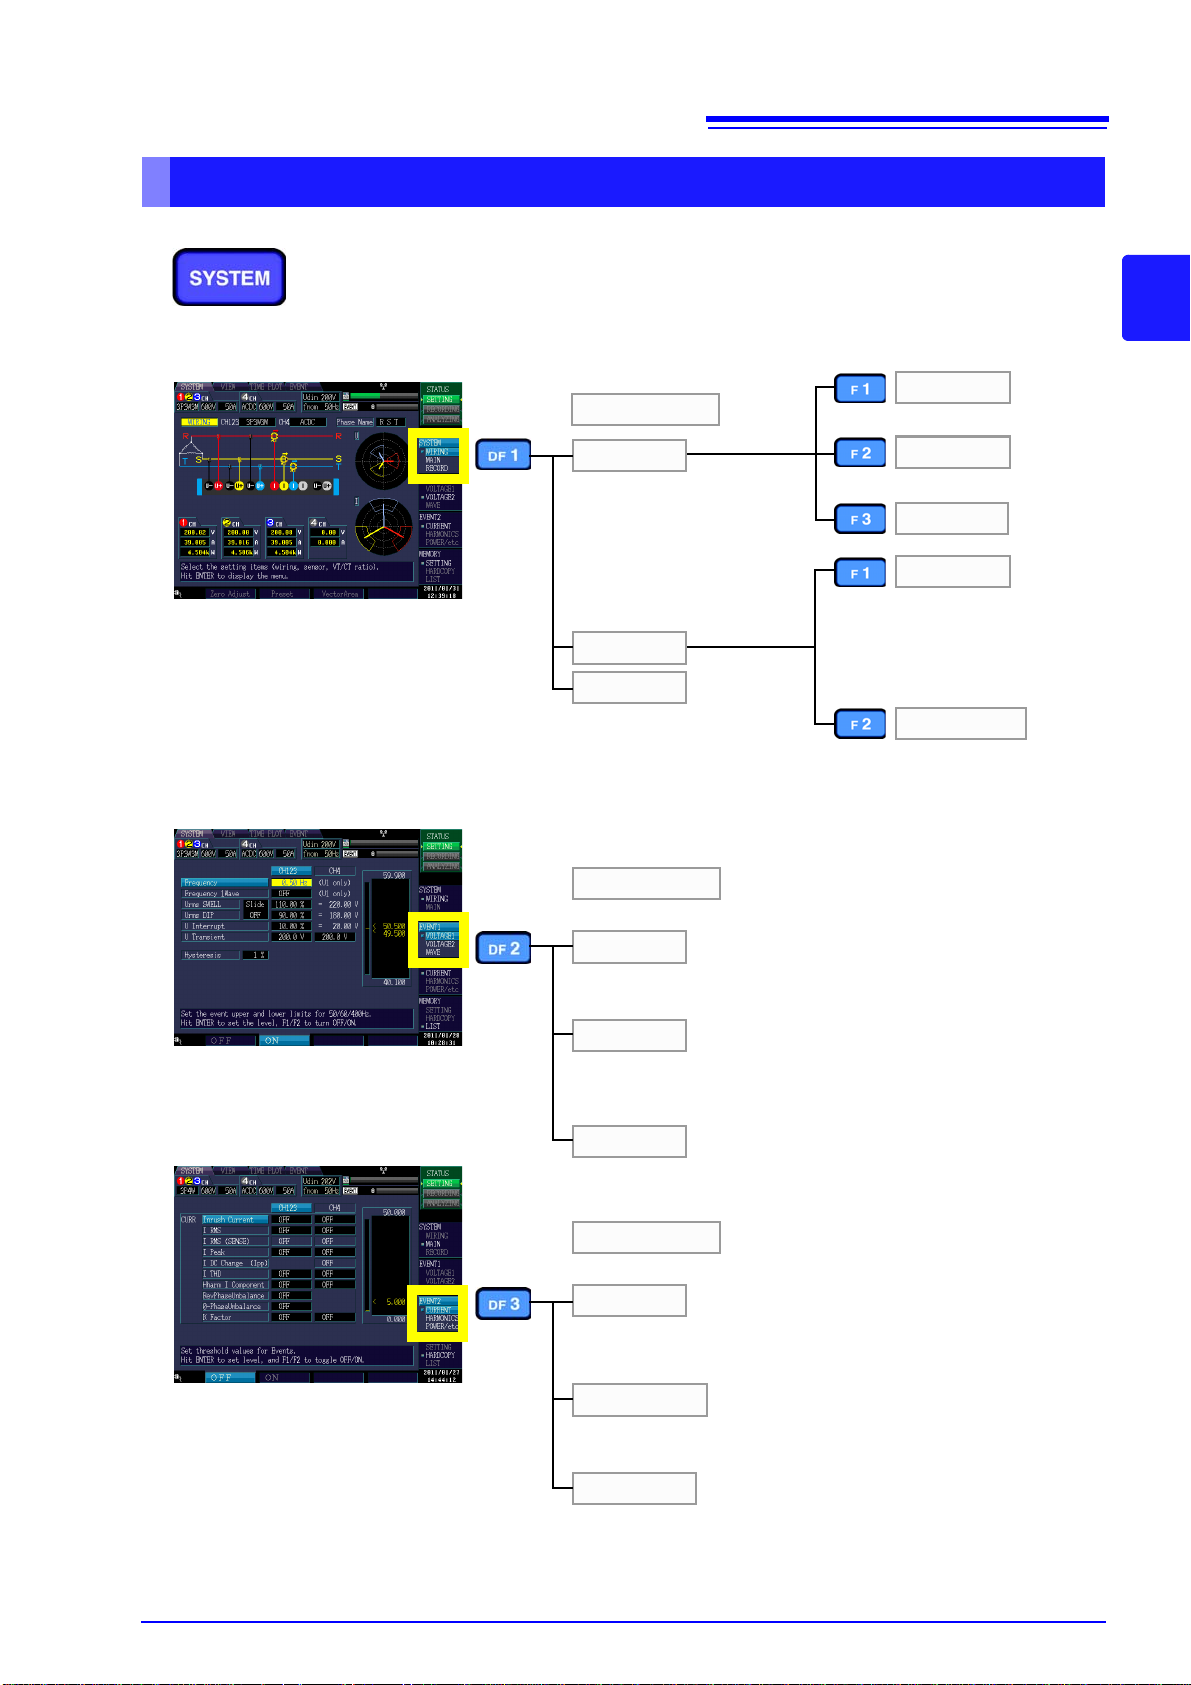
Screen Types
Configure settings
(SYSTEM screen)
The [SYSTEM] screen is used to configure var ious instrument
settings.
Press the SYSTEM key to display the [SYSTEM] screen. The
screen can be changed with the DF keys.
Configures the connection,
clamp sensor, VT ratio, and
CT ratio settings. (This
screen is always displayed
after the instrument is turned
on.)
See: Chapter 4 (p.37)
VOLTAGE1
VOLTAGE2
WAVE
WIRING
MAIN
RECORD
SYSTEM
MEASURE
HARDWARE
Zero Adjust
Preset
VectorArea
Configures the recording,
TIMEPLOT interval, realtime control, and repeated
recording settings.
See: 5.2 (p.58) to 5.3 (p.61)
Configures the connection,
clamp sensor, VT ratio, CT ratio,
current range, event, and TIMEPLOT settings.
See: 5.1 (p.55)
Configures the display language, screen color, clock, external output, RS-connected
device, beep, LCD backlight,
and LAN settings. Resets the
system.
See: 5.4 (p.64)
EVENT1
Configures the frequency, swell, dip, interruption, transient
threshold, and hysteresis settings.
Configures the RMS voltage, waveform peak, DC fluctuation,
harmonic distortion factor, high-order harmonic component, and
unbalance factor threshold settings.
See: 5.5 (p.66)
Configures the threshold settings for generating events with the
voltage waveform.
CURRENT
HARMONICS
POWER/etc
EVENT2
Configures the inrush current, RMS current, waveform peak, DC
fluctuation, harmonic distortion factor, high-order harmonic component, unbalance factor, and K factor threshold settings.
Configures the threshold settings for 0- to 50-order harmonics
(voltage, current, power, phase).
See: 5.5 (p.66)
Configures the active power, reactive power, apparent power,
power factor threshold, timer event, external event, and continuous event settings.
See: 4.7 (p.50)
See: 4.1 (p.37)
23
2.3 Display Items and Screen Types
2
Chapter 2 Names and Functions of Parts Basic Operations & Screens
24
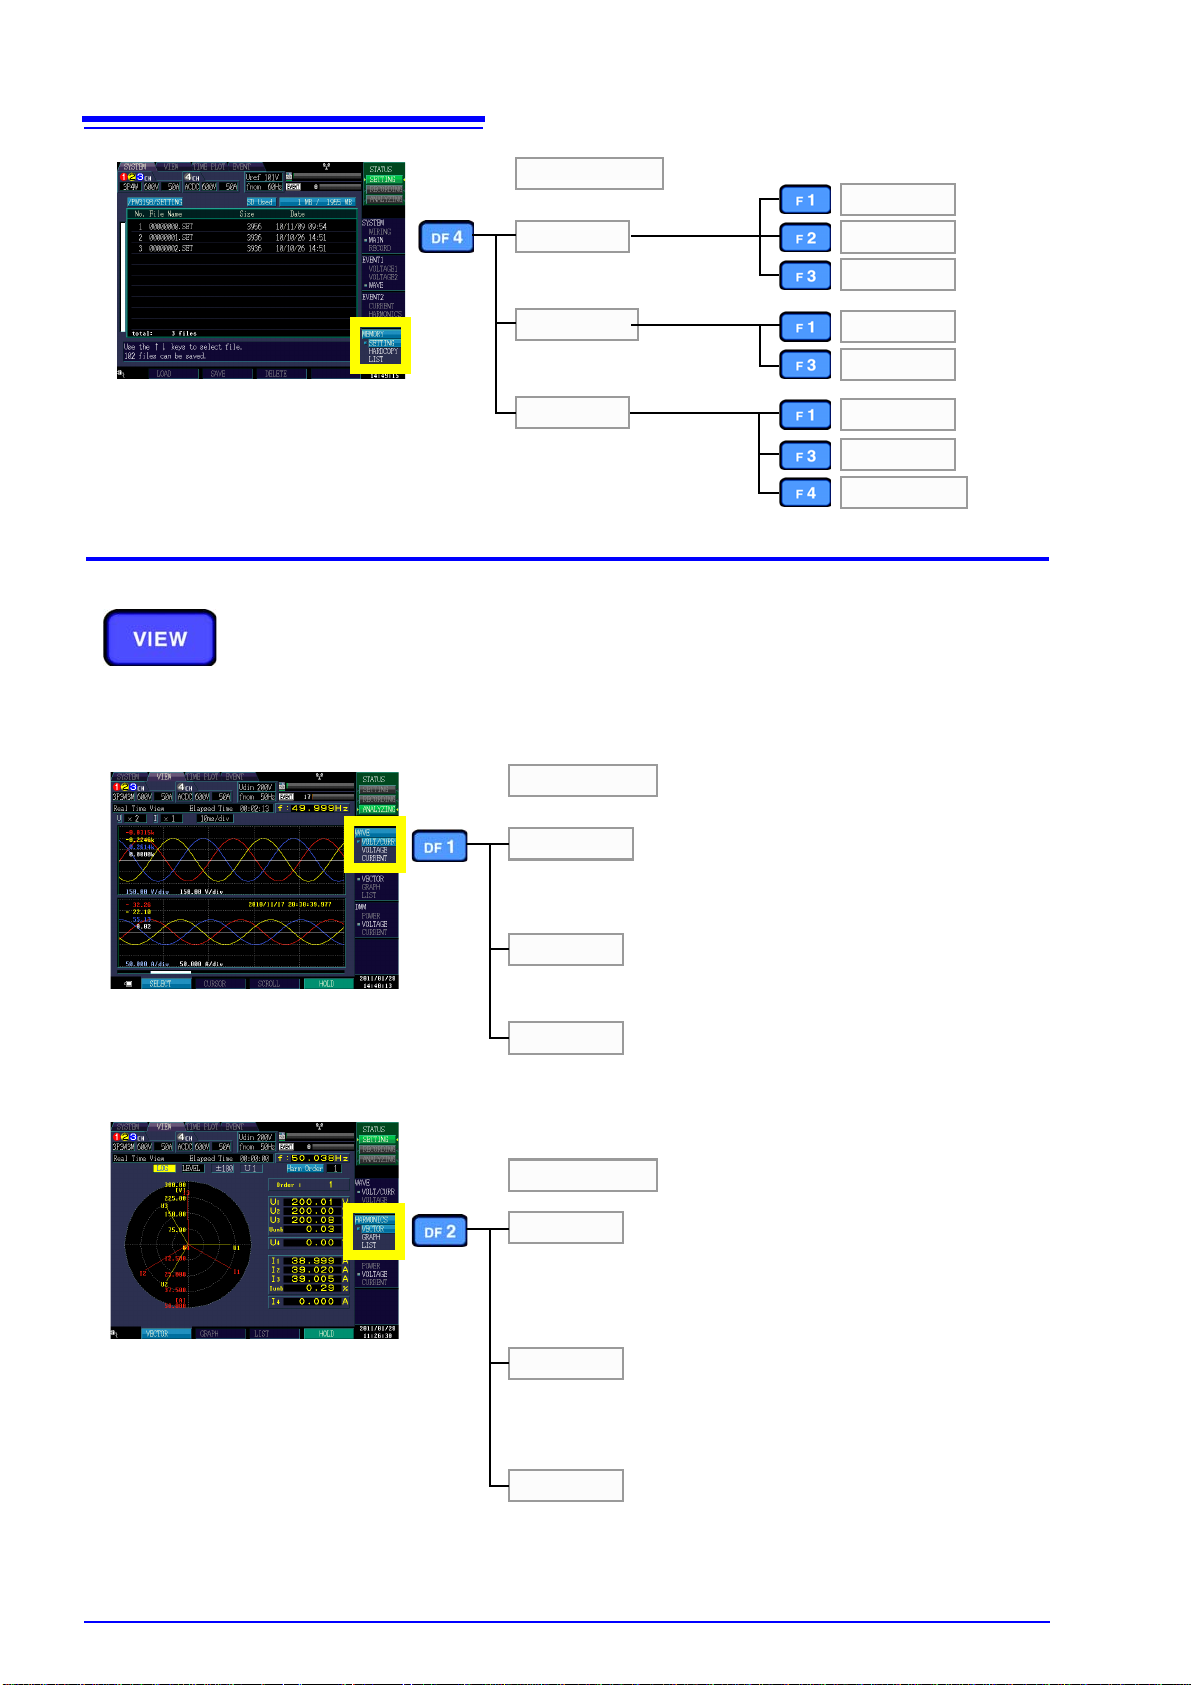
SETTING
HARDCOPY
LIST
MEMORY
Displays a list of settings data.
Displays a list of screenshot
data.
See: Chapter 9 (p.135)
Displays a list of the files
stored on the SD memory
card.
LOAD
SAVE
VIEW
DELETE
DELETE
FORMAT
DELETE
LOAD*
*The List's F1 (LOAD) will appear when the cursor is in the stored data folder. (B*******).
Monitor
instantaneous values
(VIEW screen)
The [VIEW] screen is used to view voltage and current
instantaneous waveforms, phase relationships, values, and
harmonics.
Press the VIEW key to display the [VIEW] screen. The
screen can be changed with the DF keys.
VOLT/CURR
VOLTAGE
CURRENT
WAVE
Displays voltage waveforms for channels 1 to 4 on one screen
and current waveforms for channels 1 to 4 on another screen (for
a total of two screens).
Displays separate voltage waveforms for channels 1 to 4.
See: 6.2 (p.76)
Displays separate current waveforms for channels 1 to 4.
VECTOR
GRAPH
LIST
HARMONICS
Displays the phase relationship between voltage and current for
channels 1 to 3 as a vector diagram. The RMS value and phase
instantaneous value is also shown for each order.
See: 6.3 (p.80)
Displays the sum voltage, current, and 0- to 50-order power measured values for channels 1 to 4 as a graph.
See: 6.4 (p.83)
Displays the sum voltage, current, power measured values (orders 0 to 50) for channels 1 to 4 as a graph.
See: 6.4 (p.83)
2.3 Display Items and Screen Types
 Loading...