

Page 1
Page 2

Page 3

Contents
Contents
Introduction ................................................ 1
Verifying Package Contents ..................... 2
Safety Information ..................................... 4
Operating Precautions .............................. 7
1 Overview 15
1.1 Procedure for Investigating
Power Quality ................................. 15
Step 1: Clarifying the purpose ....................15
Step 2: Identifying the malfunctioning
component (measurement location) ...........15
Step 3: Checking investigation
(measurement) locations (collecting site
data) ............................................................16
Step 4: Making measurements with the
power quality analyzer (measurement
procedure) ..................................................16
Advice for identifying the cause of
abnormalities ..............................................18
1.2 Product Overview ........................... 19
1.3 Features .......................................... 20
1.4 Names and Functions of Parts ..... 21
1.5 ScreenConguration ..................... 24
Displaying and switching screens ...............24
MONITOR screen .......................................25
TREND screen ............................................26
EVENT screen ............................................27
WIRING screen ...........................................27
SET UP screen ...........................................28
FILE screen ................................................29
QUICK SET screen .....................................29
1.6 Basic Key Operations .................... 30
Changing the required items .......................30
Entering characters .....................................31
1.7 Screen Display ............................... 32
1.8 Error Screen Display ...................... 34
2 Preparing for
Measurement 35
2.1 Preparation Flowchart ................... 35
2.2 Initial Measurement
Preparations ................................... 36
Color coding of current sensor (for
channel identication) .................................36
Bundling the voltage cords and current
sensors (If required) ....................................37
Installing the battery pack ...........................38
Attaching the strap (if required) ..................39
Setting the language, clock, and
measurement frequency .............................40
2.3 Pre-measurement Inspection ........ 41
2.4 Inserting the SD Memory Card ...... 42
2.5 Power Supply ................................. 43
2.6 Turning On/Off the Instrument ...... 44
2.7 Warm-up .......................................... 44
3 Quick Set 45
3.1 CongurableItems ......................... 45
3.2 Adding Settings .............................. 46
4 Wiring
(WIRING Screen) 47
4.1 Wiring Procedure ........................... 47
4.2 Wiring Method and Declared
Input Voltage Settings.................... 48
Wiring diagram ............................................50
4.3 Connecting Voltage Cords to
Instrument ....................................... 51
4.4 Connecting Current Sensors
andConguringCurrentSensor
Settings ........................................... 52
Connecting the optional current sensor ......52
Connecting current sensors other than
the optional sensors ....................................53
4.5 Zero Adjustment ............................. 54
4.6 Connecting Voltage Cords to
Objects ............................................ 55
4.7 Attaching Current Sensors to
Objects ............................................ 56
Load current measurement .........................56
Leakage current measurement ...................57
4.8 ConguringCurrentRange
Setting ............................................. 58
4.9 Checking Wiring ............................. 59
5 Setting Change (SET
UP Screen) 63
5.1 Measurement Settings ................... 64
SET UP, Measurement Settings 1
screen .........................................................64
SET UP, Measurement Settings 2
screen .........................................................66
5.2 Recording Settings ........................ 69
5.3 Event Settings ................................ 72
SET UP, Event Settings 1 screen .............72
SET UP, Event Settings 2 screen .............74
5.4 System Settings ............................. 75
System reset (Default) ................................76
Factory reset (Default) ................................77
Factory settings ..........................................78
1
2
3
4
5
6
7
8
9
10
Appx. Ind.
PQ3100A961-00
i
Page 4

Contents
Contents
6 Verifying the Waveform,
Measured Values
(MONITOR Screen) 81
Fixing the waveform display and
measured values ........................................81
6.1 Verifying the Voltage Waveform
and Current Waveform ................... 82
Screen display ............................................82
Changing the zoom factor for the
vertical axis and horizontal axis (X and
Y axis) of the waveform ..............................83
Verifying the measured value and
time at the cursor position (cursor
measurement) .............................................83
Scrolling the waveform ...............................83
6.2 Verifying the Electric Power (List
of Numerical Values) ...................... 84
6.3 Verifying the Electric Energy ........ 85
6.4 Verifying the Voltage Details ......... 86
6.5 Verifying the Current Details ......... 87
6.6 Verifying the Vector ........................ 88
6.7 Verifying the Harmonics Graph
and Harmonics Numerical
Values .............................................. 89
7 Recording (Save) (SET
UP Screen) 91
7.1 Start and Stop of the
Recording ....................................... 91
7.2 Using the Instrument During an
Interruption ..................................... 94
8 Verifying the Trends
(Fluctuations) in
Measured Values
(TREND Screen) 95
8.5 Verifying the Harmonic Trend
(Availableafterthermware
update) .......................................... 103
8.6 VerifyingtheFlicker(Available
afterthermwareupdate) ........... 104
9 Checking Events
(EVENT Screen) 105
9.1 Checking Event List ..................... 108
Checking event details ..............................109
9.2 Checking Event Status .................110
Switching event monitor screen ................ 111
Checking trend data on event ................... 11 2
Checking transient waveforms during
an event (Available after the rmware
update) ...................................................... 11 3
10 File Saving and
Operations (FILE
Screen) 115
10.1 Viewing and Using FILE Mode
Screen ............................................116
10.2 Folder and File Structure ..............118
SD memory card ....................................... 11 8
Internal memory ........................................120
10.3 Screen Hard Copy ........................ 121
Checking images (Available after the
rmware update) .......................................121
10.4 Saving Setting Files ..................... 122
10.5 Loading Setting Files ................... 123
10.6 Loading Measured Data ............... 124
10.7 Copy from the Internal Memory
to SD Memory Card ...................... 125
10.8 Deleting Folders and Files .......... 125
10.9 Formatting SD Memory Card
(Deleting All Files) ........................ 126
10.10 Removing SD Memory Card
during Recording ......................... 127
Verifying the measured value and
time at the cursor position (cursor
measurement) .............................................96
Scrolling the graph ......................................96
Event search ...............................................97
8.1 Verifying the Basic Trend .............. 98
8.2 Verifying the Detail Trend ............ 100
8.3 Verifying the Electric Energy ...... 101
8.4 VerifyingtheDemand(Available
afterthermwareupdate) ........... 102
ii
ii
11 Analysis (with
Computer) 129
11.1 Copying Files ................................ 129
Use of SD Memory Cards .........................130
Use of USB Cable .....................................131
11.2 Use of Application Software PQ
One (Included) .............................. 133
What can be done with the application
software ....................................................133
Installation .................................................134
Page 5

Contents
Contents
12 Communications (USB/
LAN/RS-232C) 137
12.1 Preparing for LAN
Communications .......................... 138
Settings (SET UP Screen) ........................138
Example of establishing a network
environment ..............................................139
Connection ................................................140
12.2 Remote Control of the
Instrument through the Internet
Browser (LAN Communications
Only) .............................................. 142
Preparations .............................................142
Remote operation .....................................143
Restrict the access
(password settings) ...................................144
12.3 RS-232C Communication
Preparations ................................. 145
Settings (SET UP screen) .........................145
Connection ................................................145
13 External I/O 147
13.1 Event Input .................................... 148
13.2 Event Output ................................. 149
13.3 External Event Output Settings
(SET UP Screen) ........................... 150
13.4 Connection ................................... 151
14 Specications 153
15.2 Cleaning ........................................ 195
15.3 Error Indication ............................ 195
15.4 Disposing the Instrument ............ 199
Appendix Appx.1
Appx. 1 Fundamental
Measurement Items ......... Appx.1
Appx. 2 Event Item ......................... Appx.3
Appx. 3 Explanation of Power
Quality Parameters and
Events ............................... Appx.4
Appx. 4 Event Detection
Methods ............................ Appx.8
Appx. 5 Recording Trends and
Event Waveforms ........... Appx.15
Trend screen recording method .........Appx.15
Recording event waveforms ..............Appx.16
Method for verifying aggregation values
required by IEC61000-4-30 ...............Appx.17
Appx. 6 Detailed Explanation of
IEC Flicker and ∆V10
Flicker(availableafter
thermwareupdate) ..... Appx.18
IEC icker meter ................................Appx.18
V10 icker meter ..............................Appx.20
∆
Appx. 7 3-phase 3-wire
Measurement .................. Appx.21
Appx. 8 Method for Calculating
Active Power
Accuracy ......................... Appx.23
Appx. 9 Terminology ................... Appx.24
1
11
2
12
3
13
4
14
5
15
6
6
7
7
14.1 GeneralSpecications ................ 153
14.2 InputSpecications/Output
Specications/Measurement
Specications ............................... 155
14.3 Flagging Concept ......................... 169
14.4 QUICKSETSpecications .......... 170
14.5 EventSpecications .................... 172
14.6 InterfaceSpecications ............... 173
14.7 Calculation Formula ..................... 175
14.8 RangeCongurationand
CombinationAccuracy ................ 188
15 Maintenance and
Service 193
Calibrations ...............................................193
15.1 Troubleshooting ........................... 193
Before having the instrument repaired ......193
Replaceable parts and operating
lifetimes .....................................................194
Index Ind.1
iii
iii
8
8
9
9
10
10
Appx. Ind.
Appx. Ind.
Page 6

Contents
iv
Page 7

Introduction
Thank you for purchasing the Hioki PQ3100 Power Quality Analyzer. To obtain maximum
performance from the instrument, please read this manual rst, and keep it handy for future
reference.
Registered trademarks
• Microsoft and Windows are either registered trademarks or trademarks of Microsoft Corporation
in the United States and other countries.
• Microsoft and Windows 7, Windows 10 are either registered trademarks or trademarks of
Microsoft Corporation in the United States and other countries.
• The SD logo is a trademark of SD-3C, LLC.
• Microsoft and Excel are either registered trademarks or trademarks of Microsoft Corporation in
the United States and other countries.
• Any other products and company names are generally either trade names, registered trademarks
or trademarks of respective companies.
Introduction
1
2
3
4
5
6
7
8
9
10
Appx. Ind.
1
Page 8
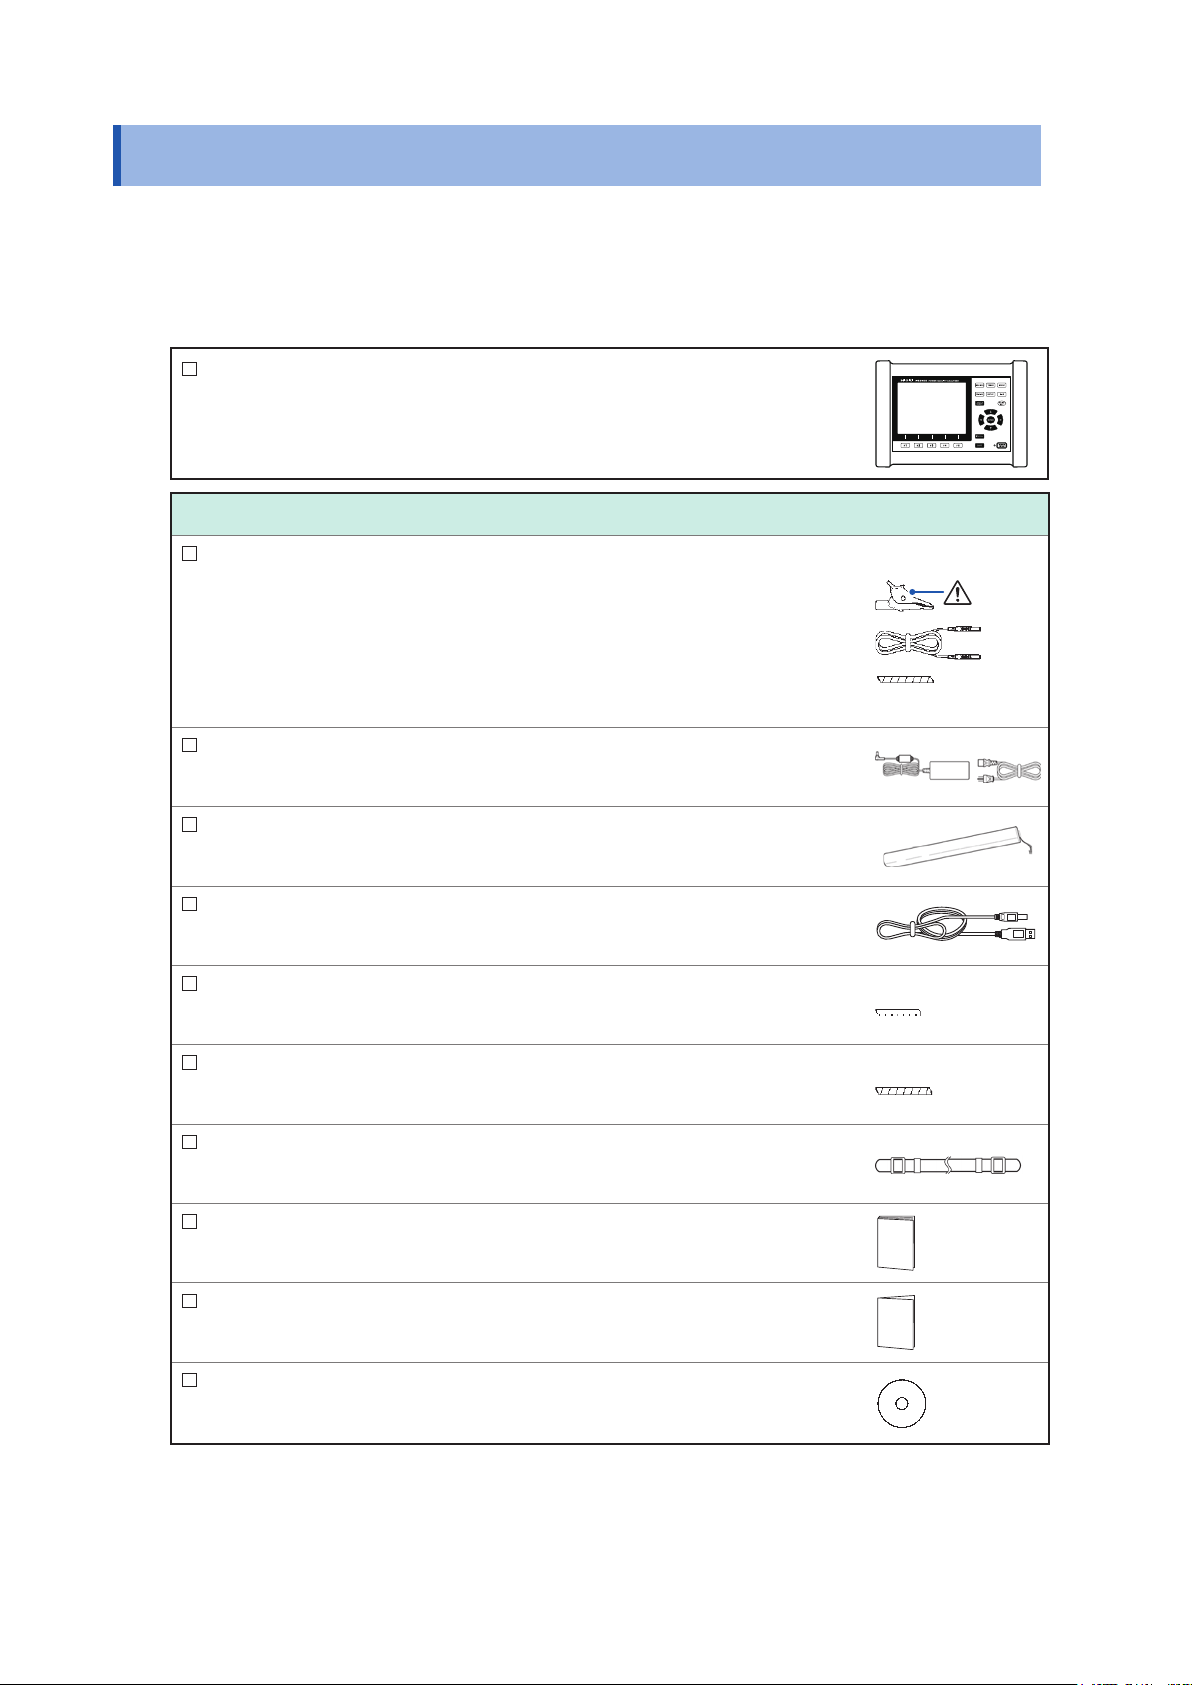
Verifying Package Contents
Verifying Package Contents
When you receive the instrument, inspect it carefully to ensure that no damage occurred during
shipping. In particular, check the accessories, keys, switch, and connectors. If damage is evident,
or if it fails to operate according to the specications, contact your authorized Hioki distributor or
reseller.
Check that the package contents are correct.
PQ3100 Power Quality Analyzer
Accessories
L1000-05 Voltage Cord
Maximum rated voltage: 1000 V, maximum rated current: 10 A
Alligator clips (black, red, yellow, blue, gray)
3 m banana plug leads (black, red, yellow, blue, gray)
Spiral Tubes (Cord bundling)
See “Bundling the voltage cords and current sensors (If required)”
(p. 37), “Connecting Voltage Cords to Instrument” (p. 51), and
“Connecting Voltage Cords to Objects” (p. 55).
Z1002 AC Adapter (with power cord)
Z1003 Battery Pack
USB cable
× 1
×1 each
×1 each
×5
×1
×1
×1
Colored spiral tubes in red, yellow, and blue (color coding for
current sensors)
Spiral tubes in black (cord bundling for current sensors)
Strap
See “Attaching the strap (if required)” (p. 39).
Instruction Manual*
Measurement Guide*
CD (computer application software)
See “11.2 Use of Application Software PQ One (Included)” (p. 133).
The latest version can be downloaded from our website.
*: See Hioki website for other languages.
Precautions when transporting the instrument
Handle the instrument carefully so that it is not damaged due to a vibration or shock.
×2 each
×5
×1
×1
×1
×1
2
Page 9

Verifying Package Contents
Options
The following options are provided for the PQ3100. Contact your authorized Hioki distributor or
reseller when ordering.
For current measurement
CT7126 AC Current Sensor (60 A, φ15 mm)
CT7131 AC Current Sensor (100 A, φ15 mm)
CT7136 AC Current Sensor (600 A, φ46 mm)
CT7044 AC Flexible Current Sensor (6000 A, φ100 mm)
CT7045 AC Flexible Current Sensor (6000 A, φ180 mm)
CT7046 AC Flexible Current Sensor (6000 A, φ254 mm)
CT7731 AC/DC Auto-Zero Current Sensor (100 A, φ33 mm)
CT7736 AC/DC Auto-Zero Current Sensor (600 A, φ33 mm)
CT7742 AC/DC Auto-Zero Current Sensor (2000 A, φ55 mm)
CT7116 AC Leakage Current Sensor (6 A, φ40 mm)
L9910 Conversion Cable (BNC-PL14)
For voltage measurement
L1000-05 Voltage Cord (accessory)
Maximum rated voltage: 1000 V, maximum rated current: 10 A
9804-01 Magnetic Adapter (Red: 1, for changing the voltage cord tips)
Maximum rated voltage: 1000 V, maximum rated current: 2 A
9804-02 Magnetic Adapter (Black: 1, for changing the voltage cord tips)
Maximum rated voltage: 1000 V, maximum rated current: 2 A
9243 Grabber Clip (Red/Black: 1 each, for changing the voltage cord tips)
Maximum rated voltage: 1000 V, maximum rated current: 1 A
Power supply
Z1002 AC Adapter (accessory)
Z1003 Battery Pack (accessory)
Media for recording
Z4001 SD Memory Card 2GB
Z4003 SD Memory Card 8GB
1
2
3
4
5
6
Communication
9637 RS-232C Cable (9 pin-9 pin/1.8 m, cross cable)
9642 LAN Cable
Carrying Case
C1009 Carrying Case (Bag)
C1001 Carrying Case (Soft)
C1002 Carrying Case (Hard)
7
8
9
10
Appx. Ind.
3
Page 10
Safety Information
Safety Information
This instrument is designed to conform to IEC 61010 Safety Standards, and has been thoroughly
tested for safety prior to shipment. However, using the instrument in a way not described in this
manual may negate the provided safety features.
Before using the instrument, be certain to carefully read the following safety notes.
DANGER
Mishandling during use could result in injury or death, as well as damage to the
instrument. Be certain that you understand the instructions and precautions in the
manual before use.
WARNING
With regard to the electricity supply, there are risks of electric shock, heat
generation, re, and arc discharge due to short circuits. Individuals using an
electrical measuring instrument for the rst time should be supervised by a
technician who has experience in electrical measurement.
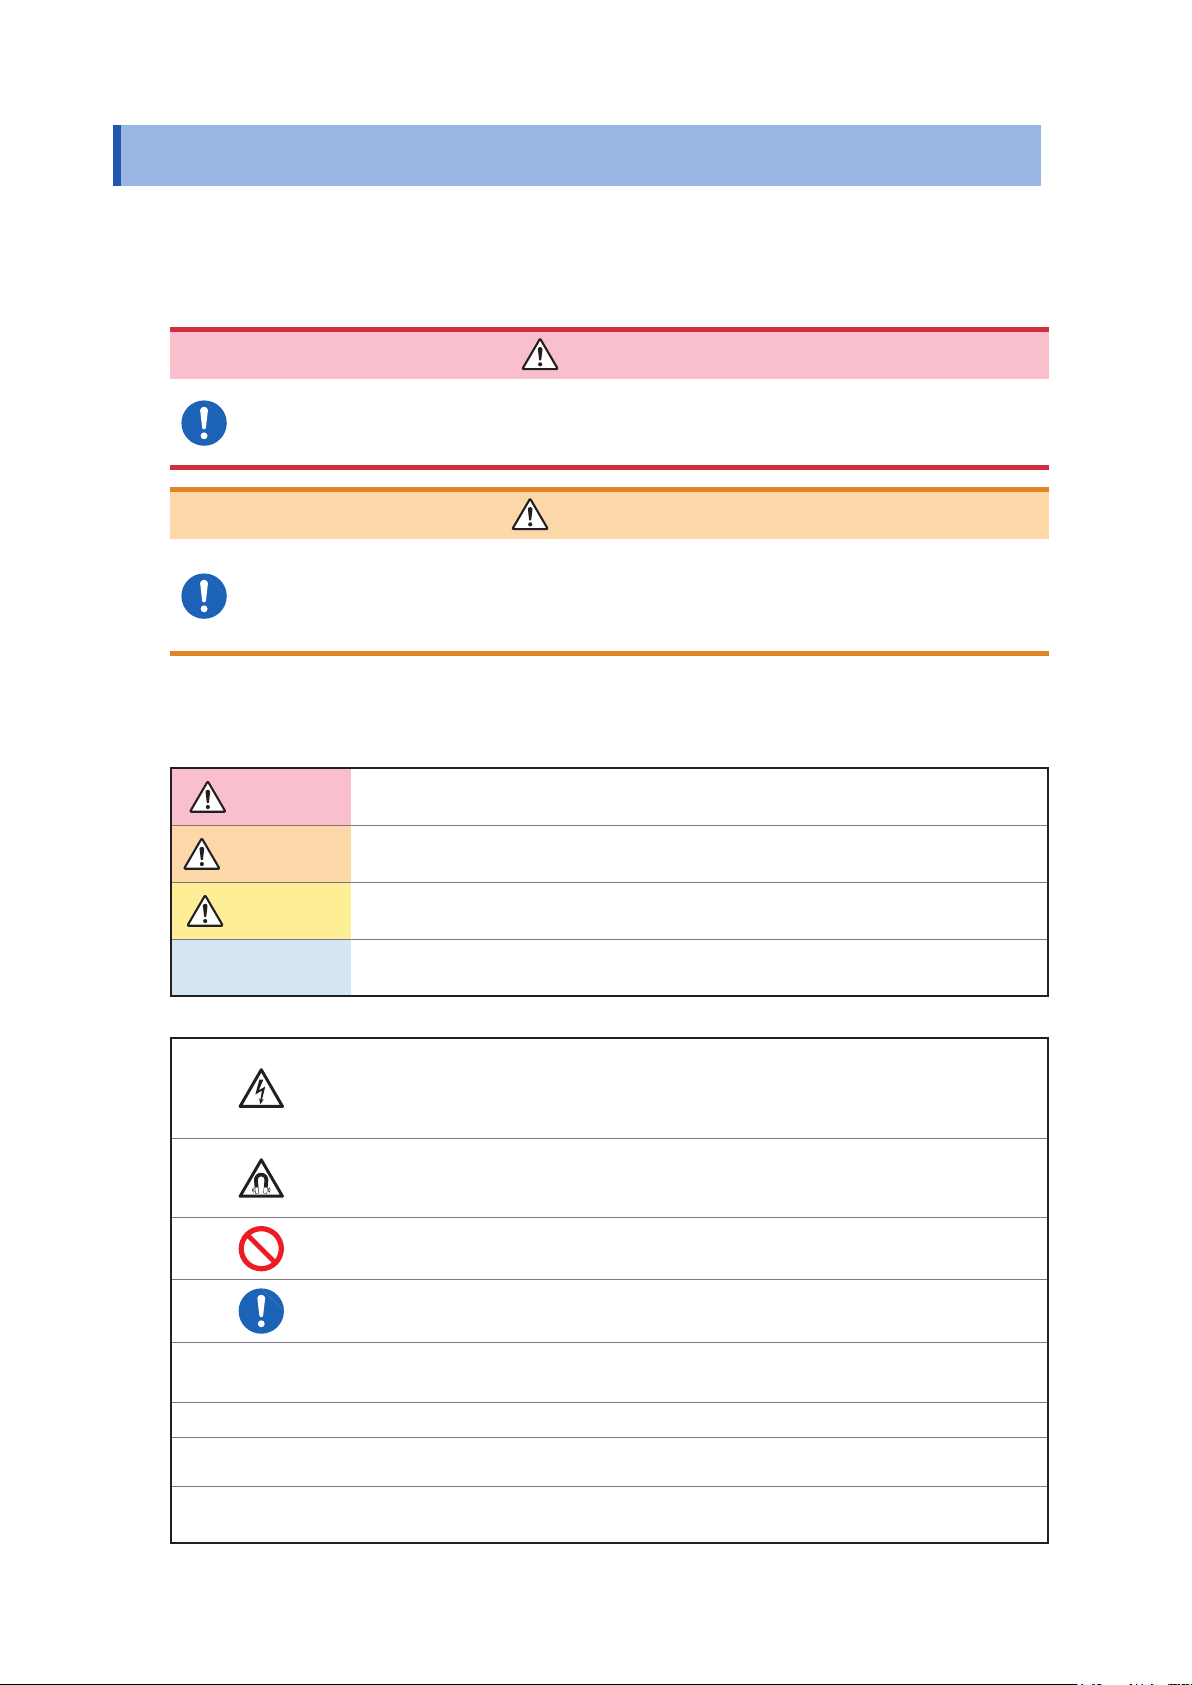
Notation
In this document, the risk seriousness and the hazard levels are classied as follows.
DANGER
WARNING
CAUTION
IMPORTANT
Indicates an imminently hazardous situation that will result in death or serious injury
to the operator.
Indicates a potentially hazardous situation that may result in death or serious injury to
the operator.
Indicates a potentially hazardous situation that may result in minor or moderate injury
to the operator or damage to the instrument or malfunction.
Indicates information related to the operation of the instrument or maintenance tasks
with which the operators must be fully familiar.
Indicates a high voltage hazard.
If a particular safety check is not performed or the instrument is mishandled, this may
give rise to a hazardous situation; the operator may receive an electric shock, may
get burnt or may even be fatally injured.
Indicates a strong magnetic-eld hazard.
The effects of the magnetic force can cause abnormal operation of heart pacemakers
and/or medical electronics.
Indicates a prohibited action.
Indicates the action which must be performed.
MONITOR
(Bold character)
[ ] Operation keys are displayed in brackets ([ ]).
*
(Available after the
rmware update)
Names on the screen are displayed in bold characters.
Additional information is presented below.
This function is not available with the present rmware. This function will be available
after the rmware version update scheduled in May, 2017.
4
Page 11
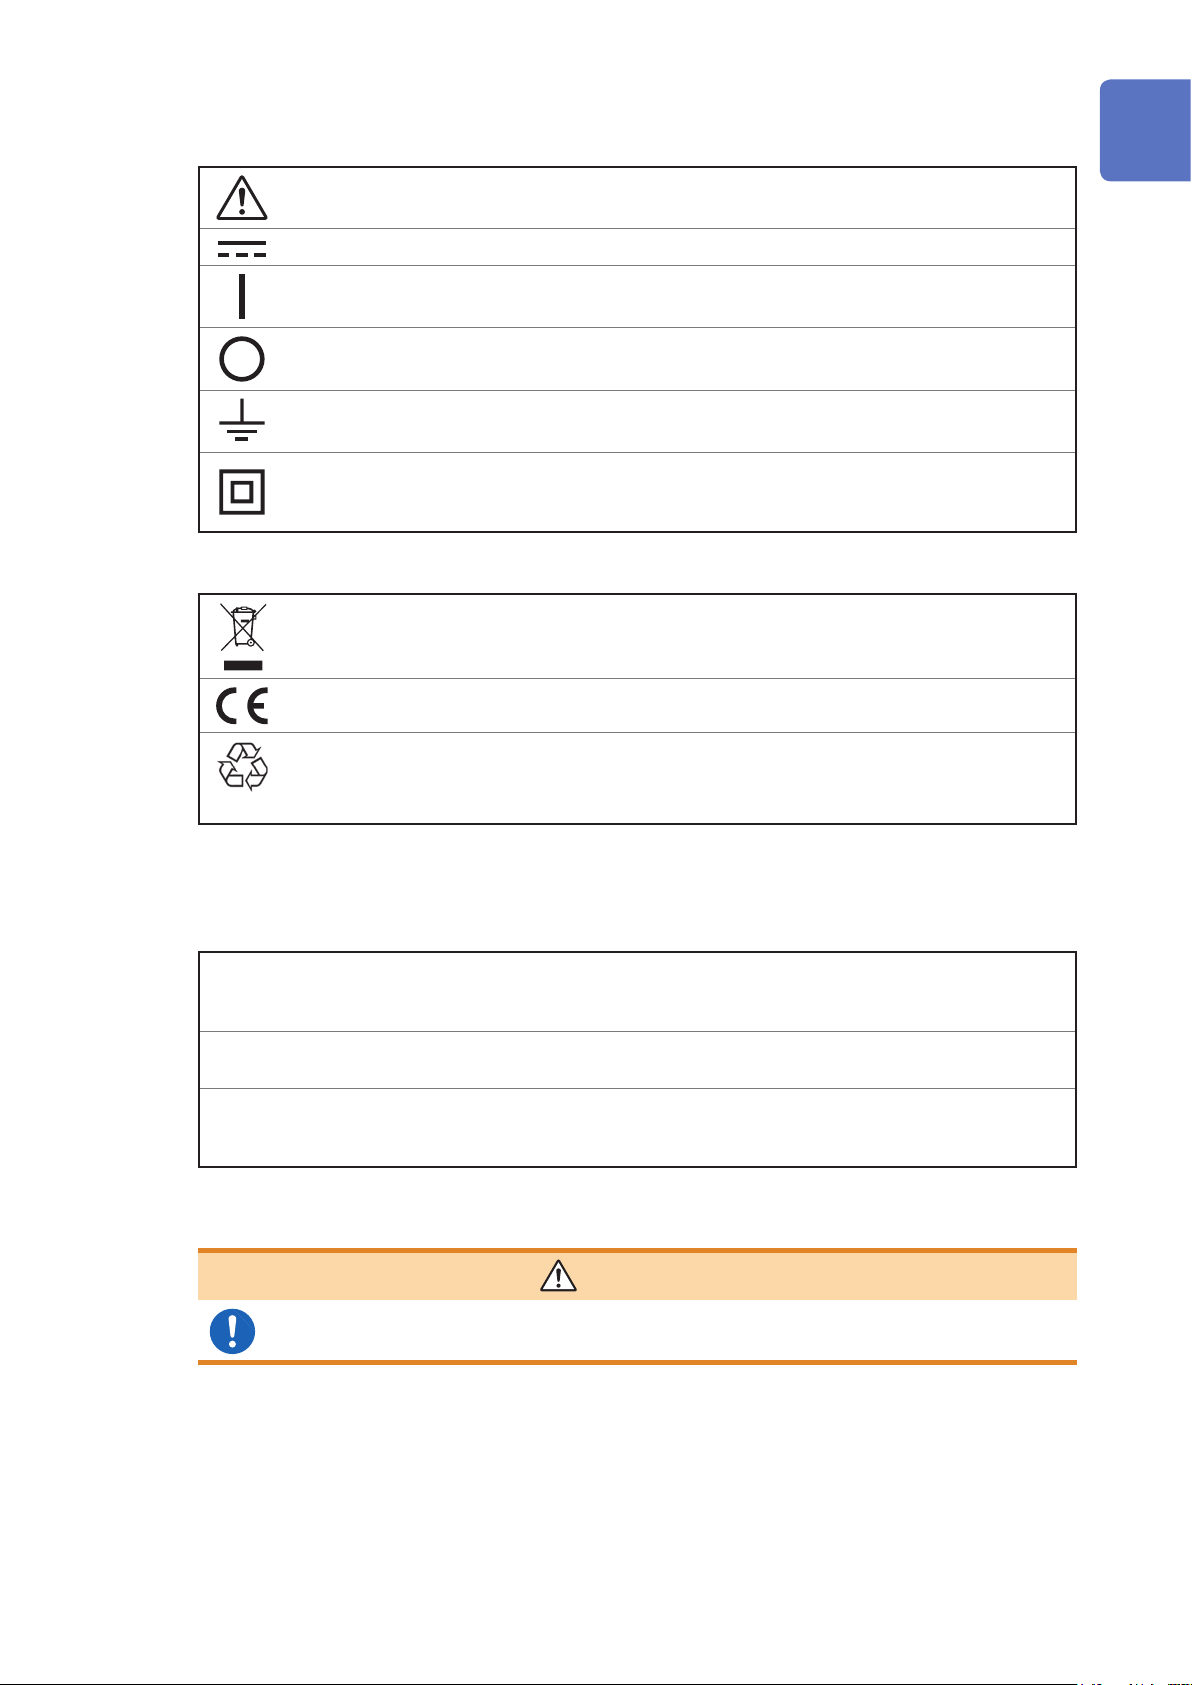
Symbols on the instrument
Indicates cautions and hazards. When the symbol is printed on the instrument, refer to a
corresponding topic in the Instruction Manual.
Safety Information
Indicates DC (Direct Current).
Indicates the ON side of the power switch.
Indicates the OFF side of the power switch.
Indicates a grounding terminal.
Indicates an instrument that has been protected throughout by double insulation or reinforced
insulation.
(9243 Grabber Clip)
Symbols for various standards
Indicates the Waste Electrical and Electronic Equipment Directive (WEEE Directive) in EU
member states.
Indicates that the product conforms to regulations set out by the EC Directive.
This is a recycle mark established under the Resource Recycling Promotion Law (only for Japan).
Ni-MH
1
2
3
4
5
Accuracy
We dene measurement tolerances in terms of f.s. (full scale), rdg. (reading) and dgt. (digit) values,
with the following meanings:
(maximum display value, range)
f.s.
rdg.
dgt.
Protective gear
The maximum value that can be displayed. This is usually the name of the currently selected
range.
(reading or displayed value)
The value currently being measured and indicated on the measuring instrument.
(resolution)
The smallest displayable unit on a digital measuring instrument, i.e., the input value that
causes the digital display to show a “1” as the least-signicant digit.
WARNING
This instrument measures live lines. To prevent electric shock, use appropriate
protective insulation and adhere to applicable laws and regulations.
6
7
8
9
10
Appx. Ind.
5
Page 12
Safety Information
Measurement categories
To ensure safe operation of measuring instruments, IEC 61010 establishes safety standards
for various electrical environments, categorized as CAT II to CAT IV, and called measurement
categories.
DANGER
• Using a measuring instrument in an environment designated with a higher-
numbered category than that for which the instrument is rated could result in a
severe accident, and must be carefully avoided.
• Never use a measuring instrument that lacks category labeling in a CAT II to CAT
IV measurement environment. Doing so could result in a serious accident.
The instrument conforms to the safety requirements for CAT III 1000 V, CAT IV 600 V measuring
instruments.
CAT II: When directly measuring the electrical outlet receptacles of the primary electrical circuits
in equipment connected to an AC electrical outlet by a power cord (portable tools,
household appliances, etc.).
CAT III: When measuring the primary electrical circuits of heavy equipment (xed installations)
connected directly to the distribution panel, and feeders from the distribution panel to
outlets.
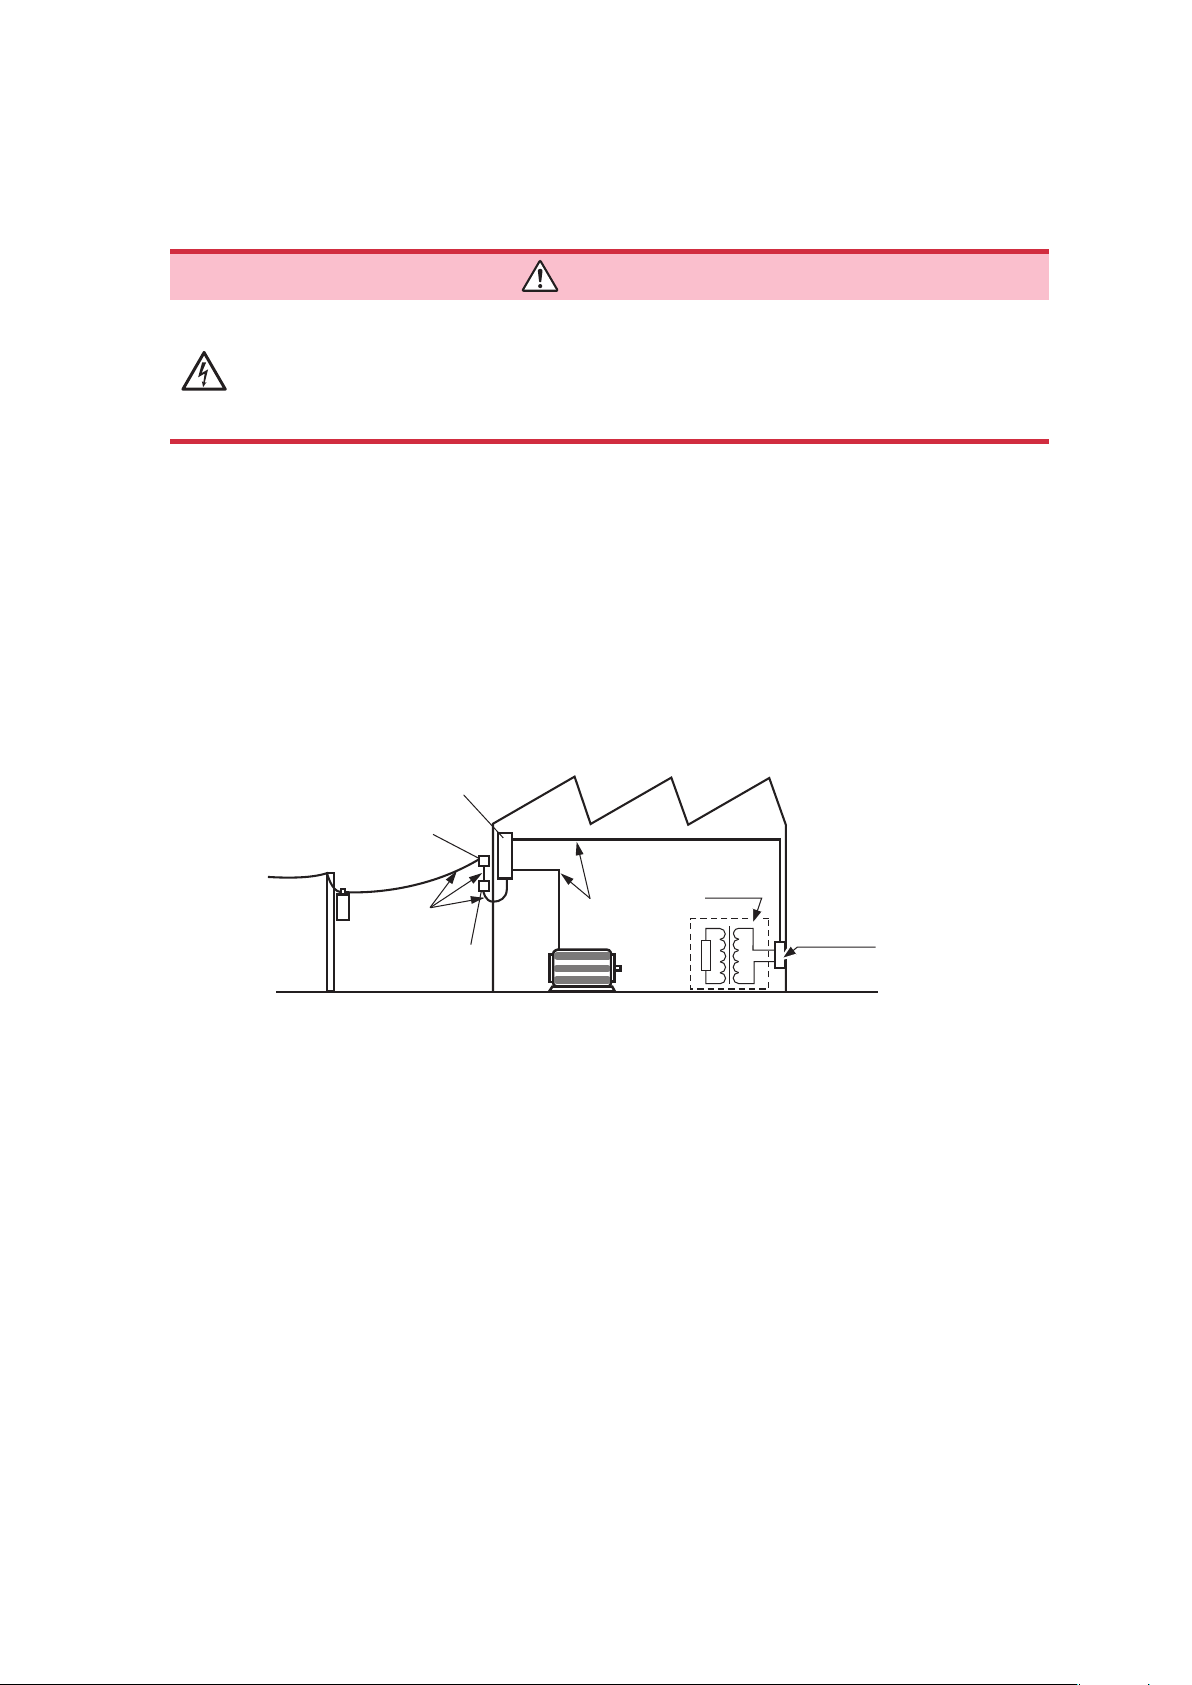
CAT IV: When measuring the circuit from the service drop to the service entrance, and to the
power meter and primary overcurrent protection device (distribution panel).
Distribution Panel
Service Entrance
Service Drop
CAT IV
Power Meter
Internal Wiring
CAT III
Fixed Installation
CAT II
T
Outlet
6
Page 13
Operating Precautions
Operating Precautions
Follow these precautions to ensure safe operation and to obtain the full benets of the various
functions.
Preliminary Checks
Before using the instrument, verify that it operates normally to ensure that no damage occurred
during storage or shipping. If you nd any damage, contact your authorized Hioki distributor or
reseller.
DANGER
1
2
To prevent an electric shock, conrm that the white portion (insulation layer) inside
the cable is not exposed. If a color inside the cable is exposed, do not use the
cable.
Installation Environment
Installing the instrument in inappropriate locations may cause a malfunction of
instrument or may give rise to an accident. Avoid the following locations:
• Exposed to direct sunlight or high temperature
• Exposed to corrosive or combustible gases
• Exposed to a strong electromagnetic eld or electrostatic charge
• Near induction heating systems (such as high-frequency induction heating
systems and IH cooking equipment)
• Susceptible to vibration
• Exposed to water, oil, chemicals, or solvents
• Exposed to high humidity or condensation
• Exposed to high quantities of dust particles
3
4
WARNING
5
6
7
CAUTION
Do not place the instrument on an unstable table or an inclined place. Dropping or
knocking down the instrument can cause injury or damage to the instrument.
Handling the Instrument
CAUTION
To avoid damage to the instrument, protect it from physical shock when transporting and
handling. Be especially careful to avoid physical shock from dropping.
This instrument may cause interference if used in residential areas.
Such use must be avoided unless the use takes special measures to reduce electromagnetic emissions to
prevent interference to the reception of radio and television broadcasts.
8
9
10
Appx. Ind.
7
Page 14
Operating Precautions
Handling Cords and Cables
If the insulation on a cord or cable melts, the metal conductor may be exposed. Do
not use any cord or cable whose metal conductor is exposed. Doing so could result
in electric shock, or other hazard.
The cord and cable are hardened under the 0 degree or colder environment. Do not bend
or pull them to avoid tearing their shield or cutting them.
Using Voltage Cords
To prevent an electric shock, conrm that the white portion (insulation layer) inside
the cable is not exposed. If a color inside the cable is exposed, do not use the
cable.
DANGER
CAUTION
DANGER
WARNING
• Use only the specied voltage cords. Using a non-specied cord may result in
electric shock or short circuits.
• Avoid contact between the cord and the measured line in order to protect the
cord from damage. Any contact can cause the instrument to malfunction and lead
to short-circuits or electric shock.
8
Page 15
Using Battery Pack
• To avoid the possibility of explosion, do not short circuit, disassemble or
incinerate battery pack. Battery may explode if mistreated. Handle and dispose of
batteries in accordance with local regulations.
• Be sure to observe the following precautions. Incorrect handling may result in
liquid leaks, heat generation, ignition, bursting and other hazards.
• The battery pack contains lye, which may cause blindness if it comes into
contact with the eyes. Should battery liquid get into your eyes, avoid rubbing
them. Flush them with water and seek immediate medical attention.
• When storing the instrument, make sure no objects that could short-circuit the
connectors are placed near them.
• For battery operation, use only the HIOKI Model Z1003 Battery Pack. We do not
take any responsibility for accidents or damage related to the use of any other
batteries.
• To avoid electric shock, turn off the power switch, disconnect all the power and
voltage cords and current sensor from the device to be measured, and replace
the battery pack.
• To prevent the instrument damage or electric shock, use only the screws
(M6×12 mm) for securing the battery cover in place that are originally installed.
If you have lost any screws or nd that any screws are damaged, please contact
your Hioki distributor for a replacement.
Operating Precautions
WARNING
1
2
3
4
5
CAUTION
• Observe the following to avoid damage to the instrument.
• Use the battery pack in an ambient temperature range of 0°C to 50°C and charge it in
an ambient temperature range of 10°C to 35°C.
• If the battery pack fails to nish charging within the stipulated time, disconnect the AC
adapter to stop charging and contact your dealer or Hioki representative.
• Consult your dealer or nearest service station should liquid leaks, strange odor, heat,
discoloration, deformation and other abnormal conditions occur during use, charging
or storage. Should these conditions occur during use or charging, turn off and
disconnect the instrument immediately.
• Do not expose the instrument to water and do not use it in excessively humid
locations or locations exposed to rain.
• Do not expose the instrument to strong impact and do not throw it around.
• Heed the following instructions to avoid battery pack performance drop or leakage.
• The battery pack is a consumable. If you are able to use the instrument for only a limited period of time
despite the battery pack being properly charged, the battery pack’s service life is at an end, and it should be
replaced.
• When a battery pack that has not been used for a long time is used, charging may end before the battery
pack is fully charged. In such a case, repeat charging and discharging a number of time before use. (A
battery pack may also be in such a state immediately after purchase.)
• The life of the battery pack (when capacity is 60% or more of initial capacity) is approximately 500 chargedischarge cycles. (The life differs depending on the conditions of use.)
• To prevent battery pack deterioration when the battery will not be used for 1 month or longer, remove it and
store it in a dry location with an ambient temperature range of between −20°C to 30°C.
• When a battery pack is used, the instrument turns off automatically when the capacity drops. Leaving the
instrument in this state for a long time may lead to over discharge so be sure to turn off the power switch on
the instrument.
• The charging efciency of the battery pack deteriorates at high and low temperatures.
• The battery pack is subject to self-discharge. Be sure to charge the battery pack before initial use. If the
battery capacity remains very low after correct recharging, the useful battery life is at an end.
6
7
8
9
10
Appx. Ind.
9
Page 16
Operating Precautions
Attaching the Strap
Attach the strap securely at 2 locations of the instrument. If insecurely attached, the
instrument may fall and be damaged when carrying.
Using SD Memory Cards
• Do not remove a card while data is being written to it. Doing so may damage the card.
See “10.10 Removing SD Memory Card during Recording” (p. 127).
• Exercise care when using such products because static electricity could damage the SD
card or cause malfunction of the instrument.
IMPORTANT
•
Format the card with the instrument. Using a computer to format the card may reduce the
card’s performance.
See “10.9 Formatting SD Memory Card (Deleting All Files)” (p. 126).
• No compensation is available for loss of data stored on the SD memory card, regardless of the
content or cause of damage or loss. Be sure to back up any important data stored on an SD
memory card.
• Observe the following to avoid corruption or loss of stored data:
• Do not touch the electrical contacts on the card or inside the insertion slot with your skin or
metallic objects.
• While writing or reading data, avoid vibration or shock, and do not turn the power off or
remove the card from the instrument.
• Before formatting (initializing) a card, conrm that it contains no important information (les).
• Do not bend or drop the card, or otherwise subject it to intense shock.
CAUTION
CAUTION
• The operating lifetime of the SD memory card is limited by its ash memory. After long-term or frequent
usage, data reading and writing capabilities will be degraded. In that case, replace the card with a new one.
• If you are unable to write data to an SD memory card, manipulate folders and les, or format the card, check
the position of the write-protect lock and disengage it if necessary.
The connector of the SD memory card is used to judge whether the card is write-protected.
If the write-protected lock is in an intermediate position, the determination of whether the card is writeprotected will depend on the connector. For example, even if the instrument determines that the card is
not write-protected and allows data to be written to it, a computer may determine that it is write-protected,
preventing data from being written to it.
10
Page 17
Using AC Adapter
• Use only the supplied Model Z1002 AC ADAPTER. AC adapter rated input voltage
range is 100 to 240 V AC at 50/60 Hz. To avoid electrical hazards and damage to
the instrument, do not apply voltage outside of this range.
• Turn the instrument off before connecting the AC adapter to the instrument and
to AC power.
• To avoid electrical accidents and to maintain the safety specications of this
instrument, connect the power cord provided only to an outlet.
Avoid using an uninterruptible power supply (UPS) or DC/AC inverter with rectangular
wave or pseudo-sine-wave output to power the instrument. Doing so may damage the
instrument.
Operating Precautions
WARNING
1
2
CAUTION
3
Turning On the Instrument
Before turning the instrument on, make sure the supply voltage matches that
indicated on its power connector. Connection to an improper supply voltage may
damage the instrument and present an electrical hazard.
• Do not connect the supply voltage improperly. Doing so may damage the instrument’s
internal circuitry.
• If the power does not turn on, the AC adapter or the instrument may be malfunctioning
or the power cord may be disconnected. Contact your authorized Hioki distributor or
reseller.
• If an error during the self-test, the instrument is damaged. Contact your authorized Hioki
distributor or reseller.
Using Magnetic Adapter
Persons wearing electronic medical devices such as a pacemaker should not use
the Magnet Adapter. Such persons should avoid even proximity to the Magnet
Adapter, as it may be dangerous. Medical device operation could be compromised,
presenting a hazard to human life.
WARNING
CAUTION
DANGER
4
5
6
7
8
9
10
CAUTION
Do not bring the Magnet Adapter near magnetic media such as oppy disks, magnetic
cards, pre-paid cards, or magnetized tickets. Doing so may corrupt and may render
them unusable. Furthermore, if the Magnet Adapter is brought near precision electronic
equipment such as computers, TV screens, or electronic wrist watches, they may fail.
Appx. Ind.
11
Page 18
Operating Precautions
Wiring
• Do not short-circuit two wires to be measured by bringing the metal part of the
voltage cord clips or current sensor tips into contact with them. Doing so could
result in a severe accident such as arcing.
• To prevent electrical shock and personal injury, do not touch any input terminals
on the VT (PT), CT or the instrument when they are in operation.
• Do not use the instrument with circuits that exceed its ratings or specications.
Doing so may damage the instrument or cause it to become hot, resulting in
bodily injury.
• To avoid electric shock, be careful to avoid shorting live lines with the voltage
cords.
• We recommend measurements at the secondary side of the distribution
panel. Measurements at the primary side cause unrestricted current ow. The
instrument and equipment could be damaged if a short circuit occurs.
• To avoid short circuit or electric shock, do not touch the metal parts of the
voltage cords or current sensor tips.
DANGER
CAUTION
• To avoid damaging the instrument, do not short the voltage cord input terminals or
current sensor input terminals or input any voltage to them.
• To ensure safe operation, use only the voltage cord and current sensor specied by
Hioki.
Displayed values can frequently uctuate due to induction potential even when no voltage is applied. This,
however, is not a malfunction.
Using USB Connector (USB Cable)
CAUTION
• To avoid equipment failure, do not disconnect the USB cable while communications are
in progress.
• Use a common ground for both the instrument and the computer. Using different ground
circuits will result in a potential difference between the instrument’s ground and the
computer’s ground. If the USB cable is connected while such a potential difference
exists, it may result in equipment malfunction or failure.
• If the instrument and computer are both off and connected with the USB cable, turn on the computer and
then the instrument. Powering up the devices in a different order may prevent the instrument and computer
from communicating.
• Copying large data les from the SD memory card to a computer via the instrument’s USB interface can be
time-consuming. When you need to copy a large data le to a computer, it is recommended to use an SD
memory card reader.
12
Page 19
Connecting the Instrument to an External Device
CAUTION
• Use a common ground for both the instrument and the computer. Using different ground
circuits will result in a potential difference between the instrument’s ground and the
computer’s ground. If the communications cable is connected while such a potential
difference exists, it may result in equipment malfunction or failure.
• Before connecting or disconnecting any communications cable, always turn off the
instrument and the computer. Failure to do so could result in equipment malfunction or
damage.
• After connecting the RS-232C cable, tighten the screws on the connector securely.
Failure to secure the connector could result in equipment malfunction or damage.
Using External I/O Terminals
WARNING
To avoid electric shock or damage to the equipment, always observe the following
precautions when connecting to external terminals or connectors.
• Always turn off the power to the instrument and to any devices to be connected
before making connections.
• Be careful to avoid exceeding the ratings of external terminals and connectors.
• During operation, a wire becoming dislocated and contacting another conductive
object can be serious hazard. Use screws to secure the external connectors.
Operating Precautions
1
2
3
4
5
CD precautions
• Exercise care to keep the recorded side of discs free of dirt and scratches. When writing text on a disc’s
label, use a pen or marker with a soft tip.
• Keep discs inside a protective case and do not expose to direct sunlight, high temperature, or high humidity.
• Hioki is not liable for any issues your computer system experiences in the course of using this disc.
6
7
8
9
10
Appx. Ind.
13
Page 20

Operating Precautions
14
Page 21
1
Overview
1.1 Procedure for Investigating Power Quality
By measuring power quality parameters, you can assess the power quality and identify the causes
of various power supply malfunctions. The ability of the instrument to measure all power quality
parameters simultaneously makes this process a quick and simple one.
The following is the description of the investigation process for the power quality.
Step 1: Clarifying the purpose
To nd the cause for the power supply malfunction
A power supply malfunction such as an equipment failure or malfunction has occurred and
you wish to address it quickly.
Go to Step 2 (p. 16).
To assess power supply quality (power quality)
There is no known problem with the power supply, and you just want to assess the power
quality.
• Periodic power quality statistical investigation
• Testing after the installation of electric or electronic equipment
• Load investigation
• Preventive maintenance
1
Overview
Go to Step 3 (p. 16).
Step 2: Identifying the malfunctioning component (measurement
location)
Check the following:
(1) Where is the issue occurring?
• Principal electrical system
Large copier, uninterruptible power supply, elevator, air compressor, air conditioning compressor,
battery charger, cooling system, air handler, time-controlled lighting, variable-speed drive, etc.
• Electric distribution system
Conduit [electrical conduit] damage or corrosion, transformer heating or noise, oil leak, circuit
breaker operation or overheating
(2) When does the issue occur?
• Does it occur continuously, regularly, or intermittently?
• Does it occur at a specic time of the day or on a specic day of the week?
(3) What type of investigation (measurement) should be performed to nd the cause?
• Measure the voltage, current (power) continuously to analyze voltage and current trends when
the issue occurs.
• Concurrent measurements at more than one location
Examples:
• Dedicated systems lines in the electrical substation (can be measured only by the power
companies)
• High-voltage and low-voltage lines of the service entrance
• Distribution panels and switchboards
• Power feeder and outlets of power supply for electric and electronic equipment
15
Page 22
Procedure for Investigating Power Quality
(4) What is the expected cause?
• Abnormal voltage
RMS value trends, waveform distortion, transient overvoltage
• Abnormal current
Leakage current, inrush current
Step 3: Checking investigation (measurement) locations (collecting
site data)
Collect information (site data) from as many locations as possible to prepare for the investigation.
Check the following:
(1) Wiring
1P2W / 1P3W /
3P3W2M / 3P3W3M / 3P4W
3P4W2.5E (available after the
rmware update)
(3) Frequency
50 Hz/60 Hz
(5) Current capacity
Current capacity is required to
select current sensors used for
the measurements.
(2) Declared input voltage
100 V to 800 V
(4) Is the voltage between the neutral line and ground,
and neutral line current required to be measured?
If the measurements are required, CH4 of the wiring settings
should be set to ON. See p. 48, and p. 64.
(6) Other items related to the whole facility
• Other systems causing power supply malfunctions
• Principal electrical system operating cycle
• Any additions or changes to facility equipment
• Check of the power distribution system in the
facilities
Step 4: Making measurements with the power quality analyzer (measurement procedure)
Measurements are performed using the following procedure:
16
Preparations
Attach accessories and optional equipment required for the measurements to the Power
Quality Analyzer.
See “2 Preparing for Measurement” (p. 35).
Measurement settings/Connections/Wiring*
Congure the conditions required for the measurements and connect voltage cord and
current sensors to the instrument.
Connect the wires to the measuring object and check if there is any mistake.
See “Installation Environment” (p. 7) and “4 Wiring (WIRING Screen)” (p. 47).
Recording settings/Event settings*
Page 23
Congure the conditions and events required for recording.
If the EVENT indicator on the screen (p. 32) frequently changes to red, too many events
have occurred.
When the number of events reaches 9999 during recording/measurement, subsequent
events will not be recorded (trend recording continues). Adjust the event settings as
required.
See “5 Setting Change (SET UP Screen)” (p. 63).
Measured value check
Press the [MONITOR] key, and use the MONITOR screen to check if there is any problem
with the values measured.
See “6 Verifying the Waveform, Measured Values (MONITOR Screen)” (p. 81).
Recording start*
Press the [START/STOP] key to start recording.
See “7 Recording (Save) (SET UP Screen)” (p. 91).
Analysis/Actions
Procedure for Investigating Power Quality
1
Overview
Continue recording for the period necessary for the analysis, check the state of the power
supply malfunction based on the detected events.
Check while recording
Check after recording is
stopped
Next, take the preventive measures for the power supply malfunction.
(The instrument is effective not only for the power supply investigation but also to check
after taking the measures for the power supply malfunction.)
“8 Verifying the Trends (Fluctuations) in Measured
Values (TREND Screen)” (p. 95), and “9 Checking
Events (EVENT Screen)” (p. 105).
“11 Analysis (with Computer)” (p. 129)
*: Use “Quick Set” for easy and secure setting, and recording start!
The Quick Set allows easy and secure procedure for setting and recording start by following the
navigation of the instrument.
The event settings also allows typical setting by only selecting the menu.
(Menu: Voltage events, Inrush current, Trend record only, EN50160)
See “3 Quick Set” (p. 45), supplied Measurement Guide.
17
Page 24

Procedure for Investigating Power Quality
Advice for identifying the cause of abnormalities
Record voltage and current trends at the power circuit inlet.
If the voltage drops while the building’s current consumption rises, the likely cause for power
abnormality lies inside the building. If the voltage and current are both low, the cause is likely to lie
outside the building.
It’s extremely important to select the right measurement locations and measure current for
troubleshooting.
Check power trends.
Overloaded equipment can cause problems. By understanding power trends, you can more easily
identify problematic equipment and locations.
See “8 Verifying the Trends (Fluctuations) in Measured Values (TREND Screen)” (p. 95).
Check when the problem occurs.
Equipment that is operating or turning on or off when events (abnormalities) are recorded may be
the cause of malfunction. By understanding the precise times at which events start and stop, you
can more easily identify problematic equipment and locations.
See “9 Checking Events (EVENT Screen)” (p. 105).
Check for heat and unusual sounds.
Motors, transformers, and wiring may produce heat or unusual sounds due to causes such as
overloading or harmonics.
18
Page 25
Product Overview
1.2 Product Overview
The PQ3100 Power Quality Analyzer is a measuring instrument used to manage power quality and
identify abnormalities of the power line to analyze the cause of the trouble.
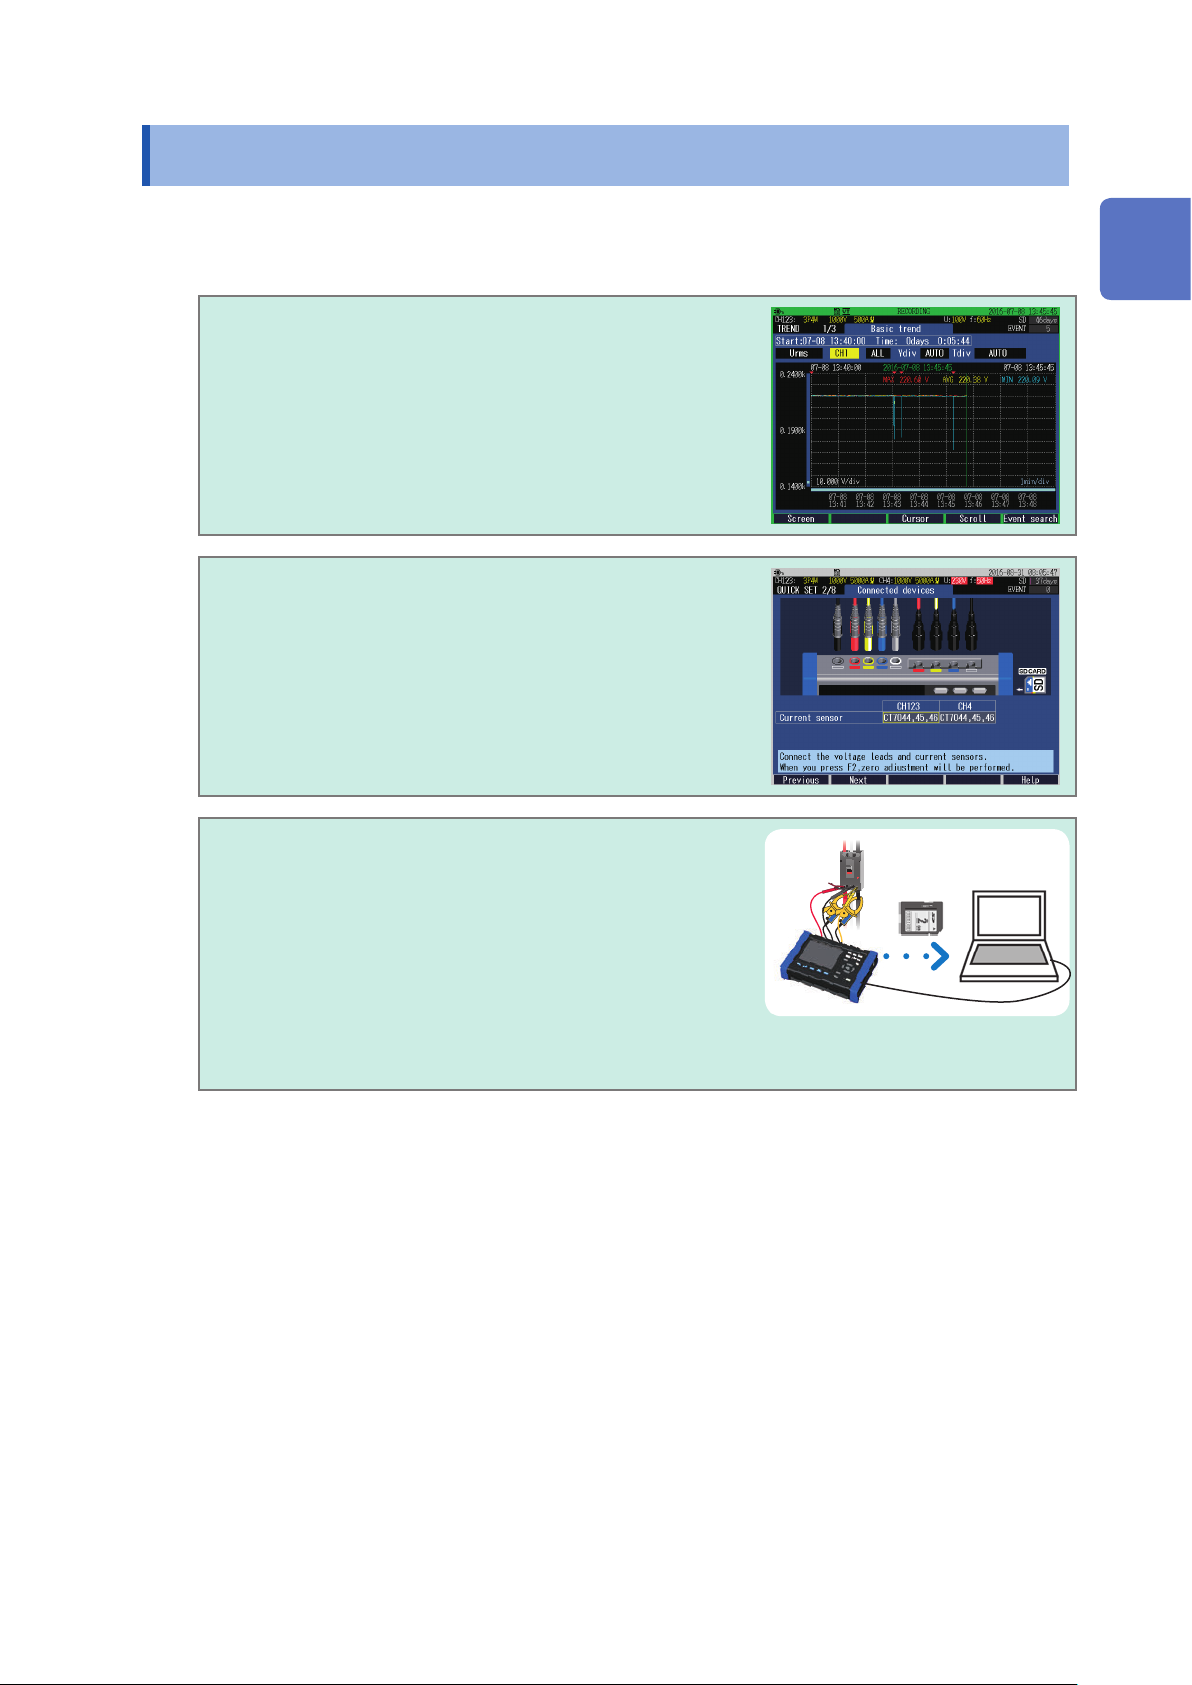
All parameters can be recorded
simultaneously.
Trends and power abnormalities (events) of all parameters
can be recorded simultaneously.
The instrument guides the procedures.
The Quick Set function allows proper and easy item
settings and connections required for measurements by
following the steps.
1
Overview
See “3 Quick Set” (p. 45), Measurement Guide (provided
separately).
Data can be easily analyzed and reported.
The data loaded to a computer can be easily analyzed and
reported with the supplied software.
See “11 Analysis (with Computer)” (p. 129) and “12 Communications (USB/LAN/RS-232C)”
(p. 137).
19
Page 26

Features
1.3 Features
Long-term event waveform
recording
DC (Direct Current)
measurements
Easy and secure
Wiring check
Easy analysis and reporting
of data
Safety
High accuracy
4 voltage channels
4 current channels
Transient measurements
Waveforms for up to 11.2 s when event occurs (1 s before event, 0.2 s on
event, 10 s after event) can be saved for power abnormality analysis.
DC voltages can be measured. AC/DC Auto Zero Sensor allows DC current
measurements.
The Quick Set allows easy operations by following the steps for secure
measurements.
Continuous calculation without a gap also allows simultaneous measurements
of all the parameters required for the power quality measurements to securely
identify the phenomenon.
Checks the wiring state. If the instrument has been connected improperly, tips
for correct connections will be displayed by the help function.
The supplied software PQ One allows easy analysis and reporting of the data.
Compatible with CAT III 1000 V and CAT IV 600 V
Voltage measurement accuracy of ±0.2% rdg.
Complies with the IEC61000-4-30 Class S international power quality standard
Measurements for voltage between neutral line and ground, and neutral line
current are available for 3-phase 4-wire wiring.
Transient measurements for 5 kHz to 40 kHz, up to 2200 V
3-channel simultaneous
∆V10 icker measurement
Simultaneous measurement
of line voltage and phase
voltage for 3-phase
Extensive lineup of current
sensors
Ability to operate for about
8 hours on battery power
Broad operating
temperature range
Saving to SD memory cards
TFT color LCD
Communications
functionality
(Available after the rmware update)
3-channel simultaneous ∆V10 icker measurement is available.
For 3-phase 3-wire 3-watt meter measurement (3P3W3M) and 3-phase 4-wire
measurement (3P4W), both line voltage and phase voltage are measured and
output.
Line voltage or phase voltage, whichever is selected, is displayed.
You can choose the best current sensors for your measurement application
ranging from leakage currents to a maximum rating of 6,000 A.
The instrument can feed the power to both Flexible Current Sensor and AC/
DC Auto-Zero Sensor enabling you to make long-term measurements without
worrying about the power supply.
Even when AC power is not available, the supplied battery pack can be used
for about 8 hours of measurement.
Operating temperature range is from −20°C to 50°C.
However, the operating temperature range is from 0°C to 50°C when Battery
Pack is used.
Data can be continuously recorded to an optional 2 GB or an 8 GB memory
card for up to one year.
The instrument uses an LCD that is easy to see in both dim and bright
conditions.
The instrument includes standard USB and Ethernet interfaces to connect a
computer for the following operations.
• To congure the instrument using a computer.
• To download data from the instrument to the computer.
• To operate the instrument remotely.
See “12 Communications (USB/LAN/RS-232C)” (p. 137).
20
Page 27
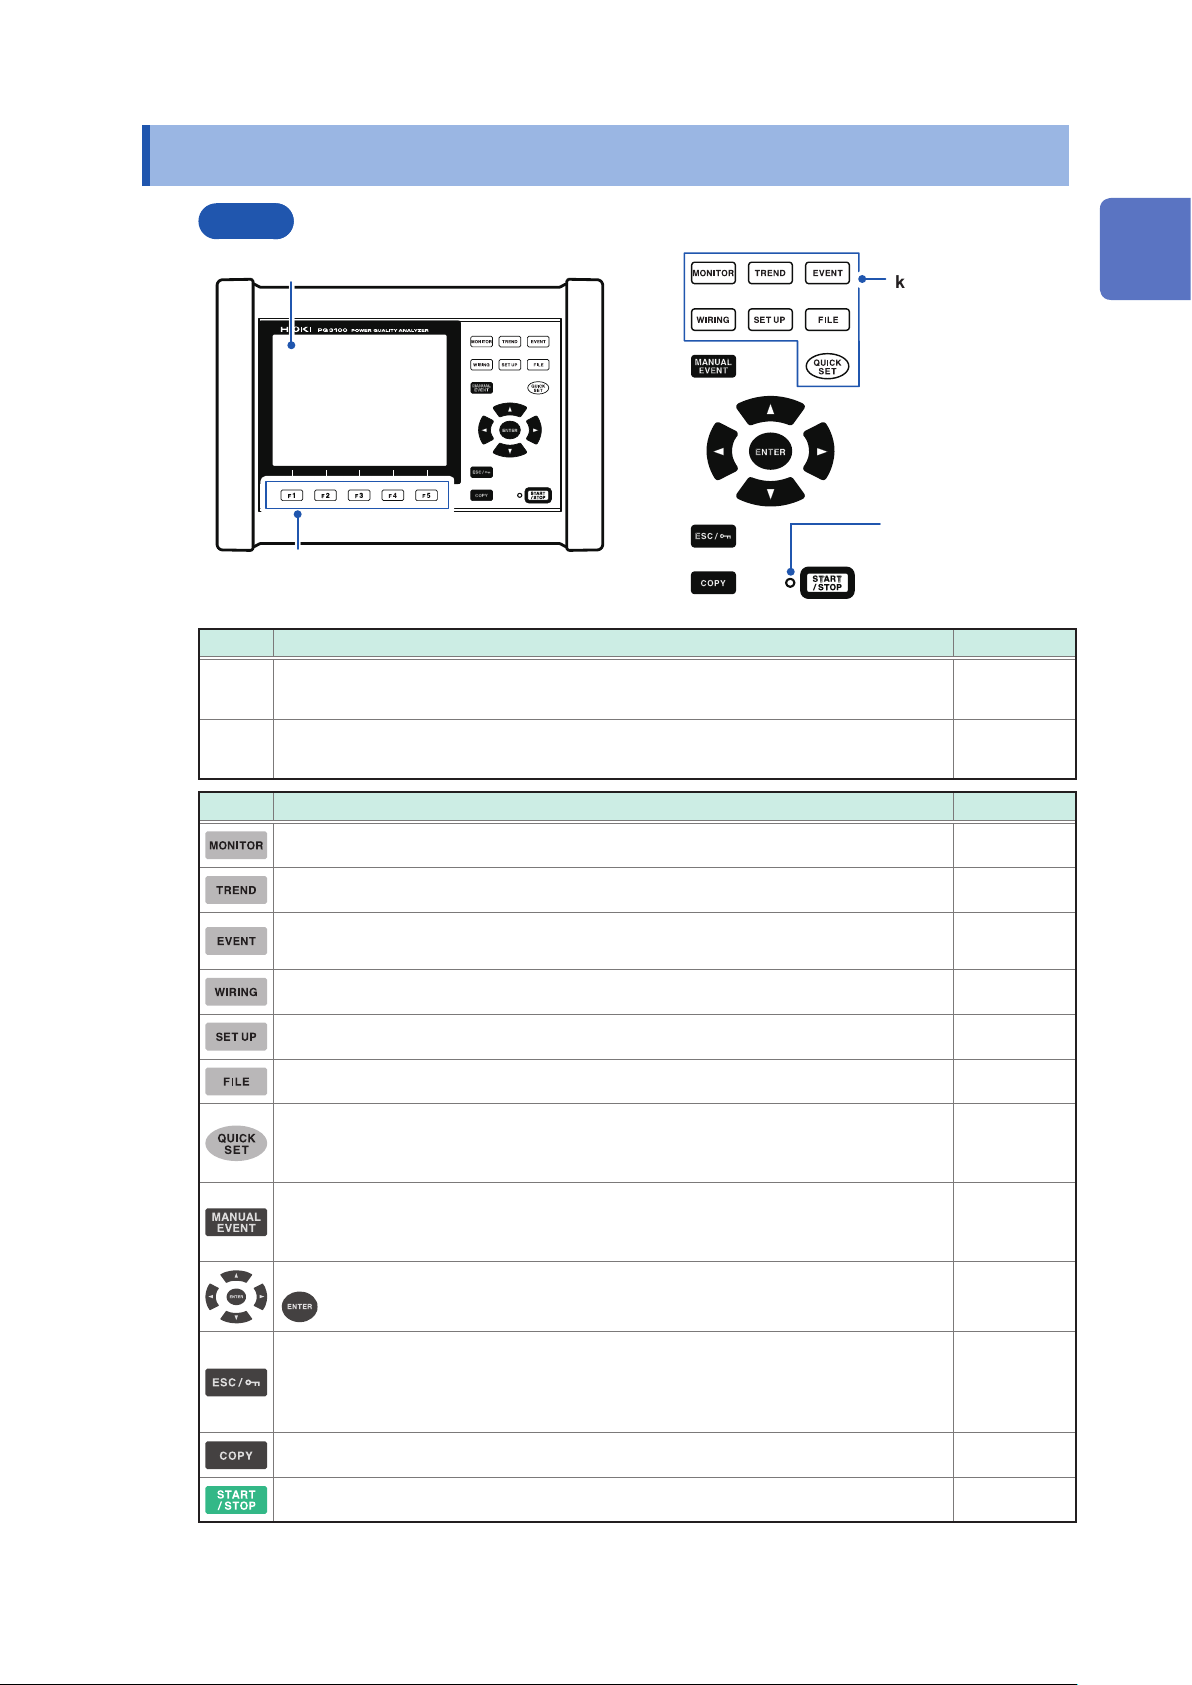
1.4 Names and Functions of Parts
Names and Functions of Parts
Front
1
2
No. Name and description Reference
Display
1
6.5″ TFT color LCD
Function key ([F1] to [F5] key)
2
Select and change display contents and settings.
Operation keys
Screen switching
key
START/STOP LED
Flashing green: When
in the recording
standby state
Solid green: When
recording
p. 24
—
1
Overview
Keys Description Reference
Displays and changes the MONITOR screen (waveform and measured values). p. 81
Displays and changes the TREND screen (time series trend graphs). p. 95
Displays and changes the EVENT screen (event status).
(Version upgrade supported for switching)
Displays and changes the WIRING screen (wiring settings, wiring check). p. 47
Displays and changes the SET UP screen (settings). p. 63
Displays and changes the FILE screen (SD memory card/internal memory). p. 115
Displays and changes the QUICK SET screen.
Pressing this key during recording allows checking the current main settings.
An event occurs at the timing when this key is pressed during recording.
The voltage and current waveforms and measured values when an event occurs
are recorded.
Moves the cursor on the screen. Scrolls through graphs or waveforms.
: Selects items on the screen and accepts changes.
Cancels any selections or changes made and reverts to the previous settings.
Switches to the previous screen.
Pressing and holding this key for at least 3 s activates the key lock function. (Same
operation for unlock)
p. 105
p. 45
Measure-
ment Guide
—
—
—
Outputs the image of the currently displayed screen to the SD memory card. p. 121
Starts and stops recording. p. 91
21
Page 28
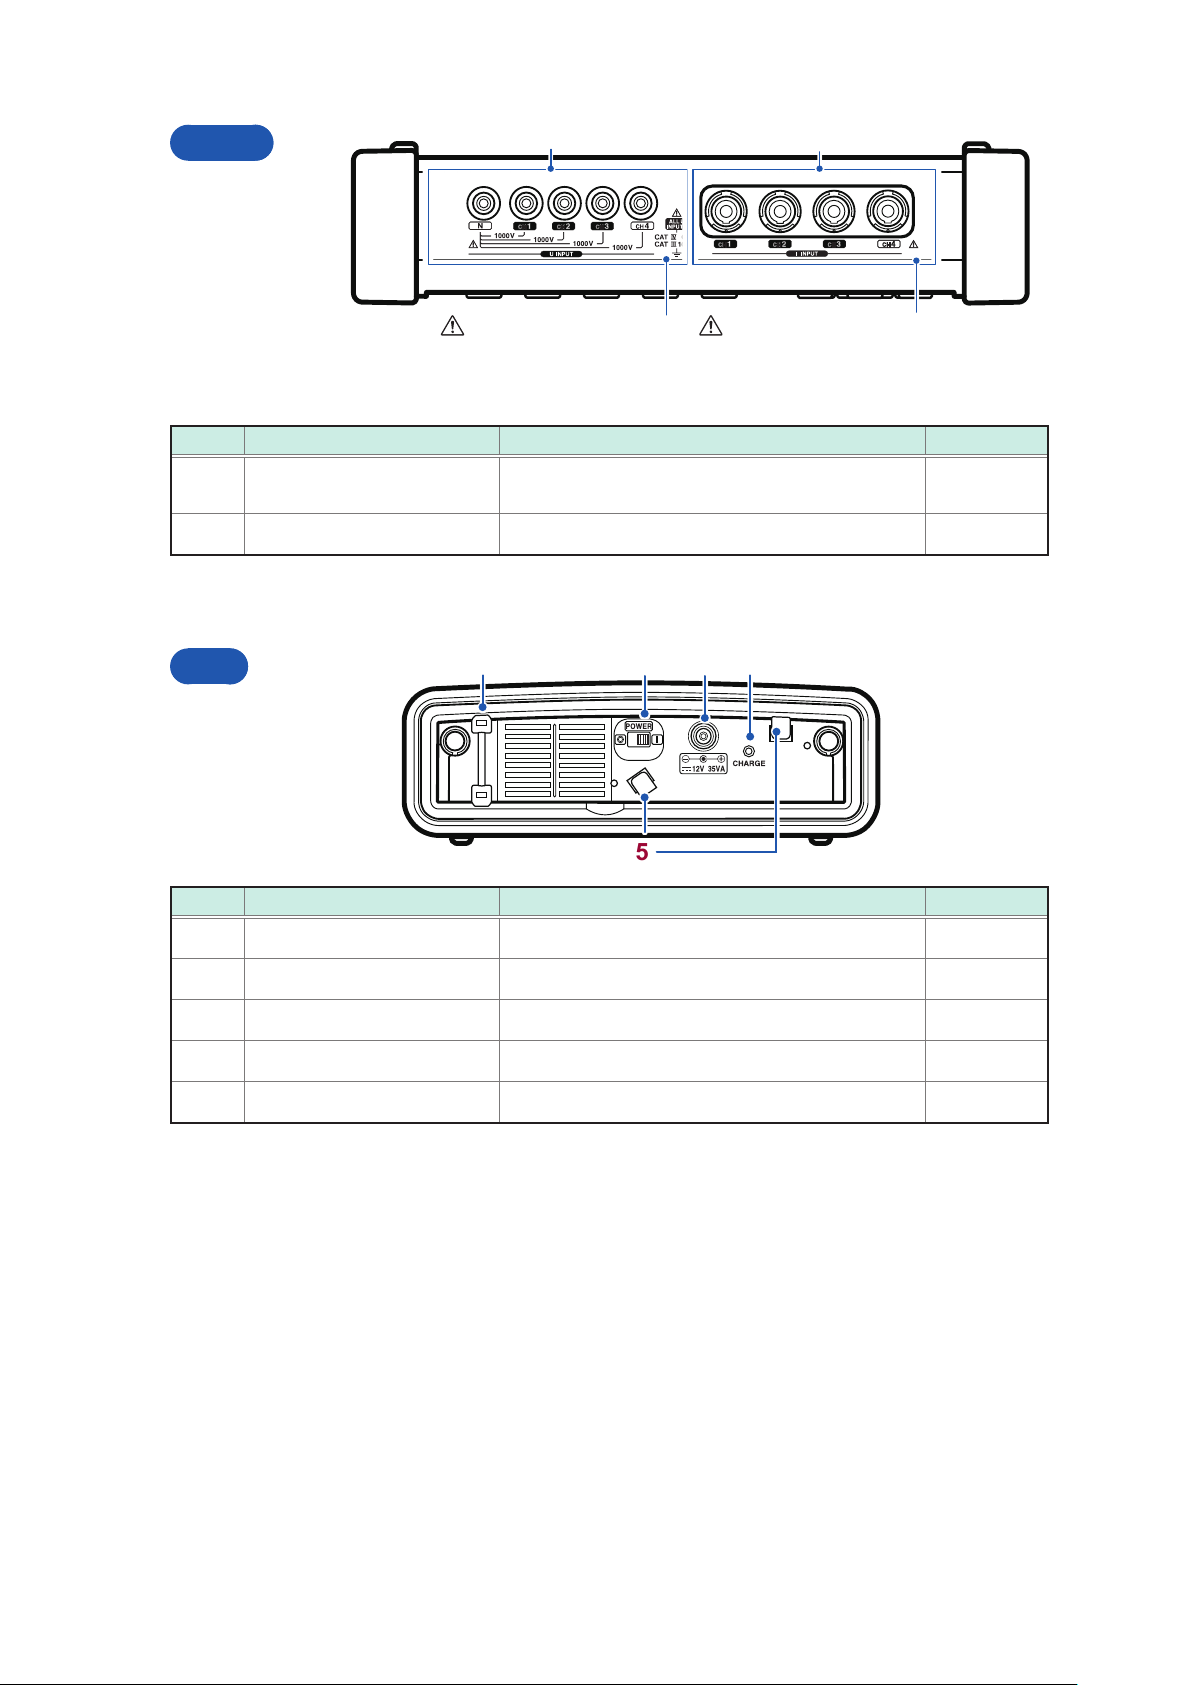
Names and Functions of Parts
Upper
“4.3 Connecting Voltage
Cords to Instrument”
(p. 51)
No. Name Description Reference
Voltage input terminal
1
Current input terminal Connects optional current sensors. p. 52
2
Left
1
“4.4 Connecting Current
Sensors and Conguring
Current Sensor Settings”
(p. 52)
Connects supplied L1000-05 voltage cord to one of
the jacks.
3 4
21
2
p. 51
5
No. Name Description Reference
Strap eyelet Attaches the strap. p. 39
1
POWER Switch Turns the instrument on and off. p. 44
2
AC adapter connection jack Connects the AC adapter. p. 43
3
CHARGE LED Lights up when the Z1003 Battery Pack is charging. p. 38
4
Hook for AC adapter Loops the AC adapter cord through these hooks. p. 43
5
22
Page 29
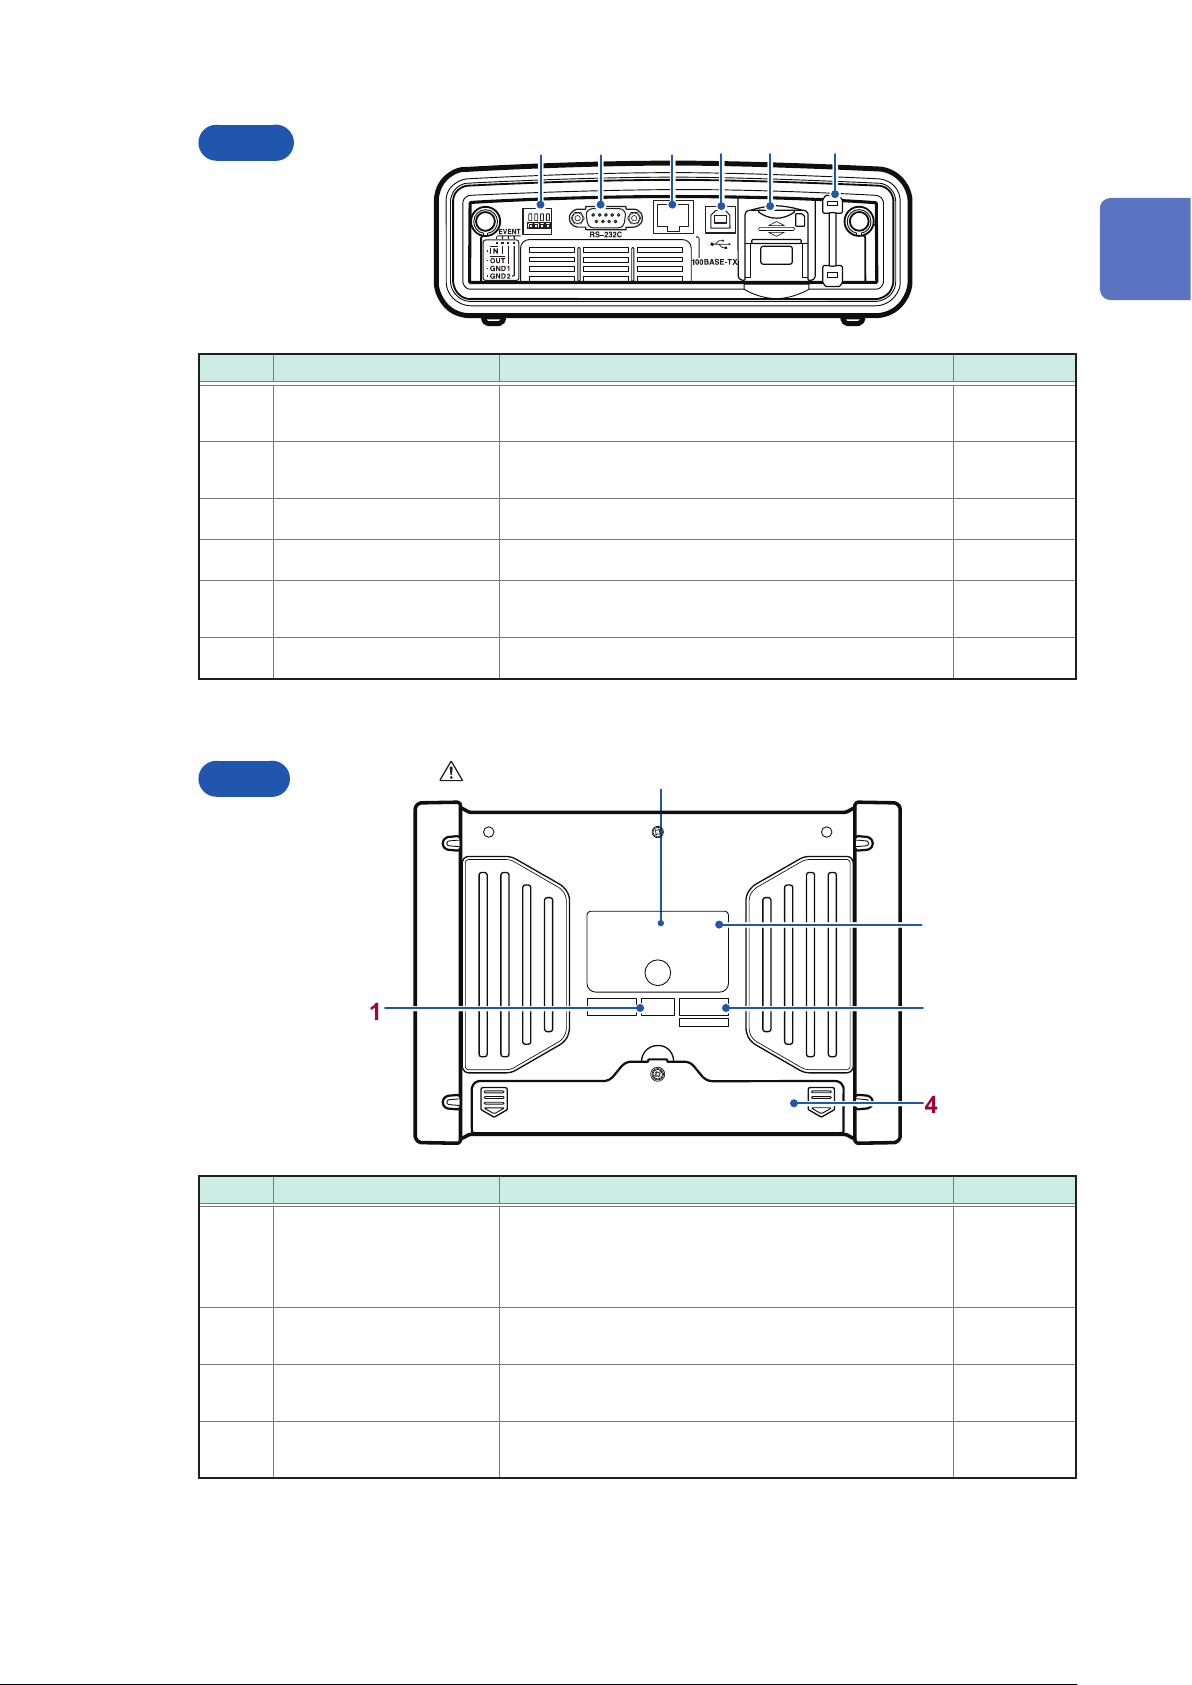
Names and Functions of Parts
5 6
Right
No. Name Description Reference
External I/O terminals
1
1 2 3
Uses commercially available wires to connect with
external devices.
4
p. 147
1
Overview
2
3
4
5
6
Back
RS-232C interface
LAN interface Connects to a computer using the LAN cable. p. 138
USB port Connects to a computer using the supplied USB cable. p. 131
SD memory card slot
Strap eyelet Attaches the strap. p. 39
Connects to a computer using the optional RS-232C
cable.
Inserts an SD memory card. Be sure to close the cover
when recording.
“Installing the battery pack” (p. 38)
p. 145
p. 42
2
1
3
4
No. Name Description Reference
Displays the instrument’s unique MAC address. This
MAC address label
1
Label
2
Serial No.
3
Battery compartment
4
address is used when conguring a LAN connection.
Do not remove the label as the information is
necessary for managing the device.
Indicates the warning, CE mark, KC mark, WEEE
Directive mark, and manufacturer.
Do not remove the label as the information is
necessary for managing the device.
Installs the supplied Z1003 Battery Pack within the
compartment.
p. 138
—
—
p. 38
23
Page 30
Screen Conguration
1.5 Screen Conguration
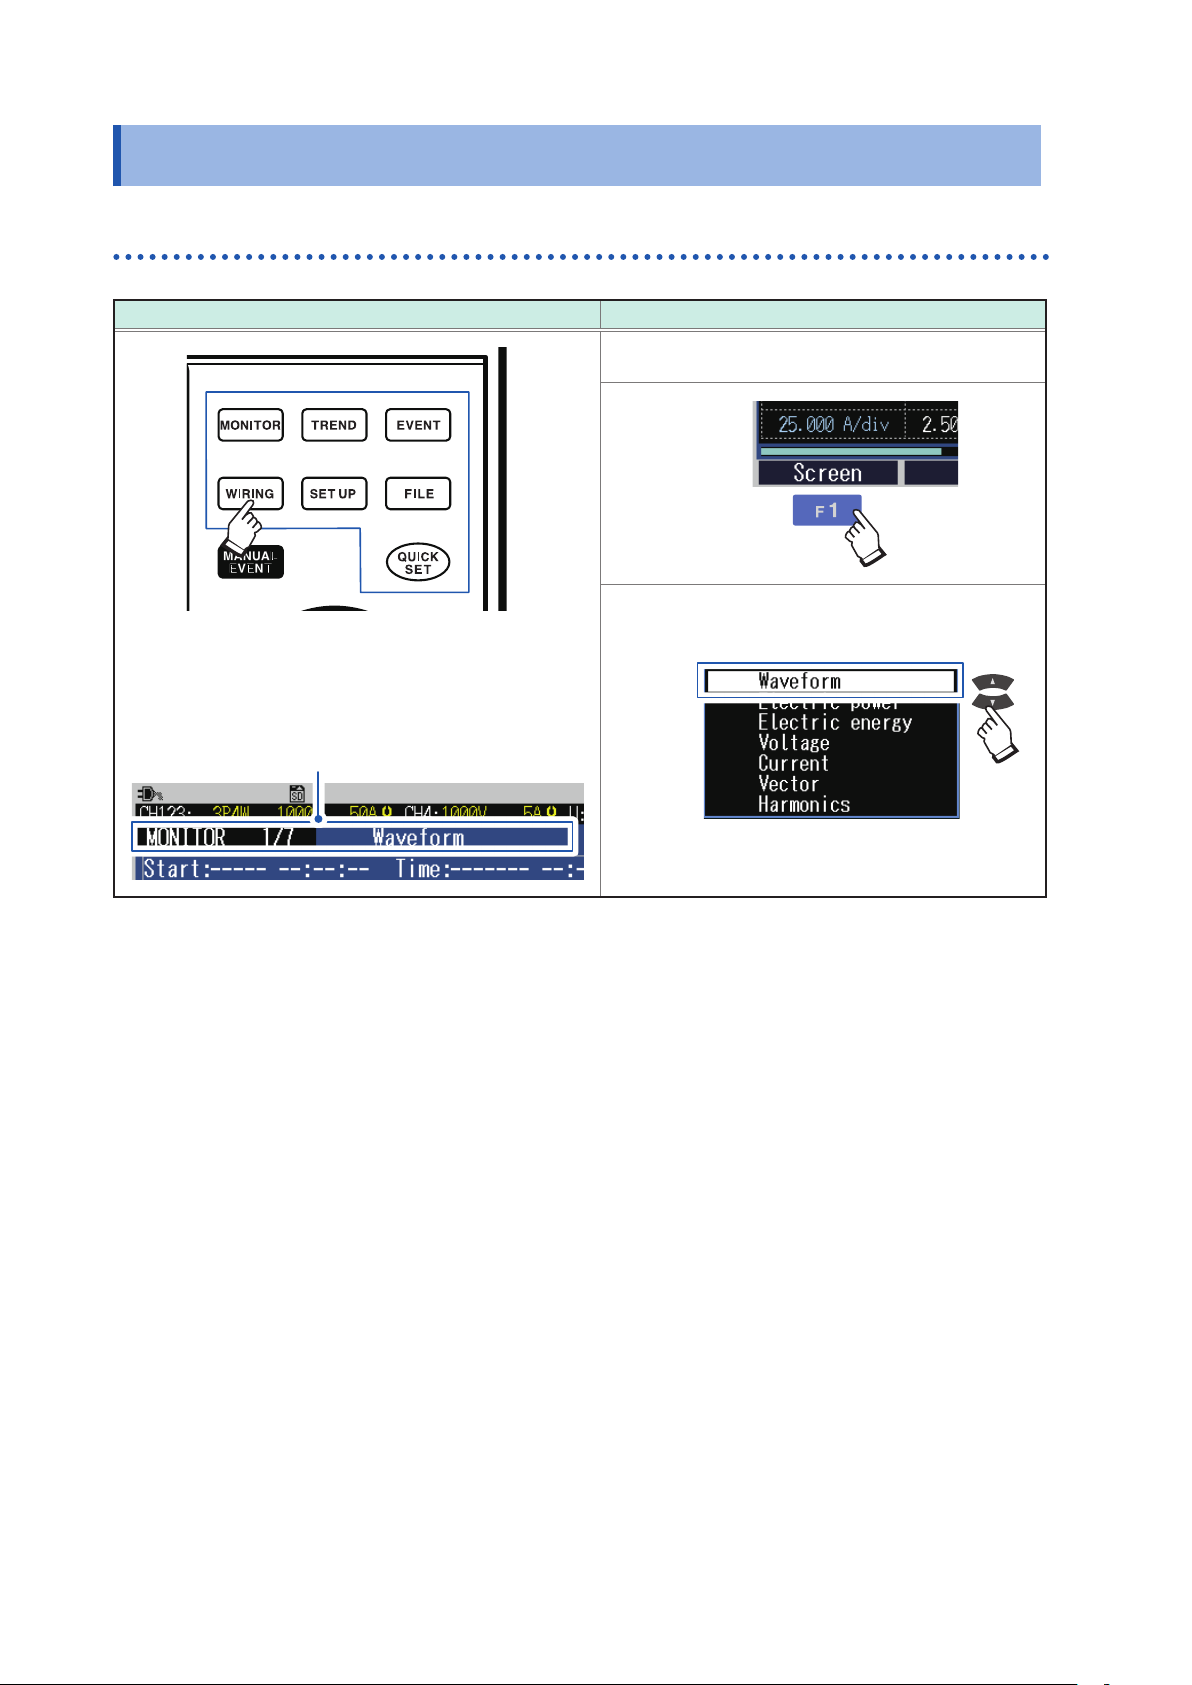
Displaying and switching screens
Use operation keys (screen switching key) Use [F1] (SCREEN) key to switch screens
Screen example: MONITOR screen
1
The screens consist of seven screens each of which
corresponds to the operation keys.
The screen corresponding to the key pressed is displayed.
The screen can be switched by pressing the key
repeatedly.
Screen name
2
24
Page 31

MONITOR screen
A screen that is used to monitor instantaneous values. This screen is used to view voltage and
current instantaneous waveforms, and the measured values.
Screen Conguration
Display/switch screen: [MONITOR] key
See “6 Verifying the Waveform, Measured Values (MONITOR Screen)” (p. 81).
Waveform screen
Voltage and current waveforms of CH1 to
CH4 are displayed.
Electric power screen
RMS voltage, RMS current, frequency, power, power
factor, active energy (consumption) and elapsed time are
displayed.
Electric energy screen
Electric energy, energy cost, start time, stop time,
elapsed time, power and power factor are displayed.
Voltage screen
Measured values related to voltage are displayed.
Current screen
Measured values related to current are displayed.
Vector screen
Phase relationship between voltage and current is
displayed in a vector diagram.
1
Overview
Harmonics screen
Harmonic current, harmonic voltage, and harmonic
power from 0 to 50th order are displayed.
Zoom screen (available after the rmware
update)
Enlarged view of 6 user-selected parameters are
available.
25
Page 32

Screen Conguration
TREND screen
A screen used to check the trend (uctuations) of the measured values.
Display/switch screen: [TREND] key
See “8 Verifying the Trends (Fluctuations) in Measured Values (TREND Screen)” (p. 95).
Basic trend screen
This screen is used to check uctuation
width of maximum, minimum and average
values between recording intervals.
Detail trend screen
This screen is used to check uctuation width of
maximum and minimum values between recording
intervals for the following parameters.
• RMS voltage refreshed each half-cycle
• RMS current refreshed each half-cycle
• Inrush current
• Frequency (1 wave)
Electric energy screen
This screen is used to check electric energy trends for
each recording interval.
Demand screen (available after the rmware
update)
This screen is used to check demand trends.
Harmonics trend screen (available after the
rmware update)
This screen is used to check trends of harmonics and
interharmonics.
Flicker screen (available after the rmware
update)
This screen is used to check trends of IEC icker or
∆V10 icker.
26
Page 33

EVENT screen
A screen used to check the event status.
Screen Conguration
Display/switch screen: [EVENT] key
See “9 Checking Events (EVENT Screen)” (p. 105).
Event list screen
Events can be checked on the list.
The events are sorted in the order of
occurrence.
EVENT MONITOR screen: See p. 111.
1
Overview
Event statistics screen
(available after the rmware update)
This screen is used to check the statistical
results for each event type.
WIRING screen
A screen used to check the wiring settings.
Display/switch screen: [WIRING] key
See “4 Wiring (WIRING Screen)” (p. 47).
Wiring settings screen
This screen is used to congure the wiring.
Make wiring by checking the wiring diagram.
Wiring check screen
This screen is used to check whether the
instrument has been connected properly.
27
Page 34

Screen Conguration
SET UP screen
A screen used to congure settings.
Display/switch screen: [SET UP] key
See “5 Setting Change (SET UP Screen)” (p. 63).
Measurement settings 1 screen
This screen is used to congure the wiring.
Measurement settings 2 screen
This screen is used to congure settings for calculation
method, energy cost, and icker (available after the
rmware update).
Recording settings screen
This screen is used to congure the settings for
recording.
Event settings 1 screen
This screen is used to congure the event threshold
value and hysteresis for voltage and current.
Event settings 2 screen
This screen is used to congure the timer event, external
event, and event waveform recording time.
System settings screen
This screen is used to congure the clock, beep sound,
language, display color, and phase name.
Interface settings screen
This screen is used to congure the settings for LAN,
RS-232C, and external output.
28
Page 35

FILE screen
A screen used for le operations.
This screen allows listing and operations for les of the SD memory card and internal memory.
Display/switch screen: [FILE] key
See “10 File Saving and Operations (FILE Screen)” (p. 115).
Screen Conguration
1
Overview
SD card screen
This screen shows lists of folders and les in the
SD memory card.
This screen shows lists of folders and les in the
internal memory.
Internal memory screen
QUICK SET screen
Minimum conditions required for recording can be set by following the Quick Set instructions.
Quick Set start: [QUICK SET] key
See “3 Quick Set” (p. 45) and refer to Measurement Guide (provided separately).
Quick Set start dialog
Press the
[ENTER]
key.
29
Page 36

Basic Key Operations
1.6 Basic Key Operations
See “1 Displaying and switching screens” (p. 24).
Changing the required items
1
2
3
4
On the MONITOR screen and the TREND screen, the items can be changed by pressing
the keys
Move the cursor to the item.
The drop down list will be
displayed.
Select an item.
Accept the setting.
without the drop-down list box displayed.
30
Page 37

Entering characters
Basic Key Operations
1
2
3
4
Move the cursor to the item.
A dialog box will be displayed.
: Character selection
: Input
: Delete a character
OK
:
The setting will be accepted.
1
Overview
Cancel
:
The entry will be canceled.
31
Page 38

Screen Display
1.7 Screen Display
18
9
17
8
2
3
4 5 6
7
1 1110 12 13
Actual time
14
16
15
No. Display Description
Gray (no character):
(START/STOP LED: Off)
• Recording is stopped.
• The setting can be changed.
Yellow (WAITING):
(START/STOP LED: Blinking)
• Recording is in standby.
• This screen is shown from the time the
1
Operation
status
[START/STOP] key is pressed until the
recording actually starts.
• During repeated recording, this screen
is also displayed when recording is
stopped.
• The setting cannot be changed.
Green (RECORDING):
(START/STOP LED: On)
• Recording is in progress.
• The setting cannot be changed.
32
Page 39

Screen Display
No. Display Description Reference
The instrument is operating with the AC adapter. p. 43
2
3
4
5
6
7
8
9
The instrument is running on the battery. p. 38
The instrument is running on the battery, which is almost out of charge.
(Blinking)
(Black)
(Blue)
(Black) The SD memory card is inserted and identied.
(Red) The SD memory card is locked. Unlock it.
Connect the AC adapter and charge the battery.
The LAN is connected. p. 138
The HTTP server is connected. p. 143
The key lock is engaged. p. 21
Holding the screen display.
The VT ratio has been set.
The CT ratio has been set.
Wiring, voltage range, and current range for CH1 to CH3.
(Red): No current sensors are connected. Otherwise, the sensors
are erroneously congured. (p. 52)
(Yellow): The current sensors are correctly congured.
p. 38
p. 58
p. 81
p. 42
p. 64
1
Overview
10
11
12
(Black background)
(Green background)
13
MEM
(Black background)
MEM
(Green background)
14
Voltage range and current range for CH4. When CH4 is OFF, no icon is
displayed.
(Red): No current sensor is connected. Otherwise, the sensor is
erroneously congured. (p. 52)
(Yellow): The current sensor is correctly congured.
Declared input voltage.
Measuring frequency (nominal frequency). p. 64
The SD memory card has been inserted in the instrument. p. 42
The SD memory card is being accessed.
As no SD memory card is inserted to the instrument, measured data will
be saved in the instrument’s internal memory.
The shortest recording interval of the internal memory is 2 s. If the
interval is set to 1 s or less, measured data cannot be saved in the
internal memory.
The internal memory is being accessed.
Indicates how much recording time or days remains on the SD memory
card or in the instrument’s internal memory. If the event data is recorded
as well, the actual recording time will become shorter than the displayed
recording time.
The utilization status is indicated with a level meter.
p. 48
p. 64
33
Page 40

Error Screen Display
No. Display Description Reference
(Black background)
No event has been detected.
15
(Red background)
16
Screen name
17
18
F key text Texts of function keys assigned for each screen.
Event IN (detection) state.
Number of events recorded. Up to 9999 events.
The event detection status is indicated with a level meter.
This is the screen name. Select with the key.
[(Present screen number) / (number of screens)] is displayed within the
screen. (See “1.5 Screen Conguration” (p. 24) for details.)
1.8 Error Screen Display
Display Description
If a voltage peak over, i.e., that the peak of the voltage exceeds 2200 V or falls below
−2200V, occurs, the background of the voltage range turns red.
If a voltage overrange, i.e., that the voltage exceeds 1300 V, occurs, the background of
the voltage range turns yellow.
If a current peak over, i.e., that the peak of the current exceeds 400% of the present
range or falls below −400% of it, occurs, the background of the current range turns red.
If a current overrange, i.e., that the current exceeds 130% of the present range, occurs,
the background of the current range turns yellow.
When a voltage value exceeds a certain ratio based on the declared input voltage, the
background color turns any of the following colors:
110% < Yellow
90% ≤ (Regular background color) ≤ 110%
80% ≤ Yellow < 90%
Red < 80%
When the measured value is different from the declared frequency, the background of
the declared frequency turns red.
Measured value became overrange (the measurement is out of measuring range).
The voltage that the instrument is capable of measuring is being exceeded. Immediately
disconnect the instrument.
If the current is overrange, increase the current range.
Measurement is not possible. Shown instead of the measured value.
If there is no input, the power factor cannot be measured.
34
Page 41

2
Preparing for Measurement
Before starting measurement, connect accessories and options to this instrument. Before
performing measurement, be sure to read “Operating Precautions” (p. 7) and to inspect the
instrument, accessories, and options to ensure that there is no damage.
2.1 Preparation Flowchart
2
Follow the procedure for preparation described below. (The items preceded by † need to be
performed only during the rst use.)
†
Initial Measurement Preparations
• Color coding of current sensor (for channel identication) (p. 36)
• Bundling the voltage cords and current sensors (If required) (p. 37)
• Installing the battery pack. (p. 38)
• Attaching the strap (if required) (p. 39)
• Setting the language, clock, and measurement frequency (p. 40)
Pre-Measurement Inspection (p. 41)
Inserting the SD Memory Card (p. 42)
Power Supply (p. 43)
Turning On the Instrument (p. 44)
Preparing for Measurement
Warm-up (p. 44)
• At least 30 min
35
Page 42

Initial Measurement Preparations
2.2 Initial Measurement Preparations
Color coding of current sensor (for channel identication)
Be sure to read “Handling Cords and Cables” (p. 8).
At both the ends of the current sensor cable, connect the spiral tube of the same color as the
channel which is to be connected to the current sensor, to avoid wiring mistakes.
Example: In the case of using 2 current sensors
Required items
Color Spiral tubes
(for color-coding the current sensor)
Current sensor in use × 2
Red (thin) × 2
Yellow (thin) × 2
Connector side
Sensor side
Color Spiral tubes for CH1 (red) Color Spiral tubes for CH2 (yellow)
Measuring object
Single-phase 2-wire (1P2W) 1 (CH1 red)
(Diagram of Model CT7136)
Number of current sensors in use
(Colors of the CH and color spiral tubes)
36
Single-phase 3-wire (1P3W)
2 (CH1 red, CH2 yellow)
3-phase 3-wire (3P3W2M)
3-phase 3-wire (3P3W3M)
3 (CH1 red, CH2 yellow, CH3 blue)
3-phase 4-wire (3P4W)
Page 43

Initial Measurement Preparations
Bundling the voltage cords and current sensors (If required)
Be sure to read “Handling Cords and Cables” (p. 8), “Using Voltage Cords” (p. 8).
If required, group the cables together by using the spiral tubes (black).
Example: In the case of using 3 voltage cords and 2 current sensors
Required items
Spiral tubes (for grouping the cables together)
Black (thick) ×10
Model L1000-05 Voltage Cord ×3
Black
Red
Yellow
CH1 Red
N Black
CH2 Yellow
Model L1000-05 Voltage Cord Current sensor
Red
Black
Yellow
Current sensor in use ×2
CH1 Red
CH2 Yellow
2
Preparing for Measurement
(The model illustrated above is
Model CT7136)
Red
Yellow
37
Page 44

Initial Measurement Preparations
Installing the battery pack
Be sure to read “Using Battery Pack” (p. 9).
The battery pack is subject to self-discharge. Be sure to charge the battery pack before initial use
(See Step 7).
If the battery can only be used for a considerably short time even after correct charging, replace it
with a new battery pack.
Required items
Phillips screwdriver (No. 2)
Turn off the instrument. (p. 44)
1
Turn the instrument over, remove
3
the screws on the primary battery
compartment and remove the cover.
Insert the battery pack in the direction
5
that is indicated by the labeling on the
battery pack.
Be careful not to pinch the wires of the battery
pack.
Model Z1003 battery pack
Remove all cords.
2
Connect the plug of the Model Z1003
4
battery pack to the connector of the
instrument. (Turn the 2 projection
surfaces of the plug to the left and
connect.)
Put the cover and tighten the screws.
6
Projection
7
38
Connect the AC adapter (p. 43) to the
instrument and charge the battery pack.
The battery pack will be charged regardless of
whether the power is ON or OFF.
• The battery pack is used as a backup power supply for the instrument during interruption. When fully
charged, it can provide backup power for approximately 8 hours in the event of an interruption.
• Note that if an interruption occurs while the battery pack is not being used, the displayed time series data will
be erased. (Data that has been recorded on the SD memory card and instrument’s internal memory will be
retained.)
• For more information about the operating temperature and humidity and the storage temperature and
humidity, see “14.1 General Specications” (p. 153).
(Left side surface of the instrument)
CHARGE LED
Solid red During charging
Off Fully charged or when the
battery is not attached
Page 45

Initial Measurement Preparations
Attaching the strap (if required)
Be sure to read “Attaching the Strap” (p. 10).
If required, attach the strap when carrying the instrument or hanging it on a hook at the installed
location.
Pass through the strap eyelet.
1
Pass through the loop.
Pass through the
2
buckle.
3
2
Preparing for Measurement
Tighten the straps securely to avoid loosening or twisting.
39
Page 46

Initial Measurement Preparations
Setting the language, clock, and measurement frequency
When you turn on the instrument for the rst time after purchase, the language setting screen, clock
setting screen, and frequency setting screen will be displayed. Congure these settings.
Similarly, these settings must be congured if a factory reset (p. 77) is performed to reset the
instrument to its default settings.
Turn on the instrument. (p. 44)
1
Select the display language.
2
Move the cursor
Japanese
English
Chinese Simple
Chinese Trad
Korean
German
French
Italian
Spanish
Turkish
Set the date and time.
3
Move the cursor
The seconds cannot be set. If you press the
[Enter] key after changing value, the seconds
will be set to 00.
Once you have set the display language, time, and measurement frequency, this settings screen will not be
shown again when the instrument is turned on.
You can change these settings on the setting screen.
See Display language, time“System Settings” (p. 75), and measurement frequency“SET UP, Measurement
Settings 1 screen” (p. 64).
Change the value
Select the frequency for the measuring
4
object using the function keys.
Move the cursor
The WIRING, wiring setting screen will be
displayed.
40
Page 47

Pre-measurement Inspection
2.3 Pre-measurement Inspection
Before using the instrument, verify that it operates normally to ensure that no damage occurred
during storage or shipping. If you nd any damage, contact your authorized Hioki distributor or
reseller.
(1) Inspect the voltage cords
Is the insulation of the voltage cord damaged,
or is bare metal exposed?
No
(2) Inspect the current sensor
• Is there any crack or damage in the jaw part?
• Is the insulation on the cables torn?
No
(3) Inspect the AC adapter
• Is damage to the AC adapter evident?
• Is the power cord’s insulation damaged?
Yes
Yes
Yes
Do not use if damage is present,
as you could receive an electric
shock.
Contact your authorized Hioki
distributor or reseller.
2
Preparing for Measurement
No
(4) Inspect the instrument
Is the device damaged?
No
Inspection complete
Yes
41
Page 48

Inserting the SD Memory Card
2.4 Inserting the SD Memory Card
Be sure to read “Using SD Memory Cards” (p. 10).
Turn off the instrument. (p. 44)
1
Disengage the lock.
3
Lock key
Open the cover.
2
Insert the SD memory card inside.
4
Arrow
Insert the card horizontally. Inserting the SD
memory card at an angle may cause the writeprotect lock to engage, preventing data from
being written to the card.
Close the cover. How to remove:
5
When storing the data to the SD memory card, congure the recording settings.
See “5.2 Recording Settings” (p. 69).
Open the cover, push in the SD memory
card and then pull it out.
42
Page 49

2.5 Power Supply
Be sure to read “Using AC Adapter” (p. 11).
Required items
Model Z1002 AC adapter
Power Supply
Power OFF
1
2
Connect
(AC adapter + power cord)
Connect
3
Hook
4
AC adapter
Power cord
5
2
Preparing for Measurement
Connect
43
Page 50

Turning On/Off the Instrument
2.6 Turning On/Off the Instrument
Be sure to read “Turning On the Instrument” (p. 11).
Turn on the instrument. After the measurement is complete, always turn off the power.
How to turn on the instrument
Slide the knob of the POWER switch
toward ON ( ) .
How to turn off the instrument
When the instrument is turned on, the Self-test screen will
be displayed.
Version number
Self-test result
After the self-test is complete, the screen that appears
before turning off the instrument will be displayed.
(When the instrument is turned on for the rst time, the
WIRING, wiring settings screen will be displayed.)
Slide the knob of the POWER switch
toward OFF ( ).
2.7 Warm-up
Warm up the instrument before performing the measurement to ensure accurate measurements.
After turning on the instrument, allow it warm-up for at least 30 min.
44
Page 51

3
Quick Set
The Quick Set function allows easy settings for minimum recording/measurement requirements by
following the guidance.
The setting proceeds in the following order: “1. Basic Settings,” “2. Device Connections,” “3. Voltage
Wiring,” “4. Current Wiring,” “5. Wiring Check,” “6. Event Settings,” “7. Recording Settings,” and “8.
Recording Start.”
See the supplied Measurement Guide for details.
3.1 Congurable Items
The items listed below can be congured with the Quick Set.
To congure other items not listed here*, see “3.2 Adding Settings” (p. 46).
*Example:
• Set the VT and CT ratios.
• Change the event settings.
Setting Details
Wiring Congure the wiring.
Current sensor Congure the current sensor.
Declared input voltage Congure the declared input voltage.
Current range Congure the current range.
Easy settings course After this course is selected, event settings and recording interval will be
automatically congured.
Recording interval Congure the recording interval.
Recording start method Congure the recording start method.
Recording stop method Congure the recording stop method.
Folder/File name Congure the folder/ le name.
Clock Congure the clock.
3
Quick Set
45
Page 52

Adding Settings
3.2 Adding Settings
Using the following procedure, normal settings can be applied in combination with the Quick Set to
perform recording as desired:
Press the [QUICK SET] key to start the
1
Quick Set.
Exit the Quick Set without starting a
3
recording.
The Quick Set will be completed. All the setting
that have been congured with the Quick Set
will not be deleted.
Press the [WIRING] key to display the
5
WIRING, Wiring check screen.
Follow the Quick Set to proceed with
2
the operations up to the QUICK SET,
Recording start screen.
Press the [SET UP] key to add settings.
4
Example: Congure the VT ratio or CT ratio,
change the event settings.
See “5 Setting Change (SET UP Screen)”
(p. 63).
Reconrm the wiring and measured
6
values.
7
46
Press the [MONITOR] key as required
to check the measured values on the
MONITOR screen.
See “6 Verifying the Waveform, Measured
Values (MONITOR Screen)” (p. 81).
See “4.9 Checking Wiring” (p. 59).
Press the [START/STOP] key.
8
The recording will start.
Page 53

4
Wiring (WIRING Screen)
4.1 Wiring Procedure
Connect the voltage codes and the current sensors to the instrument according to the following
procedure.
This chapter explains the procedure for wiring without using the Quick Set.
Setting the wiring method and the declared input voltage
“4.2 Wiring Method and Declared Input Voltage Settings” (p. 48)
Connecting the cords and the sensors and
performing the zero adjustment
“4.3 Connecting Voltage Cords to Instrument” (p. 51)
“4.4 Connecting Current Sensors and Conguring Current Sensor Settings” (p. 52)
“4.5 Zero Adjustment” (p. 54)
Connecting the voltage cords to the measuring object
4
Wiring (WIRING Screen)
“4.6 Connecting Voltage Cords to Objects” (p. 55)
Attaching the current sensor to the measuring object
“4.7 Attaching Current Sensors to Objects” (p. 56)
Checking the wiring
“4.9 Checking Wiring” (p. 59)
47
Page 54

Wiring Method and Declared Input Voltage Settings
4.2 Wiring Method and Declared Input Voltage Settings
Press the [WIRING] key to display the WIRING, wiring settings screen.
Sets the wiring method and declared input voltage.
The wiring diagram (p. 50) of the specied wiring mode is displayed.
Voltage value (RMS value)
Current value (RMS value)
1
2
Move the cursor
Select
Active power
Displacement Power Factor
(Fundamental power factor)*
*: DPF (Displacement Power Factor) is displayed as the power
factor irrespective of PF/Q/S calculation method settings
of the SET UP, measurement settings 2 screen in the
WIRING, wiring setting screen.
See “SET UP, Measurement Settings 2 screen” (p. 66),
and “Terminology” (p. Appx.24).
48
Page 55

Wiring Method and Declared Input Voltage Settings
Enables you to select the wiring method for CH1 to CH3, and select ON/OFF of the input to CH4.
1
1P2W Single-phase 2-wire line
1P3W Single-phase 3-wire line
Single-phase 3-wire line (1-voltage measurement)
Although voltages should be usually input to 2 channels for the single-
CH123
1P3W1U
3P3W2M
3P3W3M
3P4W 3-phase 4-wire line
3P4W2.5E
phase 3-wire line, a voltage is input to only CH1 in a simplistic way.
Additionally, the power of 1P3W is calculated, assuming that the voltage
U2 is equal to U1.
3-phase 3-wire line (2-watt meter method)
Two line voltages and two line currents are measured to perform the
3P3W2M measurement. U3 is calculated from U1 and U2; I3, from I1 and
I2. Although the active power of the 3-phase line as a whole is equal to
the one measured by the 3P3W3M measurement, the balance of the each
phase cannot be checked. To check the balances, select the 3P3W3M.
See “Appx. 7 3-phase 3-wire Measurement” (p. Appx.21).
3-phase 3-wire line (3-watt meter method)
Three phase voltage from the virtual neutral point and three line currents
are measured to obtain results for the 3-phase 3-wire line.
3-phase 4-wire line (2-voltage measurement)
Only the voltage U1 and U3 are measured to obtain results for the 3-phase
4-wire line. U2 is calculated from U1 and U3.
(available after the rmware update)
4
Wiring (WIRING Screen)
Enables the input to CH4.
Voltage: To measure a voltage between the neutral line and the grounding
wire
To obtain the voltage values, the potential differences between the terminal
CH4
Enables you to set the declared input voltage for the measurement line. It will be referenced for the
2
event settings (swell, dip, interruption).
See “SET UP, Event Settings 1 screen” (p. 72).
Variable (50 V to 800 V in 1 V increments), 100, 101, 110, 115, 120, 127, 200, 202, 208, 220, 230,
240, 277, 347, 380, 400, 415, 440, 480, 600
The settings can also be congured in the SET UP, measurement settings screen or in the Quick Set screen.
See “SET UP, Measurement Settings 1 screen” (p. 64), and refer to Measurement Guide.
ON
OFF Disables the input to CH4.
N and each of the channels, CH1 through CH4.
The voltage terminal N is shared by CH1 through CH3 and CH4. Inputting
a voltage to CH1 through CH3 enables the U4 eld to display the value
even though no voltage is input to CH4.
Current: To measure a neutral line current of 3P4W or 1P3W
To measure a leakage current
49
Page 56

Wiring Method and Declared Input Voltage Settings
Wiring diagram
The vector diagram in the following screen example shows the measurement line in its ideal
(balanced, power factor 1) state.
Wiring
selection
vector
diagram
1P2W
1P3W 1P3W1U
Screens
Wiring
selection
vector
diagram
Screens
3P3W2M 3P3W3M*
3P4W 3P4W2.5E (Available after the rmware update)
*: If 3P3W3M is selected, do not apply a voltage to CH4 even with CH4 set to ON.
50
Page 57

Connecting Voltage Cords to Instrument
4.3 Connecting Voltage Cords to Instrument
Be sure to read “Handling Cords and Cables” (p. 8), “Using Voltage Cords” (p. 8).
Connect a Model L1000-05 voltage cord to the voltage input terminal of this instrument.
Secure the cords together with a spiral tube if necessary.
See“Bundling the voltage cords and current sensors (If required)” (p. 37).
Required items
Model L1000-05 Voltage
Cord
(Necessary number of
cords)
Insert alligator clip magnetic adapter or
1
grabber clips into the socket at the tip of
the cord.
Alligator Clip
Model 9804-01 Magnetic
Adapter
(Optional)
Model 9804-02 Magnetic
Adapter
(Optional)
Model 9243 Grabber Clip
(Optional)
Press the [WIRING] key to display the
2
WIRING, wiring settings screen.
Red, compatible with the
M6 pan head screw
Black, compatible with the
M6 pan head screw
4
Wiring (WIRING Screen)
Red and black, 1 each
Magnetic Adapter
Grabber Clip
Insert the voltage cord while checking
3
the channel on the screen.
Voltage input terminal
Insert the cord into the terminal as far as it will go.
51
Page 58

Connecting Current Sensors and Conguring Current Sensor Settings
4.4 Connecting Current Sensors and Conguring
Current Sensor Settings
Be sure to read “Handling Cords and Cables” (p. 8).
Connect the optional current sensor to the current input terminal of this instrument.
• To make it easier to identify channels, color-code the cords with colored spiral tubes.
See“Color coding of current sensor (for channel identication)” (p. 36).
• Secure the cords together with a spiral tube if necessary.
See“Bundling the voltage cords and current sensors (If required)” (p. 37).
• Refer to the instruction manual supplied with the current sensor for specication details and
usage procedures.
When measuring power lines that use multiple channels
Use a current sensor of the same model.
Example: Use current sensors of the same model from CH1 to CH3 for the 3-phase 4-wire system.
Connecting the optional current sensor
Press the [WIRING] key to display the
1
WIRING, wiring settings screen.
3
2
Insert the connector of the current
sensor while checking the channel on
the screen.
Align the arrow with the
concave part of the terminal
to insert the connector.
Current input terminal
When disconnecting the current sensor, be sure
to grip the part of the connector indicated by the
arrows and pull it straight out.
The current sensor and the maximum current
range are set automatically.
52
Page 59

Connecting Current Sensors and Conguring Current Sensor Settings
Connecting current sensors other than the optional sensors
Press the [WIRING] key to display the
1
WIRING, wiring settings screen.
Insert the connector of the current
2
sensor while checking the channel on
the screen.
Example: Model 9661 clamp on
sensor
1 2
9661
L9910
Align the protrusions of
the connector with the
groove, and then insert it.
Current input terminal
Align the arrow with the concave part of the
terminal to insert the connector.
Turn the connector
clockwise to lock it
in place.
Model L9910
Conversion Cable
4
Wiring (WIRING Screen)
See the table given on the right side,
3
and select the corresponding optional
current sensor.
Move the cursor
Example: Select CT7136 for Model 9661 clamp
on sensor
Select
Current sensor
Other than the
optional*
CT9667-01*
CT9667-02*
CT9667-03*
9657-10
9675
9694
9695-02
9695-03
9661 CT7136
9669 9669 Clamp On Sensor
*: Set the range switch of the sensor to 500 A
when the current range of this instrument is set
to 500 A or 50 A.
CT7044
CT7045
CT7046
CT7116
CT7126
CT7131
Optional
AC Flexible Current
Sensor
AC Leakage
Current Sensor
AC Current Sensor9660
53
Page 60

Zero Adjustment
4.5 Zero Adjustment
This function adjusts the DC components superimposing on voltage and current to zero.
In order to obtain precise measurements, it is recommended to perform the zero adjustment in
advance of the measurements after allowing the instrument to warm-up for more than 30 min.
Press the [WIRING] key to display the
1
WIRING, wiring settings screen.
3
Execute zero adjustment
2
The DC components superimposing on voltage
and current are adjusted to zero. It will takes
approximately 20 s.
• Perform zero adjustment only after connecting the current sensor to the instrument.
• Perform zero adjustment before wiring to the measurement line. (The zero adjustment must be performed
when there is no input of voltage and current.)
• In order to obtain precise measurements, zero adjustment should be performed at an ambient temperature
level, that falls within the range dened by the device specications.
• The key operations are disabled during zero adjustment.
54
Page 61

Connecting Voltage Cords to Objects
4.6 Connecting Voltage Cords to Objects
Be sure to read “Wiring” (p. 12).
Connect the voltage cords to the measuring objects while checking the WIRING, wiring settings
screen.
4
Use alligator clips or Model 9243 Grabber Clip.
Securely clip the cords to metal parts such as bus bars
and screws on the secondary side of the breaker.
Method to open and close Model 9243
Using Model 9804-01 (9804-02) Magnetic Adapter
Connect the magnetic adapter to the screws on the
secondary side of the breaker.
Secondary side of breaker
Model L1000-05
Voltage Cord
Example: Alligator clip
Secondary side of breaker
Model 9804-01, 02
Magnetic Adapter
Wiring (WIRING Screen)
Model L1000-05
Voltage Cord
The weight of the voltage cords may prevent you from
making a perpendicular connection between the magnetic
adapter and the head of the screw.
In this case, connect each cord such that it hangs off the
adapter in a manner that balances its weight. Check the
voltage values to verify that the connections have been
made securely.
* Optional, standard screws: M6 small pan head screws
Secondary side of breaker
Model 9804-01, 02
Magnetic Adapter
Model L1000-05
Voltage Cord
55
Page 62

Attaching Current Sensors to Objects
「 シ ー ル ド 線 は 挟 ま な い 」の 説 明 を
記載する/しないは製品ごと技術に確認する
↓↓↓↓↓↓↓↓↓↓↓↓↓↓↓↓
NO
4.7 Attaching Current Sensors to Objects
Be sure to read “Wiring” (p. 12).
Connect the current sensors to the measuring objects while checking the WIRING, wiring settings
screen.
Load current measurement
Make sure that the current ow direction arrow points toward the load side, then clamp the
conductor.
Example:
Direction of the current
Source
Model CT7126/CT7131 AC current sensor
Source
Current Flow
Direction Arrow
CT7044/ CT7045/ CT7046 AC exible current sensor
Load side
Conductor
Current Flow
Direction Arrow
Load side
Conductor
Conductor
Source
Direction Arrow
Model CT7136 AC current sensor
Load side
Current Flow
56
IMPORTANT
Attach the clamp around only one line of the
conductor.
Single-phase (2-wire) or three-phase (3-wire,
4-wire) cables clamped together will not produce
any reading.
OK
NO
NO
Page 63

Leakage current measurement
Attaching Current Sensors to Objects
Grounding wire
measurement
Batch
measurement
Clamp 1 line only. (Diagram A)
Clamp the electrical circuits together. (Diagram B)
Clamp 2 wires together in the single phase 2-wire system circuit, and 4 wires
in the 3-phase 4-wire system circuit.
Example:
Single phase 3-wire system circuit
Transformer
A
B-type
grounding wire
3-phase 3-wire system circuit
Leakage
current lg
B
B
Load
apparatus
B
4
Wiring (WIRING Screen)
B
A
Leakage
current lg
B-type
grounding wire
Load apparatus
A
D-type
grounding wire
57
Page 64

Conguring Current Range Setting
4.8 Conguring Current Range Setting
Check the current value in the WIRING, wiring settings screen and select an appropriate current
range.
Press the [WIRING] key to display the
1
WIRING, wiring settings screen.
Optional Other than the optional
AC exible current sensor
Current sensor
CT7044
CT7045
CT7046
Check the current value (RMS value)
2
and select the current range.
Move the cursor
CT9667-01*
CT9667-02*
CT9667-03*
Current value (RMS value)
Select
Current range
5000A, 500A, 50A
AC leakage current sensor CT7116
CT7126
AC current sensor
AC/DC auto-zero current sensor
Clamp on sensor 9669 9669 1000A, 100A
*: Set the range switch of the sensor to 500 A when the current range of this instrument is set to 500 A or
50 A.
Selecting an appropriate current range
Set the current range based on the anticipated maximum load current that will generate during the
measurement. (Refer to the operating status, load rating, breaker rating, and other data to make
this determination.)
If the range is too low, then an over-range current will be generated during measurement, and
accurate measurement will not be possible.
And if the range is too high, then errors will increase and accurate measurement will not be possible.
CT7131
CT7136 9661 500A, 50A, 5A
CT7731
CT7736
CT7742
9657-10
9675
9694
9695-02
9660
9695-03
-
-
-
5A, 500mA, 50mA
50A, 5A, 500mA
100A, 50A, 5A
100A, 10A
500A, 50A
2000A, 1000A, 500A
58
Page 65

4.9 Checking Wiring
Press the [WIRING] key to display the WIRING, wiring check screen.
This screen is used to check whether the instrument has been connected properly.
Checking Wiring
Voltage value
(RMS value)
Voltage phase
angle
(Fundamental
wave)
Current value
(RMS value)
Current phase
angle
(Fundamental
wave)
Active
power value
Wiring judgment*
Displacement
Power Factor
(Fundamental
power factor)*
1
Voltage level,
phase PASS range*
Voltage phase vector*
Current level,
phase PASS range*
2
2
2
4
Current phase vector*
The measured value is xed and displayed
when the [F5] (Hold) key is pressed.
3
2
Wiring (WIRING Screen)
*1: The wiring judgment results are displayed.
Green PASS (Normal)
Red (x) FAIL (Abnormal)
Yellow (!) CHECK (Conrmation
required)
*2: The wiring is normal if the phase vector is within the ‘PASS’ range. (If outside the PASS range, see “Voltage
phase” (p. 61), “Current phase” (p. 61))
*3: DPF (Displacement Power Factor) is displayed as the power factor irrespective of the PF/Q/S calculation
method settings of the SET UP, measurement settings 2 screen in the WIRING, wiring check screen.
See “SET UP, Measurement Settings 2 screen” (p. 66) and “Power factor (PF/DPF)” (p. Appx.28).
59
Page 66

Checking Wiring
If the wiring judgment result is red (FAIL) or yellow (CHECK)
Select an item to be checked.
1
Move the cursor
A dialog box with helpful information for xing
the wiring will be displayed.
Press the [WIRING] key to display the
3
WIRING, wiring settings screen.
Review its contents.
2
(Press the [ESC] key to close the dialog box)
Verify that the actual wiring connections
4
are the same as the ones shown on the
screen.
Once again, press [WIRING] key and
5
conrm the wiring judgment result on
WIRING, wiring check conrmation
screen.
Recording can be started even if the wiring
judgment result remains red (FAIL) or yellow
(CHECK).
Correct the wiring if the connections are
incorrect.
60
Page 67

Checking Wiring
Wiring
judgment items
Voltage input To determine the voltage value based on
the declared input voltage.
110% < CHECK
90% ≤ PASS ≤ 110%
80% ≤ CHECK < 90%
See “4.2 Wiring Method and Declared Input Voltage Settings” (p. 48).
See “4.3 Connecting Voltage Cords to Instrument” (p. 51).
See “4.6 Connecting Voltage Cords to Objects” (p. 55).
Current input FAIL will be displayed when input is less
than 1% of the current range. CHECK will
be displayed when input is less than 10% of
the current range.
Judgment conditions Conrmation steps
FAIL < 80%
• Has the declared input voltage been set
correctly?
• Are the voltage cords completely inserted
into the voltage input terminals?
• Are the tip clip and cord of the voltage
cord completely inserted?
• Is the tip clip of the voltage cord connected
to the metal parts of the measurement
line?
Wiring cannot be checked when no current
is owing. Operate the equipment and
keep the current owing in order to check
the wiring. If the wiring cannot be checked
even if the equipment is operating, as exact
diagnosis cannot be done, visually check
for proper wiring before measuring.
• Are the current sensors properly inserted
into the current sensor input terminals?
• Are the current sensors correctly wired?
• Is the set current range too large for the
input level?
4
Wiring (WIRING Screen)
See “4.4 Connecting Current Sensors and Conguring Current Sensor Settings” (p. 52).
See “4.7 Attaching Current Sensors to Objects” (p. 56).
Voltage phase FAIL will be displayed when the voltage
phase exceeds the range (exceeds the
reference value ±10°).
See “4.2 Wiring Method and Declared Input Voltage Settings” (p. 48).
See “4.6 Connecting Voltage Cords to Objects” (p. 55).
Current phase FAIL will be displayed when the current
phase sequence is incorrect.
See “4.2 Wiring Method and Declared Input Voltage Settings” (p. 48).
See “4.4 Connecting Current Sensors and Conguring Current Sensor Settings” (p. 52).
See “4.7 Attaching Current Sensors to Objects” (p. 56).
• Are the wiring settings correct?
• Are the voltage cords correctly wired?
• The phases may have been incorrectly
laid out during wiring. Switch the voltage
cords and adjust the connections of the
current sensors so that PASS is displayed.
To recheck the phases, use a phase
detector to conrm that the phases are in
the correct sequence.
• Are the current sensors connected in the
right places? (On both the wiring side, and
the input terminal of this instrument)
• Does the arrow of the current sensor point
to the load side?
61
Page 68

Checking Wiring
Wiring
judgment items
Voltage and
current phase
difference
Judgment conditions Conrmation steps
FAIL will be displayed when each current
phase is not within 90° with respect to the
voltage of each phase.
CHECK appears if current phase is within
±60° to ±90° of each voltage phase.
See “4.3 Connecting Voltage Cords to Instrument” (p. 51) to “4.7 Attaching Current
Sensors to Objects” (p. 56).
• Are the voltage cords and current sensors
connected in the right places? (On both
the wiring side, and the input terminal of
this instrument)
• Does the arrow of the current sensor point
to the load side?
• Are the voltage cords and current sensors
connected in the right places? (On both
the wiring side, and the input terminal of
this instrument)
• Does the arrow of the current sensor point
to the load side?
• In light loads, power factor may be low
and phase difference may be large.
Check the wiring and if no problems are
observed, proceed with the measurement.
• When phase advances too much due
to the phase advance capacitor in light
loads, power factor may be low and phase
difference may be large. Check the wiring
and if no problems are observed, proceed
with the measurement.
Power factor
(DPF)
CHECK will be displayed if the power factor
is less than 0.5 but more than −0.5.
See “4.4 Connecting Current Sensors and Conguring Current Sensor Settings” (p. 52).
See “4.7 Attaching Current Sensors to Objects” (p. 56).
• Are the current sensors connected in the
right places? (On both the wiring side, and
the input terminal of this instrument)
• Does the arrow of the current sensor point
to the load side?
• When the load is light, the power factor
may be low. Check the wiring and if no
problems are observed, proceed with the
measurement.
• When the phase advances too much due
to the use of a phase advance capacitor
during a light load, the power factor
may be low. Check the wiring and if no
problems are observed, proceed with the
measurement.
62
Page 69

5
Setting Change (SET UP Screen)
All settings can be changed on the SET UP screen.
Press the [SET UP] key to display the SET UP screen.
In addition to the [SET UP] key, you can switch to the SET UP screen from here also.
1
For the SET UP, Interface Settings screen, see “12 Communications (USB/LAN/RS-232C)”
(p. 137) and “13 External I/O” (p. 147).
2
5
Setting Change (SET UP Screen)
63
Page 70

Measurement Settings
5.1 Measurement Settings
SET UP, Measurement Settings 1 screen
Press the [SET UP] key to display the SET UP, measurement settings 1 screen.
1
2
3
4
5
6
7
8
9
Move the cursor
Select
See “4.5 Zero Adjustment”
(p. 54).
The wiring method, declared input voltage, current sensor and current range can be set on the “WIRING,
Wiring Settings Screen” or on the “Quick Settings Screen.”
See “4.2 Wiring Method and Declared Input Voltage Settings” (p. 48), and Measurement Guide.
Enables you to select the wiring method of CH1 to CH3, and select ON/OFF input for CH4.
1
1P2W Single-phase 2-wire line
1P3W Single-phase 3-wire line
1P3W1U Single-phase 3-wire line (1-voltage measurement)
CH123
CH4
3P3W2M 3-phase 3-wire line (2-watt meter method)
3P3W3M 3-phase 3-wire line (3-watt meter method)
3P4W 3-phase 4-wire line
3P4W2.5E
ON
3-phase 4-wire line (2-voltage measurement)
(available after the rmware update)
Enables the input to CH4.
Voltage: To measure the voltage of a grounded wire.
Current: To measure the N wire current of 3P4W or 1P3W.
To measure the leakage current.
64
OFF Disables the input to CH4.
Enables you to set the declared input voltage for the measurement line. It will be referenced for the
2
event settings (swell, dip, interruption).
See “SET UP, Event Settings 1 screen” (p. 72).
Variable (50 V to 800 V in 1 V increments), 100, 101, 110, 115, 120, 127, 200, 202, 208, 220, 230,
240, 277, 347, 380, 400, 415, 440, 480, 600
The voltage range is xed to 1000 V.
3
Page 71

Measurement Settings
Enables you to set if an external VT is being used.
4
Variable (0.01 to 9999.99), 1, 60, 100, 200, 300, 600, 700, 1000, 2000, 2500, 5000
While taking measurements on the secondary side of a voltage transformer (VT), if you set the VT
ratio, you can display the voltage value by converting it to primary-side voltage values.
Example: If the voltage on primary side of a VT is 6.6 kV and the voltage on secondary side is 110 V
then the VT ratio = 60 (6600 V / 110 V)
As the voltage range of 1000 V is xed, it would be multiplied by the VT ratio of 60 to obtain a
voltage range of 60 kV.
When connecting the optional current sensor
5
If you press the [F3] (sensor) key, the current sensor and the maximum current range will be set
automatically.
Check the current value (RMS value) and select an appropriate current range.
When connecting current sensors other than the optional sensors
The sensor and the range will not be set automatically. See the following table and select the
compatible optional current sensor.
Check the current value (RMS value) and select an appropriate current range.
Current sensor
Optional
CT7044
AC exible current sensor
AC leakage current sensor CT7116
AC current sensor
AC/DC auto-zero current sensor
Clamp on sensor 9669 9669 1000A, 100A
*: Set the range switch of the sensor to 500 A when the current range of this instrument is set to
500 A or 50 A.
CT7045
CT7046
CT7126
CT7131
CT7136 9661 500A, 50A, 5A
CT7731
CT7736
CT7742
Other than the
optional
CT9667-01*
CT9667-02*
CT9667-03*
9657-10
9675
9694
9695-02
9660
9695-03
-
-
-
Current range
5000A, 500A, 50A
5A, 500mA, 50mA
50A, 5A, 500mA
100A, 50A, 5A
100A, 10A
500A, 50A
2000A, 1000A, 500A
5
Setting Change (SET UP Screen)
When measuring power lines that use multiple channels
Combine the multiple types of the current sensor.
Example: Use current sensors of the same type from CH1 to CH3 for the 3-phase 4-wire system.
Selecting an appropriate current range
Set the current range based on the anticipated maximum load current that will generate during the
measurement. (Refer to the operating status, load rating, breaker rating, and other data to make this
determination.)
If the range is too low, then an over-range current will be generated during measurement, and
accurate measurement will not be possible.
And if the range is too high, then errors will increase and accurate measurement will not be possible.
The present current value will be displayed.
6
65
Page 72

Measurement Settings
Enables you to set if using an external CT.
7
Variable (0.01 to 9999.99), 1, 40, 60, 80, 120, 160, 200, 240, 300, 400, 600, 800, 1200
While taking measurements on the secondary side of a current transformer (CT), if you set the CT
ratio, you can display the current value by converting it to primary-side current values.
Example: If the current on primary side is 200 A and the current on secondary side is 5 A then the
CT ratio = 40 (200 A / 5 A)
If the current range of 5 A is selected (with the current sensor), it would be multiplied by the CT ratio
of 40 to obtain a current range of 200 A.
Enables you to select the nominal frequency for the measurement line. It will be referenced for the
8
event settings (frequency).
See “5.3 Event Settings” (p. 72).
50 Hz, 60 Hz
• After performing a factory reset (default) (p. 77) to reset the instrument to the default settings,
when you turn on the power, rst set the frequency that matches with the measuring object.
See “Setting the language, clock, and measurement frequency” (p. 40).
• The Frequency setting dialog box will be displayed if the instrument detects voltage input and
determines that the frequency differs from the set frequency. Press the [ENTER] key to change the
frequency settings.
• Measurement of DC does not care that either 50 Hz or 60 Hz is congured.
Enables you to sync source referenced for the measurement is xed to U1.
9
SET UP, Measurement Settings 2 screen
Press the [SET UP] key to display the SET UP, measurement settings 2 screen.
1
2
3
4
5
66
Move the cursor
Select
Page 73

Measurement Settings
Enables you to select whether to display the RMS voltage of TREND screen in the form of line
1
voltage or in phase voltage.
Phase voltage (Line-N), Line voltage (Line-Line)
For 1P2W, 1P3W Phase voltage
For 3P3W2M Line voltage
For 3P3W3M, 3P4W,
3P4W2.5E
Enables you to select the method for calculating power factor (PF/DPF), reactive power (Q), and
2
apparent power (S) on the display screen.
Both the RMS calculation and fundamental calculation values are stored as a output data.
See “14.7 Calculation Formula” (p. 175).
RMS value Uses RMS voltage and RMS current to calculate.
Fundamental
RMS calculation is generally used in applications such as checking transformer capacity.
Fundamental calculation is used when measuring power factor and reactive power, which are related
to the energy cost.
Can be switched between phase voltage and line voltage
Both the phase voltage and line voltage are stored as a output data.
(3P4W2.5E will be available after the rmware update)
Uses voltage and current fundamentals to calculate.
This is the same measurement method used for measuring reactive energy
established at commercial-scale utility customers’ facilities.
Enables you to select the calculation method for calculating the total harmonic distortion (THD) on
3
the display screen and event settings.
Both the THD-F calculation value and THD-R calculation value are taken as output data.
THD-F
THD-R
When the unit cost (/kWh) is set, the energy cost is displayed by multiplying the active energy
4
(consumed) WP+ with the energy cost per unit.
See “Unit cost input method” (p. 68).
0.00000 /kWh to 99999.9 /kWh
Enables you to set the currency.
5
Set to any 3 alphanumeric characters (example: set USD for
Calculates by dividing harmonic components (total of 2nd to 50th orders)
with fundamental wave.
Calculates by dividing harmonic components (total of 2nd to 50th orders)
with RMS value (1st to 50th order).
the US dollar
)
5
Setting Change (SET UP Screen)
67
Page 74

Measurement Settings
Unit cost input method
Select the unit cost.
1
Accept the settings.
3
Move the cursor
Change the value.
2
When moving the decimal point
: Move the cursor to the position of
decimal point.
: Change the location of the decimal
point.
When changing the value
: Move the cursor to the digit that
you wish to change.
: Change the value.
68
Page 75

5.2 Recording Settings
Press the [SET UP] key to display the SET UP, recording settings screen.
Perform the settings regarding recording (storage).
The maximum recording period is up to 1 year and then the recording stops automatically.
Recording Settings
1
10
2
3
4
5
6
7
8
9
Move the cursor
Select
5
• The storage destination of measurement data is xed to the SD card. If no SD memory card is
1
2
inserted or if there is no free space in the SD memory card, data will be stored in the instrument’s
internal memory (capacity of approx. 4 MB).
• No data such as event data but only the setting data and the trend record data are stored in the
internal memory. See “File Saving and Operations (FILE Screen)” (p. 115).
Enables you to select the recording interval. It will also reect in the intervals in the trend graph.
150 cycle (only in the case of 50 Hz), 180 cycle (only in the case of 60 Hz), 200 ms, 600 ms, 1 sec,
2 sec, 5 sec, 10 sec, 15 sec, 30 sec, 1 min, 2 min, 5 min, 10 min, 15 min, 30 min, 1 hour, 2 hour
Setting Change (SET UP Screen)
• The 150 cycle (50 Hz) and 180 cycle (60 Hz) settings provide the recording intervals required for
IEC61000-4-30-compliant measurement.
• The shortest recording interval of the internal memory is 2 s. If the recording interval of 1 sec or
below is set, then the data cannot be stored in the internal memory.
Enables you to select the parameters that you wish to record. It will also reect in the parameters that
3
are displayed on the TREND screen.
Yes harmonic All the parameters are recorded.
Records the parameters other than the harmonic or interharmonic
No harmonic
The display possible time of the TREND screen changes according to the setting of Recording
interval and Recording items.
Enables you to select ON, for saving the display screen in the BMP format data (screen copy).
4
Screen copies cannot be saved in the instrument’s internal memory.
If the Recording interval is set to below 5 min, then they are saved every 5 min.
ON/OFF
Enables you to set the date and time.
5
(The seconds cannot be set. If you press the [Enter] key after changing time, the seconds will be
set to 00.)
parameters.
Records the total harmonic distortion (THD).
69
Page 76

Recording Settings
Enables you to set the method used to start recording.
6
Manual Recording starts immediately after the [START/STOP] key is pressed.
After the [START/STOP] key is pressed, recording starts at the set time. (If
the set time has already passed when the key is pressed, “Interval” starting
Specied time
Interval time
Repeat
method will be used.)
YYYY-MM-DD hh:mm
Recording starts at an even time division based on the Recording interval.
If the [START/STOP] key is pressed at the time “10:41:22” with the time
interval set to 10 min, the instrument will enter in the standby state. The
recording will start at “10:50:00.”
If the set recording interval is of 30 s or less, recording will start from the
next zero second.
Segments the le every day and repeats the recording.
Sets the Recording period.
If a folder is labeled arbitrarily, data recorded for up to 99 days can be
stored.
After the [START/STOP] key is pressed, recording starts in the Recording
period of the set start date. (If the set time has already passed when the
key is pressed, “Interval” starting method is used.)
The Recording intervals of 1 sec and above are valid.
YYYY-MM-DD
See “7.1 Start and Stop of the Recording” (p. 91).
Enables you to set the method used to stop the recording.
7
Manual Press the [START/STOP] key to stop the recording.
Recording stops at the set time.
(If the set time has already passed when recording starts, recording will be
Specied time
Timer
Repeat
See “7.1 Start and Stop of the Recording” (p. 91).
Recording start method is displayed for the repeat recording.
8
Set the recording period.
stopped using the “manual” method.)
YYYY-MM-DD hh:mm
Stops the recording automatically if the set timer time has elapsed.
hhh:mm:ss
Displayed when Recording start setting is congured to Repeat.
Recording is stopped if the Recording period of the stop date has passed.
The stop method cannot be changed for repeat recording.
YYYY-MM-DD
70
hh:mm to hh:mm
Page 77

Enables you to set the folder name and le name used to save the data.
9
See “10.2 Folder and File Structure” (p. 118)
Sets variable folder name in the dialog. (maximum 5 half-width characters)
If recording and measurement are performed again without changing
the [Folder/le name], sequentially numbered (00 to 99) folders will be
Variable
automatically created, and the data will be saved there. If Recording start
setting is congured to Repeat, data recorded for up to 100 days can be
stored because folders are created at daily intervals.
Example: “ABCDE00,” “ABCDE01,” and then, “ABCDE02”
Recording Settings
Automatic
10
• If the save time of the SD memory card or internal memory is shorter than the specied duration, recording
• The maximum recording and measurement period is 1 year. Recording will stop after 1 year.
Calculates the save time from the recording settings and displays it.
Since the maximum recording time is 1 year, the maximum data storage time is also 1 year.
Calculates the save time when there is no event (not occurred). If the event occurs, the save time
shortens.
will be started, but only the capacity during save time will be recorded.
The folder will be named automatically as “YYMMDDXX.” YYMMDD is the
year, month, and date while XX is the serial number (00 to 99).
5
Setting Change (SET UP Screen)
71
Page 78

Event Settings
5.3 Event Settings
An event will occur using the set threshold value on this screen as the basis.
For more information about events, see “Appx. 3 Explanation of Power Quality Parameters and
Events” (p. Appx.4), “Appx. 4 Event Detection Methods” (p. Appx.8).
SET UP, Event Settings 1 screen
Press the [SET UP] key to display the SET UP, event settings 1 screen.
10
1
2
“Reference graph for setting
threshold values” (p. 73)
3
4
5
6
7
8
9
Switch between
ON and OFF
Enables you to set the threshold value of the voltage transient.
1
1
*
OFF, 4 V to 2200 V
Move the digitMove the cursor Change
the value
Enables you to set the threshold value of the voltage swell.
1,2
2
*
3
*
4
*
*1: The actual event threshold value is obtained by multiplying with the VT ratio.
*2: The threshold value is set in terms of % of the declared voltage Uref (declared input voltage Udin × VT
ratio).
OFF, 0.0% to 200.0%
Enables you to set the threshold value of the voltage dip.
1,2
OFF, 0.0% to 100.0%
Enables you to set the threshold value of the interruption.
1,2
OFF, 0.0% to 100.0%
72
Page 79

Enables you to set the threshold value of the frequency (200 ms). (Only U1)
5
OFF, 0.1Hz to 9.9Hz
Enables you to set the threshold value of the frequency (1 wave). (Only U1)
6
OFF, 0.1Hz to 9.9Hz
Enables you to set the threshold value of the voltage total harmonic distortion.
7
OFF, 0.0% to 100.0%
The value depends on the THD settings of the calculation method of the SET UP, Measurement
settings 2 screen (THD-F/THD-R).
Enables you to set the threshold value of the inrush current.
8
5000 A range OFF, 0 A to 5000 A
2000 A range OFF, 0 A to 2000A
1000 A range OFF, 0 A to 1000A
500 A range OFF, 0 A to 500A
Event Settings
100 A range OFF, 0 A to 100A
50 A range OFF, 0 A to 50A
10 A range OFF, 0 A to 10A
5 A range OFF, 0 A to 5A
500 mA range OFF, 0 A to 500mA
50 mA range OFF, 0 A to 50mA
The actual event threshold value is obtained by multiplying with the CT ratio.
Enables you to set the threshold value of the current total harmonic distortion.
9
OFF, 0.0% to 500.0%
The value depends on the THD settings of the Calculation method of the SET UP, Measurement
settings 2 screen (THD-F/THD-R).
Enables you to set the hysteresis for the event threshold value to avoid frequent occurrence of
10
events. Hysteresis can be set to all the parameters except frequency.
The frequency is xed to 0.1 Hz.
0% to 10%
Reference graph for setting threshold values
You can adjust threshold values while viewing the present measured values.
Threshold value upper limit
5
Setting Change (SET UP Screen)
Presently set threshold value
Threshold value lower limit
Present measured value
73
Page 80

Event Settings
SET UP, Event Settings 2 screen
1
2
3
4
5
6
7
Switch between
ON and OFF
Enables you to select the timer event.
1
2
3
4
5
6
7
The timer events are recorded at the set intervals.
OFF, 1min, 2min, 5min, 10min, 15min, 30min, 1hour, 2hour
Select ON for using an external event.
External events occur at the time of short-circuiting the event input terminal (EVENT IN) or of the
pulse signal falling and they are recorded.
OFF, ON
The recording start event occurs when the recording starts.
The recording stop event occurs when the recording stops.
Enables you to select the event waveform recording time (before-event) before the event occurs.
1
*
OFF, 200ms, 1sec
The event waveform recording time when the event occurs is xed to 200 ms.
Enables you to select the event waveform recording time (after-event) after the event occurs.
Only the event which initially occurred is recorded.
1
If another event occurs during the after-event, the after-event of this another event cannot be stored.
*
Change the valueMove the cursor
OFF, 200ms, 400ms, 1sec, 5sec, 10sec
*1: The event OUT, timer, manual, recording start, and recording stop events are not recorded in the event
waveform recording of before-event and after-event. Only the event waveform of 200 ms, when the event
occurs, will be saved.
The event waveform is divided at intervals of 200 ms. When the after event is set to 1 sec, ve pieces,
which is obtained by dividing 1 sec by 200 ms, of the event waveform are saved.
If the before event or the after even set to exceeding 200ms, only the waveform recorded during 200 ms
can be observed with the instrument. To observe the entire length of the waveform, use the application
software PQ One, which is supplied with the instrument.
74
Page 81

5.4 System Settings
Press the [SET UP] key to display the SET UP, System settings screen.
1
2
3
4
5
6
System Settings
Serial number of this instrument
Software version of this instrument
FPGA version of this instrument
Move the cursor
Enables you to set the date and time.
1
(The seconds cannot be set. If you press the [Enter] key after changing the value, the seconds will
be set to 00.)
Select ON to enable a beep sound when pressing a key.
2
ON, OFF
Enables you to select whether or not to auto-off the backlight of the display.
3
Auto OFF
ON The backlight is on at all times.
Enables you to select the display language.
4
Japanese German
English French
Chinese Simple (Simplied) Italian
Select
5
Setting Change (SET UP Screen)
The backlight automatically turns off after 2 min have elapsed since the last
key operation.
Chinese Trad (Traditional) Spanish
Korean Turkish
Enables you to select the display color.
5
Color 1, color 2, color 3
Enables you to select the phase names for the measuring objects displayed on the wiring diagram.
6
RST, ABC, L1L2L3, UVW
75
Page 82

System Settings
System reset (Default)
Move the cursor to the system reset and press [ENTER] key to reset the system settings of this
instrument. (Factory settings: p. 78)
Perform if the instrument is operating in an odd or unexpected manner with no clear cause.
Move the cursor
All settings other than the measurement frequency, clock, language, and communication settings (LAN and
RS-232C) are initialized to their factory settings. The internal memory will not be erased.
76
Page 83

Factory reset (Default)
If you perform the factory reset, all settings, including frequency, language, and communications
settings will revert to their factory settings (p. 78). The internal memory will be erased.
System Settings
Turn off the instrument. (p. 44)
1
The factory reset will complete, and the
language setting screen will be displayed.
Set the language, clock, and measurement
frequency (p. 40).
Turn on the instrument while holding
2
down the [ENTER] and [ESC] keys,
and continue holding them down until
the beep sounds after the self-test is
complete.
5
Setting Change (SET UP Screen)
77
Page 84

System Settings
Factory settings
All the default settings are as follows:
*1: Checked parameters () are the parameters that are not initialized in quick set.
*2: Checked parameters () are the parameters that are not initialized during the system reset.
These are initialized in the factory reset only.
Screens items Default values *1 *2
Measurement
settings 1
Wiring Display Language:
Japanese
CH123: 3P3W2M
CH4: OFF
Measurement
settings 2
Display language:
Other than above
Declared input voltage Display Language:
Japanese
Display language:
Other than above
VT ratio CH123: 1
CH4: 1
Current sensor CH123: CT7136
CH4: CT7136
Current range CH123: 500 A
CH4: 500 A
CT ratio CH123: 1
CH4 :1
Measurement
frequency
Urms Other than 3P3W: Phase voltage
PF/Q/S RMS value
THD THD-F
Select 50 Hz or 60 Hz after the factory reset.
3P3W: Line voltage
CH123: 3P4W
CH4: ON
200V
230V
Recording
settings
Harmonics
(Available after the
rmware update)
Energy unit cost 0000.00/kWh
Energy cost currency _____
Flicker
(Available after the
rmware update)
Filter
(Available after the
rmware update)
Recording interval 1min
Recording items Yes harmonic
Screen save OFF
Recording start method Interval time
Recording stop method Manual
Folder/ File name Automatic
U, I, P: All levels
Display Language:
Japanese
Display language:
Other than above
Display Language:
Japanese
Display language:
Other than above
∆V10
Pst,Plt
-
230V lamp
78
Page 85

System Settings
Screens items Default values *1 *2
Event settings 1 Transient CH123: OFF
CH4: OFF
Swell OFF
Dip OFF
Interruption OFF
Frequency (200 ms) OFF
Frequency (1 wave) OFF
Voltage total harmonic
distortion
Inrush current CH123: OFF
Current total harmonic
distortion
Hysteresis 1%
Event settings 2 Timer event OFF
External event OFF
Event waveform
recording time
Before event occurs
Event waveform
recording time
After event occurs
System settings Clock Set at the time of shipment
Beep sound ON
LCD backlight Auto OFF
Display language Language selection after factory reset
Display color Color 1
OFF
CH4: OFF
CH123: OFF
CH4: OFF
OFF
OFF
5
Setting Change (SET UP Screen)
Interface
settings
Phase name Display Language:
Japanese
Display language:
Other than above
DHCP (available after the
rmware update)
IP address 192.168.1.31
Subnet mask 255.255.255.0
Default gateway 192.168.1.1
FTP function
(Available after the
rmware update)
Send mail
(Available after the
rmware update)
RS-232C baud rate 19,200bps
External output Short pulse
OFF
Undetermined
Undetermined
RST
ABC
79
Page 86

System Settings
80
Page 87

Verifying the Waveform,
6
Measured Values (MONITOR
Screen)
You can view the measured waveforms and measured values on the MONITOR screen.
Press the [MONITOR] key to display the MONITOR screen.
Elapsed time
Recording start time and date
In addition to the [MONITOR] key, you can also switch to the MONITOR screen by using the [F1] (Screen)
key.
1
Fixing the waveform display and measured values
Press the [F5] (Hold) key to x the waveform display and measured values.
Press the [F5] key again to cancel the xed waveform display and measured values.
• If a setting is changed while measured values and waveform display are being held, the hold will be
canceled.
• The time display is not xed.
2
6
Verifying the Waveform, Measured Values (MONITOR Screen)
81
Page 88

Verifying the Voltage Waveform and Current Waveform
6.1 Verifying the Voltage Waveform and Current Waveform
Press the [MONITOR] key to display the MONITOR, Waveform screen.
The voltage waveforms and current waveforms of up to 4 channels are overlapped and displayed.
The color of waveform is same as the phase color.
Screen display
Zoom factor settings for the horizontal axis (time axis) of the waveform (p. 83)
Zoom factor settings
for the vertical axis of
the waveform (p. 83)
Frequency (average value for a period of 200 ms)
1
Screen display scope
When the cursor is OFF: measured values of each channel (RMS value)
1
At the time of the cursor measurement: cursor measured values of the waveforms of each channel
(Above diagram shows the screen that is displayed when the cursor is OFF)
See “Verifying the measured value and time at the cursor position (cursor measurement)” (p. 83).
Scroll bar
Scope of all measurement data
p. 83 p. 83 p. 81
82
Page 89

Verifying the Voltage Waveform and Current Waveform
Changing the zoom factor for the vertical axis and horizontal axis (X and Y axis) of the waveform
1 2
Move the cursor
Enables you to set the zoom factor for the vertical axis (Y axis) of the waveform (U: voltage, I:
1
current).
×1/4, ×1/2, ×1, ×2, ×5, ×10, ×20, ×50
Enables you to set the zoom factor for the horizontal axis (time axis) of the waveform.
2
10ms/div, 20ms/div, 40ms/div
Select
Verifying the measured value and time at the cursor position (cursor measurement)
If you press the [F3] (Cursor) key, the measured value and time at the cursor position will also
display along with the cursor.
Move the position of the cursor by using the keys.
6
Verifying the Waveform, Measured Values (MONITOR Screen)
Cursor
Time at the cursor position
Measured value at the
cursor position
Scrolling the waveform
If the waveform is protruding from the screen, press the [F4] (Scroll) key to be able to scroll the
waveform.
Enables you to scroll the waveform in the vertical and horizontal directions by using the
keys.
83
Page 90

Verifying the Electric Power (List of Numerical Values)
6.2 Verifying the Electric Power (List of Numerical Values)
Press the [MONITOR] key to display the MONITOR, Electric power screen.
RMS current
Frequency (average value
RMS voltage
for a period of 200 ms)
1
Apparent
power
Active
power
1
Reactive power
PF: Power factor
DPF: Displacement power
factor
See
Calculation method
(p. 66).
Active energy Consumption
When the wiring method is 3P3W3M, 3P4W, or 3P4W2.5E (available after the rmware update), the
display method of the RMS voltage can be switched (between phase voltage and line voltage).
Select
84
Phase voltage (Line-N), Line voltage (Line-Line)
For 1P2W, 1P3W Fixed to phase voltage
For 3P3W2M Fixed to line voltage
For 3P3W3M, 3P4W,
3P4W2.5E
Can be switched between the line voltage and phase voltage.
Both the phase voltage and line voltage are stored as a output
data. (3P4W2.5E will be available after the rmware update.)
Page 91

6.3 Verifying the Electric Energy
Press the [MONITOR] key to display the MONITOR, Electric energy screen.
Verifying the Electric Energy
1
2
3
Active energy (WP+: consumption, WP-: regeneration)
1
Reactive energy (WQ_LAG: lag, WQ_LEAD: lead)
2
Energy cost
3
Value obtained by multiplying the “active energy consumption: WP+” by the energy unit cost*
Active power
Apparent power
Reactive power
PF: Power factor
DPF: Displacement power factor
(Not displayed for 3-phase 3-wire line)
See Calculation method (p. 66).
6
*: See “SET UP, Measurement Settings 2 screen” (p. 66)
Verifying the Waveform, Measured Values (MONITOR Screen)
85
Page 92

Verifying the Voltage Details
6.4 Verifying the Voltage Details
Press the [MONITOR] key to display the MONITOR, Voltage screen.
Average value of the channels
Voltage waveform peak (-)
Voltage waveform peak (+)
RMS voltage
Voltage DC value
Frequency for 200 ms (average
value for a period of 200 ms)
Voltage total harmonic distortion
(calculation method THD-F / THD-R)
See Calculation method (p. 66).
1
Voltage crest factor
([absolute value of voltage
waveform peak]/[RMS voltage])
Frequency for 10 sec (average
value for a period of 10 s)
Displayed in red if one of
the following occurs: swell,
dip, interruption, or out of
synchronization.
Voltage zero-phase unbalance
factor (not displayed for 3-phase
3-wire line)
See “Unbalance factor” (p. Appx.29).
Voltage negative-phase unbalance factor
See “Unbalance factor” (p. Appx.29).
When the wiring method is 3P3W3M, 3P4W, or 3P4W2.5E (available after the rmware update), the
1
display method of the RMS voltage can be switched (between phase voltage and line voltage).
Select
Phase voltage (Line-N), Line voltage (Line-Line)
For 1P2W, 1P3W Fixed to phase voltage
For 3P3W2M Fixed to line voltage
For 3P3W3M, 3P4W,
3P4W2.5E
Can be switched between the line voltage and phase voltage.
Both the phase voltage and line voltage are stored as a output
data. (3P4W2.5E is available after the rmware update)
86
Page 93

6.5 Verifying the Current Details
Press the [MONITOR] key to display the MONITOR, Current screen.
Current total harmonic distortion (calculation method THD-F / THD-R)
See Calculation method (p. 66).
Current waveform peak (-)
Current waveform peak (+)
RMS current
Average value of
the channels
K factor
See “Appx. 9
Terminology”
(p. Appx.24).
Verifying the Current Details
Current crest factor
([absolute value of current waveform
peak]/[RMS current])
Current zero-phase
unbalance factor
(Not displayed for
3-phase 3-wire)
See “Unbalance
factor” (p. Appx.29).
Current DC value
Current negative-phase unbalance factor
See “Unbalance factor” (p. Appx.29).
6
Verifying the Waveform, Measured Values (MONITOR Screen)
87
Page 94

Verifying the Vector
6.6 Verifying the Vector
Press the [MONITOR] key to display the MONITOR, Vector screen.
The voltage and current phase relationships for each harmonic order of the CH1 to CH4 are
displayed in the vector diagram.
Measured value
1
2 3
4
of frequency
Enables you to set the numerical values to be displayed.
1
Level RMS voltage and RMS current
Takes the fundamental wave component as 100% and shows a
% of FND
Phase
harmonic of each order in terms of proportion to the fundamental
wave component.
The phase angle of each harmonic order when the phase of
fundamental wave components of the reference source is
expressed in terms of 0°.
Move the cursor
Select
5
Voltage negative-phase unbalance factor
Current negative-phase unbalance factor
88
Enables you to set the display method of the axes.
2
Linear Linear display
Log Logarithmic display (low levels also become easily visible.)
Enables you to set at the time of Phase display.
3
Set the display method of numbers of phase angle.
±180 Lead 0 to 180°, lag 0 to −180°
Lag360 Lag 0 to 360°
Enables you to set when Lag360 is set.
4
Select the reference (0°)source.
U1, I1, U2, I2, U3, I3
Enables you to set the number of harmonic orders to be displayed.
5
The values of the frequency, voltage negative-phase unbalance factor (Uunb), and current negativephase unbalance factor (Iunb) remain the same as calculated by using the fundamental wave (1st
order).
0 to 50
Page 95

Verifying the Harmonics Graph and Harmonics Numerical Values
6.7 Verifying the Harmonics Graph and Harmonics Numerical Values
Press the [MONITOR] key to display the MONITOR, Harmonics: graph screen or MONITOR,
Harmonics: list screen. You can switch between the harmonics graph and harmonics numerical
values by using the [F2] key.
MONITOR, Harmonics: graph screen
Measured value
1
2 3
4
of frequency
Move the cursor
Select
5
Harmonic voltage
Interharmonic voltage
Voltage total
harmonic distortion *
Harmonic current
Interharmonic current
Current total
harmonic distortion *
Harmonic power
*: See calculation method (p. 66).
If 0th order (direct current component) of voltage and current is negative, the bar will turn green.
Enables you to set the display channel.
1
CH1 to CH4
ALL
SUM Only the active power (P) is displayed.
The voltage (U), current (I), and electric power (P) of the selected channels
are displayed.
The bar graphs of all the channels (all phases) are displayed. The orders
are displayed up to 30th order.
6
Verifying the Waveform, Measured Values (MONITOR Screen)
Enables you to set the parameters to be displayed.
2
Level RMS voltage, RMS current, and electric power
% of FND
Phase
Enables you to set at the time of Level display and % of FND display.
3
Enables you to set the display method of the axes.
Liner Linear display
Log Logarithmic display (low levels also become easily visible.)
Enables you to set the display of the interharmonics.
4
ON, OFF
Takes the fundamental wave component as 100% and shows a harmonic of
each order in terms of proportion to the fundamental wave component.
Voltage, current: The phase angle of each harmonic order when the phases
of the fundamental wave components of U1 are expressed in terms of 0°
Active power: The power factor of each harmonic order is expressed in
terms of angle
If the level exceeds 0.01% of the range, the phase is indicated by yellow
bars; does not exceed, by gray bars.
89
Page 96

Verifying the Harmonics Graph and Harmonics Numerical Values
Set the number of harmonic order to be displayed.
5
The Cursor moves to the selected order.
0 to 50
MONITOR, Harmonics: list screen
Measured value
1
2 3
4
of frequency
Interharmonics
*: See calculation method (p. 66).
Enables you to set the display parameters.
1
U Voltage
I Current
Move the cursor
Select
Total harmonic distortion
Example: 41.5th order
P Active power
Enables you to set the display channel.
2
CH1 to CH4
SUM Only the active power (P) is displayed.
Enables you to set the parameters to be displayed.
3
Level RMS voltage, RMS current, and active power
% of FND
Phase
Enables you to set the display of the interharmonics.
4
ON, OFF
The voltage (U), current (I), and active power (P) of the selected channels
are displayed.
Takes the fundamental wave component as 100% and shows a harmonic of
each order in terms of proportion to the fundamental wave component.
Voltage, current: The phase angle of each harmonic order when the phases
of the fundamental wave components of U1 are expressed in terms of 0°
Active power: The power factor of each harmonic order is expressed in
terms of angle
90
Page 97

Recording (Save) (SET UP
7
Screen)
7.1 Start and Stop of the Recording
Press the [START/STOP] key to start or stop the recording by the method which is described on
the SET UP, Recording settings screen (p. 69).
The measurement data is stored to SD memory card. (If no SD memory card is inserted, data will
be saved in the instrument’s internal memory.)
See “File Saving and Operations (FILE Screen)” (p. 115).
Start and stop the recording manually
Recording start: manual, recording stop: manual
RECORDING
Recording start
Start and stop recording at the determined time
Recording start: set time, recording stop: set time
WAITING
If the set time has already passed when the [START/STOP] key is pressed, the recording will be started at an
appropriate time punctuation (Interval).
RECORDING
2016/4/10
8:00
Recording start Recording stop
Recording stop
2016/4/12
18:00
7
Recording (Save) (SET UP Screen)
91
Page 98

Start and Stop of the Recording
Start recording at an appropriate time punctuation
Recording start: interval, recording stop: manual or set time
Example: Recording interval is set to 10 min
WAITING RECORDING
Present time
10:41:22
If the recording interval is 30 sec or below, the recording will start at “10:42:00.”
Recording start
10:50:00
Repeat recording
Recording start: repeat, recording stop: repeat, recording period: variable period
Example 1: If the recording period is 00:00 to 24:00 and recording interval is 10 min.
WAITING
Present time
10:41:22
Example 2: If the
WAITING
Recording start
10:50:00
recording period
RECORDING RECORDING
Recording (electric
energy) reset
24:00:00
Recording resume
00:00:00
is 08:00 to 18:00
(Repeat until the stop date)
RECORDING
WAITING
RECORDING
(Repeat until
the stop date)
Recording (electric
energy) reset
24:00:00
Recording resume
00:00:00
RECORDING
Present time
7:32
If the set time has already passed when the [START/STOP] key is pressed, the recording will start at an
appropriate time punctuation (Interval).
Start date
Recording start
08:00
Recording stop
18:00
Recording start
08:00
Recording stop
18:00
92
Page 99

Start and Stop of the Recording
Status of the recording operation
It can be determined from the background color of the screen and lighting state of the START/
STOP LED.
Screen background Operation status
Gray (no character):
(START/STOP LED: Off)
• Recording is stopped.
• These settings can be changed.
START/STOP LED
Yellow (WAITING):
(START/STOP LED: Blinking)
• Recording is in standby.
• This screen is shown from the time the
[START/STOP] key is pressed until the
recording actually starts.
• During repeated recording, this screen is
also displayed when recording is stopped.
• These settings can not be changed.
Green (RECORDING):
(START/STOP LED: On)
• Recording is in progress.
• These settings can not be changed.
7
Recording (Save) (SET UP Screen)
93
Page 100

Using the Instrument During an Interruption
7.2 Using the Instrument During an Interruption
If the supply of power to the instrument is cut off while recording is in progress, measurement
operation will stop during the interruption. The setting conditions will be backed up.
When the power supply is restored, the recording will reset once and it will be resumed as a new
recording.
If the Model Z1003 Battery pack has been installed, the instrument will automatically switch to
battery power in the event of an interruption and continue recording.
IMPORTANT
If the supply of power to the instrument is cut off while accessing the SD memory card, les on
the card may be corrupted. Since the SD memory card is accessed frequently when recording
with a short recording interval time, le corruption is more likely to occur if an interruption occurs
during such use.
It is recommended to avoid such inuences of interruptions by using the Model Z1003 Battery
pack supplied as an accessory.
94
 Loading...