

Page 1

Instruction Manual
MR8880-20
MEMORY HiCORDER
September 2013 Revised edition 5 MR8880B980-05 13-09H
Page 2

Page 3

Contents
Procedure...................................................................................1
Introduction.................................................................................3
Confirming Package Contents....................................................4
Safety Information ............................. ............................... ... ... ....5
Operating Precautions................................................................8
Chapter 1
Overview ____________________________________23
1.1 Product Overview and Features .............................23
1.2 Names and Functions of Parts ...............................24
1.3 Screen Configuration and Display .........................26
Chapter 2
Measurement Preparations_________________33
2.1 Using the Alkaline Battery Box (Accessory) or
Battery Pack (Option) ............................................ ..34
Installing the Alkaline Battery Box and Replacing the Batteries 35
Install the Battery Pack .............................................................36
Charge the Battery Pack ..........................................................38
2.2 Connecting the AC Adapter ....................................39
2.3 Connecting Measurement Cables to the Memory
HiCorder ...................................................................40
Connecting Connection Cords (to record voltage waveforms) .40
Connecting a Clamp Sensor (to record current waveforms) ....41
Connecting the Logic Probe (to record logic signals) ...............42
2.4 Connecting Printer and Loading Recording Paper
(Options) ...................................................................43
Connecting the Printer ..............................................................43
Loading the Recording Paper ...................................................44
2.5 Attaching the Carrying Strap ..................................46
2.6 Turning the Power On and Off ...............................47
2.7 Using CF Card or USB Flash Drive
(for Saving Data) ......................................................48
CF Card Insertion & Removal ..................................................49
i
Contents
1
2
Page 4

ii
Contents
USB Flash Drive Insertion & Removal .....................................49
Formatting a CF Card/USB Flash Drive ..................................50
2.8 Compensating for Input Circuit Offset
(Zero Adjustment) .......... ............................... ... .. ..... 51
Chapter 3
Basic OperatingProcedures ________________ 53
3.1 Pre-Operation Inspection....................................... 53
3.2 Measurement Flow ................................................. 54
3.3 Basic Operation ...................................................... 57
Checking Input State (Monitor) ................................................57
Configuring Settings (Changing Settings) ................................59
Starting and Stopping Measurement .......................................60
Viewing Measurement Results
(Scrolling Waveforms & Displaying Measurement Values) ..... 62
Saving Data .............................................................................63
Printing Data ............................................................................64
Disabling Key Operations (Key-Lock Function) .......................64
3.4 Measurement Using Setting Wizard
(PRESETS key) ........................................................ 65
Configuring Settings by Following Instructions in Navigation
(Basic Guide) ...........................................................................65
Selecting Application and Configure Settings
(Measurement Guide) ..............................................................66
Loading Setting Configuration Data .........................................67
Chapter 4
Setting the Measurement Conditions
(When you want to customize the settings)69
4.1 Flow of Configuring Settings Individually ............ 69
4.2 Recording Methods (Measurement Functions) ... 70
4.3 Using High-speed Function
(Instantaneous Recording) ............................... ..... 72
Selecting the Function (High-speed Function) ........................72
Setting the Horizontal Axis (Time Base Range) ......................73
Setting Recording Length (no. of divisions) .............................76
Set the Recording Length for Repeated or One-time
Recording ................................................................................77
Page 5

Configuring Settings Automatically (Auto Range) ....................78
4.4 Using Real-time Function
(Fluctuation Recording) ........ ... ... ............................80
Selecting the Function (Real-time Function) ............................80
Setting the Interval for the Data to Record (Recording Interval) 81
Setting the Recording Time ......................................................83
Setting the Repeat Operation (Repeat Measurement or Single
Measurement) ..........................................................................85
Retaining Records of Maximum and Minimum Values
(Envelope) ................................................................................86
4.5 Setting the Input Conditions ..................................88
Setting the Input Channel (Instantaneous Value/Effective
Value & Measurement Range) .................................................88
Selecting a Low-Pass Filter (L.P.F.) .........................................90
Selecting the Input Coupling Method .......................................90
4.6 Setting the Screen Display ...................... .. ... ..........91
Expanding and Compressing in the Horizontal Axis (Time Axis)
Direction ...................................................................................91
Setting Display Range in Vertical Axis Direction ......................93
Setting the Display Format
(Screen Splitting/Synthesis/Graph Assignment) ......................96
Setting Waveform Display Colors & Turning On/Off Display ....98
Converting Measurement Values (Scaling Function) ...............99
Setting Logic Channel Display Colors ....................................102
Setting Logic Channel Display Positions ................................102
Setting the Recording Width of Logic Waveforms ..................103
4.7 Setting Automatic Saving ........ ... .. ... .. ... ................104
Replacing CF Card or USB Flash Drive during Saving
([Realtime] only) .....................................................................108
4.8 Setting Automatic Printing ...... ... .. ........................110
4.9 Recording Using Specific Conditions
(Trigger Function) .................................................112
What is a Trigger? ..................................................................112
Enabling the Trigger Function ................................................113
Setting the Trigger Timing ......................................................113
Setting AND/OR Trigger Application Conditions ....................115
Recording Data Before Trigger Applied (Pre-trigger) .............117
Setting the Trigger Type for Analog Input Signals ..................118
Applying a Trigger at a Specified Value (Level Trigger) .........119
iii
Contents
2
3
4
Page 6

iv
Contents
Applying a Trigger Using Range Specified by Upper & Lower Limit
Values (Window Trigger) .......................................................121
Detecting Instantaneous Power Failure of Commercial Power
Supply (Voltage Drop Trigger) (High-speed Function only) ...122
Monitoring Commercial Power Supply
(Waveform Judgment Trigger) (High-speed Function only) ..123
Applying Trigger with Logic Input Signal (Logic Trigger) ....... 126
Applying Trigger at Fixed Time Interval (Interval Trigger) .....128
Applying Trigger with External Input Signal (External Trigger) 129
4.10 Entering Comments and Titles ....................... ..... 130
Setting the Title and Comments ............................................130
Printing the Title and Comments ...........................................132
Chapter 5
Waveform Analysis ________________________133
5.1 Observing Waveforms .......................................... 133
Displaying Waveforms (Display Descriptions) .......................133
Scrolling Waveforms ..............................................................134
Verifying Waveform Display Position .....................................135
Displaying Gauges .................................................................136
Magnifying and Compressing Horizontally ............................137
Viewing Any Waveform Location (Jump Function) ................139
Displaying Cursor Values ......................................................140
Specifying a Waveform Time Span .......................................142
5.2 Marking Waveforms and Searching Marks
(Search Function) .. ... ............................... .. ... ........ 143
Inserting Event Marks While Viewing Waveforms .................143
Inserting Event Marks Using External Input Signals ..............144
Searching Event Marks ..........................................................145
Viewing Events in Text Format (CSV) ...................................146
5.3 Synthesizing Waveforms (X-Y Synthesis) .......... 147
Synthesizing All Acquired Data ..............................................147
Synthesizing Part of the Data ................................................148
Chapter 6
Managing Data_____________________________149
6.1 Saving & Loading Data ......................................... 149
About the File Hierarchy ........................................................149
Page 7

About File Types & Saving/Loading .......................................150
Preparations and Settings for Power Outages during Long-term
Measurements ........................................................................151
6.2 Saving Data ..... ............................... ... .. ...................152
Selecting & Saving Data with the SAVE Key [Select&Save] ..154
Saving immediately with the SAVE Key [Quick Save] ............155
Saving Setting Configuration Data .........................................157
6.3 Loading Data on the HiCorder ..............................158
Loading a Setting Configuration .............................................158
Loading Waveform Data and Screen Images ........................160
6.4 Data Management ..................................................161
Switching Removable Storage ...............................................161
Viewing Folder Contents and the Parent Folder ....................161
Deleting Data ..........................................................................162
Renaming Files and Folders ..................................................163
Sorting Files ...........................................................................164
Chapter 7
Printing____________________________________ 165
7.1 Printing Waveform after Measurement
(Manual Print) .........................................................166
Printing Whole Waveform .......................................................166
Specifying the Range to Print (Partial Print) ...........................167
7.2 Printing the Screen Display (Screen Hardcopy) .168
7.3 Printing the Setting Information (List Print) ........169
7.4 Print Examples .......................................................170
7.5 Various Print Settings ...........................................171
Printing the Channel Number or Comment (Channel Marker) 171
Setting the Grid Type .............................................................172
Setting the Print Density .........................................................173
Printing Setting List and Gauge (List & Gauge) .....................173
Specifying the Range to Print (Print Range) ..........................174
7.6 Feeding ............................ ....................... ................ 175
7.7 Performing a Printer Check ..................................175
v
Contents
4
5
6
7
Page 8

vi
Contents
Chapter 8
Numerical Calculations ___________________177
8.1 Calculation Methods ........ ... ............................... ... 177
8.2 Calculating Automatically (Auto Calculation) .... 179
Calculating at Specified Interval (Interval Calculation) ..........181
8.3 Calculating after Measurement
(Manual Calculation) ............................................. 182
Performing Calculation for All Data ........................................182
Apply Calculations to a Specific Time Span ..........................183
8.4 Numerical Value Calculation Expressions ......... 184
Chapter 9
Scheduling Measurement _________________187
9.1 Starting & Stopping Measurement on a
Specified Day ...... .................................................. 187
9.2 Starting & Stopping Measurement Periodically . 189
9.3 Canceling a Schedule ........................................... 191
9.4 About Schedule Function Operation .................. 193
9.5 Setting Examples .................................................. 195
Chapter 10
System Environment Settings_____________197
10.1 Operation Settings ........................................... .. ... 198
Using the Auto-Resume Function
(Resume After Power Restoration) ........................................198
File Protection Level Setting ..................................................198
10.2 Screen Key Operation Settings ........................... 199
Enabling and Disabling the Backlight Saver ..........................199
Adjust Backlight Brightness ...................................................199
Selecting Black or White Screen Background .......................200
Enabling or Disabling the Beeper ..........................................200
Selecting the Horizontal (Time) Axis Display .........................201
Display of Start/Stop Confirmation Messages .......................201
Setting the SAVE Key Action .................................................202
Selecting the Display Language ............................................202
10.3 CSV File Saving Settings ..................................... 203
CSV File Data Decimal and Separator Characters ................203
Page 9

vii
Contents
10.4 Making System Settings ............... ... .....................204
Setting the Date and Time ......................................................204
Initializing the HiCorder (System Reset) ................................204
Self-Test .................................................................................205
Chapter 11
Connection to a PC _______________________ 207
11.1 USB Settings and Connections ............................207
11.2 Importing Data to a Computer ..............................208
Select the USB Drive Mode ....................................................208
Connecting the Instrument and Computer .............................209
11.3 Communication Using Commands ......................210
Setting Communication ..........................................................210
Installing the USB Driver ........................................................211
Connecting the Instrument and Computer .............................214
Uninstalling the USB Driver ....................................................216
Chapter 12
External Control __________________________ 217
12.1 Connecting to the External Control Terminals ...217
12.2 External Signal Input (External Trigger Input) ....219
12.3 External Signal Output (Trigger Output) .............221
12.4 Controlling Instrument Using External Inputs
(START/IN1 and STOP/IN2) ...................................223
12.5 Using External Outputs (ALM/OUT) ..... ... .. ... .. ... ...225
12.6 Synchronous Measurements with Multiple
Instruments ....................... ..................................... 226
13
14
8
9
10
Chapter 13
Specifications_____________________________ 227
13.1 MR8880-20 Specifications ....................................227
13.2 High-speed Function .............................................235
13.3 Real-time Function ................................................236
13.4 Other Functions ... ... .. ................................ .. ... ........239
13.5 Monitor Functions .................................................243
13.6 Setting Wizard Function (PRESETS) ...................243
11
12
Appendix
Index
Page 10

viii
Contents
Chapter 14
Maintenance and Service _________________245
14.1 Inspection, Repair, and Cleaning ........................ 245
14.2 Troubleshooting ................................................... 249
14.3 Disposing of the Instrument . .. ... .. ... ..................... 251
Appendix ______________ A1
Appendix 1 Error Messages and Remedial Actions.......A1
Appendix 2 List of Default Settings .................................A7
Appendix 3 File Naming ..................................................A12
Appendix 4 Text File (CSV File) Internal Format...........A13
Appendix 5 Waveform File Size......................................A15
Appendix 6 Maximum Recordable Time........................A16
Appendix 7 Supplemental Technical Information.........A19
Appendix 8 Frequently Asked Questions......................A21
Appendix 9 Options.........................................................A26
Appendix 10 Installing Waveform Viewer........................A28
Index___________________________________Index 1
Page 11
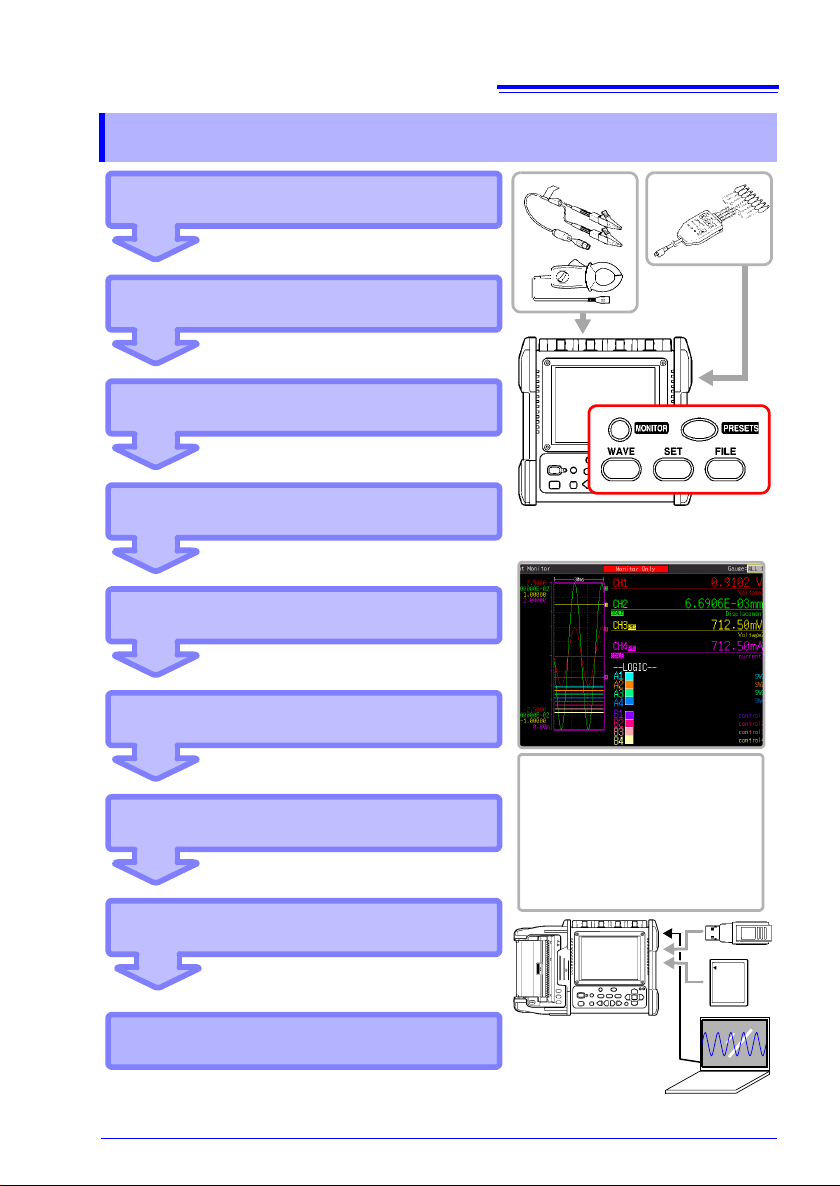
Procedure
Setup (p. 65)
Preparation (p. 33)
Inspection (p. 53)
You can customize the settings as
necessary (p. 69).
Start of Measurement
View Input State (p. 57)
End of Measurement
Analyze with Instrument (p. 133)
Save (p. 149) and Print (p. 165)
Analyze with computer
You can also automatically save (p. 104)
and print (p. 110) data.
You can configure the settings
easily with Setting Wizard.
1
Procedure
Page 12

2
Procedure
Page 13

Introduction
Introduction
Thank you for purchasing the HIOKI Model MR8880-20 Memory HiCorder. To obtain
maximum performance from the instrument, please read this manual first, and keep
it handy for future reference.
The inputs of the instrument are specifically for voltage input.
An optional clamp-on probe is required for current measurement w ith the Memory
HiCorder. In this manual, all models of these probes are collectively referred to as
"clamp sensors." For details, refer to the instruction manual of the particular clamp
sensor to be used.
Registered Trademarks
• Windows and Excel are registered trademarks of Microsoft Corporation.
• CompactFlash is a registered trademark of Sandisk Corporation (USA).
3
Page 14
4
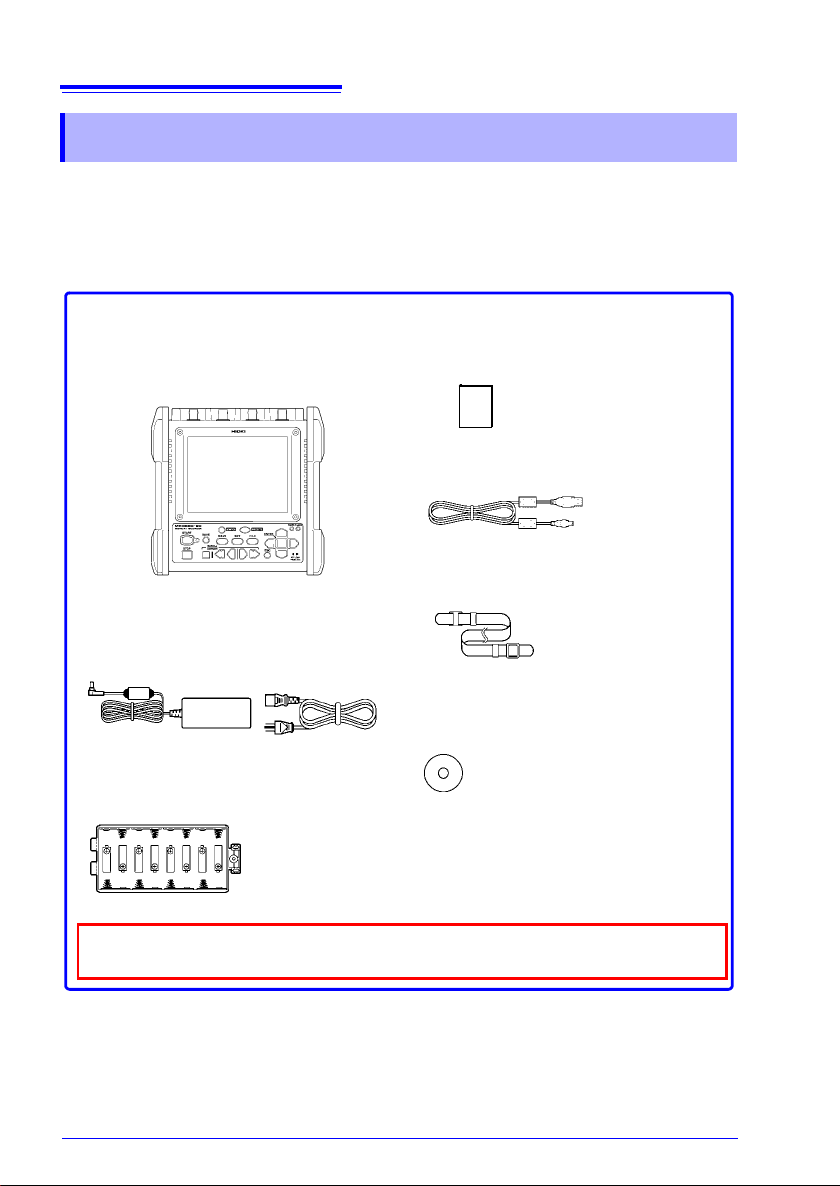
Confirm that these contents are provided.
Model MR8880-20 Memory HiCorder
.......................................................... 1
Model Z1002 AC Adapter ................ 1
with supplied power cord
Alkaline Battery Box........................ 1
(p. 39)
(p. 34)
Instruction Manual (This document)1
USB cable..........................................1
Strap ..................................................1
Application program CD
(Waveform Viewer (Wv),
Communication command).............1
(p. 209)
(p. 46)
The latest version can be downloaded from our web site.
Use the original packing materials when transporting the instrument,
if possible.
Confirming Package Contents
Confirming Package Contents
When you receive the instrument, inspect it carefully to ensure that no damage
occurred during shipping. In particular, check the accessories, panel switches, and
connectors. If damage is evident, or if it fails to operate according to the specifications, contact your dealer or Hioki representative.
For information about options: (p. A26)
Contact your dealer or Hioki representative for details.
Page 15
Safety Information
Safety Information
This instrument is designed to comply with IEC 61010 Safety Standards, and has been thoroughly tested for safety prior to shipment. However, mishandling during use could result in injury or
death, as well as damage to the instrument. Using the instrument
in a way not described in this manual may negate the provided
safety features.
Be certain that you understand the instructions and precautions
in the manual before use. We disclaim any responsibility for accidents or injuries not resulting directly from instrument defects.
This manual contains information and warnings essential for safe operation of the
instrument and for maintaining it in safe operating condit ion . Bef ore usin g it, b e sure
to carefully read the following safety precautions.
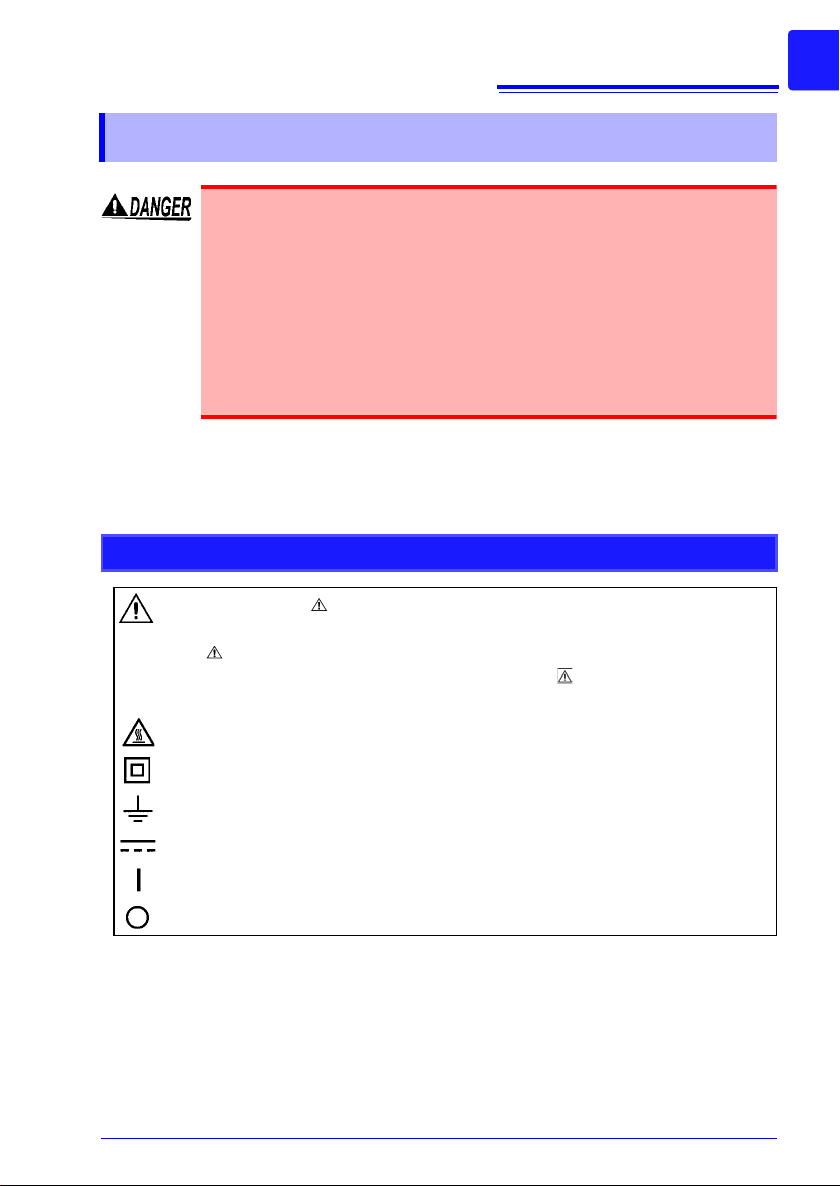
Safety Symbols
In the manual, the symbol indicates particularly important information that the
user should read before using the instrument.
The symbol printed on the instrument indicates that the user should refer to a
corresponding topic in the manual (marked with the symbol) before using the
relevant function.
Indicates a burn hazard if touched directly.
5
Indicates a double-insulated device.
Indicates a grounding terminal.
Indicates DC (Direct Current).
Indicates the ON side of the power switch.
Indicates the OFF side of the power switch.
Page 16
6
Ni-MH
Safety Information
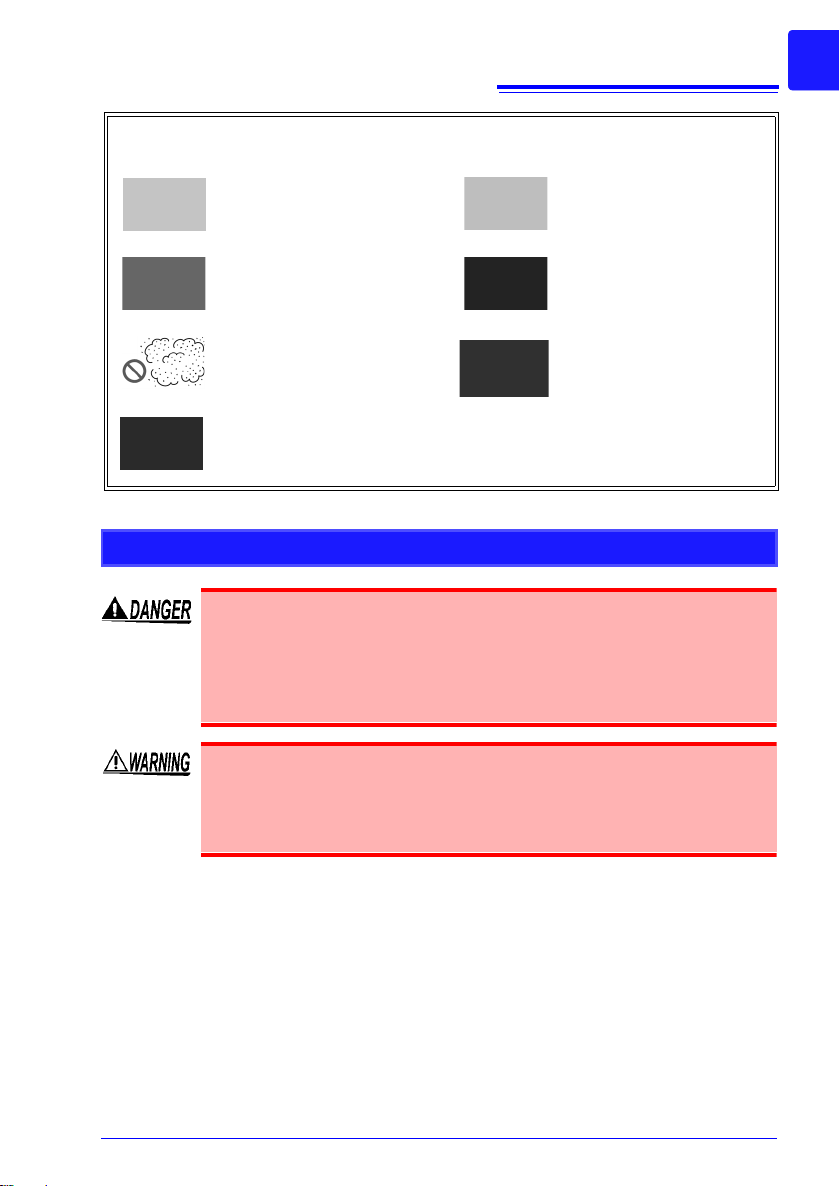
The following symbols in this manual indicate t he relative importance of cautions
and warnings.
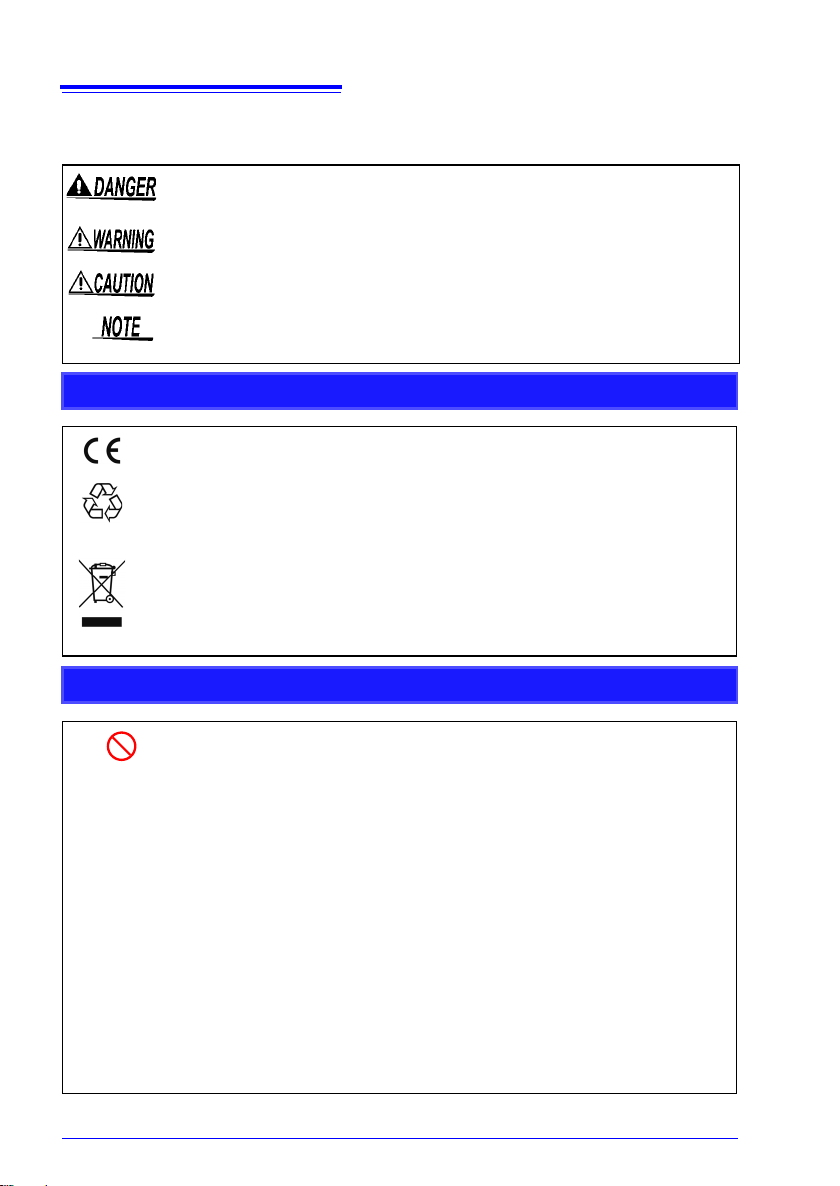
Indicates that incorrect operation presents an extreme hazard that could
result in serious injury or death to the user.
Indicates that incorrect operation presents a significant hazard that could
result in serious injury or death to the user.
Indicates that incorrect operation presents a possibility of injury to the user
or damage to the instrument.
Indicates advisory items related to performance or correct operation of the
instrument.
Symbols for V arious Standards
This symbol indicates that the product conforms to safety regulations set out by
the EC Directive.
This is a recycle mark established under the Resource Recycling Promotion
Law (only for Japan).
WEEE marking:
This symbol indicates that the electrical and electronic appliance is put on the
EU market after August 13, 2005, and producers of the Member States are
required to display it on the appliance under Article 11.2 of Directive 2002/96/
EC (WEEE).
Other Symbols
Indicates the prohibited action.
( p. )
*
[ ] The names of setting objects and buttons on the screen are indicated by
SET
(Bold charac-
ters)
• Unless otherwise specified, "Windows" represents Windows 2000, Windows XP, Windows Vista, or Windows 7.
• Dialog box represents a Windows dialog box.
• Click: Press and quickly release the left button of the mouse.
• Double click: Quickly click the left button of the mouse twice.
Indicates the location of reference information.
Indicates that descriptive information is provided below.
square brackets [ ].
Bold characters within the text indicate operating key labels.
Page 17
Safety Information
Accuracy
We define measurement tolerances in terms of f.s. (full scale), rdg. (reading) and
dgt. (digit) values, with the following meanings:
f.s.
(maximum display value or scale length)
The maximum displayable value or scale length. In this instrument, the
maximum displayable value is the range (V/div) times the number of divisions (10) on the vertical axis. Example: For the 1 V/div range, f.s. = 10 V
rdg.
(reading or displayed value)
The value currently being measured and indicated on the measuring instrument.
dgt.
(resolution)
The smallest displayable unit on a digital measuring instrument, i.e., the
input value that causes the digital display to show a "1" as the least-significant digit.
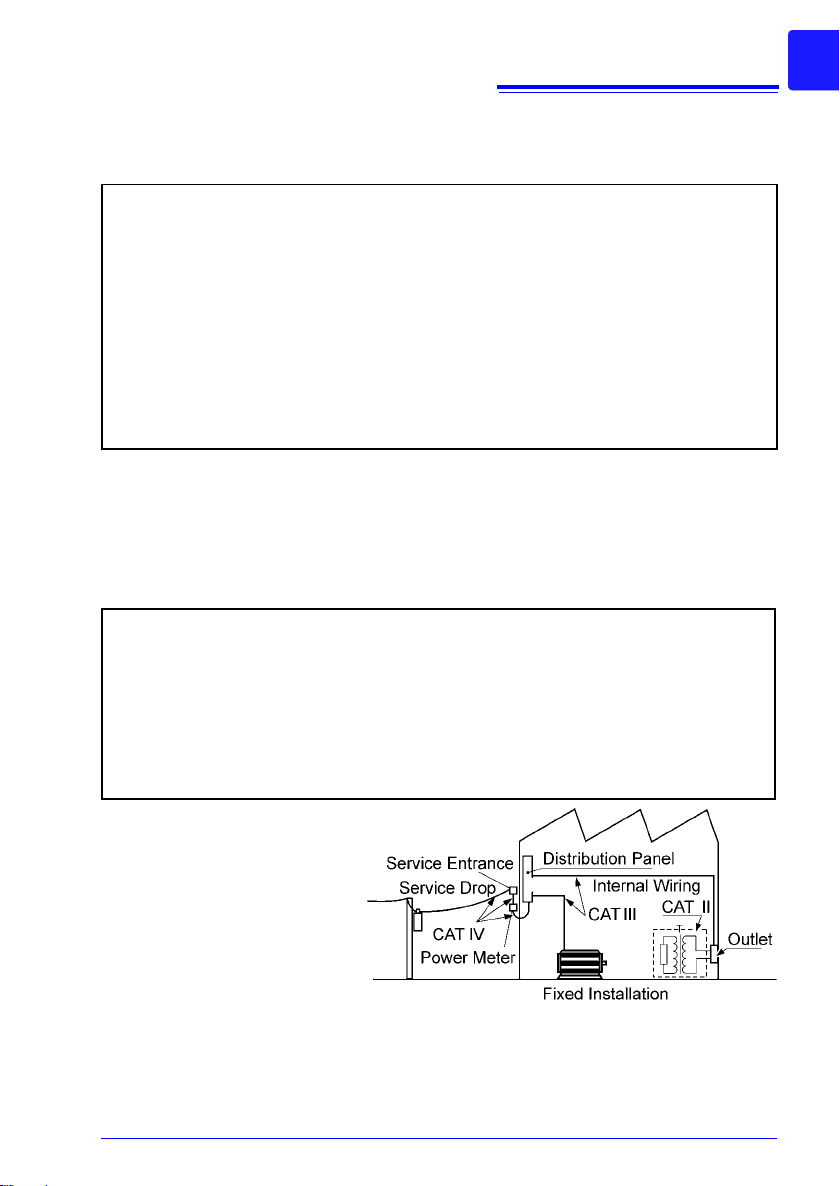
Measurement categories
This instrument complies with CAT IV (300 V AC/DC), CAT III (600 V AC/DC) safety
requirements.
To ensure safe operation of measurement instruments, IEC 61010 establishes
safety standards for various electrical environments, categorized as CAT II to CAT
IV, and called measurement categories.
CAT II Primary electrical circuits in equipment connected to an AC electrical outlet by a
CAT III Primary electrical circuits of heavy equipment (fixed installations) connected
CAT IV The circuit from the service dr op to the service entranc e, and to the power mete r
Using a measurement instrument in an environment designated with a higher-numbered
category than that for which the
instrument is rated could result
in a severe accident, and must
be carefully avoided.
Use of a measurement instrument that is not CAT-rated in
CAT II to CAT IV measurement
applications could result in a
severe accident, and must be carefully avoided.
power cord (portable tools, household appliances, etc.) CAT II covers directly
measuring electrical outlet receptacles.
directly to the distribution panel, and feeders from the distribution panel to outlets.
and primary overcurrent protection device (distribution panel).
7
Page 18

8
Operating Precautions
Operating Precautions
Follow these precautions to ensure safe operation and to obtain the full benefits of
the various functions.
Before Use
Before using the instrument the first time, verify that it operates normally to en sure
that no damage occurred during storage or shipping. If you find any damage, contact
your dealer or Hioki representative.
Before using the instrument, make sure that the insulation on the
probes, connection cords, and clamp sensor leads is unda maged
and that no bare conductors are improperly exposed. Using the
instrument in such conditions could cause an electric shock, so
contact your dealer or Hioki representative for replacements.
Instrument Installation
Operating temperature and humidity
Temperature: -10°C to 50°C (14 to 122°F),
Humidity: -10°C to 40°C (14 to 104°F) at 80%RH or less (non-condensating)
40°C to 45°C (104 to 113°F) at 60%RH or less (non-condensating)
45°C to 50°C (113 to 122°F) at 50%RH or less (non-condensating)
• During battery operation: 0°C to 40°C (32 to 104°F) at 80% RH or less (non-condensating)
• During batt ery charging : 10°C to 4 0°C (50 to 104°F) at 80% RH or less (non-co ndensating)
Temperature and humidity range for guaranteed accuracy: 23±5°C
80%RH or less (non-condensating)
(73±9°F),
Page 19
Operating Precautions
Avoid the following locations that could cause an accident or damage to the
instrument.
9
Exposed to direct sunlight
Exposed to high temperature
Exposed to water, oil, other
chemicals, or solvents
Exposed to high humidity or
condensation
Exposed to high levels of
particulate dust
Subject to vibration
Handling the Instrument
• Do not allow the instrument to get wet, and do not take measurements with wet hands. This may cause an electric shock.
• To avoid electric shock, do not remove the instrument's case.
The internal components of the instrument carry high voltages
and may become very hot during operation.
• Do not attempt to modify, disassemble or repair the instrument;
as fire, electric shock and injury could result.
• Avoid obst ructi ng the ventil ation holes on the sides of the instrument, as it could overheat and be damaged, or cause a fire.
In the presence of corrosive or explosive gases
Exposed to strong electromagnetic fields
Near electromagnetic radiators
Near induction heating systems (e.g., high-frequency
induction heating systems
and IH cooking utensils)
Page 20

10
Operating Precautions
• The operating temperature range of the instrument is -10°C to 50°C.
Do not use the instrument in an environment that is out of this range.
• To avoid damage to the instrument, protect it from physical shock
when transporting and handling. Be especially careful to avoid physical shock from dropping.
• This instrument may cause interference if used in residential areas.
Such use must be avoided unless the user takes special measures to
reduce electromagnetic emissions to prevent interference to the
reception of radio and television broadcasts.
• Before transporting the instrument, disconnect all cables and remove
any CFcard, USB flash drive and recording paper.
• Do not slant the device or place it on top of an uneven surface. Dropping or knocking down the device can cause injury or da mage to the
device.
• The instrument is equipped with a protector. The physical shock protection provided by the protector does not fully prevent instrument failures. Be sufficiently careful when handling the instrument.
Correct measurement may be impossible in the presence of strong
magnetic fields, such as near transformers and high-current condu ctors, or in the presence of strong electromagnetic fields such as near
radio transmitters.
Handling the Cords and Cables
• Avoid stepping on or pinching cables, which could damage the cable
insulation.
• To avoid breaking the cables, do not bend or pull them.
• To avoid damaging the power cord, grasp the plug, not the cord, when
unplugging it from the power outlet.
• When disconnecting the BNC connector, be sure to release the lock
before pulling off the connector. Forcibly pulling the connector without
releasing the lock, or pulling on the cable, can damage the connector.
• To prevent an electric shock accident, confirm that the white or red
portion (insulation layer) inside the cable is not exposed. If a color
inside the cable is exposed, do not use the cable.
Page 21

11
Operating Precautions
• Use only the specified connection cables. Using a non-specified cable
may result in incorrect measurements due to poor connection or other
reasons.
• Before using a clamp sensor or logic probe, read the instruction manual supplied with it.
Page 22

12
Operating Precautions
Alkaline Battery Box (Accessory) and Battery Pack (Option)
About installation procedure: "2.1 Using the Alkaline Battery Box (Accessory)
or Battery Pack (Option)" (p. 34)
Be sure to observe the following precautions. Incorrect handling
may result in liquid leaks, heat generation, ignition, bursting and
other hazards.
• For the battery pack, use the optional Z1000 Battery Pack. We do
not take any re sponsib ility for accident s or damage related to the
use of any other batteries.
• When using the alkaline battery box, use commercially available
eight LR6 alkaline batteries.
• To avoid the possibility of explosion, do not short circuit, disassemble or incinerate battery pack/battery. Handle and dispose of
batteries in accordance with local regulations.
• When storing the instrument, make sure no objects that could
short-circuit the connectors are placed near them.
• The battery pack and alkaline dry cell batteries contain lye,
which can cause blindness if comes into contact with the eyes.
Should battery liquid get into your eyes, do not rub your eyes
but rinse them in plenty of water and seek the immediate attention of a physician.
• To avoid electric shock, turn off the power switch and disconnect the cables before replacing the batteries or battery pack.
• After installing or replacing the batteries or battery pack, replace
the battery compartment cover and screws.
• Handle and dispose of batteries or battery pack in accordance
with local regulations.
Page 23
About alkaline dry cell batteries
• Do not mix old and new batteries, or different types of batteries. Also,
be careful to observe battery polarity during installation. Otherwise,
poor performance or damage from battery leakage could result.
• Do not use LR6 alkaline batteries together with commercially available nickel hydride batteries or other types of batteries.
• To avoid corrosion an d damage to this instrument from battery leakage, remove the batteries from the instrument if it is to be stored for a
long time (several months or more).
When using battery pack
Observe the following to avoid damage to the instrument.
• Use the battery pack in an ambient temperature range of 0 to 40°C
and charge it in an ambient temperature range of 10 to 40°C.
• If the battery packs fails to complete charging within the stipulated
time, disconnect the AC adapter from the pack to stop charging.
• Consult your dealer or nearest service station should liquid leaks,
strange odor, heat, discoloration, deformation and other abnormal
conditions occur during use, charging or storage. Should these conditions occur during use or charging, turn off and disconnect the instrument immediately.
• Do not expose the instrument to water and do not use it in excessively
humid locations or locations exposed to rain.
• Do not expose the instrument to strong impacts and do not throw it
around.
13
Operating Precautions
Page 24

14
Operating Precautions
• The battery pack is a consumable. If the battery capacity remains very
low after correct recharging, the useful battery life is at an end.
• When a battery pack that has not been used for a long time is used,
charging may end before the battery pack is fully charged. In such a
case, repeat charging and discharging a number of time before use.
(A battery pack may also be in such a state immediately after purchase.)
• The life of the battery pack (when capacity is 60% or more of initial
capacity) is approximately 500 charge-discharge cycles. (The life differs depending on the conditions of use.)
• To prevent battery pack deterioration when the battery will not be
used for 1 month or longer, remove it and store it in a dry location with
an ambient temperature range of between -20 to 30°C. Be sure to discharge and charge it every two months. Long-term storage when
capacity has decreased will make charging impossible and reduce
performance.
• When a battery pack is used, the instrument turns off automatically
when the capacity drops. Leaving the instrument in this state for a
long time may lead to over discharge so be sure to turn off the power
switch on the instrument.
• The charging efficiency of the battery pack deteriorates at high and
low temperatures.
Page 25

Using the AC Adapter
• Use only the supplied Model Z1002 AC Adapter. AC adapter
input voltage range is 100 to 240 V AC (with ±10% stability) at 50/
60 Hz. To avoid electrical hazards and damage to the instrument,
do not apply voltage outside of this range.
• Before connecting to a power supply, make sure the supply voltage matches that indicated on the AC adapter. Connection to an
improper supply voltage may damage the instrument or AC
adapter and present an electrical hazard.
• Turn the instrument off before connecting the AC adapter to the
instrument and to AC power.
• To avoid electrical accidents and to maintain the safety specifications of this instrument, connect the power cord provided only
to a 3-contact (two-conductor + ground) outlet.
• If you wish to use a UPS (uninterruptible power supply) or DC-AC
inverter to power the instrument, do not use a UPS or DC-AC inverter
with square wave or pseudo sine wave output. Doing so may damage
the instrument.
• To avoid damaging the power cord, grasp the plug, not the cord, when
unplugging it from the power outlet.
15
Operating Precautions
• After use, always turn OFF the power.
• Brief power interruptions of 40 ms or less will not cause this instrument to malfunction. However, Longer interruptions may cause the
Memory HiCorder to shut itself off, so consider local power conditions
before installing, as appropriate.
• To ensure that recording is not interrupted by power outages, you can
use the Z1002 AC Adapter and Z1000 Battery Pack together.
Page 26

16
Measurement
cables
Maximum input
voltage
Maximum rated voltage to earth
Model 9197
Model L9197
600 V AC/DC 600 V AC/DC (CAT III, II)
300 V AC/DC (CAT IV)
Model L9198
Model L9217
300 V AC/DC 600 V AC/DC (CAT II)
Model L9790 600 V AC/DC
When using Model L9790-01 Alligator
clip and Model 9790-03 Contact Pin
600 V AC/DC (CAT II)
300 V AC/DC (CAT III)
When using Model 9790-02 Grabber
clip
300 V AC/DC (CAT II)
150 V AC/DC (CAT III)
Model 9322 2000 V DC,
1000 V AC
When using the Grabber clip
1500 V AC/DC (CAT II)
600 V AC/DC (CAT III)
When using the Alligator clip
1000 V AC/DC (CAT II)
600 V AC/DC (CAT III)
Operating Precautions
Connecting to the Terminals
Connecting to the Analog Input Terminals
• Note the following maximum input voltage and maximum rated
voltage to earth.
600 V AC/DC (CAT III, II), 300 V AC/DC (CAT IV)
If their voltages are exceeded, this device will be damaged and
personal injury will result. Therefore, do not perform measurement in this case.
The maximum allowable input voltage is the smaller of that of the
instrument or of the measurement cables.
• The relationship between the maximum allowable input voltage
and the maximum rated voltage to earth of the combined Memory HiCorder and measurement cables is as follows.
To avoid electric shock or damage to the instruments, do not
apply input voltage above the lowest maximum.
The maximum rated voltage to earth in the table applies when
measuring through input attenuators.
Page 27
17
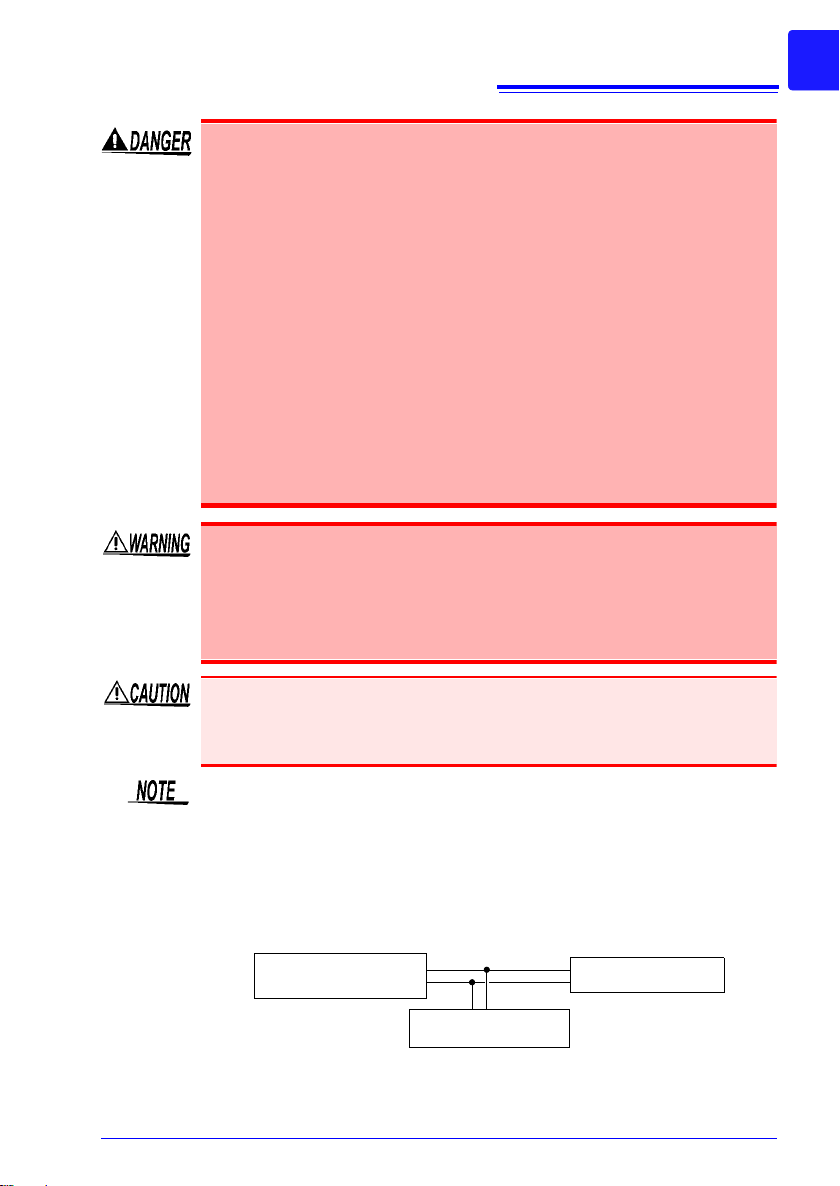
Measurement Object Memory HiCorder
Other instrument
Operating Precautions
Connect the clamp-on sensors or connection cords to the instrument first, and then to the active line s to be measured. Observe
the following to avoid electric shock and short circuits.
• To avoid short circuits and potentially life-threatening hazards,
never attach the clamp to a circuit that operates at more than the
maximum rated voltage to earth, or over bare conductors.
• Do not allow the connection cord clips to touch two wires at the
same time. Never touch the edge of the metal clips.
• When the clamp sensor is opened, do not allow the metal part of
the clamp to touch any exposed metal, or to short between two
lines, and do not use over bare conductors.
• Do not leave the Memory HiCorder connected to test objects in
environments where a voltage surge might exceed the dielectric
withstand voltage. Doing so could result in damage to the Memory HiCorder, bodily injury or fatal accident.
• Do not connect a cable to the instrument while it is connected to
the object to be measured. Otherwise, an electric shock accident
may occur.
• To avoid short-circuit accidents, make certain that connections
are secure.
To prevent damage to the instrument and sensor, never connect or disconnect a sensor while the power is on, or while th e sensor is cla mped
around a conductor.
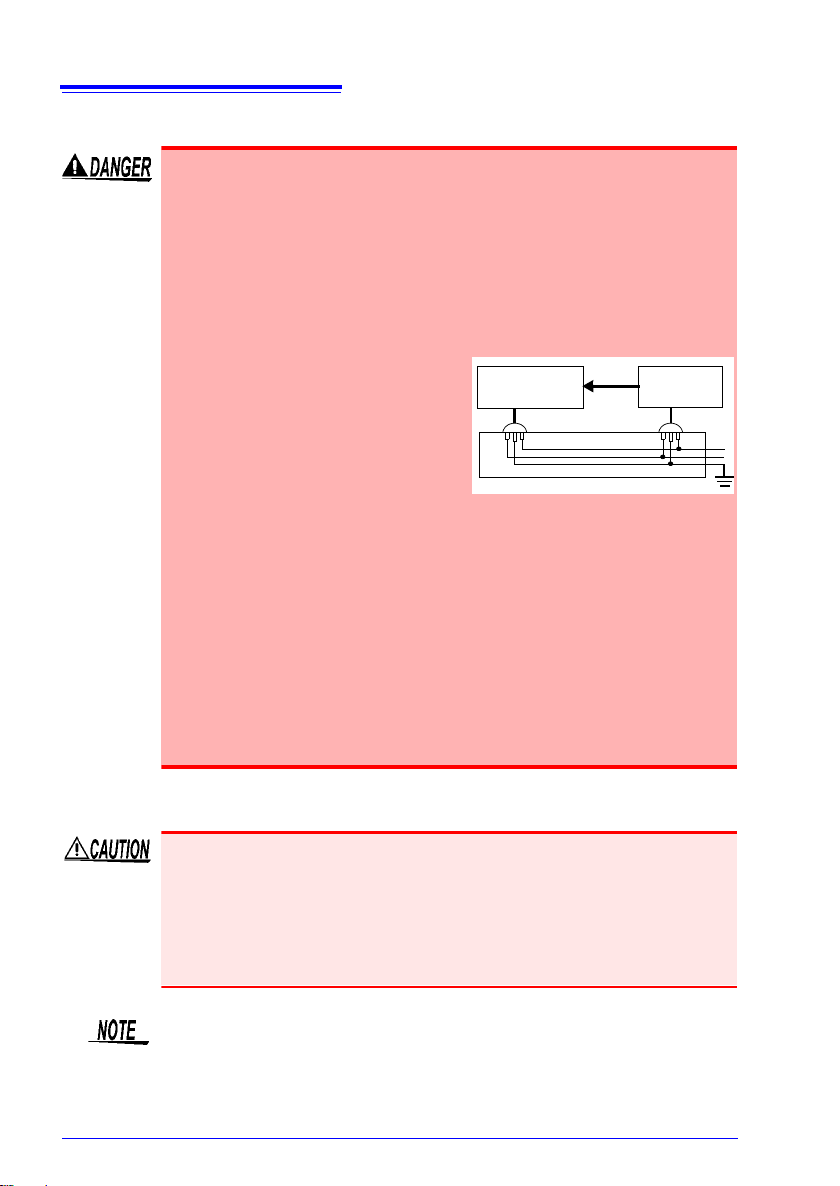
• Lay the connection cords and various cables away from the power
supply line and ground wire.
• Connecting the connection cords and various cables in a parallel configuration with the inputs of another device (see the figure be low) may
result in variations in measurement values and incorrect operation of
the instrument. When connecting with another device in a parallel
configuration, be sure to verify operation.
Page 28
18
Measurement
Object
Memory
HiCorder
Logic
Probe
Operating Precautions
Connecting to the logic terminals
To avoid electric shock and short circuit accidents or damage to
the instrument, pay attention to the following:
• Maximum logic probe input voltages are as follows.
Do not measure if the maximum voltage would be exceeded, as
damage the instrument or personal injury may result.
Model 9320-01 Logic Probe: +50 V DC
Model MR9321-01 Logic Probe: 250 Vrms (HIGH range), 150 V rms
(LOW range)
• The ground terminal for the 932001 Logic Probe is not isolated
from the Memory HiCorder's
ground (chassis ground). Therefore, if the measurement object
connect to AC, it should have a
grounded, polarized plug, and be
connected to the same power outlet as the Memory HiCorder ’s
AC adapter.
If the Memory HiCorder and measurement object are connected
to different mains circuits, or if an ungrounded power cord is
used, the potential difference between the different grounding
paths may result in current flow through a logic probe that could
damage the measurement object or Memory HiCorder.
• Do not allow the metal tip of a logic probe to cause a short
between conductors on the measurement object. Never touch
the metal tip of a probe.
When connecting USB cable
• To prevent a malfunction, do not disconnect the USB cable during
communication.
• The Memory HiCorder and computer should be connected to the
same earth ground. If grounded separately, potential difference
between the ground points can cause malfunctions or damage when
connecting the USB cable.
This instrument cannot be powered by the bus of a PC or USB hub.
When using the instrument, connect the AC adapter or install batteries.
Page 29

When connecting to external control terminals
To avoid electric shock or damage to the equipment, always
observe the following precautions when connecting to external
control terminals.
• Always turn off the power to the instrument and to any devices
to be connected before making connections.
• Be careful to avoid exceeding the ratings of external control terminals.
• Ensure that devices and systems to be connected to the external control terminals are properly isolated.
• The ground of external control terminals and the ground of the
instrument are common and not isolated.
To prevent damage to the instrument, use a grounded power
cord for the device to be connected with the external control terminals and this instrument, and supply power from the same
line. Using different lines or an ungrounded power cord may
result in a potential difference between the grounds depending
on the wiring state, and current flowing through the wiring material may lead to damage of the measurement object or instrument.
• To prevent an electrical accident, use wiring material that has
more than enough dielectric strength and current-carrying
capacity.
19
Operating Precautions
If a cable of 3 meters or longer is connected, the instrument may be
susceptible to the interference of external noise and other EMC environmental factors.
Page 30
20
Measurement data (data captured to internal buffer memory) is
cleared when new measurements are started. If you want to
keep any data, be sure to save it to external media.
Operating Precautions
About the Printer
• The printer head and metal parts nearby become very hot. Be
careful not to touch them because doing so may result in a burn.
• Be careful not to cut a finger with the paper cutter.
• To prevent a malfunction o f the instrument, turn off the power when
connecting the instrument and printer unit.
• Do not directly touch the printer head because there is the risk of it
being damaged by static electricity.
As much as possible, avoid printing in hot and humid environments.
Otherwise, printer life may be severely shortened.
Using a CF Card/ USB Flash Drive
• Inserting a CF card/USB flash drive upside down, backwards or in the
wrong direction may damage the CF card, USB flash drive, or instrument.
• Never remove a CF card or USB flash drive during measurement
while the instrument is accessing the CF card or USB flash drive. The
CF card or USB flash drive and/or the data on it may be damaged.
(The icon of the CF card or USB flash drive on the bottom left of the
screen is displayed in red during access.)
• Do not transport the instrument while a USB flash drive is connected.
Damage could result.
• Some USB flash drives are susceptible to static electricity. Exercise
care when using such products because static electricity could damage the USB flash drive or cause malfunction of the instrument.
• With some USB flash drives, the instrument may not start up if power is
turned on while the USB flash drive is inserted. In such a case, turn
power on first, and then insert the USB flash drive. It is recommended to
try out operation with a USB flash drive before starting to use it for actual
measurements.
Page 31

• The Flash memory in a CF card/USB flash drive has a limited operating life. After long-term usage, data storage and retrieval become difficult. In this case, replace the CF card/USB flash drive with a new one.
• We cannot provide compensation for data loss in a CF card/USB flash
drive, regardless of content or cause of the damage. Furthermore, if a
long time has elapsed since data was recorded to a file, the stored
data may be lost. Always maintain a backup of important data stored
on a CF card/USB flash drive.
• Data can also be saved to a USB flash drive in real time, but from the
perspective of data protection, we recommend using Hioki’s optional
CF card. The operation of media other than Hioki’s optional products
is not guaranteed.
CD Handling
• Always hold the disc by the edges, so as not to make fingerprints on
the disc or scratch the printing.
• Never touch the recorded side of the disc. Do not place the disc
directly on anything hard.
• Do not wet the disc with volatile alcohol or water, as there is a possibility of the label printing disappearing.
• To writ e on the disc label surface, use a spirit-based felt pen. Do not
use a ball-point pen or hard-tipped pen, because there is a danger of
scratching the surface and corrupting the data. Do not use adhesive
labels.
• Do not expose the disc directly to the sun's rays, or keep it in conditions of high temperature or humidity, as there is a danger of warping,
with consequent loss of data.
• To remove dirt, dust, or fingerprints from the disc, wipe with a dry
cloth, or use a CD cleaner. Always wipe from the inside to the outside,
and do no wipe with circular movements. Never use abrasives or solvent cleaners.
• Hioki shall not be held liable for any problems with a computer system
that arises from the use of this CD, or for any problem related to the
purchase of a Hioki product.
21
Operating Precautions
Page 32

22
Operating Precautions
Page 33

23
A
B
123.4V
Measure timing
Logic probes can be used to
measure the timing of control
signals.
Measure voltage and
current waveforms
Optional connection cords
and clamp sensors can be
used to record the voltage
and RMS value and measure
the current of, for example, a
commercial power supply.
Gauge display
(p. 136)
Zoom in/out
(p. 137)
Check (monitor)
the current input
state as a waveform and numerical
values (p. 57)
Event search
(p. 143)
T
12
Cursor Measurements (p. 140)
Numerical Calculations (p. 177)
Measurement data can be
stored to and read from an
optional CF card or USB
flash drive (p. 149).
The supplied USB cable can
be used to transfer the data on
a CF card or USB flash drive
to a computer. The measurement data can also be analyzed in software (p. 207).
mV A
Record anomalies
Abnormal events can be
analyzed by recording with
the trigger function (p. 112).
Unit conversion display
(p. 99)
Schedule measurements
Measurements can be
scheduled.
Easy Setting Wizard
Always Monitor Input
State
The optional printer allows
you to keep the measurement results
on paper
(p. 165).
Measuring and
Recording
Saving,
Reading, and
File Management
Printing
Analyzing
1.1 Product Overview and Features
Overview Chapter 1
1.1 Product Overview and Features
This instrument is a waveform recorder that is easy to operate. It can be powered by
batteries, making it quick to employ in the field in the event of trouble. The measurement data can be observed on the screen, calculated, and printed with a printer. You
can also check saved data on a computer. The instrument can be connected to a
computer and then controlled.
1
Chapter 1 Overview
Page 34

24
Front Panel
Rear Panel
Operating Keys and LED (p. 25)
Battery Compartment Cover (p. 34)
Install the supplied alkaline battery box or
optional Z1000 Battery Pack in the instrument.
Display Screen (p. 26)
5.7-inch TFT color LCD
Manufacturer's Serial Number
Analog input terminals (BNC Jack)
Connect optional measurement cables or
clamp sensors (p. 40).
Shows the serial number.
Do not remove this label,
as it is required for product
support.
POWER Switch
Turns the instrument on ( )
and off ( ) (p. 47)
Right Side
USB Flash Drive Port (p. 48)
Used to save data to an USB flash drive.
Insert an USB flash drive.
External Control Terminals (p. 217)
Control signals can be received from and output to
external devices.
USB Port (p. 207)
(USB 2.0 mini-B receptacle)
When you want to import the data to a computer,
connect the supplied USB cable. The data saved
on a CF card or USB flash drive can be transferred
to a computer.
AC Adapter Socket (p. 39)
Connect the supplied Model Z1002 AC
Adapter.
CF Card Slot (p. 48)
Used to save data to a CF card.
Insert an optional CF card.
LOGIC Connector (p. 42)
Connect an optional logic probe.
Ventilation holes
(Avoid obstructing
the ventilation holes)
1.2 Names and Functions of Parts
1.2 Names and Functions of Parts
Page 35

Operating Keys and LED
LED
POWER
Lights when the power is turned on (p. 47).
CHARGE
Lights when the Z1000 Battery Pack is
charging (p. 38).
Start and stop measurement (p. 60)
Setup and display
PRESETS
Allows you to set measurement
conditions by following instructions
on the screen.
ESC
Cancels changes to settings.
(Cursor Keys)
Moves the position of the
cursor (blinking selection) on the screen.
ENTER
Accepts displayed
settings.
KEY LOCK
To lock the keys, press
and hold the left and right
cursor keys for three
seconds. Repeat to unlock (p. 64).
START
Start measurement. The LED at the right lights
green while measuring.
STOP
Stop measurement.
Saving operations
Press to save data manually
View input state
MONITOR
Displays the current input state as a waveform or numerical values. (The data is not recorded in internal buffer
memory.)
Scroll waveforms and read cursor values
SCROLL/CURSOR
Selects the application for the left and right scroll keys
(waveform scrolling or cursor A/B movement).
(left/ right keys)
Scrolls the waveform or moves cursors A and B
(p. 134).
Choose a screen
WAVE
Switches the waveform screen display (p. 27).
SET
Displays the Settings screens, and switches
among the screen tabs with each press (p. 28).
FILE
Displays file information (p. 161).
25
1.2 Names and Functions of Parts
1
Chapter 1 Overview
Page 36

26
Monitor Screen
You can check the input state (p. 57).
PRESETS Screen (Setting Wizard)
Allows you to configure
the settings by following instructions displayed on the screen
(p. 65).
1.3 Screen Configuration and Display
1.3 Screen Configuration and Display
Page 37

[Wave+Trg] Display
[Wave+Calc] Display
[Wave+Set] Display
[Wave] Display
Waveform Screens
The screen switches each
time you press the key
(Five types) (p. 133).
Check the waveform and setting information
(p. 69).
Check the waveform and trigger setting information (p. 112).
Check the waveform.
Check the waveform and calculation results
(p. 177).
Wave+Set
Wave+Trg
Wave
Wave+Calc
Wave+Crsr
Operational information is displayed along the bottom of the screen.
Check the display name of the currently
displayed screen. Use the cursor keys to
switch the display.
27
1.3 Screen Configuration and Display
1
Chapter 1 Overview
Page 38

28
[Wave+Crsr] Display
Check the waveform and cursor value.
(p. 140)
Operational information is displayed
along the bottom of the screen.
[Setting] Screen
Settings Screens
The screen switches each
time you press the key.
(Seven types)
Make settings for recording (p. 69). Set numerical calculation, auto-saving and timers.
Make input channel settings while viewing
the monitor display (p. 88).
Press the left/right cursor keys to
select between the Settings
screens.
Setting
CH
ALL CH
Trig
Comment
System
[CH] Screen
Print
1.3 Screen Configuration and Display
Page 39

29
Set the recording conditions (trigger function) for each input channel (p. 112).
Make settings while viewing all channel settings.
[ALL CH] Screen
[Trig] Screen
Configure the system environment (p. 197).
Enter channel comments (p. 130).
[Comment] Screen
[System] Screen
This is only displayed when an optional
printer is connected.
Set the printer settings (p. 165).
[Print] Screen
1.3 Screen Configuration and Display
1
Chapter 1 Overview
Page 40

30
File Screen
View and manage files on the CF card/USB
flash drive (p. 149).
File Screen
Drive name
A:/ CF Card
B:/ USB flash drive
1.3 Screen Configuration and Display
Page 41

About the Icons
Clock
"Setting the Date and Time"(p. 204)
CF card, USB flash drive
Displayed when a CF card/USB flash
drive is inserted. The icon appears red
when accessing the CF card/USB flash
drive.
Indicates the name, space used, total
size, and usage percentage of the storage media in order from the left.
State indication
Indicates the current instrument process state.
Usually, displays help for the cursor item.
Storing...
Waiting for trigger... (Trigger wait state)
Waiting for pre-trigger... (Before importing data. Only indi-
cated when a trigger is set.)
Preparing...
The reservation will be started soon. (State when within 30 seconds be-
fore schedule starts)
Storing... (Display Past Data. 'Trace' to change Now
Data)
(State in which pa st waveform displayed)
Storing... (Realtime Save)
Storing... (Insert Media)
Storing... (Change New Media)
Storing... (Low Battery. Stopped Realtime Save)
Calculating... Press the ESC key to abort.
Saving waveform... Press the ESC key to abort.
Saving calc...
Drawing waveform... Hit ESC to stop. (XY waveform drawing state)
Scroll Bar
Power source indicator
Indicates the Memory HiCorder’s power source
(p. 47).
AC adapter operation
Battery pack operation (Fully charged
battery pack)
Battery pack operation
Battery pack operation (Low battery indicator)
See "Battery replacement and charging timing" (p. 37)
31
1.3 Screen Configuration and Display
1
Chapter 1 Overview
Page 42

32
1.3 Screen Configuration and Display
Page 43

Measurement Preparations
Correct the offset at the input terminals
(zero adjustment) if necessary (p. 51).
2
When using a printer (option)
(p. 43)
Connect the printer.
Load the recording paper.
Connect the measurement cables (p. 40).
1
Install the alkaline ba ttery box (accessory) or
battery pack (option) if
necessary (p. 34).
4
Turn the power on
(p. 47).
To save data (p. 48)
Insert a CF card or USB
flash drive
3
Connect the AC
adapter (p. 39).
In the case of the alkaline
battery box
In the case of the
battery pack
Optional measurement cables
or clamp sensors
Optional Logic
Cables
33
Chapter 2
2
Chapter 2 Measurement Preparations
Page 44

34
Before installation, be sure to read "Alkaline Battery Box
(Accessory) and Battery Pack (Option)" (p. 12).
Operating Precaution
2.1 Using the Alkaline Battery Box (Accessory) or Battery Pack (Option)
2.1 Using the Alkaline Battery Box (Accessory) or Battery Pack (Option)
When power cannot be supplied from a commercial power supply by connecting the
AC adapter, the instrument can be powered by just the supplied alkaline battery box
or optional Z1000 Battery Pack. Furthermore, when you are using a commercial
power supply, the alkaline battery box or Z1000 Battery Pack can serve as a backup
power supply in the event of a power failure.
When using the optional battery pack
Charge the battery pack fully before using it the first time (p. 38).
Page 45

2.1 Using the Alkaline Battery Box (Accessory) or Battery Pack (Option)
1 Turn off the instrument.
Disconnect the AC adapter and cables if they
are connected.
2 Remove the screw from the back of the
instrument, and then remove the battery
compartment cover.
3 Connect the alkaline battery box to the
connector.
Slide it toward the top the instrument until you
hear a clicking sound.
4 Insert the alkaline battery box into the
compartment.
5 Firmly fix the alkaline battery box in
place with the screw.
6 Insert eight new LR6 alkaline batteries
into the alkaline battery box.
7 Attach the battery compartment cover,
and firmly fix it in place with the scre w.
Make sure that the cables are not pinched.
3
Do not mix new and old or
different types of dry cell
batteries.
Battery compartment cover
6
2
Screw
Screw
5
4
Insert the tabs in the direction
of the arrow.
Installing the Alkaline Battery Box and Replacing the Batteries
To be required: One Phillips screwdriver (No.2), eight LR6 alkaline batteries
35
2
Chapter 2 Measurement Preparations
Page 46

36
1 Turn off the instrument.
Disconnect the AC adapter and cables if they are
connected.
2 Remove the screw from the back of the
instrument, and then remove the battery
compartment cover.
3 Connect the plug of the battery pack to the
connector.
Slide it toward the top the instrument until you hear a
clicking sound.
4 Insert the battery pack with the label surface
facing up.
5 Attach the battery compartment cover, and
firmly fix it in place with the screw.
Make sure that the cables are not pinched.
Battery compartment cover
2
Screw
3
2.1 Using the Alkaline Battery Box (Accessory) or Battery Pack (Option)
Install the Battery Pack
To be required: One Phillips screwdriver (No.2), Z1000 Battery Pack
Page 47

37
When used at ambient temperature of 23°C after a full charge (when using battery
pack) and when the LCD backlight power saving mode is OFF (initial setting)
See: "Enabling and Disabling the Backlight Saver" (p. 199)
• The above times vary depending on the type of batteries, ambient temperature,
and ink coverage of the printer.
• When the printer is used, the brightness of the backlight is set automatically to
[40%].
• The printer cannot be used with alkaline dry cell batteries.
When you want to use the printer, use the Z1002 AC Adapter or Z1000 Battery
Pack.
Operation state Alkaline Battery Box Battery Pack
Trigger wait state, brightness 100%
Approx. 40 minutes Approx. 3 hours
When printer operating Not possible Approx. 2 hours
Approximate continuous battery-only operating time
When the instrument is being used with batteries or a battery pack, the mark
(red) appears on the screen when the batteries are depleted or the battery power
becomes low.
When using the alkaline battery box:
The batteries are depleted so replace them as soon as possible.
When using a battery pack:
Connect the Z1002 AC Adapter and charge the battery pack.
Battery replacement and charging timing
2.1 Using the Alkaline Battery Box (Accessory) or Battery Pack (Option)
2
Chapter 2 Measurement Preparations
Page 48

38
Charging is finished when the LED turns off.
The LED lights orange
when charging begins.
When charging a battery with not much remaining battery power:
Fast charge time: Approximately 3 hours
The charging LED turns off after an additional auxiliary charge of approximately 1
hour is complete.
Approximate charging time
2.1 Using the Alkaline Battery Box (Accessory) or Battery Pack (Option)
Charge the Battery Pack
Regardless of whether the Memory HiCorder is on or off, the battery pack recharges
whenever the Z1002 AC Adapter is plugged in to a power source. Therefore, charging is provided by merely keeping the battery pack installed in the Memory HiCorder.
Page 49

39
Before connecting the AC adapter, be sure to read "Using the AC
Adapter" (p. 15) and "Handling the Cords and Cables" (p. 10).
Operating Precaution
Connect the power cord to the inlet
socket on the AC adapter.
Rated supply voltage is 100
to 240 V AC, and rated supply frequency is 50 or 60 Hz.
1
2
Connect the output
plug of the AC adapter
to the instrument.
Plug the power cord into
the mains outlet.
3
Power cord
AC adapter
Right side
AC Adapter Socket
Be sure to secure the cord
with the hook to prevent
disconnection of the AC
adapter.
Raise up the hook.
Secure the cord of the AC adapter with the
protector hook.
Return the hook to
its original position.
2.2 Connecting the AC Adapter
2.2 Connecting the AC Adapter
Connect the power cord and the instrument to the supplied Model Z1002 AC
Adapter, then plug the power cord into an outlet. When used with the battery pack
installed, the battery serves as an operating backup supply in case of power fa ilure,
and the AC adapter otherwise has priority.
2
Chapter 2 Measurement Preparations
Page 50

40
Before connecting the cables, be sure to read "Handling the
Cords and Cables" (p. 10) and "Connecting to the Terminals"
(p. 16).
Operating Precaution
Disconnecting BNC connectors
Push the BNC plug, twist it counterclockwise, and pull it out.
Lock
BNC Jack Guide Pins
(on the instrument)
BNC plug slots
Connect to the measurement object.
(Example: Model L9198
Connection Cord)
1
2
Connect the BNC connector of the connection cord to the analog
input jack on the instrument.
Align the slots in the BNC plug with the
guide pins on the jack on the instrument,
then push and twist the plug clockwise until
it locks.
Top of instrument
Unlock
1
2
Front
2.3 Connecting Measurement Cables to the Memory HiCorder
2.3 Connecting Measurement Cables to
the Memory HiCorder
Connect the appropriate cables for the intended recording application.
Connecting Connection Cords (to record voltage waveforms)
Connect an optional Hioki Connection Cord to the analog input terminals. Use the
Hioki 9322 Differential Probe if the voltage of the measurement object may exceed
the Memory HiCorder’s maximum input voltage (p. 16).
Page 51

41
1
2
OK
Attach the clamp around only one conductor. Single-phase (2-wire) or three-phase
(3-wire) cables clamped together will not
produce any reading.
The arrows on the clamp indicating the direction of current
flow should point toward the load side.
L
O
A
D
S
O
U
R
C
E
Conductor
The scaling function needs to be set according to the
clamp sensor model being used. Refer to "Converting
Measurement Values (Scaling Function)" (p. 99) for
details.
Clamp the sensor around the measurement object.
Top of instrument
Connect the BNC plug on the clamp sensor to the analog
input terminals (BNC jack) on the Memory HiCorder.
The connection method is the same as described for other Connection
Cables.
(Example: Model 9018-50 Clamp-on Probe)
Front
Current flow
direction arrow
2.3 Connecting Measurement Cables to the Memory HiCorder
Connecting a Clamp Sensor (to record current waveforms)
Connect an optional Hioki clamp sensor to the analog inp ut terminals. Refer to the
instructions provided with the clamp sensor for usage instructions.
2
Chapter 2 Measurement Preparations
Page 52

42
Connect to the measurement object.
(Example: Model MR9321-01 Logic Probe)
Right Side
1
2
Connect the logic probe by aligning the groves
on the plug and a LOGIC receptacle.
When a logic probe is not connected, the corresponding
logic waveform appears at HIGH level on the waveform
screen.
Take care to ensure the connector is oriented correctly.
2.3 Connecting Measurement Cables to the Memory HiCorder
Connecting the Logic Probe (to record logic signals)
Connect the optional logic probe to the LOGIC Connector. Refer to the instructions
provided with the probe.
Page 53

43
Before use, be sure to read "About the Printer" (p. 20).
Operating Precaution
Required items: Phillips screwdriver
Printer connector
12
Connect the printer
unit.
Connect the printer to
the connector properly.
Secure the printer
in place at the
back of the instrument with the two
screws.
3
Back of instrument
Use a Phillips screwdriver to remove the
two screws securing
the protector on the
left side of the instrument, and then
remove the protector.
2.4 Connecting Printer and Loading Record ing Paper (Options)
2.4 Connecting Printer and Loading Recording
Paper (Options)
Connect the optional MR9000 Printer Unit to the instrument. Usable recording
paper: Hioki’s optional 9234 Recording Paper (112 mm wide, 18 m roll)
See: "Loading the Recording Paper" (p. 44)
Before connecting the printer
• Be sure to secure the printer with the
screws to prevent it from dropping.
• To pre vent damage to the printer cover,
do not apply force to it while it is open.
The printer cannot be used with alkaline dry cell batteries.
When you want to use the printer, use the Z1002 AC Adapter or Z1000 Battery Pack.
Connecting the Printer
Connect the MR9000 Printer Unit to the instrument. When connecting and disconnecting the printer unit, be sure to turn the power switch OFF . Also, be sure to attach
the protector when the printer is not connected.
2
Chapter 2 Measurement Preparations
Page 54

44
23
Press the OPEN
button to open
the printer cover.
Insert the rod through
the center of the
recording paper.
Load the recording paper so that the print
surface is on the underside.
Press the [LOCK] mark in the center of the cover until you hear a
clicking sound.
Paper cutter
1
Remove any slack in the paper roll
by pulling the paper straight. Slack
may result in the paper becoming
jammed.
Pull the recording
paper toward you,
and then close the
printer cover.
Insert the rod so that it is protruding an equal amount from the left
and right sides.
Tear off a section of
recording paper
2.4 Connecting Printer and Loading Recording P aper (Options)
Loading the Recording Paper
About recording paper
• Please use only the specified recording paper. Using non-specified
paper may not only result in faulty printing, but printing may become
impossible.
• If the recording paper is skewed on the roller, paper jams may result.
• Printing is not possible if the front and back of the recording paper are
reversed.
• Make photocopies of recording printouts that are to be handled or
stored for legal purposes.
Page 55

45
Handling and Storing Recording Paper
The recording paper is thermally and chemically sensitized.
Observe the following precautions to avoid paper discoloration and fading.
Avoid exposure to
direct sunlight.
Do not store thermal
paper above 40°C or
90% RH.
Avoid stacking with wet
Diazo copy paper.
Avoid exposure to volatile
organic solvents like alcohol, ethers and ketones.
Avoid contact with adhesive tapes like soft vinyl
chloride and cellophane
tape.
2.4 Connecting Printer and Loading Record ing Paper (Options)
2
Chapter 2 Measurement Preparations
Page 56

46
Strap Hole
2
Feed the strap
through the buckle.
Put the end of the
strap under the
retaining loop.
3
Push the strap through one of the
strap holes on the instrument.
Repeat the same
procedure with the
other end of the
strap and the other
strap hole.
1
4
Feed the strap through
the buckle so that it is
tight and not twisted.
When only instrument
When printer attached
Strap Hole on Printer
2.5 Attaching the Carrying Strap
2.5 Attaching the Carrying Strap
Use the strap to avoid dropping the instrument while carrying, or when you need to
hang it on a hook.
Attach the strap securely to the strap holes in two places on the protector. If the strap is not sufficiently secure, the instrument may drop while
being carried, resulting in damage.
Page 57

2.6 Turning the Power On and Off
Right Side
Turn the power
switch on ( ).
The power supply icon appears near the bottom right
corner of the screen (p. 31).
If the " " indicator is not displayed, the instrument is not being powered from the AC line. In this state, the battery charge will be depleted if
measuring for a long time, and measurement may be interrupted. Verify
that the AC adapter is securely connected to an AC power source and
to the instrument.
Turning Power On
Turn the POWER switch off ( ).
The installed battery pack is charged whenever the AC adapter
is plugged into a power outlet, even when the Memory HiCorder
is off. In addition, providing there is some remaining battery
charge, waveform data and the setting configuration are memorized whenever the Memory HiCorder is turned off, so that when
the Memory HiCorder is turned back on, the same operating
state is displayed.
Verify that the instrument and peripheral devices are
correctly connected.
Turning Power Off
The accuracy of the instrument is guaranteed under the condition that the
instrument has been warmed up for at least 30 minutes.
To ensure accuracy is met, execute zero adjustment approximately 30 minutes after turning the power on. (p. 51)
Initial screen
The power LED lights.
2.6 Turning the Power On and Off
Before turning on the power, be sure to read "Operating Precautions" (p. 8).
47
2
Chapter 2 Measurement Preparations
Page 58

48
Before using the CF card or USB flash drive, be sure to read
"Using a CF Card/ USB Flash Drive" (p. 20).
Operating Precaution
• Hioki option (CF card + adapter) (The adapter cannot be used with the instrument.)
9727 PC Card 256M, 9728 PC Card 512M, 9729 PC Card 1G, 9830 PC Card 2G
Important
Use only CF cards sold by Hioki. Compatibility and performance are not
guaranteed for CF ca rds made by o ther manufacturers. You may be unable
to read from or save data to such cards.
2.7 Using CF Card or USB Flash Drive (for Saving Data)
2.7 Using CF Card or USB Flash Drive
(for Saving Data)
You can use an optional CF card (see below) or commercially available USB flash
drive to save and read the data measured with the instrument.
If the Eject button is in the released position, press it in first before
inserting the CF card all the way in. Inserting the CF card when the
Eject button is released may damage the instrument.
If the CF card does not go all the way in, do not force it in. Press the
Eject button once to release it, then press it again and insert the CF
card all the way in.
• Data can also be saved to a USB flash drive in real time, but from the
perspective of data protection, we recommend using a CF card for
real-time saving.
• USB flash drive with security functions such as password and fingerprint authentication can not be used.
• See "6.4 Data Management" (p. 161) for details about managing data
storage in the media.
Page 59

2.7 Using CF Card or USB Flash Drive (for Saving Data)
Eject Button
Inserting a CF card
1Open the CF card slot cover.
2Press the Eject button in if it is in the
released position.
3Face the C F card with the arrow mark
on top ( ), and insert it in the direction of the arrow all the way in the slot.
Removing a CF card
1Open the CF card slot cover.
2Press the Eject button (to release it).
3Press the Eject button again and pull
the card out.
Cover
Right side of
instrument
Inserting a USB flash drive
Confirm the orientation of the connection
parts of the USB flash drive and USB flash
drive port, and then insert the USB flash
drive all the way in.
Removing a USB flash drive
Pull the USB flash drive out.
See: "Replacing CF Card or USB Flash Drive dur-
ing Saving ([Realtime] only)" (p. 108)
CF Card Insertion & Removal
49
2
Chapter 2 Measurement Preparations
USB Flash Drive Insertion & Removal
The USB flash drive may not be recognized by the instrument depending on the USB flash drive used.
Page 60

50
Apply
1
2
Select the File Screen.
Select [Format].
The Format Confirmation dialog appears.
Open the Control Dialog
box
Select [Yes].
The Format Confirmation dialog appears again.
3
4
5
Apply
Select [Yes].
Apply
Control Dialog box
2.7 Using CF Card or USB Flash Drive (for Saving Data)
Formatting a CF Card/USB Flash Drive
This section describes how to format a CF card or USB flash drive with the instrument.
Format a new CF card of USB flash drive before use.
Formatting irretrievably erases all data on the CF card/USB flash drive.
Always backup important data from the CF card/USB flash drive before
formatting.
Page 61

2.8 Compensating for Input Circuit Offset (Zero Adjustment)
Turn on the power and wait for 30 minutes to stabilize the internal temperature
of the Memory HiCorder.
Waveform screen
Select [Zero Adjust].
2
3
Zero adjustment is executed.
(simultane-
ously
)
1
Display the Waveform screen.
Press and hold these keys
simultaneously for one second.
The Zero Adjust dialog appears.
Alternatively, zero adjustment can be executed from the
setting items on the [Wave+Set] or [All CH] screen.
Apply
2.8 Compensating for Input Circuit Offset
(Zero Adjustment)
51
Zero adjustment corrects for voltage offset at the input circuits, so that Memory
HiCorder measurements are relative to zero volts.
Execute zero adjustment again after a sudden change in the ambient temperature.
Any zero-adjust setting is cleared upon system reset (p. 204).
Execute zero adjustment again after a system reset.
2
Chapter 2 Measurement Preparations
Page 62

52
About zero position offset of analog input circuits
With this instrument, the zero position may be offset in a high sensitivity range (10-mV/div range,
etc.). Furthermore, the accuracy of the instrument
is guaranteed under the condition that the instrument has been warmed up for at least 30 minutes.
The figure on the right shows the representative
characteristics of zero position drift from immediately after the power is turned on. The changes in
the zero position are relatively large for 30 minutes
after the power is turned on. The existence of
these characteristics means that zero adjustment
must always be executed before measurements
are taken. In particular, when you will take measurements for a long time or take high-precision
measurements, we recommend 60 minutes of aging before executing zero adjustment.
Error (%f.s.)
Time elapsed from power on
(minutes)
2.8 Compensating for Input Circuit Offset (Zero Adjustment)
Page 63

Basic Operating
Do not use if damage is
present as you could receive an electric shock.
Replace the damaged
items.
Metal Exposed
Is the insulation of the measurement
cable to be used damaged, or is bare
metal exposed?
1
No Metal Exposed
2
Peripheral Device Inspection
Before using the instrument the first time, verify that it operates norm ally to
ensure that no damage occurred during storage or shippin g. If you find any
damage, contact your dealer or Hioki representative.
To
If damage is evident, request repairs.
Yes
Is damage to the instrument evident?
Instrument Inspection
When turning power on
Does the HIOKI logo appear on the
screen?
No
2
The power cord may be
damaged, or the instrument may be damaged internally. Request repairs.
Is the Waveform screen or Setting
screen displayed?
(When power is turned on the first time
after purchase, the Setting screen
should appear.)
No
Yes
The instrument may be
damaged internally.
Request repairs.
Nothing appears, or the
display is abnormal
Yes
Inspection complete
53
3.1 Pre-Operation Inspection
Procedures
3.1 Pre-Operation Inspection
Chapter 3
3
Chapter 3 Basic Operating Procedures
Page 64

54
Front Panel
Rear Panel
Right Side
1. Preparations for Measurement (p. 33)
Before beginning the preparations, be sure to read "Operating Precautions" (p. 8) and "3.1 Pre-Operation Inspection" (p. 53).
5
Attaching the Carrying
Strap (p. 46)
Turn the Power On (p. 47)
4
Connecting the optional
Printer (p. 43)
Connect the AC adapter (p. 39)
2
Install the batteries or
battery Pack (p. 34)
Connect the measurement
cables (p. 40)
3
Connect the instrument to the
measurement point
1
Insert a CF card/ USB
flash drive (p. 48).
To save data
3.2 Measurement Flow
3.2 Measurement Flow
Page 65

55
2. Viewing Input State (Monitor) (p. 57)
The current input state can be confirmed as a waveform and numerical values.
3. Settings(p. 69)
Configure the settings using the setting procedure that matches the purpose of measurement.
(p. 65)
(p. 69)
(p. 158)
Configuring settings
by following instructions on the screen
(Easy Setup)
Configuring settings
individually
Loading setting
configuration data
You can configure settings
by following instructions
displayed on the screen.
You can configure settings
by changing the values of
desired setting items.
You can configure settings by loading setting
conditions saved in advance.
3.2 Measurement Flow
3
Chapter 3 Basic Operating Procedures
Page 66

56
Press the START key.
Record once, and stop.
[Repeat: Single]
Stop
Measurement
The start and stop operations differ depending on the set conditions.
See: "About Measuring Operation" (p. 61)
When recording measured data using arbitrary conditions (trigger function), measured data meeting the set conditions is recorded in the internal buffer memory so it
is not displayed on the Waveform screen until the condition is met. When you want to
view the current input state, you can check it on the Monitor screen (press the MON-
ITOR key).
(default setting)
Record repeatedly.
[Repeat: Repeat]
4. Starting and Stopping Measurement (p. 60)
Press the STOP key.
Start
Measurement
View Measurement Data
(p. 133)
Waveforms can be zoomed and numerical
values confirmed.
Save Data (p. 149)
Measurement data, waveform data,
screen images and numerical calculation
results can be saved.
Print Data (p. 165)
Waveforms can be printed with the printer.
Calculate (p. 177)
Numerical measurement data can be applied to calculations.
View on a Computer (p. 207)
Measurement data can also be analyzed in
the supplied software.
5. Data Analysis
6. When Finished
Turn the Memory HiCorder Off
(p. 47)
3.2 Measurement Flow
Page 67

57
Signal currently being input
When the scaling function (conversion indication) is
used, [SCALE] is indicated below the channel (CH) for
which scaling is set.
Gauge
The gauge of the channel you want to display can be selected from the setting options of [Gauge] on the top right of the screen.
The gauge is displayed in the set range on the CH Screen.
Numerical value of analog
channel
Indicates the instantaneous
value or effective value.
([RMS] is displayed beside CH
only when the effective value
is indicated.)
Channel comment
Instantaneous value of logic
( : 0, : 1)
3.3 Basic Operation
3.3 Basic Operation
Checking Input State (Monitor)
The current input state and display range can be
checked on the Monitor screen regardless of
whether or not measurement has started. However, the data will not be acquired to the internal
buffer memory of the instrument if measurement
has not started.
The Monitor screen displays the input state in
accordance with the current setting conditions.
After measurement starts, the input state is not displayed on the Waveform screen
until the set conditions are met (while waiting for the trigger) but you can check the
input state in accordance with the current setting conditions if you switch to the Monitor screen.
3
Chapter 3 Basic Operating Procedures
Page 68

58
3.3 Basic Operation
The input signal is displayed as follows when it exceeds the possible
measurement range of the set measurement range.
• Measurement waveform: The data that exceeds the possible mea-
surement range is displayed in white when the scre en background
is black, and in black when the screen background is white.
• Measurement values: The data that exceeds the possible mea-
surement range is indicated as "OVER."
Page 69

Configuring Settings (Changing Settings)
Select the item to
change.
Show available setting
options.
Select the desired
setting.
Setting Screen
Waveform Screen
Apply the new setting,
or cancel it.
Changing screen contents
(p. 65)
(p. 69)
(p. 158)
Configuring settings
by following instruc-
tions on the screen
(Easy Setup)
Configuring settings
individually
Loading setting
configuration data
Setting configuration
data can also be loaded
from Setting Wizard.
The settings items can be changed.
59
3.3 Basic Operation
3
Chapter 3 Basic Operating Procedures
There are three procedures available for configuring the settings depending on the
purpose of use.
For details, refer to each of the reference pages.
Page 70

60
Press the START key.
(The green LED lights.)
[Storing...] is displayed on the screen during measurement.
When measuring using the trigger function, the timing for starting
measurement and starting recording (starting acquiring of data to internal buffer memory) differs.
Start Measurement
IMPORTANT
When the START key is pressed, the start confirmation message appears.
(You can set the message not to be displayed (p. 201).)
If measurement is resumed after it has been stopped, the measurement
data recorded to the internal buffer memory will be overwritten. Save any
important data to a CF card or USB flash drive before you resume measurement.
When automatically saving data
When you want to save the data to storage media simultaneously with measurement, check the following items before you start recording.
• Are the auto save settings configured properly? (p. 104)
• Is the CF card or USB flash drive inserted properly? (p. 48)
• Is there sufficient free space on the CF card or USB flash drive? (p. A15)
When [Repeat] is set to [Single] (default setting), measurement finishes when the data is read once for the set recording length (or recording time portion).
When [Repeat] is set to [Repeat] or [Cont (Continuous Recording)]
is set to [On] (Real-time Function only), press the STOP key to end
measurement.
If you press the STOP key part way through measurement, the stop
confirmation message appears. (You can set the message not to be
displayed (p. 201).)
Select [Yes] to force measurement to stop.
Finish Measurement
3.3 Basic Operation
Starting and St opping Measurement
Start measurement so that the data is acquired to the internal buffer memory.
Page 71

61
Press START key or wait until scheduled start time
Press STOP key or wait until scheduled end time
Stop
Measuring
Start
Measuring
Measuring
Recording length or
Recording time
Stop
Measuring
Start
Measuring
Measuring
Dead time
Recording length or Recording time
Stop
Measuring
Start
Measuring
Measuring
Recording length or
Recording time
Stop
Measuring
Start
Measuring
Measuring
Dead time
Recording length or Recording time
Stop
Measuring
Start
Measuring
Measuring
Dead time
Measuring
3.3 Basic Operation
About Measuring Operation
The operation differs depending on the measurement function (high speed or real time) and
setting conditions.
Continuous
Recording
[Cont]
*1
Specified
or Off
*2
Specified (*1 and
when measurement stopped within recording time)
*2
or Off
*2
On
*1: When High-speed Function
*2: When Real-time Function
About Dead time
When [Repeat (Repeat Recording)] is set to [Repeat]:
After measurement is performed for the recording
length (recording time) portion, time is needed for internal processing before measurement can be resumed
(dead time). Measurement is not performed during this
dead time.
When you want to split the data into files at arbitrary times without losing any data,
set [Cont (Continuous Recording)] to [On] and set [Split Save] of auto saving to
[On].
The dead time cannot be eliminated when measurement is performed with the Highspeed Function. The measurement operation differs when measurement is performed using the trigger function.
Repeat Recording [Repeat]
[Single] [Repeat]
______________
3
Chapter 3 Basic Operating Procedures
Page 72

62
Scrolling a waveform
See: "Scrolling Waveforms" (p. 134)
Scroll
backward.
Scroll forward.
2
1
Switch to [Scroll] display.
Reading values at cursors
Switch to [Cursor] display.
Move the A/B cursors.
Values at cursor positions can be
read numerically.
You can select the cursor display type and
which cursor(s) to move (p. 140).
1
2
3.3 Basic Operation
Viewing Measurement Results (Scrolling Waveforms & Displaying Measurement Values)
Page 73

63
Insert a CF card (or USB flash drive).
Press the SAVE
key.
(A dialog appears.)
Select the items to be saved, and
press the ENTER key.
Select [Yes] in the confirmation
dialog, and press ENTER again.
(The data is saved to the set CF card or
USB flash drive.)
3.3 Basic Operation
Saving Data
Measurement data, settings, screen images and numerical calculation results can
be saved.
For details of the saving methods, see "Chapter 6 Managing Data" (p. 149).
(Default settings)
Saving Method: [Select & Save] (Press the
SAVE key to select and save data.)
3
Chapter 3 Basic Operating Procedures
Page 74

64
Press the PRINT key.
The measurement data is
printed.
A hard copy of the screen is
printed.
Press the COPY key.
Press and hold the right and left cursor keys for
three seconds to lock the other keys, and repeat to
unlock.
3.3 Basic Operation
Printing Data
The measurement data can be printed with an optional printer.
See: About connecting the printer and loading the recording paper
"2.4 Connecting Printer and Loading Recording Paper (Options)" (p. 43)
Various Printing Methods: "Chapter 7 Printing" (p. 165)
(When default settings)
Disabling Key Operations (Key-Lock Function)
Keys can be disabled to avoid inadvertent operations.
Page 75

65
Basic Guide
Configuring settings by
following instructions
in Navi
Loading Settings
Load setting
configuration data
(p. 67)
(p. 66)(p. 65)
Measurement Guide
Select application and
configure settings
(measurement example)
Set the analog channel.
3
Select
Apply
Set the function.
• [Highspeed]
• [Realtime]
You can check the difference between
the functions on the right side of the
screen.
1
High-speed Function
Real-time function
Execute Auto Range.
2
Set the time base range and
recording length.
4
Set the recording interval and
recording time.
3.4 Measurement Using Setting Wizard (PRESETS key)
3.4 Measurement Using Setting Wizard
(PRESETS key)
You can configure settings and perform measurement by following instructions displayed on the screen.
Configuring Settings by Following Instructions in Navigation (Basic Guide)
Configure the settings by following instructions displayed on the screen.
3
Chapter 3 Basic Operating Procedures
Page 76

66
Set the trigger.
5
Set the pre-trigger and repeat measurement.
6
Set the start trigger.
Set the stop trigger.
Start measurement
High-speed Function
Real-time function
Select
Apply
Select the purpose of use.
1
Configure the settings to
match the setting items on
the screen.
2
Start measurement
See: Other screens (p. 67)
3.4 Measurement Using Setting Wizard (PRESETS key)
Selecting Application and Configure Settings (Measurement Guide)
Page 77

3.4 Measurement Using Setting Wizard (PRESETS key)
Examples of other settings screens [Measurement Guide]
Select
Apply
Select the load destination.
1
Select the data to load from the list.
2
Load the data
Loading Setting Configuration Data
67
3
Chapter 3 Basic Operating Procedures
• With PRESETS, all settings are applied by performing a series of operations to the end.
• Once you switch to the PRESETS screen, the settings of some items will
be cleared if you cancel the setup procedure in the PRESETS screen part
way through.
Page 78

68
3.4 Measurement Using Setting Wizard (PRESETS key)
Page 79

4.1 Flow of Configuring Settings Individually
Setting the Recording Conditions (p. 70)
Setting the Input Channel (p. 88)
Setting Saving (p. 149)
Setting Specific Conditions (p. 112)
When you want to use specific
conditions to record, for example, abnormal phenomenon
When you want to save automatically after measurement starts
Configuring settings individually
• Select the function (p. 70)
[High speed]: Instantaneous recording (p. 72)
[Real time]: Fluctuation recording (p. 80)
• Set the horizontal axis (data acquisition interval
or recording interval).
• Set the length (or time) for recording.
• Select whether to repeat recording.
• Set the vertical axis (measurement
range).
• Configure the other settings as necessary.
Load the setting configuration data (p. 158)
Setting configuration data that has been saved
in advance to the instrument or a CF card/USB
flash drive can be loaded.
Setting the Measurement
Conditions
(When you want to
69
customize the settings)
4.1 Flow of Configuring Settings Individually
Chapter 4
4
Chapter 4 Setting the Measurement Conditions (When you want to customize the settings)
Page 80

70
Select this function when you want to, for
example, measure waveforms that
change at high speed (instantaneous
waveforms) and unexpected transient
phenomena as you would with an oscilloscope.
Just the necessary measurement data
can be saved and printed after measurement.
Select this function when you want to, for
example, measure fluctuations in lowspeed phenomena and fluctuations in the
effective value of a power supply over a
long period of time as you would with a
pen recorder or data logger.
Recording, saving, and printing can be
performed simultaneously with measurement*.
High-speed Function
[Highspeed]
Real-time Function
[Realtime]
This measurement function is equivalent to
the Memory Recorder function of previous
Hioki Memory HiCorder models.
This measurement function is equivalent to
the Recorder function of previous Hioki Memory HiCorder models.
(*). Printing may not be possible at the same time de-
pending on the setting for the horizontal axis.
Waveform screen
[Setting] screen
Change the function
(Open/confirm the setting information.)
4.2 Recording Methods (Measurement Functions)
4.2 Recording Methods
(Measurement Functions)
As recording methods, the instrument has two measurement functions, high speed
and real time. The internal processing for saving and printing and the setting items
on the measurement screen differ depending on the function.
The measurement function can be set on the Waveform screen and Setting screen
of the instrument.
Page 81

4.2 Recording Methods (Measurement Functions)
Sampling is performed at high speed so
the data is first stored in the internal buffer memory. The data stored in the internal buffer memory is displayed on the
screen, saved to the storage media, and
printed after measurement ends.
Sampling is performed at low speed so
the waveform is displayed and the data
is saved to the storage media and printed* during sampling.
Set the time per division of the horizontal
axis (time base).
The fastest time base that can be set is
100 µs/div, which is 1 MS/s when converted to sampling speed. (At the magnification of x1, the number of data per
division is 100.)
By changing the setting, you can
set the time interval at which to
perform sampling in the same
way as shown on the right.
Set the time interval to perform sampling.
The maximum sampling interval is 100
µs, which is 10 kS/s when converted to
sampling speed.
Differences in internal operation
High-speed Function Real-time Function
How to select the sampling speed
Processed
simultaneously
Start measurement
Start
measurement
Sampling
Display
Save
Print
(*)
Sampling
(Specified recording length portion)
Display
Save
Print
Processed in order
time t (t/div)
Input voltage
Sampling period (1/100 of time t)
1001
1 div
Time interval
: 1 sampling
: 1 sampling
(*).Printing may not be possible at the same
time depending on the setting for the horizontal axis.
Instantaneous value or effective
value (RMS value)
Differences in operation by function
71
4
Chapter 4 Setting the Measurement Conditions (When you want to customize the settings)
Page 82

72
Select the High-speed Function (p. 72)
Set the range of the horizontal axis (time
base) (p. 73)
Set the recording length (number of divisions) (p. 76)
Set the repeat operation (repeat measurement or single measurement) (p. 77)
Set the input conditions (p. 88)
Configure the settings as
necessary
Set the display format
(p. 96)
Performing numerical cal-
culation (p. 177)
Save automatically (p. 104)
Sch edul e measurement
(p. 187)
Common to both high speed and real time
2
Select [Highspeed].
(Open/confirm the setting information.)
Select the [Setting] screen.
1
4.3 Using High-speed Function (Instantaneous Recording)
4.3 Using High-speed Function
(Instantaneous Recording)
This function is suitable for recording, for example, instantaneous waveforms of a
power supply and the starting current of a motor.
Set the recording conditions on the [Setting] screen.
Selecting the Function (High-speed Function)
Display the setting screen for the High-speed Function.
Page 83

4.3 Using High-speed Function (Instantaneous Recording)
1 division
1
100
Data acquisition interval
Time per division
Setting options (. default setting)
• Decreasing the t imebase increases the resolution of data available for analysis.
See: "Selecting a Timebase (Horizontal Axis)" (p.
A19)
• When th e prod uct of th e timebase multiplied by
the display magnification is greater than 50 ms,
waveforms can be automatically scrolled on the
display while measuring (the Roll Mode display
function).
100, 200, 500 s [/div]
1, 2, 5, 10, 20, 50, 100 ms [/div]
The setting can also be
changed on the Waveform
screen. ([Wave+Set] Display)
1
2
Select from the setting options of
[Timebase].
(Open/confirm the setting information.)
Select the [Setting] screen.
Setting the Horizontal Axis (Time Base Range)
Two setting procedures are available: setting the time
per division of the horizontal axis and setting the data
acquisition interval.
• When setting the time per division of the horizontal
axis
The data of 100 samples is included in 1 division.
(When the magnification is x1)
Sampling rate = timebase (seconds/div)/100 (data
samples/division)
• When setting the data acquisition interval (p. 74)
(It is possible to switch to the same setting procedure as for the Real-time Function.)
Select the recording interval that matches the measurement target. If a short recording interval is selected, the recording time for
which data can be stored in the internal buffer memory will be short.
Set the time per division
73
4
Chapter 4 Setting the Measurement Conditions (When you want to customize the settings)
Page 84

74
Setting options (. default setting)
1s, 2s, 5s, 10s, 20s, 50s, 100s, 200s,
500
s, 1ms
1
2
Press the ENTER key at the [Time-
base] position.
Select from the setting options of [Interval].
3
Select from the setting options of
[Interval].
(Open/confirm the setting information.)
The setting can also be
changed on the Waveform
screen. ([Wave+Set] Display)
Select the [Setting] screen.
The peak cannot be acquired.
Recording interval: 1ms
Horizontal axis: 10ms/div
The waveform peak may not be able to
be recorded depending on the setting for
the recording interval.
Example: When the recording interval is
set to 1 ms, a state in which the waveform
peak cannot be recorded is displayed.
: data
Recording Interval and Waveform Peak
4.3 Using High-speed Function (Instantaneous Recording)
Set the data acquisition interval
Page 85

4.3 Using High-speed Function (Instantaneous Recording)
Recording Interval and Selection Range
: Selectable, X: Not selectable
Horizontal
axis
(/div)
Interval
s
ms
1 2 5 10 20 50 100 200 500 1
10
s
X X X X X X X X X
20
s
XXXXXXXX
50
s
X X X X X X X
100
s
XXXXXX
200
s
X X X X X
500
s
XXXX
1 ms
X X X
2ms
XX
5 ms
X
10 ms
20 ms
50 ms
100 ms
200 ms
500 ms
1s
2 s
5s
10 s
30 s
1 min
2min
5 min
10 min
75
4
Chapter 4 Setting the Measurement Conditions (When you want to customize the settings)
Page 86

76
15 divisions
Recording length
• When the setting proc edure for the horizon-
tal axis is set to time per division:
Set the recording length for acquiring the waveform.
Setting options
5 to 10,000 div (Settable in 5-division steps)
(default setting): 15
Increases or decreases the value in
increments of 5.
Increases or decreases the value in increments of 100.
1
2
(Open/confirm the setting information.)
Select from the setting options of
[Shot (recording length)].
• When the setting proc edure for the horizon-
tal axis is set to data acquisition interval:
Set the number of data for acquiring the waveform.
Setting options
500 to 1,000,000
(default setting): 1,500
Increases or decreases the value
in increments of
500.
Increases or decreases
the value in increments of
10,000.
Select the [Setting] screen.
4.3 Using High-speed Function (Instantaneous Recording)
?
Setting Recording Length (no. of divisions)
Set the recording length in units of display divisions.
Recording time = timebase (s/div) x recording length
(div)
An arbitrary value up to 10,000 can be set.
Page 87

4.3 Using High-speed Function (Instantaneous Recording)
Recording only once
Repeated recording
1
2
(Open/confirm the setting information.)
Select from the setting options of
[Repeat].
Setting options (. default setting):
Single
Records once only and then ends.
Repeat Records repeatedly until the STOP key is
pressed.
When a trigger is not applied, the waiting for
trigger state will be restored.
When the trigger is off, the next recording
starts automatically.
See: "About Measuring Operation" (p.
61)
Select the [Setting] screen.
Set the Recording Length for Repeated or One-time Recording
Set recording to be performed once or repeatedly for
the set recording length portion.
If you want to record only when the desired conditions are met, the trigger settings also need to be
configured.
See: "4.9 Recording Using Specific Conditions (Trigger Function)" (p. 112)
77
4
Chapter 4 Setting the Measurement Conditions (When you want to customize the settings)
Page 88

78
Select [Auto Range].
1
3
Press and hold together
for one second.
A dialog appears.
Select the Waveform
Screen.
(Simultaneously)
When [Auto Range failed] appears.
If the voltage level of the input signal is
low, it may not be possible to determine
a suitable range. In this case, configure
the range settings manually from the
Setting screen while watching the waveform monitor.
Apply
Auto Range from the Waveform Screen
2
Select [Zero adj.].
1
2
A dialog appears.
If you follow the instructions in the dialog box, the
range will be set to match the input waveform.
Selecting Auto Range on the Setting Screen
(Also Settable in Setting Wizard using the PRESETS key)
Apply
3
Apply
Select [Auto Range].
Bottom right of
screen
Select the [All CH] screen.
4.3 Using High-speed Function (Instantaneous Recording)
Configuring Settings Automatically (Auto Range)
Auto Range can only be set when the High-speed Function is used.
When you do not know how to determine the range for the input signal, you can set
the range automatically (Auto Range) on the Waveform screen or [CH] screen or in
Setting Wizard (using the PRESETS key).
Furthermore, the instrument can be set by loading setting configuration data saved
to the instrument or a CF card (when inserted). (p. 158)
Page 89

79
4.3 Using High-speed Function (Instantaneous Recording)
Auto Range Settings
Setting Item Settings
[Timebase](*) Timebase Auto setting value
Automatically displays 1 to 2.5 cycles on the Waveform screen.
[Zoom] Zoom (magnification) x1
Settings for CH1 to CH4
[Mode] Instantaneous value
[Range] Voltage-axis range Auto setup value
[0 Pos] Zero position Auto setup value
[Zoom] Zoom (magnification) x1
[L.P.F.] Low-pass filter Off
[Coupling] Input coupling DC
Trigger Criteria
[Repeat] (Setting screen) Repeat
[Condit.] OR
[Pre-Trig] (20%)
[Start](*) Trigger Level trigger
[S] Slope
[Level] Trigger Level Auto setup value
[Filt] Filter Off
(*): Check whether the difference between the maximum value and minimum value of the
input signal is 3 divisions or more from CH1 while display is on, and set the time base
range and trigger using the signal of the corresponding channel as the reference.
4
Chapter 4 Setting the Measurement Conditions (When you want to customize the settings)
Executing Auto Range generates a trigger signal on the trigger ou tput
external control terminal. Bear this in mind when using the trigger output
terminal and the Auto Range function.
Page 90

80
Set the interval for the data to be
recorded (p. 81)
Select the Real-time Function (p. 80)
Set the repeat operation (repeat measurement or single measurement) (p. 85)
Configure the settings as
necessary
Set th e disp lay range of the
horizontal axis (time base)
(p. 91)
Set th e disp lay format
(p. 96)
Perform nu merical calcula-
tion (p. 177)
Save in re al time (p. 104)
Sche dule measurement
(p. 187)
Set continuous recording or recording
time (p. 83)
Set whether to record the peak hold data (maximum and minimum
values within data interval) (p. 86)
Set the input conditions (p. 88)
(Common to both high speed and real time)
1
2
Apply
Select [Realtime]
Select the [Setting] screen.
4.4 Using Real-time Function (Fluctuation Recording)
4.4 Using Real-time Function
(Fluctuation Recording)
This function is suitable for monitoring the control voltage, recording fluctuations in
the effective value of a power line, etc. over a long period of time. Set the recording
conditions on the [Setting] screen.
Selecting the Function (Real-time Function)
Display the setting screen for the Real-time Function.
Page 91

4.4 Using Real-time Function (Fluctuation Recording)
: Measurement data
Recording interval
1
2
(Open/confirm the setting information.)
Select from the setting options of
[Interval].
Setting options (. default setting)
100μs, 200μs, 500μs,
1ms, 2ms, 5ms, 10ms, 20ms, 50ms, 100ms, 200ms,
500ms, 1s, 2s, 5s, 10s, 20s, 30s, 1min
The setting can also be
changed on the Waveform
screen. ([Wave+Set] Display)
Select the [Setting] screen.
Some waveform peaks may not be displayable
with certain interval settings.
Example: When the recording interval is set to 1
s and the horizontal axis is set to 5 s/div, a state
in which the waveform peak cannot be recorded
is displayed.
To make sure the peak is recorded:
"Retaining Records of Maximum and Minimum
Values (Envelope)" (p. 86)
Recording Interval and Waveform Peak
Horizontal axis: 5 s/div
Recording interval: 1s
Peak
Setting the Interval for the Data to Record (Recording Interval)
Set the interval for acquiring data
Select the data acquisition interval to suit your measurement objectives.
If a short recording interval is selected, the recording
time for which data can be stored in the internal buffer
memory will be short. If you want to retain the data for a
long period of time, we recommend setting continuous
recording to [On] and saving in real time to external storage media.
81
4
Chapter 4 Setting the Measurement Conditions (When you want to customize the settings)
If real time saving, [Envelope] function, and [Numerical Calc.] are set at
the same time, the recording interval cannot be set to 100 µs and 200
µs.
Page 92

82
Recording Interval and Selection Range
: Selectable, X: Not selectable
: Only selectable when envelope is Off, : Display is not possible during measurement
Time/div
Interval
sms smin
100 200 500 1 2 5 10 20 50 100 200 500 1 2 5 10 20 30 1
10
ms
XXX X X X XXXXXX X
20
ms
XX X X X XXXXXX X
50
ms
XX X X X XXXXXX X
100
ms
X X X XXXXXX X
200
ms
X X XXXXXX X
500
ms
X X XXXXXX X
1
s
XXXXXX X
2
s
XXXXX X
5
s
XXXXX X
10
s
XXX X
30
s
XX X
1
min
X
2
min
5
min
10
min
30
min
1
h
2
h
5
h
10
h
12
h
1
day
4.4 Using Real-time Function (Fluctuation Recording)
Page 93

4.4 Using Real-time Function (Fluctuation Recording)
Continuous Recording
Specify the
recording time
Start
Measurement
Stop
Measurement
Repeat Recording (p. 85)
1
2
Enable continuous recording
(set
[Cont] to [On]).
When measurement data is saved automatically, the
save method will differ depending on the [Deleting (Delete while Saving)] and [Split Save] settings.
See: "4.7 Setting Automatic Saving" (p. 104)
(Open/confirm the setting information.)
Select the [Setting] screen.
Setting the Recording Time
Specify how you want recording to start and stop.
The following methods are available.
• Recording continuously:
Record continuously from when recording is
started until when the STOP key is pressed or the
stop condition is met.
• Recording for specified recording time:
Record for only the specified amount of time.
Recording can also be repeated each time the
specified time ends (p. 128).
Recording continuously
83
4
Chapter 4 Setting the Measurement Conditions (When you want to customize the settings)
Page 94

84
1
2
Set [Cont] to [Off].
3
Specify the duration of one recording length
(time span).
Setting options (. default setting)
d (days) (0 to 694), h (hours)(0 to 23),
min (minutes) (0 to 59), s (seconds) (0 to 59)
Change 1’s digit
Change 10’s digit
Recording proceeds for the specified
length. Recording stops early if you press
the
STOP key before the recording length
has elapsed, or if a "stop trigger" event
occurs.
Maximum recording length and
data samples
Indicates the maximum recording time to
internal buffer memory, and the maximum number of data samples. These
values are limited by the Recording Interval (p. A16).
(Open/confirm the setting information.)
Select the [Setting] screen.
2
3
4.4 Using Real-time Function (Fluctuation Recording)
Recording for Specified Recording Time
Page 95

4.4 Using Real-time Function (Fluctuation Recording)
Records one time
Repeated recording
1
2
(Open/confirm the setting information.)
Select from the [Repeat] setting
items.
Setting options (. default setting)
:
Single
Records one time and stops.
Repeat Recording restarts after the specified re-
cording length has elapsed or after recording is stopped by a "stop trigger" event.
To manually stop recording, press the
STOP key.
See: "About Measuring Operation" (p. 61)
Select the [Setting] screen.
Setting the Repeat Operation (Repeat Measurement or Single Measurement)
Set whether to resume recording after recording for the
set recording time or when the condition for stopping
recording using the trigger function is met (stop trigger
condition is met).
This can only be set when [Cont (Continuous Recording)] is set to [Off].
85
4
Chapter 4 Setting the Measurement Conditions (When you want to customize the settings)
Page 96

86
MAX
MIN
Sampling interval
1 M
1
2
(Open/confirm the setting information.)
Select from the setting options of
[Envelope].
Setting options (. default setting)
On Records the maximum value and minimum
values within the sampling interval.
Off
Records instantaneous data of each sampling
interval.
Select the [Setting] screen.
4.4 Using Real-time Function (Fluctuation Recording)
Retaining Records of Maximum and Minimum Values (Envelope)
The maximum and minimum values within the
recording interval are calculated from da ta oversampled at maximum sampling speed (1 MS/s), and
recorded for each recording interval. Therefore,
recording without missing the peak of fluctuation will
be possible even if a long recording interval is set.
(*): Sampling is the acquiring of the data to be saved
to the internal buffer memory. Oversampling is the acquiring of data at a higher
speed than when data is acquired to the internal buffer memory (sampling). Oversampled data is not saved.
Page 97

87
Maximum
value
Minimum
value
: Oversampled data
: Saved data (two data items, maximum value and
minimum value)
Recording
interval
Oversampling data (1MS/s)
: Waveform output to the screen or recording paper
Envelope Values
One sampling data for during
[Envelope] recording consists
of two data items, the maximum
value and minimum value, of
the measurement values obtained as a result of performing
oversampling during the set recording interval.
When displaying them on the
screen or printing them with the
printer, they will be displayed or
printed as a shaded band.
When saved to external storage
media, the two data items, the
maximum value and minimum
value, are saved for one measurement time.
4.4 Using Real-time Function (Fluctuation Recording)
If real-time saving, [Envelope] function, and [Numerical Calc.] are se t at
the same time for the Real-time Function, the recording in terval cannot
be set to 100 µs and 200 µs.
4
Chapter 4 Setting the Measurement Conditions (When you want to customize the settings)
Page 98

88
Set the input channel
Set the input mode
Configure the other settings as necessary.
Configure the settings as
necessary
Se t the low-pass filter (p. 90)
Set the input coupling meth-
od (p. 90)
Se t the display range (p. 93)
Se t the display graph (p. 96)
Pe rform scaling (p. 99)
Use the trigge r function
(p. 112)
Perform numerical calcula-
tion (p. 177)
Set the measurement range
4.5 Setting the Input Conditions
4.5 Setting the Input Conditions
Configure the input channel settings on the [CH] screen. You can configure various
settings while viewing the monitor display on the Setting screen.
Setting the Input Channel (Instant aneous V alue/Effective V alue & Measurement Range)
This section describes the minimum required settings for measurement.
The input channel mode (instantaneous value/effective value recording) and measurement range need to be set before measurement. Change the settings of oth er
setting items as necessary.
• The frequency range for effective values that can be measured with
the instrument is 30 Hz to 10 kHz. An effective value of a frequency
that is out of this range cannot be measured correctly.
• When effective value measurement is perform ed, the response time
becomes long if the input voltage is 10% f.s. or less. We recommend
configuring the setting so that the input voltage becomes 10% f.s. or
more.
• The input signal is displayed as fo llows when it exceeds the possible
measurement range of the set measurement range.
Measurement waveform: The data that exceeds the possible measurement range is displayed in white when the screen backgroun d is
black, and in black when the screen background is white.
Measurement values: The data that exceeds the possible measurement range is indicated as "OVER."
Page 99

89
1
2
(Open/confirm the setting information.)
Select the channel to set from
[Channel].
3Select the type of value to record from
[Mode].
Setting options (. default setting)
4Select the appropriate measurement
amplitude range from [Range].
Setting options (. default setting)
The measurable effective range is up to ±10 times
of the range. (However, for 100 V/div, the maxi-
INSTNT
Records instantaneous values.
RMS Records effective values.
When an effective value is selected, the
input coupling automatically becomes
[AC]. ([DC] cannot be selected.)
10, 20, 50, 100, 200, 500 mV,
1, 2, 5, 10, 20, 50, 100 V [/div]
1div
Voltage value per division in the vertical axis direction
10mV/div
0mV
50mV
-50mV
10mV
10div
In the following steps, use the same operation to configure settings.
The setting can also be
changed on the Waveform
screen. ([Wave+Set] Display)
When you want to view all of the channel setting information
You can check the information on the [All CH]
screen.
When you do not want to display the waveform
of a specific channel
Set the channel display setting to Off (clear the
check).
2
3
4
Select the [CH] screen.
If the channel setting is set to Off, the following items are not applicable. Howeve r, the
trigger is accepted because measurement is performed.
Waveform display, printing, data saving, and data calculation
4.5 Setting the Input Conditions
4
Chapter 4 Setting the Measurement Conditions (When you want to customize the settings)
Page 100

90
Normal Display
(Off)
Cut-Off Frequency Selected
1
2
(Open/confirm the setting information.)
Select from the setting options of [L.P.F].
The setting can also be
changed on the Waveform
screen. ([Wave+Set] Display)
Setting options (. default setting)
Off, 5Hz, 50Hz, 500Hz, 5kHz, 50kHz
Select the [CH] screen.
1
2
(Open/confirm the setting information.)
Select from the setting options of
[Coupling].
The setting can also be
changed on the Waveform
screen. ([Wave+Set] Display)
Setting options (. default setting)
DC
DC Coupling
Select this to acquire both DC and AC
components of an input signal.
GND
The input signal is disconnected.
Zero position can be confirmed.
Select the [CH] screen.
4.5 Setting the Input Conditions
Selecting a Low-Pass Filter (L.P.F.)
When you want to eliminate excess high-frequency
components such as frequencies higher than the
waveform you want to measure, select a cut-off
frequency.
Selecting the Input Coupling Method
Select the coupling method for input signals.
When an effective value is selected in [Mode], the input coupling automatically becomes [AC].
 Loading...