

Page 1

MR8870-20
Instruction Manual
MEMORY HiCORDER
Aug. 2018 Revised edition 3
MR8870B982-03 18-08H
EN
Page 2

Page 3

Contents
Contents
i
1
Introduction ..............................................................................1
Confirming Package Contents................................................2
Safety Information....................................................................3
Operating Precautions.............................................................6
Chapter 1
Overview ____________________________________11
1.1 Product Overview and Features .............................11
1.2 Measurement Flow ........... .......................................12
1.3 Names and Functions of Parts ...............................15
1.4 Screen Configurations ............................................17
1.5 Basic Operation .......................................................19
Chapter 2
Measurement Preparations_________________23
2.1 Using the Battery Pack (Option) ............................24
Install the Battery Pack ....................................................27
Charge the Battery Pack ..................................................27
2.2 Connecting the AC Adapter ....................................28
2.3 Connecting Measurement Cables to the
Memory HiCorder ....................................................29
Connecting Connection Cords
(to record voltage waveforms) ..........................................31
Connecting a Clamp
(to re
cord current waveforms) ..........................................31
Connecting the Logic Probe (to record logic signals) .......32
2.4 Attaching the Carrying Strap ..................................33
2.5 Turning the Power On and Off ...............................34
2.6 Zero Adjustment ......................................................35
Sensor
2
3
MR8870B982-03
Page 4

ii
Contents
Chapter 3
Setting before Measurement_______________ 37
3.1 Pre-Operation Inspection ....................................... 37
3.2 Operating Flow Overview ........................ ............... 38
3.3 Automatic Configuration of Measurement Settings
(Auto Range) .. ... .. .................................................... 42
3.4 Measurement Configuration 1
(Horizontal Axis Settings) ...................................... 44
Select a Timebase ...........................................................44
Setting Recording Length (no. of divisions) .....................45
Setting Display Zoom (as needed) ................................... 45
3.5 Measurement Configuration 2
(Setting Recording Criteria) ................................... 46
Setting the Trigger Mode .................................................46
3.6 Measurement Configuration 3
(Analog Channel Settings) ..................................... 47
Setting the Voltage Axis (Vertical Axis) Range ................47
Selecting Waveform Display Color (as needed) ..............47
Setting the Zero Position (as needed) .............................48
Selecting the Input Coupling Method (as needed) ...........48
Zooming the Vertical Axis (as needed) ............................49
Selecting a Low-Pass Filter (L.P.F.) (as needed) ............49
Converting Units (Scaling function) ...................... ........ ....50
3.7 Measurement Configuration 4
(Logic Channel Settings) ....................................... 51
Setting Logic Channel Display Colors (as needed) .........51
Setting Logic Channel Display Positions .........................51
3.8 Entering Comments ................................................ 52
Chapter 4
Making Trigger Settings____________________ 55
4.1 Setting Recording Criteria ..................................... 55
Setting Combining Logic (AND/OR)
for Multiple Trigger Sources ............................................56
Setting the Trigger Start Point (Pre-Trigger) ....................56
4.2 Triggering by Analog Signals ................................ 57
Selecting an Analog Trigger Type ....................................58
Page 5

Selecting a Trigger Filter ..................................................59
Selecting Rising or Falling (Slope) of the Input Signal .....59
Setting the Signal Threshold Level (Trigger Level) ..........59
Setting Lower and Upper Trigger Thresholds ..................60
Selecting Measurement Frequency .................................60
4.3 Logic Channel Trigger Settings .............................61
Configuring Logical (AND/OR) Trigger Criteria ................61
Setting a Trigger Pattern ..................................................62
Setting a Trigger Filter ......................................................62
4.4 Triggering Manually (Manual Trigger) .... .. ... .. ........62
Chapter 5
Waveform Analysis__________________________63
5.1 Viewing Waveforms .................................................63
Scrolling Waveforms ........................................................64
Verifying Waveform Display Position ...............................64
Magnifying and Compressing Horizontally (Time Axis) ....64
Viewing Any Waveform Location (Jump Function) ..........65
5.2 Viewing Measurement Values ................................66
Displaying Gauges ...........................................................66
Displaying Cursor Values .................................................66
Specifying a Waveform Time Span ..................................68
Viewing Input Signals as Numerical Values
(Numerical Value Display Function) .................................69
iii
Contents
3
4
5
6
Chapter 6
Saving & Loading Data _____________________71
6.1 About Saving and Loading Data ............................71
6.2 Using a CF Card .......................................................74
CF Card Insertion & Removal ..........................................75
Formatting a CF Card ......................................................76
6.3 Saving Data ..... .........................................................77
Automatic Saving .............................................................78
Enabling Delete-and-save Operation ...............................79
Selecting the Manual Saving Method
[Quick Save]/[Select & Save] ...........................................80
Saving Waveform Data (with the SAVE Key) ...................81
Capturing a Screen Image (With the SAVE Key) .............82
Page 6

iv
Contents
Saving Numerical Calculation Results
(With the SAVE Key) ........................................................83
Saving Setting Configurations ..........................................84
6.4 Loading Data on the Memory HiCorder ................ 85
Loading a Setting Configuration .......................................85
Load the setting configuration data automatically ............86
Loading Waveform Data and Screen Images ..................87
6.5 Data Management ................................................... 88
Viewing Folder Contents and the Parent Folder ..............88
Deleting Data ...................................................................89
Renaming Files and Folders ............................................89
Sorting Files .....................................................................90
6.6 Transferring Data to a Computer .......................... 91
Chapter 7
Numerical Calculations ____________________ 93
7.1 Calculation Methods ........ ... .................................... 93
Auto Calculation ...............................................................94
Manual Calculation ..........................................................95
Apply Calculations to a Specific Time Span
(Manual Calculation Only) ................................................96
7.2 Numerical Value Calculation Expressions ........... 97
Chapter 8
System Environment Settings______________ 99
8.1 Screen and Key Operation Settings ................. ... 100
Using the Auto-Resume Function
(Resume After Power Restoration) ................................100
Adjust backlight brightness ............................................100
Enabling and Disabling the Backlight Saver ..................101
Selecting Black or White Screen Background ...............101
Enabling or Disabling the Beeper ..................................101
8.2 Making System Settings ...................................... 102
Setting the Date and Time .............................................102
Initializing the Memory HiCorder (System Reset) ..........103
Selecting the Display Language ....................................103
Self-Test .........................................................................104
Page 7

Chapter 9
External Control __________________________ 105
9.1 Connecting to the External Control
Terminals ......................... .. .....................................105
9.2 External Trigger Input ......... .. ... .............................107
9.3 External Signal Output (Trigger Output) .............108
9.4 Synchronous Measurements with Multiple
Instruments ....................... ..................................... 109
Chapter 10
Specifications_____________________________ 111
Chapter 11
Maintenance and Service_________________ 127
v
Contents
11.1 Troubleshooting ....................................................127
11.2 Cleaning .................................................................130
11.3 Disposing of the Instrument .................................131
Appendix ___________________________________ A1
Appendix 1 Error Messages and Remedial Actions......... A1
Appendix 2 File Naming ......................................................A5
Appendix 3 Wave Processor Application Program.......... A6
Appendix 4 List of Default Settings ...................................A9
Appendix 5 Supplemental Technical Information...........A11
Appendix 6 Options...........................................................A13
Appendix 7 Easy setting for RMS recorder mode ..........A15
Appendix 8 Executing zero adjustment
for Model CT969x series and Model CT6590A18
Appendix 9 To 8870-20 Users
(Firmware Ver. 1.08 or Earlier)......................A19
Appendix 10To MR8870-20 Users
(Firmware Ver. 2.03 or Earlier)......................A21
Index __________________________________ Index 1
6
7
8
9
10
11
Appendix
Index
Page 8

vi
Contents
Page 9

Introduction
Thank you for purchasing the HIOKI "Model MR8870-20 Memory
HiCorder." To obtain maximum performance from the instrument,
please read th
erence.
1
Introduction
is manual carefully, and keep it handy for future ref-
The MR8870-20 offers two modes: mem
RMS recorder mode. This manual primarily describes operation of
the instrument in memory recorder mode. For more information
about RMS recorder mode, see the included Measurement Guide
(RMS Recorder).
An optional clamp-on probe is required for current measurement
w
ith the Memory HiCorder. In this manual, all models of these
probes are collectively referred to as “clamp sensors.” For details,
refer to the instruction manual of the particular clamp sensor to be
used.
ory recorder mode and
Registered trademarks
• Windows is a registered trademark of Microsoft Corporation in
the United States and/or other countries.
• CompactFlash is a registered trademark of Sandisk Corporation
(USA).
Page 10
2
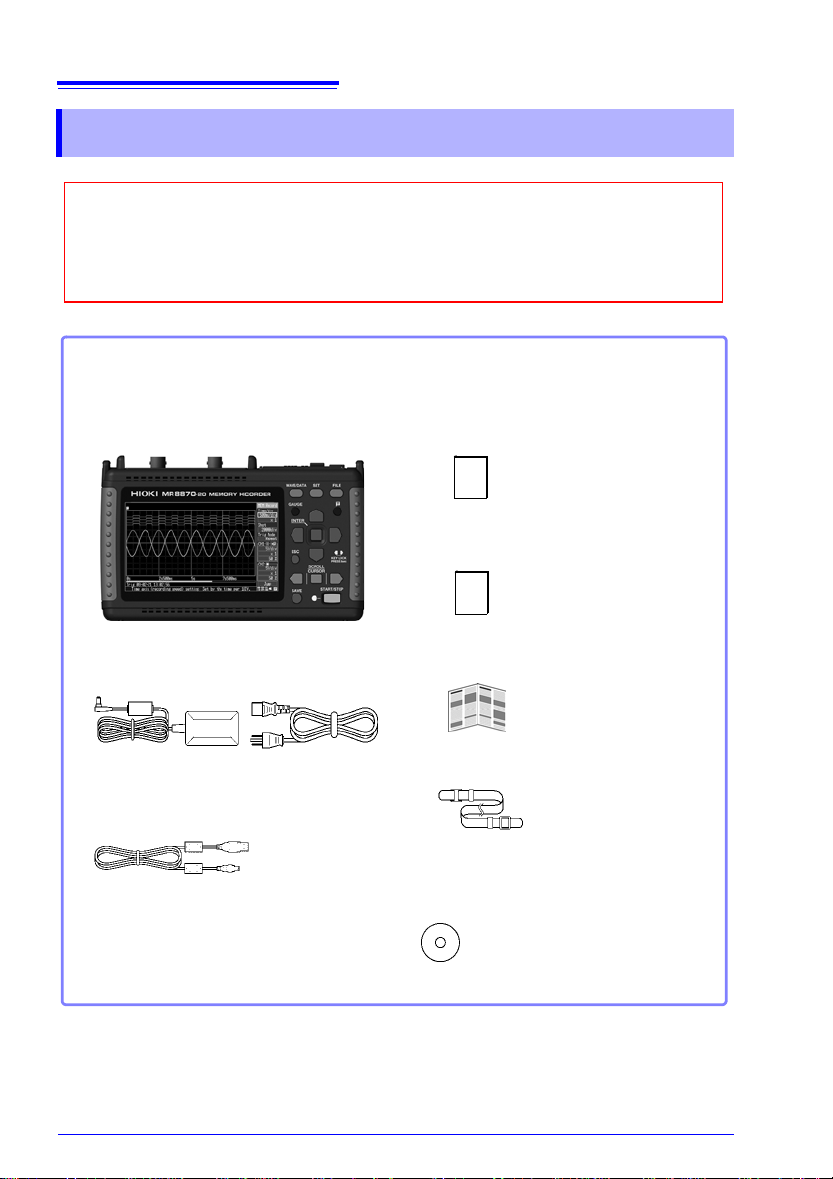
When you receive the instrument, inspect it carefully to ensure that no damage
occurred during shipping. In particular, check the accessories, panel switches,
and connectors. If damage is evident, or if it fails to operate according to the
specifications, contact your dealer or Hioki representative.
Confirm that these contents are provided.
Model MR8870-20
Memory HiCorder.........................1
Model Z1005 AC Adapter ............1
with supplied power cord
USB Cable ....................................1
Model 9809 Protection Sheet......1
Please stick this over the screen to protect
it from any damage.
(p. 28)
(p. 91)
Instruction Manual
(This document)...........................1
Measurement Guide
(Memory Recorder)......................1
Measurement Guide
(RMS Recorder) ...........................1
Strap .............................................1
Dedicated Wave Processor
Application Program for the
8870 (CD)......................................1
(p. 33)
The latest version can be
downloaded from our web site.
Confirming Package Contents
Confirming Package Contents
For information about options:(p. A13)
Contact your dealer or Hioki representative for details.
Page 11

3
Safety Information
Safety Information
This instrument is designed to comply with IEC 61010 Safety
Standards, and has been thoroughly tested for safety prior to
shipment. However, mishandling during use could result in
injury or death, as well as damage to the instrument. However, using the instrument in a way not described
ual may negate the provided safety features.
Be certain that you understand the instructions and precautions in the manual before use.
ity for accidents or injuries not resulting directly from
instrument defects.
This manual contains information and warnings essential for safe operation of the
instrument and for maintaining it in safe operating condition. Before using it, be sure
to carefully read the following safety precautions.
We disclaim any responsibil-
Safety Symbols
In the manual, the symbol indicates particularly important information that the
user should read before using the instrument.
The symbol printed on the instrument indicates that the user should refer to a
corresponding topic in the manual (marked with the symbol) before using the
relevant function.
Indicates a double-insulated device.
Indicates DC (Direct Current).
in this man-
Indicates a grounding terminal.
Indicates the ON side of the power switch.
Indicates the OFF side of the power switch.
The following symbols in this manual indicate
and warnings.
Indicates that incorrect operation presents an extreme hazard that could
result in serious injury or death to the user.
Indicates that incorrect operation presents a significant hazard that could
result in serious injury or death to the user.
Indicates that incorrect operation presents a possibility of injury to the user
or damage to the instrument.
Indicates advisory items related to performance or correct operation of the
instrument.
the relative importance of cautions
Page 12
4
Ni-MH
Safety Information
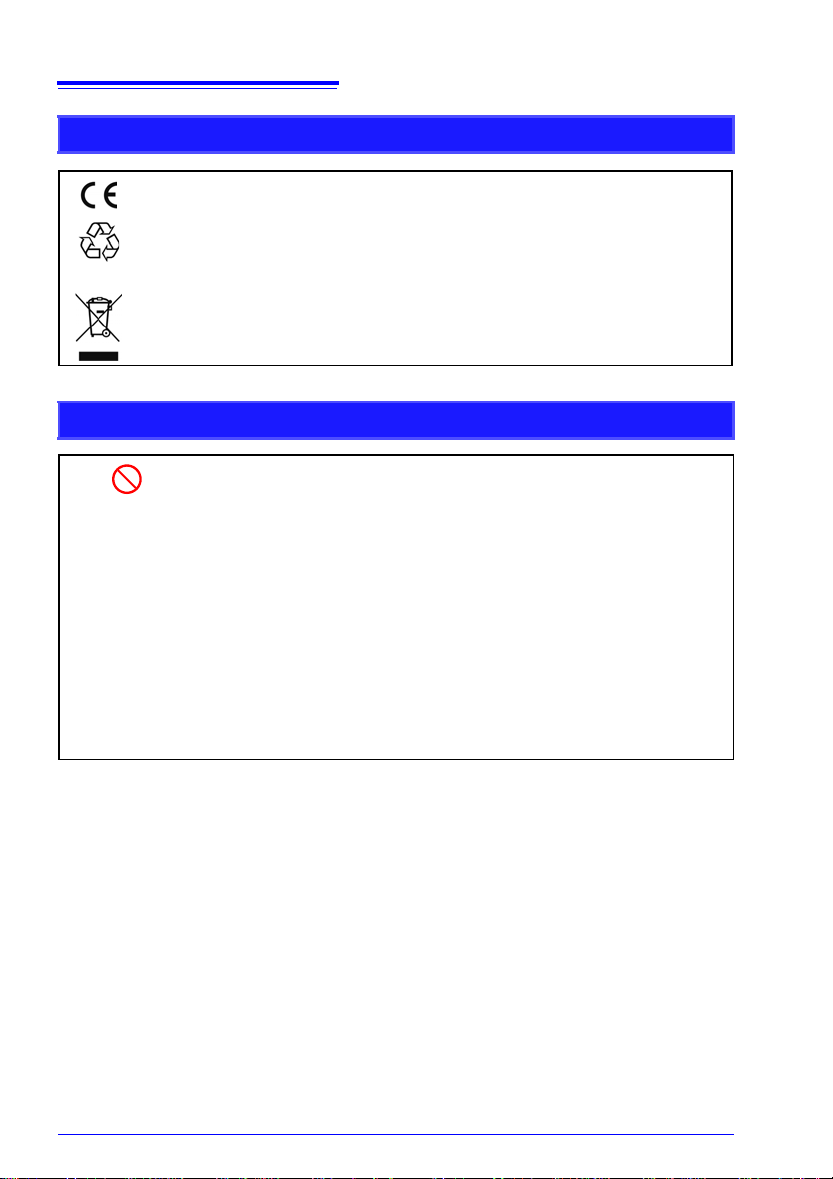
Symbols for Various Standards
Indicates that the product conforms to regulations set out by the EC Directive.
This is a recycle mark established under the Resource Recycling Promotion
(only for Japan).
Law
Indicates the Waste Electrical and Electronic Equipment Directive (WEEE
Directive) in EU member states.
Other Symbols
Indicates the prohibited action.
(p. #)
[ ]
SET
(Bold characters)
Unless otherwise specified, "Windows" represents Windows XP, Windows Vista, Windows 7, Windows 8, or Windows 10
Click: Press and quickly release the left button of the mouse.
Double click: Quickly click the left button of the mouse twice.
Indicates the location of reference information.
Indicates that descriptive information is provided below.
The names of setting objects and buttons on the screen are indicated
by square brackets [ ].
Bold characters within the text indicate operating key labels.
Accuracy
We define measurement tolerances in terms of f.s. (full scale), rdg. (reading) and
dgt. (digit) values, with the following meanings:
f.s. (maximum display value or scale length)
The maximum displayable value or scale length. In this instrument, the maximum
layable value is the range (V/div) times the number of divisions (10) on the verti-
disp
cal axis. Example: For the 1 V/div range, f.s. = 10 V
rdg. (reading or displayed value)
The value currently being measured and indicated on the measuring instrument.
dgt. (resolution)
The smallest displayable unit on a digital measuring instrument, i.e., the input value
that causes the digital display to show a "1" as the least-significant digit.
Page 13

Safety Information
Measurement categories
This instrument complies with CAT II safety requirements.
To ensure safe operation of measurement instruments, IEC 61010 establishes safety standards for various electrical environments, categorized as CAT II to CAT IV, and called measurement categories.
5
CAT II: Primary electrical circuits in equipment
CAT III: Primary electrical circuits of heavy
CAT IV: The circuit from the service drop to the service entrance, and to the power meter
Using a measurement instrument in an environment d esignated with a higher-numbered ca tegory than that for which the instrument is rated could result in a severe accident, and must
b
Use of a measurement instrument that is not CAT-rated in CAT II to CAT IV measurement
a
connected to an AC electrical outlet by
a powe
r cord (portable tools, household
appliances, etc.) CAT II covers directly
measuring electrical outlet receptacles.
eq
uipment (fixed installations) connected directly to the distribution panel, and
fe
eders from the distribution panel to
outlets.
an
d primary overcurrent protection device (distribution panel).
e carefully avoided.
pplications could result in a severe accident, and must be carefully avoided.
Page 14
6
Operating Precautions
Operating Precautions
Follow these precautions to ensure safe operation and to obtain
the full benefits of the various functions.
Before Use
• Before using the instrument the first time, verify that it operates
normally to en
or shipping. If you find any damage, contact your dealer or Hioki
representative.
• Before using the instrument, make sure that the insulation on the
pro
bes, connection cords, and clamp sensor leads is undamaged and that no bare conductors are improperly exposed. Using
the instrumen
so contact your dealer or Hioki representative for replacements.
Instrument Installation
Operating temperature and humidity: 0 to 40°C at 80% RH or less
-condensating)
(non
Temperature and humidity range for guaranteed accuracy:
2
3±5°C, 80%RH or less
sure that the no damage occurred during storage
t in such conditions could cause an electric shock,
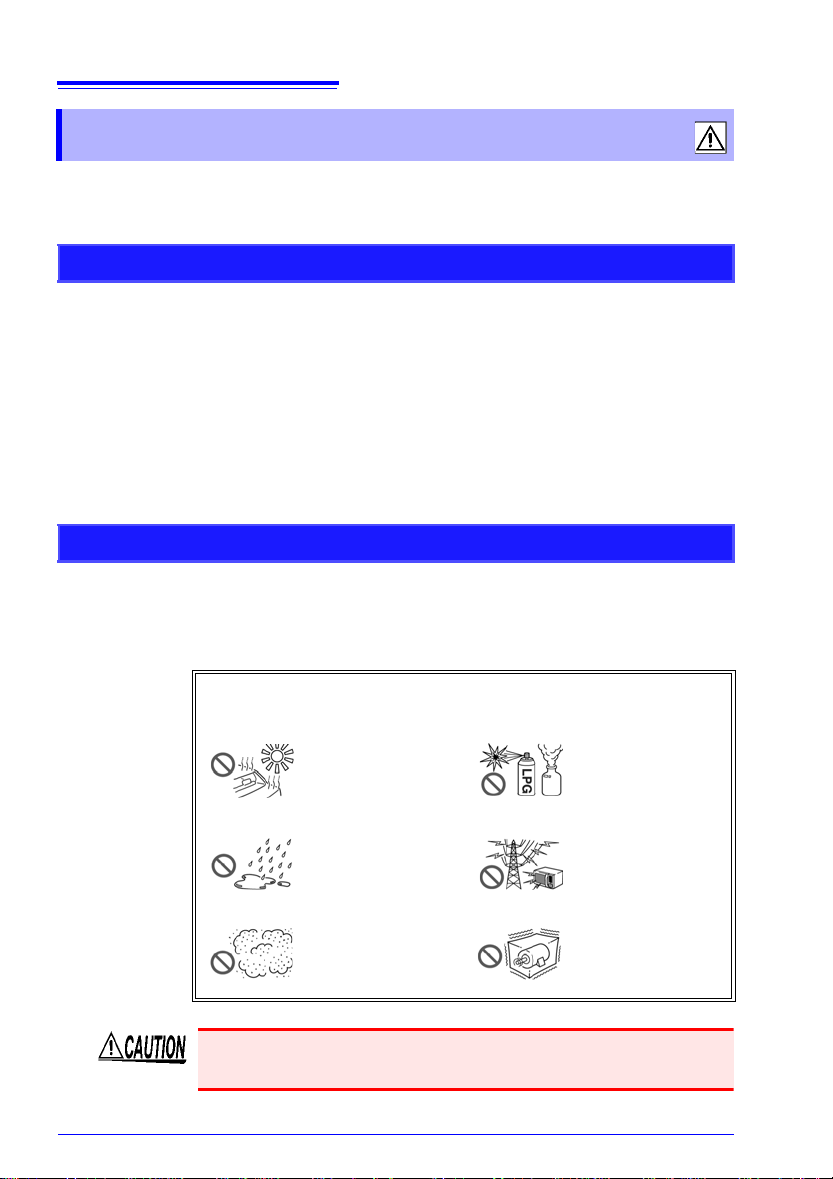
Avoid the following locations that could cause an accident or
damage to the instrument.
Exposed to direct
sunlight
Exposed to high
temp
erature
Exposed to liquids
Exposed to high
humid
ity or con-
densation
Exposed to high
levels o
f particulate
dust
In the presence of
corrosive or explosive gases
Exposed to strong
electr
omagnetic
fields
Near electromagnetic radiators
Subject to vibration
The maximum operating (ambient) temperature for the MR8870-20
is 40°C. Do not attempt to use in higher temperature environme nts.
Page 15

Correct measurement may be impossible in the presence of
strong magnetic fields, such as near transformers and high-cur
rent conductors, or in the presence of strong electromagnetic
fields such as near radio transmitters.
Installation Precautions
• Do not install the instrument with any side except the bottom facing down.
• Leave sufficient space around the ventilation holes and install the
instrumen
Handling the Instrument
• Do not allow the instrument to get wet, and do not take measurements with wet hands. This may cause an electric
shock
.
• Do not attempt to modify, disasse
ment; as fire, electric shock and injury could result.
• To avoid damage to the instrument, protect it from physical
shock when transporting and handling. Be especially careful to
avoid physical shock from dropping.
• This i nstrument may cause interference if used in residential
are
as. Such use must be avoided unless the user takes special
measures to reduce electromagnetic emissions to prevent interference to the reception of radio and television broadcasts.
7
Operating Precautions
-
t with the holes unobstructed.
mble or repair the instru-
Handling the Cords and Probes
• Avoid stepping on or pinching cables, which could damage the
cable insulation.
• To avoid breaking the cables and prob
• To avoid damaging the power cord, grasp the plug, not the cord ,
whe
n unplugging it from the power outlet.
• When disconnecting the BNC connector, be sure to release the
ck before pulling off the connector. Forcibly pulling the connec-
lo
tor without releasing the lock, or pulling on the cable, can dam age the connector.
es, do not bend or pull them.
Page 16

8
Operating Precautions
• To prevent an electric shock accident, confirm that the white or
red portion (insulation layer) inside the cable is not exp osed. If a
color inside the cable is exposed, do not use the cable.
• Use only the specified measurement cables. Using a non-specified cable may result in incorrect measurements due to poor connection or other reasons.
• Before using a clamp sensor or logic probe, read the instruction
manual supplied with it.
Before Turning Power On
Using the Battery Pack
• For battery operation, use only the HIOKI Model 9780 Battery
Pack. We do not take any responsibility for accidents or
amage related to the use of any other batteries.
d
See: "2.1 Using the Battery Pack (Option)" (p. 24)
Using the AC Adapter
• Use only the supplied Model Z1005 AC Adapter. AC adapter
input voltage range is 100 to 240 VAC (with ±10% stability) at
50/60 Hz. To avoid electrical hazards and damage to the
instrument, do not apply voltage outside of this range.
• Turn the instrument off before connecting the AC
the instrument and to AC power.
• To avoid electrical accidents and to maint ain the safety specifications of this instrument, connec
vided only to a 3-contact (two-conductor + ground) outlet.
• Before turning the instrument on, make sure the
age matches that indicated on it
tion to an improper supply voltage may damage the
instrument and present an electrical hazard.
adapter to
t the power cord pro-
supply volt-
s power connector. Connec-
When the power is turned off, do not apply voltage or current to
the BNC jacks, logic connector, or external control terminals.
Doing so may damage the instrument.
After use, always turn OFF the power.
Page 17
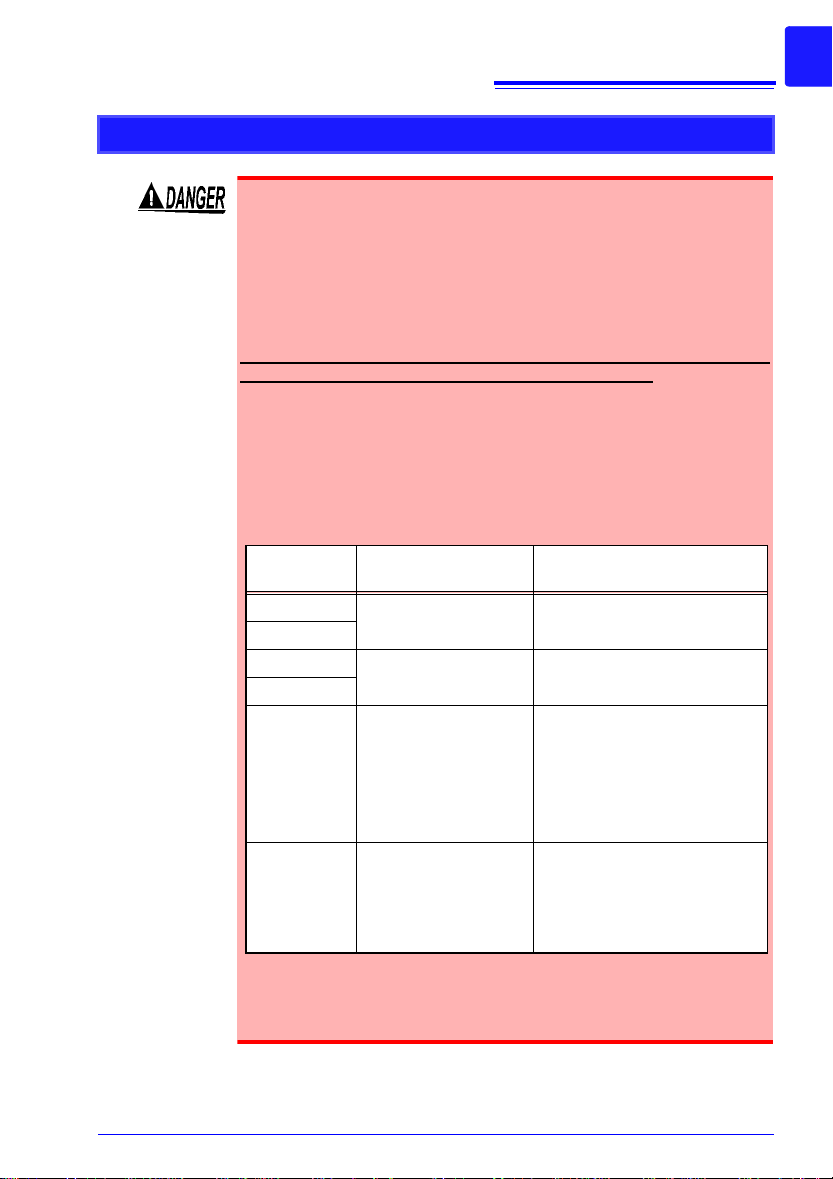
About Inputs and Measurement
Measurement cables
Maximum rated voltage between terminals
maximum rated voltage to
earth
Model L9197 600 VAC/DC
600 VAC/DC (CAT III)
300 VAC/DC (CAT IV)
Model 9197
Model L9198 300 VAC/DC
600 VAC/DC (CAT II)
300 VAC/DC (CAT III)
Model L9217
Model L9790 600 VAC/DC When using the L9790-01 Alliga-
tor clip, the 9790-03 Contact pin
600 VAC/DC (CAT II)
300 VAC/DC (CAT III)
When using the L9790-01 Grabber clip
300 VAC/DC (CAT II)
150 VAC/DC (CAT III)
Model 9322
Differential
Probe
2000 VDC, 1000 VAC When using the Grabber clip
1500 VAC/DC (CAT II)
600 VAC/DC (CAT III)
When using the Alligator clip
1000 VAC/DC (CAT II)
600 VAC/DC (CAT III)
Note the following maximum rated voltage between terminals
and maximum rated voltage to earth.
Maximum rated voltage between terminals: 400 VDC
Maximum rated voltage to earth: 300 VAC/DC (CAT II)
The following tables list the maximum ra
terminals and the maximum rated voltage to earth for connection cords.
To avoid electric shock and instru
voltages in excess of these figures.
The lower of the instrument’s and the
imum rated voltage between terminalss applies.
When these voltage levels are exceeded, the instrument will
be damaged. Do not make measurements as doing so may
result in bodily injury.
The maximum rated voltage to earth doe
you make measurements with an attenuator or other component connected to the input.
Consider your connection method and do not exce
maximum rated voltage to earth.
9
Operating Precautions
ted voltage between
ment damage, do not input
connection cord’s max-
s not change, even if
ed the
For example, if the instrument is used in combination with
Model L9198, the maximum rated voltage between terminals
is 300 VDC and the maximum rated voltage to earth is 300
VAC (CAT II).
Page 18

10
Operating Precautions
Connect the clamp-on sensors or measurement cables to the
instrument first, and then to the active lines to be measured.
Observe the following to avoid electric shock and short circuits.
• To avoid short circuits and potentia
ards, never attach the clamp to a c
more than the maximum rated voltage to earth, or over bare
conductors.
• Do not allow the connection cord clip
the same time. Never touch the edge of the metal clips.
• When the clamp sensor is opened, do not allow the metal
art of the clamp to touch any exposed metal, or to short
p
between two lines, and do not use over bare conductors.
• Do not leave the Memory HiCorder connected to test object
in environments where a voltage surge might exceed the
dielectric withstand voltage. Doing so could result in damage to the Memory HiCorder, bodily injury or fatal accident.
CD Handling
• Always hold the disc by the edges, so as not to make fingerprints
on the disc or scratch the printing.
• Never touch the recorde d side of the disc. Do not place the disc
dire
• Do not wet the disc with volatile alcohol or water, as there is a
possibility of th
• To write on the disc label surface, use a spirit-based felt pen. Do
not
use a ball-point pen or hard-tipped pen, because there is a
danger of scratching the surface and corrupting the data. Do not
use adhesive labels.
• Do not expose the disc directly to the sun's rays, or keep it in
conditions of high temp
of warping, with consequent loss of data.
• To remove dirt, dust, or fingerprints from the disc, wipe with a dry
th, or use a CD cleaner. Always wipe from the inside to the
clo
outside, and do no wipe with circular movements. Never use
abrasives or solvent cleaners.
• Hioki shall not be held liable for any problems with a computer
syste
related to the purchase of a Hioki product.
lly life-threatening haz-
ircuit that operates at
s to touch two wires at
s
ctly on anything hard.
e label printing disappearing.
erature or humidity, as there is a danger
m that arises from the use of this CD, or for any prob lem
Page 19

11
Waveform analysis
T
mV A
Cursor Measurements (p. 66)
A
B
Using the A/B cursors, values at cursor locations on waveforms and the time and period at trigger positions can be displayed.
Up to seven types of calculations such as
RMS, maximum and average values can
be applied to measurement data, and
waveforms and calculation results can be
displayed separately on screen.
Numerical Calculations (p. 93)
123.4V
Recording logic
signals
Measures using optional
logic probes. Mixed analog and logic
recording is
possible.
Recording various analog
signals
Measurements for a wide variety
of applications are available using
the appropriate
measurement
leads or clamp
sensor options.
Gauge display
(p. 66)
Zoom in/out
(p. 64)
Numerical display
(p. 69)
Measurement data and setting configurations are
stored, read and managed
as data files
Measurement data can be stored
to and read from an optional CF
card (p. 71).
Recording waveforms
of abnormal events
Abnormal events can be analyzed by recording with the
trigger function
(p. 55).
Analysis on a PC
Data stored on the CF card can be
transferred for analysis to a computer using the supplied USB cable
(p. 91). Measurement data can be
analyzed using
the supplied application program
(p. A6).
Display in converted units
Using the scaling function, input values can be displayed in units of the
actual physical quantity being measured, such as speed or temperature
(p. 50).
1.1 Product Overview and Features
Overview Chapter 1
1.1 Product Overview and Features
The Hioki MR8870-20 Memory HiCorder is a compact, lightweight, easy-tooperate waveform recorder. It can run on batteries, and can be quickly
deployed when a power anomaly occurs.
Measurement data can be monitored, subjec
on a personal computer using the supplied application program.
ted to calculations and analyzed
1
Chapter 1 Overview
3
Page 20

12
AC adapter
connection (p. 28)
Install the battery pack (option) (p. 24)
Connect to the Model MR8870-20 (p. 23), and set up (p. 6)
Turn the power on (p. 34)
Measurement
cables connections
(p. 29)
Configure measurement mode (p. 38)
Memory recorder mode
The instrument records instantaneous signal waveforms. Trigger
and numerical calculation functionality can be used.
RMS recorder mode
The instrument records RMS
waveforms for commercial power
supply(50Hz,60Hz) and DC signals.
Thereafter, it will be explained on the screen of Memory recorder mode.
1.2 Measurement Flow
1.2 Measurement Flow
Installing, Connecting and Turning On
Page 21

13
Configure measurement settings (p. 44)
Using a previously saved setting
configuration
Reload a previously stored setting
configuration from Model MR8870-20
memory or a CF card, and measure
(p. 85).
Select the timebase (horizontal axis), voltage range (vertical axis) and
input channels.
If the measurement ranges are unknown, they can be set automatically (p. 42).
Move to a
setting item
Open the
setting options
Select
Apply
Configure Automatic Data Storage
to a CF card (as needed) (p. 77)
To save (store) measured data automatically, enable Auto-Save before
starting to measure. Alternatively,
you can save data manually after
measuring.
1.2 Measurement Flow
Settings
1
Chapter 1 Overview
3
Page 22

14
Press the START/STOP key (p. 20)
Record once, and stop. Trigger Mode: [Single]
Start
Measurement
When recording using the trigger function, recording occurs only
when the input waveform satisfies specified trigger criteria.
Record repeatedly. Trigger Mode: [Repeat]
Stop
Measurement
View Measurement Data (p. 63)
Waveforms can be zoomed and numerical values confirmed.
Save Data (p. 71)
Measurement data, waveform data, screen images and numerical
calculation results can be saved.
Calculate (p. 93)
Numerical measurement data can be applied to calculations.
View on a Computer (p. 91)
To download data from the CF card in the Memory HiCorder, connect a computer with
the supplied USB cable. Recorded data can be analyzed on the com puter with the bundled Wave Processor program (p. A6).
Turn the Memory HiCorder Off (p. 34)
1.2 Measurement Flow
Starting and Stopping Measurement
Data Analysis
When Finished
Page 23

15
Front Panel
Operating Keys
Rear Panel
Battery Compartment (p. 24)
The optional Model 9780 Battery Pack
is installed here.
Display Screen (p. 63)
4.3-inch TFT color LCD
Screen Configurations (p. 17)
Manufacturer's Serial Number
Shows the serial number.
Do not remove this label, as it is required
for product support.
Operating Keys
WAVE/DATA
Switches between Waveform
and Numerical Value screens
(p. 17).
SET
Displays the Settings screens,
and switches among the
screen tabs with each press
(p. 18).
FILE
Displays file information
(p. 18).
GAUGE
Alternately displays and
hides the measurement
scale on the Waveform
screen.
(Manual trigger)
Press to trigger manually.
ESC
Cancels changes to settings.
Cursor Keys
Moves the position
of the cursor (blinking selection) on the
screen.
ENTER
Accepts displayed
settings.
KEY LOCK
To lock the keys,
press and hold the
left and right cursor
keys for three seconds.
Repeat to unlock.
Press to save data manually
(p. 77).
Use the left and right keys to
scroll waveforms or move
the A/B cursors. Press the
middle key to select which
of these actions the left and
right keys perform (p. 19).
Setup and display
Saving operations
Scroll waveforms and
read cursor values
Choose a screen
Start and stop measurement. The LED at the left
lights green while measuring (p. 20).
Start and stop
measurement
1.3 Names and Functions of Parts
1.3 Names and Functions of Parts
1
Chapter 1 Overview
3
Page 24

16
Top Panel
AC Adapter Socket
Connect the supplied Model
Z1005 AC Adapter (p. 28).
CF Card Slot
Insert an optional CF Card (p. 74).
BNC Jack
Connect optional measurement cables or
clamp sensors (p. 29).
CHARGE LED
This LED lights when the battery
is charging (p. 27).
LOGIC Connector
Connect an optional logic probe (p. 32).
External Control Terminals
Control signals can be received from and
output to external devices (p. 105).
Right Side
POWER Switch
Turns the instrument on and off (p. 34).
Power Off
Power On
USB Port
(USB 2.0 mini-B receptacle)
Open the dust cap and connect the USB
cable (p. 91).
Connect to a computer to transfer data.
Strap Hole (p. 33)
1.3 Names and Functions of Parts
Page 25

17
Press this key to
switch between
the screens.
Operational information is displayed
along the bottom of
the screen.
Waveform Screen
Data stored in the Memory HiCorder is displayed as waveforms (p. 63).
Numerical Screen
Displays the real-time numerical values of the measurement
signals. Switch between instantaneous (peak-to-peak)
and RMS values, or Display
Hold. (p. 69)
Waveform/Numerical Screens
About the Icons
Clock
"Setting the Date
and Time" (p. 102)
Power Source Indicator
Indicates the Memory HiCorder's power
source.
AC adapter operation
Battery pack operation
Fully charged battery pack
Battery pack operation
Low battery indicator during
battery pack operation
CF Card
Displayed when a CF
card is inserted.
1.4 Screen Configurations
1.4 Screen Configurations
1
Chapter 1 Overview
3
Page 26

18
Press this key to
switch between
the screens.
Operational information is displayed
along the bottom of
the screen.
Setting Screen
Configure measurement settings (p. 44).
Set trigger criteria as needed
(p. 55).
Calc/Save Screen
Configure numerical calculations (p. 93) and auto-saving
(p. 78).
Comment Screen
Enter per-channel comments
(p. 52).
System Screen
Configure the system environment (p. 99).
Settings Screens
File Screen
View and manage files on the
CF card (p. 71).
File Screen
Operational information is displayed
along the bottom of
the screen.
1.4 Screen Configurations
Page 27

19
Select the item to
change.
Show available setting options.
Select the desired
setting.
Changing screen contents
Setting Screen
Apply the new setting,
or cancel it.
Waveform Screen
Scrolling a waveform
Earlier
Later
See: "Scrolling Waveforms" (p. 64)
Reading values at cursors
A/B cursor values
1
Display the A/B cursors.
Cursor type
2
Move the A/B cursors.
Values at cursor positions can
be read numerically.
Select the cursor type, and
which cursor(s)
to move (p. 66).
1.5 Basic Operation
1.5 Basic Operation
Screen Operations
1
Chapter 1 Overview
3
Page 28
20
Start Measurement
Press the START/STOP key.
The green LED lights.
When using the trigger function, the times when measurement
starts and when recording (data acquisition) starts are not the
same.
Finish Measurement
Trigger Mode: [Repeat] (default setting)
Pressing the START/STOP key stops recording.
Trigger Mode: [Single]
Recording stops when the specified recording time has elapsed.
Press and hold the right and left cursor keys for three seconds to
lock the other keys, and repeat to unlock.
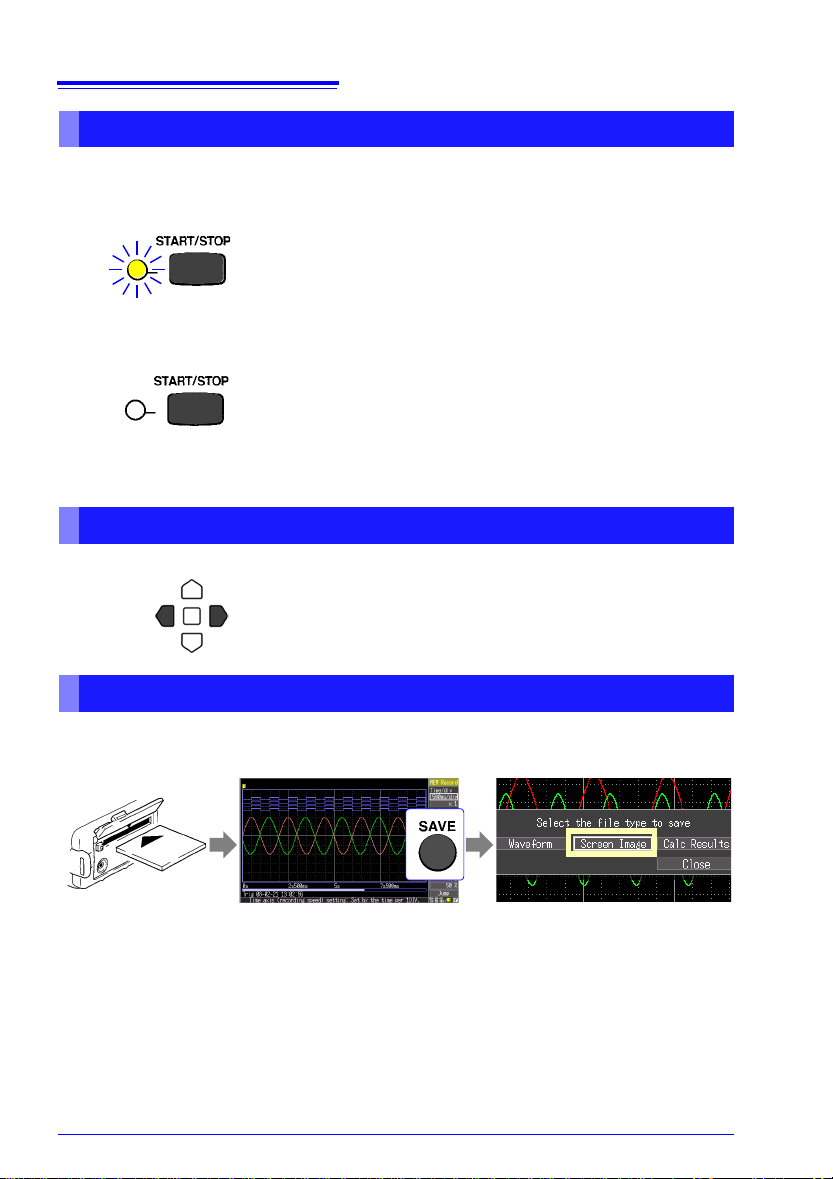
Insert a CF card. Display the screen to be saved,
and press the SAVE key.
Select [Screen Image] in the dialog, and press the ENTER key
to display the confirmation dialog.
Select [Yes] and press ENTER
again.
The image is saved as a bitmap
image file (named date_number.
BMP).
1.5 Basic Operation
Starting and Stopping Recording
Acquire measurement data on the Memory HiCorder, and start recording.
Recording stops according to the trigger mode
46).
Disabling Key Operations (Key-Lock Function)
Keys can be disabled to avoid inadvertent operations.
(recording criteria) setting (p.
Saving Display Images
Screen images of measurement data and s
tured and saved (p. 82).
etting configurations can be cap-
Page 29

21
Displayable waveform range
The displayable range is determined by the waveform magnification (vertical zoom) and zeroposition settings.
Current Input Signal
Level
Measurement Units of Input Waveform
Using the Scaling function (p. 50), measurement
units can be converted as desired for display.
Waveform monitor
Gauge
Shows the selected voltage range (vertical axis)
for channels 1 and 2.
1.5 Basic Operation
Verifying the Input Level (Level Monitor)
You can verify the input status and display range while making settings on the
Setting screen. This is not available while measuring.
1
Chapter 1 Overview
3
Page 30

22
1.5 Basic Operation
Page 31

Measurement
Rear View
Install the 9780 Battery Pack
(option) (p. 24)
1
Connect the AC
adapter (p. 28)
3
(To save data)
Insert a CF card (option) (p. 74)
4
2
Connect measurement cables
(p. 29)
Logic signal measurement:
connect logic probe
Voltage measurement:
connect connection cords
Current measurement:
connect clamp sensors
Attach the strap (p. 33)
External control
signal inputs
External control
signal outputs
(p. 105)
Turn the power on (p. 34)
Execute zero adjustment (p. 35)
5
23
Preparations
Chapter 2
2
Chapter 2 Measurement Preparations
3
Page 32

24
2.1 Using the Battery Pack (Option)
2.1 Using the Battery Pack (Option)
If commercial power is not available when the AC adapter is connected, the
MR8870-20 Memory HiCorder can operate from the Model 9780 battery pack,
so when using commercial power, the battery pack serves as a backup supply
during power outages.
Charge the battery pack fully before using it the first time.
Be sure to observe the following precautions. Incorrect handling may result in liquid leaks, h
bursting and other hazards.
• Do not use a battery pack other than the 9780 Battery Pack.
We cannot accept responsibility
related to the use of any other batteries.
• To avoid the possibility of explos
disassemble or incinerate battery pack.
• When storing the instrument, make
could short-circuit the connectors are placed near them.
• The battery pack contains lye, whi
comes into contact with the eyes. Should battery liquid get
into your eyes, do not rub your eyes but rinse them in plenty
of water and seek the immediate attention of a physician.
eat generation, ignition,
for accidents or damage
ion, do not short circuit,
sure no objects that
ch can cause blindness if
Installing and replacing the battery pack
• To avoid electric shock, turn of
connect the cables before replac
• After installing or replacing the battery pack, replace the
battery comp
• Handle and dispose of batteries
regulations.
artment cover and screw.
f the power switch and dis-
ing the battery pack.
in accordance with local
Page 33

25
2.1 Using the Battery Pack (Option)
Observe the following to avoid damage to the instrument.
• Use the battery pack in an ambient temperature range of 0 to
40°C and
to be on the safe side.
• If the battery packs fails to complete charging within the stipulated time, disconnect the AC adapter from the pack to stop
ch
• Consult your dealer or nearest se
leaks, strange odor, heat, discoloration, deformation and other
abnormal conditions occur during use, charging or storage.
Should these conditions occur during use or charging, turn off
and disconnect the instrument immediately.
• Do not expose the instrument to water and do not use it in excessively humid locations or locations exposed to rain.
• Do not expose the instrument to strong impacts and do not throw
it arou
• The battery pack is subject to self-discharge. Be sure to charge
the battery pack before initial use.
• When recharging a discharged battery pack in the Model
MR8870-20, allow it to charge for at least ten minutes with the
Model MR8870-20 turned off to maximize battery longevity.
• The battery pack is a consumable. If the battery capacity remains
very low
end. It can be recharged up to about 500 times.
• To prevent battery pack deterioration when the battery will not be
u
sed for 1 month or longer, remove it and store it in a dry location
with an ambient temperature range of between -10 to 30°C. Be
sure to discharge and charge it every two months. Long-term
storage when capacity has decreased will make charging impossible and reduce performance.
• Remove the battery pack from instrument once a month and
che
• As long as battery charge remains, wave form data is retained in
inte
battery continues to gradually discharge. When the battery
charge is depleted, stored waveform data is lost.
charge it in an ambient temperature range of 5 - 30°C
arging.
rvice station should liquid
nd.
after correct recharging, the useful battery life is at an
ck that appearance is normal.
rnal memory while the Memory HiCorder is turned off, so the
2
Chapter 2 Measurement Preparations
3
Page 34

26
When to charge
When powering the instrument from the battery pack without the Model Z1005
AC Adapter, the low battery indicator ( ) is displayed when the battery
charge is depleted, indicating that the battery pack requires charging.
Note that if the Memory HiCorder is turned off under this situation, waveform
data may fail to be backed up, and could be lost.
Approximate charging time:
About 200 minutes at 23ºC when recharged at the first appearance of the low
battery indicator.
Approximate continuous battery-only operating time
(operating at 23°C)
• After a full charge, with the LCD backlight always on (default setting):
approximately two hours
• After a full charge, with the LCD backligh t off (five minutes after last keypress): approximately 2.5 hours
See: "Enabling and Disabling the Backlight Saver" (p. 101)
2.1 Using the Battery Pack (Option)
Page 35

Install the Battery Pack
Required tool:
One Phillips screwdriver
(No.2)
Important
Disconnect the AC adapter when installing the battery pack.
Battery Compartment
Cover
1
Place the Memory
HiCorder face down,
and remove the battery
compartment cover
screw and cover.
2
Connect the plugs of the
battery pack to the connectors and insert the
battery pack with the
label side up.
Replace the battery
compartment cover
and screw.
3
Pull the battery pack plug straight out to remove the battery pack.
Make sure that the
cables are not
pinched.
2
Be sure to properly
seat the connectors.
1
Connect the power cord to
the inlet socket on the AC
adapter.
1
2
Connect the output plug of the
AC adapter to the instrument.
Plug the power cord into the mains outlet.
3
Refer to "2.2 Connecting the AC Adapter" (p. 28) for details about the AC adapter.
The CHARGE LED lights red
when charging begins.
Charging is finished when the
CHARGE LED turns off.
27
2.1 Using the Battery Pack (Option)
2
Chapter 2 Measurement Preparations
3
Charge the Battery Pack
Regardless of whether the Mem ory HiCorder is on or off, the battery pack recharges
whenever the Z1005 AC Adapter is plugged in to a power source. Therefore, charging is provided by merely keeping the battery installed in the Memory HiCorder.
Page 36

28
Connect the power cord to
the inlet socket on the AC
adapter.
Rated supply voltage is 100 to
240 VAC, and rated supply frequency is 50 or 60 Hz.
1
2
Connect the output plug of the AC
adapter to the instrument.
Plug the power cord into the mains outlet.
3
2.2 Connecting the AC Adapter
2.2 Connecting the AC Adapter
Connect the power cord and the instrument to the supplied Model Z1005 AC
Adapter, then plug the power cord into an outlet. When used with the battery pack
in
stalled, the battery serves as an operating backup supply in case of power failure,
and the AC adapter otherwise has priority.
Before Connecting
• Use only the supplied Model Z1005 AC Adapter. AC ada pter
input voltage range is 100 to 240 VAC (with ±10% st ability) at
50/60 Hz. To avoid electrical hazards and damage to the
instrument, do not apply voltage outside of this range.
• Turn the instrument off before connecting the AC adapter to
the instrument a
• To avoid electrical accidents and to maintain the safety
specifications of this instr
only to a 3-contact (two-conductor + ground) outlet.
To avoid damaging the power cord, grasp the plug, not the cord,
when unplugging it from the power outlet.
nd to AC power.
ument, connect the power cord
Page 37

2.3 Connecting Measurement Cables to the Memory HiCorder
Measurement cables
maximum rated voltage between terminals
Maximum rated voltage to
earth
Model L9197 600 VAC/DC
600 VAC/DC (CAT III)
300 VAC/DC (CAT IV)
Model 9197
Model L9198 300 VAC/DC
600 VAC/DC (CAT II)
300 VAC/DC (CAT III)
Model L9217
Model L9790 600 VAC/DC When using the L9790-01 Alliga-
tor clip, the 9790-03 Contact pin
600 VAC/DC (CAT II)
300 VAC/DC (CAT III)
When using the L9790-01 Grabber clip
300 VAC/DC (CAT II)
150 VAC/DC (CAT III)
Model 9322
Differential
Probe
2000 VDC, 1000 VAC When using the Grabber clip
1500 VAC/DC (CAT II),
600 VAC/DC (CAT III)
When using the Alligator clip
1000 VAC/DC (CAT II)
600 VAC/DC (CAT III)
2.3 Connecting Measurement Cables to
the Memory HiCorder
29
Connect the appropriate cables for the intended recording application.
• To record voltage waveforms (p. 31)
• To record current waveforms (p. 31)
• To record logic signals (p. 32)
Be sure to read the "Operating Precautions" (p. 6) before connecting the cables.
Connecting to the BNC terminals
Note the following maximum rated voltage between terminals
and maximum rated voltage to earth.
Maximum rated voltage betwe
Maximum rated voltage to earth: 300 VAC/DC (CAT II)
The following tables list the maximum ra
terminals and the maximum rated voltage to earth for connection cords. To avoid electric shock and instrument damage,
do not i
nput voltages in excess of these figures.
The lower of the instrument’s and the
imum rated voltage between terminalss applies.
When these voltage levels are excee
be damaged. Do not make measurements as doing so may
result in bodily injury.
The maximum rated voltage to earth doe
you make measurements with an attenuator or other component connected to the input.
Consider your connection method and do not exce
maximum rated voltage to earth.
en terminals: 400 VDC
ted voltage between
connection cord’s max-
ded, the instrument will
s not change, even if
ed the
2
Chapter 2 Measurement Preparations
3
For example, if the instrument is used in combination with
Model L9198, the maximum rated voltage between terminals
is 300 VDC and the maximum rated voltage to earth is 300
VAC (CAT II).
Page 38

30
Measurement
Object
Memory
HiCorder
Logic
Probe
2.3 Connecting Measurement Cables to the Memory HiCorder
Do not connect a cable to the instrument while it is connected
to the object to be measured. Otherwise, an electric shock
accident may occur.
To prevent damage to the instrument and sensor, never connect
or disconnect a sensor while the power is on, or while the sensor
is clamped around a conductor.
Connecting to the logic terminals
T o avoid electric shock and short circuit accidents or damage
to the instrument, pay attention to the following:
• The ground terminal for the
optional logic probe is not
isolated from the Memory
order's ground (chassis
HiC
ground). Therefore, if the
measurement object connect to AC, it should have a
gr
ounded, polarized plug, and be connected to the same
power outlet as the Memory HiCorder’s AC adapter.
If the Memory HiCorder and measurement object are connected to different mains circuits, or if an ungrounded
power c
ferent grounding paths may result in current flo w through a
logic
Memory HiCorder.
• Do not allow the m etal tip of a
between conductors on the measurement object. Never
touch the metal tip of a probe.
• Maximum rated voltage between terminal
follow the indications below.
Do not measure if the Maximum rate
minals would be exceeded, as damage the instrument or
personal
Model 9320-01 Logic Probe: +50 VDC
Model MR9321-01 Logic Probe: 250 Vrms (HIGH range), 150
Vrms (LOW range)
ord is used, the potential difference between the dif-
probe that could damage the measurement object or
logic probe to cause a short
d voltage between ter-
injury may result.
s of logic probe
Page 39

31
Lock
BNC Jack Guide Pins
(on the instrument)
BNC plug slots
Connect to the
measurement object
(Example: Model L9198 Connection Cord)
BNC jack
1
2
Connect the BNC
plug on the Connection
Cord to a BNC jack on
the Memory HiCorder.
Disconnecting BNC connectors
Push the BNC plug, twist it counterclockwise, and pull it out.
Align the slots in the BNC plug with the guide
pins on the jack on the instrument, then push
and twist the plug clockwise until it locks.
(Example: Model 9018-50
Clamp-On Probe)
1
2
Connect the BNC plug on the clamp sensor
to a BNC jack on the Memory HiCorder.
The connection method is the same as described for
other Connection Cables.
OK
Attach the clamp around only one conductor. Single-phase (2-wire) or three-phase
(3-wire) cables clamped together will not
produce any reading.
The arrows on the clamp indicating the direction
of current flow should point toward the load side.
L
O
A
D
S
O
U
R
C
E
Conductor
Current flow
direction
arrow
The scaling function needs to be set according to the
clamp sensor model being used. Refer to "Converting
Units (Scaling function)" (p. 50) for details.
Clamp the sensor around
the measurement object.
BNC jack
2.3 Connecting Measurement Cables to the Memory HiCorder
Connecting Connection Cords (to record voltage waveforms)
Connect an optional Hioki Connection Cord. Use the Hioki Differential Probe
(P9000-01/02, 9322) if the voltage of the measurement object may exceed the
Memory HiCorder’s maximum rated voltage between terminals.
Connecting a Clamp Sensor (to record current waveforms)
2
Chapter 2 Measurement Preparations
3
Connect an optional Hioki clamp sensor. Refer to the instructions pro
clamp sensor for usage instructions.
vided with the
Page 40

32
Connect to the measurement object.
(Example: Model MR9321-01 Logic Probe)
LOGIC jack
1
2
Connect the logic probe by aligning the
groves on the plug and a LOGIC jack.
When a logic probe is not connected, the corresponding
logic waveform appears at HIGH level on the waveform
screen.
2.3 Connecting Measurement Cables to the Memory HiCorder
Connecting the Logic Probe (to record logic signals)
Connect the optional logic probe. Refer to the instruction provided with the probe.
Page 41

33
Strap Hole
2
Feed the strap
through the buckle.
Put the end of the
strap under the retaining loop.
3
Push the strap
through one of the
strap holes on the
instrument.
Repeat the same procedure with the other
end of the strap and
the other strap hole.
1
4
Feed the strap through the buckle so
that it is tight and not twisted.
2.4 Attaching the Carrying Strap
2.4 Attaching the Carrying Strap
Use the strap to avoid dropping the instrument while carrying, or when you
need to hang it on a hook.
Attach both ends of the Strap securely to the instrument. If insecurely attached, the instrument may fall and be damag ed when
carr
ying.
2
Chapter 2 Measurement Preparations
3
Page 42

34
Right Side
Turn the power
switch on ( ).
If the " " indicator is not displayed, the instrument is not being powered
from the AC line. In this state, the battery charge will be depleted if measuring
for a long time, and measurement may be interrupted. Verify that the AC
adapter is securely connected to an AC power source and to the instrument.
See: "Approximate continuous battery-only operating time" (p. 26)
Turning Power On
Turn the power
switch off ( ).
The installed battery pack is charged whenever the AC adapter is plugged into a power outlet, even when the Memory HiCorder is off. In addition, providing there is some remaining
battery charge, waveform data and the setting configuration
are memorized whenever the Memory HiCorder is turned off,
so that when the Memory HiCorder is turned back on, the
same operating state is displayed.
Verify that the instrument and peripheral devices
are correctly connected.
Turning Power Off
Execute zero-adjust 30 minutes after turning power on. (p. 35)
Initial screen
The power supply icon appears
near the bottom right corner of
the screen (p. 17).
2.5 Turning the Power On and Off
2.5 Turning the Power On and Off
Using the AC Adapter
Before turning the instrument on, make sure the supply voltage matches that indicated on its power connector. Connection to an improper supply volt
instrument and present an electrical hazard.
Rated supply voltage is 100 to 240 VAC
(Voltage fluctuations of ±10% from the rated supply voltage
ar
e taken into account.)
Rated supply frequency is 50 or 60 Hz.
age may damage the
Page 43

35
Turn on the power and wait for 30 minutes to stabilize the internal
temperature of the Memory HiCorder.
With the Waveform or Setting screen displayed, press and hold
these keys simultaneously for one second.
The Zero Adjust dialog appears.
From the Setting screen
Select [Zero Adjust].
Apply
1
2
Zero adjustment is executed.
(simultaneously)
2.6 Zero Adjustment
2.6 Zero Adjustment
Zero adjustment corrects for volt age offset at the input terminals, so that Memory HiCorder measurements are relative to zero volts.
Repeat zero adjustment if the ambient temperature changes suddenly.
2
Chapter 2 Measurement Preparations
3
Any zero-adjust setting is cleared upon system reset (p. 103).
Page 44

36
2.6 Zero Adjustment
Page 45

Setting before
Do not use if damage is
present as you could receive an electric shock.
Replace the damaged
items.
Metal Exposed
Is the insulation of the probe or
connection cord to be used damaged, or is bare metal exposed?
When using probes and connection cords
When using a clamp
Is the clamp cracked or damaged?
Yes
1
No Metal
Exposed
2
To
No
2
Peripheral Device Inspection
Before using the instrument the first time, verify that it operates normally to
ensure that the no damage occurred during storage or shipping. If you find any
damage, contact your dealer or Hioki representative.
To
2
If damage is evident,
request repairs.
Yes
Is damage to the instrument
evident?
Instrument Inspection
When turning power on
Does the HIOKI logo appear
on the screen?
No
The power cord may be
damaged, or the instrument may be damaged
internally.
Request repairs.
Is the Waveform or Setting screen
displayed?
(When power is turned on the firs t
time after purchase, the Setting
screen should appear.)
No
The instrument may be
damaged internally.
Request repairs.
Nothing appears, or
the display is abnormal
Yes
Yes
3
To
3
Input signals Inspection
Is “OVER” being displayed on the
Numerical value screen?
Yes
A signal whose magnitude exceeds the maximum rated terminal-to-terminal voltage is being
input. Halt measurement, as this
condition is hazardous.
Inspection complete
No
37
3.1 Pre-Operation Inspection
Measurement
Chapter 3
3.1 Pre-Operation Inspection
3
Chapter 3 Setting before Measurement
3
Page 46

38
The measurement mode can also be changed using the measurement
mode area on the display, located at the top right of screens such as
the Waveform screen (p. 17) and the Setting screen (p. 18).
Connect
Connect measurement cables or a clamp sensor (p. 29).
Memory recorder mode
The instrument records instantaneous signal waveforms. Trigger and
numerical calculation functionality can be used.
RMS recorder mode
The instrument records RMS waveforms for commercial power supply(50Hz,60Hz) and DC signals.
When memory recorder mode has been selected
measurement mode
Selecting the mode from the screen
that is displayed at power-on
Selecting the mode from other screens
When RMS recorder mode has been selected
The rest of this manual uses the memory recorder screen to describe
instrument operation. For more information about RMS recorder mode
settings, see the Measurement Guide (RMS Recorder).
3.2 Operating Flow Overview
3.2 Operating Flow Overview
Page 47

39
Record
Manual configuration (p. 44)
Display the Setting screen
Automatic
configuration (p. 42)
Manual configuration
Configure
Configure input channels (p. 47)
Configure data saving (p. 78)
Analyze
Analyze recorded data on the Waveform screen (p. 63).
Calculations can be applied to measured data (p. 93).
Save
Select and save data (p. 71).
When configuration is finished, start recording
(p. 20).
Reload stored
settings (p. 85)
Specify recording criteria (p. 55)
(to record specific
phenomena)
(to save automatically)
3.2 Operating Flow Overview
3
Chapter 3 Setting before Measurement
3
Page 48

40
Selecting the Timebase (p. 44)
Setting the Recording Length
(divisions) (p. 45)
Selecting Horizontal Display
Magnification (p. 45)
Selecting Logic Channel Waveform Colors
(p. 51)
Setting Logic Channel Waveform Display
Positions (p. 51)
Trigger Settings (p. 61)
Selecting the Voltage Axis
(Vertical Axis) Range (p. 47)
Selecting Waveform Display
Colors (p. 47)
Setting the Zero Position (p. 48)
Selecting the Input Coupling
Method (p. 48) 1
Selecting Vertical Axis
Magnification (p. 49)
Selecting the Low-Pass Filter
(p. 49) 1
Setting Unit Conversion (Scaling)
(p. 50) 1
1. Can be set only from the
[Setting] screen.
Logic Channel Settings
Input Channel Settings
Time Axis (Horizontal Axis) Settings
Selecting the Trigger Mode (p. 46)
Trigger Settings (p. 55)
Setting Recording Criteria
Automatic Setting Configuration (p. 42)
Reloading Settings (p. 85)
Saving Settings (p. 84) 1
Automatic Setting Configuration,
Saving and Reloading
3.2 Operating Flow Overview
Measurement Configuration (Setting Screen)
Before starting measurement, configure settings on the [Setting] screen
according to the desired measurement.
To observe their effects, settings can be made while viewing input waveforms
e waveform monitor window (p. 21).
in th
Previously stored setting configuratio
ns can also be reloaded (p. 85).
Information about the currently highlighted item is display
of the [Setting] screen.
ed along the bottom
Page 49

41
Selecting the Timebase (p. 44)
Setting the Recording Length
(divisions) (p. 45)
Selecting Horizontal Display
Magnification(p. 45)
Waveform Screen
Time Axis (Horizontal Axis) Settings
Selecting the Trigger Mode (p. 46)
Trigger Settings (p. 55)
Selecting the Voltage Axis (Vertical
Axis) Range (p. 47)
Selecting Waveform Display Colors
(p. 47)
Setting the Zero Position (p. 48)
Selecting Vertical Axis Magnification
(p. 49)
Input Channel Settings
Setting Recording Criteria
3.2 Operating Flow Overview
Measurement Configuration (Waveform Screen)
Certain setting items are available on the W aveform screen. Setting details are
the same as for those on the Setting screen.
Changing the range, recording length or trigge
causes any existing measurement data to be erased as measurement restarts
with the new settings (Restart).
r setting while measuring
3
Chapter 3 Setting before Measurement
3
Page 50

42
Select [Auto Range]
Apply
1
2
Press and hold together
for one second
A dialog appears.
Select the Waveform
Screen
(simultaneously)
If the appropriate range cannot be automatically
detected, "Auto Range failed" appears. In this
case, configure the range settings manually
from the Setting screen while watching the
waveform monitor.
Select the [Setting] Screen.
Select [Setup Wizard].
Apply
Apply
1
2
A dialog appears.
Follow the instructions in
the dialog.
Set according to the input
waveform amplitude.
If appropriate settings for the input signal cannot
be determined, select [Next] to display the manual range selection procedure, and follow the procedure to make the settings.
3.3 Automatic Configuration of Measurement Settings (Auto Range)
3.3 Automatic Configuration of Measurement
Settings (Auto Range)
If the appropriate measurement range settings are unknown, Auto Range can
be enabled from the Waveform or Setting screen.
Setting configurations saved to Memory HiCorder memory or to
CF card can be reloaded for later reuse (p. 85).
Auto Range from the Waveform Screen
an installed
Selecting Auto Range on the Setting Screen
Page 51

3.3 Automatic Configuration of Measurement Settings (Auto Range)
Auto Range Settings
Setting Item Settings
Timebase [Timebase] Auto setting value
Zoom (magnification) [Time Mag]
Settings for CH1 and CH2
Voltage-axis range [Rng/div] Auto setup value
Zero position [Pos] Auto setup value
Zoom (magnification) [Mag] x1
Low-pass filter [L.P.F] Off
Input coupling [Coupling]
Trigger Criteria
Trigger mode [Trig Mode] Repeat
Trigger source AND/OR [Source] OR
Pre-Trigger [Pre-Trig] 20%
Trigger [Trig] Level trigger
Slope [Slope] (Rising)
Level (Trigger Level) [Level] Auto setup value
Filter [Filter] Off
Automatically displays 1 to 2.5 cycles on the
Wave
form screen. When both channels are
enabled for waveform display, the waveform
on CH1 determines the timebase setting.
x1
DC
CH1 only. However, if CH1 display is disabled when executing Auto Range from the
Wave
form screen, this setting is applied to
CH2 only. This setting is also applied to CH2
when the difference between maximum and
minimum values of the input signal on CH1 is
two divisions or less.
43
3
Chapter 3 Setting before Measurement
3
When Using External Control Terminals
Executing Auto Range generates a trigger signal on the trigger
output external control terminal. Bear this in mind when using the
trigger output terminal and the Auto Range function.
Page 52

44
Select the [Setting]
Screen.
Move to a setting item.
Apply
Open the setting options
for the item to be set.
Select from the listed
options.
1
2
Waveform monitor
1 division
Select from the [Timebase] setting options.
Setting options:
100, 200, 500 s, 1, 2, 5, 10, 20, 50, 100, 200, 500 ms,
1, 2, 5, 10, 30 s, 1, 2, 5 min [/div]
( default setting)
3.4 Measurement Configuration 1 (Horizontal Axis Settings)
3.4 Measurement Configuration 1
(Horizontal Axis Settings)
Make settings while viewing the Waveform monitor at the left side of the [Setting] screen.
Select a Timebase
Set the amount of time to display per horizontal division.
Sampling rate = timebase (seconds/div)/100 (data samples/
di
vision), so at x1 display magnification, each division contains 100 data samples.
Decreasing the timebase increases the resolution of data
a
vailable for analysis. See "Selecting a Timebase (Horizontal Axis)" (p. 11).
When the duration of 1 div. as shown on the Waveform
scre
en is 50 ms or more, the waveform will be scrolled
automatically as it is displayed during measurement (the
Roll Mode display function).
Page 53

45
20 div
Recording
length
Select from the [Shot] setting options.
Setting options:
20, 50, 100, 200, 500, 1000, 2000, 5000,
10000, 20000 [div], Cont (continuous)
( default setting)
Normal Display
Magnified
Display (x2)
Select from the [Time Mag] setting options.
Setting options:
x10, x5, x2, x1, x1/2, x1/5, x1/10, x1/20, x1/50,
x1/100, x1/200, x1/500, x1/1000
( default setting)
3.4 Measurement Configuration 1 (Horizontal Axis Settings)
Setting Recording Length (no. of divisions)
Set the recording length in units of display divisions.
Recording time = timebase (s/div) x recording
length
(div)
Recording length (Cont) (continuous)
• The [Cont] recording length can be used when the time axis is 50 ms/div or slower.
For example, setting the recording length (Cont) when the time axis is set to 10 ms/div will
automatically set the time axis to 50 ms/div.
• Time values are not indicated during measurements.
• The trigger function (p. 55) and external trigger function (p. 107) are not available.
• The trigger mode (p. 46) is fixed at [Single].
When recording exceeds the maximum recording length (20,000 div), the following will take
ace
pl
• A total of 20000 divisions worth of data remains when recording is stopped.
• Data saved on a CF card during auto save and manual save extends a total of 20000 divisions back from the end of recording.
• The time values indicated in the waveform screen indicates the time at end of recording
0 s, a negative value.
as
3
Chapter 3 Setting before Measurement
3
Setting Display Zoom (as needed)
Select display magnification of the horizontal axis
as needed.
Page 54

46
Select from the [Trig Mode] setting options.
Setting options:( default setting)
Single Records one time and stops.
Repeat Records continuously until you press the
START/STOP key.
3.5 Measurement Configuration 2 (Setting Recording Criteria)
3.5 Measurement Configuration 2
(Setting Recording Criteria)
Setting the Trigger Mode
Select whether to record one recording length per trigger event, or to record continuously ([Repeat]). To specify other recording criteria
required.
See: "Chapter 4 Making Trigger Settings" (p. 55)
, additional trigger settings are
When the trigger mode is set to [Rep
processing (auto save, waveform display processing and calculation) before going to the
next trigger standby status. Therefore, events that meet the trigger criteria during this processing period are not recognized as trigger events.
Recording length [Cont], the trigger mode is fixed at [Single].
eat], triggering is disabled during the end of recording
Page 55

47
Select the [Setting] Screen.
Move to a setting item.
Apply
Open the setting options
for the item to be set.
Select from the listed
options.
1
2
1 div
Select from the [Rng/div] setting options.
Setting options:
10, 20, 50, 100, 200, 500 mV,
1, 2, 5, 10, 20, 50 V [/div]
( default setting)
Measurable effective range is up to ±10 times of the voltage axis range (For 50 V/div,
the maximum rated voltage between terminals is up to 400 V DC).
Select from the waveform display color setting
options.
Setting options:
OFF ( x ), Red (* CH1), Green (* CH2),
Blue, Yellow, Pink, Light Blue
( default setting)
3.6 Measurement Configuration 3 (Analog Channel Settings)
3.6 Measurement Configuration 3
(Analog Channel Settings)
Configure the analog input channels (CH1 and CH2) from the [Setting] screen.
Setting the Voltage Axis (Vertical Axis) Range
Select the voltage amplitude (voltage axis range) per vertical division for each input channel.
3
Chapter 3 Setting before Measurement
3
If the input signal exceeds the measurable range for the selected
measurement range, the measured value will be shown as [OVER].
Selecting Waveform Display Color (as needed)
Different display colors can be selected for each input channel waveform.
Page 56

48
Normal
Waveform(50%)
Changed Zero
Position(25%)
0 V
100%
0%
50%
0 V
25%
Select from the [Pos] setting options.
Setting options:- 50 to 150%
(in 1% steps, when the [Mag] setting is x1),
(default setting: 50%),
Magnification and compression (p. 49) in the voltage axis direction is based on the zero
position.
Although the range of voltage that can be displayed on the Waveform screen depends
on the zero position and magnification/compression of the voltage axis, the measurement range is unaffected.
0V
Zero Position: 0%
50%
100%
(Magnification: x1)
Measurement
range
Display range
0%
50%
100%
50%
100%
0%
0%
100%
50%
The valid setting range depends on display magnification.
With x10 magnification (maximum setting range), -950 to 1050%
Select from the [Coupling] setting options.
Setting options:( default setting)
DC
DC Coupling
Select this to acquire both DC and AC
components of an input signal.
GND The input signal is disconnected.
Zero position can be confirmed.
3.6 Measurement Configuration 3 (Analog Channel Settings)
Setting the Zero Position (as needed)
The vertical display position of each waveform
can be changed.
Set the waveform zero position (in this example, zero volts) for display on the vertical axis.
Selecting the Input Coupling Method (as needed)
Select the coupling method for input signals.
Page 57

3.6 Measurement Configuration 3 (Analog Channel Settings)
Normal Display
Zoomed Display
(x2)
Select from the [Mag] setting options.
Setting options: x10, x5, x2, x1, x1/2, x1/5
( default setting)
Normal Display
OFF)
Cut-Off Frequency
Selected
Select from the [L.P.F] setting options.
Setting options: OFF, 5Hz, 50Hz, 500Hz, 5kHz
( default setting)
Zooming the Vertical Axis (as needed)
Display magnification of the vertical (voltage)
axis can be selected for each input waveform.
ification is applied relative to the wave-
Magn
form’s zero position.
Selecting a Low-Pass Filter (L.P.F.) (as needed)
To suppress high-frequency components, select
a low-pass filter.
49
3
Chapter 3 Setting before Measurement
3
Page 58

50
Normal Display
(OFF)
Scaling Enabled
A
mV
Select from the [Scaling] setting options.
Setting options: OFF, Model, Ratio, 2-Point
( default setting)
A dialog appears when selected.
Ratio
Select the output ratio (conversion ratio) of the
clamp sensor, or the attenuating ratio of the attenuating probe.
2-Point
Set the voltage values of two points of the input
signal, the converted unit value of these two
points and the name of the converted measurement units, so measurement values acquired as
voltage are converted to the specified units.
Example:
Voltage value at 2
points
Voltage of units to convert
V
H
: High value AH: Converted high value
V
L
: Low value AL: Converted low value
Model
Select your clamp sensor and attenuating probe
model from the Model list.
Setting options:
3283, 3284, 3285, 9010-50, 9018-50, 9132-50,
9657-10, 9675, CT9691, CT9692, CT9693,
CT9667, 9322, P9000, 9660, 9661, 9669,
9694, 9695-02, 9695-03, CT6500,
CT7044/CT7045/CT7046, CT7631/CT7731,
CT7636/CT7736, CT7642/CT7742
A
H
A
L
VLV
H
[A]
[V]
Conversion ratio and
offset value are calculated from the two
points and converted
Actual measurement
values
Converted unit
values
Valid setting ranges for conversion ratio and offset are as follows.
Note that the conversion ratio cannot be set to zero.
-9.9999E+9 (conversion ratio, offset) -1.0000E-9
(offset) = 0
+1.0000E-9 (conversion ratio, offset) +9.9999E+9
Values outside the above range cannot be set.
Scaled values (and cursor values when using the A/B cursors) can
be verified in the waveform screen.
Y
A
HAL
–
V
HVL
–
-------------------
X
V
HAL
VLAH–
V
HVL
–
---------------------------------------------+=
Conversion Ratio Offset
X: Voltage value
Y: Converted value
*When using Model CT969x series in combination with
Model CT6590, execute zero adjustment.(p. A18)
3.6 Measurement Configuration 3 (Analog Channel Settings)
Converting Units (Scaling function)
Input voltage values can be converted to physical units for display, such as by converting voltage to current. Preset scaling settings are
d for current measurement with the
provide
optional clamp sensor models.
Page 59

3.7 Measurement Configuration 4 (Logic Channel Settings)
Select the [Setting]
Screen.
Move to a setting item.
Apply
Open the setting options
for the item to be set.
Select from the listed
options.
1
2
Select from the waveform display color setting
options.
Setting options:
OFF*, Red, Green, Blue, Yellow, Pink, Light Blue
( default setting)
Position1
2
3
4
Select from the [Pos] setting options.
Setting options: Pos1, Pos2, Pos3, Pos4
( default setting)
3.7 Measurement Configuration 4
(Logic Channel Settings)
Configure the input channels when measuring with a logic probe.
To use logic signals as a trigger source:
See: "4.3 Logic Channel Trigger Settings" (p. 61)
51
3
Chapter 3 Setting before Measurement
3
Setting Logic Channel Display Colors (as needed)
You can select a display color for each logic channel waveform
Setting Logic Channel Display Positions
You can select the display position of each logic
waveform. Waveform overlap on the display
n be minimized when recording simulta-
ca
neously with an analog waveform.
Page 60

52
Select the [Comment]
Screen.
Select the field in which to
enter the comment
1
2
Apply
The character entry screen
appears.
3
Select the characters to
enter
To enter a space, select a
blank character.
Apply
Characters appear in the entry field as you select them.
Navigate the entry field
Select [OK]
Accepts your entry and returns to the
[Comment] screen.
Finished with entry
Entry field
3.8 Entering Comments
3.8 Entering Comments
Comments of up to 40 characters can be entered as a title for the me asurement
data, and as a label for each input waveform.
The comments can be displayed when the data is viewed in an application program
on a
computer.
The following characters are converted as follows when saved to a text file.
Entered character
Converted plain
text equivalent
^2 ^3 ^u ~o ~c ~e
Page 61

Operating Panel
Only the keys displayed on the operating panel are enabled.
• List (WAVE/DATA key)
Measurement related terms are registered in the list
beforehand.
• Hist (History, SET key)
You can select previously entered terms from the pick list.
• Char Input ( key)
Switches between the pick list and character selection
frames.
• / (Cursor up/down key)
Selects from the pick list frame.
• Select (ENTER key)
Accepts the item selected in the pick list.
• Cancel (ESC key)
Cancels entry.
• <</ >> (SCROLL/CURSOR left/right key)
Move input position.
• BS (SCROLL/CURSOR middle key)
Deletes one character.
• OK (START/STOP key)
Accepts entry.
The operating panel depicts
the functions of Memory HiCorder's operating keys.
53
3.8 Entering Comments
3
Chapter 3 Setting before Measurement
3
Page 62

54
3.8 Entering Comments
Page 63

Making Trigger
Trigger criteria met
T
T
T
Move to a setting item.
Apply
Open the setting options for the item to be
set.
Select from the listed
options.
1
2
Select the [Setting]
Screen.
55
4.1 Setting Recording Criteria
Settings
Triggering is the process of controlling the start and stop of
recording by specific signals or conditions (criteria). When
rec
ording is started or stopped by a specific signal, we say
the trigger is "applied" or "triggering occurs".
In this manual, indicates a "trigger poi
which a trigger is applied.
The trigger function cannot be used in RMS recorder mode.
Signals that can be used for triggering (trigger sources) are as follows.
Trigger Source Description Ref.
Analog Trigger
Logic Trigger
External Trigger
Manual Trigger Applies a trigger by pressing . (p. 62)
A trigger can be applied by combining (AND/OR) criteria from multiple trigger sources (except
manual triggering). When the r ecor din g leng th is [Con t], th e tri gger func tion is no t avai la ble.
Applies a trigger according to a signal input on an analog
ch
annel. (Level, In-Window, Out-of-Window, or Voltage
Sag trigger)
Applies a trigger according to signals input on logic chan-
nels (Ch A to Ch D).
Applies a trigger according to an input signal at the
EXT.TRIG ter
minal (External Trigger Input)
Chapter 4
nt", as the time at
(p. 57)
(p. 61)
(p. 105)
4.1 Setting Recording Criteria
3
4
Chapter 4 Making Trigger Settings
Make these settings when selecting the type of triggering to be applied to input
channel (CH1 or CH2) recording.
Page 64

56
Select from the [Source] setting options.
Setting options:( default setting)
OR
Triggering occurs when any one of the specified trigger source criteria is met.
AND Triggering occurs only when all of the speci-
fied trigger source criteria are met.
[AND]
One waveform has crossed above 0V
as the other crosses on the upslope
[OR]
Either waveform crosses 0V on
the upslope
T
Trigger.......Level
Filter..............Off
Level .............0 V
Slope
To apply a trigger when the upslope () of the waveform crosses zero volts
When the trigger combining logic is set to [AND]
If trigger criteria are already met when you press the START/STOP key, no triggering occurs. Triggering occurs only after all trigger sources have ceased to meet the criteria at
once, and are subsequently met again.
T T T
Start
Measurement
Start
Measurement
When the recording length is [Cont], the trigger source setting is disabled.
80%
20%
T
Select from the [Pre-Trig] setting options.
Setting options:
0, 5, 10, 20, 30, 40, 50, 60, 70, 80, 90, 95, 100%
( default setting)
Difference between [Waiting for pre-trigger] and [Waiting for trigger]
When measurement is started, the specified pre-trigger length is recorded. This period is
indicated as the [Waiting for pre-trigger].
After the specified pre-trigger length has been recorded, the period indicated as [Waiting
for trigger] continues until a trigger occurs.
During the [Waiting for pre-trigger] period, trigger events are not recognized even when
the trigger criteria are met.
When the recording length is [Cont], the pre-trigger setting is disabled.
4.1 Setting Recording Criteria
Setting Combining Logic (AND/OR) for Multiple Trigger Sources
Analog, logic, and external trigger criteria can be combined by AND/OR logic to
define complex trigger criteria.
Setting the Trigger Start Point (Pre-Trigger)
Make this setting to specify a portion of the waveform to
be recorded prior to a trigger event, as a percentage of the
o
verall specified recording length.
Page 65

57
Select the [Setting] Screen.
Move to a setting item.
Apply
Open the setting options
for the item to be set.
Select from the listed
options.
1
2
Displays the Waveform screen.
Select [ ].
T
Apply
1
2
Trigger setting items are displayed.
Set the trigger level, slope, trigger
filter and frequency.
To return to the channel setting
display , select [ ] again, and
press the ENTER key.
Channel setting
display
Trigger setting
display
4.2 Triggering by Analog Signals
4.2 Triggering by Analog Signals
Make this setting to define trigger criteria according to input signal cha racteristics on CH1 or CH2.
Settings can also be made on the Waveform screen.
3
4
Chapter 4 Making Trigger Settings
Page 66

58
Select from the [Trig] setting options.
Setting options: OFF, Level, In, Out, Drop
( default setting)
Trigger Level
Input
Trigger Slope
[ ]
[ ]
T T
T
T
Upper
Threshold
Lower
Threshold
Upper
Threshold
Lower
Threshold
TT
1/2 Period
Trigger Level
T
Apply a trigger when the input signal
exceeds 200 mV
Trigger............... Level (Level Trigger)
Level..................200 mV
Slope (rising)
Apply a trigger when the input signal
is outside of the range ±1 V
Trigger............... Out (Out-Window
Trigger)
Upper................. 1 V
Lower................. -1 V
Apply a trigger if a 50-Hz mains
frequency input signal, nominally
about 220 Vrms (311.1 Vpeak), drops
below 198 Vrms (280.1 Vpeak)
Trigger................ Drop
Level................... 280 V
Freq.................... 50 Hz
4.2 Triggering by Analog Signals
Selecting an Analog Trigger Type
Select the appropriate trigger type. Setting options differ by trigger type.
Type of Analog
Trigger
Trigger Example Description
Level Trigger
[Level]
In-Window
Trigger
[In]
Out-of-Window Trigger
[Out]
Voltage dip
Trigger
[Drop]
Setting Example
A trigger is applied when an input signal
crosses the specified trigger level
(threshold voltage).
A trigger is applied when the input signal
enters a range defined by upper and lower thresholds.
A trigger is applied when the input signal
exits a range defined by upper and lower
thresholds.
A trigger is applied when the amplitude of
the input signal (at commercial mains frequency) dips below the specified trigger
leve
l.
Page 67

4.2 Triggering by Analog Signals
Noise
Filter Width
T
Select from the [Filter] setting options.
Setting options: OFF, 10, 20, 50, 100S
( default setting)
TT
Select from the [Slope] setting options.
Setting options: ( default setting)
A trigger occurs when the signal crosses the
threshold on the upslope (rising edge).
A trigger occurs when the signal crosses the
threshold on the downslope (falling edge ).
T
Select from the [Level] setting options.
Setting options: One twentieth of the voltage range
[Rng/div] (Default setting: Zero volts for Level Trigger
mode, and one division above the zero position for
Voltage Sag trigger mode.)
Selecting a Trigger Filter
Sets the filter width (trigger filter) for triggering. Suppresses triggering from noise.
The filter width setting is defined according to the number
of
samples* of acquired data.
* Number of samples: 1 division = 100 samples (with x1 display
magnification)
Selecting Rising or Falling (Slope) of the Input Signal
Set the slope (rising () or falling () edge) of the input signal on which to trigger.
59
3
4
Chapter 4 Making Trigger Settings
Setting the Signal Threshold Level (Trigger Level)
Set the signal threshold level (volt
triggering is to occur. The trig
instantaneous value (not RMS). The setting value can be
verified in the waveform monitor or on the Waveform
screen. When scaling is enabled, the scaled trigger level
value can be verified in the waveform monitor.
age value) at which the
ger level setting value is an
Page 68

60
Select from the [Lower]/[Upper] setting options.
Setting options: One twentieth of the voltage range
[Rng/div] (Default setting: One division below the lower limit zero position, and one division above the upper limit zero position.)
Select from the [Freq] setting options.
Setting options: 50Hz, 60Hz ( default setting)
4.2 Triggering by Analog Signals
Setting Lower and Upper Trigger Thresholds
Set the upper and lower thresholds for a trigger window. Upper and lower thresholds
can be verified in the waveform monitor or on the Waveform screen. When scaling is
enabled, the scaled threshold values are displayed.
Selecting Measurement Frequency
Select the frequency of the commercial mains power to be measured.
Page 69

4.3 Logic Channel Trigger Settings
Select the [Setting] Screen.
Move to a setting item.
Apply
Open the setting options
for the item to be set.
Select from the listed
options.
1
2
Select from the [Trig] setting options.
Setting options:( default setting)
OFF
Logic triggering is disabled.
OR Triggering occurs when input signal logic
matches any setting in the trigger pattern.
AND Triggering occurs only when input signal logic
matches all settings in the trigger pattern.
Trigger pattern
1
0
X
X
T
[OR]
1
0
X
X
[AND]
T
When the trigger combining logic is set
to [AND]
If trigger criteria are already met when starting measurement, no triggering occurs.
Instead, triggering occurs once as soon as
the criteria are no longer met, and again
when the criteria are subsequently met.
4.3 Logic Channel Trigger Settings
Make these settings to utilize logic channel input signals for triggering.
A trigger event occurs when the logic signal p
ical AND/OR trigger criteria. You can enable a trigg
mum interval (the filter width) during which trigge
triggering occurs.
attern matches the specified log-
er filter to specify a mini-
r criteria must be met before
61
3
4
Chapter 4 Making Trigger Settings
Configuring Logical (AND/OR) Trigger Criteria
Specify a logical pattern of logic inputs to serve as trigger criteria.
Page 70

62
1
0
HIGH
LOW
Select from the [Pattern] setting options.
Setting options:( default setting)
X Ignore signal
0 Triggering occurs when the signal transitions
from HIGH to LOW.
1 Triggering occurs when the signal transitions
from LOW to HIGH.
Noise
Filter width
T
Select from the [Filter] setting options.
Setting options: OFF, 10, 20, 50, 100 S
( default setting)
4.4 Triggering Manually (Manual Trigger)
Setting a Trigger Pattern
Specify the state of each input signal required for triggering.
Setting a Trigger Filter
To enable trigger filtering, just specify a
filter). The filter can prevent f
The filter width setting is defin
of samples* of acquired data.
* Number of samples: 1 division = 100 samples (w ith x1
di
splay magnification)
filter width (trigger
alse triggering due to noise.
ed according to the number
4.4 Triggering Manually (Manual Trigger)
Triggers can be applied manually. Manual triggering takes priority over all
other trigger sources, regardless of settings.
At any time after starting measurement (by pressing the START/ST OP key), you can
press the key to apply a manual trigger. However
when the input channel trigger setting is OFF
ing measurement, the [Waiting for trigger] mod
be generated by pressing the
key.
. After setting trigger criteria and start-
, manual triggering is disabled
e is active, during which a trigger can
Page 71

5.1 Viewing Waveforms
Logic
waveforms
Analog
waveforms
Displays acquired
data as waveforms.
A/B Cursor Values
(when A/B cursors are displayed)
Shows the values at cursor locations
on the waveform (p. 66).
This can be switched to show numerical
calculation results (p. 93).
Time
Values
Trigger Mark ( )
The trigger mark appears at the point
where a trigger is applied.
T
Scroll Bar
Shows the range and position of
the displayed waveform.
Viewing the Scroll bar (p. 64)
Displays a gauge (p. 66)
Measurement
Configuration
You can change
these settings (p. 41).
Analog Trigger
Settings (p. 55)
Jump Function (p. 65)
Trace Display (p. 64)
Select the Waveform
Screen.
Move to a setting item
Apply
Open the setting options
for the item to be set.
Select from the listed
options.
1
2
Waveform
Analysis Chapter 5
5.1 Viewing Waveforms
Waveform Screen
63
3
5
Chapter 5 Waveform Analysis
Page 72

64
Screen Display
Earlier
Later
Time Axis Magnification x1
x2
x1/2
When Recording Length is
200 div
Screen Display Range (20 div)
Scroll bar
Whole Waveform (200 div)
Even for identical recording
lengths, the width of the
screen display range indication in the scroll bar depends
on the specified magnification/compression of the time
axis.
Select from the [x1](display magnification) setting options.
Setting options:
x10, x5, x2, x1, x1/2, x1/5, x1/10, x1/20, x1/50, x1/100,
x1/200, x1/500, x1/1000 ( default setting)
5.1 Viewing Waveforms
Scrolling Waveforms
When measuring or displaying an existing waveform, use
the SCROLL/CURSOR keys to scroll.
During Roll Mode display,* manually scrolling
terminates the Roll Mode, so you can freely view any part
of the measured waveform.
To return to Roll Mode, move the cursor to [T
the bottom right corner of the display, and press the
ENTER key. Alternatively, just scroll to the right end of the
waveform to resume Roll Mode.
out the Roll Mode display:
* Ab
When each div shown on the Waveform screen is at least
50 ms, the
part of the waveform is always displayed.
To jump to the start or end of a waveform (or between trigger events), hold the ESC key while pressing the right or
lef
t SCROLL/CURSOR key.
Verifying Waveform Display Position
From the scroll bar you can verify the relative position and
size of the displayed portion of a waveform within the overall recorded waveform. Trigger
A/B cursor positions (when using vertical or trace cursors)
are also displayed.
screen scrolls automatically so that the newest
a waveform
race] near
time, trigger position and
Magnifying and Compressing Horizontally (Time Axis)
Data details can be observed by magnifying the waveform
along the time axis. Also, by compressing the time axis,
verall waveform fluctuations can be readily seen. Time axis
o
magnification can be changed while measuring, and when
the A/B cursors are displayed, magnification can be set
according to cursor position (but only when finished measuring). Memory recorder mode from the magnification, RMS
er mode Select from the settings of the time axis.
record
Page 73

Select [Jump].
Apply
1
2
The location of the currently displayed portion
of the overall waveform is
indicated by the mark
on the scroll bar.
3
Move the mark to
display a different portion of the waveform.
The portion of the waveform at the mark is
displayed.
Apply
Select the Waveform
Screen.
4
65
5.1 Viewing Waveforms
Viewing Any Waveform Location (Jump Function)
When the recording length of a waveform is long, you can
specify the portion to be displayed immediately.
3
5
Chapter 5 Waveform Analysis
Page 74

66
A
B
Changing Cursor Type
Cursor Values
[Motion]
A Cur
B Cur
AB Cur
( default setting)
1
Displays the A/B cursors and the
values at the cursor positions.
To hide the cursor items again,
press the SCROLL/CURSOR key.
2
Move the cursors to display numerical values along the waveform.
Hold the ESC key to move by whole
divisions.
To select which cursor(s) to move
Select from the [Motion] setting options.
To select the type of cursor values to
display
Select from the [Type] setting options.
[Type]
Trace
Vert (Vertical)
Horz (Horizontal)
( default setting)
Cursor A Cursor B
The current [Motion] selection can be
changed directly, by holding the ESC
key while pressing the central
SCROLL/CURSOR key.
5.2 Viewing Measurement Values
5.2 Viewing Measurement Values
Displaying Gauges
Press the GAUGE key to display gauges at the left side of
the screen corresponding to the measurement range of
e
ach channel. Measurement values can be confirmed on
the gauges. The color of each gauge matches the color of
its waveform.
Press the GAUGE key again to hide the gauges.
Displaying Cursor Values
Time difference, frequency and potential difference (and
when scaling is enabled, scaling values) can be read as
n
umerical values using the A/B cursors.
See "About Cursor Values" (p. 67)
Page 75

About Cursor Values
Trace Cursor case
A Cursor value B Cursor value B-A value
AB
B-A
B-A
AB
B-A
A
B
B-A
Cursor Type Example Cursor Value
Trace
Cursors
Displays the time and measurement values at the A/B
cursors, or the time and measurement differences between the A/B cursors.
Displays the intersections (trace points) of cursors and
wa
veforms. (the intersections of waveform traces of se-
lected channels)
(Time and Measurement Values)
Time Values
A Cursor value, B Cursor value: Time from trigger point
o
r recording start
B-A value: Time difference between A/B cursors
Measurement Values
A Cursor value, B Cursor value: Measurement value
B-A value: Difference between measured values at A/B
cursors
67
5.2 Viewing Measurement Values
3
5
Chapter 5 Waveform Analysis
Vertical
Cursors
Horizontal
Cursors
Displays the time and frequency values at the A/B cursors, or the time and frequency differences between the
A/B cursor
(Time Value and Frequency)
Time Values (t): Time from trigger point or recording
st
art
Frequency (f): Frequency having period t
B–A value: Time difference between A/B cursors
Displays the measurement values at the A and B cursors for the selected channel(s), or the difference between A/B cursor values.
(Measurement Values)
A Cursor value, B Cursor value: Measured value of
ch
annel
B–A value: Difference between values at A/B cursors
s.
Page 76

68
1
The A/B cursors and cursor values
are displayed.
3
Move the A/B cursors to specify the time span.
Select [Motion].
2
Apply
Open the setting options
for the item to be set.
Select which cursor(s)
to move.
[Motion]
A Cur
B Cur
AB Cur
5.2 Viewing Measurement Values
Specifying a Waveform Time Span
Specify a waveform time span when saving a partial waveform or applying numerical
calculations (Trace cursors or Vertical cursors).
Page 77

69
CH1 Numerical
Value
CH2 Numerical
Value
RMS display mode indicator
(Indicates the current mode: RMS or instantaneous (P-P))
Display Hold
The displayed value is held constant.
Normal Display
Scaling Indicators
Gauge
Maximum count is
5500
Instantaneous
logic values
(: 0, : 1)
Scaling Unit
Indicators
Appears only when
scaling is enabled
for that channel
(p. 50).
Units displayed after conversion by
scaling settings
These depict operating key functions
Select the Numerical Screen.
1
2
Switching between instantaneous and
RMS values
Holding and releasing display
values
Toggles only CH1
Press these keys to toggle the
selection
Toggles both CH1 and CH2
Toggles only CH2
Press these keys to toggle the selection
3
5.2 Viewing Measurement Values
Viewing Input Signals as Numerical Values (Numerical Value Display Function)
AC voltage measured at commercial mains frequencies (50/60 Hz) or DC voltage
can be displayed as a numerical value. Either instantaneous or RMS numerical
value can be displayed.
Instantaneous value: the input voltage
RMS value: the root-mean-square of the
Note that the RMS value is only displayed correctly for commercial mains frequencies (50/60 Hz) and DC signals.
If the input voltage peak value exceeds 450 V, “OVER” will be shown.
actual input voltage (p. 97)
3
5
Chapter 5 Waveform Analysis
Page 78

70
5.2 Viewing Measurement Values
Display when the input voltage peak value exceeds 450V
Page 79

Saving &
71
6.1 About Saving and Loading Data
Loading Data
Chapter 6
Measurement data acquired by the Memory HiCorder can be saved to a CF
card.
See: "6.2 Using a CF Card" (p. 74)
*To load data saved by the MR8870-20 in memory recorder mode with the
8870-20, upgrade the 8870-20 to firmware version 2.00 or later.
See: "Appendix 9 To 8870-20 Users (Firmware Ver. 1.08 or Earlier)" (p. A19)
Methods available for saving data consist of Auto Save, for saving data automatically while measuring; and Select & Save and Quick Save for saving data
a
fter measurement is finished. Refer to "6.3 Saving Data" (p. 77) for details.
6.1 About Saving and Loading Data
When saving data, a folder named
in the folder as follows. Up to 1,000 files can be saved in one folder.
File Type
Settings Data Binary CONFIG
Settings List Binary CONFIG
Waveform
Data*1
Numerical Calculation Results
Captured
Screen Image
*1.To reload data into the instrument or load it into the Wave Processor program:
Save it in binary format. Waveforms and some of the measurement settings are saved.
To save a waveform partially, specify a period by using A/B cursors (p. 68).
*2.BMP Format: This is a standard Windows graphics format. These files can be handled by
ma
ny graphics programs.
*3.When using auto-save functionality, a folder named AUTOhhmmss is created under a
folder named with the date of saving (based on the trigger time), where hhmmss is the
measurement start time.
(Example: The file AUTO131031 is created at the time 13:10:31)
File
Format
Binary
Text
Text
BMP *2
Folder
Name
Date of
saving
(e.g. 14-0330
)
*3,*5,*6
[HIOKI8870] is created, and files are stored
O = Available, X = Not available
File Name
(Auto-numbered from 1)
CONFIG0001.SET*7
CONFIG0001.SRM*8
LIST0001.BDL X O O X
WAVE0001.MEM*7
WAVE0001.RMS*8
WAVE0001.CSV
MEAS0001.CSV
SCR0001.BMP*4
Save
Manu-
Auto
al
X O O X
O O O O
O O X O
O O X O
O O O O
Load
PCRea
able
d-
3
6
Chapter 6 Saving & Loading Data
Page 80

72
6.1 About Saving and Loading Data
*4.Also when auto-saving, screen images are saved in the file named [WAVE0001.BMP].
*5.When the retrieved waveform is re-saved as waveform or display image data, it is saved
*6.When delete-and-save has been selected, a folder named
*7.This filename is used when saving data in memory recorder mode.
*8.This filename is used when saving data in RMS recorder mode.
See: "Appendix 2 File Naming" (p. A5)
r the date (year/month/date) folder (based on the trigger time) where the retrieved
unde
waveform file is saved.
[AUTO_D] will be created in-
side the HIOKI8870 folder, and all data for which auto-save has been enabled will be
saved
in that folder. All data saved in this folder is targeted by delete-and-save ope ration
(i.e., potentially subject to deletion).
Setting data (.SRM) and waveform data (.RMS) saved in RMS
recorder mode cannot be loaded in memory recorder mode. To
load these files, first switch the instrument to RMS recorder mode
from any screen.(p. 38)
Page 81

6.1 About Saving and Loading Data
HIOKI8870
WAVE0003.MEM
(Settings data folder)
CONFIG
(Folder for all data
other than settings)
14-03-30 (Date)
14-04-01
Up to 1000 files
(Automatically saved folder
including its creation time)
CONFIG0001.SET
CONFIG0002.SET
WAVE0001.MEM
AUTO131031
WAVE0002.MEM
LIST0001.BDL
LIST0002.BDL
AUTO_D
14-04-012
WAVE0004.MEM
Up to 1000 files
(Folder targeted for delete-and-save operation)
Files are saved in this folder when both auto-save
operation and delete-and-save operation are enabled (excluding numerical calculation results
files). Once the CF card becomes full, the files
here will be deleted in the order of their creation,
starting with the oldest file.
Directory Structure for Saved Data
Model MR8870-20 waveform data size list (Memory recorder mode)
73
3
6
Chapter 6 Saving & Loading Data
Recording
length(div)
20 12.8 KB 82.5 KB
50 27.4 KB 205.6 KB
100 51.8 KB 410.6 KB
200 100.7 KB 820.8 KB
500 247.1 KB 2.0 MB
1,000 491.3 KB 4.0 MB
2,000 979.6 KB 8.0 MB
5,000 2.4 MB 20.0 MB
10,000 4.8 MB 40.1 MB
20,000 9.5 MB 80.1 MB
In binary saving, all channels will be saved, regardless of whether the displa y is ON
Binary Text
or OFF.
When saving as text, only the channel that is disp
The save column in the chart above is an example of the case of displaying and saving all channels.
For example, when using the 9729 PC Card (1GB), a
record length 20,000div files can be saved.
layed will be saved.
pproximately 100 binary data of
Page 82

74
Hioki options PC cards
(includes adapter)
• Model 9726 PC Card 128M
(*End of sale)
• Model 9727 PC Card 256M
(*End of sale)
• Model 9728 PC Card 512M
• Model 9729 PC Card 1G
• Model 9830 PC Card 2G
Important
Use only CF cards sold by Hioki.
Compatibility and performance are not guaranteed for CF cards made by other manufacturers. You may be unable to read from or save
data to such cards.
This Memory HiCorder does not require a CF (CompactFlash) adapter.
See "6.5 Data Management" (p. 88) for details about managing data storage in the card.
6.2 Using a CF Card
6.2 Using a CF Card
The following options are available for saving and loading measurement data
with the Memory HiCorder.
• Format new CF cards before use.
To format with this instrument: (p. 76)
• Inserting a CF card upside down, backwards or in the wrong
dire
ction may damage the CF card or instrument.
• Never eject a CF card while it
ment. Data on the CF card could be lost.
• During battery-only operation, data may fail to be stored properly
if bat
tery charge is exhausted while saving. In the worst case,
the CF card could be damaged, so pay appropriate attention to
the discharge state of the battery pack.
• If the Eject button is in the released position, press it in first
before inserting the CF card all the way in. Inserting the CF card
when the Eject button is released may damage the instrument. If
the CF card does not go all the way in, do not force it in. Press
the Eject button once to release it, then press it ag ain and insert
the CF card all the way in.
• As the CF card is sensitive to static electricity, damage to the CF
or wrong operations by the this instrument may occur due to
card
static electricity. Please be careful when handling it.
is being accessed by the instru-
• The Flash memory in a CF card has a limited operating life. After
long-term usage, data storage and retrieval become difficult. In
this case, replace the CF card with a new one.
• We cannot provide compensation for data loss in a CF card,
regardless of content or cause of the damage. Always maintain a
backup of important data stored on a CF card.
Page 83

CF Card Insertion & Removal
Eject Button
Inserting a CF card
1 Open the CF card slot cover.
2 Press the Eject button in if it is in the
released position.
3 Face the CF card with the arrow mark
() on top, and insert it in the direction of the arrow all the way in the slot.
Removing a CF card
1 Open the CF card slot cover.
2 Press the Eject button (to release it).
3 Press the Eject button again and pull
the card out.
Cover
Top View
75
6.2 Using a CF Card
3
6
Chapter 6 Saving & Loading Data
Page 84

76
Select the File Screen.
Select [Format].
Apply
Apply
1
2
The Format Confirmation
dialog appears.
Select [Yes].
Open the Control Dialog
box
Apply
The Format Confirmation
dialog appears again.
Select [Yes].
6.2 Using a CF Card
Formatting a CF Card
CF Cards are formatted from the Memory HiCorder’s File screen.
Formatting irretrievably erases all data on the CF card. Always
backup important data from the CF card before formatting.
Page 85

6.3 Saving Data
Press the SAVE key to
save the data previously
specified on the System
screen. This is convenient
for saving certain types of
data, or when you want to
save immediately while
monitoring (p. 80).
(Default setting)
Press the SAVE key to select and save the selected
contents.
No settings are needed before saving this way (p. 80).
Automatically saves all acquired measurement data
for the specified recording
length. Various types of
data can be saved at the
same time. Select the save
contents before measuring
(p. 78).
To save automatically
while measuring
To save immediately
upon pressing the SAVE
key
To save selected
contents
Auto Save Quick Save Select & Save
Insert a CF card.
Set the Auto Save setting
[ON].
Select what to save.
Enable delete-and-save
operation (as needed).
Measurement
Saving proceeds
automatically
Calc/Save Screen
The following can be
saved simultaneously:
• Waveform Data
• Numerical Calculation
Results
• Screen Image
Insert a CF card.
Set the function of the
SAVE key to
[Quick Save].
Select what to save*.
Press the SAVE key*.
Save
System Screen
• Waveform Data
• Numerical Calculation
Results
• Screen Image
Insert a CF card.
Set the function of the
SAVE key to
[Select & Save].
Press the SAVE key.
Select what to save
Press the ENTER key.
Save
System Screen
Save Dialog
• Waveform Data
• Numerical Calculation
Results
• Screen Image
: To save a waveform partially, specify a period by using
A/B cursors. (Saving a waveform section is not available
with Auto Save)
To save a screen image, display the desired screen before saving.
Basically, three methods are available for saving.
77
6.3 Saving Data
3
6
Chapter 6 Saving & Loading Data
Page 86

78
Move to a setting item.
Apply
Open the setting options
for the item to be set.
Select from the listed
options.
1
2
Select the [Calc/Save]
Screen.
Set [Waveform] to [ON].
From the [Format] options, select the data saving format.
Binary Select this format to be able to reload
the saved data into the instrument, or so
that it can be loaded into the Wave Processor program.
Text Select this format to save the data as a
text file.
(When [Text] format is selected)
From the [Thinning] options, select the amount
of data thinning desired.
1/2, 1/5, 1/10, 1/20, 1/50, 1/100, 1/200,
1/500, 1/1000, OFF(* default setting)
1/2: Saves every other data point
( x x x)
1/5: 5Saves one of every five data points
(xxxxxxxxxxxx)
To Save Waveform Data
Saving Screen Image s
Set [Screen Image] to [ON].
[Format]
BMP (fixed)
This is selected automatically
when setting [Screen Image] to
[ON].
To Save Numerical Calculation
Results
Set [Calc Results] to [ON].
Numerical calculation settings
are necessary (p. 93).
After making any other necessary settings, press the START/STOP key.
Data is automatically saved to the CF card when measurement finishes.
"Directory Structure for Saved Data" (p. 73)
Set [Auto Save] to [ON], and select the item(s) to save.
3
6.3 Saving Data
Automatic Saving
Before measuring, configure saving on the [Calc/Save] screen.
Waveform data, screen images and numerical calculation results can be saved at
the sa
me time.
Before starting to measure, confirm that Auto
the CF card is properly installed.
Save is configured correctly, and that
When the time axis setting is 50 ms/div. or slower, data will be saved
while measurement is being performed. During automatic saving, a red
progress bar will be shown on the Save in Progress dialog box. When
the time axis setting is faster than 50 ms/div., data will be saved once
measurement is complete.
Page 87

79
[ON]
Once available space on the CF card becomes
limited, the file with the oldest date of creation
in the folder
[HIOKI8870]-[AUTO_D] will be
deleted to make space for a new file.
[OFF]
Data will be saved as long as there is space remaining on the CF Card. Once the card becomes full, data will no longer be saved.
6.3 Saving Data
Enabling Delete-and-save Operation
When delete-and-save operation is enabled, the oldest data will be deleted to make
space for new files once available space on the CF card becomes limited during
measurement that is performed with auto-save enabled.
3
When enabling Auto Save operation in RMS recorder mode, ensure that
the CF card has at least 10 MB of available space when measurement is
started. An error will result if there is not adequate space. On the other
hand, when enabling delete-and-save operation, 10 MB of available
space obtained by deleting files in the folder
will avoid an error.
6
Chapter 6 Saving & Loading Data
[HIOKI8870]-[AUTO_D]
Page 88

80
Select the [System]
Screen.
Move to a setting item.
Apply
Open the setting options
for the item to be set.
Select from the listed
options.
1
2
Selecting [SAVE Key Operation] setting options.
Setting options:( default setting)
Select & Save
Pressing the SAVE key displays the setting options for saving.
Quick Save Select the setting options for saving on the [Calc/Save] screen
before pressing the SAVE key.
The Save dialog appears.
Select from the saving options
in this dialog.
Save Waveforms (p. 81)
Save Screen Image (p. 82)
Save Numerical Calculation
Results (p. 83)
Setting items are displayed.
Select your saving options.
[Select & Save]
[Quick Save]
6.3 Saving Data
Selecting the Manual Saving Method
[Quick Save]/[Select & Save]
Two manual saving methods are available: [Quick Save] and [Select & Save], both
of which offer the same setting options. When saving waveforms, a folder (named
with the date of saving) is created for data on the CF card, and saved files are automatically numbered (p. 71).
Page 89

81
Quick Save
(Before pressing the SAVE key, make
settings on the System screen)
(Select from the dialog that appears
when you press the SAVE key)
1
For the [Format] setting, select the data saving format.
Binary Select this format to be able to reload the saved data into the instru-
ment, or so that it can be loaded into the Wave Processor program.
Text Select this format to save the data as a text file.
2
(When [Text] format is selected)
From the [Thinning] options, select the amount of data thinning desired.
1/2, 1/5, 1/10, 1/20, 1/50, 1/100, 1/200, 1/500, 1/1000, OFF
1/2: Saves every other data point ( x x x)
1/5: Saves one of every five data points (xxxxxxxxxxxx)
3
From the [Period] setting options, select the portion of the data to save.
Whole *, A-B, Start-A, Start-B, A-End, B-End
(Whole = all acquired waveforms, A = Cursor A, B = Cursor B,
Start = start of acquired waveforms, End = end of acquired waveforms)
Select [Save] and press the ENTER key.
Select [Yes] in the confirmation dialog,
and press the ENTER key.
Select [Waveform], and
press the ENTER key.
Select [Waveform] as
the [Save Type].
( default setting)
Select & Save
6.3 Saving Data
Saving Waveform Data (with the SAVE Key)
When saving waveform data, created files are automatically named
WAVEnnnn.MEM, RMS (or .CSV) in a folder automatically named [HIOKI8870][save date], where nnnn is an automatically generated seria l number starting from
0001 and da
To save a partial waveform, specify the time span to save beforehand (p. 68).
te is the saving date (p. 71).
3
6
Chapter 6 Saving & Loading Data
Page 90

82
(Before pressing the SA VE key, make
settings on the System screen)
(Select from the dialog that appears
when you press the SAVE key)
Display the screen to capture
Select [Yes] in the confirmation
dialog, and press the ENTER key.
Select [Screen Image], and
press the ENTER key.
Select [Screen Image] as
the [Save Type].
Display the screen to capture,
and press the SAVE key.
Quick SaveSelect & Save
6.3 Saving Data
Capturing a Screen Image (With the SAVE Key)
Captured screen image files are automatically named SCRnnnn.BMP in a folder
named [HIOKI8870]-[save date] (p. 71).
Page 91

6.3 Saving Data
(Before pressing the SAVE key, make
settings on the System screen)
(Select from the dialog that appears
when you press the SAVE key)
Display the numerical calculation
results to be saved.
Select [Yes] in the confirmation
dialog, and press the ENTER key.
Select [Calc Results], and
press the ENTER key (p. 93).
Select [Calc Results] as
the [Save Type].
By specifying a particular time span for numerical calculation, only the results
for that time span are saved.
Quick SaveSelect & Save
Saving Numerical Calculation Results (With the SAVE Key)
Numerical calculation settings are necessary before saving results (p. 93).
Numerical calculation result files
folder named [HIOKI8870]-[save date] (p. 71).
are automatically named MEASnnnn.CSV in a
83
3
6
Chapter 6 Saving & Loading Data
Page 92

84
Select the [Setting] Screen.
Select [Save Setting].
Apply
The Save dialog appears.
1
2
3
Select whether to save to
the MR8870-20’s memory
or to a CF card.
Apply
4
(When [CF Card] is selected)
Setting configuration files are automatically named CONFIGnnnn.SET (at memory recorder mode) in a folder named [HIOKI8870]-[CONFIG] (p. 71).
To reload a setting configuration, see p. 85.
In RMS recorder mode, files will be saved with the extension .SRM.
(When [Memory] is selected)
Select [Save] for the configuration instance (No.) to
save.
Enter a comment as needed.
Apply
When [Export] is selected, all the setting configurations saved in the internal
memory can be saved as one file in the CF card.
Saved under the file name [LIST + Automatic No. (0001).BDL] inside the
[HIOKI8870]-[CONFIG] folder.
When reading the setting list file (LISTxxxx.BDL) saved in the CF card on this
instrument, all the 10 settings inside the internal memory will be overwritten.
Comments entered on the [Comment] screen
are displayed here.
6.3 Saving Data
Saving Setting Configurations
Setting configurations can be saved as data files and later reloaded into the Memory
HiCorder when you need to make more measurements with the same settings.
Up to ten setting configurations can be saved to internal memory, and more can be
store
d on a CF card.
Page 93

85
Select the [Setting] Screen.
Select [Load Setting].
1
2
Apply
The loading dialog appears.
3
Select whether to load a
setting configuration from
MR8870-20’s memory or
CF card
Apply
When Loading from Memory HiCorder Memory
The list of configurations stored in Memory HiCorder memory is displayed.
(If you selected
[Memory])
Select [Load] for the configuration you want to load
Apply
4
6.4 Loading Data on the Memory HiCorder
6.4 Loading Data on the Memory HiCorder
Previously stored binary waveform data, captured screen images, saved setting configurations and setting lis
(p. 71). Data stored on a CF card can also be
the supplied USB cable (p. 91).
Waveform files (.RMS) and setting files (.SRM) saved in RMS
recorder mode cannot be loaded in memory recorder mode. Additionally, waveform files (.MEM) and setting files (.SET) saved in
me
mory recorder mode cannot be loaded in RMS recorder mode.
Change the mode as appropriate before loading files.
Loading a Setting Configuration
Setting configurations saved in the Memory HiCorder’s memory or on a CF card can
be reloaded.
How to save a setting configuration: p. 84
t can be reloaded into the Memory HiCorder
transferred to a computer using
3
6
Chapter 6 Saving & Loading Data
Page 94

86
Apply
Select the configuration
file to load.
(CONFIGnnnn.SET)
Memory HiCorder settings are reconfigured to those in the loaded configuration file.
(If you selected
[CF Card])
When Loading from CF card
Configuration files stored in the [HIOKI8870][CONFIG] folder on the CF card are displayed.
1
2
Method 1. Loading from instrument memory
Open the screen for loading
the setting configuration.
(Up to step 3 on the previous page)
Specify the number of the setting
configuration you want to load
automatically and input it into
[Auto Load].
Method 2. Loading from external storage media
Setting options:( default setting)
Off
Loading is not performed automatically.
[No1] to
[No10]
Select the file to load automatically.
• Setting configuration data saved as a file named STARTUP.SET or STARTUP.SRM in the [HIOKI8870] - [CONFIG] folder of the CF card is automatically
loaded at power-on.STARTUP.SET will start up in memory recorder mode, STARTUP.SRM will start up in RMS recorder mode.
• In both cases, you can read in favor of the measurement mode during start-up.
6.4 Loading Data on the Memory HiCorder
Load the setting configuration data automatically
Page 95

Select the File Screen.
The contents of the CF card
are displayed.
1
Apply
The control dialog box appears.
Select a file to load.
Displays the parent folder.
Displays the child folder.
After selecting a folder by pressing the ENTER key,
select [Change folder] in the displayed control dialog box.
2
The selected file content is displayed on the waveform screen.
Select [Load].
Apply
3
When binary format waveform data and screen images have been automatically
saved together, you can switch the display between the two.
Load the screen image (WAVEnnnn.BMP)
Loads the waveform data corresponding to the screen image file with the same name.
The loading dialog appears
Select [Yes] and press the
ENTER key to display the
waveform data.
Switch to the screen image files
in the same folder.
87
6.4 Loading Data on the Memory HiCorder
Loading Waveform Data and Screen Images
Waveform data saved in binary format, or captured screen images, can be reloaded
into the Memory HiCorder.
3
6
Chapter 6 Saving & Loading Data
Page 96

88
Select the File Screen.
1
2
Opens the control dialog
box.
Select the File Screen.
The contents of the card are displayed.
1
Displays the parent folder.
View child folder (view contents of the currently highlighted folder)
(press the ENTER key and select [Folder] in the displayed control dialog
box)
2
Select a folder to view.
6.5 Data Management
6.5 Data Management
You can manage data stored on a CF card in the Memory HiCorder.
• Load a file (when the file is selected) (p. 85)
• Move displayed folders (when the folder is selected) (p. 88)
• Delete data (p. 89)
• Rename files and folders (p . 89)
• Sort files (p. 90)
• Format a CF card (p. 76)
The following operations can be performe d from the co
pressing the ENTER key from the File screen.
Viewing Folder Contents and the Parent Folder
ntrol dialog box displayed by
Page 97

89
Select the File Screen.
The contents of the CF card
are displayed.
1
Apply
Select a file to delete.
2
A confirmation dialog appears.
Select [Yes] and press the ENTER key to delete.
3
Select [Delete].
Apply
Select the File Screen.
The contents of the CF card
are displayed.
1
Apply
Select the file or folder to
rename.
2
The character entry dialog appears.
Enter the new file name (the same way as when entering a comment) (p. 52)
A confirmation dialog appears.
Select
[Yes] and press the ENTER key to apply the new name.
3
Select [Rename].
Apply
6.5 Data Management
Deleting Data
Folder and files on the CF card can be deleted.
Renaming Files and Folders
Folders and files on a CF card can be renamed. File names may consist of up to 26
regu
lar characters.
3
6
Chapter 6 Saving & Loading Data
Page 98

90
Select the File Screen.
1
Apply
Select the key on which to
sort.
4
3
Select [Sort].
Apply
2
Apply
The control dialog box
appears.
Select the desired sort
order.
(Ascending or Descending)
Files are displayed in the
new sort order
5
6
Finish
6.5 Data Management
Sorting Files
Files can be sorted in ascending or descending order according to a selected so rt
key.
Page 99

91
Open the protective
cover over the USB
connector.
Orient the USB cable
plug properly, and
insert it into the receptacle.
1
2
Protective Cover
Connect the other end
of the cable to a USB
port on the computer.
3
The computer should recognize the Memory HiCorder as a remo vable disk when
the cable is connected. Only data in the CF card inserted in this Memory HiC order
can be accessed from the computer. Data not saved in the CF card cannot be
accessed.
Connection Precautions
Connecting the cable while measuring or with the File screen displayed will prevent the computer from recognizing the Memory HiCorder. Also, the Memory
HiCorder cannot be operated during the connection process.
Removable
Disk
6.6 Transferring Data to a Computer
6.6 Transferring Data to a Computer
Using the supplied USB cable, data stored on a CF card in the Memory
HiCorder can be transferred to a computer. To analyze the data using an application program, refer to the instructions for
See: "Appendix 3 Wave Processor Application Program" (p. A6)
Computer Requirements
A personal computer running Windows XP, Vista, 7, or 8
• Do not eject the CF card or pull out the USB cable during data
transfer. Doing so would prevent proper data transfer.
• The Memory HiCorder and computer should be connected to the
me earth ground. If grounded separately, potential difference
sa
between the ground points can cause malfunctions or damage
when connecting the USB cable.
the program.
3
Connecting the USB Cable
USB Disconnection Procedure
Before unplugging the USB cable connected to the Memory HiCorder, select the
“Safely Remove Hardware” icon in the Windows notification area, and click the mass
storage device corresponding to the Memory HiCorder to remove.
6
Chapter 6 Saving & Loading Data
Page 100

92
6.6 Transferring Data to a Computer
 Loading...