

circuit
).
1
LR8400-92
LR8400-93
PV Power V er if ier
Instruction Manual (PV Mode)
December 2013 Revised edition 1
Printed in Japan
LR8400E981-01 13-12H
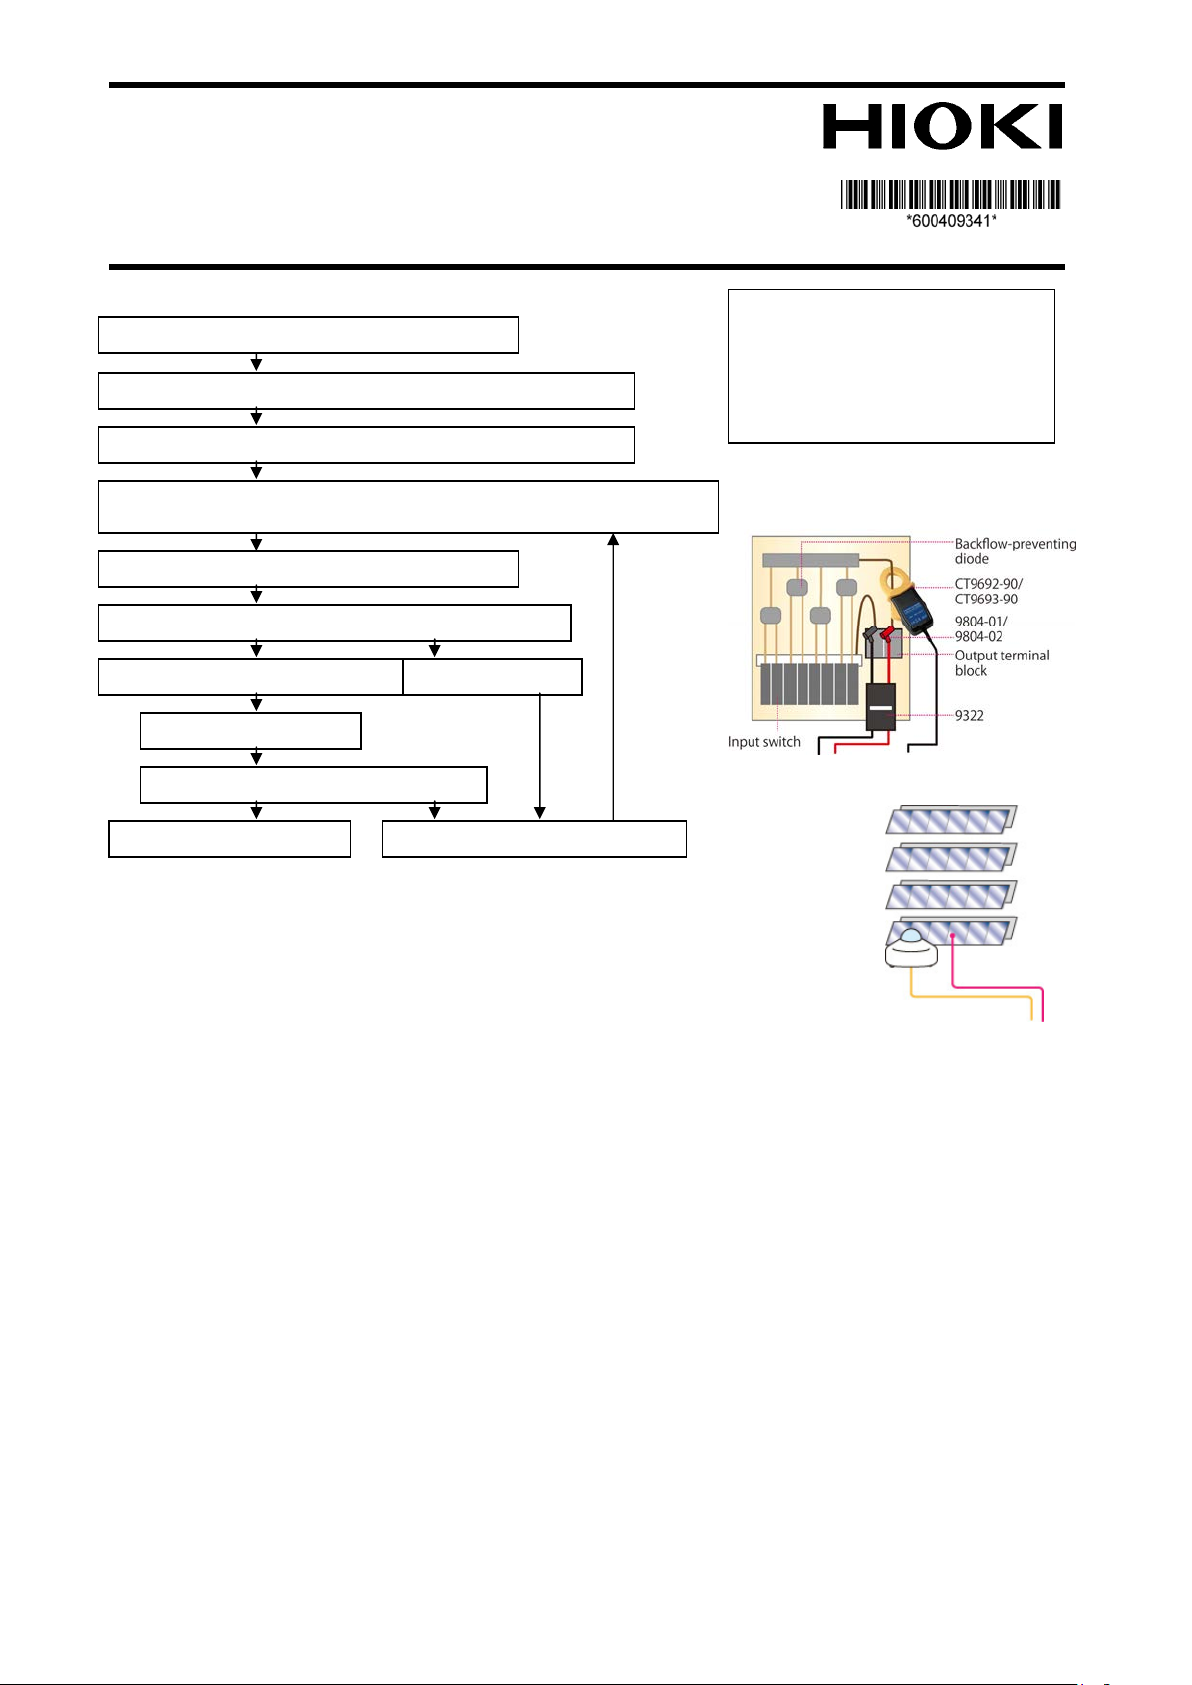
Measurement Procedure
3. Place the sensors (when investigating a failed string, change the measurement
inside the junction box
5. Check measured values on the Monitorscreen.
6. Start time-series recording. End measurement.
Turn off the instrument. 7. Investigate the failed string.
1. Select “PV Mode Set ON” on the Measurement Settings screen.
-1. Press the “SET” key and select “PV Mode Set ON” on the
Measurement Settings screen.
2. Connect the sensors to the LR8400-23.
-1. Ch.1-1:
• Connect the BNC conversion cable(2.4m) to the BNC side of the 9322 Differential Probe and connect
the 9804-01 Magnet Adapter (red) and the 9804-02 Magnet Adapter (black) to the ends.
• Connect the BNC conversion cable to Ch.1-1.
• Connect the power cord to the power jack on the 9322 Differential P robe.
• Connect the power cord’s positive wire to the +12 V jack on the external I/O terminal block on the LR8400-23, and similarly
connect the power cord’s negative wire to the GND jack.
-2. Ch.1-2:
• Connect another BNC conversion cable(30cm) to the CT9692-90 (or CT9693-90) Clamp Sensor and connect it to Ch.1-2.
• Set the CT6590 Sensor Unit’s range (H or L).
• Check the AA batteries in the CT6590 Sensor Unit.
-3. Ch.1-3:
• Connect the actinometer (EKO Instruments ML-01 or ML-020VM).
-4. Ch.1-4:
• Connect the thermocouple.
3. Place the sensors (see Figures 1 and 2).
-1. Ch.1-1:
• Connect the 9804-01 (red) and 9804-02 (black) magnet adapters that are connected to the tip of the 9322 Differential Probe to the
positive and negative terminals of the main DC line in the junction box or the electrical box (or when investigating a failed string,
the branch circuit) between the solar panels and the power conditioner. Cut the magnet sheet, pasted on the back of the 9322
Differential Probe.
-2. Ch.1-2:
• Clamp the CT9692-90 (or CT9693-90) Clamp Sensor to the positive side of the main DC line in the junction box or electrical box
(or when investigating a failed string, the branch circuit). At this time, orient the current direction mark on the clamp sensor so that
it indicates a flow from the solar panels to the power conditioner.
-3. Ch.1-3:
Attach the actinometer (EKO Instruments ML-01 or ML-020VM) to the
•
surface using the adjustment screw.
-4. Ch.1-4:
• Attach the thermocouple to the solar panel.
Turn on the instrument.
1. Select “PV Mode Set ON” on the Settings screen.
2. Connect the sensors to the LR8400-23.
4. Configure settings.
End recording.
Check and analyze saved data.
Thank you for choosing the Hioki LR8400-92/
LR8400-93. This Measurement Guide introduces the
basic method for measuring the DC side of a
photovoltaic system. For more information about
standard methods for using the instrument in
applications other than the above and general handling
information, please see the LR8400-20 Instruction
Manual.
Measurement preparation s
-1. Inspect the instrument.
-2. Insert a CF card (or USB flash drive)
into the instrument as necessary.
-3. Connect the AC adapter.
-4. Turn on the instrument.
Figure 1
Figure 2
solar panel. So that it is parallel with the measurement
4. Config ure settings.
g
polycry
p
y
pyn
y
g
g
y
g
g
py
p
p
g
p
y
g
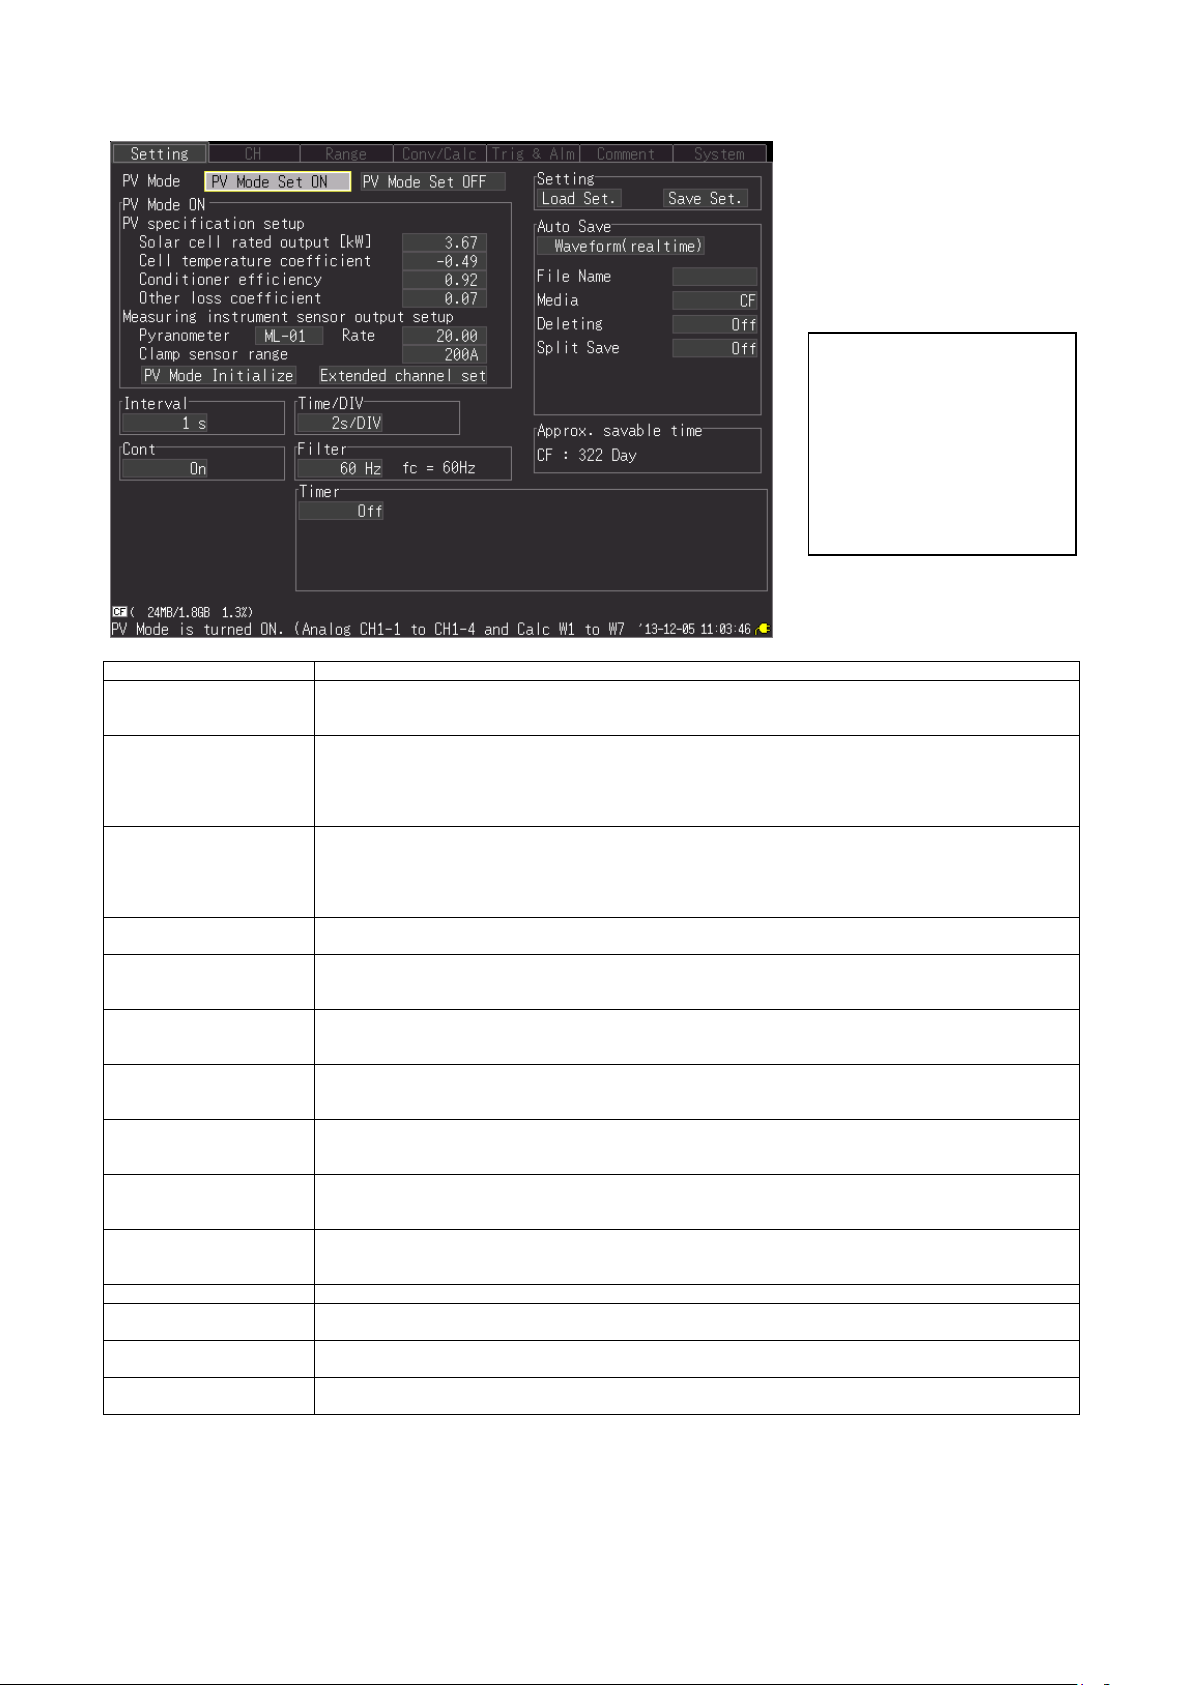
-1. Select the “PV Mode Set ON” setting on the Measurement Settings screen.
Settings
Solar cell rated output
[kW]
Cell temperature
coefficient
(maximum output)
Conditioner efficiency To display the AC estimated power (reference values) and AC estimated energy (reference values) on a
Other loss coefficient Coefficient for the effects of factors such as wiring resistance, dirt or snow buildup on the panel
Pyranometer kind
Pyranometer output rate
Clamp sensor range Select the same range as set for the CT6590 Sensor Unit. Next, press the “Monitor” key on the LR8400
PV mode initialize Resets the following settings to their default values: Solar cell rated output, Cell temperature
Extended channel set An input can be added to ch1-5 to ch1-11.Voltage, Thermo couple, and a clamp (2000A, 200A, 100A,
Interval Set the time interval at which to record data. The longer the time interval, the lower the cutoff
Cont Set whether to perform measurement for the set time or continuously.
Time/DIV Set the time per division.
Filter Set to either 60 Hz or 50 Hz depending on the power supply frequency in your region. The longer the
Timer Set when you wish to perform measurement regularly. This setting allows the instrument to perform
Auto save Set when you wish to save data automatically during measurement. For more information, see “Saving
Note
・ For photovoltaic systems that boost the voltage on the power conditioner side so that it is higher than the value at the junction box
・ The waveform data measured in "PV mode Set ON" LR8400-23 can be displayed by attached Logger Utility. However, "PV mode"
Settin
Description
where the measurement i s being taken , select chann el number 1-1 on the Setting screen’s “CH” sheet and enter a voltag e value as
appropriate for the “Offset” setting under “Scaling” so that the voltage shown on the LR8400-23’s Monitor screen matches the
photovoltaic system monitor’s DC voltage value.
cannot be set up by Logger Utility.
Enter the photovoltaic cell rated output or photovoltaic cell capacity for the solar panel being
measured. If measuring a bran ch circuit, for example in order to investigate a failed string, enter the
total rated output for the target photovoltaic cell only.
Photovoltaic cells have negative temperature characteristics, meaning that their output decreases as
their surface temperature i ncreases, and this coefficient expresses that relationship. This tendency i s
particularly pronounced in crystalline silicon. Enter the appropriate value after checking the
specifications for the photovoltaic system. Following are reference values: Monocrystalline Si: -0.46;
stalline Si: -0.49; amorphous Si: -0.26; CI(G)S: -0.46
PV Waveform/Values screen, consult the power conditioner specifications and enter the device’s
conversion efficiency. The above value is subject to a larger error component in photovoltaic systems
that boost the voltage on the power conditioner side so that it is higher than the voltage at the
measurement point.
surface, shadows, etc. A general average value of 0.07 is used by default. Change as necessary.
Choose the pyranometer kind. Output rate initial value of the ML-01 is 20.00. Output rate initial value
of the ML-020VM is 140.00. When Sensitivity indicated on the label of Pyranometer is A, the
calculated value of 1000/A is set to output rate. Other
while the clamp is not applied to anything and adjust the 0ADJ knob on the CT6590 so that the “ch1-2
current” is 0.
coefficient, Conditioner efficiency, Other loss coefficient Pyranometer kind , Pyranometer output rate,
and Clamp sensor range. (Please perform, when you initialize PV mode setup.)
20A, 10A) can be chosen from th e input item of the channel which select check mark. (P lease use it,
when you increase the measurem ent channel in PV mode.)
frequency, increasing noise rejection effectiveness. It is recommended to increase the recording
interval in environments that are prone to noise from inverters or other devices.
OFF: Normal measurement (measurement for t he specified recording time)
ON: Continuous measurement
recording interval, the greater the noise rejection effectiveness.
measurement at a regular interval from the set start time to the set stop time.
Data Automatically” in Section 6.2, “Saving Data,” of the LR8400 User Manual.
ranometer use Free Set.
Note: The version of the
software until the V9.12, it was
ML-020 only rather than
selection of pyranometer kind.
From V9.13, please use it to
select "ML-01", "ML-020", and
"Free Set" pyranometer kind
used as shown in the figure on
the left. (In the system screen,
you can check the version.)

5. Check measured values on the Monitor screen.
play
-1. If you encounter any of the following displays on the Monitor screen, refer to the indicated solution.
Erroneous vol tage value • Check whether the 9322 Differential Probe switch is set to “DC.”
Erroneous curr ent value • Check the CT6590 Sensor Unit’s range setting.
Erroneous insolation value • Check the wiring connections.
Erroneous panel temperature
value
Significant difference between
power and estimated power
6. Start time-series recording.
If performing time-series recording, start recording. If the auto-save setting has been activated, data will be recorded simultaneously
to the instrument’s internal memory and the specified CF card or USB flash drive.
-1. Start measurement with the Start key.
-2. Stop measurement with the Stop key.
Note
The continuous operating time for the AA alkaline batteries
in the CT6590 Sensor Unit that ships with the CT9692-90
(or CT9693-90) Clamp Sensor is approximately 25 hours.
When performing time-series recording, use the optional
9445-02 AC A dapter .
7. Investigate the failed string. (See Figure 3.)
If the power value is significantly less than the estimated
power, a solar panel may have failed. The instrument can be
used to look for a string with a wiring break or a module
failure by means of the following method.
-1. Return to Step 3, “Place the sensor s,” and connect the
9322 Differential Probe and CT9692-90 (or CT9693-90) Clamp Sensor
to the branch circuit as shown in Figure 3. Next, change the
photovoltaic cell rated output on the Measurement Settings
screen to the output value for the string being measured and
check the voltage, current, and output values o n the Monitor screen.
Perform similar measurements for the other strings. Circuits with
relatively lower values may indicate wiring breaks or module failures.
-2. Without changing the settings made in (-1) above, cover the solar cell that you expect may be damaged with a piece of cloth, board,
or other material and compare the resulting voltage, current, and energy values with the corresponding values before the panel was
covered. Strings whose measured values do not change when they are covered may have a module failure or wiring break.
-3. The instrument can also be used as a normal data logger by using the “PV Mode Set OFF” setting. Up to 30 channels of current
data can be recorded by purchasing additional CT9692-90 (or CT9693-90) Clamp Sensors and BNC conversion cables. Current data
for multiple strings can be recorded simultaneously, allowing current variations to be investigated.
Note
•The instrument cannot be used to search for failures or wiring breaks within individual modules. For such applications, please use a
thermal camera or dedicated checker.
Dis
Solution
• Check whether the voltage range has been set to take into account the fact that the differential
probe’s output ratio is 1/1,000.
• For photovoltaic systems that boost the voltage on the power conditioner side so that it is higher
than the value at the junct ion box where the measurement is bei ng taken, select channel nu mber
1-1 on the Setting screen’s “CH” sheet and enter a voltage value as appropriate for the “Offset”
setting under “Scaling” so that the voltage shown on the LR8400’s Monitor screen matches the
photovoltaic system monitor’s DC voltage value.
• Check whether the solar panels are susceptible to the effects of factors such as shadow, dirt, or
snow buildup.
• There may be a wiring break on a string or a module failure.
• Check the LR8400’s clamp range setting.
• Check the adjustment of the 0ADJ knob on the CT6590 Sensor Unit.
• Check the CT6590 Sensor Unit’s remaining battery life.
• Check for noise sources such as inverters in the vicinity of the system.
• Check the site to see if the solar panels are susceptible to the effects of factors such as shadow,
dirt, or snow buildup.
• There may be a wiring break on a string or a module failure.
• Check for noise sources such as inverters in the vicinity of the system.
• Check the kind of pyranometer and output rate to be used.
•Check the installation of the thermocouple.
•Check for a broken thermocouple connection.
* Turning on the broken connection check on the “CH” sheet will cause “Burn Out” to be
displayed for the measurement data. However, the broken connection check function cannot be
used if the recording interval is 10 ms.
• Check the solutions for erroneous voltage, current, insolation, and panel temperature values
above.
• Check whether the PV specification setup have been set to appropriate value. In particular,
double-check the photovoltaic cell rated output and clamp range settings as these are easy to
overlook.
• This error is more likely to occur in climates and time zones characterized by low insolation.
Perform measurement during a time of high insolation.
• There may be a wiring break on a string or a module failure. Pinpoint the location of the failure,
for example by using an I/V tracer.
Figure 3
3 2

g
ccutsdetejuctobo
).
g
grggy
g
g
4
About the Waveform/Values screens
PV Wave + Value screen
Estimate Power screen
Equations
w1: Power (kW) = Voltage (Ch. 1-1) × current (Ch. 1-2)
w2: Power integration (kWh) = Voltage (Ch. 1-1) × current (Ch. 1-2) × measurement time (h)
w3: Estimated power (kW) = Insolation strength (Ch. 1-3) / Gs (standard test condition of 1 kW/m
(1 - coefficient for other losses) × photovoltaic cell rated output (kW)
w4: Estimated integration (kWh) = Insolation strength (Ch. 1-3) / Gs (standard test condition of 1 kW/m
× (1 - coefficient for other losses) × photovoltaic cell rated output (kW) × measurement time (h)
w5: AC estimated power (kW) = Estimated power (w3) × power conditioner conversio n efficiency (reference value)
w6: AC estimated integration (kWh) = Estimated energy (w4) × power conditioner conversion efficiency (reference value)
w7: Estimated power approximation rate (%) = Energy (w2) / estimat ed energy (w4)
* 1 Temperature loss = Photovoltaic cell maximum output temperature coefficient × (panel temperature (Ch. 1-4) - 25) / 100
* The estimated energy is calculated for reference purposes using JIS C8907:2005, “Estimation Method of Generating Electric Energy
by PV Power System.”
* In the state of "PV mode Set ON", the range o f ch1-1 to ch1-4 and w1 t o w7, scaling, an upper and lo wer limit, and a comment are
set up automatically. Moreover, the range of ch1-5 to ch1-11 set up on the "extended channel set" screen , scaling are also set up
automatically.
Note
The results of calculations performed by the instrument to yield estimated power, estimated integration, estimated power
approximation rate, AC estimated power (reference values), and AC estimated integration (reference values) are easil y influenced by
the manner in which the target solar panels were installed as well as weather conditions and panel degradation. Calculated values
should be considered as guidelines for solar panel maintenance, rather than guaranteed values.
The instrument provides the following
six Waveform/V alues screens:
•PV Wave + Value
•PV Wave + Crsr
•Gauge + PV Wave
•PV Value
•Estimate Power
•AC Estimate (reference values)
2
) × (1 + temperature loss*1) ×
2
) × (1 + temperature loss*1)
 Loading...