

Page 1

9624-50
PQA-HiVIEW PRO
Instruction Manual
Oct. 2018 Revised edition 4
9624C981-04 18-10H
EN
Page 2

Page 3

Contents
Introduction ........................................................................ 1
Confirming Package Contents and Handling the CD .............. 1
Symbols and Terminology ....................................................... 2
Chapter 1
Overview ______________________________3
Product Overvi ew and Features ....................................... 3
Operation Flowc hart .............. .. ... .. ..................................... 4
i
Contents
Chapter 2
Setup _________________________________5
Hardware and OS Requirements
(System Configura t i on)........ .. .. .......................................... 5
Installing the 9624-50 PQA-HiVIEW PRO Program.......... 6
Uninstalling the Program................................................... 9
Chapter 3
Basic Operations ______________________11
Starting and Closing the Program.................................... 11
Starting the Program ............................................................... 11
Closing the Program ............................................................... 12
Loading Data . ...................................................................... 13
Viewing Measu re me nt Data...................... ... .. .. .................. 17
9624C981-04
File Types ................................................................................ 14
Loading Data ........................................................................... 15
Screens ................................................................................... 17
Menu Bar Operations .............................................................. 18
Tool Bar Operations ................................................................ 22
Changing Windows ................................................................. 23
Window List ............................................................................. 24
Arranging Windows (Window Layout) ..................................... 25
Adding TIME PLOT windows .................................................. 26
Page 4

ii
Contents
Undocking measurement windows from the main window ..... 28
Docking a floating measurement window in the main window 29
Specifying the docking position of measurement windows ..... 30
Hiding a specific measurement window .................................. 31
Saving and Loading integrated settings file.................... 32
About integrated settings file ................................................... 32
Specify the Save Destination for the integrated settings file
Beforehand ............................................................................. 32
Saving a integrated settings file .............................................. 33
Loading a integrated settings file ............................................ 33
Chapter 4
Analyzing Measurement Data ____________35
Displaying Gr aphs.................... ... .. .. ... ................................ 35
Enlarging and scrolling graphs ................................................ 35
Changing the Displayed Channels, Line Colors,
and Thicknesses ..................................................................... 37
Viewing Measurement Data as Numerical Values
(Cursor Measurement).............................................. ......... 38
Viewing a Time Series Graph
Opening and Switching Time Plot Windows ........................... 40
Viewing RMS Fluctuations (Trends) [TIME PLOT – RMS] ..... 43
Viewing Voltage Fluctuations (Detailed Trends)
[TIME PLOT – VOLTAGE] ...................................................... 44
Viewing Harmonic Fluctuations
(Hioki PW3198, 3196 only) [TIME PLOT – HARMONICS] .... 45
Viewing Inter-Harmonic Fluctuations
(Hioki PW3198, 3196 only) [TIME PLOT – INTERHARM] ..... 46
Comparing Multiple TIME PLOT Windows ............................. 47
[TIME PLOT].......................... 40
Viewing 1 day / 1 week’s data ................................................. 49
Viewing Event Phe nomena.................. ... .. .. ....................... 50
Viewing Events as a List
Viewing Event Measurement Data
Opening and Switching Event Data Windows ......................... 57
Viewing Voltage/Current Waveforms [VOLTAGE/CURRENT] 59
Viewing Voltage/Transient Waveforms
(PW3198, 3196) [VOLTAGE/TRANSIENT] ............................ 60
[EVENT LIST] ................................ 53
[EVENT DATA].............. 57
Page 5

Viewing Voltage Waveforms [VOLTAGE] ............................... 61
Viewing Current Waveforms [CURRENT] ............................... 62
Viewing Measu re me nt Settings ........................................ 63
Printing Measu re me nt Da t a............... .. ... .. ......................... 64
Generating Reports................ .. .......................................... 66
Report Output Items ................................................................ 70
Report Printout Example ......................................................... 71
Printing with a Specified Report Format .................................. 73
Copying a displayed image into the clipboard................ 7 5
Storing Measurement Data in a CSV File......................... 76
Convert Time-Series Data to CSV Format .............................. 77
iii
Contents
Converting Waveform Data to CSV Format ............................ 79
Converting Demand Data to CSV Format ............................... 80
Before Converting Harmonic Voltage Measurement Data
(EN50160 Mode) to CSV Format (Hioki 3196 only) ................ 81
Using Optional Functions.................................................. 82
Chapter 5
Analyzing Measurement Data from the
Hioki PW3198, 3196 ____________________83
Viewing detailed event measurement data [EVENT DATA] 83
Viewing the Vector Display [VECTOR] ................................... 84
Viewing the DMM Display [DMM] ............................................ 84
Viewing Harmonics on a Bar Graph
Viewing Harmonics in a List [HARMONICS LIST] .................. 86
[HARMONICS BAR GR APH]
Viewing High-order Harmonic Details(PW3198).............. 87
85
Viewing Voltage Fluctuation Details(3196)
[Voltage Fluctuation Event Graph] ............................................... 89
Viewing Voltage Fluctuation Details
and the Inrush Current Graph (Hioki PW3198 only)
[Event Voltage Fluctuation and Inrush Current Graph] ................
Viewing Integral Power
PW3198, 3196 ........................................................................ 92
[Integrated Power Window] .............. 92
90
Page 6

iv
Contents
Viewing a Demand Graph [Demand Window]........................ 94
PW3198, 3196 ........................................................................ 94
Testing Measurement Data Conformance [ITIC]................ 95
Setting Tolerances (Making a User-Defined Curve) ............... 97
Curve Tables (Reference) ....................................................... 99
Viewing a Flick er Gra p h..................................................... 100
Viewing a Delta V10 Flicker Graph [Delta V10 Flicker Window] 100
Viewing an IEC Flicker Graph [IEC Flicker Window] .............. 101
Switching to EN50160 Display Mode................................ 102
Viewing EN50160 Mode Measurement Data..................... 103
Overview Window ................................................................... 104
Harmonic Window ....................... ............ ............ ............ ........ 106
Signaling Window (Hioki 3196 only) ....................................... 107
Measurement Result Classification Window ........................... 108
Downloading Measurement Data from the Power Quality
Analyzer (LAN Downl o ad Func tion) ........ .. ... .. .................. 111
Storing Measurement Data in a PQDIF File (PW3198) .... 113
Converting measurement data to the PQDIF format .............. 113
Chapter 6
Analyzing Measure me nt Da ta
from the Hioki 3197 ___________________115
Viewing Voltage Fluctuation Details
[Voltage Fluctuation Event Graph] ............................................... 115
Viewing an Inrush Current Graph
[Inrush Current Event Graph]....................................................... 116
Viewing Integral Power
[Integrated Power Window] ............. 117
Viewing a Demand Graph
[Demand Window]........................ 118
Page 7

Chapter 7
Specifications ________________________119
General Specifications....................................................... 119
Hioki PW3198 Function Specifications and
Calculation Formul a s............... ... ....................................... 119
Hioki 3197 Function Specifications.................................. 127
Hioki 3196 Function Specifications and
Calculation Formul a s............... ... ....................................... 131
Appendix ____________________________A 1
Appendix 1 PW3198 Data-header Composition ...........A 1
v
Contents
Appendix 2 3197 Data-header Composition.................A 7
Appendix 3 3196 Data-header Composition.................A 8
Appendix 4 Measurement Settings and Instrument
Status.........................................................A 12
Appendix 5 TIME PLOT Item Notation.........................A 13
Appendix 6 Event Item Notation ..................................A 15
Appendix 7 Error Messages.........................................A 16
Index ______________________ _____ Index 1
Page 8

vi
Contents
Page 9

Page 10

Page 11

Introduction
When you receive the software, inspect it carefully
to ensure that no damage occurred during shipping.
If damage is evident, or if it fails to operate according to the specifications, contact your dealer or
Hioki representative.
9624-50 PQA-HiVIEW PRO
Program Software (CD)
The latest version can be downloaded from
our web site.
Install guide
CD Handling Precautions
Follow these precautions to ens ure safe operation an d to obtain the full be nefits of the vario us functions.
• Always hold the disc by the edges, so as not to make fingerprints on the disc or scratch the printing.
• Never touch the recorded side of the disc. Do not place the disc directly on anything hard.
• Do not wet the disc with volatile alcohol or water, as there is a possibility of the label printing disappearing.
• To write on the disc label sur face, use a spirit -based felt pen. Do no t use a b all-point pen or hard tipped pen, because there is a danger of scratching the surface and corrupting the data. Do not use
adhesive labels.
• Do not expose the disc directly to the su n's rays, or keep it in conditions of high temperature or
humidity, as there is a danger of warping, with consequent loss of data.
• To remove dirt, dust, or fingerprints from the disc, wipe with a dry cloth, or use a CD cleaner.
Always wipe spherical from the inside to the outside, and do no wipe with circular movements.
Never use abrasives or solvent cleaners.
• Hioki shall not be held liab le for any proble ms with a computer sys tem that arises from the use of
this CD, or for any problem related to the purchase of a Hioki product.
Thank you for purchasing the HIOKI "Model 9624-50 PQA-HiV IEW PRO."
To obtain m
carefully, and keep it handy for future reference.
The 9624-50 PQA-HiVIEW PRO is a PC program for use with the Model
PW3198, 3196 and 3197 Power Quality Analyzers.
Registered trademarks
The company and product name s used in this i nstruction manual are the trademarks or registered trademarks of their respective owners.
Confirming Package Contents and Handling the CD
aximum performance fr om the instr ument, please read this m anual
1
Introduction
In the interests of ongoing product developments, there may be minor discrepancies between screen displays
and the operating instructions, and in the data conversion process.
Page 12

2
Introduction
Symbols and Terminology
The following symbols in this manual indicate the relative importance of cautions
and warnings.
Symbols
Indicates that i nc orre ct o pera tion presents a pos sibi lity of injury t o the
user or damage to the instrument.
Indicates advi sory items relate d to performa nce or correct ope ration of
the instrument.
(p. )
*
Indicates the location of reference information.
Indicates that descriptive information is provided below.
Mouse Operation T er minology
Click
Right-click
Double click
Drag
Activate
Press and quickly release the left button of the mouse.
Press and quickly release the right button of the mouse.
Quickly click the left button of the mouse twice.
While holding down the left button of the mouse, move the mouse
and then release the l eft bu tto n to d epo si t the c ho se n ite m i n the desired position.
Click on a window on the screen to activate that window.
Other Terminology
• Unless otherwise specified, "Windows" represents Windows 2000, Windows XP,
Windows Vista, Windows 7 (32bit/64bit ) or Windows 8 (32bit/64bit).
• Dialog box represents a Windows dialog box.
• Menus, dialogs, buttons in a dialog, and other names on the screen are indicated in
brackets.
Example: File-Open indicates that you should click File in the menu bar, and then cli ck
Open in the displayed pull-down menu.
Page 13

3
(Hioki PW3198, 3196 only)
Download measurement data
from the PW3198, 3196 Power
Quality Analyzer (p. 111)
Connect the Hioki PW3198, 3196 to a
computer via LAN to download data
from its internal memory and data files
from the PW3198 or 3196's SD/PC
Card.
Display and Analyze Measurement
Data (p. 17)
Analyze measurement data in greater detail using the same display as the PW3198,
3196, and 3197 Power Quality Analyzers.
You can also display and compare multiple
graphs.
Print Displayed Windows(p. 64)
and Copying (p. 75)
Print and copy displayed windows for
use in other applications.
Convert Measurement Data to
CSV Format (p. 76)
Convert any span of measurement data
to CSV format. Load converted files into
computer spreadsheet programs.
The 9624-50 PQA-HiView Pro offers the following functions.
Display Measurement and Calcul ation Values (Maximum, Minimum
and Average) (p. 38)
Use the A/B cursors to view maximum,
minimum and average values within any
time span.
Display measuremen t data in
EN50160 mode (p. 103)
Judge anomalies according to the
ITIC (CBEMA) Curve* (p. 95)
* Commonly used in the USA, the ITIC
Curve is a standard for evaluating voltage
anomalies by specifying a range of acceptable tolerance. A "User-Defined Curve" can
be optionally defined for voltage anomaly
evaluation.
Generate Measurement Data
Reports (p. 66)
Print any measurement as a report.
You can also save it as a rich text format
file, and use it in other applications.
Calculate Demand and Integral
Power
Hioki PW3198(p. 92),
Hioki 3197(p. 117), Hioki 3196(p. 92)
From the measurement data, calculate
maximum and average demand values,
and integral power.
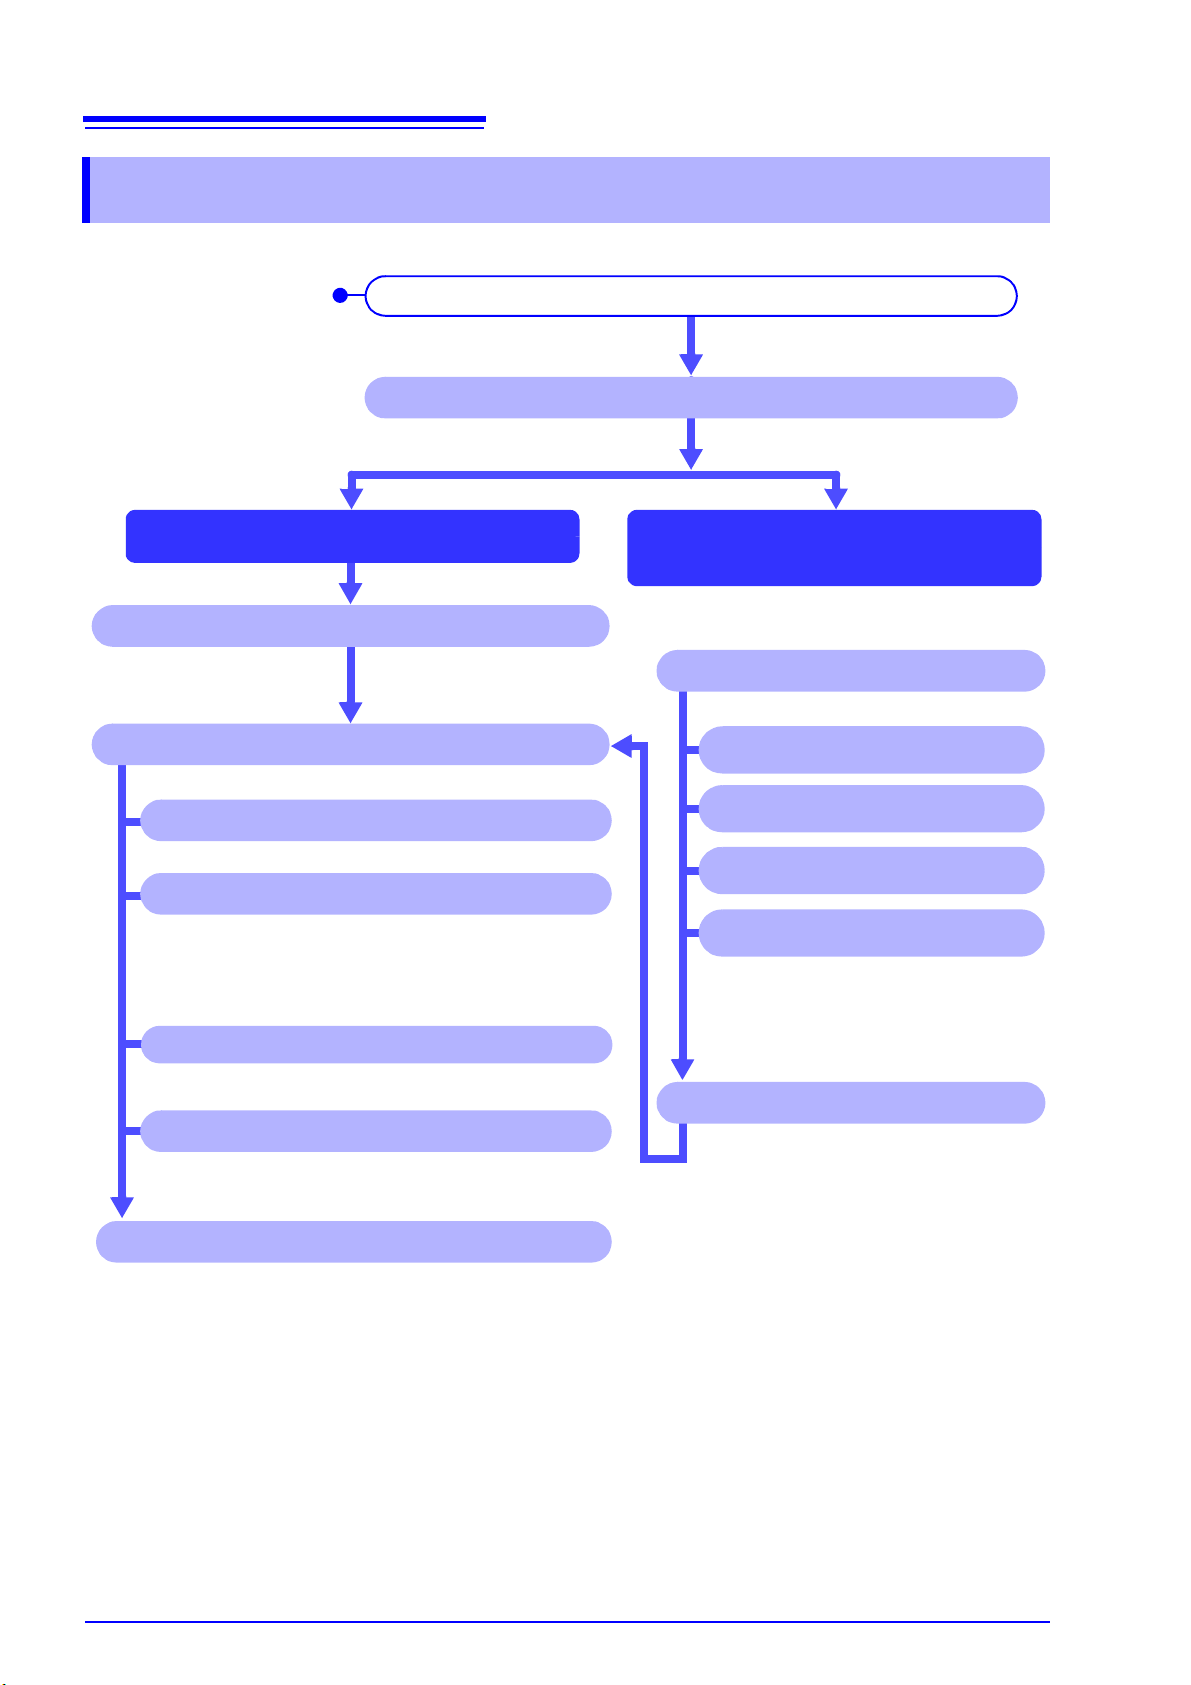
Chapter 1 Overview
Overview Chapter 1
Product Overview and Features
The Hioki 9624-50 PQA-HiView Pro is a software application for analyzing binary-format measurement data from the Hioki PW3198, 3196 and 3197 Power Quality Analyzers on a computer.
The PQA-HiView Pro can load and read only binary da ta recor ded with the Hioki PW3198, 3196 and
3197 Power Quality Analyzers.
It cannot read text or CSV data.
Page 14
4
Close the program (p. 12)
Display and analyze the measurement data (p. 17)
Load an integrated settings file
To analyze data or generate reports with the
same settings
Copy the screen image to the clipboard(p. 75)
First things to do after
purchasing
Launch the program (p. 11)
Install the 9624-50 PQA-HiVIEW PRO program (p. 5)
Create and load an integrated
settings file
Print (p. 64)
Load measurement data (p. 13)
View measurement data
Generate a report (p. 66)
Convert to CSV file (p. 76)
Save the integrated settings file
Settings file for generating reports
(.RPF)*
Settings file for limit value curve (.UCV)
Settings file for measurement result
classification (.ESP)
Integrated settings file (.QAP)*
To use measurement data w ith anoth er application
* Only settings files for report generation and
the integrated settings file are available for
data from Hioki 3197.
Measurement data can be downloaded
from Hioki PW3198, 3196 to the computer.(p. 111)
Chapter 1 Overview
Operation Flowchart
Page 15

5
Chapter 2 Setup
Setup Chapter 2
Hardware and OS Requirements (System Configuration)
The 9624-50 PQA-HiVIEW PRO requires the following hardware and software. Please verify your
system configuration.
Computer Type PC/AT compatible
Operating System English version of any of the following operating systems:
• Microsoft Wi ndows XP
• Microsoft Wi ndows Vista
• Microsoft Wi ndows 7
• Microsoft Wi ndows 8
Memory At least 512 MB
Display XGA (1024 x 768 dots) or higher
Disk System CD-ROM drive (Used only for installation)
Printer Required for report printing on the computer.
Either color or monochrome can be used, but the fastest possible printing is recommended.
For some models, proper operation cannot be guaranteed even when the above
requirements are satisfi ed .
Page 16

6
Installation may not be possible when other applications are running.
Before installing, close all applications that you can.
When an anti-virus program is running, installation may not be possible even when no virus
exists. In this case, change your anti-virus program settings as necessary to allow installation to
proceed.
The installer starts when you double click.
(\English\setup.exe)
Double Click
Chapter 2 Setup
Installing the 9624-50 PQA-HiVIEW PRO Program
Install the program by the following procedure.
Windows XP or Windows Vista, Windows 7, Windows 8 should be inst alled by your Systems Administrator.
Note: The description and message may vary depending on the operating system in use.
Start the computer.
1
Close all running programs.
Insert the program CD into the CD-ROM drive.
2
In the English folder, double click Setup.exe (the extension may not be displayed) to start
3
the installer.
Page 17

In the installer, click Next and confirm the installation destination.
To change the installation destination,
click Change to select another folder.
There is normally no need to change it.
The instal lation destination is
displayed.
Next
Next
If you are not changing th e installation desti nation,
click Next.
Click
Click
The installation destination folder can be changed on this screen.
4
7
Chapter 2 Setup
Page 18

8
Installation starts.
Progress is displayed during installation.
To interrupt installation in progress,
click Cancel.
Install
Click Finish to finish installation.
Click
Installation finished
Click
Finish
Chapter 2 Setup
Click Install to start installing.
5
Remove the CD from the CD-ROM drive.
6
Refer to Chapter 3, "Basic Operations" (p. 11) for the next procedure.
Page 19

Uninstalling the Program
Click
A confirmation dialog appears
when you click Remove
(or Change/Remove).
Change/Remove
Click
Yes
Click
The uninstall process begins.
The uninstall progress status is displayed.
The 9624-50 PQA-HiView Pro program is uninstalled.
The uninstall procedure is finished.
Click
Finish
Use the following procedure to uninstall the program.
From the Windows Start menu, select the Control Panel, and click Uninstall a program.
1
Select 9624-50 PQA-HiView Pro and click the Remove (or Change/Remove) button.
2
9
Chapter 2 Setup
3
4
Click Yes.
Click ( ).
Page 20

10
Chapter 2 Setup
Page 21

Chapter 3 Basic Operations
The main window, entitled HIOKI 9624-50 PQA-
HiVIEW PRO, appears.
Open the Windows Start menu and click
All Programs
– HIOKI – HIOKI 9624-50 – 9624-50V2.
Basic Operations Chapter 3
Starting and Closing the Program
Starting the Program
11
Page 22

12
Close button
Minimizes the window.
Maximizes the window.
Method 1
From the menu bar, click File
– Exit
Click
Method 2
Click the Close button ( ) at the top right
corner of the window
Click
Chapter 3 Basic Operations
Closing the Program
The program can be closed by any of the following methods.
Page 23

13
Chapter 3 Basic Operations
Loading Data
Measurement data recorded with the Hioki PW3198, 3196 or 3197 Power Quality Analyzer can be
loaded by the PQA-HiView Pro program.
However, it can load only binary format measurement data. Text and CSV format data cannot be
loaded.
To load measurement data:
PW3198
You can insert a SD Card with stored measurement data into a SD Card reader connected to the
computer, or transfer the measurement data over LAN to the computer, and then load it.
See: "Downloading Measurement Data from the Power Quality Analyzer (LAN Download Function)" (p. 111)
• It may take an extremely long time to directl y load large measurement data
files using the USB function. It is recommended to load such fi les after first
copying them to the computer.
• Do not disconnect the USB device while downloading data. Doing so may
cause the program to forcibly terminate.
3197
You can use the special-purpose application program bundled with the Hioki 3197 to download the
measurement data, and the load it.
See: The instructions (PDF) for the special-purpose application program on the CD-R supplied with the Hioki 3197
3196
You can insert a PC Card with stored measurement data into a PC Card reader connected to the
computer, or transfer the measurement data over LAN to the computer, and then load it.
See: "Downloading Measurement Data from the Power Quality Analyzer (LAN Download Function)" (p. 111)
Page 24

14
Chapter 3 Basic Operations
File Types
The data to be loaded is specified by its folder.
The following data files can be loaded from that folder.
File Contents
Setting data .SET
TIME PLOT data .ITV
Lists
Event data
Flicker data (Delta V10, IEC) .FLC
Transient over voltage waveform data .TRN
Event voltage fluctuation datal .WDU
High-order harmonic waveform files .HHC
EN50160 data EN50160.EN
EN50160 event data EVENT.EN
Inrush current graph data .INR
Demand graph data .DEM
Voltage/current waveforms
Numerical values
File
Extension
.EVT
PW3198 3197 3196
−−−
−−−
−−−
(Part of inrush current graph)
−−− −−−
−−−
(Calculated internally)
−−−
(Calculated internally)
−−−
(Part of event voltage
fluctuation data)
−−−
(Calculated internally)
−−−
−−−
−−−
−−−
Page 25

Chapter 3 Basic Operations
Measurement data from the PW3198, 3196 or
3197 is stored in folders named as follows:
B + date + serial number (8 digits)
Example:
B6040302
Binary data
Year 2006
April 3
2
nd
folder
Loading Data
Click the (Open button), or select File – Open on the menu bar.
1
The Open dialog box appears.
Select the folder containing the measurement data from the PW3198, 3196 or 3197 to be
2
loaded.
15
Click the OK button to load the selected data.
3
The loaded data is displayed on screen. Refer to the following for the details of each screen.
See: "Analyzing Measurement Data" (p. 35)
Analyzing T wo Types of Measurement Data
Two instances of the PQA-HiView Pro program can be started and run at the same time.
You can take advantage of this ca pability to compare measurement data from multi ple PW3198, 3196,
and 3197 instruments.
• Reading a folder containing a large amount of data may take som e time. The
time required to read the data depends on the computer system.
• It may take an extremely long time to directl y load large measurement data
files using the USB function. It is recommended to load such fi les after first
copying them to the computer.
• Do not disconnect the USB device while downloading data. Doing so may
cause the program to forcibly terminate.
Page 26

16
Displays the previous set of data.
Displays the next set of dat a.
Chapter 3 Basic Operations
Estimated Loading Time
(Example 1) To load measurement data into the PQA-HiView Pro from a SD card inserted in the computer.
Loading time: About 30 seconds
Loading conditions:
• Computer System Configuration
Computer Xeon CPU 3.20 GHz
OS Microsoft Windows XP
Memory 2 GB
Measurement Data
•
Capacity 177 MB
ITV files TIME PLOT(ALL DATA, MAX/MIN/AVG)
EVT files 1000 items
(Example 2) When loadi ng measureme nt data to the 9624 -50 from an SD me mory card ins erted into a notebook computer
Loading time: About 10 seconds
Loading conditions:
• Computer System Configuration
Computer Core2Duo CPU 1.58 GHz
OS Microsoft Windows XP
Memory 2 GB
•
Measurement Data
Capacity 309 MB
ITVfiles TIME PLOT(ALL DATA, MAX/MIN/AVG)
EVTfiles 1000 items
Data can be loaded faster if you first copy the data from the SD/PC card to the computer's hard disk.
Loading recording data
You can use the buttons on the standard toolbar to scroll backwards and forwards through repeated recording
data (PW3198) (p. 22).
Page 27

17
Menu bar
Tool bar
(standard)
Read data folder
Tool bar
(window)
Click the icons to
open different windows for viewing
measurement data, or
to show and hide windows.Move the
mouse over the tool
bar to see tool descriptions.
Status bar
Shows the current status and information
about each window.
Window tool bar
You can change th e content displayed
in the measurement windows, and
magnify or reduce waveform views.
Example: After loading measurement data from Hioki PW3198
Measurement windows
Windows can be changed from the
menu bar or from the tool bar (for
displaying windows).
Pop-Up menu
Appears when you ri ght click
on each window.
Operations are the same as
on the menu bar.
Close
Maximize
Minimize
Chapter 3 Basic Operations
Viewing Measurement Data
Screens
When the Model 9624-50 starts up, the main window appears.
Measurement data windows are displayed on the main window.Applicable measurement data windows are shown when measurement data is loaded.
Page 28
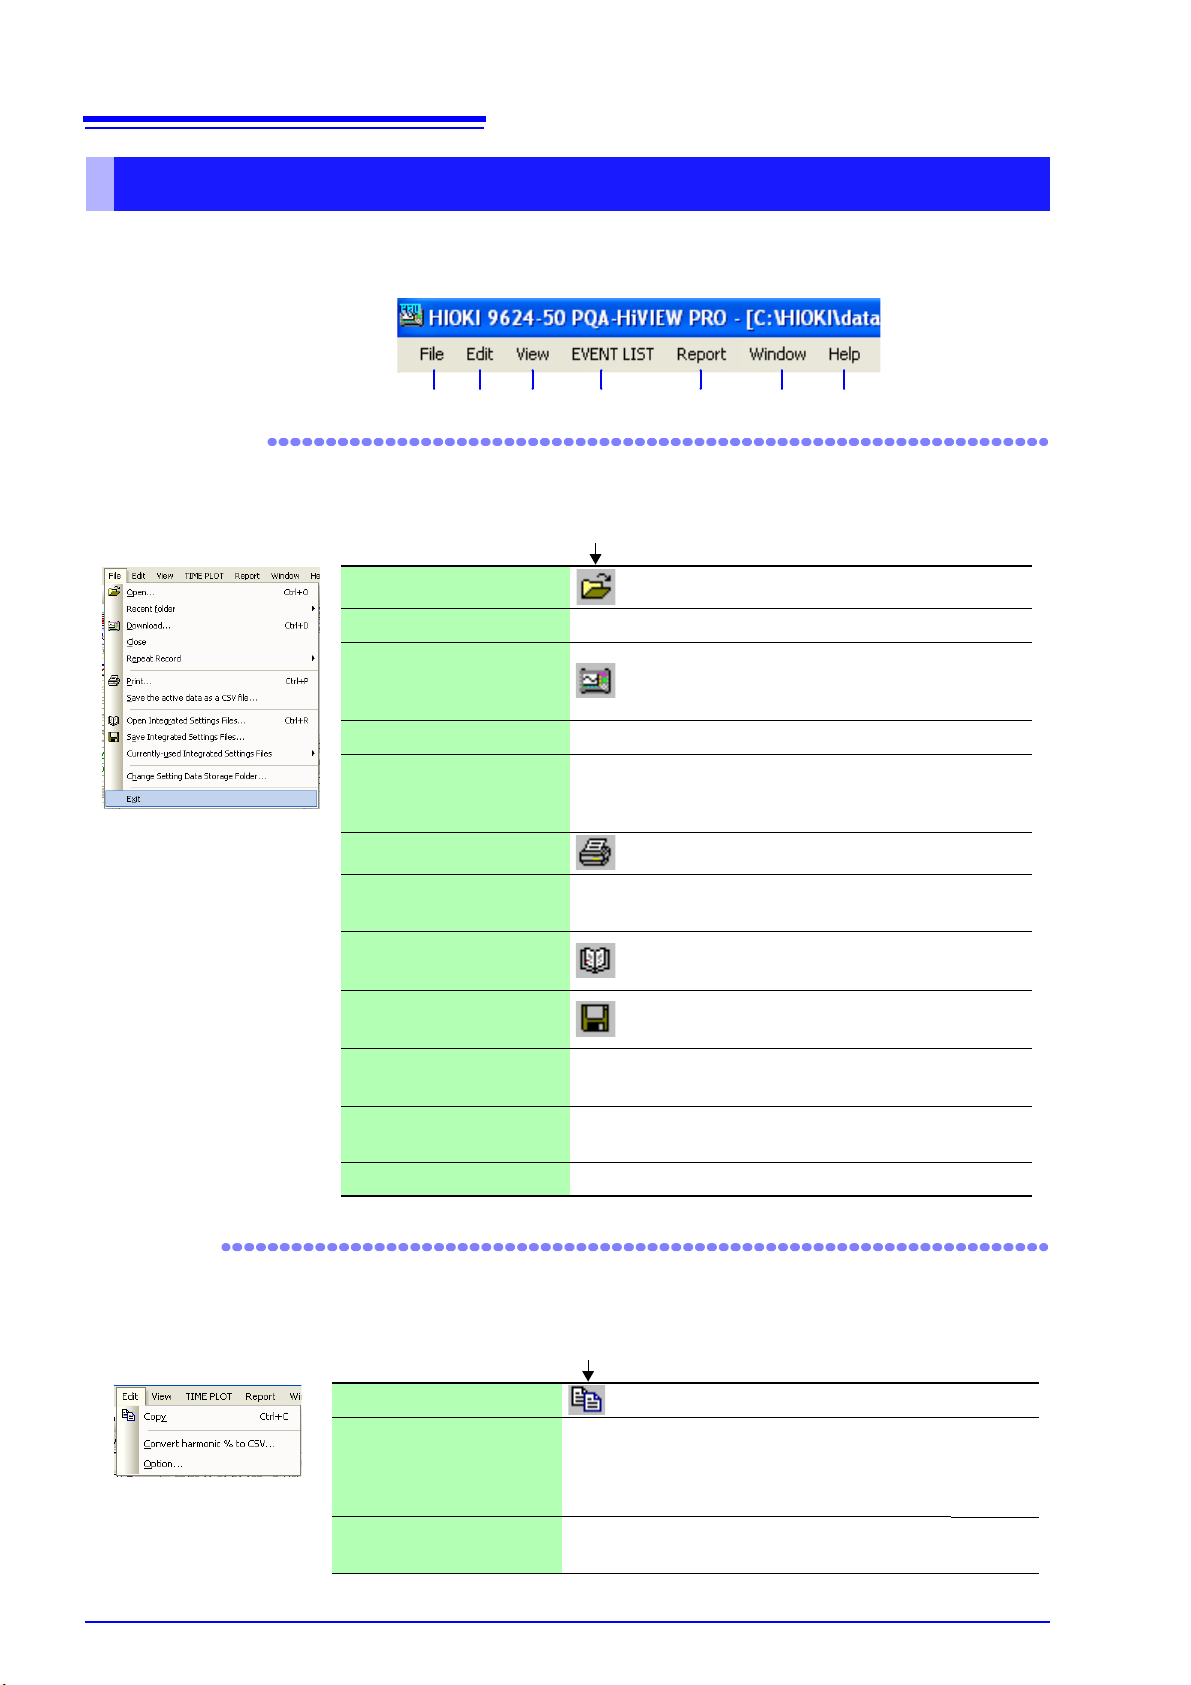
18
12 3 4 5 6 7
The same operations are available on the tool bar (p. 2 2).
Open Opens a file. (p. 15)
Recent folder Displays recently used folders.
Download
Downloads data from internal memory of
the PW3198, 3196 or SD/PC card via
LAN.
(p. 111)
Close Closes the currently active window.
Repeated Recording
Loads measurement data created using
the PW3198’s repeated recording function.
Print Prints the currently active window. (p. 64)
Save the active data as a
CSV file
Saves the loaded data as a CSV format
file.
(p. 76)
Open integrated settings
file
Loads a integrated settings file for the
PQA-HiView Pro.
(p. 33)
Save integrated settings
file
Saves a integrated settings file for the
9624-50.
(p. 33)
Currently-used integrated settings file
Displays recently used integrated settings
file.
Change Settings Folder
Specifies the folder in w hich setti ngs data
is stored.
(p. 33)
Exit Closes the PQA-HiView Pro program. (p. 12)
Click File and select from the pull-down menu.
1 File
The same operations are available on the tool bar (p. 22).
Copy Displays can be copied to the clipboard. (p. 75)
Convert CSV Harmonic
Content Percentages
Converts harmonic voltage v alues from a
nominal voltage basis to a fundamental
wave basis when converting to CSV-format data (EN50160 data only).
(p. 81)
Option
Configures functionality that is not used
during normal measurement.
(p. 82)
Click Edit and select from the pull-down menu.
2 Edit
Chapter 3 Basic Operations
Menu Bar Operations
Clicking a menu item displays one of the pull-down menus shown below. Items not available for the
current window are grayed out.
Page 29

Click View and select the window or items to display from the pull-down menu.
3 View
The same operations are available on the tool bar (p. 22).
Tool Bar
Toggles the display of the standard tool bar (top) and
window display tool bar (left).
EVENT LIST
Window
Opens the event list window.
You can re-order the displayed list by selecting Sort
by Time (–), Sort by Time (+) or Sort by Priority.
(p. 53)
EVENT DATA
Window
Opens the event details window.
You can select the following window data types:
• Voltage/Current Waveform Window
• Voltage/Transient Waveform Window
• Voltage Waveform Window
• Current Waveform Window
• High-order harmonics
• Vector Window
• DMM Window
• Harmonic Bar Graph Window
• Harmonic List Window
(p. 83)
ITIC Window
Opens the ITIC Window.
An EVT file containing voltage swell, dip or interruption data must be loaded in order to display this window.
(p. 95)
Open new TIME
PLOT Window
Opens up to ten new TIME PLOT windows.
You can select the following window data types:
• RMS Window (Trends)
• Voltage Window (Detailed Trends)
• Harmonics Window
• Interharmonics Window
(p. 40)
Delta V10 Flicker Window
Opens the Delta V10 Flicker Window.
(An FLC file of Delta V10 flicker data m ust be loaded
in order to display this window)
(p. 100)
IEC Flicker
Window
Opens the IEC Flicker Window.
(An FLC file of IEC flicker data must be loaded in order to display this window)
(p. 101)
Voltage
Fluctuation
Event Graph
Opens the Event Voltage Fluctuation Window (The
selected event must include an event voltage fluctuation graph WDU file in order to dis play this wind ow.)
PW3198, 3196
(p. 89)
3197
(p. 115)
Inrush Current
Event Graph
Opens the Inrush Current Graph Window.
(The selected event must include a rush current
graph INR/WDU file in order to display this window.)
PW3198
(p. 89)
3197
(p. 116)
Integral Power
Window
The Integral Power opening dialo g is dis pl ay ed, and
after setting, the Integral Power window
appears.
PW3198, 3196
(p. 92)
3197
(p. 117)
Demand
Window
The Demand opening dialog is displayed, and after
setting, the Demand Window appears.
PW3198, 3196
(p. 94)
3197
(p. 118)
A and B cursor
Select to demarcate a span or view values at cursor
positions.
(p. 38)
EN50160
Switches between normal and EN50160 display
modes.
(p. 102)
Display Status
Screen...
Displays the settings on the Hioki PW3198,3197,
3196.
(p. 63)
Application
Appearance
Changes the application's appearance.
19
Chapter 3 Basic Operations
Page 30

20
The menu displayed depends on the selected window.
Click EVENT LIST, EVENT DATA, TIME PLOT or ITIC to select a window from the corresponding
pull-down menu.
You can also right click and select a window to switch to from the pop-up menu.
4 EVENT LIST/ EVENT DATA/ TIME PLOT/ ITIC
EVENT LIST
Sort by Time (-)
(p. 53)
Sort by Time (+)
Sort by Priority
Order of CH
Add Tab (p. 56)
Tabs (p. 56)
ITIC
Limit Value Curve... (p. 95)
TIME PLOT
RMS (TREND) (p. 43)
VOLTAGE
(DetailTrend)
(p. 44)
HARMONICS
(Harmonic Fluctuation s)
(p. 45)
INTERHARM
(Inter-Harmonic Fluctuations)
(p. 46)
Event Distribution
Graph
(View the event distribution as a graph.)
(p. 50)
Import
(Display other measurement data at the same
time.)
(p. 42)
EVENT DATA
VOLTAGE/CURRENT
WAVEFORM
(p. 59)
VOLTAGE/ TRANSIENT
WAVEFORM
(p. 60)
VOLTAGE WAVEFORM (p. 61)
CURRENT WAVEFORM (p. 62)
High Order harmonics (p. 87)
VECTOR (p. 84)
DMM (p. 84)
HARMONICS BAR
GRAPH
(p. 85)
HARMONICS LIST (p. 86)
FFT Analysis (p. 88)
Chapter 3 Basic Operations
Page 31

21
Click Report and select from the pull-down menu.
5 Report
Report Wizard
Sets the conditions for creating a
report.
(p. 66)
User Report
Selects customized us er report output.
You can also customize application
menus.
(p. 73)
All Data
All TIME Plot
TP Voltage & Current
Integrat ed Power
& Demand
Harmonics
List & Waveforms All
Events
Flicker
EN50160
Selects a standard report output
format.
(p. 73)
Click Window and select from the pull-down menu.
6 Window
The same operations are available on the tool bar (p. 22).
Tile
Arranges display of all open
windows.
(p. 25)
Click Help and select from the pull-down menu.
7 Help
9624-50 PQA-HiView Pro Help... Displays the instruction manual
Version of 9624-50 PQA-HiView Pro... Displays version information
Chapter 3 Basic Operations
Page 32

22
1 Open (p. 15) 7 Save integrated settings file (p. 33)
2 Download (p. 111) 8 Tile (p. 25)
3 Re port Wizard (p. 66) 9 A and B cursors (p. 38)
4 Print (p. 64) 10 Switch to EN50160 Window (p. 102)
5 Copy (p. 75) 11
Displays the previous set of
data created with the repeated
recording function.
(p. 16)
6 Open integrated settings file (p. 33) 12
Displays the next set of data
created with the repeated recording function.
(p. 16)
Tool bar (standard)
12345678910
1112
1 Show/hide EVENT LIST Window (p. 53)
2 Show/hide EVENT DATA Window (p. 57)
3 Show/hide ITIC Window (p. 95)
4 Open new TIME PLOT Window (p. 40)
5 Open Delta V10 Flicker Window (p. 100)
6 Open IEC Flicker Window (p. 101)
7 Open Voltage Fluctuation Event Graph (p. 89)
8 Open Inrush Current Graph (p. 89)
9 Open Integrated Power Window (p. 92)
10 Open Demand Window (p. 94)
11 Open EN50160 Overview Window (p. 94)
12 Open EN50160 Harmonic Window (p. 106)
13
Open EN50160 Measurement Result Classification
Window
(p. 108)
14 Open EN50160 Signaling Window (p. 107)
15 Open Status Window (p. 63)
Tool bar (window)
1
2
3
4
5
6
7
8
9
10
11
12
13
14
15
Chapter 3 Basic Operations
Tool Bar Operations
Page 33

Changing Windows
When a Time Plot window is active in step 1 above
Select the window to s witch to fro m the pop -up menu.
2 Click
A pop-up menu appears whe n you right click on a window.
1 Right Click
You can change the selected window to a different window.
Activate the window whose contents you wish to switch by cli cking it.
1
The selected active window’s type is shown to the right of the View menu.
Click the window name for the selected active item and select the window to switch to from
2
the pull-down menu.
23
Chapter 3 Basic Operations
The active window is replaced.
You can also select from the pop-up menu.
Page 34

24
Windows for analyzing data from the PW3198
Window Name See Page
Event List Window (p. 53)
Time Plot
RMS (Trends) (p. 43)
Voltage (Detailed Trends) (p. 44)
Harmonics
(Harmonic Fluctuations)
(p. 45)
Interharm
(Inter-Harmonic Fluctuations)
(p. 46)
Event Data
Window
Voltage/Current (p. 59)
Voltage/Transient (p. 60)
Voltage (p. 61)
Current (p. 62)
High-order Harmonics
Graph
(p. 87)
Vector (p. 84)
DMM (p. 84)
Harmonics Bar Graph (p. 85)
Harmonics List (p. 86)
ITIC Window Tolerance Cu rve (p. 95)
Delta V10 Flicker Window (p. 100)
IEC Flicker Window (p. 101)
Event Voltage Fluctuation/Inrush Current
Graph Window
(p. 89)
Integrated Power Window (p. 92)
Demand Window (p. 94)
EN50160
Window
Overview (p. 104)
Harmonic (p. 106)
Measurement Result
Classification
(p. 108)
Status Window (p. 63)
Windows for analyzing data fr om the 3197
Window Name
See
Page
Event List Window (p. 53)
Time Plot
RMS (Trends)
(p. 43)
Voltage (Detailed Trends)
(p. 44)
Event Data
Window
Voltage/Current
(p. 59)
Voltage
(p. 61)
Current
(p. 62)
Voltage Fluctuation Event Graph
(p. 115)
Inrush Current Event Graph
(p. 116)
Integrated Power Window
(p. 117)
Demand Window
(p. 118)
Status Window
(p. 63)
Windows for analyzing data fr om the 3196
Window Name
See
Page
Event List Window (p. 53)
Time Plot
RMS (Trends) (p. 43)
Voltage (Detailed Trends) (p. 44)
Harmonics
(Harmonic Fluctuations)
(p. 45)
Interharm
(Inter-Harmonic Fluctua-
tions)
(p. 46)
Event Data
Window
Voltage/Current (p. 59)
Voltage/Transient (p. 60)
Voltage (p. 61)
Current (p. 62)
Vector (p. 84)
DMM (p. 84)
Harmonics Bar Graph (p. 85)
Harmonics List (p. 86)
ITIC Window Tolerance Curve (p. 95)
Delta V10 Flicker Window (p. 100)
IEC Flicker Window (p. 101)
Voltage Fluctuation Event Graph (p. 89)
Integrated Power Window (p. 92)
Demand Window (p. 94)
EN50160
Window
Overview (p. 104)
Harmonic (p. 106)
Signaling (p. 107)
Measurement Result
Classification
(p. 108)
Status Window (p. 63)
Chapter 3 Basic Operations
Window List
Page 35

Chapter 3 Basic Operations
Arranging Windows (Window Layout)
All currently open windows can be displayed by arranging the appli cation's windows.
Click the (Tile) button or select Window – Tile from the menu bar.
25
Page 36

26
Chapter 3 Basic Operations
Adding TIME PLOT windows
You can add TIME PLOT windows.
Click the button (to open a new TIME PLOT window) or select View – Open new TIME PLOT
Window from the menu bar. You can also right-click and select the command from the pop-up
menu.
TIME PLOT windows added to the screen.
Page 37

27
Tabs will be added.
You can add up to 10 windows.
Chapter 3 Basic Operations
You can add up to 10 TIME PLOT windows. When the number of windows that can be displayed is
exceeded, new windows will be added as tabs.
Page 38

28
right-click
The window is disp layed as a
separate window.
Chapter 3 Basic Operations
Undocking measurement windows from the main window
Measurement windows other than TIME PLOT windows can be undocked from the main window
and displayed as separate (floating) windows. Right-click on the title bar of the measurement window you wish to display as a separate window and select Floating from the pop-up menu.
The selected measurement window will be displayed as a separat e (floating) window.
You can also undock a window by dragging its title bar to the position at which you wish it to be displayed. You can also double-click the title bar.
Page 39

29
right-click
The window will be docked in the main window.
Chapter 3 Basic Operations
Docking a floating measurement window in the main window
You can dock a separate (floating) measurement window in the main wind ow. Right-click on the title
bar of the separate measurement window and select Docking from the pop-up menu.
The selected measurement window will be docked in the main window.
You can also double-click title bar.
Page 40

30
Indicates the docking position
on each main window.
Indicates the docking position
on each measurement window.
Chapter 3 Basic Operations
Specifying the docking position of measurement windows
You can specify the docking position of measurement windows.
Drag the title bar of the measurement window, align it with the cursor shown on the main window to
specify the desired docking position, and drop the window .
Example: When the "4" application appearance has been selected
Page 41

31
right-click
Hidden measurement window
Move the mouse poi nter to the tab t o
display the measurement window.
Chapter 3 Basic Operations
Hiding a specific measurement window
You can temporarily hide a specific measurement window in order to display other measurement
windows at a larger size. Click the button (to automatically hide the window) at the top right of
the screen. You can also right-click on th e t itle bar of the measur ement window y ou wi sh to hi de a nd
select Auto Hide from the pop-up menu.
The measurement window will be hidden and shown as a tab at the edge of the main window.
Moving the mouse pointer to the tab of a hidden measurement window will cause the window to be
redisplayed. The position and size of other measurement windows will not be affected.
Page 42

32
Chapter 3 Basic Operations
Saving and Loading integrated settings file
About integrated settings file
The PQA-HiView Pro can save and reload the following settings as a integrated settings file.
After saving a integrated sett ings file, you can reload it to vie w data or create re port s using the same
settings as when the file was saved. The types of settings files that can be saved are different for
the Hioki PW3198, 3196 and 3197.
The procedure described here is for saving and loading integrated settings file. Refer to the indicated reference pages for the procedures to save and load discrete (non-integrated) files.
Settings File
Report Wizard Settings File .RPF
User-Defined Curve Settings File .UCV
Measurement Result Classification
Settings File
integrated settings file (This file
type combines all three of the
above file types, although the Hioki
3197 supports only the Report
Wizard Settings File data.)
File Ex-
tension
.ESP
.QAP
File Contents
(Report Wizard Window) Report ou tput item
settings can be saved.
(Curve Editing W indow) Upper and lower limit
curves can be edited and saved.
(EN50160 Measurement R esult Classification
Editor Window) Different classification tables
for EN50160 me asurem ent r esults can be edited and saved.
All data defined for the User-defined Curve
Settings file, Measurement Result Classification file and Report Wizard Settings file are
stored together.
PW3198
, 3196
3197
−
−
Refer-
ence
(p. 66)
(p. 97)
(p. 109)
(p. 33)
Specify the Save Destination for the integrated settings file Beforehand
The default save destination is the My Documents folder.
By specifying another sa ve destination before savi ng the integrated settings file, all settings files will
be saved to the new destination in the future.
Select File – Change of Setting Data Storage Folder from the menu bar.
1
The Open dialog box opens.
Select the folder in which to save integrated settings file, and click the OK button.
2
Page 43

Chapter 3 Basic Operations
Saving a integrated settings file
The data for each type of settings file is combined and stored in a single file.
Click the (Save integrated settings file) button or select File – Save integrated settings
1
file from the menu bar.
The Save dialog box opens.
33
Enter the file name to be saved in the dialog, and click Save.
2
The current settings are saved in the specified file.
Loading a integrated settings file
Click the (Open integrated settings f ile) button or select File – Open integrated set tings
1
file from the menu bar.
The Open dialog box opens.
Select the name of the file to open in the dialog, and click Open.
2
The settings loaded from the file are applied to each setting item.
Page 44

34
Chapter 3 Basic Operations
Page 45

35
Enlarge the Y-axis Enlarge the X-axis (1cycle/div:1 period/div)
Chapter 4 Analyzing Measurement Data
Analyzing
Measurement
Data Chapter 4
Displaying Graphs
Enlarging and scrolling graphs
To enlarge a graph
Activating the graph window displays a dedicated toolbar. Select the item you wish to change from
the pull-down menu on the toolbar.
TIME PLOT enlarging the X-axis
Grid units : Select the desired display interval for the graph scale from the right menu.
1 day/window width : Displays the graph so that the width of the window is equivalent to one day.
1 week/window width: Displays the graph so that the width of the window is equivalent to one week.
Display all : Displays the graph so that all data fits in the window.
AB cursor range : Displays the range of data selected by the A and B cursors in one window.
User setting : Rotate the mouse wheel while holding down the Ctrl key for fine-grained
control over the graph scale.
Page 46

36
Scrollbars
You can scroll by rotating the mouse wheel.
You can also scroll b y click ing and grabbi ng the
window.
Move the mouse
pointer to the area you
wish to enlarge or reduce and rotate the
mouse wheel while
holding down the Ctrl
key to enlarge or reduce that part of the
graph.
Drag the mouse while holding down
the Ctrl key to enlarge the graph.
Chapter 4 Analyzing Measurement Data
To scroll a graph:
You can scroll up, down, left, and right on the graph window by movi ng the mouse pointer to the top
of the window and dragging. You can also scroll left, right, up, and down by dragging the scrollbars
on the right and bottom of the window.
Tip:
Dragging the mouse while h olding down the Ct rl key o n t he keyboard enl arges t he r ange over which
you moved.
Rotating the mouse wheel while holding down the Ctrl key on the keyboard enlarges or reduc es the
display around the mouse pointer's position.
Page 47

Chapter 4 Analyzing Measurement Data
Specifies the channel to display.
Specifies the color of displayed lines.
Specifies the thickness of displayed lines.
Changing the Displayed Channels, Line Colors, and Thicknesses
Select Waveform Display Settings from right-click and displayed pop-up menu on the graph
1
window.
37
Specify the displayed channel, line, and thickness settings on the Settings dialog box.
2
Page 48

38
Cursor A: Light Blue
Cursor B: Purple
Between
A and B cursors
Cursor B (Purple)
Cursor A (Light Blue)
Delta V10 alarm output period (PW3198 only)
Indicates periods for whic h the Delta V10 alarm
was output.
The values at the
cursor positions in
the active window
are displayed.
Time and numerical
values at A and B cursor locations
Maximum
Average
Minimum
Differences between A and B data (B – A)
Time of 1 interval has been added to the time
Chapter 4 Analyzing Measurement Data
Viewing Measurement Data as Numerical Values (Cursor Measurement)
The values measured at the A and B cursor positions (cursor values) can be displayed numerically.
Maximum, minimum and average values within a span of measurement data (between cursors) can
also be checked by demarcating the span with the cursors.
Measurement values can be confirmed in the A/B cursor dialog. An image of the displayed numerical values can be copied to other applications.
Windows supporting cursor measurement: Waveform and Graph windows
Example: Viewing measurement values in a Time Plot window.
Click the (A and B cursors) button or select View – A, B cursor from the menu bar.
1
You can also right click and select from the pop-up menu.
The A/B cursors appear in the window, and a dialog box indicates values at the cursor positions. Displayed con-
tents differ according to the type of data displayed.
You can move the cursors either by dragging them or by pressing the left and right cursor
2
keys on the keyboard.
To view the maximum, minimum, and average values for the desi red period, mov e the A and
3
B cursors to the respective positions to specify the appropriate range.
Page 49

Chapter 4 Analyzing Measurement Data
A/B cursor reset
Moves the A and B cursors to the beginning
and end of the data, respectively.
A cursor
Summon to [A] window
Moves the A cursor to the window
To [A] zero-cross position
Moves the A cursor to the zero-cross position.
To maximum value position
Moves the A cursor to the maximum value.
To previous event position
Moves the A curs or to the pre vious event position.
To minimum value position
Moves the A cursor to the minimum value.
To next event position
Moves the A cursor to the next event position.
B cursor
A/B cursor interval lock
Locks the interval between the A and B cursors.
Horizontal cursors
Displays horizontal cursors and Y-axis values.
The results displ ayed at the A and B cursors differ from produ ct display
values in the following circumstances:
Error notation:
Example: A value is displayed even when the PW3198 displays 0.000 Hz.
Horizontal cursor on the Y-axis on the graph
Horizontal cursors
Moving the A and B cursors to the position whose measured values you wish to check
You can use the toolbar buttons to move the A and B cursors to the desired positions.
4
39
You can view measured values for the graph's Y-axis by moving the cursor vertically.
5
To display the horizontal cursor on the Y-axis on the graph, press the U
bar.
To move the horizontal cursor on the Y-axis, align the mouse pointer with the cursor and
drag it up or down as desired.
button on the tool-
Page 50

40
Scrolls the window
Move a scroll box or click within the scroll bar.
When scrolling horizontally, all open Time Plot windows
scroll together.
Click an event marker to view an event phenomenon in the other windows.
See: "Viewing Event Phenomena" (p. 50)
Time Plot Window
Chapter 4 Analyzing Measurement Data
Viewing a Time Series Graph [TIME PLOT]
Data measured with the Power Quality Analyzer can be displayed as a time series graph (Time Plot
window). The program’s Time Plot windows correspond to each Time Plot screen on the Power
Quality Analyzer.
The following types of Time Plot windows can be displayed up to ten windows at a time.
RMS (Trends) Window (p. 43)
VOLTAGE (Detailed Trends) Window (p. 44)
HARMONICS Window (Hioki PW3198, 3196 only) (p. 45)
INTERHARM (Interharmonics) Window (Hioki PW3198, 3196 only) (p. 46)
Opening and Switching Time Plot Windows
Load the measurement data.
1
See: "Loading Data" (p. 15)
Click the (Open Time Plot Window) button or select View – Open new TIME PLOT
2
window from the menu bar.
A Time Plot Window opens.
You can open up to ten windows by clicking the button or selecting from the menu bar repeatedly.
Page 51

Chapter 4 Analyzing Measurement Data
Switching Windows
Activate the Time Plot window to be switched, and select the desi red windo w to displ ay fr om
3
the TIME PLOT menu.
You can also right click and select from the pop-up menu.
Which windows can be selected depends on the measured data type.
Viewing Measurement Data as Numerical Values (Cursor Measurement)
Measurement values can be confirmed using the cursors. In addition, the minimum, maxi-
4
mum and average values over any span can be displayed.
See: "Viewing Measurement Data as Numerical Values (Cursor Measurement)" (p. 38)
The 30-minute average for the voltage in the cursor-selected range can be output to a CSV file. Activate the
TIME PLOT window, right-click the mouse, and select Output a voltage mean value during 30min... from the
pop-up menu. This functionality is available when the Voltage mean value during 30min checkbox is selected
under Options on the Edit menu.
41
Page 52

42
Chapter 4 Analyzing Measurement Data
Loading other measurement data
Other measurement data can be displayed at the same time.
5
Activate the TIME PLOT window , right-clic k the mouse, and selec t Import
menu.
… from the pop-up
Specify the measurement data you wish to display.
The data is displayed as the IMPORT waveform.
Page 53

Chapter 4 Analyzing Measurement Data
Maximum MAX
(Blue)
Average AVG
(Yellow-Green)
Minimum MIN
(Red)
Scrolls the window
Display item
Channel
U2-U1, I1+I2 indicate the results of the calculations shown.
MIN/ MAX/ AVG/ all
Y-axis scal e
X-axis scal e
Window tool bar
See: For more information about display items, see Appendix 5.( p.A13)
Viewing RMS Fluctuations (Trends) [TIME PLOT – RMS]
Open a Time Plot window.
1
See: "Opening and Switching Time Plot Windows" (p. 40)
Activate the Time Plot window and sel ect RMS(Trends) from the TIME PLOT menu.
2
You can also right click and select from the pop-up menu.
The RMS(Trends) window opens.
43
Changing Displayed Contents
When the RMS(Trends) window is active, it’s own tool bar is displayed.
3
Select the items you want to change from the pull-down menus in the RMS window’s tool
bar.
Page 54

44
CH1 (Red)
CH2 (Yellow-Green)
CH3 (Blue )
CH4 (Light Blue)
Scrolls the window
Channel
Y-axis scale
X-axis scal e
Window tool bar
Display item
(PW3198 only)
See: For more information about display items, see Appendix 5. ( p.A13)
Chapter 4 Analyzing Measurement Data
Viewing Voltage Fluctuations (Detailed Trends) [TIME PLOT – VOLTAGE]
Open a Time Plot window.
1
See: "Opening and Switching Time Plot Windows" (p. 40)
Activate the Time Plot window and select VOLTAGE data(Detailed Trends) from the TIME
2
PLOT menu.
You can also right click and select from the pop-up menu.
The Voltage data window opens.
Voltage fluctuation data consists of pairs of maximum and minimum values for every measurement interval.
Therefore, expan ding th e horiz ont al sc ale rev eals th e dat a as a series of vertica l lines betwee n ea ch p air of m aximum and minim um values at each me asu rem en t i nte rval. There is no h oriz on t al line through the s p ac e bet w een
measurement intervals.
With the PW3198, voltage-synchronized current and frequency fluctuations can be viewed.
Changing Displayed Contents
When the Voltage data window is active, it 's own tool bar is displayed.
3
Select the items you want to change from the pull-down menus in the Voltage window’s tool
bar.
Page 55

Chapter 4 Analyzing Measurement Data
Displayed harmonic orders
can be set from the tool bar.
Scrolls the window
Displayed orders
Display item
X-axis scale
Window tool bar
Displayed orders
Up to six harmonic orders (from 0 or 1 to 50) can be selected for display together.
The vertical axis has a fixed logarithmic scale.
Y-axis scal e
(fixed)
See: For more information about display items, see Appendix 5. ( p.A13)
MAX/MIN/AVG
Viewing Harmonic Fluctuations
(Hioki PW3198, 3196 only) [TIME PLOT – HARMONICS]
Open a Time Plot window.
1
See: "Opening and Switching Time Plot Windows" (p. 40)
Activate the Time Plot window and sel ect HARMONICS from the TIME PLOT menu.
2
You can also right click and select from the pop-up menu.
The HARMONICS window opens.
45
Data from 400 Hz measurements can be analyzed up to the 10th harmonic order.
Phase angle display
:Displays the voltage-current phase difference with [MAX/MIN/AVG].
avg :Displays the voltage-current phase difference using average values [AVG].
Uphase/Iphase :Displays the voltage/current phase angle using average values [AVG].
Changing Displayed Contents
When the Harmonics window is active, it's own tool bar is displayed.
3
Select the items you want to change from the pull-down menus in the Harmonics window's
tool bar.
Page 56

46
Displayed harmonic orders
can be set from the tool bar.
Scrolls the window
Display item
Y-axis scal e
(fixed)
Window tool bar
Displayed orders
Up to six inter-harmonic orders (from 0.5 to 49.5) can be selected for display together.
The vertical axis has a fixed logarithmic scale.
X-axis scale
See: For more information about display items, see Appendix 5. (
p.A13)
MAX/MIN/AVG
Chapter 4 Analyzing Measurement Data
Viewing Inter-Harmonic Fluctuations
(Hioki PW3198, 3196 only) [TIME PLOT – INTERHARM]
Open a Time Plot window.
1
See: "Opening and Switching Time Plot Windows" (p. 40)
Activate the Time Plot window and select INTERHARM from the TIME PLOT menu.
2
You can also right click and select from the pop-up menu.
The INTER-HARMONIC window opens.
Changing Displayed Contents
When the Interharm window is active, it's own tool bar is displayed.
3
Select the items you want to change from the pull-down menus in the Interharm window's
tool bar.
Page 57

47
Chapter 4 Analyzing Measurement Data
Comparing Multiple TIME PLOT Windows
Multiple RMS value fluctuation(Trends) window graphs being displayed on the TIME PLOT window
can be superimposed on the display. This functionality allows you to easily compare fluctuations.
Activate the waveform you wish to superimpose.
1
Select Overlap Wave Graph from the pop-up menu.
2
Page 58

48
Chapter 4 Analyzing Measurement Data
The semi-transparent waveform moves with the cursor. Move it over the graph on top of
3
which you wish to superimpose it to compare the gra phs.
You can fine-tune the graph display in the vertical and horizontal direction s wi th th e c urs or k ey s wh ile the graphs
are superimposed.
The superimposed graphs can be copied into the clipboard by right clicking the mouse or pressing Alt + Print-
Screen on the keyboard.
The darkness of the superimp os ed ima ges can be adjus ted w ith the mo us e whe el.
Page 59

Chapter 4 Analyzing Measurement Data
You can scroll the screen
by per day units.
Viewing 1 day / 1 week’s data
You can easily display 1 day or 1 week’s data. You can also scroll per day.
Open the TIME PLOT window, and from the X-axis scale menu select 1 day / screen size or 1
week / screen size.
The screen will be automatica lly adjusted to the scale for 1 day o r 1 week’s data to be displayed, and the A/B
cursors will auto matically be ON and the left end of the graph will be displayed at the start of the pag e break.
49
If the A/B cursors are left in this position while measurement data is stored in a CSV file (p. 76),
you can create a CSV file with 1 day’s worth of data.
Page 60

50
Chapter 4 Analyzing Measurement Data
Viewing Even t Phenomena
An event name or marker is displayed in each window (Event Marker function).
Each displayed window is interlinked, so by clicking an event's name or marker, you can view other
characteristics related to that event in other windows.
Measurement data from the Hioki PW3198, 3196 is displayed differently than that from the 3197.
Event Display
Event Viewing Windows
Event List Window
Time Plot Window
Voltage Fluctuation
Event Window
Inrush Current Graph
Window (Hioki PW3198,
3196 only)
Event Data Window
Event Occurrence
Event items indicate the contents of events. You can visually check the frequency of events.
(The display c olor va ries with
the event type. For more infor-
mation, see "Appendix 6
Event Item Notation".
Event markers are displayed
at the times that event occurred.
Displays the message,
“Specified file xxx does not
exist.”
Displays the waveform for the event selected in another window.
Event markers (yellow-green) are displayed at event occurrences.
Voltage Fluctuation Graph
(WDU event)
The WDU column shows
WDU events.
(Blue)
Event markers are displayed
at the times when voltag e fluctuations occurred.
Displays the waveform for the event selected in another window.
Inrush Current Graph
(INRUSH event)
(Hioki PW3198, 3196 only)
The INRUSH column shows
INRUSH events.
(Pink)
Event markers are displayed
at the times tha t inrush current
occurred.
ITIC Window
(Hioki 3196 only)
−−−−−
(CH1: Red)
(CH2: Yellow-Green)
(CH3: Blue)
−−−−−
Page 61

51
Example: Viewing event phenomena in a Time Plot window
Event Marker
Click
Click on overlapping event markers to display a m enu on the graph.
Select an event marker from the
menu.
If more than 30 event markers
overlap, they are displayed in submenus of up to 30 markers each.
When multiple event markers overlap
Click
The selected event marker
becomes hollow.
Example: Displaying the event distribution
Select Event Distribution
from the TIME PLOT window
pop-up menu. To disa ble the
display, deselect Event Distribution.
The distribution of event
occurrence is shown on
the graph, allowing you
to easily ascertain in
which time period the
most events occurred.
Chapter 4 Analyzing Measurement Data
Page 62

52
TIME PLOT Window
Event List
Window
TIME PLOT Window
Voltage Fluctuation
Event Graph Window
Example: Graph of a voltage fluctuation event (WDU) in measurement data from Hioki PW3198
(Red) Event occurrence on CH1
(Yellow-Green)Event occurrence on C H2
(Blue) Event occurrence on CH3
To view the same event phenomenon in
other windows:
Activate the window and click the desired
event marker. The selected event marker
blinks.
WDU Indicates that a voltag e fluctuation
event graph exists
INRUSH Indicates that an inrush current
graph exists (Hioki PW3198, 3197
only)
To view the same event phenomenon in
other windows:
Activate the window and click the desired
event item, or select it with the up- or down-arrow keys on the keyboard. The background
color of the selected event list will change.
Event Content
(Blue) Voltage fluctuatio n event (WDU) occurr ence
(Pink) Inrush current event (INRUSH) occurrence (Hi oki
3197 only)
(Red) An event occurrence other than the above types
To view the same event phenomenon in other windows:
Activate the window an d cli ck the desi red eve nt marker, or select it with the up- or down-arrow keys on the keyboard. The
selected event marker becomes hollow ( ).
(Event Markers)
Event Occurrences
Event List Window
ITIC Window (Hioki 3196 only)
(Blue) Voltage fluctuation event
(WDU) occurrence
(Pink) Inrush current event
(INRUSH) occurrence
(Hioki 3197 only)
(Red) An event occurrence other
than the above types
Displays the graph for the event selected in another window.
When an inrush current event marker is
selected in another window, the inrush
current screen appears.
(Hioki PW3198, 3197 only).
Voltage Fluc t ua tion Event Wi nd o w
(Event Marker)
Event Occurrence
Click to display
the event graph.
Event Occurrences
(Event Markers)
Event Occurrences
ITIC Window
(Hioki PW3198,
3196 only)
(Yellow-Green)..... Location at which event occurred
Displays the locations at which events occurred.
Event Data Window
(Event marker)
Event occurrence
Chapter 4 Analyzing Measurement Data
Page 63

53
+ Displays event details as a tree. Click + to toggle the display.
No. Event ID.
Time and
date
Time and date at which event occurred.
Event items Event type.
ch Channel on which event occurred.
IN/OUT Event IN and OUT.
WDU Indicates there is a voltage event fluctuation graph.
INRUSH Inrush current graph display.
Event period Period during which the event state persisted.
Peak value Waveform peak value display (not shown for RMS data).
Worst value RMS value display.
Others Transient Worst value detection time + count + event continuation period.
Swell/dip/interruption
Worst value detection time + worst value detection channel +
measured value.
Other Worst value detection time + measured value.
Click an event, or se lect us ing the up/dow n arrow ke ys on th e key board to v iew the even t pheno menon
in other windows.
See: "Viewing Event Phenomena" (p. 50)
Binary data from the HiTETER is displayed for worst values and
measured values. Thes e displays may differ fro m DMM and TIME PLOT
notation. Additionally, values that are not possible during normal operation
are saved in data when errors occur, and those values are displayed.
Chapter 4 Analyzing Measurement Data
Viewing Events as a List [EVENT LIST]
Event occurrences within data measured with the Hioki PW3198, 3196 can be displayed as a list
(the Event List window).
The Event List window is equivalent to the EVENT – LIST screen on the Hioki PW3198, 3196.
You can re-order the displayed list by selecting Sort by Time (–), Sort by Time (+) or Sort by Pri-
ority.
Load the measurement data.
1
See: "Loading Data" (p. 15)
To display the Event List window, the loaded data must include an EVT file.
Click the (Show/hide EVENT LIST window) button or select View – EVENT LIST Win-
2
dow from the menu bar .
The Event List window opens.
Page 64

54
Chapter 4 Analyzing Measurement Data
Viewing ev ent details
Click + on the Event List window.
3
Multiple events included when the event occurred are displayed.
Click + again to display only the representative event.
Re-Ordering the Display of Events
Make the Event List window active, and select Sort by Time (–), Sort by Time (+), Sort by
4
Priority (Hioki 3196 only)
You can also right click and select from the pop-up menu.
The list is re-ordered according to your selection.
You can click a column heading to sort the list in ascending or descending order for that column.
or Sort by Channe l from the EVENT LIST menu.
To revert the display, select All from the pop-up menu over the column in question.
Page 65

Chapter 4 Analyzing Measurement Data
Specifies the filter target.
Displays the top 10 candidates.
Specifies the filter conditions.
Displaying only specific e vents
Move the mouse to the item , rig h t-c li ck , an d select Filter from the pop-up menu.
5
To return to the original display, right-click on the item and select All from the pop-up menu.
The [Execute Filt er] di al og bo x wil l be di spl aye d. Se t the f il ter con diti ons as de sir e d and cli ck the
6
OK button.
55
Counting events
Right-click the mouse on the Event List window and select Event Counter on the pop-up
7
menu.
The Event Counter dialog box is displayed with an event count for each item.
8
Page 66

56
Up to three event lists with different conditi ons
can be created. You can click the tab to switc h
the display. Select Add to add a new even t list.
Up to three lists can be added. You can also
add a new list by selecting Event List - Add
Tab from the menu, and y ou can displ ay a lis t
of all tabs currently being displayed by selecting Event List - Tabs.
Chapter 4 Analyzing Measurement Data
Switching the Event List window
9
Page 67

57
Click an event marker or an event in the Event List to display a graph of the event.
See: "Viewing Event Phenomena" (p. 50)
Event data window
Chapter 4 Analyzing Measurement Data
Viewing Event Measurement Data [EVENT DATA]
Data measured with the Hioki PW3198, 3196 upon the occurrence of an event can be displayed as
a graph (Event Data window).
The Event Data window is equivalent to the VIEW screen di splayed when you sel ect an event in t he
Event List on the Hioki PW3198, 3196 and press the ENTER key.
The Event Data window can be switched between the following ten types.
VOLTAGE/CURRENT Window (p. 59) VECTOR Window (p. 84)
VOLTAGE/TRANSIENT Window (p. 60) DMM Window (p. 84)
VOLTAGE Window (p. 61) HARMONICS BAR GRAPH Window (p. 85)
CURRENT Window (p. 62) HARMONICS LIST Window (p. 86)
In this manual, the above windows are collective ly cal led “Event Data windows”.
Opening and Switching Event Data Windows
Load the measurement data.
1
See: "Loading Data" (p. 15)
Click the (Show/hide EVENT DATA window) button or select View – EVENT DATA
2
Window from the menu bar.
The Event data window opens.
Page 68

58
Chapter 4 Analyzing Measurement Data
Switching Windows
Activate the Event Data window and select the desired window from the EVENT DATA
3
menu.
You can also right click and select from the pop-up menu.
Page 69

Chapter 4 Analyzing Measurement Data
Scrolls the window
CH1 (Red)
CH2 (Yellow-Green)
CH3 (Blue )
CH4 (Light Blue)
Window tool bar
Up to 14 cycles (50 Hz) ,
16 cycles (60 Hz) or 112
cycles (400 Hz) can be
analyzed.
Voltage waveform
Current waveform
Y-axis scale of
voltage waveform
Y-axis scale of current waveform
X-axis scale of waveform
Move to previous
or next event
Time and numerical values at A and B cursor locations
Differences between A and B data (B – A)
Between A and B cursors
Cursor B (Purple)Cursor A (Light Blue)
The time difference between cursors is calculated using
internal data resolution of less than 0.001 seconds, but
the last digit (0.001 s) may not be exact.
Viewing Voltage/Current Waveforms [VOLTAGE/CURRENT]
Open the Event Data window.
1
See: "Opening and Switching Event Data Windows" (p. 57)
Activate the Event Data window and select the VOLTAGE/CURRENT window from the
2
EVENT DATA menu.
You can also right click and select from the pop-up menu.
The Voltage/Current Waveform window opens.
59
Viewing Measurement Data as Numerical Values (Cursor Measurement)
Measurement values can be confirmed using the cursors. In addition, the minimum, maxi-
3
mum and average values over any span can be displayed.
See: "Viewing Measurement Data as Numerical Values (Cursor Measurement)" (p. 38)
Page 70

60
Scrolls the window
CH1 (Red)
CH2 (Yellow-Green)
CH3 (Blue)
CH4 (Light Blue)
Click to display the
waveform to the left or
right of the transient.
Voltage waveform
Transient waveform
(Magnified)
Window tool bar
Y-axis scale of
voltage waveform
X-axis scale of
waveform
Y-axis scale of transient
waveform
X-axis scale of transient
waveform
Move to left transient
Move to right transient
Move to previous or
next event
Time and numerical values at A and B cursor locations
Differences between A and B data (B – A)
The wavelength is the reci procal of the time b etween
the A/B cursors.
Time data is 0 µs at the left end of the transient data.
Between A and B cursors
Cursor B(Purple)Cursor A (Light Blue)
Frequency 11.24 Hz
Chapter 4 Analyzing Measurement Data
Viewing Voltage/Transient Waveforms (PW3198, 3196) [VOLTAGE/TRANSIENT]
Open the Event Data window.
1
See: "Opening and Switching Event Data Windows" (p. 57)
The Voltage/Transient window can only be displayed when a TRN file is loaded.
Activate the Event Data window and select the VOLTAGE/TRANSIENT window from the
2
EVENT DATA menu.
You can also right click and select from the pop-up menu.
The Voltage/Transient Waveform window opens.
Viewing Measurement Data as Numerical Values (Cursor Measurement)
Measurement values can be confirmed using the cursors. In addition, the minimum, maxi-
3
mum and average values over any span can be displayed.
See: "Viewing Mea s urement Data as Numerical Values (Cursor Measurement)" (p . 38)
Page 71

Chapter 4 Analyzing Measurement Data
Scrolls the window
CH1 (Red)
CH2 (Yellow-Green)
CH3 (Blue)
CH4 (Light Blue)
Window tool bar
Up to 14 cycles (50 Hz),
16 cycles (60 Hz) or 112
cycles (400 Hz) can be
analyzed.
X-axis scale of waveform
Y-axis scale o f voltage waveform
Move to previous or next even t
Viewing Voltage Waveforms [VOLTAGE]
Open the Event Data window.
1
See: "Opening and Switching Event Data Windows" (p. 57)
Activate the Event Data window and select the VOLTAGE window from the EVENT DATA
2
menu.
You can also right click and select from the pop-up menu.
The Voltage window opens.
61
3
Viewing Measurement Data as Numerical Values (Cursor Measurement)
Measurement values can be confirmed using the cursors. In addition, the minimum, maximum and average values over any span can be displayed.
See: "Viewing Measurement Data as Numerical Values (Cursor Measurement)" (p. 38)
Page 72

62
Scrolls the window
CH1 (Red)
CH2 (Yellow-Green)
CH3 (Blue)
CH4 (Light Blue)
Window tool bar
Up to 14 cycles (50 Hz),
16 cycles (60 Hz) or 112 cycles
(400 Hz) can be analyzed.
X-axis scale of waveform
Y-axis scale of voltage waveform
Move to previous
or next event
Chapter 4 Analyzing Measurement Data
Viewing Current Waveforms [CURRENT]
Open the Event Data window.
1
See: "Opening and Switching Event Data Windows" (p. 57)
Activate the Event Data window and select the CURRENT window from the EVENT DATA
2
menu.
You can also right click and select from the pop-up menu.
The Current window opens.
Viewing Measurement Data as Numerical Values (Cursor Measurement)
Measurement values can be confirmed using the cursors. In addition, the minimum, maxi-
3
mum and average values over any span can be displayed.
See: "Viewing Mea s urement Data as Numerical Values (Cursor Measurement)" (p . 38)
Page 73

63
Example: Hioki PW3198 Status Window Example: Hioki 3197 Status Window
Chapter 4 Analyzing Measurement Data
Viewing Measurement Settings
Instrument settings recorded on the Hioki PW3198, 3196 or 3197 can be viewed in the Status window. Of course, the settings cannot be changed here.
The Status window can only be displayed when a SET file is loaded.
In addition, the EN50160 setting tab is not displayed unless EN50160 data is loaded
(Hioki 3196 only).
See: "Appendix 4 Measurement Settings and Instrument Status"
Click the (Status window Icon) button or select View – Display Status Screen from
1
the menu bar.
The Status window appears.
Select the tabs to view each setting.
2
Page 74

64
To print the time and date or comment in the
Time field (p. 65)
Select the content to be printed.
• Unselected: The field will be blank.
• Time: The printing time(date) will be printed.
• Text: The field will contain your entered text.
To print comments in the Comment field (p. 65)
Enter the contents to be printed (up to three lines).
To load the contents of a text file, click the Load a
comment file button.
Selects the printing
destination.
Starts printing.
Shows a preview of the printout.
Cancels printing.
To print a logo or comment in the Logo field (p. 65)
Select the logo or text to be printed.
• Unselected: The field will be blank.
• HIOKI Logo: Select an image file to print.
If you fail to s ele ct an im ag e, the HIO KI l og o i s prin ted.
• Text: The field will contain your entered text.
Select to include maximu m,
minimum and average values and channel information in the printout.
To print TIME PLOT measurement data across all measurement periods
Select the period you wish to print.
• Display area only: Prints one sheet including the display area only.
• All areas: Prints multiple pages including reduced views of all data windows.
Chapter 4 Analyzing Measurement Data
Printing Measurement Data
Each display screen can be printed out. In addition, all open Time Plot windows can be printed
together on one page.
Activate a window to be printed, and display the area to print.
1
The qualification for printing is that whatever is displayed will be printed as it appears.
Maximize windows for clearest printing of large quantities of data.
Click the (Print) button or select File – Print from the menu bar.
2
The Print Setup dialog box opens.
Select the items you need to print, and click the Print button.
3
Page 75

Printout Example
Logo Field
Time Field
Comment Field
Sample of an Event Waveform Printout
Paper setting: A4
Printing orientation: Portrait
The window type is automatically printed here.
65
Chapter 4 Analyzing Measurement Data
Page 76

66
Cursor B
(Purple)
Cursor A
(Light Blue)
Click
Chapter 4 Analyzing Measurement Data
Generating Reports
Reports are generated from loaded measurement dat a, and can be printed out or saved as rich text
format (.rtf) files.
Rich text format files can be loaded and edited in application programs such as Wordpad (supplied
with Windows), or Microsoft Word.
Reports can be generated by three methods.
Report Generation Method Details
Generate report contents automaticall y (Auto)
Generate report with specified contents
(Custom Settings)*
Generate report with specified detailed contents (Detailed Settings)*
* Report generation settings can be saved and reloaded as integrated settings files.
Report contents are generated without selecting output items.
Items that can be output with auto report generation are limited.
Report contents are generated by selecting output items.
Note that for trans ient waveform s, th e T ransie nt Wav eform selec tion
is available only when Worst Case is selected.
Report contents are generated from selected details of each output
item and channel.
See: "Report Output Items" (p. 70) for the items available for output in reports.
Confirm the span of data to be used in generating the report.
1
When the report wizard starts, the measurement data span is determined automatically from the current display
state and position of the cursors in the window.
Set the A/B cursor locations if you want the report to specify a particular waveform span.
See: "Viewing Mea s urement Data as Numerical Values (Cursor Measurement)" (p . 38)
If the A/B cursors are not enabled, the report is automatically generated using all loaded measurement data.
Click the (Report Wizard) button or select Report – Report Wizard from t he menu bar.
2
The Report Wizard – Start Page dialog box opens.
The Report Wizard cannot be started unless a window is already open.
Page 77

Chapter 4 Analyzing Measurement Data
Logo Field Output
Settings
• Unselected: The field will
be blank.
• HIOKI Logo: Select an
image file for output. If no
file name is selected, the
HIOKI logo is output.
• Text: The field will contain
your entered text.
The logo is output only when
printing. Logo data cannot be
output to a rich text format file.
Comment Field Output Settings
Enter the contents to be output (up to three lines).
To load the conten ts of a te xt file , c lic k the Lo ad a com-
ment file button.
Logo Field
Printout Example
Time Field
Comment Field
Starting Page No.
Specify the number for
the first page of report
output.
Time Field Output Settings
• Unselected: The field will be blank.
• Time: Outputs the time(date) of report generation.
• Text: The field will contain your entered text.
1 Click
2 Select
4 Select
5 Click
3 Select
Make settings in the Start Page dialog box.
3
1. Select a report generation method.
2. Set the starting and ending times of the data span to be reported.
(These are automatically set to match the loaded data when the Report Wizard starts, but you can change
them here.)
3. If report output is to include a demand graph, set the demand time span here.
4. Make settings for printing as occasion demands.
(Comments and other information can printed in the Logo, Time and Comment fields, shown below.)
5. Click Next.
If Auto is selected: The Report Wizard – Last Page dialog box opens.
If Custom Settings is selected: The Report Wizard – Individual Setting Page dialog box opens.(p. 68)
If Detailed Settings is selected: The Report Wiz ard – Detailed Setting Page dialog box opens.(p. 69)
67
Page 78

68
Preview
Displays a preview of printout
contents before printing.
Page Setup
Displays the Print dialog. Printer and paper selections can be
made here.
Prints a report.
Opens the Print dialog for
you to make printer settings
and print.
Saves a report to a rich text
format file.
Opens the Save RTF File
dialog where you c an specify
the save destination and
name.
After saving the rich text file,
opens the file with the default
application associated with RTF
files (Microsoft Word etc). You
can use the application to add
comments and other in formation.
Dialog Example for Hioki PW3198
1 Select
Settings can be saved and reloaded later.
You can save your report selections as a Report Wizard Settings file that you can simply reload whenever
you want to create another report with the same settings.
The Report Wizard Settings file contains all custom and detailed report output settings.
You can register save d settings on the menu bar. Once regis tered, you can pr int reports si mply by selecti ng
the item on the menu bar. See page (p. 73).
2 Click
Chapter 4 Analyzing Measurement Data
In the Last Page dialog, select whether to save or print the report.
4
Selecting Custom Settings
Make settings in the Individual Setting Page dialog box.
1. Select those items to be output in the report.
Note that Transient Waveform can be selected only when Worst Case is selected.
2. Click Next.
The Report Wizard – Last Page dialog box opens.
Printout Example: (p. 71)
Page 79

Selecting Detailed Settings
3196 3197
Page Setting Items Page Setting Items
1/4 Voltage Fluctuations, RMS Fluctuations 1/2 Voltage Fluctuations, RMS Fluctuations
2/4 Harmonic Fluctuations 2/2 Demand, Integrated Power
3/4 Interharmonic Fluctuations
4/4 IEC Flicker, Demand, Integrated Power
Settings can be saved and reloaded later.
For your convenience , you can save yo ur report se lections as a Report Wizard Sett ings file that you c an simply reload whenever you want to create anoth er report
with the same settings.
The Report Wizard Settings file contains all custom
and detailed report output settings.
You can register saved settings on the menu bar.
Once registered, you can print reports simply by selecting the item on the menu bar. See page (p. 73).
Example: Voltage and RMS fluctuations in the Hioki PW3198 dialog (page 1/4)
Loads the settings (SET ) file, after which
threshold data can be entered as the
reference line value.
Report output graph colors can be selected.
The Color Setting dialog box opens.
Graph colors set here are applied o nl y t o g r aph s
output in reports.
Select graph plotting of thresholds
and reference traces.
Graph plotting methods are selectable:
• Single
All channels are plotted on one graph, and output on one
page.
•
Division
One graph is divided into sections for each channel, and all
channel sections are arranged and output on one page.
•
Separate
Each channel is plotted on a separate graph, and output as
one graph per page.
1 Select
2 Click
Make settings in the Detail Setting Page dialog box.
1. Select those items to be output in the report.
2. Click Next.
The pages of displayed setting items depend on the loaded measurement data.
3. Click Next.
The Report Wizard – Last Page dialog box opens.(p. 68)
69
Chapter 4 Analyzing Measurement Data
Printout Example: (p. 72)
Page 80

70
Chapter 4 Analyzing Measurement Data
Report Output Items
*1. Report output items are fixed for Auto report gen eration, but are select able for Custom Setting s or Detaile d Settings
report generation.
*2. Transient Waveform can be selected only when Worst Case is selected.
*3. Output for each channel can be set independently.
: Can be output, ×: Cannot be output
Report Output Item
RMS Voltage Fluctuation
Graph
*1
*3
PW3198, 3196
Auto Custom Detailed Auto Custom Detailed
3197
*1
Output Contents
Outputs a graph of rms voltage fluctuation that can
*3
be displayed in a Time Plot window.
RMS Current Fluctuation
Graph
Voltage Fluctuation,
RMS Fluctuation,
Integral Power Graph,
Demand Graph
Harmonic Fluctuations,
Inter-harmonic Fluctua tions,
Flicker Graph
Voltage Total Harmonic
Distortion Level Graph
Current Total Harmonic
Distortion Level Graph
EN50160 Overview
EN50160 Signaling
EN50160 Harmonics
EN50160 Measurement
Result Classification
Worst Case
×
×
××
×
×
*3
×
*3
*3
*3
*3
×
×
× ×
× ×
× ×
Outputs a graph of rms current fluctuation that can
*3
be displayed in a Time Plot window.
Outputs a graph of integral power and demand
*3
that can be displayed in a Time Plot window.
Outputs a graph of Flicker that can be displayed in
a Time Plot window.
Outputs a graph of voltage total harmonic distor-
*3
tion levels that can be displayed in a Time Plot window.
Outputs a graph of current total harmonic distortion levels that can be displayed in a Time Plot window.
Outputs the contents displayed in the EN50160
Overview window.
Outputs the contents displayed in the EN50160
Signaling window.
Outputs the contents displayed in the EN50160
Harmonics window.
Outputs an EN50169 measurement result classification table.
Outputs the five worst-case values for each v oltage swell, dip, interruption and transient event
within the reporting span.
The worst-case values are maximum voltage
swell, maximum continuous voltage swell duration,
minimum voltage dip, maximum continuous voltage dip duration, maximum continuous voltage interruption duration and maximum transient value.
Transient Waveform *2
Maximum/ Minimum List
Detailed List of All Events
All Event Waveforms
Settings List
×
× Outputs the worst-case transient waveform.
× ×
× ×
× ×
× ×× ×
Outputs a list of voltage fluctuations (each channel
separately), rms fluctuations (voltage and current
on each channel separately), frequency, and maximum and minimum values of active, reactive and
apparent power within the reporting span.
Outputs a list of all events and event details.
The order of the output list can be set to either
chronological or priority sequence in the Event List
window.
Outputs all event waveforms.
Outputs a list of settings for the currently loaded
data. These are the settings displayed in the Settings window when you select View – SYSTEM
from the menu bar.
Page 81

Report Printout Example
Auto Settings
71
Chapter 4 Analyzing Measurement Data
Page 82

72
Chapter 4 Analyzing Measurement Data
Custom Settings
Detailed Settings
Page 83

73
Chapter 4 Analyzing Measurement Data
Printing with a Specified Report Format
You can print reports in a specified format, and you can also create reports in a custom user- configured format.
Printing reports in a specified form at
Select Reports from the menu bar and select the desired report format.
A report including the current data will be printed in the specified report format.
All Data
All Time Plot Prints a report including all TIME PLOT data.
TP Voltage & Current Prints a report including TIME PLOT voltage and current data.
Integrated Power & Demand Print a report including integral power and demand data.
Harmonics Prints a report including harmonics data.
List & Waveformes of All Events Prints a report including an event list and all event waveforms.
Flicker
EN50160 Prints a report including EN50160 results.
Prints a report including all data that can be configured using individual
settings.
Prints a report including flicker data.
(This functionality is available for IEC flicker only.)
Printing reports in a custom user-configured format
You can print reports in a custom user-configured report format.
Select Report - User Reports from the menu bar and select the desired user-configured report format.
A report including the current data will be printed in the specified format.
See: "Configuring custom report formats" (p. 74)
Page 84

74
Report Wizard: Individual Settings Page
Report Wizard: Detailed Settings Page
Chapter 4 Analyzing Measurement Data
Configuring custom report formats
If Indivi dual Se ttin gs or Detailed Settings was selected as the report creation method, you can
save the configured report format .
1. Configure a report format as desired using the report wizard (see).
2. Save a report wizard integrated settings file.
The filename will subsequently be shown in the menu.
3. Select Report - User Reports - Report Menu Editor from the menu bar to display the Report Menu
Editor.
Menu items are shown in order.
Selects the report wizard integrated settings file to register in the menu.
Removes the selected item from the menu. The corresponding file is not deleted.
Changes the menu order by moving the selected item up and down in the list.
Page 85

75
To copy the DMM or harmonic list to Microsof t W ord or Microsof t Excel, sp ecify the range of dat a to co py.
Example: Copying and pasting five different windows into Microsoft Word
Chapter 4 Analyzing Measurement Data
Copying a displayed image into the clipboard
Image data can be copied to the clipboard and pasted into other applications such as Microsoft
Word and Microsoft Excel. You can also copy and paste the measured values displayed on the A/B
Cursor dialog box.
Click on the window you wish to copy to activate it.
1
2
3
Click the (copy) button, right-click and select Copy from the pop-up menu, or select
Edit - Copy from the menu bar.
Paste the copied image into the desired application (Microsoft W ord, Microsoft Excel, etc.).
Page 86

76
Chapter 4 Analyzing Measurement Data
Storing Measurement Data in a CSV File
Measurement data (in binary format) can be converted to CSV format.
Data converted to CSV format can be used in spreadsheet programs such as Excel.
Refer to the "Appendix" (p. A1) and the instruments’ instruction manuals f or file format details.
The results of CSV c onver s io n di ffer fr om p ro duc t display values in th e fol low in g
circumstances.
Error notation:
Example: A display of 0.000 Hz on the PW3198 will appear as OVER.
Convertible Data :Convertible, −:Non-Convertible
Conversion Procedure Window
Convert time-series data to CSV format
(for the span demarcated by A/B cursors)
(p. 77)
Convert waveform data to CSV format
(p. 79)
Convert demand data to CSV format
(p. 80)
Time Plot
Flicker Graph
Voltage Fluctuation Event
Inrush Current Graph
Integrated Power
Voltage/Current Waveform
Voltage/Transient Waveform
Voltage Event Waveform
Current Event Waveform
Demand
Hioki
PW3198
Hioki 3197 Hioki 3196
−
−
−
Page 87

Chapter 4 Analyzing Measurement Data
Cursor A: Light Blue
Cursor B: Purple
Between A and B cursors
Cursor B (Purple)
Cursor A (Light Blue)
Click
Click
Convert Time-Series Data to CSV Format
Activate the window with the data to be converted.
1
Demarcate the span for conversion
Click the (A and B cursor) button, or select A and B cursor in the View menu.
2
You can also right click and select from the pop-up menu.
The A/B cursors appear in the window, and a dialog box indicates values at the cursor positions.
Displayed contents differ according to the type of data displayed.
You can change everything when the A/B cursors are OFF.
Click the point where you want to move the cu rsor, or press the right- or left-arr ow key on the
3
keyboard to move the cursor.
77
Page 88

78
Time Plot Window Example
Voltage Event Fluctuation Window
Example
Integrated Power Window Example
Example
The number of selected measurement items displayed
at the upper right of the Sel ect Data for CSV Convers ion
dialog cannot exceed 256.
Microsoft Excel is unable to lo ad more than 256 items in
one CSV format data file.
Shows the number of currently selected
measurement items
IEC Flicker Window Example
Inrush Current Window Example
1 Select
3 Click
2 Enter
Chapter 4 Analyzing Measurement Data
Select the items to be converted to CSV format
From the File menu, select Save the active data as a CSV file.
4
You can also right click and select from the pop-up menu.
The Select Data for CSV Conversion dialog box opens.
Displayed contents differ according to the type of data displayed.
Select the check boxes of the items to be converted to CSV format.
5
Click the OK button.
6
The Save As dialog box opens.
Select the save destination and enter the name of the file to save.
7
Page 89

Chapter 4 Analyzing Measurement Data
Event Waveform Example
Transient Waveform Example
Example
Shows the number of currently selected measurement items
2 Enter
1 Select
3 Click
Converting Waveform Data to CSV Format
Open the window with the waveform to be converted.
1
See: "Loading Data" (p. 15)
To convert an event wavefor m
2
Make the Event Waveform window active, and select Save the active data as a CSV file –
Event waveform data from the File menu.
The currently displaye d event w avefo rm is conv erted. All event wav eform da ta (al l event s) in clude d in th e file are
converted to CSV format data.
To convert transient waveform data (Hioki PW3198, 3196 only)
Make the V oltage/Transient Wavefor m window ac tive, and select Save the act ive data as a
CSV file – Event transient waveform data from the File menu.
You can also right click and select from the pop-up menu.
The Select Data for CSV Conversion dialog box opens.
79
Select the check boxes of the items to be converted to CSV format.
3
The time is recorded in the format “h:mm:ss.000.”
Click the OK button.
4
The Save As dialog box opens.
Select the save destination and enter the name of the file to save.
5
Page 90

80
Shows the number of currently selected measurement items
2 Enter
1 Select
3 Click
Chapter 4 Analyzing Measurement Data
Converting Demand Data to CSV Format
Make the Demand window active, and select Save the active data as a CSV file from the
1
File menu.
The Select Data for CSV Conversion dialog box opens.
Select the check boxes of the items to be converted to CSV format.
2
Click the OK button.
3
The Save As dialog box opens.
Select the save destination and enter the name of the file to save.
4
Page 91

81
Chapter 4 Analyzing Measurement Data
Before Converting Harmonic Voltage Measurement Data (EN50160 Mode) to CSV Format (Hioki 3196 only)
For EN50160 mode measurements with the Hioki 3196, harmonic voltage (as opposed to inter-harmonic voltage) content is recorded as a percentage (of Uref) relative to the nominal voltage. This
harmonic voltage can be converted from percentage of the nominal voltage (% of Uref) to percentage of the fundamental waveform voltage (% of Ufnd) and saved in CSV format.The PW3198
records this data as a percentage of the fundamental waveform voltage (% of Ufnd).
Switch to EN50160 mode.
1
See: "Switching to EN50160 Display Mode" (p. 102)
Select Convert harmonic % to CSV in the Option menu.
2
The Convert harmonic % to CSV dialog box opens.
Select the check box, and click the OK button.
3
Page 92

82
Unit Prefixes
Fix "KW".
Unify the electricity-related unit to a unit with k, such as kW.
Do not use any unit prefix with "V":
Set the voltage unit as V a nd do not use a ny unit prefix such as k.
Do not use any unit prefix with "A":
Set the current unit as A and do not use any unit prefix such as k.
Enabling voltage 30-minute averages allows you to select voltage 30-minute ave raging fro m the po p-up menu when you rightclick on the [TIME PLOT] screen.
TIME PLOT/EVENT: Harmonics (PW3198 only)
Allows you to change the method used to calculate harmonics
data shown on the [TIME PLOT] screen's harmonic and event
data DMM graphs and redisplay the graphs accordingly.
PW3198: 3P3W2M connections
With 3P3W2M connecti ons, channel 3 valu es can be calculated
from channels 1 and 2 and shown for reference. The instantaneous waveforms u3 and i3 are calcu la ted as (u2- u1) and (-i1i2), respectively.
Voltage 30-minute average
Interval,2010/11/17 00:00:00 ~ 2010/11/17
07:30:00
,,U1[V],U4[V]
,maximum value,106.27E+0,000.00E-3
,average value,105.47E+0,000.00E-3
,minimum value,104.80E+0,000.00E-3
,,U1,U4
Date, time,[V],[V]
2010/11/17,00:00:00,105.43E+0,000.00E-3
2010/11/17,00:30:00,106.27E+0,000.00E-3
2010/11/17,01:00:00,105.96E+0,000.00E-3
Maximum, ave rage, and min imum vol tage
values recalculated every 30 minutes
Voltage values recalculated
every 30 minutes
Chapter 4 Analyzing Measurement Data
Using Optional Functions
This section describes how to configure special function operation. These functions are not used
during normal measurement, and their settings need n ot be changed during normal operation.
Output V oltage 30-minute Average
This option can be selected from the pop-menu by right-clicking on the TIME PLOT window. Average voltage values will be recalculated every 30 minutes within the range specified by the A and B
cursors and output to a CSV file. (Values cannot be recalculated for data for which the interval is
greater than 30 minutes.)
Example output
Page 93

83
Chapter 5 Analyzing Measurement Data from the Hioki PW3198, 3196
Analyzing Measurement Data
from the
Hioki PW3198, 3196Chapter 5
Viewing detailed event measurement data
[EVENT DATA]
Data measured with the Hioki PW3198 , 3196 upon the o ccurrence o f an event can be displayed as a graph
(Event Data window).
The conditions under which events occurred can be analyzed using the following graphs on the
Event Data window:
VOLTAGE/CURRENT Window (p. 59) VECTOR Window (p. 84)
VOLTAGE/TRANSIENT Window (p. 60) DMM Window (p. 84)
VOLTAGE Window (p. 61) HARMONICS BAR GRAPH Window (p. 85)
CURRENT Window (p. 62) HARMONICS LIST Window (p. 86)
In this manual, the above windows are collective ly cal led “Event Data windows”.
For more information about how to open an Event Data window, see "Opening and Switching Event
Data Windows" (p. 57)
Page 94

84
Window tool bar
Vectors
Calculated values of positive-,
negative- and zero-ph ase voltage
Calculated values of positive-,
negative- and zero-p hase current
Voltage on each channel
Current on each channel
Up to 10 harm onic orders
can be analyzed from 4 00 Hz
measurements.
Axis Display
LINEAR (Linear Display)
LOG (Logarithmic Display)
Display Types
VALUE (RMS)
PHASE (Phase Angles)
Numerical Display Method (for phase angles)
±180 (0 to 180º Lead)
lag360 (0 to 360º Lag)
Reference Source (for phase angles)
Order number
Move to previous or next event
Chapter 5 Analyzing Measurement Data from the Hioki PW3198, 3196
Viewing the Vector Display [VECTOR]
Open the Event Data window.
1
See: "Opening and Switching Event Data Windows" (p. 57)
Activate the Event Data window and select the VECTOR window from the EVENT DATA
2
menu.
You can also right click and select from the pop-up menu.
The Vector window opens.
When using a 3P4W connection, the positive-, negative-, and zero-phase components are displayed. For the
3196, these values are obtained using the calculations listed on the attached table.
Viewing the DMM Display [DMM]
Open the Event Data window.
1
See: "Opening and Switching Event Data Windows" (p. 57)
Activate the Event Data window and select the DMM window from the EVENT DATA menu.
2
You can also right click and select from the pop-up menu.
The DMM window opens.
Page 95

Chapter 5 Analyzing Measurement Data from the Hioki PW3198, 3196
Window tool bar
Voltage
Current
Power
High-order harmonic
voltage
High-order harmonic
current
High-order harmonics bar graph
Channel
Axis Display
LINEAR (Linear Display)
LOG (Logarithmic Display)
Display Types
VALUE (RMS)
PHASE (Phase Angles)
Show/hide inter-harmonics
iHarmOFF
iHarmON
Order number
Move to previous or next event
Data from 400 Hz
measurements can
be analyzed up to the
10
th
harmonic order.
Viewing Harmonics on a Bar Graph [HARMONICS BAR GRAPH]
Open the Event Data window.
1
See: "Opening and Switching Event Data Windows" (p. 57)
Activate the Event Data window and select the HARMONICS BAR GRAPH window from
2
the EVENT DATA menu.
You can also right click and select from the pop-up menu.
The Harmonics Bar Gr aph win dow o pens. For the PW 3198, t he high -order ha rmoni cs co mpone nts are di splay ed
at the far right.
85
Page 96

86
Window tool bar
Data from 400 Hz measurements can be analyzed up to
the 10
th
harmonic order.
Channel
Display item
Display Types
VALUE (RMS)
PHASE (Phase Angles)
Show/hide inter-harmonics
iHarmOFF
iHarmON
Move to previous or next ev ent
Chapter 5 Analyzing Measurement Data from the Hioki PW3198, 3196
Viewing Harmonics in a List [HARMONICS LIST]
Open the Event Data window.
1
See: "Opening and Switching Event Data Windows" (p. 57)
Activate the Event Dat a windo w and select the HARMONICS LIST window f rom the EVENT
2
DATA menu.
You can also right click and select from the pop-up menu.
The Harmonics List window opens.
Page 97

87
Window tool bar
Scrolls the window
Voltage Y-axis scale
Current Y-axis scale
X-axis scal e
Move to previous or
next event
CH1 (Red)
CH2 (Yellow-Green)
CH3 (Blue )
CH4 (Light Blue)
Chapter 5 Analyzing Measurement Data from the Hioki PW3198, 3196
Viewing High- order Harmonic Details(PW3198)
The PW3198 POWER SUPPLY QUALITY ANALYZER can be used to observe high-order harmonics at a high level of detail. The high-order harmonics graph is only displayed when there is highorder harmonic data (HHC file). A time series graph representing 40 ms of the waveform obtained
using 200 kHz high-speed sampling is shown.
Activate the event data and select Event Data – High-order Harmonics from the menu
1
bar.
Viewing Measurement Data as Numerical Values (Cursor Measurement)
You can check measured values using the cursor. You can also display maximum, mini-
2
mum, and average values for the desired range.
See: "Viewing Measurement Data as Numerical Values (Cursor Measurement)" (p. 38)
Page 98

88
Display item
Channel
Y-axis scale
LOG (log axis)
LINEAR (equal interval)
Y-axis scale
X-axis scale
AB cursor
X-axis scale
LOG(log axis)
LINEAR(equal interval)
Chapter 5 Analyzing Measurement Data from the Hioki PW3198, 3196
Frequency Analysis of High-order harmonics (Frequency Analysis)
Activate the event data screen and from the Event Data menu select High-order Harmon-
1
ics. Right click and from the pop-up menu select FFT Analysis.
You cannot select Frequency Analysis in any other screen besides the High-order Har-
monics screen.
2
The area of the target to be analyzed i n the High-order Harmonics gr aph will turn grey and
the Frequency Analysis window will open.
When the A/B cursors are ON, you can read the measurement values.
Page 99

89
CH1 (Red)
CH2 (Yellow-Green)
CH3 (Blue )
CH4 (Light Blue)
Window tool bar
Scrolls the window
Voltage swell, dip and interruption events are indicated by blue
event markers ( ) at their times of occurrence.
Y-axis scale
X-axis scale
Chapter 5 Analyzing Measurement Data from the Hioki PW3198, 3196
Viewing Voltage Fluctuation Details(3196)
[Voltage Fluctuation Event Graph]
Voltage fluctuation phenomena (swells, dips and interruptions) that occurred within data measured
by the Hioki 3196 can be displayed graphically (in the Voltage Fluctuation Event Graph window).
A Voltage Fluctuation Event Graph can be displayed only when an Event file (WDU file) is loaded.
Event files can be confirmed in the Event List (p. 53).
A Voltage Fluctuation Event Graph is a 10-second(3196) time series graph of rms voltage calculated over one half-cycle-shifted waveform.
Specify the event file (WDU file) to display using the Voltage Fluctuation Event Graph.
1
See: "Viewing Events as a List [EVENT LIST]" (p. 53)
Click the (Open Voltage Fluctuation Event Graph) button or select View – Voltage
2
Fluctuation Event Graph fro m th e menu bar.
The Voltage Fluctuation Event Graph window opens.
3
When there is no WDU file for the selected event, the display will show, "No voltage fluctuation graph data is
available for the specified even t."
Viewing Measurement Data as Numerical Values (Cursor Measurement)
Measurement values can be confirmed using the cursors. In addition, the minimum, maximum and average values over any span can be displayed.
See: "Viewing Measurement Data as Numerical Values (Cursor Measurement)" (p. 38)
Page 100

90
Chapter 5 Analyzing Measurement Data from the Hioki PW3198, 3196
Viewing Voltage Fluctuation Details and the
Inrush Current Graph (Hioki PW3198 only)
[Event Voltage Fluctuation and Inrush Current Graph]
Voltage fluctuation phenomena (swells, dips, and interruptions) and inrush current phenomena that
occurred within data measured by the Hioki PW3198 can be displayed graphically (in the Voltage
Fluctuation Event Graph window).
A Voltage (current) Fluctuation Event data Graph can be displayed only when an event file (WDU
file) is loaded.
Event files can be confirmed in the Event List (p. 53). A Voltage Fluctuation Event Graph is a 30second (PW3198) time series graph of RMS voltage and current calculations over one half-cycleshifted waveform.
 Loading...