

Page 1

Instruction Manual
8855
MEMORY HiCORDER
December 2008 Revised edition 9 8855A988-09 08-12H
Page 2

Page 3

Contents
Introduction i
Inspection ii
Safety Notes iv
Notes on Use vi
Chapter Summary xi
Chapter 1 Product Overview 1
1.1 Major Features 2
1.2 Identification of Controls and Indicators
Chapter 2 Installation and Preparation 9
2.1 Installation of the Product 9
2.2 Power Supply and Ground Connections
2.2.1 Connecting the AC Power Supply 11
2.2.2 Functional Grounding of the 8855 12
2.3 Power On/Off 13
2.4 Connection of the Input Product
2.4.1 8950, 8952, 8953-10, 8955 INPUT UNITs 14
2.4.2 8951 VOLTAGE/CURRENT UNIT 15
2.4.3 8954 VOLTAGE/TEMP UNIT 18
2.5 Logic Probe Connection 20
2.6 9018-10, 9132-10 CLAMP ON PROBE
Connection
2.7 9322 DIFFERENTIAL PROBE Connection
11
14
21
22
4
2.8 9665 10:1 PROBE / 9666 100:1 PROBE
2.9 Loading Recording Paper
(when the 8994 PRINTER UNIT is installed)
2.10 Care of Recording Paper
2.11 Notes on Measurement
2.11.1 Maximum Input Voltage 29
2.11.2 Using a Voltage Transformer 30
23
24
26
27
Page 4

Chapter 3 Recorder & Memory Function 31
3.1 Overview of the Recorder & Memory Function 31
3.2 Operation Sequence (REC&MEM)
3.3 STATUS Settings (REC&MEM: STATUS Screen)
3.3.1 Setting the Function Mode 35
3.3.2 Setting the Time Axis Range 36
3.3.3 Setting the Recording Length 37
3.3.4 Display Function 38
3.3.5 Setting the Display Format 39
32
34
3.4 Setting the Additional Recording Function 40
3.5 Settings on the Waveform Display Screen
(REC&MEM)
41
3.6 Setting The Printer (Only When The 8994
PRINTER UNIT Is Installed)
3.6.1 Setting the Print Mode 43
3.6.2 Setting the Real-time Printing Function 44
43
3.7 Setting the Auto Save Function 45
3.8 Simultaneous Display of Recorder and Memory
Waveforms
47
3.9 Start and Stop Operation (REC&MEM)
48
Chapter 4 FFT Function 49
4.1 Overview of the FFT Function 49
4.2 Operation Sequence (FFT)
4.3 STATUS Settings (FFT)
4.3.1 Setting the Function Mode 53
4.3.2 Setting the FFT Channel Mode 53
4.3.3 Setting the Frequency Range 54
4.3.4 FFT Number of Points Setup 55
4.3.5 Setting the Window Function 56
4.3.6 Setting the Peak Function 57
4.3.7 Selecting Reference Data 58
4.3.8 Setting the Display Format 59
4.3.9 Setting the Averaging Function 60
4.3.10 Setting the Interpolation (dot-line) 63
50
52
4.3.11 Setting the Waveform Evaluation 64
4.3.12 Setting the FFT Analysis Mode 65
4.3.13 Setting the Analysis Channel 66
4.3.14 Setting the X-axis and Y-axis Displays 67
Page 5

4.3.15 Setting the Wave Colors 69
4.3.16 Setting the Display Scale 70
4.3.17 Octave Filter Setting 71
4.4 Printout of FFT Processing Results
(When 8994 PRINTER UNIT is installed.) 72
4.4.1 Setting the Print Mode 72
4.4.2 Setting the Auto Print Function 72
4.5 Setting the Auto Save Function 73
4.6 Settings on the Waveform Display Screen (FFT)
4.7 Start and Stop Operation (FFT)
4.8 FFT Analysis Function
4.8.1 Storage Waveform [STR] 77
4.8.2 Linear Spectrum [LIN] 78
4.8.3 RMS Spectrum [RMS] 80
4.8.4 Power Spectrum [PSP] 81
4.8.5 Auto Correlation [ACR] 83
4.8.6 Histogram [HIS] 84
4.8.7 Transfer Function [TRF] 85
4.8.8 Cross Power Spectrum [CSP] 87
4.8.9 Cross Correlation [CCR] 89
4.8.10 Unit Impulse Response [IMP] 90
4.8.11 Coherence [COH] 91
4.8.12 Octave Analysis [OCT] 92
75
76
77
Chapter 5 Input Channel Settings 97
5.1 Overview 98
5.2 Setting the Variable Function
5.3 Scaling Function (SYSTEM)
5.3.1 Setting the Scaling Function 103
5.3.2 Scaling Setting Example 106
99
102
5.4 Comment Function (CHANNEL) 107
5.4.1 Title Comment Entry 107
5.4.2 Analog/Logic Channel Comment Entry 108
5.4.3 Character Entry Procedure 109
5.5 Copying Channel Settings 110
5.6 Setting the Waveform Display Screen
5.6.1 Entering by F9 (CH.SET) Key 111
5.6.2 Entering by CH.SET Key 112
5.6.3 Setting the Vernier Function 113
111
5.7 Setting the Probe Voltage Division Ratio 114
Page 6

5.8 Setting the 8951 VOLTAGE/CURRENT UNIT 116
5.8.1 Setting Voltage Measurement 116
5.8.2 Setting Current Measurement 116
5.9 Setting the 8952 DC/RMS UNIT 118
5.9.1 Setting Voltage Measurement 118
5.9.2 Setting RMS Measurement 118
5.10 8953-10 HIGH RESOLUTION UNIT 120
5.11 Setting the 8954 VOLTAGE/TEMP UNIT
5.11.1 Setting Voltage Measurement 121
5.11.2 Setting Temperature Measurement 121
121
5.12 Setting the 8955 F/V UNIT 124
5.12.1 Frequency, Rotation, and Commercial
Power Frequency Measurement Settings 124
5.12.2 Integration Measurement Settings 127
5.12.3 Pulse Duty Ratio Measurement Settings 128
5.12.4 Pulse Width Measurement Settings 129
Chapter 6 Memory Segmentation Function 131
Chapter 7 Calculation Function 137
7.1 Numerical Calculation (MEM) 137
7.1.1 Making Settings for Numerical Calculation 139
7.1.2 Copying Calculations Settings 142
7.1.3 Making Settings for Numerical Evaluation 143
7.1.4 Executing Numerical Calculation 145
7.2 Waveform Calculation (MEM) 147
7.2.1 Preparing for Waveform Processing 148
7.2.2 Defining the Processing Equation 149
7.2.3 Copying an Equation 151
7.2.4 Setting the Channel for Recording Processing
Results 152
7.2.5 Setting the Display Scale 153
7.2.6 Perform Waveform Processing 155
Chapter 8 Search Function 157
8.1 View Function (VIEW key) 158
8.1.1 Position Display 158
8.1.2 Block Display 159
8.2 Trigger Search 160
8.3 Peak Search Function
162
Page 7

8.4 Event Search 163
8.5 Time Search
8.6 Moving Cursors to the Search Points
164
165
Chapter 9 Waveform Evaluation Function 167
9.1 Waveform GO/NG Evaluation
(MEM, FFT Function, Power Monitor Function)
9.2 Setting the Waveform Area
9.3 Setting the Waveform Evaluation Mode
9.4 Setting the GO/NG Stop Mode
9.5 Creating the Evaluation Area
9.6 Editor Command Details
167
170
171
171
172
172
Chapter 10 Printout of Measurement Data 175
10.1 Printout of Measurement Data Operating
Procedure 176
10.2 Setting the STATUS Screen (printout)
178
10.2.1 Setting the Display Format 178
10.2.2 Setting the Waveform Display Graph
Position 179
10.3 Setting the CHANNEL Screen (printout) 180
10.3.1 Setting the Print Density 180
10.3.2 SCALING Screen 180
10.3.3 COMMENT Screen 181
10.4 Setting the SYSTEM Screen (printout) 182
10.5 Example of Printer Output
10.6 Printing Procedure
10.6.1 Manual Print 186
10.6.2 Auto Print 187
10.6.3 Real Time Print 188
10.6.4 Partial Print 189
10.6.5 Screen Hard Copy 190
10.6.6 List Print 190
10.6.7 Report Print 190
183
186
Chapter 11 Communication Settings 191
11.1 INTERFACE Screen (LAN Interface) 191
11.2 FTP Service
11.3 PPP connection
11.4 PC Card Interface
197
199
202
Page 8

Appendix APPENDIX 1
Appendix 1 Error Messages APPENDIX 1
Appendix 2 Glossary
Appendix 3 Reference
Appendix 3.1 Sampling APPENDIX 6
Appendix 3.2 Aliasing APPENDIX 6
Appendix 3.3 Measurement Limit
Frequency APPENDIX 7
Appendix 3.4 Recorder Function APPENDIX 8
Appendix 3.5 Averaging Equations APPENDIX 9
Appendix 3.6 "2-point method" Scaling
Equation APPENDIX 9
Appendix 3.7 Waveform Parameter
Calculation Details APPENDIX 10
Appendix 3.8 Details on Operators APPENDIX 14
Appendix 3.9 FFT Function APPENDIX 17
APPENDIX 4
APPENDIX 6
Appendix 4 Waveform Viewer (Wv) APPENDIX 24
Appendix 4.1 Starting the Waveform
Viewer APPENDIX 25
Appendix 4.2 Waveform Viewer Menus APPENDIX 26
Appendix 4.3 Using the Waveform
Viewer APPENDIX 28
Appendix 4.4 Conversion to CSV Format
APPENDIX 31
Appendix 4.5 Batch Conversion APPENDIX 32
Appendix 5 Size of a Waveform File APPENDIX 33
INDEX INDEX 1
Page 9

────────────────────────────────────────────────────
Introduction
Thank you for purchasing the HIOKI "8855 MEMORY HiCORDER." To
obtain maximum performance from the instrument, please read this manual
first, and keep it handy for future reference.
About This Manual
This manual is the Advanced edition (Instruction Manual) for the "8855
MEMORY HiCORDER." It describes the advanced functions and procedures
for the 8855. For information on general functions and procedures, refer to
the Basics edition (Quick Start Manual) of this manual.
i
────────────────────────────────────────────────────
Introduction
Page 10

ii
────────────────────────────────────────────────────
Inspection
When you receive the instrument, inspect it carefully to ensure that no
damage occurred during shipping. In particular, check the accessories, panel
switches, and connectors. If damage is evident, or if it fails to operate
according to the specifications, contact your dealer or Hioki representative.
Accessories
Power cord 1
9231 RECORDING PAPER (when the 8994 PRINTER UNIT is installed)
Roll paper attachment (when the 8994 PRINTER UNIT is installed)
PC card protector
Connector cable label
Instruction Manual
Guide book
Application Disk (CD-R)
1
2
1
1
1
1
1
Options
8950 ANALOG UNIT
8951 VOLTAGE/CURRENT UNIT
8952 DC/RMS UNIT
8953-10 HIGH RESOLUTION UNIT
8954 VOLTAGE/TEMP UNIT
8955 F/V UNIT
8994 PRINTER UNIT
9646 MO UNIT (with eject pin)
9663 HD UNIT
9645 MEMORY BOARD (96 M words) total 128 M words
9645-01 MEMORY BOARD (512 M words) total 512 M words
9557 RS-232C CARD
9558 GP-IB CARD
9626 PC CARD 32M
9627 PC CARD 64M
9726 PC CARD 128M
9727 PC CARD 256M
9728 PC CARD 512M
9729 PC CARD 1G
9397-01 CARRYING CASE (for the 8855)
9231 RECORDING PAPER (6 rolls)
9197 CONNECTION CORD (for high voltage, maximum input voltage 500 V)
9198 CONNECTION CORD (for low voltage, maximum input voltage 300 V)
9199 CONVERSION ADAPTOR (between BNC and banana, female)
9217 CONNECTION CORD (isolated between BNC and BNC)
9327 LOGIC PROBE (maximum input voltage 50 V)
9321-01 LOGIC PROBE (maximum input voltage 250 V)
9665 10:1PROBE
9666 100:1PROBE
9322 DIFFERENTIAL PROBE
9328 POWER CORD (for the 9322)
9325 POWER CORD (for the 8951)
────────────────────────────────────────────────────
Inspection
Page 11

iii
────────────────────────────────────────────────────
220H PAPER WINDER
*
9303 PT
9318 CONVERSION CABLE (for the 9270 to 9272, 9277 to 9279)
3273 CLAMP ON PROBE (DC to 50 MHz)
3273-50 CLAMP ON PROBE (DC to 50 MHz)
3274 CLAMP ON PROBE (DC to 10 MHz)
3275 CLAMP ON PROBE (DC to 2 MHz)
3276 CLAMP ON PROBE (DC to 100 MHz)
9018-10 CLAMP ON PROBE (10 to 500 A, 40 Hz to 3 kHz)
*
9132-10 CLAMP ON PROBE (20 to 1000 A, 40 Hz to 1 kHz)
*
9270 CLAMP ON SENSOR (20 A, 5 Hz to 50 kHz)
*
9271 CLAMP ON SENSOR (200 A, 5 Hz to 50 kHz)
*
9272 CLAMP ON SENSOR (20/200 A
,5Hzto10kHz)
9277 UNIVERSAL CLAMP ON CT (20 A, DC to 100 kHz)
9278 UNIVERSAL CLAMP ON CT (200 A, DC to 100 kHz)
*
9279 UNIVERSAL CLAMP ON CT (500 A, DC to 20 kHz)
*
9555 SENSOR UNIT (used with the 9270 to 9272, and the 9277 to 9279)
9667 FLEXIBLE CLAMP ON SENSOR
(500 to 5000 A/50 to 500 A, 10 to 20 kHz)
9333 LAN COMMUNICATOR
9335 WAVE PROCESSOR
9549 FUNCTION UP DISK (power monitor function)
*: no CE marking
NOTE
To connect the 9270 to 9272 or 9277 to 9279 Clamp-On Sensor to the 8951
VOLTAGE/CURRENT UNIT, use the 9318 CONVERSION CABLE. To
connect these sensors to other instruments, use in combination with the 9555
SENSOR UNIT.
────────────────────────────────────────────────────
Inspection
Page 12

iv
────────────────────────────────────────────────────
Safety Notes
This manual contains information and warnings essential for safe operation
of the instrument and for maintaining it in safe operating condition. Before
using the instrument, be sure to carefully read the following safety notes.
DANGER
Safety symbols
This instrument is designed to comply with IEC 61010 Safety
Standards, and has been thoroughly tested for safety prior to
shipment. However, mishandling during use could result in
injury or death, as well as damage to the instrument. Be
certain that you understand the instructions and precautions in
the manual before use. We disclaim any responsibility for
accidents or injuries not resulting directly from instrument
defects.
The symbol printed on the instrument indicates that the user
should refer to a corresponding topic in the manual (marked with
the symbol) before using the relevant function.
In the manual, the symbol indicates particularly important
information that the user should read before using the
instrument.
Indicates a grounding terminal.
Indicates AC (Alternating Current).
DANGER
WARNING
CAUTION
NOTE
Indicates DC (Direct Current).
Indicates both DC (Direct Current) and AC (Alternating Current).
Indicates the ON side of the power switch.
Indicates the OFF side of the power switch.
The following symbols in this manual indicate the relative importance of
cautions and warnings.
Indicates that incorrect operation presents an extreme hazard
that could result in serious injury or death to the user.
Indicates that incorrect operation presents a significant hazard
that could result in serious injury or death to the user.
Indicates that incorrect operation presents a possibility of injury
to the user or damage to the instrument.
Indicates advisory items related to performance or correct
operation of the instrument.
────────────────────────────────────────────────────
Safety Notes
Page 13

v
────────────────────────────────────────────────────
Measurement categories (Overvoltage categories)
This instrument complies with CAT II safety requirements.
To ensure safe operation of measurement instruments, IEC 61010 establishes
safety standards for various electrical environments, categorized as CAT I to
CAT IV, and called measurement categories. These are defined as follows.
CAT I
CAT II
CAT III
CAT IV
Secondary electrical circuits connected to an AC electrical
outlet through a transformer or similar device.
Primary electrical circuits in equipment connected to an AC
electrical outlet by a power cord (portable tools, household
appliances, etc.)
Primary electrical circuits of heavy equipment (fixed
installations) connected directly to the distribution panel,
and feeders from the distribution panel to outlets.
The circuit from the service drop to the service entrance,
and to the power meter and primary overcurrent protection
device (distribution panel).
Higher-numbered categories correspond to electrical environments with
greater momentary energy. So a measurement device designed for CAT III
environments can endure greater momentary energy than a device designed
for CAT II.
Using a measurement instrument in an environment designated with a
higher-numbered category than that for which the instrument is rated could
result in a severe accident, and must be carefully avoided.
Never use a CAT I measuring instrument in CAT II, III, or IV environments.
The measurement categories comply with the Overvoltage Categories of the
IEC60664 Standards.
Accuracy
We define measurement tolerances in terms of f.s. (full scale), rdg. (reading)
and dgt. (digit) values, with the following meanings:
f.s.
rdg.
dgt.
────────────────────────────────────────────────────
(maximum display value or scale length)
The maximum displayable value or the full length of the scale.
This is usually the maximum value of the currently selected range.
(reading or displayed value)
The value currently being measured and indicated on the measuring
instrument.
(resolution)
The smallest displayable unit on a digital measuring instrument, i.e.,
the input value that causes the digital display to show a "1".
Safety Notes
Page 14

vi
────────────────────────────────────────────────────
Notes on Use
Follow these precautions to ensure safe operation and to obtain the full
benefits of the various functions.
DANGER
Probe Connection, Measurement Voltage Input
Maximum input voltage ratings for the input module and the input
terminals of the instrument are shown below. To avoid the risk of
electric shock and damage to the instrument, take care not to
exceed these ratings.
The maximum rated voltage to earth of the input module
(voltage between input terminals and main instrument frame
ground, and between inputs of other analog input modules) is
shown below. To avoid the risk of electric shock and damage
to the instrument, take care that voltage between channels
and between a channel and ground does not exceed these
ratings.
The maximum rated voltage to earth rating applies also if an
input attenuator or similar is used. Ensure that voltage does
not exceed these ratings.
When measuring power line voltages with the 8950, 8952 or
8953-10, always connect the probe to the secondary side of
the circuit breaker, so the breaker can prevent an accident if a
short circuit occurs. Connection to the primary side involves
the risk of electric shock and damage to the instrument.
Before using the instrument, make sure that the insulation on
the connection cords is undamaged and that no bare
conductors are improperly exposed. Using the products in
such conditions could cause an electric shock, so contact
your dealer or Hioki representative for replacements. (Model
9197, 9198.)
Input/output terminal Maximum input voltage Maximum rated voltage to earth
8950 (input) 400 V DC max. 370 V AC/DC
8951 (input) 30 V rms or 60 V DC 30 V rms or 60 V DC
8952 (input) 400 V DC max. 370 V AC/DC
8953-10 (input) 400 V DC max. 370 V AC/DC
8954 (input) 30 V rms or 60 V DC 370 V AC/DC
8955 (input) 30 V rms or 60 V DC 30 V rms or 60 V DC
9322
EXT TRIG/ START
STOP/ EXT SMPL
TRIG OUT/ GO/ NG/
EXT.OUT
2000 V DC, 1000 V AC (CAT
II)
600 V DC/AC (CAT III)
-5 to +10 V DC
-20 V to +30 V DC
500 mA max./ 200 mW max.
When using grabber clips
1500 V DC/AC (CAT II), 600 V DC/AC (CAT III)
When using alligator clips
1000 V DC/AC (CAT II), 600 V DC/AC (CAT III)
Not insulated
────────────────────────────────────────────────────
Notes on Use
Page 15

vii
────────────────────────────────────────────────────
DANGER
External I/O terminal connections
A common GND is used for the external I/O terminals (START,
STOP, GO, NG, EXT_OUT, EXT_TRIG, EXT_OUT, and EXT_SMPL
terminals) and the 8855 instrument. The terminals are not
isolated. To prevent damage to the object connected to the
external I/O terminals and the 8855 instrument, wire the
terminals so that there is no difference in electrical potential
between the GND for the external I/O terminals and the GND for
the connected object.
Logic Probe Connection
The logic input and 8855 instrument share a common ground.
Therefore, if power is supplied to the measurement object of the
logic probe and to the 8855 from different sources, an electric
shock or damage to the equipment may result. Even if power is
supplied from the same system, if the wiring is such that a
potential difference is present between the grounds, current will
flow through the logic probe so that the measurement object and
8855 could be damaged. We therefore recommend the following
connection method to avoid this kind of result. Refer to Section
2.5, "Logic Probe Connection" for details.
(1) Before connecting the logic probe to the measurement
object, be sure that power is supplied from the same outlet
box to the measurement object and the 8855 using the
supplied power cord.
(2) Before connecting the logic probe to the measurement
object, connect the ground of the measurement object to the
8855 ground terminal. Also in this case, power should be
supplied from the same source. Refer to Section 2.2, "Power
Supply and Ground Connections" for grounding terminal
details.
Differential Probe Connection
When using grabber clips, the 9322's maximum rated voltage
to earth is 1500 V AC or DC (CAT ll) / 600 V AC or DC (CAT lll);
when using alligator clips, it is 1000 V AC or DC (CAT ll) / 600
V AC or DC (CAT lll). To avoid electrical shock and possible
damage to the instrument, never apply voltage greater than
these limits between the input channel terminals and chassis,
or across the input of two 9322s.
Maximum input voltage is 1000 V AC/2000 V DC (CAT ll) / 600
V AC or DC (CAT lll). Attempting to measure voltage in excess
of the maximum rating could destroy the instrument and
result in personal injury or death.
────────────────────────────────────────────────────
Notes on Use
Page 16

viii
────────────────────────────────────────────────────
DANGER
WARNING
10:1 and 100:1 probe connections
The maximum rated to-voltage does not change when using a
9665 10:1PROBE or a 9666 100:1PROBE. To avoid electrical
shock or damaging the 8855 instrument, make probe
connections in such a manner that the method for the probe,
and make sure the to-ground voltage does not exceed the
rated maximum.
The maximum input voltage is 1,000 V DC for the 9665
10:1PROBE, and 5,000 V DC for the 9666 100:1PROBE. (The
measurement category (overvoltage category) is the same as
that of the input modules of MEMORY HiCORDERs that use
the 9665 and the 9666. ) Do not measure voltages that exceed
the maximum input voltage, as the 8855 instrument could be
damaged and an accidents resulting in injury or death could
result.
Power Supply Connections
Before turning the instrument on, make sure the source
voltage matches that indicated on the instrument's power
connector. Connection to an improper supply voltage may
damage the instrument and present an electrical hazard.
Replacing the Input Modules
To avoid electric shock accident, before removing or
replacing an input module, confirm that the instrument is
turned off and that the connection cords are disconnected.
To avoid the danger of electric shock, never operate the
instrument with an input module removed. To use the
instrument after removing an input module, install a blank
panel over the opening of the removed module.
Grounding the Instrument
To avoid electrical accidents and to maintain the safety
specifications of this instrument, connect the power cord only
to a 3-contact (two-conductor + ground) outlet. Refer to
Section 2.2, "Power Supply and Ground Connections."
Before Powering on
Check that the power supply is correct for the rating of the
instrument. Be careful to avoid connecting voltage improperly,
as the internal circuitry may be destroyed. (The AC fuse is
integrated in the instrument.)
Usage Precautions for the Internal MO Drive (option)
To prevent damage to the instrument, do not attempt to
disassemble the MO drive.
Laser radiation can be emitted when the MO drive is open.
Avoid looking directly into the laser when the MO drive is
open. Maximum laser output is 50 mW (at 685 nm, pulsed).
────────────────────────────────────────────────────
Notes on Use
Page 17

ix
────────────────────────────────────────────────────
CAUTION
Installation Enviroment
This instrument should be installed and operated indoors only,
between 5 and 40 and 30 to 80% RH. Do not store or use the
instrument where it could be exposed to direct sunlight, high
temperature or humidity, or condensation. Under such conditions,
the instrument may be damaged and insulation may deteriorate so
that it no longer meets specifications.
Storing (when the 8994 PRINTER UNIT is installed)
When the product is not to be used for an extended period, set the
head up/down lever to the "head up" position. This will protect the
printer head and prevent deformation of the rubber roller.
Precautions on carrying this equipment
The terminal guard of the equipment protects the inputs. Do not
hold this guard when carrying the equipment. To carry this
equipment, use the handle. See Section 1.2.
Shipping
Remove the printer paper from the product. If the paper is left in
the product, paper support parts may be damaged due to
vibrations. (when the 8994 PRINTER UNIT is installed)
To avoid damage to the instrument, be sure to remove the input
modules, floppy disk, MO disk, PC card, and SCSI cable before
shipping.
Use the original packing materials when reshipping the instrument,
if possible.
Handling the CD-R
Always hold the disc by the edges, so as not to make fingerprints
on the disc or scratch the printing.
To write on the disc label surface, use a spirit-based felt pen. Do
not use a ball-point pen or hard-tipped pen, because there is a
danger of scratching the surface and corrupting the data. Do not
use adhesive labels.
Do not expose the disc directly to the sun's rays, or keep it in
conditions of high temperature or humidity, as there is a danger of
warping, with consequent loss of data.
To remove dirt, dust, or fingerprints from the disc, wipe with a dry
cloth, or use a CD cleaner. Always wipe radially from the inside to
the outside, and do no wipe with circular movements. Never use
abrasives or solvent cleaners.
Hioki shall not be held liable for any problems with a computer
system that arises from the use of this CD-R, or for any problem
related to the purchase of a Hioki product.
Others
In the event of problems with operation, first refer to Quick Start
Section 14.4, "Troubleshooting".
Carefully read and observe all precautions in this manual.
────────────────────────────────────────────────────
Notes on Use
Page 18

x
────────────────────────────────────────────────────
NOTE
Using a printer
Avoid using the printer in hot, humid environments, as this can greatly
reduce printer life.
Using the connection cords
Use only the specified connection cord (9197, 9198). Using a non-specified
cord may result in incorrect measurements due to poor connection or other
reasons.
Recording paper (when the 8994 PRINTER UNIT is installed)
Use only recording paper specified by Hioki. Non-specified recording paper
may result in poor-quality or blank printouts.
Printing is not possible if the recording paper is loaded wrong-side up. See
Section 2.9.
────────────────────────────────────────────────────
Notes on Use
Page 19

xi
────────────────────────────────────────────────────
Chapter Summary
Chapter 1 Product Overview
Contains an overview of the instrument and its features.
Chapter 2 Installation and Preparation
Explains how to set the instrument up for measurement.
Chapter 3 Recorder and Momory Function
Explains how to use the recorder and memory functions of the instrument.
Chapter 4 FFT Function
Explains how to use the FFT functions of the instrument.
Chapter 5 Input Channel Settings
Explains how to use the input channel of the instrument.
This manual describes the advanced functions of the 8855.
Chapter 6 Memory Segmentation Function
Explains how to use the Memory Segmentation Function.
Chapter 7 Operation Function
Explains how to use the Calculating, Waveform Parameter value and
Waveform GO/NG Evaluation.
Chapter 8 Search Function
Explains how to search for data.
Chapter 9 Waveform Evaluation Function
Explains how to use the Calculating, Waveform Evaluating value and
Waveform GO/NG Evaluation.
Chapter 10 Printout of Measurement Data
Explains how to print out measurement data and how to read printed charts.
Chapter 11 Communication Settings
Explains how to make settings for the LAN interface and PC card interface.
Appendix
Contains information that is necessary for using this instrument, including a
description of error messages, a glossary, and an explanation how to increase
memory.
────────────────────────────────────────────────────
Chapter Summary
Page 20

xii
────────────────────────────────────────────────────
────────────────────────────────────────────────────
Chapter Summary
Page 21

1
────────────────────────────────────────────────────
Chapter 1
1
2
Product Overview
3
4
5
6
7
8
9
10
11
12
13
14
A
────────────────────────────────────────────────────
Page 22

2
────────────────────────────────────────────────────
1.1 Major Features
(1) Waveform collection performance
Using the 8950 ANALOG UNIT, the 8951 VOLTAGE/CURRENT UNIT,
and the 8952 DC/RMS UNIT with the 8855, it is possible to record
waveforms at 20 MS/s with a resolution of 12 bits.
Furthermore, using the 8953-10 HIGH RESOLUTION UNIT, it is possible to
record waveforms at 1 MS/s with a resolution of 16 bits.
Using the 8954 VOLTAGE/TEMP UNIT in combination with the 8855, it is
possible to record temperature.
Using the 8955 F/V UNIT in combination with the 8855, it is possible to
measure items such as frequency.
Regardless of the input module, it is possible to record waveforms on up to
8 channels, simultaneously.
(2) High-resolution display
The 8855 is equipped with a 10.4-inch (800 x 600 pixels) TFT color LCD,
and can display waveforms with great precision.
Because both the values and gauge can be displayed simultaneously, it is
easy to confirm waveform measurements directly on-screen.
(3) Measurement functions
Memory with a maximum sampling speed of 50 ns (simultaneous recording
on all channels).
If using the optional printer module, it is possible to output real-time
recordings on recording paper.
(4) Storage capacity
The 8855 has a standard storage capacity of 32 M words, expandable to 128
M or 512 Mwords with memory upgrades.
(5) Trigger function
Digital trigger circuit
Trigger types: level trigger, window-in trigger, window-out trigger, period
trigger, glitch trigger, event trigger, logic trigger (pattern trigger)
(6) Diverse observation functions
The 8855 can calculate such values as the average, maximum, and absolute
values, as well as perform arithmetic calculations.
The time and value of the cursor can be calculated for all channels.
(7) Search function
You can set criteria and search through captured waveforms.
(8) GUI display
The GUI-inspired (Graphical User Interface) design, which uses both
graphical and textual representation on the function key display, makes the
instrument easier to configure and operate.
────────────────────────────────────────────────────
1.1 Major Features
Page 23

3
────────────────────────────────────────────────────
(9) On-line help
On-line help guides the user through operation steps and various functions.
Furthermore, you can easily display help using the setting item in the lower
part of the screen.
(10) Scaling function
By setting the physical amount and the unit to be used for 1 V input, the
measurement result can be converted into any desired scale.
(11) Additional recording function
When enabled, the memory is regarded as printer paper.
(12) Input modules (Option)
The analog inputs are floating, and so each input can be connected to its
own independent potentials.
Select input modules suitable for measurements.
(13) Built-in thermal printer (Option)
Thermosensitive recording method using a thermal line head
The built-in printer delivers waveform printouts on the spot.
The printer can also be used to print screen shots, reduction screen shots and
parameter information. Report print can be printed.
(14) External storage means (MO/HD drive option)
Measurements, settings, and images can be recorded on a MO disk or hard
disk.
1
2
3
4
5
6
7
8
(15) PC card
Measurements, settings, and images can be recorded on a flash ATA card.
PPP connection is possible using a modem card.
(16) SCSI interfaces
If a MO drive is connected to the SCSI interface, the waveform data and/or
setup conditions can be stored on a MO disk.
When the 8855 is connected to your PC through an SCSI, you can access
the data of the internal 8855 MO disk or hard disk from the PC.
(17) Internal LAN interface (10BASE-T)
You can connect the 8855 to a local area network (LAN) using the 9333
LAN COMMUNICATOR.
When performing rapid data exchanges, such as those between the 8855 and
a PC, remote operations are possible from the PC.
The 8855 supports FTP.
(18) Dual-language capability
Display language is switchable between Japanese and English.
9
10
11
12
13
14
────────────────────────────────────────────────────
1.1 Major Features
A
Page 24

4
────────────────────────────────────────────────────
1.2 Identification of Controls and Indicators
1
2
3
4
5
6
7
8
9
10 11 12 15 16 17 18 21 22
13 14 19 20
26
25
24
23
Front Panel
────────────────────────────────────────────────────
1.2 Identification of Controls and Indicators
Page 25

5
────────────────────────────────────────────────────
1
F1toF10
2
HELP
3
CHAN
4
5
6
7
8
9
10
11
12
13
14
15
16
17
18
19
20
21
22
23
24
25
26
key
DISP
key
FILE
key
TRIG
STATUS
TIME/DIV
SYSTEM
PRINT
COPY
FEED
CURSOR
SAVE
AUTO
VALUE
WAVE
SHUTTLE
JOG
A.B CSR
RANGE
STOP
START
POSITION
Channel select
keys
key
ESC
key
key
key
key
key
key
key
key
key
knob
key
key
key
key
key
key
key
key
knob
Serve to select setting items.
Provides on-line help.
Causes the display to show the Channel screen which serves for making
input channel settings.
Causes the display to show measurement and analysis results.
Causes the display to show the File screen which serves for reading, storing,
etc. the waveform data etc.
Causes the display to show the Trigger screen. Setting the trigger functions.
Causes the display to show the Status screen which serves for setting most
measurement parameters.
Serves to set the speed for inputting and storing the input signal.
Causes the display to show the System screen. Makes all the settings of
common functions, such as the initial settings and various other settings.
Serves to print out stored waveforms.
Serves to print out a hard copy of the current screen display.
Causes the printer paper to advance for as long as the key is pressed.
These keys serve to move the flashing cursor in the four directions.
Saves the data on the specified media.
Pressing this key activates automatic setting of time axis range and voltage
range values of input waveform.
Uses to select the numerical values setting.
Uses to select the the waveform scrolling.
Rotary control knob that serves to change values, move the A/B cursors,
and scroll the waveform.
Concentric ring that serves to change values, move the A/B cursors, and to
scroll the waveform. The speed of movement is proportional to the rotation
angle.
Uses to select the the A/B cursor moving.
Sets the measurement range for the channel.
Stops measurement and analysis.
Pressing this key twice stops measurement.
Initiates the measurement and analysis. During measurement, the LED
above the key is lit.
Sets the zero position for the channel.
Selects channel.
Exits the Input or Set up screen.
1
2
3
4
5
6
7
8
9
10
11
12
13
────────────────────────────────────────────────────
1.2 Identification of Controls and Indicators
14
A
Page 26

6
────────────────────────────────────────────────────
1819202122
23
1
AC power switch
2
AC connector
3
Function ground
terminal (GND)
4
External sampling
terminal
5
Trigger terminals
6
PC card slot
7
Logic probe connectors
8
Eject button
9
External output terminal
10
NG evaluation output
terminal
11
GO evaluation output
terminal
12
Ground terminal (GND)
13
External stop terminals
14
External start terminals
15
Key lock
16
SCSI connector
17
LAN connector
1 2 93 4 5 6 7 8 10 11 12 13 14 15 16 17
Right Side Panel
Switches on or off the AC power supply.
The supplied power cord must be plugged in here.
Connects to the earth.
Allows input of an external sampling signal. (in the Memory
function)
Can be used to synchronize multiple instruments, using the EXT
TRIG input and TRIG OUT output.
Inserts the PC card.
Input connector for the logic input section, designed for the
dedicate logic probes (CH A to D).
Removes the PC card.
Various output signals can be selected, such as the BUSY or error
signals.
When NG results from the numerical calculation evaluation and
waveform evaluation, a signal is output from this terminal.
When GO results from the numerical calculation evaluation and
waveform evaluation, a signal is output from this terminal.
Uses with9to14(except12)terminals.
Stop operation can be controlled.
Start operation can be controlled.
Locks the operation of keys.
An MO drive can be connected.
Can be connected to a network through a LAN.
────────────────────────────────────────────────────
1.2 Identification of Controls and Indicators
Page 27

7
────────────────────────────────────────────────────
18
FD slot
19
MO slot
20
Input module slots
21
Fastening screw
22
Analog input connector
23
Blowing slot
Floppy disk is inserted.
MO disk is inserted.
These slots accept input modules.
Secures the plug-in instrument.
Unbalanced analog input. (on ANALOG UNIT)
3
Left Side Panel
1
2
2
Upper Panel
2
2
Bottom PanelRear Panel
1
Handle
2
Ventilation
Serves for transporting the 8855.
slots
3
Printer
────────────────────────────────────────────────────
(when the 8994 PRINTER UNIT is installed)
1.2 Identification of Controls and Indicators
Page 28

8
────────────────────────────────────────────────────
────────────────────────────────────────────────────
1.2 Identification of Controls and Indicators
Page 29

9
────────────────────────────────────────────────────
Chapter 2
1
2
Installation and Preparation
2.1 Installation of the Product
Installation orientation
Install the instrument on a flat, level surface.
3
4
5
6
7
8
9
10
11
12
13
14
A
────────────────────────────────────────────────────
2.1 Installation of the Product
Page 30

10
────────────────────────────────────────────────────
Ambient conditions
Temperature 5 to 40oC, 23 5oC recommended for high-precision
measurements.
Humidity 30 to 80% RH (no condensation); 50 10% RH (no
condensation) recommended for high-precision
measurements.
Ventilation Take care not to block the ventilation openings and assure
proper ventilation. When using the instrument in an
upright position, take care not to block the openings on
both side.
Blowing slot
Avoid the following locations:
Blowing slot
Right side
Blowing slot
Upper side
Left side
Blowing slot
Bottom side
Subject to direct sunlight.
Subject to high levels of dust, steam, or corrosive gases (Avoid using the
equipment in an environment containing corrosive gases (e.g., H2S, SO2,
NI2,andCI2) or substances that generate harmful gasses (e.g., organic
silicones, cyanides, and formalins).
Subject to vibrations.
In the vicinity of equipment generating strong electromagnetic fields.
────────────────────────────────────────────────────
2.1 Installation of the Product
Page 31

11
────────────────────────────────────────────────────
2.2 Power Supply and Ground Connections
1
2.2.1 Connecting the AC Power Supply
WARNING
Check the following points before connecting the instrument
to a power supply. Take care never to exceed the power
supply ratings given below, to avoid the risk of electric shock
and damage to the instrument.
(1) Power supply matches Rated supply voltage (100 to 240 V
AC: Voltage fluctuations of 10% from the rated supply
voltage are taken into account.) and rated supply frequency
(50/60 Hz).
(2) The AC power switch of the 8855 is set to OFF.
(3) Use only the supplied AC power cord.
When supplying power with an inverter or an uninterruptible
power supply (UPS), use a device that complies with the
following conditions. To avoid the risk of electric shock and
damage to the instrument, do not use devices that have a
voltage frequency outside the specified range, or that output
square waves.
(1) Voltage: 100 V to 240 V AC
(2) Power frequency: 50/60 Hz
(3) Sine wave output (Do not use devices that have an
unstable output, even if the output is sinusoidal.)
The 8855 has no protective ground terminal, but is intended to
be connected to a ground wire via the grounded three-core
power cord supplied. In order to avoid electric shock
accidents, be sure to connect the grounded three-core power
cord supplied to a power supply socket one of whose
terminals is properly grounded.
2
3
4
5
6
7
8
9
10
1. Verify that the AC power switch of the 8855 is set to OFF.
2. Plug the grounded three-core power cord supplied into the
AC power connector on the right side of the 8855.
3. Plug the power cord into an AC outlet corresponding to the
rating of the 8855.
NOTE
────────────────────────────────────────────────────
The fuse is incorporated in power supply. It is not user-replaceable. If a
problem is found, contact your nearest dealer.
2.2 Power Supply and Ground Connections
11
12
13
14
A
Page 32

12
────────────────────────────────────────────────────
2.2.2 Functional Grounding of the 8855
When the 8855 is used in noise-prone environments, connect the functional
grounding terminal to improve noise characteristics.
Functional grounding terminal
────────────────────────────────────────────────────
2.2 Power Supply and Ground Connections
Page 33

13
────────────────────────────────────────────────────
2.3 Power On/Off
WARNING
Check the following points before the power switch is turned on.
Power supply matches Rated supply voltage (100 to 240 V AC:
Voltage fluctuations of 10% from the rated supply voltage
are taken into account.) and rated supply frequency (50/60 Hz).
The instrument is correctly installed (Section 2.1).
Power cord is correctly connected (Section 2.2).
The instrument is properly grounded.
1
2
3
4
5
6
NOTE
After the power switch is turned on, wait approximately 30 min to stabilize
the inside temperature of the connected input module in order to obtain
accurate waveforms. Then, make a zero adjustment prior to measurement.
For details, see the specifications of each module, Quick Start Section 13.2
"Analog Inputs."
Adjustment See Quick Start Section 6.4 "Zero Adjustment."
When the instrument is turned off, it memorizes the currently used settings
and reestablishes the same settings the next time the instrument is turned on
again.
7
8
9
10
11
12
13
────────────────────────────────────────────────────
2.3 Power On/Off
14
A
Page 34

14
────────────────────────────────────────────────────
2.4 Connection of the Input Product
2.4.1 8950, 8952, 8953-10, 8955 INPUT UNITs
WARNING
CAUTION
NOTE
Never connect the probe to the 8855 while the probe is
already connected to the measurement object. Otherwise
there is a risk of electric shock.
Use only the specified input cord with this probe.
An insulating BNC connector is provided to prevent electric
shock. When using a metal BNC, there is risk of electric
shock, due to the input L terminal having the same potential
as the metal portion of the BNC connector.
When disconnecting the BNC connector, be sure to release the lock
before pulling off the connector. Forcibly pulling the connector without
releasing the lock, or pulling on the cord, can damage the connector.
Use the power terminal with the 9322 DIFFERENTIAL PROBE only. To
connect the probe, you need the 9328 POWER CORD. To avoid injuries
or damage to this instrument, do not connect any device other than the
9322 to the terminal.
Use of an unspecified input cord may result in inaccurate measurements due
to poor connection or BNC connector damage.
Connection
Cord
(Maximum input
voltage:)
Measurement
objects
For safety reasons, only use the optional 9197, 9198, or 9217
CONNECTION CORD for connection to the analog input modules.
9197
(500 V)
Items that can be
hooked to with large
alligator clips
Items that can be
hooked to with
small alligator clips
9198
(300 V)
9217
(300 V)
BNC output
Connecting to the main instrument
1. Align the BNC connector with the guide groove
Groove of the BNC
of the module input connector, and turn
clockwise while pressing in to lock the
connector. (Only use the 9198 CONNECTION
CORD for connection to the 8955 F/V UNIT.)
2. To remove from the module, turn the BNC
Connectorguide
connector counterclockwise to release the lock,
then pull it.
────────────────────────────────────────────────────
2.4 Connection of the Input Product
Page 35

15
────────────────────────────────────────────────────
2.4.2 8951 VOLTAGE/CURRENT UNIT
DANGER
Precautions when using the 3273, 3273-50, and the 3276
CLAMP ON PROBE
When conductors being measured carry in excess of the
safe voltage level (SELV-E)* and not more than 300 V, to
prevent short circuits and electric shock while the core
section is open, make sure that conductors to be measured
are insulated with material conforming to (1) Measurement
Category (Overvoltage Category), (2) Double (reinforced)
Insulation Requirements for Working Voltages of 300 V, and
(3) Pollution Degree 2. For safeties sake, never use this
sensor on bare conductors. The core and shield case are
not insulated.
Be careful to avoid damaging the insulation surface while
taking measurements.
Refer to the following standards regarding the meanings of
underlined terms.
IEC 61010-1 (JIS C 1010-1)
IEC 61010-2-031 (JIS C 1010-2-31)
IEC 61010-2-032 (JIS C 1010-2-32)
Precautions when using the 3274 and the 3275 CLAMP ON
PROBE
When conductors being measured carry in excess of the
safe voltage level (SELV-E)* and not more than 600 V (CAT II)
or 300 V (CAT III), to prevent short circuits and electric shock
while the core section is open, make sure that the conductor
insulation satisfies the (1) Basic insulation requirements for
the applicable (2) Measurement Category (Overvoltage
Category, (3) Working Voltage, and (4) Pollution Degree. For
safeties sake, never use this sensor on bare conductors.
Be careful to avoid damaging the insulation surface while
taking measurements.
Refer to the following standards regarding the meanings of
underlined terms.
IEC 61010-1 (JIS C 1010-1)
IEC 61010-2-031 (JIS C 1010-2-31)
IEC 61010-2-032 (JIS C 1010-2-32)
*: The voltage levels are 30 V rms and 42.4 V peak or 60 V DC.
WARNING
When you are using the clamp to the 8855, the 8951 GND,
clamp GND, and power supply terminals of modules on other
channels are not insulated. Exercise care in handling these
to avoid damaging this instrument or suffering from injury.
To avoid shock and short circuits, turn off all power before
connecting probes.
────────────────────────────────────────────────────
2.4 Connection of the Input Product
Page 36

16
────────────────────────────────────────────────────
CAUTION
When disconnecting the BNC connector, be sure to release the
lock before pulling off the connector. Forcibly pulling the connector
without releasing the lock, or pulling on the cord, can damage the
connector.
Connecting the Connection cord
(for voltage measurement)
1. Align the BNC connector with the guide groove of
Groove of the
BNC
Connectorguide
the 8855 input connector, and turn clockwise while
pressing in to lock the connector.
(For using the 8951, use the 9198 CONNECTION
CORD.)
2. To remove from the module, turn the BNC
connector counterclockwise to release the lock,
then pull it.
Connecting the Clamp (for current measurement)
The following clamp-on sensors and clamp-on probes can be connected
using the 9318 CONVERSION CABLEs.
Conversion cable Clamp-on sensor/probe
9318 9270, 9271, 9272, 9277, 9278, 9279
Number of usable clamps
The number of clamps that can be used with the 8855 is limited according
to clamp type. The clamps that can be used for the relevant clamp type is
shown to the list shown below.
In the case that the relevant clamp type is used the clamp total use number
is confirmed and please do not exceed the number of the list shown below.
Clamp Number
3274 CLAMP ON PROBE
Continuous 150 A
Non-continuous 300 A
3273-50, 3275, 3276 CLAMP ON PROBE 4
9278 UNIVERSAL CLAMP ON CT 7
9279 UNIVERSAL CLAMP ON CT 7
8
4
────────────────────────────────────────────────────
2.4 Connection of the Input Product
Page 37

17
r
────────────────────────────────────────────────────
Instrument's sensor connector
Conversion cable plug
Conversion cable connector
Adapted clamp's
Projection on the instrument connecto
Groove on the 3273 CLAMP ON
PROBE's termination connector
Sensor connector
on the instrument
Conversion cable plug
plug
Connecting the 9318 CONVERSION CABLE
1. Align the groove on the conversion cable plug with
the sensor connector on the 8951 and push inward
until the connector locks into place.
2. Align the groove on the conversion cable connector
with the adapted clamp on sensor plug and push
inward until the connector locks into place.
3. To unplug the cables, slide the lock ring on each
plug outward to unlock it, then pull out the plug.
Connecting the 3273, 3273-50, 3274, 3275,
3276 CLAMP ON PROBE
1. Align the groove on the 3273, 3273-50, 3274,
3275, 3276 CLAMP ON PROBE's termination
connector with the pin on the BNC connector on
the 8951, then slide the termination connector over
the BNC connector and turn to lock it in place.
2. Align the groove on the 3273, 3273-50, 3274,
3275, 3276 cable plug with the power connector on
the 8951.
────────────────────────────────────────────────────
2.4 Connection of the Input Product
Page 38

18
────────────────────────────────────────────────────
2.4.3 8954 VOLTAGE/TEMP UNIT
WARNING
CAUTION
Do not connect the connection cord to the 8855 while the
instrument is connected to the object being measured. This
may cause electric shock.
A common GND is used for the voltage and temperature
input on each channel. When using the voltage and
temperature inputs simultaneously, do not connect them
both at the same time as this may damage the object you are
measuring.
When using a non-insulated thermocouple to measure the
temperature of points, be careful not to touch the terminals.
The terminals may be electrically charged.
When disconnecting the BNC connector, be sure to release the lock
before pulling off the connector. Forcibly pulling the connector without
releasing the lock, or pulling on the cord, can damage the connector.
Make sure that the thermocouple is installed in a location within the
safe super-low voltage (30 V rms or 60 V DC ). For information on
selecting a thermocouple when measuring high voltage components,
contact the thermocouple manufacturer.
NOTE
The voltage and temperature inputs and this instrument are isolated.
Connecting the connection cord(whenmeasuringvoltage)
1. Align the groove on the BNC connector with the connector guide on the
module and insert the BNC connector, then turn it to the right to lock it in
place. (Use the 9198 CONNECTION CORD when measuring voltage with
the 8954.)
2. To remove the BNC connector, turn it to the left to release the lock, then
pull it out.
Connecting the thermocouple (when measuring temperature)
1. First, remove the covering from the thermocouple.
2. Press the button with a tool, such as a screwdriver.
3. With the button pressed down, insert the thermocouple into the connection
slot.
4. When you release the button, the thermocouple is fixed in place.
5. To remove the thermocouple, hold down the button and pull out the
thermocouple.
────────────────────────────────────────────────────
2.4 Connection of the Input Product
Page 39

19
────────────────────────────────────────────────────
How to remove the covering from the thermocouple
25 mm
10 mm
External covering
Internal covering Thermocouple wire
Recommended diameter
φ
0.4 mm to 1.2 mm
(AWG26 to 16)
NOTE
To install and remove the thermocouple, use a tool such as a screwdriver.
The push-button terminal block on the 8954 VOLTAGE/TEMP UNIT is for
use with a thermocouple. Only connect the thermocouples specified (types
K, J, E, T, N, R, S, B, and W).
If you reverse the + and connections on the thermocouple, the correct value
will not be displayed.
────────────────────────────────────────────────────
2.4 Connection of the Input Product
Page 40

20
y
────────────────────────────────────────────────────
2.5 Logic Probe Connection
DANGER
The logic input and 8855 instrument share a common ground.
Therefore, if power is supplied to the measurement object of the
logic probe and to the 8855 from different sources, an electric
shock or damage to the equipment may result.
Even if power is supplied from the same system, if the wiring is
such that a potential difference is present between the grounds,
current will flow through the logic probe so that the measurement
object and 8855 could be damaged. We therefore recommend the
following connection method to avoid this kind of result.
(1) Before connecting the logic probe to the measurement object,
be sure that power is supplied from the same outlet box to the
measurement object and the 8855 using the supplied power
cord.
(2) Before connecting the logic probe to the measurement object,
connect the ground of the measurement object to the 8855
ground terminal. Also in this case, power should be supplied
from the same source. Refer to Section 2.2, "Power Supply and
Ground Connections" for grounding terminal details.
Object to be
measured
8855
Object to be
measured
8855
NOTE
GND
Functionground terminal
In this case too, obtain power
from the same supply.
Power suppl
Figure 2
Outlet
Figure 1
Ground
The logic input is located on the rear of the
instrument. Up to four probes can be connected.
Since one logic probe can record 4 channels, the
combined maximum recording capability for logic
waveforms is 16 channels.
Connect the probe by aligning the groove on the plug
with the ridge on the connector.
If no logic probe is connected, the corresponding logic waveform is
displayed on the screen at high level.
Carefully read the instruction manual supplied with the probe.
Do not connect logic probes other than supplied by HIOKI to the logic inputs.
────────────────────────────────────────────────────
2.5 Logic Probe Connection
Page 41

21
────────────────────────────────────────────────────
2.6 9018-10, 9132-10 CLAMP ON PROBE Connection
DANGER
Clamp-on probe should only be connected to the secondary
side of a breaker, so the breaker can prevent an accident if a
short circuit occurs. Connections should never be made to the
primary side of a breaker, because unrestricted current flow
could cause a serious accident if a short circuit occurs.
Before using the 9018-10, 9132-10 CLAMP ON PROBE, be
certain that you understand the instructions and precautions
in the manual
This instrument measures input voltage, so although current can not be
measured directly, current can be measured by the voltage output from the
HIOKI 9810-10, 9132-10 CLAMP ON PROBEs.
Connect the BNC connector of the CLAMP ON PROBE to the analog input
terminal. For details, refer to "Connecting the Connection cord
(for voltage measurement)" of 2.4.2.
NOTE
9018-10
9132-10
The 8855 will indicate measurement results as voltage.
Using the scaling function, units can be converted to "A" for display. See
Section 5.3.2.
When the clamp-on probe is used for measurement, the measurement
precision will be affected both by the 8855 precision and clamp-on probe
precision ratings. The same is true for cases where other clamps are used.
When using the 9199 CONVERSION ADAPTOR, the 9018, 9132 CLAMP
ON PROBEs can be used.
────────────────────────────────────────────────────
2.6 9018-10, 9132-10 CLAMP ON PROBE Connection
Page 42

22
────────────────────────────────────────────────────
2.7 9322 DIFFERENTIAL PROBE Connection
DANGER
When using grabber clips, the 9322's maximum rated voltage to
earth is 1500 V AC or DC (CAT ll) / 600 V AC or DC (CAT lll);
when using alligator clips, it is 1000 V AC or DC (CAT ll) / 600 V
AC or DC (CAT lll). To avoid electrical shock and possible
damage to the instrument, never apply voltage greater than
these limits between the input channel terminals and chassis,
or across the input of two 9322s.
Maximum input voltage is 1000 V AC/2000 V DC (CAT ll) / 600 V
AC or DC (CAT lll). Attempting to measure voltage in excess of
the maximum rating could destroy the instrument and result in
personal injury or death.
Grabber clips
H
Alligator clips
H-L
2,000 V DC,
1,000 V AC (CAT II)
600 V AC, DC (CAT III)
L
H-GND
1,500 V AC, DC (CAT II)
600 V AC, DC (CAT III)
L-GND
1,500 V AC, DC (CAT II)
600 V AC, DC (CAT III)
H
H-L
2,000 V DC,
1,000 V AC (CAT II)
600 V AC, DC (CAT III)
L
H-GND
1,000 V AC, DC (CAT II)
600 V AC, DC (CAT III)
L-GND
1,000 V AC, DC (CAT II)
600 V AC, DC (CAT III)
9322 is a differential probe that connects to input of 8855 MEMORY
HiCORDER input module. For more details, refer to its instruction manual.
────────────────────────────────────────────────────
2.7 9322 DIFFERENTIAL PROBE Connection
Page 43

23
────────────────────────────────────────────────────
2.8 9665 10:1 PROBE / 9666 100:1 PROBE
DANGER
NOTE
10:1 and 100:1 probe connections
The maximum rated to-voltage does not change when using a
9665 10:1PROBE or a 9666 100:1PROBE. To avoid electrical
shock or damaging the 8855 instrument, make probe
connections in such a manner that the method for the probe,
and make sure the to-ground voltage does not exceed the
rated maximum.
The maximum input voltage is 1,000 Vrms (1MHz max) for the
9665 10:1PROBE, and 5,000 Vpeak (1MHz max) for the 9666
100:1PROBE. (The measurement category (overvoltage
category) is the same as that of the input modules of
MEMORY HiCORDERs that use the 9665 and the 9666. ) Do not
measure voltages that exceed the maximum input voltage, as
the 8855 instrument could be damaged and an accidents
resulting in injury or death could result.
The 9665 10:1PROBE and the 9666 100:1PROBE cannot be used with the
8951 VOLTAGE/CURRENT UNIT, the 8954 VOLTAGE/TEMP UNIT, or
the 8955 F/V UNIT.
For details on the 9665 10:1PROBE and the 9666 100:1PROBE, refer to the
instruction manuals supplied with the respective probes.
────────────────────────────────────────────────────
2.8 9665 10:1 PROBE / 9666 100:1 PROBE
Page 44

24
────────────────────────────────────────────────────
2.9 Loading Recording Paper (when the 8994 PRINTER
UNIT is installed)
1. Press the stock cover and open it.
Stock cover
Head up/down
lever
2. Put down the head up/down lever.
Holder
Printer roller
Attachment
Back side of
paper
3. Insert the attachments into the ends of the roll of
recording paper and set the paper into its holder.
4. Insert the leading edge of the recording paper
from above into the gap behind the printer roller,
and pull it out to the other side.
────────────────────────────────────────────────────
2.9 Loading Recording Paper (when the 8994 PRINTER UNIT is installed)
Page 45

25
────────────────────────────────────────────────────
5. Align the edges of the recording paper you
pulled out of the printer with the edges of the
recording paper set into the holder.
If the edges of the recording paper are not
aligned exactly, the paper will come out crooked
when printing.
6. Raise the head up/down lever.
7. Pull the recording paper to the outside through
the printer exit slot in the stock cover.
CAUTION
8. Close the stock cover, and finish by tearing off
the recording paper against the edge of the
printer exit slot.
Always place the product in the head-up condition when it is to be
transported or stored for an extended period of time. If the product
is left idle for a long time with the head pressing on the roller, the
roller may be deformed, resulting in uneven printing.
NOTE
Make sure that the paper may jam if it is not aligned with the roller.
Printing is not possible if the recording paper is loaded wrong-side up.
────────────────────────────────────────────────────
2.9 Loading Recording Paper (when the 8994 PRINTER UNIT is installed)
Page 46

26
────────────────────────────────────────────────────
2.10 Care of Recording Paper
Care of recording paper
While unopened, thermal paper will not be affected by the environment,
provided that ambient temperature and humidity do not exceed normal
levels. For long-term storage, temperature should be lower than 40 .Low
temperatures cause no problem.
After opening, protect the paper from strong light, to prevent discoloration.
Storing data recordings
As the recording paper is thermally sensitive, be aware of the following
points:
To avoid paper discoloration, do not expose it to direct sunlight.
Store at no more than 40 and 90% RH.
For permanent storage of important recorded data, photocopy the recording
paper.
Thermal paper will blacken when brought into contact with alcohol, ester,
ketone, or other volatile organic substances.
If the thermal paper absorbs an organic solvent such as alcohols or ketones it
may no longer develop properly, and recorded information may fade. Soft
PVC film and transparent contact adhesive tape contain such solvents, so
avoid using them with recordings.
The thermal recording paper is ruined by contact with wet Daizo copy paper.
Direct sunlight Organic solvent
────────────────────────────────────────────────────
2.10 Care of Recording Paper
Page 47

27
────────────────────────────────────────────────────
2.11 Notes on Measurement
DANGER
Maximum input voltage ratings for the input module and the
input terminals of the instrument are shown below. To avoid
the risk of electric shock and damage to the instrument, take
care not to exceed these ratings.
The maximum rated voltage to earth of the input module
(voltage between input terminals and main instrument frame
ground, and between inputs of other analog input modules) is
shown below. To avoid the risk of electric shock and damage
to the instrument, take care that voltage between channels
and between a channel and ground does not exceed these
ratings.
The maximum rated voltage to earth rating applies also if an
input attenuator or similar is used. Ensure that voltage does
not exceed these ratings.
When measuring power line voltages with the 8950, 8952 or
8953-10, always connect the probe to the secondary side of
the circuit breaker. Connection to the primary side involves
the risk of electric shock and damage to the instrument.
Before using the instrument, make sure that the insulation on
the connection cords is undamaged and that no bare
conductors are improperly exposed. Using the products in
such conditions could cause an electric shock, so contact
your dealer or Hioki representative for replacements. (Model
9197 or 9198 CONNECTION CORD.)
Input/output terminal Maximum input voltage Maximum rated voltage to earth
8950 (input) 400 V DC max. 370 V AC/DC
8951 (input) 30 V rms or 60 V DC 30 V rms or 60 V DC
8952 (input) 400 V DC max. 370 V AC/DC
8953-10 (input) 400 V DC max. 370 V AC/DC
8954 (input) 30 V rms or 60 V DC 370 V AC/DC
8955 (input) 30 V rms or 60 V DC 30 V rms or 60 V DC
9322
EXT TRIG/ START
STOP/ EXT SMPL
TRIG OUT/ GO/ NG/
EXT.OUT
────────────────────────────────────────────────────
2000 V DC, 1000 V AC (CAT
II)
600 V DC/AC (CAT III)
-5 to +10 V DC
-20 V to +30 V DC
500 mA max./ 200 mW max.
When using grabber clips
1500 V DC/AC (CAT II), 600 V DC/AC (CAT III)
When using alligator clips
1000 V DC/AC (CAT II), 600 V DC/AC (CAT III)
Not insulated
2.11 Notes on Measurement
Page 48
28
────────────────────────────────────────────────────
WARNING
CAUTION
In order to avoid accidents from electric shock, before
removing or replacing an input module, check that the
connection cords and thermocouple are disconnected, turn
off the power, and remove the power cord.
To avoid the danger of electric shock, never operate the
instrument with an input module removed. To use the
instrument after removing an input module, install a blank
panel over the opening of the removed module.
When making measurements on an AC power line for example,
using a voltage transformer, be sure to connect the voltage
transformer ground terminal to ground.
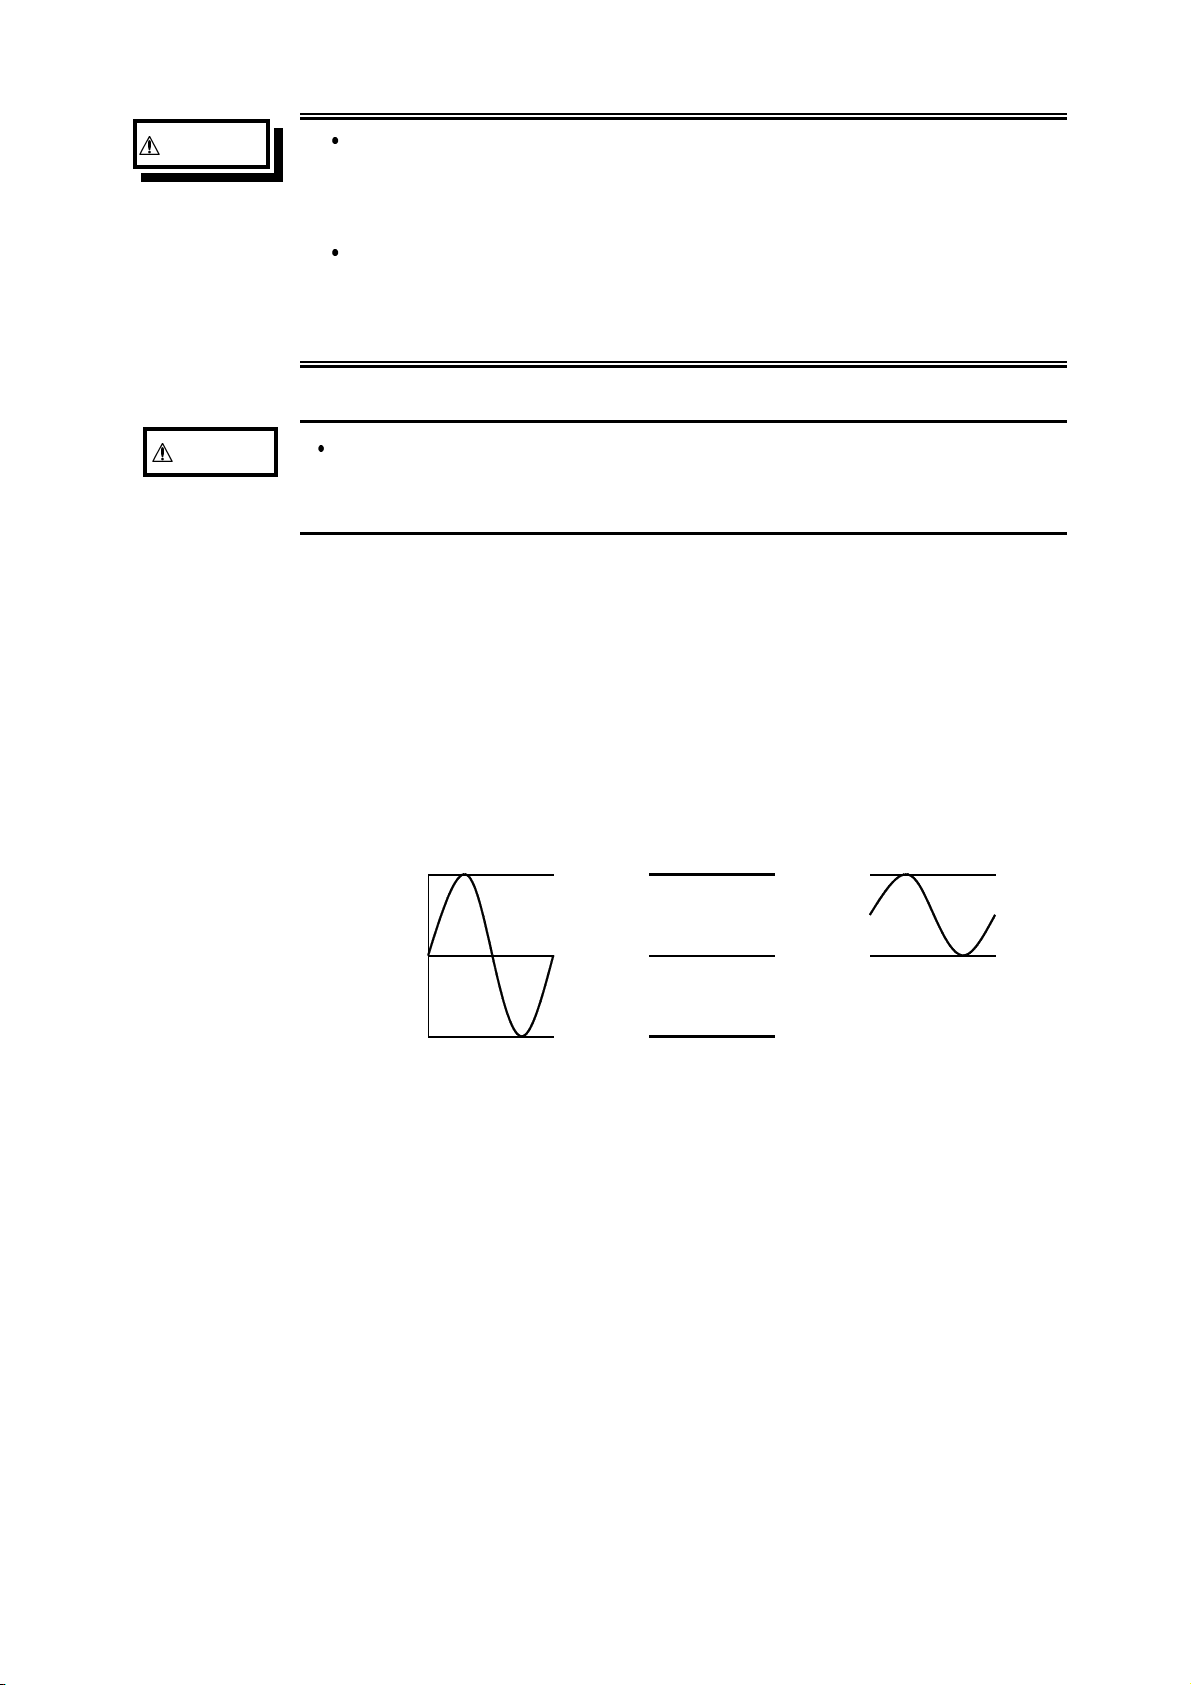
Difference between "370 V AC, DC" and "400 V DC max."
indication
370 V AC, DC: RMS value is displayed.
400 V DC max.: Instantaneous value is displayed.
The maximum input voltage (400 V DC max.) is defined as the
superposition of DC component and AC peak, as shown in the figure below.
AC DC DC+AC
+400 V DC
0V
-400 V DC
────────────────────────────────────────────────────
2.11 Notes on Measurement
Page 49

29
────────────────────────────────────────────────────
2.11.1 Maximum Input Voltage
8950 ANALOG UNIT/ 8952 DC/RMS UNIT
8953-10 HIGH RESOLUTION UNIT
8855
GND
8950
8953-10
H
L
8951 VOLTAGE/CURRENT UNIT
8855
GND
8951
Connector
BNC
H
L
H
L
8954 VOLTAGE/TEMP UNIT
8855
GND
8954
H
L
400 V DC max.
370 V AC, DC
30 V rms or 60 V DC
30 V rms or 60 V DC
30 V rms or 60 V DC
30 V rms or 60 V DC
370 V AC, DC
370 V AC, DC
30 V rms or
60 V DC
370 V AC, DC
8955 F/V UNIT
8855
GND
8955
H
L
30 V rms or 60 V DC
30 V rms or 60 V DC
30 V rms or
60 V DC
────────────────────────────────────────────────────
2.11 Notes on Measurement
Page 50

30
────────────────────────────────────────────────────
2.11.2 Using a Voltage Transformer
When making measurements on an AC power line for example, using a
voltage transformer, be sure to connect the voltage transformer ground
terminal to ground.
When the voltage transformer has a ground terminal
8855
GND
8950
H
L
PT
Input
Voltage transformer
(PT) ground terminal
Ground
When the voltage transformer has no ground terminal
8855
GND
8950
H
L
Ground
PT
Input
────────────────────────────────────────────────────
2.11 Notes on Measurement
Page 51

31
────────────────────────────────────────────────────
Chapter 3
1
1
2
2
Recorder & Memory Function
3.1 Overview of the Recorder & Memory Function
The recorder and memory function has the following features.
(1) After being stored in the internal memory, input signal data can be displayed
and printed.
(2) All input channel data are recorded on the same time axis.
Since data for all channels can be superimposed, the relative relationship
between input signals can be observed visually.
(3) Simultaneous Display of Recorder and Memory Waveforms
(4) Time axis setting
10 ms/DIV to 1 h/DIV (recorder, 17 steps)
10 µs/DIV to 5 min/DIV (memory, 20 steps)
3
3
4
4
5
5
6
6
7
7
8
8
9
9
(5) Time axis resolution 100 points/DIV
(6) Storage capacity
32 M words (DIV) 10000 (Recorder) 20000 (Memory)
128 M words (DIV) 40000 (Recorder) 80000 (Memory)
512 M words (DIV) 160000 (Recorder) 320000 (Memory)
Desired setting: in addition to the above recording lengths, 1-division steps
up to the highest division are possible
(7) Display format
Single, dual, quad, oct screen display
(8) Printing
Real-time print (recorder only), manual print, partial print, report print,
screen hard copy can be printed.
(9) High-quality print
Smooth print function approximates analog waveform.
(10) Additional recording function
The first set of measurement data is preserved, and recording of the second
set of measurement data starts after the first set.
(11) Logging function
Numeric printout of waveform data
10
10
11
11
12
12
13
13
14
14
A
A
────────────────────────────────────────────────────
3.1 Overview of the Recorder & Memory Function
Page 52

32
────────────────────────────────────────────────────
3.2 Operation Sequence (REC&MEM)
Preparation
See Chapter 2
Basic Settings
Settings on the STATUS screen
See Section 3.3
Press the
the STATUS screen.
STATUS
key to display
Installation of the Instrument
Turn on the power
Connect the inputs
Function
Select the recorder and memory
function.
Time axis range
(Recorder/Memory
waveform setting)
Recording length
Determine the speed with which
the input signal waveform is
captured.
Determine the length of the data
sample for a single measurement.
Display function
Select the waveform data
(recorder/memory) on the
waveform display screen.
Display format
Select the format type for the
waveform display screen.
Additional recording
Set whether additional recording
is required.
Setting the printer
See Section 3.6
Saving the file
See
Section 3.7
Advanced Settings
(Use this function, if necessary.)
Settings on the STATUS2 screen
Setting the print
mode
Select the format, waveform, or
numerical value should be used
to output measured data and
calculation results.
Setting the print
mode
Select whether or not to print out
the waveform automatically after
it is captured.
Auto save function Select whether or not to save the
waveform automatically after it is
captured.
Memory segmentation
See Chapter 6
────────────────────────────────────────────────────
3.2 Operation Sequence (REC&MEM)
Page 53

33
────────────────────────────────────────────────────
Setting the input channel
Settings on the channel screen
Settings the advanced function
Setting the trigger function
See Quick Start
Chapter 7
See Quick Start Chapter 6
Waveform display color
Waveform display graph
Voltage axis range
Input coupling
Logic input
Magnification/compression along voltage
Zero position
Zero adjustment
Low-pass filter
Variable function (See Section 5.2)
Scaling function (See Section 5.3)
Comment function (See Section 5.4)
Vernier function (See Section 5.6.3)
Trigger mode
Trigger source
Pre-trigger
Trigger selection
1
2
3
4
5
6
7
Start measurement
Press the
When the trigger conditions are met, measurement start.
Press the
Processing measurement data
Measurements on display screen
Stop measurement
Setting the system
Press the
SYSTEM screen. (See Quick Start Chapter
9)
SYSTEM
key to display the
START
STOP
key and the LED lights.
key and the LED goes out after measurement has finished.
Printing the measurement data (See Chapter 10)
Saving the measurement data (See Quick Start Chapter 10)
Waveform scrolling (See Quick Start Section 8.1)
Using the A B cursor (See Quick Start Section 8.2)
Magnification/compression ratio along time axis
(See Quick Start Section 8.3)
Set up (See Quick Start Section 9.2)
File (See Quick Start Section 9.3)
Printer (See Quick Start Section 9.4)
Interface (See Chapter 11)
Initialize (See Quick Start Section 9.5)
Self-check (See Quick Start Section 9.6)
8
9
10
11
12
13
14
────────────────────────────────────────────────────
3.2 Operation Sequence (REC&MEM)
A
Page 54

34
────────────────────────────────────────────────────
3.3 STATUS Settings (REC&MEM: STATUS Screen)
Press the
STATUS
key to access the STATUS screen. This section explains
how to set the STATUS screen of the recorder and memory function. See
the corresponding sections for items that can be set in the Waveform display
or CHANNEL screens.
Waveform display screen: See Section 3.5
CHANNEL screen: See Quick Start Section 6.3
See Sections
3.3.1
3.3.2
3.3.3
3.3.5
3.3.4
NOTE
────────────────────────────────────────────────────
3.3 STATUS Settings (REC&MEM: STATUS Screen)
The settings of memory segmentation function, see Chapter 6.
Page 55

35
────────────────────────────────────────────────────
3.3.1 Setting the Function Mode
The 8855 has four function modes. Select the Recorder and Memory
functions.
Procedure Screen: STATUS, CHANNEL, Waveform display, TRIGGER, SYSTEM
1. Use the Menu keys to display the desired screen.
2. Move the flashing cursor to the top position.
3. Select the
REC&MEM
function key display.
1
2
3
Function
display
Recorder & Memory Function Operation
During real-time signal recording with the recorder function, if an abnormal
phenomena latches the trigger, that period is recorded simultaneously by the
high-speed sampling memory recorder. Normal recorder operation is not
suspended during memory recording, so the real-time recording continues
through the abnormal phenomena.
Low-speed Recorder recording
Meaning
:
Memory recorder function
:
Recorder function
:
Recorder & Memory function
:
FFT function
4
5
6
7
8
9
High-speed Memory recording
10
11
12
13
14
A
────────────────────────────────────────────────────
3.3 STATUS Settings (REC&MEM: STATUS Screen)
Page 56

36
────────────────────────────────────────────────────
3.3.2 Setting the Time Axis Range
Set the speed for inputting and storing the waveform of the input signal.
Time axis range setting expresses the time for 1 DIV. The sampling period is
1/100th of the set value for the time axis range. (100 samples/DIV)
The sampling period for the sampling recorder is set by the memory.
Procedure 1 1. Use the Menu keys to display the desired screen.
Screen: Waveform display
Procedure 2 1. Press the
NOTE
Screen: STATUS
2. Move the flashing cursor to the
Time/Div
item.
3. Move the flashing cursor to the time axis range for recorder or memory to
make the selection by using the Jog/Shuttle control, the function keys.
For the time axis range setting for the recorder, the
TIME/DIV
knob can be
also used.
key to display the Waveform display screen.
DISP
2. Move the flashing cursor to
waveform) or
rec&MEM
3. Move the flashing cursor to the
Function change
(memory waveform) by using theF4function key.
time axis range
4. Use the Jog/Shuttle control, the function keys, or
setting. The
TIME/DIV
knob can be used regardless of where the flashing
and select
item.
TIME/DIV
REC&mem
(recorder
knob to make the
cursor is located.
The sampling period of the recorder is the same as that set for memory, so
depending on the memory sampling period, the time axis may not be
settable for the recorder.
When the time axis range for recorder is set to the fast range (greater than
200 ms/division), the real-time print setting is automatically off.
10 µs
20 µs
50 µs
100 µs
200 µs
500 µs
1ms
2ms
5ms
10 ms
20 ms
50 ms
100 ms
200 ms
500 ms
1s
2s
5s
10 s
30 s
1min
2min
5min
Combination of the recorder and memory time axis range.
Vertical axis: time axis range of memory waveform (/DIV), horizontal axis:
time axis range of recorder waveform (/DIV)
10 ms 20 ms 50 ms 100 ms200 ms500 ms 1 s 2 s 5 s 10 s 30 s 1 min 2 min 5min10 min 30 min 1 hour
zzzzzzzzzzzzzz zzz
zzzzzzzzzzzzzz zzz
zzzzzzzzzzzzzz zzz
zzzzzzzzzzzzzz zzz
zzzzzzzzzzzzzz zzz
zzzzzzzzzzzzzz zzz
zzzzzzzzzzzzzz zzz
zzzzzzzzzzzzzz zzz
- zzzzzzzzzzzz
- -
- - -
- - - -
- - - - -
- - - - - -
- - - - - - -
- - - - - - - -
- - - - - - - - - zz
- - - - - - - - - - z
- - - - - - - - - - -
- - - - - - - - - - - - z
- - - - - - - - - - - - -
- - - - - - - - - - - - - -
- - - - - - - - - - - - - - - zz
z z z z z z z z z z z z zzz
z z z z z z z z z z z zzz
z z z z z z z z z z zzz
z z z z z z z z z zzz
z z z z z z z z zzz
z z z z z z z zzz
z z z z z z zzz
z z z zzz
z z z zzz
z z z zzz
z zzz
z zzz
z zzz
zzz
────────────────────────────────────────────────────
3.3 STATUS Settings (REC&MEM: STATUS Screen)
Page 57

37
────────────────────────────────────────────────────
3.3.3 Setting the Recording Length
The length of recording for one measurement operation (number of DIV) can
be set.
The recording lengths for the recorder and memory are set separately. Two
setting methods are available.
SELECT
ARBITRARY Variable recording length can be selected by the user.
Screen: STATUS, Waveform display
Procedure 1 Constant recording length mode
1. Use the Menu keys to display the desired screen.
2. Move the flashing cursor to the
3. To set the recording length, move the flashing cursor to either Recorder or
Memory, according to which is to be set, and select
4. Use the Jog control or the function keys to make a setting.
Select the recording length.
Function
display
Meaning
Shot
item.
SELECT
.
:
Move the cursor up in the selection window.
:
Move the cursor down in the selection window.
Setting the recording length to continuous
:
format.
Procedure 2 Variable recording length mode
1. Use the Menu keys to display the desired screen. Move the flashing cursor
to the
Shot
item.
2. To set the recording length, move the flashing cursor to either Recorder or
Memory, according to which is to be set, and select
3. Use the Jog/Shuttle control or the function keys to make a setting.
Function
display
Meaning
:
Increases in number. (+50)
:
Increases in number. (+1)
:
Decreases in number. (-1)
:
Decreases in number. (-50)
ARBITRARY
.
NOTE
If the recording length is changed during measurement, measurement is
restarted using the newly set recording length.
The memory capacity of 32 M words can accommodate up to 10000
divisions (recorder) or 20000 divisions (memory) of waveform data. With
128 M words, waveform data of up to 40000 divisions (recorder) or 80000
divisions (memory) can be saved. With 512 M words, waveform data of up
to 160000 divisions (recorder) or 320000 divisions (memory) can be saved.
────────────────────────────────────────────────────
3.3 STATUS Settings (REC&MEM: STATUS Screen)
Page 58

38
────────────────────────────────────────────────────
3.3.4 Display Function
The type of display waveform can be selected.
Procedure
1. Press the
2. Move the flashing cursor to the
3. Use the function keys to make a setting.
NOTE
Screen: STATUS
STATUS
Function
display
:
:
:
The type of display waveform can be set by pressing the
key to display the STATUS screen.
Function
Meaning
Memory waveform is displayed
Recorder waveform is displayed
Displays both the memory (MEM) waveform
and recorder (REC) waveform
item.
REC&MEM
function key on the Waveform display screen.
The memory waveform in Recorder and Memory function can be also
displayed in memory recorder function.
The display function setting cannot be changed during measurement.
Starting up the 8855 with memory waveform display ON automatically
selects REC&MEM display.
────────────────────────────────────────────────────
3.3 STATUS Settings (REC&MEM: STATUS Screen)
Page 59

39
────────────────────────────────────────────────────
3.3.5 Setting the Display Format
The style can be set for showing input signals on the screen display and
recording them on the printer.
The styles single, dual, quad, and oct are available.
Procedure Screen: STATUS
Flashing cursor
1. Press the
STATUS
screen.
2. Move the flashing cursor to the
key to display the Status
Format
item, as
shown in the figure on the left.
3. Use the function keys to select the display
format.
Function
display
Meaning
:
Display and record the waveform in one graph.
:
Display and record the waveform in two graphs.
Display and record the waveform in four
:
graphs.
:
Display and record the waveform in oct graphs.
On the channel screen, set the graph position of the display screen or
waveform to be printed. This setting is valid when [Display format setting]
on the status screen is set to a format other than single screen.
Flashing cursor
NOTE
Procedure Screen: ONE CH, LIST (CHANNEL)
1. Press the
CHAN
key to display the Channel
screen.
2. Move the flashing cursor to the position of the
Graph
3. Use the function keys or
to be set.
control to make
JOG
the selection.
Function
display
Meaning
:
Increases in number
:
Decreases in number
Setting the display function to memory waveform and recorder waveform
invalidates the display format setting.
────────────────────────────────────────────────────
3.3 STATUS Settings (REC&MEM: STATUS Screen)
Page 60

40
)
)
s
────────────────────────────────────────────────────
3.4 Setting the Additional Recording Function
This records, regarding the memory as though it were recording paper.
As waveforms captured by the recorder are stored in the instrument's
memory, this machine can be operated as a paper recorder.
The memory capacity of 32 M words can accommodate up to 10000
divisions of waveform data. With 128 M words (after optional memory
expansion), waveform data of up to 40000 divisions can be saved. With 512
M words (after optional memory expansion), waveform data of up to 160000
divisions can be saved.
The waveform can be scrolled and printed out.
Switching the additional recording on and off affects the use of memory as
shown below.
(When the recording length is set to 30 divisions)
Additional recording: OFF
Additional recording: ON
Initial recording
Records 30 divisions of data
10000 DIV(No memoryexpansion
30 DIV
Second recording
Records a further 30 divisions of data
Initial measurements are erased, and new
data is recorded from the beginning of
the memory.
30 DIV
Initial recording
Records 30 divisions of data
10000 DIV(No memoryexpansion
30 DIV
Second recording
New data is recorded from the end of
existing data without erasing the previou
measurements.
30 DIV
30 DIV
The first and second sets of
waveforms can be observed by
scrolling or printing the waveform.
Procedure Screen: STATUS
1. Press the
STATUS
2. Move the flashing cursor to the
key to display the STATUS screen.
Record Add
item.
3. Use the function keys to make a setting.
Function
display
────────────────────────────────────────────────────
3.4 Setting the Additional Recording Function
Meaning
:
Additional recording is disabled.
:
Additional recording is enabled.
Page 61

41
────────────────────────────────────────────────────
NOTE
Time values output to the printer and displayed on the screen with the
additional recording function enabled are equal to those of the most recently
acquired waveforms. Therefore, when measuring waveforms in a different
time axis range, always take that difference into consideration.
When the 10000 (128 M words: 40000, 512 M words: 160000) DIV has
been reached, old data will be overwritten.
In the recorder, the trigger mark ( ) is written as the start position mark. In
an additional recording, the trigger mark is displayed in front of the most
recently entered data.
If auto-save is enabled, only newly acquired waveforms are saved. Even
when A and B cursors appear on the screen, no partial save is performed,
because the setting is disabled when the
START
key is pressed.
A one-line data appears between the two measurements to delimit them.
(The line of data is vertical.)
When using the 8953-10 HIGH RESOLUTION UNIT, 8954
VOLTAGE/TEMP UNIT, or 8955 F/V UNIT, and its additional recording
function is active, if logic input is activated during measurement, a logic
waveform is displayed, but the data is invalid. When measurement is made
with additional recording ON, the screen shows the logic waveform obtained
before additional recording was turned on, but the data is invalid. If logic
input is active, the analog data corresponding to that logic channel becomes
12-bit data. For details,
see Quick Start Section 6.3.10.
3.5 Settings on the Waveform Display Screen (REC&MEM)
Explains the setting items on the Waveform display screen.
For details on setting,
When want to use the Jog/Shuttle control, press the
selection window is not displayed.)
Pressing the F4 function key "REC&MEM" on the Waveform display screen
toggles screen between memory waveform and recorder waveform.
REC&mem
rec&MEM
REC&MEM
Recorder waveform display in Recorder and Memory function
Memory waveform display in Recorder and Memory function
Displays both the recorder waveform and memory waveform
refer to Section 3.3
.
VALUE
select key. (The
────────────────────────────────────────────────────
3.5 Settings on the Waveform Display Screen (REC&MEM)
Page 62

42
────────────────────────────────────────────────────
1 4
Setting items Selection Explanation
1. Function
2. Trigger mode
(recorder waveform)
3. Pre-trigger
(memory waveform)
Time Axis Range
4.
MEM, REC, FFT,
REC&MEM
SINGLE, REPEAT,
TIMER
0to100%,-95%
10 ms/DIV to
1h/DIV(REC)
10 µs/DIV to
5 min/DIV (MEM)
6 5
2
Select function.
Select trigger mode.
Set the Pre-trigger.
Set the speed for inputting and
storing the waveform of the input
signal.
Time axis range setting expresses
the time for 1 DIV.
5. Magnification
/compression
along the time axis
x 1 to x 1/500 (REC)
x 10 to x 1/10000
(MEM)
By magnifying the waveform,
detailed observations can be made.
By compressing the waveform, an
entire change can be promptly
apprehended.
6. Recording Length
Input channel settings
SELECT:
30 DIV to continuous
(REC)
30 DIV to 20000 DIV
(MEM)
ARBITRARY:
1 DIV to 10000 DIV
(REC)
1 DIV to 20000 DIV
(MEM)
Analog input
Logic input
Using channels: 8 ch
Capacity: 32 M words
The length of recording for one
measurement operation (the number
of DIV) can be set.
Press the
F9 (CH.SET)
Waveform display screen to make
settings for the input channel on
the display. For details, see section
5.6.
Trigger settings
Analog trigger
Press the
F9 (CH.SET)
Memory waveform display screen
to make trigger settings on the
display. For details, refer to Quick
Start chapter 7.
Level monitor function
VIEW function
Press the
MONITOR)
the Waveform display
screen.
Press the
key on the Waveform
display screen.
F8 (LEVEL
key on
F7 (VIEW)
Refer to Quick Start Section 8.5.
Refer to Section 8.1.
3
key on the
key on the
────────────────────────────────────────────────────
3.5 Settings on the Waveform Display Screen (REC&MEM)
Page 63

43
────────────────────────────────────────────────────
3.6 Setting The Printer (Only When The 8994 PRINTER
UNIT Is Installed)
3.6.1 Setting the Print Mode
Select the format, waveform, or numerical value should be used to output
measured data and calculation results.
Waveform The smooth print function can be used, but print speed will
decrease.
Logging
The data spacing interval also must be set.
Procedure
(1) Setting the printer format
1. Press the
2. Move the flashing cursor to the
3. Use the function keys to make a setting.
(2) Setting the smooth printing and print interval
1. When the waveform format is selected, determine whether to use the smooth
2. Move the flashing cursor to the
3. Use the function keys to make a setting.
Screen: PRINTER
SYSTEM
Function
display
:
:
key to display the PRINTER screen.
Print Mode
Meaning
Measurement data and the result of calculation
are printed as a waveform.
Measurement data and the result of calculation
are printed as numeric data.
item.
printing or not. When the numerical value is selected, set the print interval.
(unit: divisions)
smooth print
item or
interval
.
Since 1 division represents 100 samples, the print interval "0.01" refers to a
printout of every sample (no print interval). If the set print interval exceeds
recording length, only the first point is printed.
NOTE
────────────────────────────────────────────────────
Smooth printing is available for memory waveform.
3.6 Setting The Printer (Only When The 8994 PRINTER UNIT Is Installed)
Page 64

44
────────────────────────────────────────────────────
3.6.2 Setting the Real-time Printing Function
The input waveform (recorder waveform) is continuously printed in real
time.
Procedure Screen: PRINTER
1. Press the
SYSTEM
2. Move the flashing cursor to the
3. Use the function keys to make a setting.
Function
display
Meaning
:
Printing is disabled.
:
Printing is enabled.
key to display the PRINTER screen.
Realtime Print
item.
NOTE
When the recorder's time axis is set to 200 ms/DIV or faster, the real-time
printing settings are automatically disabled. Further, when the time axis
range is set to a speed faster than 200 ms/DIV, Real-Time Printing is
automatically disabled.
While the printer always outputs the data at the measurement magnification
in recording mode, the waveform on the screen is reduced in size at the
ratio shown in the table below, depending on the time-axis range.
50 ms/DIV x 1/2, 20 ms/DIV x 1/5, 10 ms/DIV x 1/10
Setting a time axis range faster than 1 s/DIV may result in light printing.
────────────────────────────────────────────────────
3.6 Setting The Printer (Only When The 8994 PRINTER UNIT Is Installed)
Page 65

45
────────────────────────────────────────────────────
3.7 Setting the Auto Save Function
When the function is enabled, measurement data are automatically stored on
a floppy disk, PC card, MO disk or connected SCSI device after they are
captured and the recording is completed. The Auto Save function stores a
file in the directory currently selected on the file screen.
Procedure Screen: STATUS
1. Press the
SYSTEM
2. Move the flashing cursor to the
3. Use the function keys, select the media for auto saving.
Function
display
:
:
key to display the STATUS screen.
Auto Save
Meaning
Auto save is disabled.
Automatically stored on floppy disk
item.
:
Automatically stored on PC card.
Automatically stored on connected SCSI
:
device.
:
Automatically stored on MO disk.
:
Automatically stored on LAN.
4. Move the flashing cursor to
Function
display
Meaning
:
Data are stored as binary data.
:
Data are stored as text data.
, and select the format.
type
Data stored in the text format is not readable by the 8855.
5. When the data format to be saved is set to text data, the intermittent setting
item is displayed. Use the function keys or Jog/Shuttle control to make a
setting.
6. Set the file name. For the input method, refer to Section 5.4.3.
When using auto-save, a number is appended to the name you specify as the
file name. This then becomes the file name. If you start procedures before
specifying a file name, AUTO is automatically enabled.
7. Set whether a new directory is created when measurement data is saved.
8. Select the channels to be saved. Move the flashing cursor to the
item.
Save
────────────────────────────────────────────────────
3.7 Setting the Auto Save Function
Channel to
Page 66

46
────────────────────────────────────────────────────
9. When Media is selected, the Storage method item appears.
Function
display
Meaning
When [Make directory] is set to [NONE], auto-
:
save is cancelled when the storage
media is full, or when the directory's file count
exceeds 5000.
When [Make directory] is set to [EXIST], a new
directory is created each time the current
directory's file count exceeds 5000, until the
storage media fills up, causing auto-save to
cancel.
When the media becomes full, old files are
:
deleted to make room for automatic storage.
When 1 Block Save is selected with the Binary
Format, the file extension 'MEM' or 'REC' are
deleted. If sequential save is selected, or if the
saving data is 'R&M', this setting is invalid.
When All Block Save is selected with the
Binary Format, this operation is disabled.
With the text format selected, files with the
extension 'TXT' are deleted.
10. Set the data save area.
Select to save all of the waveform data or only the data between cursors A
and B.
NOTE
11. Select the item to be stored.
Function
display
Meaning
:
1 block save of recorder data
:
1 block save of memory data
:
All block save both recorder and memory data
File names consist of 8 characters. With auto-save, since numbers are attached
to the end of file names, long file names are truncated when this number is
appended to the end of the file name.
When automatic storage is selected for both recorder and memory data,
automatic storage is activated (an index file is created). If only recorder or
memory is set for storage, 1 block save is performed.
When auto-save is enabled, the storage channel cannot be selected. Data for the
channel for which the waveform is displayed is saved. For details on auto saving
file name,
see to Quick Start Section 10.7
.
When the recording length of the recorder is set to "CONT.", the auto-saving
cannot be made a setting.
When cursor A and B are enabled, their setting will be preferred.
If additional recording is enabled, only newly acquired waveforms are saved.
Even when A and B cursors appear on the screen, no partial save is performed.
The same media is used for both the recorder and memory. Separate media
cannot be selected.
The directory and the number of files that can be stored in the directory are
limited. For details,
see Quick Start Section 10.7
.
During automatic storage, if the STOP key is pressed to interrupt measurement,
waveforms taken prior to the interruption are stored automatically.
Do not use the symbols +, =, and [,] in a file name. A file containing any of
these symbols in its file name cannot be processed under Windows 2000 or XP.
────────────────────────────────────────────────────
3.7 Setting the Auto Save Function
Page 67

47
────────────────────────────────────────────────────
3.8 Simultaneous Display of Recorder and Memory
Waveforms
A recorder waveform and memory waveform can be displayed
simultaneously on the screen.
This allows trigger activation using memory to
analyze in detail an incident that occurs during
recording.
Top :Recorder waveform
Bottom :Memory waveform
Use with memory segmentation
By using memory segmentation, you can divide an incident during recording
on the recorder into a set number of blocks.
The numbers shown on the recorder waveform
display at the top represent the number of times
data is loaded into memory blocks and the related
trigger positions.
Waveform scroll
When the blinking cursor is on the time axis or zoom for the memory waveform
at the bottom of the screen, or when the VIEW function is ON, the MEM
waveform can be scrolled. Otherwise, the REC waveform can be scrolled.
Search
Search will be performed on the MEM waveform. To search the REC waveform,
switch the screen for REC waveform display only.
The waveform print after measurement, numeric data print, and
A/B cursors are for MEM waveforms only.
NOTE
────────────────────────────────────────────────────
There is dead time between recorder startup and memory startup (trigger
standby) due to internal processing.
When memory segmentation has been performed, dead time occurs due to
display and interblock processing.
3.8 Simultaneous Display of Recorder and Memory Waveforms
Page 68
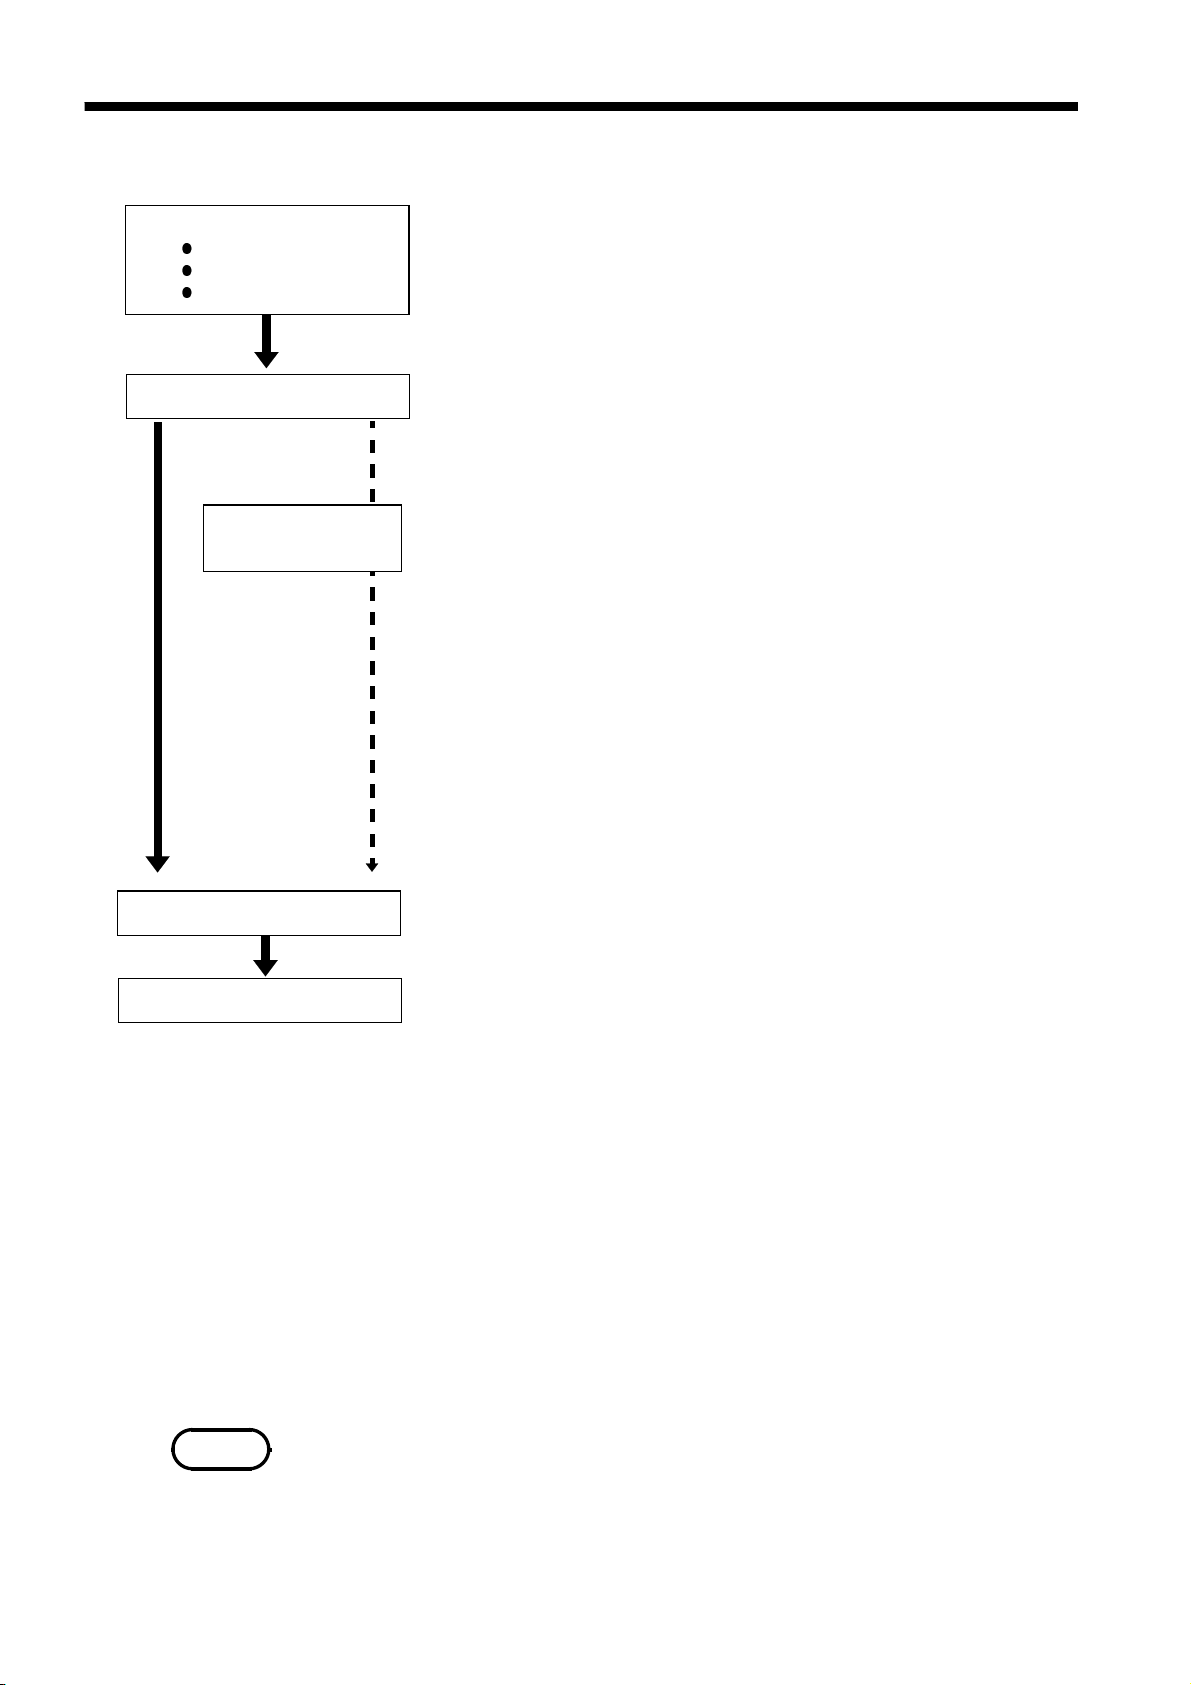
48
────────────────────────────────────────────────────
3.9 Start and Stop Operation (REC&MEM)
Setting the 8855
STATUS Settings
Channel Settings
Trigger Settings
See Section 3.3, "STATUS Settings", Chapter 5, "Input Channel
Settings", Quick Start Chapter 7, "Trigger Functions."
Measurement start
Recorder
waveform
Trigger condition
Recording end
Memory
waveform
are met
Press the
START
key and LED light.
Setting the trigger to Timer causes a delay until the set time.
Displays "Storing" during storing the recorder waveform.
When the printer is enabled, the recording waveform is printed
at the same time it is displayed.
Using the VIEW key to display the time (from measurement
started time).
Data recording starts when trigger condition of memory
waveform is met.
When Pre-Trigger is enabled during waveform storage, if the
trigger conditions are met before the trigger point, data
collection begins at that time.
When automatic storage is enabled and measurement is
interrupted in progress, measurement data taken prior to the
interruption point is stored automatically.
Auto save is executed.
Measurement end
Trigger mode SINGLE
REPEAT
End of measurement
Starts measurement again.
Waveform data stored in memory blocks is cleared.
Press the
TIMER
Measurement is repeated at the set time interval until the
specified stop time.
During storing the waveform data, the following message is displayed:
"MEMORY WAVE WAIT TRIG": Waiting for trigger
"MEMORY WAVE STORING": Storing memory waveform
"MEMORY WAVE STORE END": End of storing memory waveform
When using the sequential save function:
"MEMORY WAVE XXX/000": Displays stored block
(XXX: the last stored block, 000: number of memory divisions)
NOTE
Numeric operation is possible using the memory function for a memory
waveform loaded using the Recorder & Memory function. When memory
segmentation is OFF, waveform processing is also possible. Note that when
waveform processing is performed, the recorder waveform loaded by the
Recorder & Memory function will be lost.
STOP
key.
────────────────────────────────────────────────────
3.9 Start and Stop Operation (REC&MEM)
Page 69

49
────────────────────────────────────────────────────
Chapter 4
1
2
4.1 Overview of the FFT Function
The FFT function has the following features.
(1) FFT (Fast Fourier Transform) processing can be performed on input signal
data for frequency analysis.
(2) Frequency range
133 mHz to 8 MHz
(3) Frequency resolution
1/400, 1/800, 1/2000, 1/4000 of frequency range
(4) 12 types of analysis functions
Storage waveform, linear spectrum, RMS spectrum, power spectrum, autocorrelation function, histogram, transfer function, cross-power spectrum,
cross- correlation function, unit-impulse response, coherence function, octave
analysis
(5) Analysis modes
1-channel FFT, 2-channel FFT
(6) Analysis of data stored with memory recorder function and recorder and
memory function possible
(7) Switchable anti-aliasing filter
Automatic selection of cutoff frequency to match frequency range (8953-10
HIGH RESOLUTION UNIT)
NOTE
We recommend using an input module equipped with an anti-aliasing filter
that can be enabled to minimize sampling distortions during FFT analysis.
Refer to Appendix 3.9, "FFT Function" for more information about aliasing
distortion and anti-aliasing filters.
FFT Function
3
4
5
6
7
8
9
10
11
12
13
────────────────────────────────────────────────────
4.1 Overview of the FFT Function
14
A
Page 70

50
────────────────────────────────────────────────────
4.2 Operation Sequence (FFT)
Preparation
See Chapter 2
Basic Settings
Settings on the STATUS screen
See Section 4.3
Press the
the STATUS screen.
STATUS
key to display
Installation of the Instrument
Turn on the power
Connect the inputs
Function
FFT mode
Select the FFT function.
Select the using channels (1
channel or 2 channels)
Frequency range
Set the maximum value of
frequency range.
Number of FFT point
Set the number of points for
FFT analysis
Window function
Set the window function to get
input signal.
Display format
Set the display and print formats
for the input signal or analysis
result.
For single and dual screens, set
peak value display.
Setting the printer
See Section 4.4
Reference data
FFT analysis mode
Averaging
Interpolation
Waveform
evaluation
Setting the print
mode
Setting the print
mode
Set the new data or memory
waveform data for the FFT
analysis.
FFT analysis mode
Analysis channel
X- and Y- axis display
Display scale
Set the averaging type and
count.
Select waveform display format
(dot/line)
(item setting/stop mode)
Select the format, waveform, or
numerical value should be used
to output measured data and
calculation results.
Select whether or not to print out
the waveform automatically after
it is captured.
Saving the file
See
Section 4.5
────────────────────────────────────────────────────
4.2 Operation Sequence (FFT)
Auto save function Select whether or not to save the
waveform automatically after it is
captured.
Page 71

51
────────────────────────────────────────────────────
Setting the input channel
Settings on the channel screen
Settings the advanced function
Setting the trigger function
See
Quick Start
Chapter 7
Start measurement
Press the
When the trigger conditions are met, measurement start.
Press the
See Quick Start Chapter 6
Waveform display color
Voltage axis range
Input coupling
Magnification/compression along voltage
Anti-aliasing filter
Zero position
Zero adjustment
Low-pass filter
Comment function See Section 5.4
Trigger mode
Trigger source
Pre-trigger
Trigger selection
START
STOP
key and the LED lights.
key and the LED goes out after measurement has finished.
1
2
3
4
5
6
7
Processing measurement data
Measurements on display screen
Stop measurement
Setting the system
Press the
SYSTEM screen.
See Quick Start Chapter 9
SYSTEM
key to display the
Printing the measurement data (See Chapter 10)
Saving the measurement data (See Quick Start Chapter 10)
Using the A-B cursor (See Quick Start Section 8.2)
Set up (See Quick Start Section 9.2)
Saving the file (See Quick Start Section 9.3)
Printer (See Quick Start Section 9.4)
Interface (See Chapter 11)
Initialize (See Quick Start Section 9.5)
Self-check (See Quick Start Section 9.6)
8
9
10
11
12
13
────────────────────────────────────────────────────
4.2 Operation Sequence (FFT)
14
A
Page 72

52
────────────────────────────────────────────────────
4.3 STATUS Settings (FFT)
See Sections
4.3.1
4.3.2
4.3.3
4.3.4
4.3.5
4.3.6
4.3.7
4.3.17
Press the
STATUS
key to access the STATUS screen. This section explains
how to set the STATUS screen of the FFT function. See the corresponding
sections for items that can be set in the Waveform display or CHANNEL
screens.
Waveform display screen:
CHANNEL screen:
See Quick Start Section 6.3
See Section 4.6
4.3.8 4.3.9
4.3.10
4.3.11
4.3.12
4.3.13
4.3.14
4.3.15
4.3.16
────────────────────────────────────────────────────
4.3 STATUS Settings (FFT)
Page 73

53
────────────────────────────────────────────────────
4.3.1 Setting the Function Mode
The 8855 has four function modes. Select the FFT function.
Procedure Screen: STATUS, CHANNEL, Waveform display, TRIGGER
1. Use the Menu keys to display the desired screen.
2. Move the flashing cursor to the top position.
3. Select the
Function
display
function key display.
FFT
Meaning
:
Memory recorder function
:
Recorder function
:
Recorder & Memory recorder function
:
FFT function
1
2
3
4
5
6
4.3.2 Setting the FFT Channel Mode
This setting determines whether only one channel (1ch-FFT) or two channels
(2ch-FFT) are used for FFT processing. When "1ch-FFT" is selected, certain
FFT analysis modes will not be available.
Screen: STATUS
Procedure 1. Use the Menu keys to display the desired screen.
NOTE
2. Move the flashing cursor to the
3. Use the function key to make the selection.
Function
display
The following analysis functions are not possible in 1-channel FFT mode:
Transfer function (TRF), cross-power spectrum (CSP), cross-correlation
function (CCR), unit impulse response (IMP), coherence function (COH)
Meaning
:
One channel
:
Two channels
FFT Mode
item.
7
8
9
10
11
12
13
────────────────────────────────────────────────────
4.3 STATUS Settings (FFT)
14
A
Page 74

54
────────────────────────────────────────────────────
4.3.3 Setting the Frequency Range
The frequency range (frequency axis maximum value) can be set as follows.
The frequency range corresponds to the time axis range (TIME/DIV) setting
of the memory function.
Screen: STATUS, Waveform display
Procedure 1. Use the Menu keys to display the desired screen.
2. Move the flashing cursor to the
Frequency Range
3. Use the function key to make the selection.
You can also use the TIME/DIV knob to make the settings. In this case,
you can change the settings irrelevant of the position of the flashing cursor.
Function
display
Meaning
:
Move the cursor up in the selection window.
:
Move the cursor down in the selection window.
item.
NOTE
:
External sampling
The anti-aliasing filter cutoff frequency is the same as the selected frequency
range.
When "EXT." was selected, octave analysis cannot be carried out.
To use external sampling, see Quick Start Section 11.1.4.
Frequency Range, Frequency Resolution, Window Width, Corresponding
Time Axis Range (when the number of FFT points is 1000)
Frequency range
[Hz]
1
8M*
1
4M*
1
2M*
1
800 k*
1
400 k*
1
200 k*
1
80 k*
40 k 100 10 ms 1ms
20 k 50 20 ms 2ms
8k 20 50 ms 5ms
4k 10 100 ms 10 ms
2k 5 200 ms 20 ms
800 2 500 ms 50 ms
400 1 1s 100 ms
200 500 m 2s 200 ms
80 200 m 5s 500 ms
40 100 m 10 s 1s
20 50 m 20 s 2s
2
8*
2
4*
2
1.33 *
2
667 m*
2
333 m*
2
133 m*
Frequency
3
resolution*
[Hz]
20 k 50 µs 5 µs
10 k 100 µs 10 µs
5k 200 µs 20 µs
2k 500 µs 50 µs
1k 1ms 100 µs
500 2ms 200 µs
200 5ms 500 µs
20 m 50 s 5s
10 m 100 s 10 s
3.33 m 5 min 30 s
1.67 m 10 min 1 min
0.83 m 20 min 2 min
0.33 m 50 min 5 min
Window width*
4
Time axis
[ /DIV ]
────────────────────────────────────────────────────
4.3 STATUS Settings (FFT)
Page 75

55
────────────────────────────────────────────────────
The cutoff frequency of the anti-aliasing filter is the same as the selected
frequency range, except for the cases listed below.
*1: Anti-aliasing filter is OFF.
*2: Cutoff frequency is 20 Hz.
*3: FFT Number of Points values of 2000, 5000 and 10,000 correspond to
multiples of 1/2, 1/5 and 1/10, respectively.
*4: FFT Number of Points values of 2000, 5000 and 10,000 correspond to
multiples of 2, 5 and 10, respectively.
4.3.4 FFT Number of Points Setup
This setting determines the sample count (Number of Points) used for FFT
calculation. A higher setting increases the frequency analysis capability, but
also increases the processing time required.
Screen: STATUS, Waveform display
Procedure 1. Use the Menu keys to display the desired screen.
2. Move the flashing cursor to the
Sampling point
3. Use the function key to make the selection.
Function
display
Meaning
item.
:
1000 points FFT calculation
:
2000 points FFT calculation
:
5000 points FFT calculation
:
10000 points FFT calculation
────────────────────────────────────────────────────
4.3 STATUS Settings (FFT)
Page 76

56
────────────────────────────────────────────────────
4.3.5 Setting the Window Function
The window function defines the segment of the input signal that will be
processed. Window processing can be used to minimize leakage error.
Screen: STATUS, Waveform display
Procedure 1. Use the Menu keys to display the desired screen.
2. Move the flashing cursor to the
Window
3. Use the function key to make the selection.
Function
display
Meaning
:
Rectangular (effective on discrete waveforms)
:
Hanning (effective on continuous waveforms)
:
Exponential (effective on decaying waveforms)
item.
4. If
EXPO.
was selected, the coefficient item is displayed. Select the
attenuation ratio in percent, using the function keys or the Jog/shuttle
controls. If coefficient (attenuation ratio) is set to 0%, processing will be
carried out as 0.1%.
Function
display
Meaning
:
Increases in number, small step
:
Decreases in number, small step
Noise on attenuated waveform
is reduced
Waveform captured
in one operation
100%
10%
10%
100%
When setting of exponential window function
attenuation ratio 10%
NOTE
When measurements are taken using the Hanning window or exponential
window, note that the calculation results in the display of a value that is
lower than the amplitude obtained when using a rectangular window.
────────────────────────────────────────────────────
4.3 STATUS Settings (FFT)
Page 77

57
────────────────────────────────────────────────────
4.3.6 Setting the Peak Function
Display the peak or maximum value of the input signal and analyzed results.
This is available only when the Format is set to Single or Dual display.
Screen: STATUS
Procedure 1. Press the
2. Move the flashing cursor to the
3. Use the function key to make the selection.
Function
display
STATUS
:
:
:
key to display the screen to be displayed.
item.
Peak
Meaning
OFF
Peak value
Maximum value
Peak value display
When data at one point are higher than data
within the vicinity, the point is a peak. The 10
highest peaks are shown.
Peak 1
Maximum value display
, ---Data
Peak 2
Points with the 10 highest values are shown.
Maximum value 1
2
4
5
, ---Data
3
6
────────────────────────────────────────────────────
4.3 STATUS Settings (FFT)
Page 78

58
────────────────────────────────────────────────────
4.3.7 Selecting Reference Data
Select data to be used for FFT processing.
Screen: STATUS
Procedure 1. Press the
2. Move the flashing cursor to the
3. Use the function keys to make a setting.
Function
display
NEW DATA
STATUS
:
:
key to display the STATUS screen.
Reference
Meaning
Capture new waveform data for FFT processing
Use stored waveform data for FFT processing
item.
NOTE
Pressing the
START
key initiates measurement, reads the number of samples
specified as the FFT Number of Points, and FFT processing is performed.
FROM MEM
Pressing the
START
key initiates FFT processing of the specified FFT Number
of Points, from the start of the data (Memory Recorder or memorized
Recorder & Memory waveform) that has been stored in memory.
The starting point for calculation can be specified using the cursor on the
screen with the stored Recorder & Memory waveform displayed.
If the A-B cursors are used, the FFT calculation is performed on the
specified
Sampling point
beginning with whichever cursor is foremost.
When a memory waveform is selected, the frequency is automatically set to
correspond with the time axis as indicated in frequency range setup table in
section 4.3.3.
If a memory waveform is the reference data when the trigger mode is
Continuous and Automatic, FFT processing is performed on the waveform
data collected by the Memory Recorder function for the specified FFT
Number of Points, and then shifted by that amount and processed again,
until all data has been processed. (If the data is shorter than the FFT Number
of Points, no processing occurs.)
────────────────────────────────────────────────────
4.3 STATUS Settings (FFT)
Page 79

59
────────────────────────────────────────────────────
4.3.8 Setting the Display Format
You can set the format for displaying input signal waveforms on the screen
and recording them on the printer. The SINGLE, DUAL, and NYQUIST
formats are available.
Screen: STATUS
Procedure 1. Press the
2. Move the flashing cursor to the
3. Use the function key to make the selection.
Function
display
STATUS
:
:
:
key to display the screen to be displayed.
Format
Meaning
Single screen
Dual screen
Nyquist screen
item.
Single graph
Displays the waveform on a
single screen.
NOTE
The peak value is displayed on the screen and printed out, but it is not
recorded as the peak value in data storage.
Dual graph
Divides the waveform display
screen into upper and lower
screens.
Nyquist graph
For the linear spectrum, cross
power spectrum, and transfer
function, displays the real-number
portion of the data for the FFT
calculation result on the X-axis,
and the imaginary number
portion of the data on the Y-axis.
────────────────────────────────────────────────────
4.3 STATUS Settings (FFT)
Page 80

60
────────────────────────────────────────────────────
4.3.9 Setting the Averaging Function
The averaging function allows capturing several instances of a waveform and
determining the average.
This makes it possible to eliminate noise and irregular signal components.
Averaging for the time axis waveform and frequency axis waveform can be
selected.
Procedure Screen: STATUS, Waveform display
1. Use the Menu keys to display the desired screen.
2. Move the flashing cursor to the
Averaging
3. Use the function keys to make a setting.
Function
display
Meaning
:
Disable averaging
:
Perform time axis waveform simple averaging
item.
Perform time axis waveform exponential
:
averaging
Perform frequency axis waveform simple
:
averaging
Perform frequency axis waveform exponential
:
averaging
:
Frequency axis waveform peak hold
4. Move the flashing cursor to the
Number
item, and set the time of averaging
count by using the Jog/Shuttle controls or function keys.
Function
display
Meaning
:
Move the cursor up in the selection window.
:
Move the cursor down in the selection window.
Time axis waveform averaging
(1) Averages collected waveform data
(2) FFT processing is then performed on the averaged values
When the trigger mode is AUTO
When the
START
key is pressed, data are captured even if trigger conditions
are not fulfilled after a certain interval. If averaging is applied to
unsynchronized input signals, the result will be meaningless.
Frequency axis waveform averaging
Unlike time axis averaging, the results are valid also if no trigger
synchronization is used. But if the characteristics of the input waveform
allow triggering, using the trigger for synchronization is recommended.
(1) Captured data first undergo FFT processing.
(2) Averaging is performed and the result is displayed.
────────────────────────────────────────────────────
4.3 STATUS Settings (FFT)
Page 81

61
────────────────────────────────────────────────────
Frequency axis peak hold
The specified number of samples are captured, and the peak value is held
(stored) for each frequency.
NOTE
For details on summing averaging and exponential averaging, refer to
Appendix 3.5.
When averaging is used together with the waveform evaluation function,
waveform evaluation is carried out after the specified averaging count is
completed.
After calculating the average, changing the analysis channel does not cause
recalculation.
FFT analysis mode and averaging
z: Setting is valid
- : Setting is invalid (has no effect)
Frequency
axis
averaging
z
z
z
z
-
z
z
z
z
-
z
z
-
-
z
z
-
z
z
z
z
-
z
z
Peak hold
-
-
z
z
-
-
-
z
z
-
z
z
-
-
z
z
-
-
-
z
z
-
z
z
FFT analysis mode Y-axis
Storage waveform
Linear spectrum
RMS spectrum
Power spectrum
Auto correlation
function
Histogram
Transfer function
Cross power spectrum
Cross correlation
function
Unit impulse response
Coherence function
Octave analysis
(Linear) z z -
LIN-REAL
LIN-IMAG
LIN-MAG
LOG-MAG
PHASE
LIN-REAL
LIN-IMAG
LIN-MAG
LOG-MAG
PHASE
LIN-MAG
LOG-MAG
(Linear) z z z
(Linear) z - -
LIN-REAL
LIN-IMAG
LIN-MAG
LOG-MAG
PHASE
LIN-REAL
LIN-IMAG
LIN-MAG
LOG-MAG
PHASE
(Linear) z z z
(Linear) z z z
(Linear) z z z
LIN-MAG
LOG-MAG
Time axis
averaging
z
z
z
z
z
z
z
z
z
z
z
z
z
z
z
z
z
z
z
z
z
z
z
z
Same for linear spectrum, transfer function, and cross-power spectrum with
Nyquist display.
────────────────────────────────────────────────────
4.3 STATUS Settings (FFT)
Page 82

62
────────────────────────────────────────────────────
Averaging and trigger mode
(1) Trigger mode: SINGLE
1. After the
START
key was pressed, data are captured whenever the trigger
conditions are fulfilled, averaging is carried out, and then the waveform is
displayed.
Collected waveform data is averaged with the FFT time axis waveform and
FFT processing is performed. FFT processing is performed on the frequency
axis and the calculated result is averaged.
2. Trigger occurs when the trigger conditions are fulfilled again.
3. When the specified number of data has been captured, measurement stops
automatically. If the measurement was stopped prematurely with the
STOP
key, the averaging result up to that point is displayed.
When the frequency
axis waveform
FFT
When the time
axis waveform
FFT
Input
Trigger conditions
fulfilled
Waveform averaging count = less than specified number
Waveform capture Averaging Display End
(for recording length)
Waveform averaging count = specified number
(2) Trigger mode: REPEAT
1. After the
START
key was pressed, data are captured whenever the trigger
conditions are fulfilled, and averaging is carried out until the specified
averaging count. The averaging result is shown on the display.
2. Trigger occurs when the trigger conditions are fulfilled again. The waveform
data is cleared and the trigger occurs when the trigger conditions are fulfilled
again
3. When the specified averaging count is reached, data up to that point are
discarded, and new data are captured for averaging. If the measurement was
stopped prematurely with the
STOP
key, the averaging result up to that point
is displayed.
When the frequency
axis waveform
FFT
When the time
axis waveform
FFT
Input
────────────────────────────────────────────────────
4.3 STATUS Settings (FFT)
Trigger conditions
fulfilled
Waveform capture Averaging Display End
(for recording length)
After specified count
The STOP key is pressed
Page 83

63
────────────────────────────────────────────────────
(3) Trigger mode: AUTO
(Time axis waveform)
When the
START
key is pressed, data are captured even if trigger conditions
are not fulfilled after a certain interval. If averaging is applied to
unsynchronized input signals, the result will be meaningless.
(Frequency axis waveform)
1. After the
START
key was pressed, data are captured whenever the trigger
conditions are fulfilled, and averaging is carried out until the specified
averaging count. The averaging result is shown on the display.
2. When the specified number of data has been captured, measurement stops
automatically.
3. If the measurement was stopped prematurely with the
STOP
key, the
averaging result up to that point is displayed.
If the trigger condition does not occur within the specified period,
waveform data input begins anyway.
Input
Trigger conditions
fulfilled
Waveform
capture
FFT Averaging Display End
4.3.10 Setting the Interpolation (dot-line)
This setting determines whether the input waveform (sampling data) is to be
displayed and printed as a series of dots or a line using linear interpolation.
Procedure Screen: STATUS
1. Press the
STATUS
2. Move the flashing cursor to the
3. Use the function keys to make a setting.
Function
display
key to display the STATUS screen.
Dot-Line
Meaning
Press the STOP key
item.
:
Linear interpolation is not performed.
:
Linear interpolation is performed.
────────────────────────────────────────────────────
4.3 STATUS Settings (FFT)
Page 84

64
────────────────────────────────────────────────────
4.3.11 Setting the Waveform Evaluation
Display format can be set on single screen or Nyquist screen.
GO (pass) or NG (fail) evaluation of the input signal waveform can be
performed using an evaluation area specified by the user. This can serve to
detect irregular waveforms. After the evaluation result is generated, signals
are output from the GO/NG terminal. All the channels being displayed are
evaluated.
Procedure Screen: STATUS
1. Press the
STATUS
2. Move the flashing cursor to the
3. Use the function keys to make a selection.
Function
display
Meaning
:
Disable waveform evaluation
Return NG if any part of the waveform leaves the evaluation
:
area
key to display the STATUS screen.
Comparison
item.
NOTE
:
Return NG if the entire waveform leaves the evaluation area
:
Evaluation area is created.
:
Enable waveform evaluation area.
4. If Comparison is set to OUT or ALL-OUT, the
Stop Mode
item will be
displayed. Move the flashing cursor to this item.
5. Use the function keys to make a setting.
Function
display
Meaning
If GO is selected, recording and analysis will stop after an OK
:
result.
If NG is selected, recording and analysis will stop after an NG
:
result.
If GO & NG is selected, measurement will stop regardless of
:
the evaluated results.
When a waveform evaluation area is created by the FFT function, the
waveform evaluation area created by the memory recorder function is
cleared. For details on the waveform evaluation, refer to Section 9.1.
────────────────────────────────────────────────────
4.3 STATUS Settings (FFT)
Page 85

65
────────────────────────────────────────────────────
4.3.12 Setting the FFT Analysis Mode
Used to select the FFT calculation method.
Procedure Screen: STATUS, Waveform display
1. Use the Menu keys to display the desired screen.
2. Move the flashing cursor to the
FFT Mode
3. Use the function keys to make a setting.
For details on analysis, please refer to 4.8 FFT Analysis Function.
item.
Function
display
Meaning
:
Stored waveform
:
Linear spectrum
:
RMS spectrum
:
Power spectrum
Auto correlation
:
function
Flashing cursor
Function
display
:
Transfer function
:
Cross power spectrum
Cross correlation
:
function
:
Impulse response
:
Coherence function
Meaning
:
Histogram
:
Octave analysis
────────────────────────────────────────────────────
4.3 STATUS Settings (FFT)
Page 86

66
────────────────────────────────────────────────────
4.3.13 Setting the Analysis Channel
Select the channel for FFT analysis.
Procedure Screen: STATUS, Waveform display
1. Use the Menu keys to display the desired screen.
2. Move the flashing cursor to the
w1orw2
3. Use the function keys or Jog/shuttle control, select the channel.
Function
display
Meaning
:
Move the cursor up in the selection window.
:
Move the cursor down in the selection window.
item.
NOTE
Flashing cursor
The values for transmission interval and single impulse response are
calculated from (W2)/(W1).
To analyze data without aliasing distortion due to sampling, we
recommend that you use a channel input module that is capable of FFT
analysis, such as the 8953-10 HIGH RESOLUTION UNIT.
────────────────────────────────────────────────────
4.3 STATUS Settings (FFT)
Page 87

67
────────────────────────────────────────────────────
4.3.14 Setting the X-axis and Y-axis Displays
Set the X and Y axis for display of FFT calculation results. Different units
can be selected for the X and Y axis. With some FFT analysis modes, one of
the axis cannot be set.
When external sampling is used, the X-axis (horizontal axis) expresses the
data count.
Procedure Screen: STATUS, Waveform display
1. Use the Menu keys to display the desired screen.
2. Move the flashing cursor to the
YAxis
3. Use the function keys or Jog control, select the channel. Set the x-axis in the
same way.
Y Axis
Function
display
Meaning
item.
:
Real number part (linear display)
:
Imaginary number part (linear display)
:
Amplitude (linear display)
:
Amplitude (decibel display)
:
Phase (degree display)
X Axis
Function
display
Meaning
:
Frequency (linear display)
:
Frequency (logarithm display)
(When octave analysis)
Function
display
Meaning
:
1/3 octave
:
1/1 octave
Flashing cursor
────────────────────────────────────────────────────
4.3 STATUS Settings (FFT)
Page 88

68
────────────────────────────────────────────────────
X and Y Axis Settings Available with each FFT Analysis Mode
STR
LIN
RMS
PSP
ACR
HIS
TRF
CSP
CCR
IMP
COH
OCT
FFT analysis mode
Storage Waveform (Time) (Linear)
Linear Spectrum
RMS Spectrum
Power Spectrum
Auto Correlation Function (Time) (Linear)
Histogram (Volt) (Linear)
Transfer Function
Cross Power Spectrum
Cross Correlation Function (Time) (Linear)
Unit Impulse Response (Time) (Linear)
Coherence Function
Octave Analysis
XAxis
(horizontal axis)
LIN-Hz
LOG-Hz
LIN-Hz
LOG-Hz
LIN-Hz
LOG-Hz
LIN-Hz
LOG-Hz
LIN-Hz
LOG-Hz
LIN-Hz
LOG-Hz
1/3 OCT
1/1 OCT
YAxis
(vertical axis)
LIN-REAL
LIN-IMAG
LIN-MAG
LOG-MAG
PHASE
LIN-REAL
LIN-IMAG
LIN-MAG
LOG-MAG
PHASE
LIN-MAG
LOG-MAG
LIN-REAL
LIN-IMAG
LIN-MAG
LOG-MAG
PHASE
LIN-REAL
LIN-IMAG
LIN-MAG
LOG-MAG
PHASE
(Linear)
LIN-MAG
LOG-MAG
The item shown by brackets ( ), it is fixed.
────────────────────────────────────────────────────
4.3 STATUS Settings (FFT)
Page 89

69
────────────────────────────────────────────────────
4.3.15 Setting the Wave Colors
Set the waveform display ON/OFF and the waveform color.
Procedure Screen: STATUS, Waveform display
1. Use the Menu keys to display the desired screen.
2. Move the flashing cursor to the
Wave
3. Use the function keys or Jog control, select the channel. Set the x-axis in the
same way.
Function
display
Meaning
:
Move the cursor up in the selection window.
:
Move the cursor down in the selection window.
:
Waveform will be displayed in selected color.
:
Waveform will not be displayed.
item.
────────────────────────────────────────────────────
4.3 STATUS Settings (FFT)
Page 90

70
p
────────────────────────────────────────────────────
4.3.16 Setting the Display Scale
The display scale for showing the FFT processing result can either be set
manually or automatically.
Procedure Screen: STATUS
1. Press the
STATUS
2. Move the flashing cursor to the
3. Use the function keys to make a setting.
Function
display
Meaning
The vertical axis (Y-axis) scale is set automatically, depending on
:
the processing result.
The vertical axis (Y-axis) scale can be set as desired, to match the
:
purpose of the measurement. This is useful for enlarging or reducing
the am
key to display the STATUS screen.
Scale
litude and for shiftingthe waveform upor down.
item.
4. When
MANUAL
is selected, set the upper and lower limits to display and
record the processing result.
Setting range is -9.9999E+29 to 9.9999E+29. (exponent is E-29 to E+29).
Function
display
Meaning
A number pad will be displayed. Use the cursor and function keys to
:
specify the value. Press [ fix.] F4 t o confirm.
:
Reset to the default values.
:
Return to the previous setting.
An input screen will be displayed. Use the cursor keys to move the
:
flashing cursor to each digit, and the function keys to edit each value.
NOTE
The unit (eu) setting is affected by the scaling setting. When scaling is
turned off, a unit of measurement range is displayed.
The selected unit is displayed for those channels for which the scaling
function has been set.
The X-axis setting for the histogram can be changed on the Waveform
display screen or the CHANNEL screen. (If the upper or lower limit value is
changed, the x-axis is changed.)
────────────────────────────────────────────────────
4.3 STATUS Settings (FFT)
Page 91

71
y
────────────────────────────────────────────────────
4.3.17 Octave Filter Setting
When octave analysis has been selected, two different filter types can be
chosen.
The characteristics of both filter types are within ANSI CLASS 3 tolerance
limits (1/3 octave only).
Procedure
1. Select "OCTAVE ANALYSIS" in FFT analysis mode, and the
2. Move the flashing cursor to the
3. Use the function keys to make a selection.
NOTE
Screen: STATUS
Octave Filter
item is shown.
item.
Function
display
Meaning
Filter characteristics approximate the characteristics used for
:
conventional octave analyzers with analog filters.
Spectrum components outside the octave band are excluded totally
:
and only the spectrum in the octave band is bundled and used for
anal
sis.
1/1-octave (1/3-octave)
normal filter characteristics
Octave Filter
1/1-octave (1/3-octave)
sharp filter characteristics
This instrument does not use analog filters. It first determines the entire
power spectrum and then uses weighting by bundling the spectrum to
achieve the desired filter characteristics.
────────────────────────────────────────────────────
4.3 STATUS Settings (FFT)
Page 92

72
p
────────────────────────────────────────────────────
4.4 Printout of FFT Processing Results
(When 8994 PRINTER UNIT is installed.)
4.4.1 Setting the Print Mode
Select the format, waveform, or numerical value should be used to output
FFT processing results.
Procedure
(1) Setting the printer format
1. Press the
2. Move the flashing cursor to the
3. Use the function keys to make a setting.
(2) Setting the print interval
1. When the numerical value is selected, set the print interval. (unit: points)
2. Move the flashing cursor to the
3. Use the function keys to make a setting.
Screen: PRINTER
SYSTEM
Function
display
Function
display
Meaning
:
The result of calculation are printed as a waveform.
:
The result of calculation are printed as numeric data.
Meaning
:
Move the cursor up in the selection window.
:
Move the cursor down in the selection window.
key to display the PRINTER screen.
Print Mode
Interval
item.
item.
4.4.2 Setting the Auto Print Function
Printout is automatically carried out after FFT analysis.
Procedure Screen: PRINTER
1. Press the
SYSTEM
2. Move the flashing cursor to the
3. Use the function keys to make a setting.
Function
display
────────────────────────────────────────────────────
4.4 Printout of FFT Processing Results (When 8994 PRINTER UNIT is installed.)
Meaning
:
Auto print is disabled.
Automatically print the FFT processing results to the
:
internal printer.
Automatically transfer the FFT processing results to
:
the LAN connected device.
O
tional 9333 LAN COMMUNICATOR is required.
key to display the PRINTER screen.
Auto Print
item.
Page 93

73
────────────────────────────────────────────────────
4.5 Setting the Auto Save Function
The FFT analysis is carried out and measurement data are automatically
stored on a floppy disk, PC card, MO connected SCSI, or built-in MO/HD
device after they are captured. The Auto Save function stores a file in the
directory currently selected on the file screen. See Quick Start Section
10.13.2.
Procedure
1. Press the
2. Move the flashing cursor to the
3. Use the function keys, select the media for auto saving.
4. Move the flashing cursor to
Screen: STATUS
STATUS
Function
display
Function
display
Meaning
:
Auto save is disabled.
:
Automatically stored on floppy disk
:
Automatically stored on PC card.
:
Automatically stored on MO/HD.
Automatically stored on external MO connected SCSI
:
device.
Automatically stored on LAN-connected device.
:
(Optional 9333 LAN Communicator is required.)
Meaning
key to display the STATUS screen.
Auto Save
, and select the format.
type
item.
:
Data are stored as binary data.
Data are stored as text data.
:
(Nyquist cannot be saved in the text format)
Data stored in the text format is not readable by the 8855.
5. Set the file name. For the input method, refer to Section 5.4.3.
When using auto-save, a number is appended to the name you specify as the
file name. This then becomes the file name. If you start procedures before
specifying a file name, AUTO is automatically enabled.
6. Set whether or not to create a new directory when saving.
7. Move the flashing cursor to
Function
display
Meaning
When the media becomes full, automatic storage
:
stops.
When the media becomes full, old files are deleted to
:
make room for automatic storage.
method
, and select the format.
With the binary format selected, the file with the extension 'FFT' is deleted.
With the text format selected, files with the extension 'TXT' are deleted.
────────────────────────────────────────────────────
4.5 Setting the Auto Save Function
Page 94

74
────────────────────────────────────────────────────
NOTE
File names consist of 8 characters. With auto-save, since numbers are
attached to the end of file names, long file names are truncated when this
number is appended to the end of the file name.
When auto-save is enabled, the storage channel cannot be selected. Data for
the channel for which the waveform is displayed is saved.
For details on auto saving file name, refer to Quick Start Section 10.7.
When both auto-print and auto-save are enabled, auto-save takes precedence.
For details on connected SCSI device, refer to Quick Start Section 10.4.
The directory and the number of files that can be stored in the directory are
limited. For details, see Quick Start Section 10.7.
Thinning is not applied with FFT data text format storage.
Do not use the characters and symbols below in a file name. A file
containing any of these characters/symbols in its file name cannot be
processed under Windows 2000 or XP.
Full-size lowercase letters: a to z
Full-size characters: π, µ, ε
Half-size symbols: +, =, [,]
────────────────────────────────────────────────────
4.5 Setting the Auto Save Function
Page 95

75
────────────────────────────────────────────────────
4.6 Settings on the Waveform Display Screen (FFT)
Explains the setting items on the Waveform display screen.
For details, refer to Sections 4.3.
When want to use the Jog/Shuttle control, press the
selection window is not displayed.)
VALUE
select key. (The
1 2
3
Setting items Selection Explanation
1. Function
2. Frequency range
3. Window function
4
MEM, REC, FFT,
REC&MEM
133 mHz to 8 MHz (24
steps), EXT
Rectangular, hanning,
exponential
5
Select function.
Set the maximum value of the
frequency axis.
Set a window function that uses
multiples when reading an input
signal.
4. Trigger mode
5. Pre-trigger
6. Wave color
SINGLE, REPEAT,
AUTO
0to100%,-95%
ON/OFF, desired color
Select trigger mode.
Set the Pre-trigger.
Set the waveform display to
ON/OFF and the waveform color.
7. Analysis mode
Select from 12 items.
Selects the FFT analysis method.
See Section 4.8.
8. Analysis channel
9. X-, Y-axis
Select from channel 1
to using channels
X axis
Frequency
(linear/logarithm
display)
When octave analysis:
1/3, 1/1 octave
Y axis
Real number part
(linear), imaginary
number part (linear),
amplitude (linear/dB),
phase (deg)
Selects the channel for FFT
analysis.
Sets the X-and Y- axis for display
of FFT calculation results.
With some FFT analysis mode, one
of the axis cannot be set.
6
7
8
9
────────────────────────────────────────────────────
4.6 Settings on the Waveform Display Screen (FFT)
Page 96

76
────────────────────────────────────────────────────
4.7 Start and Stop Operation (FFT)
Setting the 8855
STATUS Settings
Channel Settings
Trigger Settings
See Section 4.3, "STATUS Settings (FFT)", Quick Start Chapter
6, "Input Channel Settings", Quick Start Chapter 7, "Trigger
Functions".
Measurement start
Trigger condition
are met
Recording start
Recording end
Press the
START
key and LED light.
When the pre-trigger is set, the trigger will not be registered for
a certain period after the start of measurement. (During this
interval, "Pre-trigger standby" is shown on the display.)
When the trigger can be registered, the indication "Waiting for
trigger" is shown on the display.
Data recording starts when trigger condition are met.
When trigger mode selected AUTO, instrument waits for about
1 second for trigger conditions to be met. After this interval,
data recording starts, regardless of trigger state.
Displays "Storing".
When the printer is enabled, the recording waveform is printed
at the same time it is displayed.
When the
STOP
key is pressed twice during measurement, the
8855 is forcibly stopped.
The FFT calculation result display, auto-print, and automatic
storage is not performed.
After capturing measured data, the FFT analysis is carried out
and then the result is displayed.
Auto printout and auto save are executed.
Measurement end
Trigger mode SINGLE
REPEAT
AUTO
End of measurement
Each time when trigger conditions are met, data are recorded
and memory contents are overwritten.
End of measurement in REPEAT and AUTO trigger modes
When the
STOP
key is pressed once during measurement, the
8855 acquires measurement data in an amount corresponding to
the set recording length, and the FFT analysis is carried, and
then the measurement is stopped. (FFT analysis result, auto
printout, auto save are executed.)
When the
STOP
key is pressed twice, the measurement is
stopped forcibly. (FFT analysis result, auto printout, auto save
are not executed.)
────────────────────────────────────────────────────
4.7 Start and Stop Operation (FFT)
Page 97

77
────────────────────────────────────────────────────
4.8 FFT Analysis Function
4.8.1 Storage Waveform [STR]
Displays the time domain waveform of the input signal.
Function
Horizontal
cursor
Vertical
cursor
Example Stored waveform
fa
Time Time axis display
Indicates the value of the specified TIME/DIV frequency
range.
(Refer to the table "Frequency Range, Frequency Resolution,
Window Width, Corresponding Time Axis Range" in Section
4.3.3.)
Linear Indicates the value of the measurement range of the input
module in voltage units.
────────────────────────────────────────────────────
4.8 FFT Analysis Function
Page 98

78
────────────────────────────────────────────────────
4.8.2 Linear Spectrum [LIN]
Displays the frequency domain waveform of the input signal, including
magnitude and phase information.
Major applications include:
Determining the peaks of waveform frequency components
Determining the levels of high and low harmonics
Function
Horizontal
cursor
Vertical
cursor
Fa = (fa)
= |Fa|exp(jθa)
=|Fa|(cos θa+jsin θa)
LIN-Hz Frequency spectrum display as linear units.
The range is from DC to the maximum frequency range value.
LOG Hz Frequency spectrum display as logarithmic units.
The range is from between 1/400 and 1/4000 of value to the
frequency range value.
Real Linear display of real-number part of the data as voltage
(Nyquist mode)
LIN-REAL Linear display of real-number part of the data as voltage
LIN-IMAG Linear display of imaginary-number part of the data as voltage
LIN-MAG Linear display of analysis data as voltage
LOG-MAG Logarithmic display of analysis data as dB
(0dB reference value: 1 V peak=2V p-p)
PHASE Degrees (deg) display of phase component of data
Imag Linear display of imaginary-number part of the data as voltage
(Nyquist mode)
────────────────────────────────────────────────────
4.8 FFT Analysis Function
Page 99

79
────────────────────────────────────────────────────
Examples Linear spectra waveforms
Stored waveform
Y-axis: LIN-IMAG (X-axis: LOG-Hz)
Y-axis: LOG-MAG (X-axis: LOG-Hz)
Y-axis: LIN-REAL (X-axis: LOG-Hz)
Y-axis: LIN-MAG (X-axis: LOG-Hz)
Y-axis: PHASE (X-axis: LOG-Hz)
Nyquist
────────────────────────────────────────────────────
4.8 FFT Analysis Function
Page 100

80
────────────────────────────────────────────────────
4.8.3 RMS Spectrum [RMS]
Displays the frequency domain waveform of the input signal, including
magnitude (effective value) and phase information.
The LOG-MAG displays of RMS spectrum and Power spectrum express the
same processing result.
Major applications include:
Determining the peaks of waveform frequency components.
Determining the effective values of frequency components.
Function
Horizontal
cursor
Ra = Fa
=|Ra|exp(jθa)
=|Ra|(cos θa+jsin θa)
LIN-Hz Frequency spectrum display as linear units. The range is from
DC to the maximum frequency range value.
LOG-Hz Frequency spectrum display as logarithmic units. The range is
from between 1/400 and 1/4000 of value to the frequency
range value.
Vertical
cursor
LIN-REAL Linear display of real-number part of the data as voltage
LIN-IMAG Linear display of imaginary-number part of the data as voltage
LIN-MAG Linear display of analysis data as voltage
LOG-MAG Logarithmic display of analysis data as dB (0dB reference
value: 1 V rms)
PHASE Degrees (deg) display of phase component of data
Examples RMS spectra waveform
Stored waveform
DC components: Ra = Fa
08-23, 30, 31, 32, 33, 34
Y-axis: LIN-REAL (X-axis: LOG-Hz)
Y-axis: LIN-IMAG (X-axis: LOG-Hz) Y-axis: LIN-MAG (X-axis: LOG-Hz)
Y-axis: LOG-MAG (X-axis: LOG-Hz) Y-axis: PHASE (X-axis: LOG-Hz)
────────────────────────────────────────────────────
4.8 FFT Analysis Function
 Loading...