

Page 1

INSTRUCTION MANUAL
8807-51
8808-51
MEMORY HiCORDER
HARMONIC WAVE
ANALYSIS FUNCTION
Page 2

Page 3

Contents
1. General Description 1
2. Setup Procedures 2
3. Basic Setting Items 3
3.1 Function Setting 3
3.2 Measurement Target Setting
4. Analog Input Channel Setting 5
4.1 Waveform Display Color Setting 5
4.2 Input Type Setting
4.3 Vertical Axis Range Setting
4.4 Scaling Setting
4.5 Scale Conversion Rate Setting
4.6 Line Connection & Level Check
4.7 DMM Function
11
13
5. Instantaneous Analysis Mode 15
5.1 Analyses and Display Screens 15
5.2 Basic Item Setting
5.3 Cursor Operation
5.4 Analysis Example 1: Simultaneous Instantaneous
Analysis of Two 100-VAC Single-Phase 2-Wire Lines
21
27
28
3
6
7
8
9
5.5 Analysis Example 2: Instantaneous Analysis of 200-VAC
3-Phase 3-Wire Line
33
6. Time-Series Analysis Mode 35
6.1 Basic Item Setting 35
6.2 Analysis Item Setting
6.3 Cursor Operations
6.4 Waveform Scrolling
6.5 Input Setting in Waveform Display Screen
6.6 Over-Range Check Function
6.7 Analysis Example: Time-Series Analysis of 100-VAC
Single-Phase 3-Wire Line
41
45
46
47
48
49
7. Triggers for Harmonic Wave Analysis Function 52
7.1 Basic Trigger Setting Items and Setting Methods 52
7.2 Harmonic Wave Trigger
55
Page 4

8. Printer Operations 59
8.1 Recording on Printer 59
9. PC Card 62
9.1 Input of File Name 62
9.2 Text File Internal Format
9.3 Examples of Stored Files
63
64
10. Characteristics of CLAMP ON PROBES
(Reference Information) 66
Index INDEX 1
Page 5

_____________________________________________________________________________________________
1
1. General Description
The harmonic wave analysis function is designed exclusively for use with the
8807-51/8808-51 MEMORY HiCORDER.
For detailed information on the product and product functions, please refer
to the manual for the main unit.
Features
(1) A range of harmonic wave analysis functions for commercial
power supplies
The 8807-51 is designed for analysis of single-phase 2-wire lines, while the
8808-51 is intended for analysis of single-phase 2-wire lines, single-phase 2wire lines of two different systems, single-phase 3-wire lines, and 3-phase 3wire lines.
The function measures power supplies with a fundamental frequency ranging
from 45 to 65 Hz.
(2) Fast Fourier transform in accordance with frequency
512 data points sampled at a rate of 400 kS/s are extracted for calculations.
(3) Two analysis modes to match specific applications
Instantaneous analysis mode for analysis of instantaneous waveforms during
measurement.
Time-series analysis mode for recording and analyzing analysis data as timeseries data.
(4) Extensive analysis items
Six types of analysis of harmonic waves of all degrees rms value, content
ratio, phase angle, active power, power content ratio, and power phase angle
and calculations of total rms value, total distortion, active power, reactive
power, apparent power, and power factor are available.
(5) Instantaneous analysis mode
Displays analysis results as spectral graphs or with numeric values, and
stores result data.
Displays all harmonic wave components from 1st degree to 40th degree on a
single screen.
(6) Time-series analysis mode
Data on 20 phenomena over a period of up to 30 days, or data on four
phenomena over a maximum of 150 days, can be stored in memory.
Four phenomena can be recorded in an overlapping manner on a single time
axis to allow an easy grasp of the interrelationships among phenomena.
The time axis can be set in seven levels from 5 min/DIV to 12 h/DIV.
Smoothing function for cancellation of unexpected phenomena
Pre-trigger function for observation of the signal prior to a trigger
(7) Harmonic wave trigger function
The trigger can be tripped for rms value, content ratio, all degrees power,
power content ratio, power phase angle, total rms value, and any type of
distortion of a selected harmonic wave component.
______________________________________________________________________________________________
Page 6

2
_____________________________________________________________________________________________
(8) Scaling function
Easy input setting for measurement using a clamp ammeter
(9) Equipped with anti-aliasing filter
Built-in low-pass filter prevents return distortion by eliminating all
frequencies other than measurement targets.
(10) Over-range check function
Automatically switches to a lower sensitivity range when an input waveform
exceeds the maximum input voltage.
2. Setup Procedures
1 Basic Settings (Page)
1. Selecting the Harmonic Wave Function 3
2. Selecting the Power Supply Line
2 Detailed Input Settings
1. Waveform Display Color Setting 5
2. Input Type Setting
3. Vertical Axis Range Setting
4. Scaling Setting
5. Line Connection & Level Check Setting
Application: Trigger Setting
3 Instantaneous Analysis
1. Basic Settings 21
2. Reading Display with Cursor
Analysis Example 1:
Instantaneous Analysis of 100-VAC Single-Phase
2-Wire Line
Analysis Example 2:
Instantaneous Analysis of 200-VAC 3-Phase
3-Wire Line
Time-Series Analysis
1. Basic Settings 35
2. Analysis Item Setting
3. Reading Display with Cursor, and Waveform
Scrolling
Analysis Example 1:
Time-Series Analysis of 100-VAC Single-Phase
3-Wire Line
11
52
27
28
33
41
45
49
Setting examples
Q&A
3
6
7
8
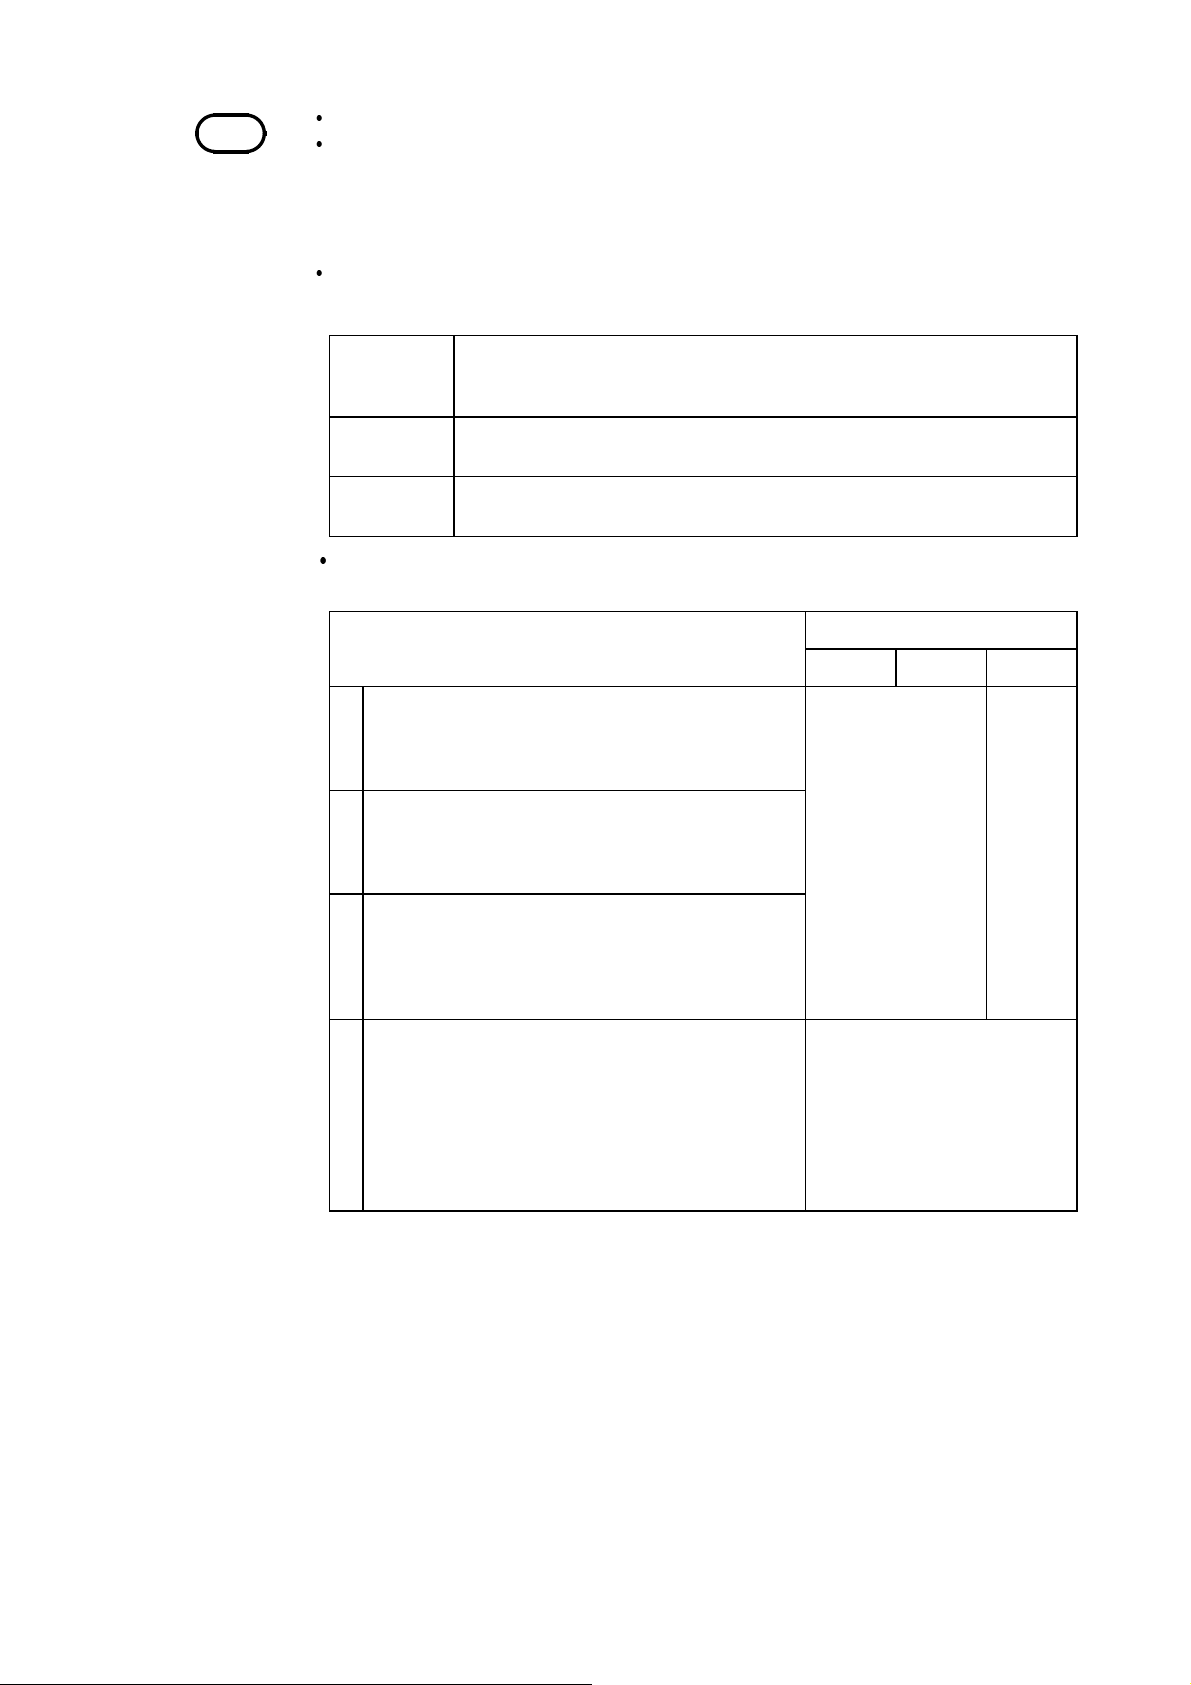
Method of selecting the range
when measuring commercial
power supplies 7
Q&A
Method of selecting the range
when using the 9018-10 CLAMP
ON PROBE 7
Q&A
Method of scaling with a
combination of the 9020 CLAMP
ON ADAPTER and 9018-10
CLAM ON PROBE 9
Q&A
Current measurement using a
combination of the 9277
UNIVERSAL CLAMP ON CT
and 9555 SENSOR UNIT 10
4 Data Printing and Saving
Printer Recording Setting 59
Using a PC Card
Entering a File Name
______________________________________________________________________________________________
62
62
Page 7

_____________________________________________________________________________________________
3
3. Basic Setting Items
3.1 Function Setting
The 8807-51 and 8808-51 each provide a total of four functions.
To use the harmonic wave analysis function, follow the procedures given
below.
Setting Screen SET >>
STATUS(1/4)/ CHANNEL(2/4)/ TRIGGER(3/4)/ ANALYZE(4/4)
1. Move the flashing cursor to the location shown
in the diagram.
2. Using the buttons, select
HARM
3.2 Measurement Target Setting
This screen is used to select the power supply type to be measured.
Setting Screen SET >>
1. Move the flashing cursor to
2. Make a setting using the buttons.
UNIQUE
(Independent
channels)
Conducts power analysis only when
odd-number channel receives
voltage input and even-number
channel receives current input
(clamp). (Any input type can be
set.)
Wiring
.
CHANNEL(2/4)
.
1P2W
Single-phase
2-wire
1P3W
(Single-phase
3-wire)
3P3W
(3-phase 3wire)
______________________________________________________________________________________________
Analyzes single-phase 2-wire line.
Perform the setting so that oddnumber channels receive voltage
input and even-number channels
receive current input (clamp). (The
8808-51 can analyze two singlephase 2-wire lines simultaneously.)
Analyzes single-phase 3-wire line.
(8808-51 only)
Analyzes 3-phase 3-wire line.
(8808-51 only)
3.2 Measurement Target Setting
Page 8

4
_____________________________________________________________________________________________
Single-phase 2-wire
Single-phase 3-wire
8808-51 only
Source
1
HL
CH1 CH2
8807-51
Load
Position the clamp with the current direction
indicator pointing toward the load side.
LoadSource
Source
1
N
Load
HL
CH1 CH2 CH3 CH4
Source
1
N
HL
Load
8808-51
3-phase 3-wire
8808-51 only (3-phase 3-wire, 2-power meter method)
Source
R
Load
N
2
L
H
CH1 CH2 CH3 CH4
L
H
8808-51
For example, when using a HIOKI clamp on probe, the clamping method should be as shown below.
If the clamp on probe is faced in the opposite direction, the phase will shift 180 degrees from the actual
value.
NOTE
The direction of connection for the 9132-10 is opposite from the 9018-10.
9018-10
Load
S
T
L
H
CH1 CH2 CH3 CH4
H
8808-51
9132-10
Source
L
Source
______________________________________________________________________________________________
3.2 Measurement Target Setting
Load
Page 9

_____________________________________________________________________________________________
5
4. Analog Input Channel Setting
4.1 Waveform Display Color Setting
In instantaneous analysis mode, you can select the color of the displayed
waveform.
Setting Screen SET >>
1. Move the flashing cursor to the location next to
the channel to be set, as shown in the diagram.
2. Make a setting using the buttons.
List
OFF
Red/Green
Yellow/Light
Blue
Blue/Gray
Does not display
waveform.
Prints waveform at
standard print density.
Prints waveform at low
print density.
Prints waveform at high
print density.
When the 8992 PRINTER UNIT is used to print a
waveform, the three print densities are used to
represent the selected waveform display color (6
colors).
Print density has no effect in real-time printing.
CHANNEL(2/4)
______________________________________________________________________________________________
4.1 Waveform Display Color Setting
Page 10
6
(
_____________________________________________________________________________________________
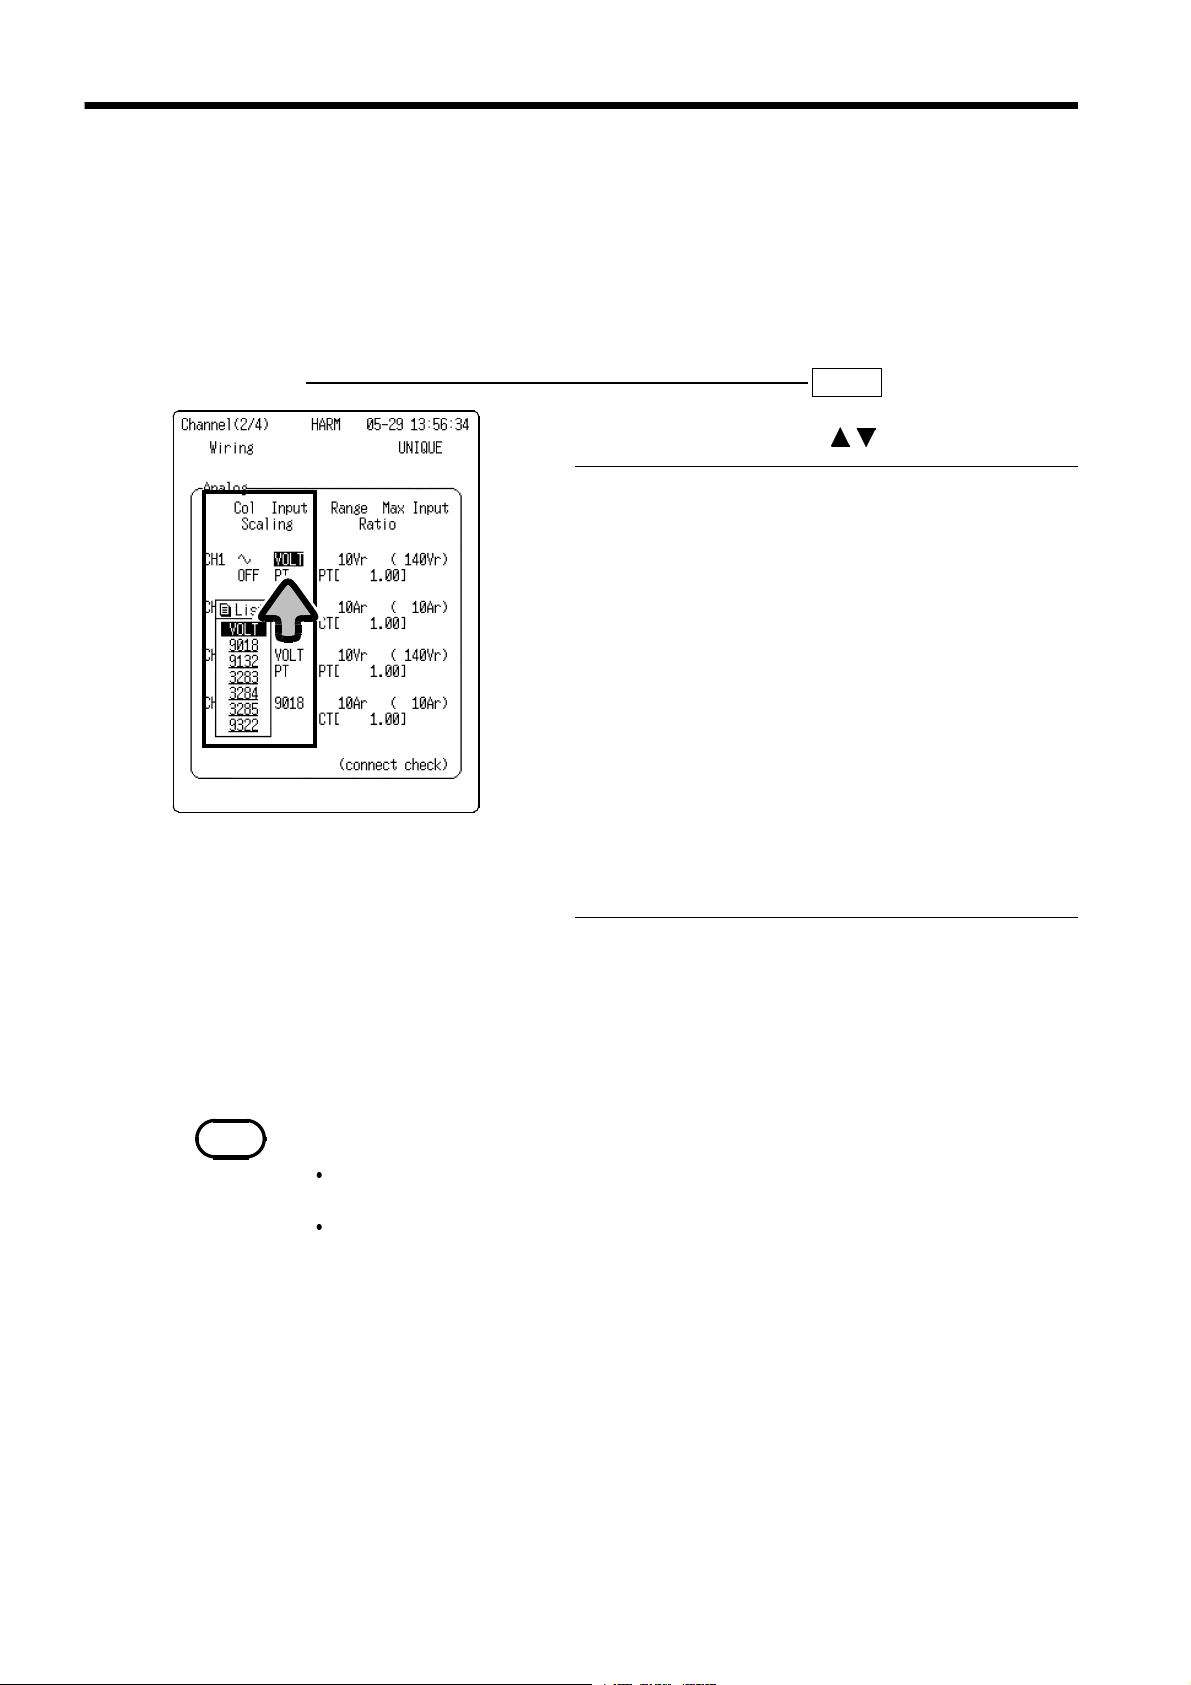
4.2 Input Type Setting
The input type must be set for each analog input channel.
Voltage and current in combination with the HIOKI Clamp Sensor can be
measured.
When the name of clamp is selected, measurements are automatically
converted to current values and displayed.
Setting Screen SET >>
1. Move the flashing cursor to
INPUT
2. Make a setting using the buttons.
For direct input of voltage or when using a
general-purpose clamp probe
(Current measurement)
When using a 9018-10 CLAMP ON PROBE
(Current measurement)
When using a 9132-10 CLAMP ON PROBE
(Leakage current measurement)
When using a 3283 CLAMP ON LEAK
HiTESTER
(Current measurement)
When using a 3284 CLAMP ON AC/DC
HiTESTER
(Current measurement)
When using a 3285 CLAMP ON AC/DC
HiTESTER
(High voltage measurement)
When using a 9322 DIFFERENTIAL PROBE
(*)When a 3283, 3284, or 3285 CLAMP ON
HiTESTER is selected, power analysis
(harmonic wave active power, harmonic wave
power content ratio, harmonic wave power
phase angle, active power, apparent power,
reactive power, power factor) cannot be
performed due to the phase characteristics.
If the 3283, 3284, or 3285 is selected, the
following warning message is displayed when
power analysis begins.
"Warning 635: 3283,3284,3285 can't analyze
power."
VOLT
9018
9132
3283(*)
3284(*)
3285(*)
9322
CHANNEL(2/4)
.
NOTE
Precautions for measuring current using a HIOKI CLAMP ON PROBE/CLAMP ON
HiTESTER
Set the same measurement range for the 8807-51/8808-51 and the clamp.
Accurate measurements are not possible if improper ranges are set.
When using the 3283, 3284 or 3295 CLAMP ON HiTESTER for current
measurement, press the OUTPUT button on the 3283/3284/3285 unit and set to
MON
______________________________________________________________________________________________
4.2 Input Type Setting
waveform output: AC).
Page 11
_____________________________________________________________________________________________
7
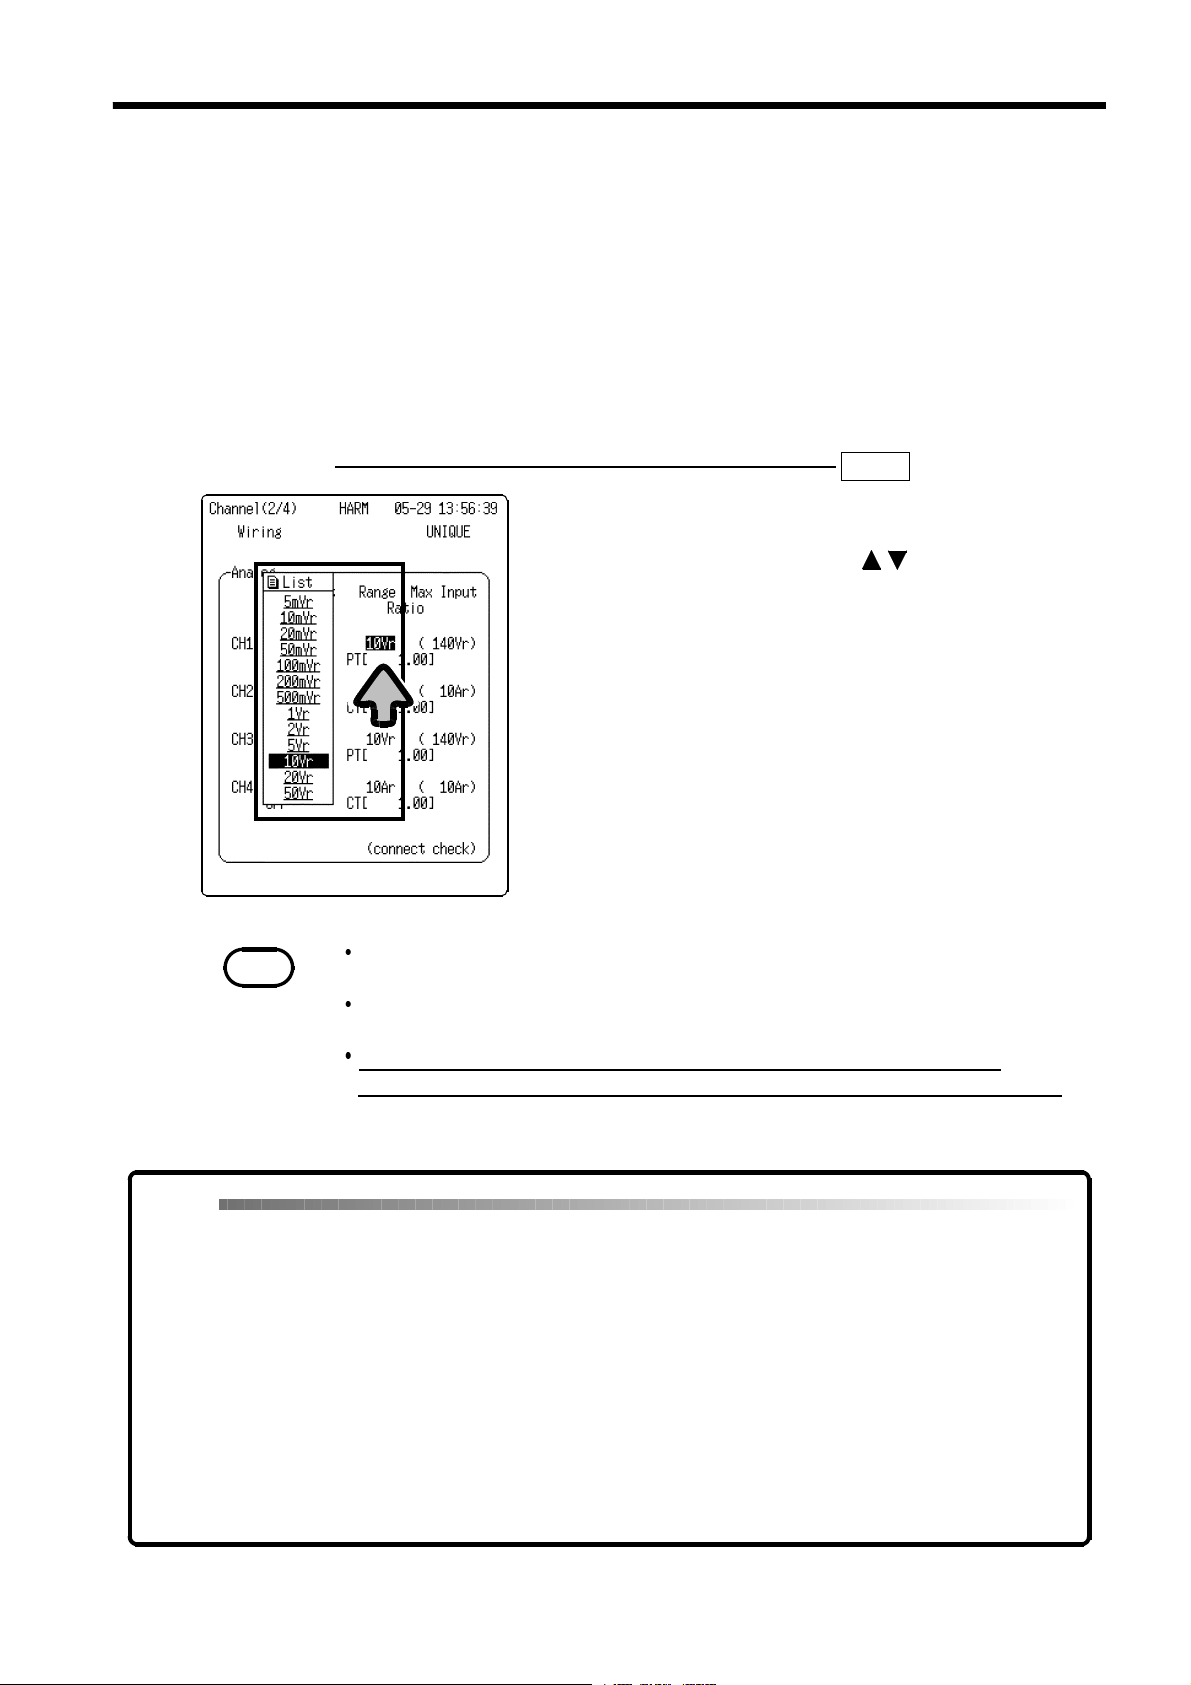
4.3 Vertical Axis Range Setting
The vertical axis range must be set for each channel.
When VOLTAGE is set as the input type:
Indicates rms voltage value per division when vertical axis magnification is
setto"x1."
When CLAMP is set as the input type:
Indicates rms current value on full vertical axis scale.
Setting Screen SET >>
1. Move the flashing cursor to
RANGE
2. Make a setting using the buttons.
NOTE
The input range for the harmonic wave analysis function is indicated as an rms
value.
In instantaneous analysis, the voltage value read by the cursor on the input
waveform screen is indicated as an instantaneous value.
Note that when VOLTAGE is selected as the input type, the maximum
measurement voltage displayed on the channel screen becomes the guaranteed
accuracyrange.
CHANNEL(2/4)
.
Q&A
Q1
What range should I select
when measuring a
commercial 110-Vrms
power supply?
Q2
What range should I select
when using the 9018 for 15Arms measurement?
______________________________________________________________________________________________
A1
Since commercial power supplies can fluctuate in the range of 10%,
select a range that covers 121 Vrms (110 Vrms x 1.1).
Maximum measurement voltage in 5-Vr range: 70 Vrms
70 Vrms < 121 Vrms X (over range)
Maximum measurement voltage in 10-Vr range: 140 Vrms
140 Vrms > 121 Vrms O (appropriate range)
A2
The clamp probe range indicates the maximum full-scale input as an
rms value. Select a range larger than the value of current to be
measured.
Be sure to set the same range in the clamp probe and the main unit.
10-Ar range setting: 10 Arms < 15 Arms X (over range)
20-Ar range setting: 20 Arms > 15 Arm s O (appropriate range)
4.3 Vertical Axis Range Setting
Page 12

8
_____________________________________________________________________________________________
4.4 Scaling Setting
The scaling function can be turned On or Off when using a CT/PT or
generic clamp probe.
Setting Screen SET >>
1. Move the flashing cursor to the location next to
the channel to be set, as shown in the diagram.
2. Make a setting using the buttons.
OFF
ON
No scaling
Scaling provided
3. When VOLTAGE is set as the input type:
Select the type of scaling.
PT
For PT rate setting
CHANNEL(2/4)
A
When a clamp probe other than HIOKI unit
is used
______________________________________________________________________________________________
4.4 Scaling Setting
Page 13

_____________________________________________________________________________________________
9
4.5 Scale Conversion Rate Setting
This screen is used to set the scaling conversion rate when using a CT/PT or
other clamp probe.
Setting of CT/PT rate
Setting Screen SET >>
1. Move the flashing cursor to the location next to
the channel to be set, as shown in the diagram.
2. Press the buttons to open the numerical
value setting window.
3. Move the cursor to a selected digit in the
numerical value setting window and enter a value
using the buttons. (exponential notation)
4. To confirm the setting:
Move the flashing cursor toOK, and press the
buttons or the
START
button.
To cancel the setting:
Move the flashing cursor to
the buttons or the
CANCEL
STOP
button.
Q&A
Q1
How can I measure 1500
Arms using a combination
of the 9020 CLAMP ON
ADAPTER (10:1) and the
9018?
A1
When the 10:1 9020 is used to measure 1500 Arms, the 9020 unit
outputs 150 Arms (1500 Arms x 1/10).
To measure 150 Arms, the 9018 should be set to the 200 Arms range.
With this setting, when scaling is turned ON and the conversion rate is
set to "10.00," the screen will display "1500 Arms" as the measured
value.
CHANNEL(2/4)
and press
______________________________________________________________________________________________
4.5 Scale Conversion Rate Setting
Page 14
10
g
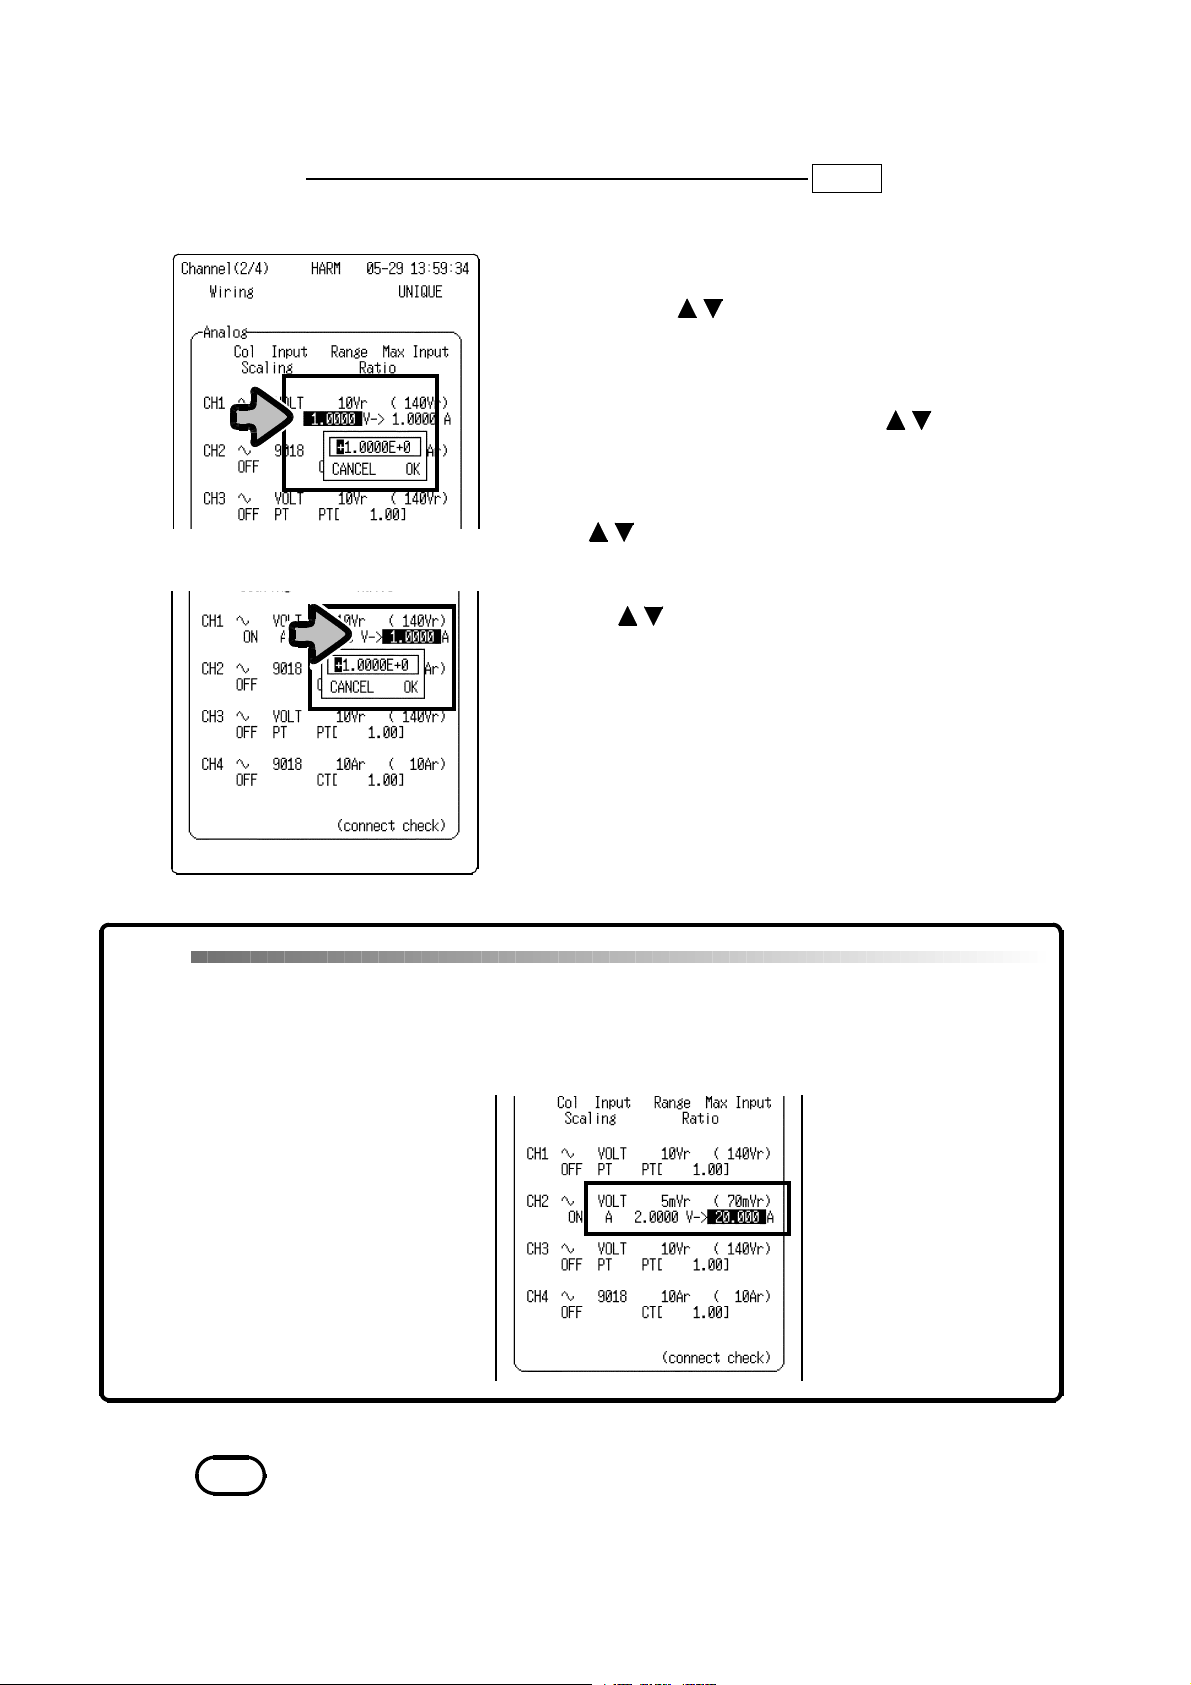
_____________________________________________________________________________________________
Settings for use of other clamp products
Setting Screen SET >>
1. Move the flashing cursor to the location next to
the channel to be set, as shown in the diagram.
2. Press the buttons to open the numerical
value setting window.
3. Move the cursor to a selected digit in the
numerical value setting window and enter an
output voltage value using the buttons.
(exponential notation)
4. To confirm the setting:
Move the flashing cursor toOK, and press the
buttons or the
START
button.
To cancel the setting:
Move the flashing cursor to
the buttons or the
CANCEL
STOP
button.
5. Move the flashing cursor toAand enter the
measurement range of the clamp to be used.
(Repeat steps 3 and 4.)
CHANNEL(2/4)
and press
Q&A
Q1
How can I make high
accuracy current
measurements using a
combination of the 9277
UNIVERSAL CLAMP ON
CT and the 9555?
NOTE
The scaling in the harmonic wave analysis function is effective only for harmonic
wave analyses.
The scaling setting in other functions is not valid in harmonic wave analyses.
You can enter a conversion rate even if scalin
A1
When the 9277 and 9555 are used together, the voltage output
becomes 2 Vf.s. with an input of 20 Af.s. In such cases, enter "2.00" in
"VOLTAGE" and "20.00" in "A" for automatic conversion of
measurement values to current values.
is set to OFF.
______________________________________________________________________________________________
4.5 Scale Conversion Rate Setting
Page 15
_____________________________________________________________________________________________
11
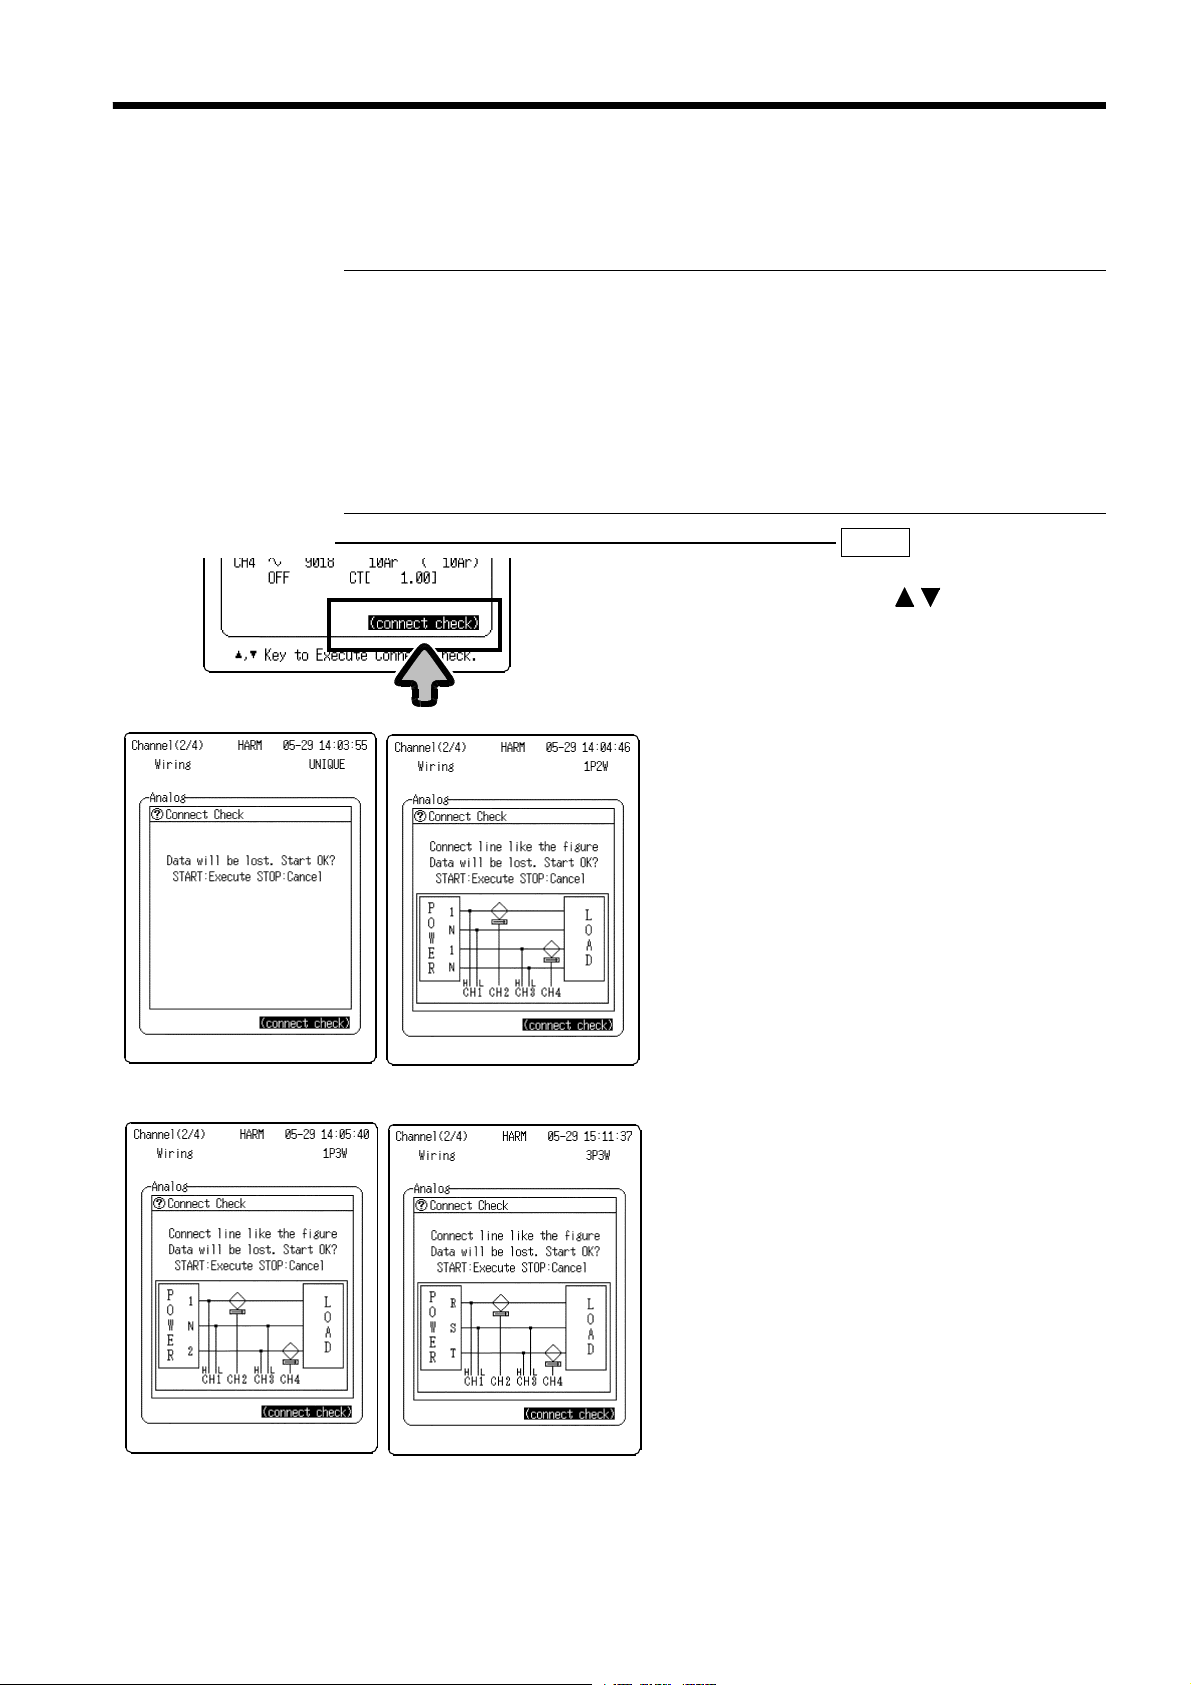
4.6 Line Connection & Level Check
This function is used to set an appropriate range for the input signal prior to
measurement. When a clamp probe is used, this function checks the
orientation of the probe. The check items vary by measurement target.
UNIQUE
Range check, voltage, and current phase check (when power analysis
is valid)
1P2W
1P3W
3P3W
Input type check, range check, voltage, and current phase check
Input type check, range check, voltage, and current phase check,
voltage level imbalance check, single-phase 3-wire and 3-phase 3-wire
detection
Input type check, range check, voltage, and current phase check,
voltage level imbalance check, single-phase 3-wire and 3-phase 3-wire
detection, phase sequence check
Setting Screen SET >>
1. Move the flashing cursor to
check)
, and press the buttons to
open the connection diagram and check
start window (diagrams at lower left).
(The displayed window corresponds to the
measurement target.)
2. Make connections according to the
connection diagram.
3. To run the check after completing the
connections:
Press the
START
button.
(The line connection & level check begins
automatically.)
To cancel:
Press the
STOP
button.
CHANNEL(2/4)
(connect
Independent channels
Single-phase 3-wire
______________________________________________________________________________________________
Single-phase 2-wire
3-phase 3-wire
4.6 Line Connection & Level Check
Page 16

12
_____________________________________________________________________________________________
4. Check the results of the line connection &
level check.
(The check items are automatically
selected from the items listed below,
according to measurement target.)
Range Over
Checks whether the range is appropriate for
the waveform to be measured.
For voltage measurement, the range switches
automatically to prevent input overshoot.
When the range switches, the following
message appears: "Range changed. (Out of
range) " (at the bottom of the screen)
Input type
Independent channels
Single-phase 2-wire
(modes except "UNIQUE")
Checks that the settings are appropriate for
power measurement.
Checks whether an appropriate clamp probe is
connected.
Sensor Direction
Checks the orientation of the clamp probe.
If the level of voltage/current input signal is
low, the screen indicates that a determination
cannot be made.
Single-phase 3-wire
The result of each check is indicated by "OK" or
"NG" (no good). When a check results in a
"NG" result, the line connection & level check
function halts, and details of the connection
error are displayed.
NOTE
If the input waveform phase is reversed, an accurate active power will not be
displayed. Be sure to perform the line connection & level check before
3-phase 3-wire
measurement.
Note that the waveform data stored in memory is deleted when the line
connection & level check is executed.
If the voltage/current level is low, a reversed clamp connection may not be
detected. In this case, the result of the clamp reversal connection check is
displayed as "?."
Connection errors may not be detected under the following conditions.
1) When there are two or more connection errors.
2) When the voltage/current level is low.
3) When the power factor is low.
In addition to the line connection & level check, we recommend checking the
DMM screen for abnormal measured values.
Voltage RMS line
(when set for 1P3W or 3P3W)
Checks voltage level imbalance
Select Measure Line
(when set for 1P3W or 3P3W)
Checks whether measurement is for a singlephase 3-wire line or 3-phase 3-wire line.
Voltage Phase Sequence
(when set for 3P3W)
Checks the phase sequence when measuring
a 3-phase 3-wire line.
5. When a check results in "NG":
Check and correct connections and restart
the line connection & level check.
Repeat the check until all items show
"OK."
______________________________________________________________________________________________
4.6 Line Connection & Level Check
Page 17
_____________________________________________________________________________________________
13
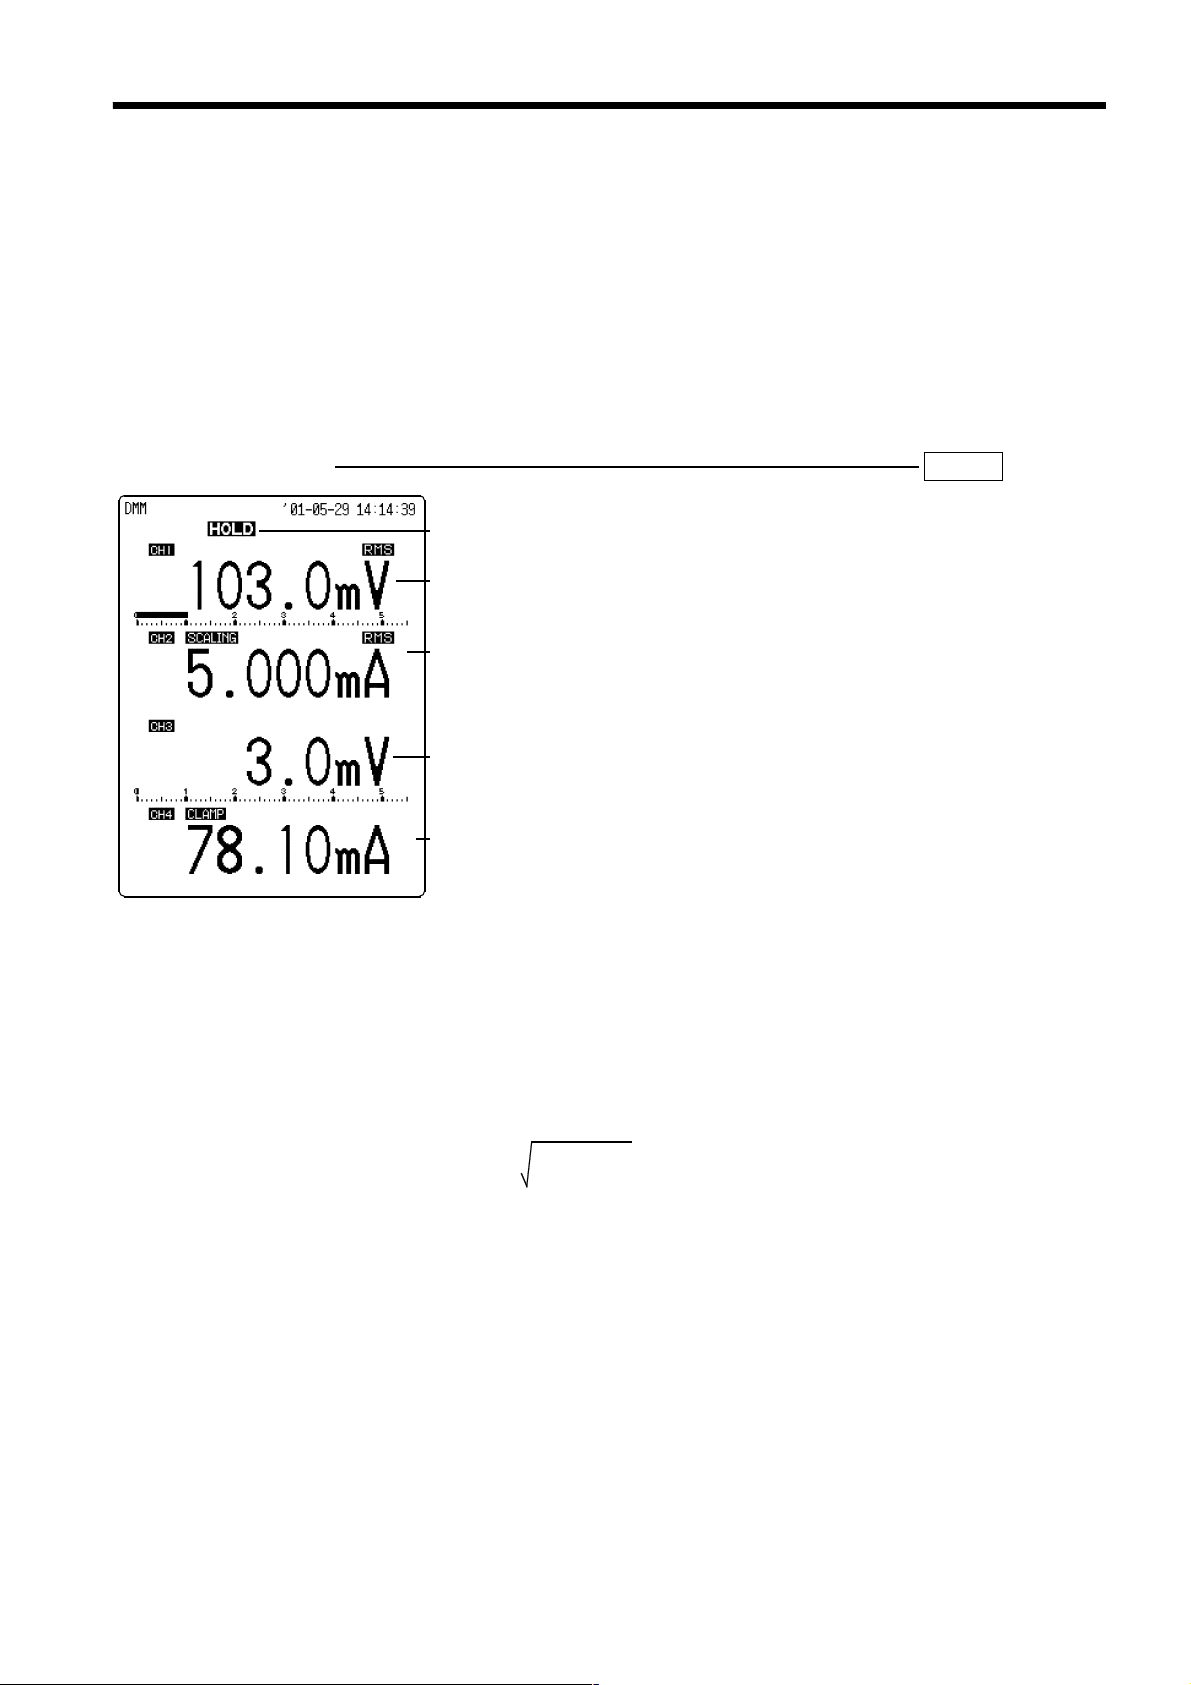
4.7 DMM Function
The DMM function provides a numeric display of the input voltage of a
commercial power supply (50/60 Hz) and DC signal on the screen.
The digital display can be switched between instantaneous value and rms
value.
This function will not display accurate values if the input voltage is not of a
commercial power supply (50/60 Hz) or a DC signal.
When the DMM screen is used with the harmonic wave analysis function,
the range set in the harmonic wave analysis function is reflected in the
display values.
Setting Screen DISP >>DMM
Hold
indication
rms value
(voltage)
rms value
(clamp)
1. Press the
screen.
2. Press the
open the DMM screen.
To return to the waveform screen, press the
button on the DMM screen.
button to open the waveform
DISP
button on the waveform screen to
DISP
DISP
Instantaneous
value
(voltage)
Instantaneous
value
(clamp)
Display contents
Instantaneous value display: The indications show the instantaneous values
of the input voltage of a commercial power supply (50/60 Hz) and DC
signal.
RMS value display: The displayed value is an rms value calculated on the
basis of the input voltage. The calculation is based on the following
equation:
RMS =
"A" indication when clamp is used
This indication shows the channel that measures the current using the 901810/9132-10 CLAMP ON PROBE, 3283 CLAMP ON LEAK HiTESTER, or
3284/3285 CLAMP ON AC/DC HiTESTER, or with scaling applied by a
generic clamp.
n
(
di2/n)
Σ
i=1
RMS: Rms value
n: Data number source
di: ith data in channel
______________________________________________________________________________________________
4.7 DMM Function
Page 18

14
play
_____________________________________________________________________________________________
Switching between instantaneous value display and rms value display
Channels with rms value display are indicated with an "RMS" displayed on
the DMM screen. You can toggle the display between instantaneous value
and rms value in the following ways:
Change to all-channel rms value display: button
Change to all-channel instantaneous value display: button
Change the specified channel:
CH1, CH2, CH3, CH4
(channel to be changed)
Display hold/cancellation of hold
Display hold:
STOP
(The screen shows
. The values displayed at the
HOLD
time that the button is pressed remain on screen.)
Canceling hold:
START
Printing the DMM screen
Printing the displayed values:
Screen copy:
COPY
PRINT
DMM function specifications in harmonic wave analysis function
Measurement target: Commercial power supply (50/60 Hz) (automatic
frequency setting)
Displayed information: Rms value or instantaneous value
Update rate: 1 s
Sampling speed: 4 kS/s
The number of displayed digits: 4 digits (the lowest digit indicates "0" when
the actual value is between 0 and 4, and "5" when the actual value is
between 5 and 9.). When scaling turned ON, exponential notation is used.
Accuracy: 3% rdg. 5 dgt.
NOTE
With scaling turned OFF, the maximum voltage value that can be displayed is
5499. The auto range function switches to a lower range when the count falls
below 500. The lowest digit indicates either "0" or "5."
The color of the digital indication for each channel corresponds to the waveform
dis
color set in instantaneous analysis mode.
______________________________________________________________________________________________
4.7 DMM Function
Page 19
_____________________________________________________________________________________________
15
5. Instantaneous Analysis Mode
This mode is used to perform various analyses on one cycle of an input
waveform.
5.1 Analyses and Display Screens
The analyses that can be performed in instantaneous analysis mode and
analysis result screens are described below.
The instantaneous analysis mode supports six analyses (items), each with its
own analysis screen, and seven analyses (parameter values) with numeric
indications only.
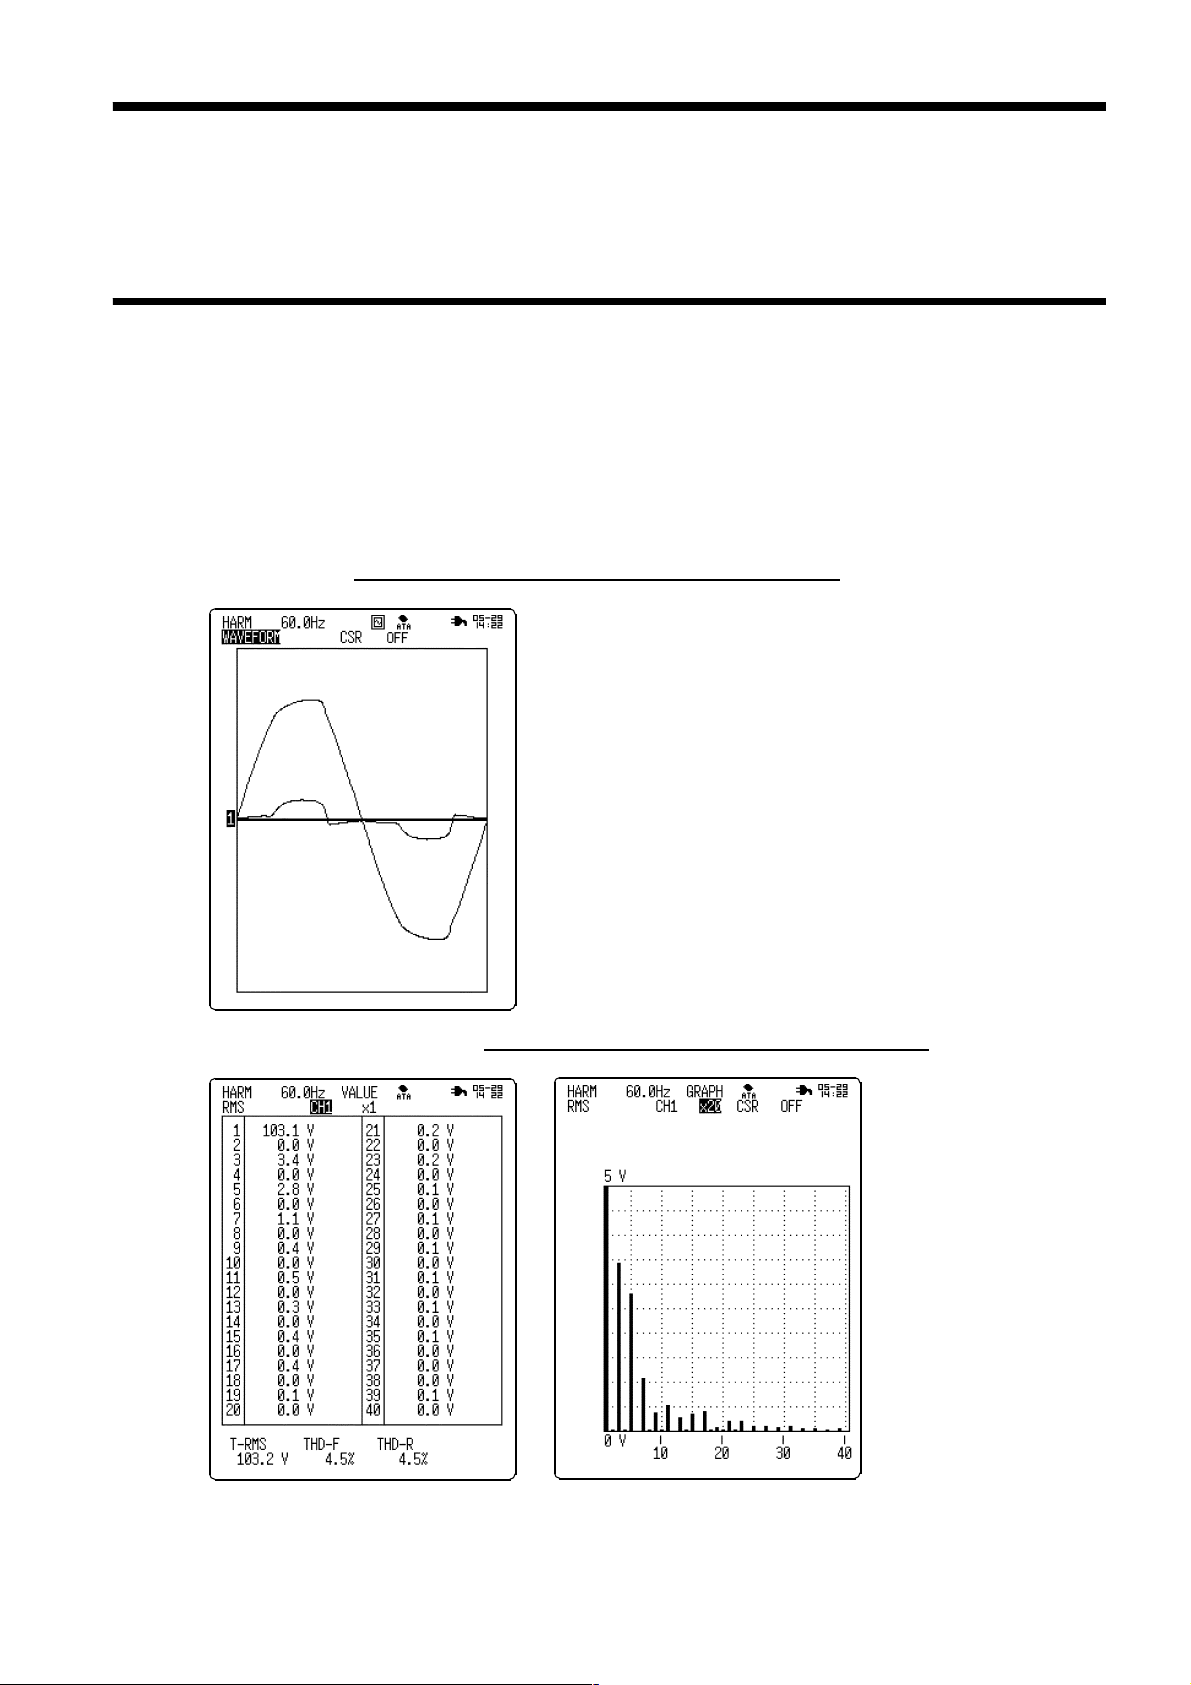
(1) Input waveform
(2) Harmonic wave rms value
(WAVEFORM screen)
512 sample points are extracted from the data,
which is sampled at a frequency of 400 kS/s.
(RMS screen)
The screen displays
the rms values of
harmonic wave
components of each
input signal, ranging
from the fundamental
wave to the 40th
degree.
Numeric screen
______________________________________________________________________________________________
Graph screen
5.1 Analyses and Display Screens
Page 20
16
_____________________________________________________________________________________________
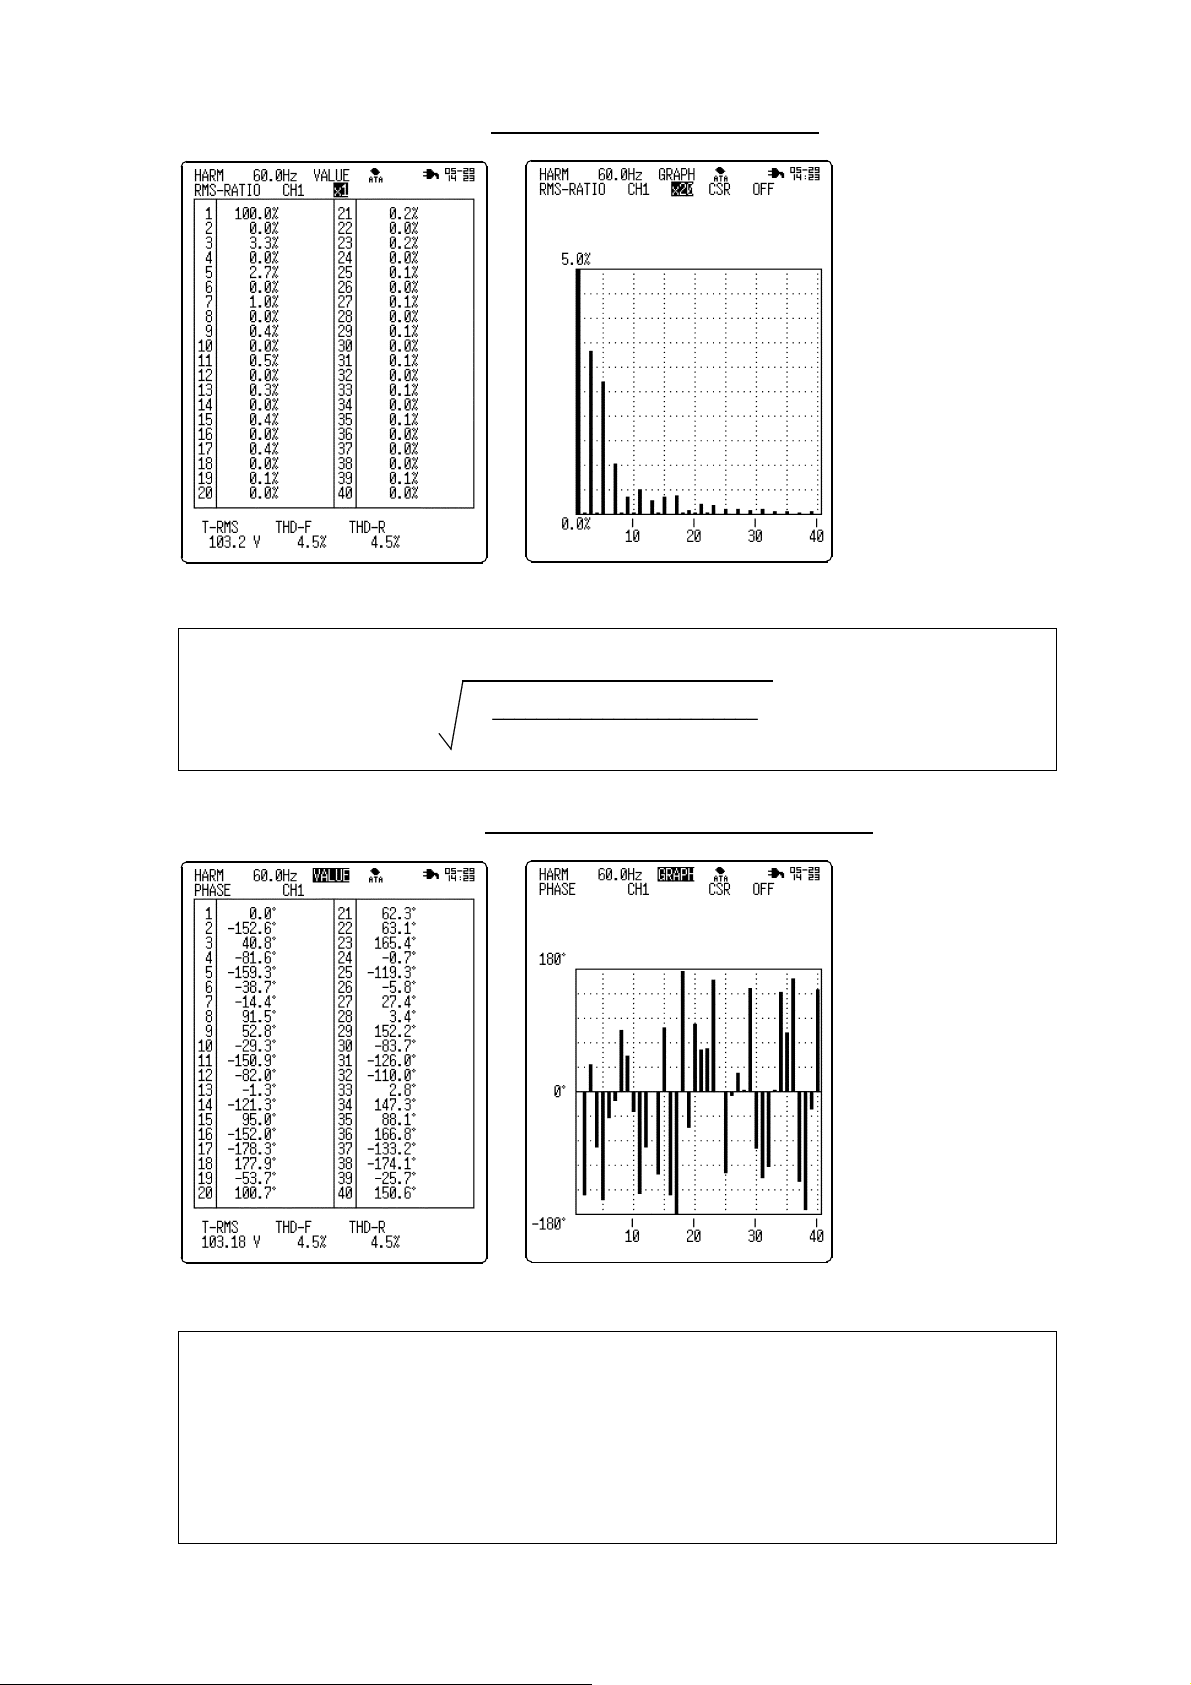
(3) Harmonic wave content ratio
Numeric screen
The fundamental wave content ratio is assigned a value of 100% for the calculations.
Content ratio =
___________________________
Graph screen
(nth-degree harmonic wave)
(Fundamental wave)
2
2
x 100 (%)
(RMS-RATIO screen)
The screen displays
the content ratios (%)
of harmonic wave
components of all
degrees to the input
signal.
(n = degree of
harmonic wave)
(4) Harmonic wave phase angle
Numeric screen
The input signal V can be expressed by the following equation:
sin(ωt)+V
V=V
1
.... +V
sin(2ωt+θ
2
sin{(n-1)ωt+θ
(n-1)
)+V
2
(n-1)
Graph screen
sin(3ωt+θ
3
sin(nωt+θ
}+V
n
)+ ...
3
ω =2π/T
t: Fundamental wave
)
n
frequency
: Rms value of nth degree
V
n
: Phase deviation of nth-
θ
n
degree harmonic wave from
fundamental wave
(PHASE screen)
The screen displays
the phase deviation of
the harmonic wave
components of all
degrees from the
fundamental input
signal wave.
______________________________________________________________________________________________
5.1 Analyses and Display Screens
Page 21

_____________________________________________________________________________________________
17
(5) Harmonic wave active power
Numeric screen
Active power = (Rms voltage value)
Graph screen
x (Rms current value)
n
(POWER screen)
The screen displays
the active power
values (W) of the input
signal harmonic wave
components, ranging
from the fundamental
wave to the 40th
degree.
x cos(Power phase angle)
n
(n = 1 to 40)
n
(6) Harmonic wave active power content ratio
Numeric screen
Active power content ratio=
Active power of nth-degree harmonic wave
____________________________________
Active power of fundamental wave
Graph screen
(P-RATIO screen)
The screen displays
the percentage of
active power value of
the harmonic wave
component of each
degree in the active
power value (given a
value of 100%) of the
fundamental wave of
input signal.
x100(%)
(n = degree of harmonic wave)
______________________________________________________________________________________________
5.1 Analyses and Display Screens
Page 22

18
_____________________________________________________________________________________________
(7) Harmonic wave power phase angle
Numeric screen
NOTE
In the graph, the horizontal axis and vertical axis show active power and reactive
power, respectively, while vector length indicates the magnitude of rms value
(apparent power).
The power phase angle vector diagram shows the harmonic wave components of
all degrees from the fundamental wave to the 40th degree.
Specifying a desired harmonic wave component displays the component in the
vector diagram as a solid line.
Harmonic wave inflow and outflow can be determined as shown below.
(P-PHASE screen)
By measuring the
phase angle of
harmonic wave current
of each degree relative
to the voltage
waveform, the screen
indicates the direction
of drift in the harmonic
wave of each degree.
Graph screen
Harmonic wave outflow
(8) Parameters
The numeric screen displays the following parameters:
90
180
-90
Harmonic wave inflow
0
Analysis screen Displayed parameters
RMS, RMS-RATIO, PHASE Total rms, total distortion-F, total
distortion-R
POWER, P-RATIO, P-PHASE Active power, apparent power, reactive
power, power factor
______________________________________________________________________________________________
5.1 Analyses and Display Screens
Page 23

_____________________________________________________________________________________________
19
Total rms value
Sum of rms values of all harmonic wave components.
Total rms value=
40
(nth-degree harmonic wave)
Σ
i=1
2
[V] or [A]
(n = degree of harmonic wave)
Total distortion-F
Percentage of all harmonic waves in fundamental wave.
"F" refers to "fundamental."
Total distortion-F =
40
(nth-degree harmonic wave)
Σ
i=2
(Fundamental wave)
2
2
[%]
(n = degree of harmonic wave)
Total distortion-R
Percentage of all harmonic waves in total rms value.
"R" refers to "rms."
Total distortion- R =
40
(nth-degree harmonic wave)
Σ
i=2
Total rms value
2
[%]
(n = degree of harmonic wave)
Active power
Mean value of the amount of work performed by one cycle of AC
instantaneous power
Active power =
40
{(Rms voltage value)
Σ
i=1
cos(Power phase angle)
x (Rms current value)
n
}[W]
n
(n = degree of harmonic wave)
x
n
Apparent power
Product of rms values of voltage and current
Apparent power = (Total rms voltage value) x (Total rms current value) (VA)
Reactive power
Value obtained by multiplying the product of rms values of voltage and
current by sin.
Reactive power =
40
{(Rms voltage value)
Σ
i=1
sin(Power phase angle)
x (Rms current value)
n
} [var]
n
(n = degree of harmonic wave)
x
n
Power factor
Cos of the phase difference between voltage and current.
Power factor = (Active power)/(Apparent power)
______________________________________________________________________________________________
5.1 Analyses and Display Screens
Page 24
20
p
_____________________________________________________________________________________________
NOTE
Harmonic wave analysis shows the results of analysis performed on sample data.
Based on analysis results, the rms value and content ratio are calculated
independently with a greater number of decimal places than are actually displayed
on screen. Therefore, the results calculated for rms value and content ratio may
differ slightly from the results obtained by calculating with the values displayed
on the screen.
If any of the following conditions is met, power measurement cannot be
erformed.
Condition 1 When CH1 and CH3 are set for current measurement
(input type: voltage/ 9322, scaling: A) or
(input type: 9018/ 9132/ 3283/ 3284/ 3285)
Condition 2 When CH2 and CH4 are set for voltage measurement
(input type: voltage/ 9322, scaling: OFF/ PT)
Condition 3 When the input types of CH2 and CH4 are set to 3283/ 3284/
3285
If one of conditions 1 through 3 is met at the start of measurement and
the following conditions apply, a warning message is displayed.
Condition
Setting
1 2 3
a (Harmonic wave trigger)
When the harmonic wave trigger source is set
to "power of each degree," "power content
ratio," or "power phase"
*1
Warning
633 (in 8807-51)
634 (in 8808-51)
*1
Warning
635
b (Instantaneous analysis)
When the analysis type is set to "active
power," "power content ratio," or "power
phase angle"
c (Time-series analysis)
When the analysis item is set to "active power
of each degree," "power content ratio," "power
phase angle," "active power," "reactive power,"
or "power factor"
d (Instantaneous analysis)
With the measurement target set to
*2
Warning 636
"independent channels" and the analysis type
set to "waveform," "rms value," "content
ratio," or "phase angle," when the analysis
type is changed to "active power," "power
content ratio," or "power phase angle" after
measurement
*1: Measurement halts if one of the following warning messages is
displayed:
Warning 633: Set CH1=Volt, CH2=Current (for 8807-51).
Warning 634: Set CH1,CH3=Volt, CH2,CH4= Current (for 8808-51).
Warning 635: 3283,3284,3285 can't analyze power.
*2: When the following warning message is displayed, the screen displays a
table with no numeric values.
Warning 636: Don't analyze power.
______________________________________________________________________________________________
5.1 Analyses and Display Screens
Page 25

_____________________________________________________________________________________________
21
5.2 Basic Item Setting
The following describes various setting items and setting methods.
1. Settings on Status Screen
(1) Analysis mode setting SET >>STATUS(1/4)
1. Move the flashing cursor to
MODE
2. Using the buttons, select
.
INSTANT
.
INSTANT
SERIES
Conducts instantaneous analysis.
Conducts time-series analysis.
(2) Frequency setting SET >>STATUS(1/4)
This item is used to set the power supply frequency
of the analysis target.
1. Move the flashing cursor to
Freq
.
2. Select the setting using the buttons.
Auto
50Hz
60Hz
45Hz65Hz
The frequency of the measurement
target is automatically calculated (in 0.1Hz steps) based on the input waveform.
The frequency of the measurement
target is set to 50 Hz.
The frequency of the measurement
target is set to 60 Hz.
For manual frequency settings (in 0.1-Hz
steps).
NOTE
The frequency estimate may fail if the waveform contains a significant amount of
noise, or with square waves. If this happens, set the basic frequency manually.
(3) Multi-screen setting SET >>STATUS(1/4)
The input waveform screen can be divided into subscreens, each displaying one channel.
1. Move the flashing cursor to
Display format
.
2. Using the buttons, select the number of
sub-screens to display.
Single
Dual
Quad
One graph for display and recording
Two graphs for display and recording
Four graphs for display and recording
The setting is valid only when the analysis type is
setto"WAVEFORM."
______________________________________________________________________________________________
5.2 Basic Item Setting
Page 26

22
_____________________________________________________________________________________________
(4) Auto save setting SET >>STATUS(1/4)
You can have data saved automatically to a PC card
when waveform analysis is complete. Data files are
stored in the directory selected in the file screen.
Selecting the data format for auto save
1. Move the flashing cursor to
Auto Save
.
2. Using the buttons, select the data format for
data to be saved by the auto save function.
OFF
Binary
Text
The auto save function is turned off.
Data is saved in binary format (for use in
8807-51/8808-51 only).
Data is saved in text format (for used in
PC). (Data saved in text format cannot be
loaded on the 8807-51 or 8808-51.)
Entering a file name for auto save
When a file name is entered, the auto save function
stores the file with that name. When several files
are saved in succession, they are assigned individual
numbers.
If no file name is entered, files are named
"AUTO.***", "AUTO0001.***", and so on.
For information on the file input method, see
Section 9.1 "Input of File Name."
(5) Print channel setting SET >>STATUS(1/4)
Select a channel from which results of measured
data analysis are printed.
1. Move the flashing cursor to the location of each
channel position, as shown in the diagram.
2. Using the buttons, select to print or not
print analysis results for each channel.
Print analysis results.
O
Do not print analysis results.
x
The setting is valid only when analysis results are
displayed as numerical values.
For active power, power content ratio, and power
phase angle, the power analysis results of the
systems containing the channels set for printout are
printed.
(6) Auto print setting SET >>STATUS(1/4)
You can have data printed automatically when
waveform analysis is complete.
1. Move the flashing cursor to
Auto Print
.
2. Using the buttons, select ON/OFF for the
auto print function.
______________________________________________________________________________________________
5.2 Basic Item Setting
Page 27

_____________________________________________________________________________________________
23
2. Settings in the Analysis Item Screen
(1) Analysis type setting SET >>ANALYZE (4/4)
Select the analysis result to be displayed.
1. Move the flashing cursor to
Analyze
2. Select the setting using the buttons.
.
Displays waveform data based on
512 points extracted from data
sampled at a rate of 400 kS/s.
Displays the harmonic wave rms
value component of an input signal.
Displays the content ratio of the
harmonic wave component of any
degree for the input signal.
Displays deviations in harmonic
wave component of any degree from
fundamental wave of the input signal.
Displays active power value (W) of
harmonic wave component of any
degree in input signal.
Displays active power content ratio
of the harmonic wave component of
any degree in active power (given a
value of 100%) of fundamental wave
of the input signal.
Displays the phase angle of the
harmonic wave current of any degree
relative to voltage waveform.
(*) Measurement is possible only when oddnumber channels are set for voltage and evennumber channels set for current. With HIOKI
CLAMP ON SENSORS 3283, 3284, or 3285,
power measurement cannot be performed, due
to inadequate phase accuracy.
WAVEFORM
RMS
RMS-RATIO
PHASE
POWER (*)
P-RATIO(*)
P-PHASE(*)
(2) Analysis channel setting SET >>ANALYZE (4/4)
Select the channel to be analyzed.
Selection options vary depending on the analysis
item.
vary depending on the analysis item.
1. Move the flashing cursor to
Channel
.
2. Select the setting using the buttons.
8807-51
8808-51
CH1/CH2
CH1/CH2/CH3/CH4
(3) Analysis result display setting SET >>ANALYZE (4/4)
Select the method for displaying analysis results.
1. Move the flashing cursor to
Disp Kind
.
2. Select the setting using the buttons.
VALUE
GRAPH
Displays analysis results numerically.
Displays analysis results in graph.
______________________________________________________________________________________________
5.2 Basic Item Setting
Page 28

24
_____________________________________________________________________________________________
3. Settings on Measurement Screen
(1) Analysis type setting DISP >>Waveform display
Select the analysis results to be displayed.
1. Move the flashing cursor to the location
indicated in the diagram.
2. Select the setting using the buttons.
(*) Measurement is possible only when oddnumber channels are set for voltage and evennumber channels are set for current. With
HIOKI CLAMP ON SENSORS 3283, 3284, or
3285, power measurements cannot be
performed due to inadequate phase accuracy.
WAVEFORM
RMS
RMS-RATIO
PHASE
POWER(*)
P-RATIO(*)
P-PHASE(*)
Displays waveform data based on 512
points extracted from data sampled at
a rate of 400 kS/s.
Displays the harmonic wave rms value
component of the input signal.
Displays the content ratio of the
harmonic wave component of any
degree for the input signal.
Displays deviations in the harmonic
wave component of any degree from
the fundamental wave of the input
signal.
Displays active power value (W) of
harmonic wave component of any
degree in the input signal.
Displays active power content ratio of
the harmonic wave component of any
degree in active power (given a value
of 100%) of the fundamental wave of
the input signal.
Displays phase angle of harmonic
wave current of any degree relative to
voltage waveform.
(2) Analysis result display setting DISP >>Waveform display
Select the method for displaying analysis results.
1. Move the flashing cursor to the location
indicated in the diagram.
2. Select the setting using the buttons.
(not displayed on the input waveform screen)
VALUE
GRAPH
Displays analysis results numerically.
Displays analysis results in graph.
______________________________________________________________________________________________
5.2 Basic Item Setting
Page 29

_____________________________________________________________________________________________
25
(3) Analysis channel setting DISP >>Waveform display
Select the channel to be analyzed.
1. Move the flashing cursor to the location
indicated in the diagram
2. Select the setting using the buttons.
Selection options vary depending on the analysis
item.
8807-51
8808-51
CH1/CH2
CH1/CH2/CH3/CH4
For POWER, P-RATIO, P-PHASE, the analysis
results of the system containing the selected channel
are displayed.
(4) Analysis result magnification/compression DISP >>Waveform display
You can magnify or compress the displayed
analysis results.
Magnified graph allows detailed examination of the
results.
1. Move the flashing cursor to the location
indicated in the diagram.
2. Select the setting using the buttons.
LOG, x1/2, x1, x2, x5, x10, x20, x50, x100
NOTE
1/10 f.s.
1/100 f.s.
1/1000 f.s.
1/10000 f.s.
When the analysis result is magnified by x10 or more, the display resolution
increases order of magnitude. Note that the measurement accuracy is based on a
display of x1 magnification.
The vertical axis of the LOG displayis as follows:
When the magnification is set to
the LOG display on the POWER
f.s.
screen, the center value of the
graph indicates the following:
When POWER (W) is selected:
(1/100,000 of f.s.)
When P-RATIO (%) is selected:
0.01%
______________________________________________________________________________________________
5.2 Basic Item Setting
Page 30

26
_____________________________________________________________________________________________
(5) Cursor ON/OFF setting (for graph screen only) DISP >>Waveform display
You can choose to hide or display detailed data for
each harmonic wave on the screen.
1. Move the flashing cursor to the location
indicated in the diagram.
2. Select the setting using the buttons.
OFF
+
Cursor is not used.
Cursor is used.
(6) Analysis degree setting (for graph screen only) DISP >>Waveform display
Use the cursor to select the analysis degree to read.
1. Move the flashing cursor to the location
indicated in the diagram.
2. Select the setting using the buttons.
From first degree to 40th degree
(7) Waveform display range setting
(for waveform input screen only) DISP >>Waveform display
You can select the display size of the waveform
input screen. Selecting the multi-screen setting
displays the input range for the instantaneous
waveform used for harmonic wave analysis.
1. Move the flashing cursor to the location
indicated in the diagram.
2. Select the setting using the buttons.
Displays the input instantaneous waveform in a
full screen.
Displays the input instantaneous waveform in a
sub-screen.
Upper and lower limit values for four channels (two
channels with 8807-51) are displayed on the screen.
______________________________________________________________________________________________
5.2 Basic Item Setting
Page 31

_____________________________________________________________________________________________
27
(8) Input setting (for waveform input screen only) DISP >>Waveform display
Input can be set for each channel on the waveform
input screen.
Setting
of
channel
1
2
3
4
1. Using the
CH1,CH2,CH3,CH4
buttons, display
the setting window for a selected channel.
2. Move the flashing cursor to the position of the
channel to set and press the buttons.
(You can change the setting window to input
channels CH1 through CH4 (CH2 for the 8807-
51).)
3. Move the flashing cursor to the item to be set.
4. Press the buttons.
5. To close the setting window, press the channel
button again.
Setting details
1. Waveform display color Used to select waveform display color
2. Input type Used to select the input type for the analog input
channel
3. Vertical axis range Used to set the vertical axis range for each channel
4. Maximum input (display
only)
Displays the maximum input that can be measured
in the set vertical axis range.
5.3 Cursor Operation
In the input waveform screen, you can use the cursor to simultaneously read
the phase relative to the zero crossing point and the voltage value.
Setting Screen DISP >>Waveform display
1. Using the buttons, set the analysis type to
.
Do not use cursors A/B.
Use only cursor A.
Setting of analysis type
WAVEFORM
2. Move the flashing cursor to the location
indicated in the diagram and select the cursor
type using the buttons.
OFF
A
A-B
A-B Use cursors A and B and move cursor B.
A-B
Value of A or B Value of B-A
t Phase difference from
zero crossing point
v Instantaneous voltage
(current) value of
selected channel
______________________________________________________________________________________________
Phase difference
between cursors
Potential difference
between cursors
3. Move the cursor using the
and read an indication.
Use the buttons to move the cursor
quickly.
Use cursors A and B and move cursor A.
Use cursors A and B and move both
simultaneously.
SCROLL/CURSOR
5.3 Cursor Operation
button
Page 32

28
p
)
_____________________________________________________________________________________________
5.4 Analysis Example 1: Simultaneous Instantaneous Analysis
of Two 100-VAC Single-Phase 2-Wire Lines
NOTE
Described below is a method for performing instantaneous analysis of two
100-VAC single-phase 2-wire lines simultaneously using the 8808-51.
In the example, the HIOKI 9018-10 CLAMP ON PROBE is used for current
measurement.
(1) Power supply on
Turn on the power switch for the 8808-51.
(2) Input connection
This equipment is designed to measure input voltage. To measure current, use a
voltage-output-type clamp ammeter. We recommend our CLAMP ON PROBE
and CLAMP ON HiTESTER for current measurements.
If a clamp ammeter is used to take measurements, the accuracy of both the 880751/8808-51 and the clamp affects the accuracy of measurements. Carefully check
the specifications for the CLAMP ON PROBEs and select the unit most
appropriate for the specific application. (Refer to Section 10 "Characteristics of
Clam
-on Probes."
Connect the 8808-51, as shown in the diagram below.
Source
1
N
Load
HL
CH1 CH2 CH3 CH4
Source
1
N
HL
8808-51
Load
To ensure that the phases of
measured current and the output
voltage match, check that the
current flow direction arrow
displayed on the clamp part points
toward the load.
Refer to P4 clamp on probe
connection method.
______________________________________________________________________________________________
5.4 Analysis Example 1: Simultaneous Instantaneous Analysis of Two 100-VAC Single-Phase 2-Wire Lines
Page 33

_____________________________________________________________________________________________
29
(3) Preparing for measurement
1. Using the
to the screen in which settings
are to be made.
2. Using the cursor and
buttons, make the settings as
shown in the diagrams on the
left.
button, proceed
SET
(4) Line connection & level check
This item is used to check the connections.
1. Move the flashing cursor to
(connect check)
the channel screen (2/4).
2. Press the buttons to open the confirmation
window.
3. To start the line connection & level check:
Press the
START
button.
4. To cancel the line connection & level check:
Press the
NOTE
______________________________________________________________________________________________
5.4 Analysis Example 1: Simultaneous Instantaneous Analysis of Two 100-VAC Single-Phase 2-Wire Lines
When a line connection & level check is executed, measurement data stored in
memory is deleted.
We recommend saving any required data to a PC card before running a line
connection & level check.
STOP
button.
on
Page 34

30
_____________________________________________________________________________________________
Line connection & level check start
The voltage range automatically switches to prevent
input overshoot. When the range changes, the
following message appears at the bottom of the
screen:
"Range changed. (Out of range)."
1) After the line connection & level check, check
the window.
2) When the line connection check result is "NG"
(no good):
Cause: Reverse probe connection
Remedy: Check the direction of the arrow on the
probe and correct the probe orientation. Restart
the line connection & level check.
Make sure that the check result shows "OK."
For details, see Section 4.6, "Line Connection &
Level Check."
(5) Measurement start
Press the
START
(6) Measurement complete
When one cycle of data is input, the LED turns off and measurement halts.
The screen displays a waveform.
(7) Other analyses
Proceed to the analysis type item and select the analysis screen by pressing
the buttons.
button to execute the measurement. (Green LED lights.)
Waveform input screen
This example indicates that the
analysis target is a waveform
with a frequency of 60 Hz.
______________________________________________________________________________________________
5.4 Analysis Example 1: Simultaneous Instantaneous Analysis of Two 100-VAC Single-Phase 2-Wire Lines
Rms value graph screen
This example shows that the
third-degree, fifth-degree and
seventh-degree harmonic wave
Content ratio graph screen
Indicates harmonic wave
components by content ratios.
This example indicates that oddnumbered harmonic wave
components are high in content.
Page 35

_____________________________________________________________________________________________
31
Phase angle numeric screen Active power graph screen
Shows the harmonic wave active
power of any degree with a bar
graph.
Power content ratio screen
Indicates the percentage of the
active power of harmonic wave
component of any degree in
active power (given a value of
"100%") of the fundamental
wave.
Power phase angle vector graph
screen
The vector graph shows the inflow
and outflow of harmonic waves.
______________________________________________________________________________________________
5.4 Analysis Example 1: Simultaneous Instantaneous Analysis of Two 100-VAC Single-Phase 2-Wire Lines
Page 36

32
_____________________________________________________________________________________________
(8) Printout
Press the
PRINT
button.
When the numeric screen is displayed, the numeric data is printed. When
the graph screen is displayed, a hard copy of the screen is printed. For more
information, refer to Section 8.1 "Recording on Printer."
Numeric data
Example of printout of RMS, RATIO, PHASE screen
Numeric data
Example of printout of POWER, P-RATIO, P-PHASE
screen
______________________________________________________________________________________________
5.4 Analysis Example 1: Simultaneous Instantaneous Analysis of Two 100-VAC Single-Phase 2-Wire Lines
Page 37

_____________________________________________________________________________________________
33
5.5 Analysis Example 2: Instantaneous Analysis of 200-VAC 3Phase 3-Wire Line
Describes below is a method for performing an instantaneous analysis of a
200-VAC 3-phase 3-wire line using the 8808-51.
The 8808-51 uses a 2-wattmeter method for power analysis of 3-phase lines.
(1) Input connection
Connect the 8808-51, as shown in the diagram below.
Source Load
R
S
T
H
CH1 CH2 CH3 CH4
(2) Preparation for measurement
L
L
H
8808-51
To ensure that the phases of
measured current and the output
voltage match, check that the
current flow direction arrow
displayed on the clamp part points
toward the load.
Refer to P4 clamp on probe
connection method.
1. Using the
button, proceed
SET
to the screen in which settings
are to be made.
2. Using the cursor and
buttons, make the settings as
shown in the diagrams on the
left.
______________________________________________________________________________________________
5.5 Analysis Example 2: Instantaneous Analysis of 200-VAC 3-Phase 3-Wire Line
Page 38

34
_____________________________________________________________________________________________
(4) Line connection & level check
This item is used to check
connections.
For detailed information, refer to
Measurement Example 1(4).
(5) Measurement start/end
Press the
When one cycle of data is input, the LED goes out and measurement stops.
The screen displays a waveform.
START
button to perform the measurement. (Green LED lights.)
______________________________________________________________________________________________
5.5 Analysis Example 2: Instantaneous Analysis of 200-VAC 3-Phase 3-Wire Line
Page 39
_____________________________________________________________________________________________
y
35
6. Time-Series Analysis Mode
The time-series analysis mode is used to perform data analysis for a specific
time interval for any of the 13 types of analysis available in instantaneous
analysis mode, and then to record changes in data over time.
The following section describes how to use the time-series analysis mode
and provides examples of analysis.
6.1 Basic Item Setting
Described below are selection options and setting methods for various setting
items:
1. Settings in the Status Screen
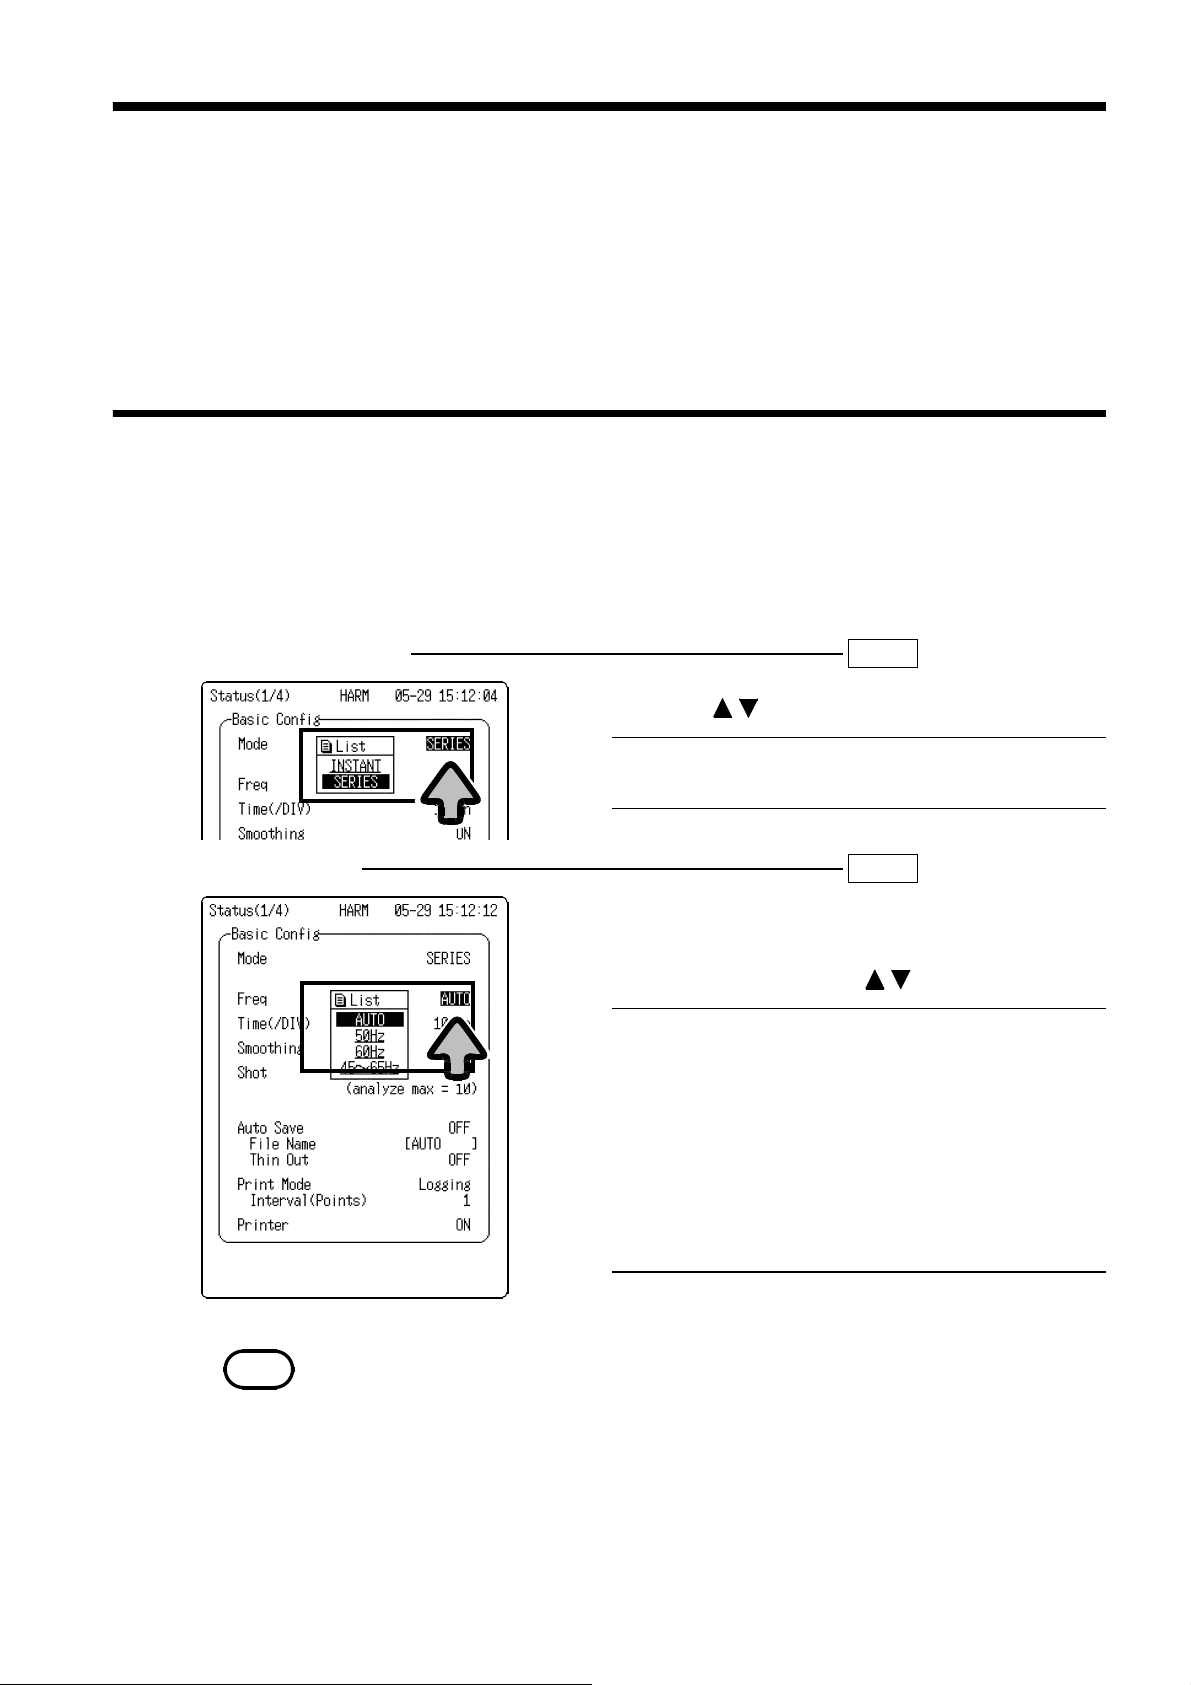
(1) Analysis mode setting SET >>STATUS(1/4)
1. Move the flashing cursor to
2. Using the buttons, select
INSTANT
SERIES
Conducts instantaneous analysis.
Conducts time-series analysis.
Mode
SERIES
.
.
(2) Frequency setting SET >>STATUS(1/4)
This screen is used to set the frequency of the
analysis target.
1. Move the flashing cursor to
Freq
.
2. Select a setting using the buttons.
Auto
50Hz
60Hz
45Hz-65Hz
The frequency of the measurement
target is automatically calculated (in
0.1-Hz steps) based on the input
waveform.
Sets 50 Hz as the frequency of the
measurement target.
Sets 60 Hz as the frequency of the
measurement target.
Used to set the frequency manually (in
0.1-Hz steps).
NOTE
______________________________________________________________________________________________
Frequency estimations may fail if the waveform contains significant amounts of
noise or consists of square waves. If this happens, set the basic frequency
manuall
.
6.1 Basic Item Setting
Page 40

36
_____________________________________________________________________________________________
(3) Time-axis range SET >>STATUS(1/4)
This item is used to set the time per division on the
time axis (one grid on recording paper).
1. Move the flashing cursor to
Time (/DIV)
.
2. Select a setting using the buttons.
5, 10, 30 min/DIV, 1, 3, 6, 12 h/DIV
NOTE
The data interval is 1/80 of the time-axis range setting.
(4) Average processing SET >>STATUS(1/4)
This function cancels out unexpected phenomena by
obtaining an average of the analysis data.
A simple average of all data measured in a data
interval is recorded for each data interval.
1. Move the flashing cursor to
Smoothing
.
2. Select a setting using the buttons.
OFF, ON
NOTE
The number of data used to calculate the average depends on the time-axis range.
Time-axis range 5min 10 min 30 min 1h 3h 6h 12 h
No. of data Not
available
2 6 12 24 48 96
(5) Recording length SET >>STATUS(1/4)
This item is used to set the recording length
(recording time) of one measurement input
operation.
1. Move the flashing cursor to
Shot
.
2. Select a setting using the buttons.
______________________________________________________________________________________________
6.1 Basic Item Setting
Page 41

_____________________________________________________________________________________________
(
37
Relationship between time-axis range and recording length
(min: minutes/ h: hours/ d: days)
Time axis
No. of
analysis items
20 30
20 1 hour 3 hours 6 hours 12 hours 1day 3days 7days
20 3 hours 6 hours 12 hours 1 day 3days 7days 14 days
20 5 hours 10 hours 1 day 2days 7days 14 days 30 days
10 10 hours 20 hours 2days 4days 14 days 30 days 60 days
4 1 day 2days 6days 12 days 37 days 75 days 150 days
20 CONT*
5min 10 min 30 min 1h 3h 6h 12 h
1 hour 3 hours 6 hours 12 hours 1 day 3days
minutes
(5 hours)
CONT*
(10 hours)
CONT*
(30 hours)
CONT*
(2.5 days)
CONT*
(7.5 days)
CONT*
(15 days)
CONT*
(30 days)
(*) The last 60 divisions of analysis data are stored in memory. Figures in ( ) indicate recording time
lengths.
NOTE
When the recording length is set to "CONT," measurement continues until the
STOP button is pressed.
When the recording length is set to "CONT," waveforms for the last 60 divisions
includingthe screen currentlydisplayed)are saved to memory.
(6) Auto save setting SET >>STATUS(1/4)
As soon as waveform analysis is complete, data can
be saved automatically to a PC card. Data files are
stored in the current directory set in the file screen.
Selection of data format for auto save
1. Move the flashing cursor to
Auto Save
.
2. Using the buttons, select the format for data
to be stored by the auto save function.
OFF
Binary
Text
Auto save function is turned off.
Data is saved in binary format (for use in
8807-51/8808-51 only).
Data is saved in text format (for use on a
PC).(Data saved in text format cannot be
loaded by the 8807-51 or 8808-51. Data
for all set analysis items (max. 20 items) is
saved.)
Entering name of file to be auto-saved
If a file name is entered, the auto save function
stores the file under that name. If files are saved in
succession, they are assigned individual numbers.
If no file name is entered, files are named
"AUTO.***," "AUTO0001.***", and so forth.
For information on the file input method, refer to
Section 9.1 "Input of File Name."
______________________________________________________________________________________________
6.1 Basic Item Setting
Page 42
38
_____________________________________________________________________________________________
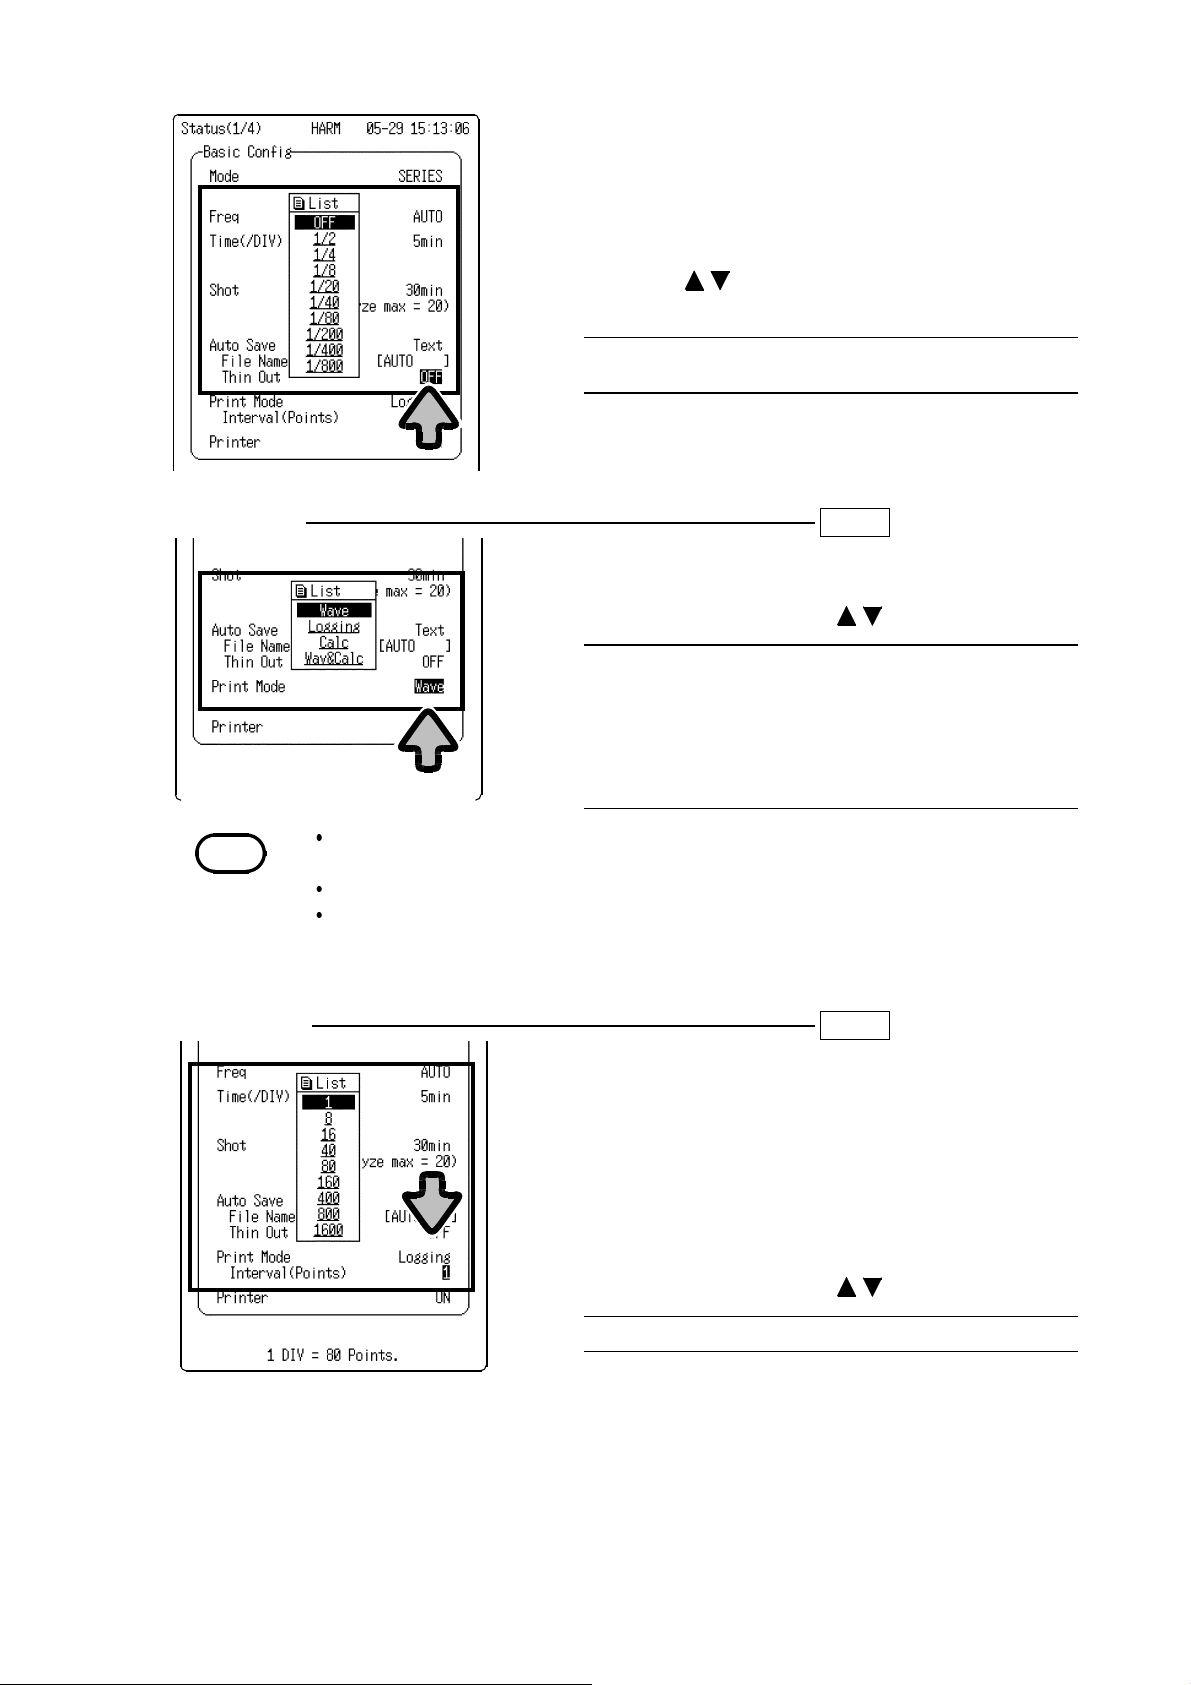
Selective save setting
When "Text" is set for the data saving format, data
can be saved at selected intervals.
The selective save function stores data at selected
intervals. No other data is included in the data file.
1. Move the flashing cursor to
Thin out
.
2. Using the buttons, select the interval for
saving data.
OFF, x1/2, x1/4, x1/8, x1/20, x1/40, x1/80, x1/200,
x1/400, x1/800
(7) Printing types SET >>STATUS(1/4)
This item is used to select the printer output type.
1. Move the flashing cursor to
Print Mode
.
2. Select a setting using the buttons.
Outputs waveform.
Outputs numeric values.
Outputs calculation values.
Outputs waveform and
calculation values.
NOTE
Wave
Logging
Calc
Wav & Calc
The calculation operation determines the maximum value and average value of
measurement data collected over the entire recording length.
The calculation operation is performed only for analysis displayed on the screen.
When cursors are used, calculations are performed for the section located between
the cursors.
(8) Printing interval SET >>STATUS(1/4)
When "Logging" is selected as the print type in step
7, this item allows the setting of the interval of data
to be printed.
The selective printing function prints data at
selected intervals.
The number of points per one division of the record
is 80.
1. Move the flashing cursor to
Interval (Points)
.
2. Select a setting using the buttons.
1, 8, 16, 40, 80, 160, 400, 800, 1600
______________________________________________________________________________________________
6.1 Basic Item Setting
Page 43

_____________________________________________________________________________________________
39
(9) Printer setting SET >>STATUS(1/4)
Measurements can be printed simultaneously as
analysis is being carried out.
1. Move the flashing cursor to
Printer
.
2. Select a setting using the buttons.
OFF
ON
Does not print measurements in real time.
Prints measurements as data is input.
2. Settings on Measurement Screen
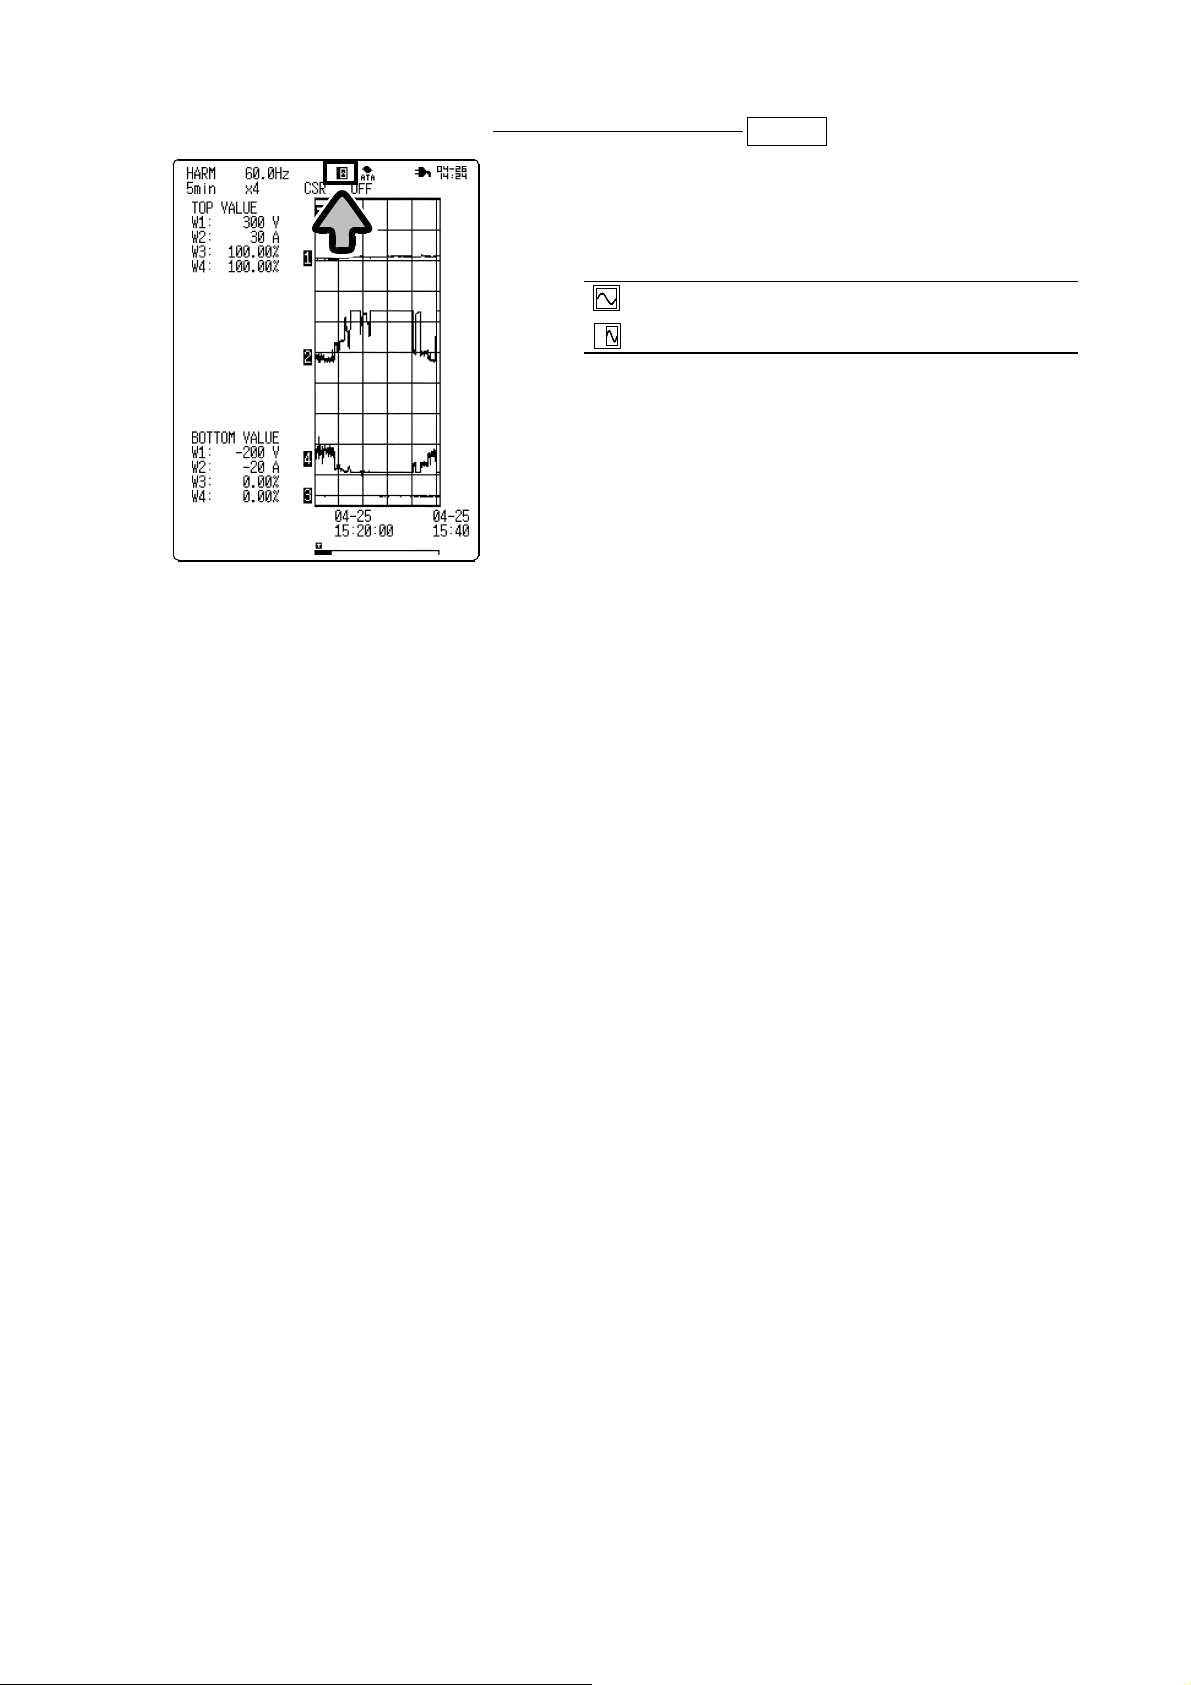
(1) Time-axis range magnification/compression DISP >>Waveform display
The magnification/compression rate can be set for
the time axis in the waveform screen.
A magnified display of waveforms allows detailed
examination of results.
A compressed display of waveforms makes it easier
to see overall changes.
Waveform magnification/compression uses the left
edge of the screen as the stationary point.
1. Move the flashing cursor to the location
indicated in the diagram.
2. Select a setting using the buttons.
x4, x2, x1, x1/2, x1/4, x1/6, x1/12, x1/24, x1/48
x4
x1/4
______________________________________________________________________________________________
6.1 Basic Item Setting
Page 44
40
_____________________________________________________________________________________________
(2) Waveform display range setting DISP >>Waveform display
You can select the display size of the waveform
input screen. When the multi-screen setting is
selected, the upper and lower limit values for the
display of the selected analysis item are indicated.
Displays measurement screen on full screen.
Displays measurement screen on sub-screen.
Upper and lower limit values for four channels (two
channels with 8807-51) are displayed on the screen.
______________________________________________________________________________________________
6.1 Basic Item Setting
Page 45

_____________________________________________________________________________________________
41
6.2 Analysis Item Setting
In time-series analysis mode, a maximum of 20 items from the following 13
types can be analyzed for harmonic waves of all degrees simultaneously.
Harmonic wave rms value, harmonic wave content ratio, harmonic wave
phase angle, total rms value, total distortion-F, total distortion-R, active
power of each degree, power content ratio, power phase angle, active power,
apparent power, reactive power, and power factor
(For calculation methods, refer to Section 5.1.)
1. Settings in Analysis Item Screen
(1) Analysis type setting SET >>Analyze
This screen is used to select the analysis to be
performed.
1. Move the flashing cursor to an analysis item.
2. Select a setting using the buttons.
NOTE
The following conditions must be met to
measure active power of each degree, power
content ratio of each degree, power phase angle
of each degree, active power, apparent power,
reactive power, and power factor.
1. Odd-numbered channels are set to receive
voltage waveforms, while even-numbered
channels are set for current waveforms.
2. The 9018, 9132, or general-purpose clamp is
selected for current measurement.
If the above conditions are not met for the
measurement of power values, one of the
following warning messages is displayed when
measurement starts, and measurement then stops.
Warning 633: Set CH1=Volt, CH2=Current.
(for
8807-51).
Warning 634: Set CH1,CH3=Volt, CH2,CH4=
Current.
Warning 635: 3283,3284,3285 can't analyze
power.
(for 8808-51).
(for both 8807-51 and 8808-51).
RMS
RATIO
PHASE
T-RMS
THD-F
THD-R
POWER
P-RATIO
P-PHASE
WATT
VA
var
P-FACTOR
Rms value of harmonic wave component
of each degree
Content ratio of harmonic wave
component of each degree in the
fundamental wave
Phase deviation of harmonic wave
component of each degree relative to the
fundamental wave
Sum of rms values of all harmonic wave
components (overall rms value)
Percentage of all harmonic waves in
fundamental wave
Percentage of all harmonic waves in total
rms value
Active power value of harmonic wave
component of each degree
Active power content ratio of harmonic
wave component of each degree in active
power of the fundamental wave
Phase angle of harmonic wave current of
each degree relative to the voltage
waveform
Active power containing all harmonic wave
components
Apparent power
Reactive power
Power factor
______________________________________________________________________________________________
6.2 Analysis Item Setting
Page 46

42
_____________________________________________________________________________________________
(2) Analysis channel setting SET >>Analyze
You can select the channel to be analyzed.
1. Move the flashing cursor toCH.
2. Select a setting using the buttons.
8807-51
8808-51
CH1/CH2
CH1/CH2/CH3/CH4
For POWER, P-RATIO, P-PHASE, WATT, VA,
var, and P-FACTOR, data for the system containing
the selected channel is analyzed.
(3) Setting Degree of analysis SET >>Analyze
When harmonic wave rms value, harmonic wave
content ratio, harmonic wave phase angle, active
power of each degree, power content ratio of each
degree, and power phase angle of each degree are
selected, this item is used to select the degree of
harmonic wave to be analyzed.
1. Move the flashing cursor to theNsection of an
analysis item.
2. Select a setting using the buttons.
1to40
(4) Result screen display setting SET >>Analyze
A maximum of four analysis result phenomena can
be displayed on the screen and printed. Waveforms
to be displayed are set in W1 through W4.
1. Move the flashing cursor to
in the display
No
item section.
2. Select a setting using the buttons.
OFF
1-20
______________________________________________________________________________________________
6.2 Analysis Item Setting
Hides analysis results.
Used to select analysis result to be
displayed.
Page 47

_____________________________________________________________________________________________
43
(5) Waveform display color setting SET >>Analyze
Select the color of the displayed waveforms.
1. Move the flashing cursor to
in the display
Col
item section.
2. Select a setting using the buttons.
NOTE
When the 8992 PRINTER UNIT is used to print a waveform, the three print
densities are used to represent the 6 selected waveform display colors.
Theprint densitysettinghas no effect for real-timeprinting.
(6) Analysis result magnification/compression
Magnify or compress the display of analysis results.
A magnified display allows detailed examination of
the results.
1. Move the flashing cursor to
item section.
2. Select a setting using the buttons.
LOG, x1/2, x1, x2, x5, x10, x20, x50, x100
List
OFF
Red/Green
Yellow/Light
Blue
Blue/Gray
Hides waveform.
Prints waveform at
standard print density.
Prints waveform in low
print density.
Prints waveform in high
print density.
Zoom
in the display
x1 xLOG
______________________________________________________________________________________________
6.2 Analysis Item Setting
Page 48

44
_____________________________________________________________________________________________
(7) Zero position
This item is used to set the zero position of an
analysis result.
1. Move the flashing cursor to
in the display
Posn
item section.
2. Select a setting using the buttons.
______________________________________________________________________________________________
6.2 Analysis Item Setting
Page 49

_____________________________________________________________________________________________
play
45
6.3 Cursor Operations
On the waveform screen, use cursors A and B to read measurement time and
analysis values.
1. Move the flashing cursor to the location indicated
in the diagram and select
buttons.
(You can also make this selection by
simultaneously pressing both right and left cursor
buttons.)
, using the
CSR
CSR
SCRL
To move cursors A and B
To scroll waveform
2. Move the flashing cursor to the location indicated
in the diagram and select the cursor type using
the buttons.
OFF
A
A-B
A-B Cursors A/B are used, and cursor B
A-B
Cursors A/B are not used.
Only cursor A is used.
Cursors A/B are used, and cursor A
moves.
moves.
Cursors A/B are used, and they move
simultaneously.
3. Move the flashing cursor to the location indicated
in the diagram. Using the buttons, select
the type of analysis result for which the cursor is
used.
W1 to W4
4. Move the cursor using the
SCROLL/CURSOR
button,
andreadanindication.
Use the buttons to move the cursor
quickly.
Value indicated by cursor
Value of A or B Value of B-A
t Time indicated by cursor position Time difference between cursors
v Analysis result read by cursor Difference of analysis results
between cursors
NOTE
______________________________________________________________________________________________
On the waveform screen, the scale for the analysis result for which the cursor is
used is indicated on the side of the screen.
When scrolling a waveform, cursors A and B move along with the waveform.
When the cursors A and B are used for different analyses, the (B-A) cursor value
is not dis
ed.
6.3 Cursor Operations
Page 50

46
_____________________________________________________________________________________________
6.4 Waveform Scrolling
The analysis result in the waveform screen can be scrolled horizontally.
Setting Screen DISP >>Waveform display
1. Move the flashing cursor to the location
indicated in the diagram and select
SCRL
the buttons.
(You can also make this selection by
simultaneously pressing both right and left cursor
buttons.)
using
NOTE
CSR
SCRL
2. Move the cursor using the
To move cursors A and B
To scroll waveform
SCROLL/CURSOR
and read an indication.
Use the buttons to move the cursor
quickly.
Auto scroll
When the
SCROLL/CURSOR
button is held pressed for
about five seconds, the waveform automatically
scrolls (
Auto scroll
indication appears on the
screen).
Press any button to cancel the auto scroll function.
The bar graph shown at the bottom of the screen indicates the location of the
displayed waveform along the total recording length.
Trigger point
Position of cursor A Position of cursor B
button
TA B
Display range
Total recording length (data in memory)
______________________________________________________________________________________________
6.4 Waveform Scrolling
Page 51

_____________________________________________________________________________________________
47
6.5 Input Setting in Waveform Display Screen
In the waveform display screen, you can select the contents of result display
Nos. W1 through W4.
1. Using the
2
3
1
4
5
6
7
8
the setting window for a selected result display
No.
(W1: CH1, W2: CH2, W3: CH3, W4: CH4)
(Example) To display the setting screen for result
display No. W2:
Press the
CH1,CH2,CH3,CH4
button.
CH2
2. Move the flashing cursor to
and select a result display No. from W1
No.
buttons, open
Display waveform
through W4 using the buttons.
3. Set the analysis item No., analysis item, analysis
channel, degree of analysis, display
magnification, and display position, as necessary.
1 Display waveform To select display waveform to be set
2 Waveform display color To select color of waveform to be displayed
3 Analysis item No. To select analysis item No.
4 Analysis item To select analysis item
5 Analysis channel To select input channel to be analyzed
6 Degree of analysis To select degree of harmonic wave to be analyzed
7 Display magnification To set magnification/compression rate of analysis
result display
8 Zero position To set zero position for analysis result.
4. Press the same button that was pressed in step 1 to close the setting
window.
______________________________________________________________________________________________
6.5 Input Setting in Waveform Display Screen
Page 52

48
y
_____________________________________________________________________________________________
6.6 Over-Range Check Function
When the input wave exceeds the set maximum input range during
measurement, this function lowers the range by one level to prevent input
overshoot in the next measurement.
When the auto range check function is activated during extended
measurement (time-series analysis), a symbol [OV] (OVER) is indicated at
the time at which the range switched.
Over-range indication
O
V
NOTE
______________________________________________________________________________________________
6.6 Over-Range Check Function
Note that data collected at the time indicated by "OV" will contain errors due to
input overshoot.
When the auto range check function is activated during measurement and
switches the range, the following warning message appears.
Warning 631: Range changed. (Out of range).
Note that the auto range check function only switches a range from a higher
sensitivit
level to a lower one.
Page 53

_____________________________________________________________________________________________
)
49
6.7 Analysis Example: Time-Series Analysis of 100-VAC SinglePhase 3-Wire Line
Described below is a method for performing time-series analysis of a 100VAC single-phase 3-wire line using the 8808-51.
In this example, a HIOKI 9018-10 CLAMP ON PROBE is used for current
measurement.
NOTE
(1) Power supply on
This equipment is designed to measure input voltage. To measure current, use a
clamp ammeter with a voltage output function. We recommend a HIOKI CLAMP
ON PROBE or CLAMP ON HiTESTER for current measurement.
If a clamp ammeter is used to take measurements, the accuracy of both the 880751/8808-51 and the clamp will affect measurement accuracy. Carefully check the
specifications of the CLAMP ON PROBES and select the most appropriate unit
for the specific application. (Refer to Section 10 "Characteristics of CLAMP ON
PROBES."
(2) Input connection
Turn on the power switch of the 8808-51.
Connect the 8808-51, as shown in the following diagram.
Source
1
N
2
L
H
CH1 CH2 CH3 CH4
L
H
8808-51
Load
To ensure that the phases of
measured current and the output
voltage match, check that the
current flow direction arrow
displayed on the clamp part points
toward the load.
Refer to P4 clamp on probe
connection method.
______________________________________________________________________________________________
6.7 Analysis Example: Time-Series Analysis of 100-VAC Single-Phase 3-Wire Line
Page 54

50
_____________________________________________________________________________________________
(3) Preparation for measurement
1. Using the
button, proceed
SET
to the screen in which settings
are to be made.
2. Using the cursor and
buttons, make the settings as
shown in the diagrams on the
left.
(4) Line connection & level check
NOTE
When a line connection & level check is executed, any measurement data currently
saved in the unit is deleted.
We recommend saving necessary data to a PC card before performing a line
connection & level check.
1. Move the flashing cursor to
(Connect check)
in
the channel screen (2/4).
2. Press the buttons to open the confirmation
window.
3. To start the line connection & level check:
Press the
START
button.
To cancel the line connection & level check:
Press the
STOP
button.
______________________________________________________________________________________________
6.7 Analysis Example: Time-Series Analysis of 100-VAC Single-Phase 3-Wire Line
Page 55

_____________________________________________________________________________________________
51
Line connection & level check start
The voltage range is automatically shifted to
prevent input overshoots. The following message is
displayed at the bottom of the screen.
"Range changed.(Out of range)."
1) After the line connection & level check, check
the window.
2) If the line connection check results in a "NG"
(no good) assessment:
Cause: Reverse probe connection
Remedy: Check the direction of the arrow on the
probe and correct the probe orientation. Restart
the line connection & level check.
Make sure that the check result shows "OK."
For details, refer to Section 4.6, "Line Connection
& Level Check."
(5) Measurement start
Press the
To start measurement: Press the
To cancel measurement: Press the
As soon as a trigger is tripped, the screen displays a waveform and printing
begins.
When the
message appears on the screen:
"STOP key to abort."
To abort measurement: Press the
measurement halts.)
(6) Measurement complete
When data for a period of two days is input, the LED goes out and
measurement stops.
(7) Other analyses
Simply changing the result display setting allows up to 20 analysis results to
be displayed on the screen and printed.
START
STOP
button to execute measurement. (Green LED lights.)
STOP
button.
button.
START
button is pressed during measurement, the following
STOP
button. (The LED goes out and
______________________________________________________________________________________________
6.7 Analysis Example: Time-Series Analysis of 100-VAC Single-Phase 3-Wire Line
Page 56

52
_____________________________________________________________________________________________
7. Triggers for Harmonic Wave Analysis Function
The following four triggers can be used with the harmonic wave analysis
function:
Manual trigger, external trigger, timer trigger, harmonic wave trigger
The following diagram illustrates the relationship among the four triggers.
A maximum of four conditions can be set for the harmonic wave trigger.
Manual trigger ON/OFF
External trigger ON/OFF
Timer trigger ON/OFF
Harmonic wave
trigger(*)
ON/OFF
OR
AND
(*) Four harmonic wave trigger sources are ORed together.
7.1 Basic Trigger Setting Items and Setting Methods
Described below are methods for setting triggers for the harmonic wave
analysis function.
(1) Trigger mode
This item is used to set whether to end recording
after one measurement or to continue recording.
1. Move the flashing cursor to
2. Select the setting using the buttons.
SING, REP
Trig Mode
Trigger
ON
.
(2) Pre-trigger
This selection is valid only in time-series analysis
mode.
It is used to set the number of divisions for the
signal to be recorded prior to a trigger.
1. Move the flashing cursor to
Pre-Trig
.
2. Select the setting using the buttons.
0, 5, 10 DIV
NOTE
______________________________________________________________________________________________
7.1 Basic Trigger Setting Items and Setting Methods
The pre-trigger function is disabled when the external trigger/timer trigger is
turned ON.
In the harmonic wave analysis function, a trigger can be accepted immediately
after starting. Thus, the pre-trigger portion of a recording may not be available in
some cases.
Page 57

_____________________________________________________________________________________________
53
(3) Manual trigger
This item is used to activate a trigger when the
button is pressed.
The manual trigger on standby is given priority over
all other trigger settings.
1. Move the flashing cursor to
Manual Trig
.
2. Select the setting using the buttons.
(4) Harmonic wave trigger
This is used to set the harmonic wave trigger.
(Refer to Section 7.2 "Harmonic Wave Trigger.")
(5) External trigger
OFF
ON
Manual trigger is not used.
Manual trigger is used.
This enables use of an external input as a trigger
source. (For detailed information, refer to Section
8.10 "External Trigger" in the operating manual for
the main unit.)
1. Move the flashing cursor to
Extended Trig...
on
the trigger screen (3/4).
2. Press the buttons to open the extended
trigger screen.
3. Move the flashing cursor to
Ext Trig
.
4. Select the setting using the buttons.
OFF
External trigger is not used.
ON
External trigger is used.
______________________________________________________________________________________________
7.1 Basic Trigger Setting Items and Setting Methods
Page 58

54
gg
_____________________________________________________________________________________________
(6) Timer trigger
This trigger is tripped for a fixed time interval from the set starting time to
the set ending time.
This function is used to make recordings at regular intervals.
1. Move the flashing cursor to
Extended Trig
on the
trigger screen (3/4) and press the buttons to
open the extended trigger screen.
2. Move the flashing cursor to
Timer Trig
.
3. Select the setting using the buttons.
OFF
ON
4. Move the flashing cursor to
Timer trigger is not used.
Timer trigger is used.
START
.
5. Set the starting time, using the buttons.
In the same way, set the ending time and the
time interval.
To set to the current time:
With the cursor on "START," press the button.
(The current time is read.)
NOTE
______________________________________________________________________________________________
7.1 Basic Trigger Setting Items and Setting Methods
Before setting the timer trigger, be sure to set the current time in the system
screen. (For information on time setting, refer to Section 10.5.1 "Time Setting" in
the operating manual for the main unit.)
Make sure the start/end times are set later than the time at which the START
button is pressed and measurement starts.
When using a single trigger mode, only one trigger that is tripped at the start time
is valid. In such cases, the time interval and end time become invalid (when only
the timer trigger function is turned On).
Note that the end time setting becomes valid in the following conditions.
1. When the recording length is set to "CONT."
2. When the end time comes before the data of the set recording length is
obtained.
To make recordings at regular intervals, set the trigger mode to "REPEAT" and
the harmonic wave tri
er to "OFF."
Page 59

_____________________________________________________________________________________________
55
7.2 Harmonic Wave Trigger
A trigger can be tripped during harmonic wave analysis according to
specified conditions.
Up to four conditions can be set as trigger sources.
(1) Harmonic wave trigger type setting
A maximum of four harmonic wave triggers can be
set in No. 1 through No. 4.
1. Move the flashing cursor to
trigger type
.
Harmonic wave
2. Select the setting using the buttons.
OFF
RMS
RATIO
T-RMS
THD-F
THD-R
POWER
P-RATIO
P-PHASE
Harmonic wave trigger is not used.
Rms value of harmonic wave component
of each degree
Content ratio of harmonic wave
component of each degree in fundamental
wave
Sum of rms values of all harmonic wave
components (overall rms value)
Percentage of all harmonic waves in
fundamental wave
Percentage of all harmonic waves in total
rms value
Active power value of harmonic wave
component of each degree
Active power content ratio of harmonic
wave component of each degree in active
power of fundamental wave
Phase angle of harmonic wave current of
each degree relative to voltage waveform
______________________________________________________________________________________________
7.2 Harmonic Wave Trigger
Page 60

56
_____________________________________________________________________________________________
(2) Trigger channel setting
This is used to set the channel to be applied with a
harmonic wave trigger.
1. Move the flashing cursor toCH.
2. Select the setting using the buttons.
(3) Harmonic wave degree setting
(4) Trigger level setting
CH1, CH2, CH3,
CH4
(CH3 and CH4 are available only
in the 8808-51.)
This item is used to set the degree of harmonic
wave analysis results to be triggered.
A selection can be made only when rms value,
content ratio, active power, power content ratio, and
power phase angle settings have been made.
1. Move the flashing cursor to
N.
2. Select the setting using the buttons.
1to40
This item is used to set the level of a selected
harmonic wave trigger.
1. Move the flashing cursor to
Level
.
2. Open the numeric input window using the
buttons.
3. Using the
SCROLL/CURSOR
button, move the
flashing cursor to a selected digit. Enter a value
using the buttons.
4. To confirm the setting:
Move the flashing cursor to
buttons or the
START
and press the
OK
button.
To cancel the setting:
Move the flashing cursor to
the buttons or the
STOP
CANCEL
button.
and press
NOTE
______________________________________________________________________________________________
7.2 Harmonic Wave Trigger
Level input is in scientific notation format, using "E."
Settings based on unit prefixes such as "m" ("mill") and "k" ("kilo") cannot be
used.
Page 61

_____________________________________________________________________________________________
57
(5) Trigger condition setting
This is used to set the conditions required to trip
the trigger set in steps (1) through (4).
In case of parameters other than power phase angle
1. Move the flashing cursor to
Hi-Lo
.
2. Select the setting using the buttons.
Trigger is tripped when the value is above the
trigger level.
Trigger is tripped when the value is below the
trigger level.
NOTE
In case of
1. Move the flashing cursor to
P-PHASE
IN/OUT
.
2. Select the setting using the buttons.
IN
OUT
The harmonic wave trigger is tripped according to the ORed result of the four
conditions that can be set.
In the harmonic wave analysis function, the external trigger and timer trigger are
ANDed with the harmonic wave trigger.
When either the external trigger or timer trigger is ON, the harmonic wave trigger
condition is checked against the input waveform acceding to those trigger
conditions.
Trigger is tripped when harmonic wave is
flowing in.
Trigger is tripped when harmonic wave is
flowing out.
______________________________________________________________________________________________
7.2 Harmonic Wave Trigger
Page 62

58
A
gg
gg
play
p
p
y
_____________________________________________________________________________________________
Theory behind harmonic wave trigger
In harmonic wave analysis, the harmonic wave trigger is not tripped in real
time because the trigger is based on a comparison of the results of FFT
calculations performed on the input waveform with the set conditions.
Note that a trigger is not tripped by unexpected phenomena that occur as
data is being processed, as shown below.
er is not tripped
ctual harmonic wave
content ratio waveform
Tri
er level
Tri
Trigger is tripped
Calculation
...
Trigger level
Waveform dis
Display
Waveform input
ed on equipment
Calculation
Display
Waveform input
Calculation
Display
Waveform input
::Sam
: Data
: Data stored in memor
lingpoint
rocessingtime
Calculation
Display
______________________________________________________________________________________________
7.2 Harmonic Wave Trigger
Page 63

_____________________________________________________________________________________________
p
)
59
8. Printer Operations
Recording types and analysis modes
Analysis mode
Recording method
Manual print
Partial print x
Auto print
Screen copy
z
:Possible/ x:Not possible
NOTE
The printer cant be used when the main unit is running on alkaline batteries.
To use the printer, use the 9418-10 AC ADAPTER or 9447 BATTERY PACK.
In manual print, real time print, and partial print, the list and gauge can be
printed with the waveform. (Refer to Section 11.2.3 "List & Gauge" in the
o
eratingmanual for the main unit.
8.1 Recording on Printer
(1) Manual print
In instantaneous analysis mode, this setting prints the results of analysis of
data obtained in one measurement.
In time-series analysis mode, this setting prints a maximum of 60 divisions
of analysis results stored in memory.
Since measurement data is saved to memory, it can be reprinted as many
times as required.
Instantaneous
analysis mode
Time-series
analysis mode
z z
z
z z
z z
After measurement, pressing
NOTE
______________________________________________________________________________________________
In instantaneous analysis mode, manual printing performs the following
operations:
Waveform display screen: Displayed waveform data is printed.
Gauge & list and comment setting become valid. (*1)
Displayed cursors A and B are printed.
Numeric screen: Numerical data is printed.
Graph screen: Displayed graph data is printed.
Gauge & list and comment setting become valid. (*1)
Displayed cursors are printed.
(*1) (For detailed information, refer to Section 11.2.3 "List & Gauge" and Section
11.3 "Comment Screen Setting" in the operating manual for the main unit.)
Press the FEED button to feed the recording, except during measurement.
When the waveform is magnified or compressed in the time-series analysis mode,
the printing reflects that setting.
Partialprintingoccurs if cursors A and B are used in time-series analysis mode.
PRINT
button prints measurement results.
8.1 Recording on Printer
Page 64

60
_____________________________________________________________________________________________
(2) Auto print (instantaneous analysis mode)
This function automatically prints the input
waveform as soon as it is displayed on the screen.
1. Move the flashing cursor to
Auto Print
.
2. Select the setting using the buttons.
OFF
ON
(3) Real-time printing (time-series analysis mode)
This function prints in real time as measurement
data is input.
1. Move the flashing cursor to
2. Select the setting using the buttons.
OFF
ON
(4) Partial print (time-series analysis mode)
When cursors A and B are used, this function prints the section between the
two cursors.
A partial print can be produced even if either cursor A or B lies at a
position off screen.
This function can be used when the print type is set to "Wave" or
"Logging."
When only cursor A is used, the waveform data from the time indicated by
the cursor is printed.
To use cursors A and B, refer to Section 6.3 "Cursor Operations" in the
operating manual for the main unit.
Disables the auto print function.
Enables the auto print function.
Printer
Disables the real-time print function.
Enables the real-time print function.
.
1. Move cursors A and B to the start and end
points.
(Either cursor may be positioned at either point.)
2. Press the
NOTE
______________________________________________________________________________________________
8.1 Recording on Printer
When the analysis result is magnified, the printed document also reflects the
magnification setting.
PRINT
button.
Page 65

_____________________________________________________________________________________________
61
(5) Screen copy
You can print any images displayed on the LCD, including waveforms,
status information, trigger, and system screens.
1. Display the screen to be printed.
2. Press the
COPY
button.
(6)Reportprinting
This function is used to print the waveform, upper and lower limit values,
and analog channel settings displayed on the waveform display screen.
When cursors A and B and the comment displayed on the screen are set,
comments are also printed.
1. Display the waveform display screen.
2. Press the
FEED
and
COPY
buttons simultaneously. (Press the
FEED
button first.)
In the numeric screen for instantaneous analysis mode, the report printing
function prints the results or execution performed on the graph screen.
______________________________________________________________________________________________
8.1 Recording on Printer
Page 66

62
_____________________________________________________________________________________________
9. PC Card
9.1 Input of File Name
Described below is a method for entering a file name for auto save.
Comment
input box
1. Move the flashing cursor to
File Name
2. Press the buttons to open the file name
input window.
3. In the character selection section in the file name
input window, select a character using the cursor
button. Press the buttons to confirm input.
4. After entering the comment, press the
button to confirm input. (The file name input
window is closed.)
.
START
Character
selection
section
Virtual
function
button
section
(1) Operation on comment input section (available in the comment input screen)
Backspace
Cursor operations
Moves the cursor to the beginning of
the comment input box.
Moves the cursor one character
position to the right or left.
SCROLL/CURSOR
Moves the cursor to the end of the
comment input box.
(2) Operation on character selection section (available in the comment input screen)
Cursor operation Comment input confirm
Character input confirm Comment input cancel
START
STOP
______________________________________________________________________________________________
9.1 Input of File Name
Page 67

_____________________________________________________________________________________________
63
(3) Using the virtual function buttons
Move the flashing cursor to the virtual function
buttons and press the buttons to confirm the
selection.
9.2 Text File Internal Format
A text file contains a header and data.
The header provides the following information for measurement data.
INS/OVER
DEL
BS
<< >>
A
CANCEL
OK
Switches between Insert and Overwrite.
Deletes the character indicated by the
flashing cursor.
Backspace
Shifts the input position to the right or
left.
Alphanumeric character
Cancels comment input screen.
Confirms comment input.
The virtual function buttons have the same
functions as the corresponding function buttons.
COMMENT General waveform comment
DATE Measurement date (month/day/year)
TIME Trigger time (hours:minutes:seconds)
NUM_SIGS Number of data types (including time-axis data)
INTERVAL Data interval (= time-axis range/80)
HORZ_UNITS Unit of time axis (S = seconds)
VERT_UNITS Units of data (including time-axis data)
SIGNAL Name of data
DATA Indicates the end of the header; measurement data follows.
______________________________________________________________________________________________
9.2 Text File Internal Format
Page 68

64
_____________________________________________________________________________________________
9.3 Examples of Stored Files
(1) Data stored in the waveform screen in instantaneous analysis
"HARMONICS(INSTANT)"
"Trig.Time","Fund.Freq."
"01-05-31 15:27:49","60.0Hz"
"PHASE(CH1&2)","VALUE(CH1)","VALUE(CH2)","PHASE(CH3&4)","VALUE(CH3)","VAL
UE(CH4)"
"゚", "V ", "A ","゚", "V ", "A "
+0.0000E+00,+1.2500E-01,+4.0625E+00,+0.0000E+00,+2.5000E-01,+3.1250E-02
+5.3973E-02,+2.5000E-01,+4.0625E+00,+5.8499E-02,+2.5000E-01,+3.1250E-02
+1.0795E-01,+3.7500E-01,+4.0625E+00,+1.1700E-01,+2.5000E-01,+3.1250E-02
+1.6192E-01,+5.0000E-01,+4.0469E+00,+1.7550E-01,+2.5000E-01,+3.1250E-02
+2.1589E-01,+6.2500E-01,+4.0469E+00,+2.3399E-01,+2.5000E-01,+3.1250E-02
+2.6987E-01,+7.5000E-01,+4.0469E+00,+2.9249E-01,+2.5000E-01,+3.1250E-02
+3.2384E-01,+8.7500E-01,+4.0469E+00,+3.5099E-01,+2.5000E-01,+3.1250E-02
+3.7781E-01,+1.0000E+00,+4.0469E+00,+4.0949E-01,+2.5000E-01,+3.1250E-02
+4.3178E-01,+1.1250E+00,+4.0469E+00,+4.6799E-01,+2.5000E-01,+3.1250E-02
+4.8576E-01,+1.2500E+00,+4.0625E+00,+5.2649E-01,+2.5000E-01,+3.1250E-02
+5.3973E-01,+1.5000E+00,+4.0469E+00,+5.8499E-01,+2.5000E-01,+3.1250E-02
+5.9370E-01,+1.6250E+00,+4.0625E+00,+6.4348E-01,+2.5000E-01,+3.1250E-02
+6.4768E-01,+1.7500E+00,+4.0469E+00,+7.0198E-01,+2.5000E-01,+3.1250E-02
+7.0165E-01,+1.8750E+00,+4.0625E+00,+7.6048E-01,+2.5000E-01,+3.1250E-02
(2) Data stored in the rms value/content ratio/phase angle screen in
instantaneous analysis
"HARMONICS(INSTANT)"
"Trig.Time","Fund.Freq."
"01-05-31 15:27:49","60.0Hz"
"T-RMS(CH1)","THD-F(CH1)","THD-R(CH1)","T-RMS(CH2)","THD-F(CH2)","THDR(CH2)","T-RMS(CH3)","THD-F(CH3)","THD-R(CH3)","T-RMS(CH4)","THDF(CH4)","THD-R(CH4)"
"V","%","%","A","%","%","V","%","%","A","%","%"
+1.0293E+02,+4.6666E+00,+4.6615E+00,+2.9717E+00,+7.7376E+00,+7.7146E+00,+6.5
895E-03,+1.0710E+03,+9.9567E+01,+2.6618E-02,+2.2863E+01,+2.2288E+01
"N","RMS(CH1)","RATIO(CH1)","PHASE(CH1)","RMS(CH2)","RATIO(CH2)","PHASE(CH2
)","RMS(CH3)","RATIO(CH3)","PHASE(CH3)","RMS(CH4)","RATIO(CH4)","PHASE(CH4)"
"","V","%","゚","A","%","゚","V","%","゚","A","%","゚"
1,+1.0282E+02,+1.0000E+02,-4.6973E08,+2.9628E+00,+1.0000E+02,+0.0000E+00,+6.1258E04,+1.0000E+02,+0.0000E+00,+2.5949E-02,+1.0000E+02,+0.0000E+00
2,+5.9404E-02,+5.7775E-02,+7.6835E+01,+1.1931E-01,+4.0268E+00,-
1.5367E+02,+9.8334E-04,+1.6052E+02,-6.1345E+00,+9.6758E04,+3.7288E+00,+8.1774E+01
3,+3.5094E+00,+3.4132E+00,+4.3359E+01,+1.0508E01,+3.5466E+00,+7.8675E+01,+6.8968E-04,+1.1259E+02,-8.4088E-01,+2.2887E03,+8.8201E+00,-1.3350E+02
4,+2.2965E-02,+2.2336E-02,-1.7230E+01,+8.6278E-02,+2.9120E+00,-
4.8757E+01,+3.4679E-04,+5.6612E+01,-1.4347E+02,+2.3760E-03,+9.1565E+00,-
5.4695E+01
______________________________________________________________________________________________
9.3 Examples of Stored Files
Page 69

_____________________________________________________________________________________________
65
(3) Data stored in the active power/power content ratio/power phase angle
screen in instantaneous analysis
"HARMONICS(INSTANT)"
"Trig.Time","Fund.Freq."
"01-05-31 15:27:49","60.0Hz"
"T-WATT1","T-VA1","T-var1","P-PHASE1","T-WATT2","T-VA2","T-var2","P-PHASE2"
"W","VA","var","","W","VA","var",""
-6.7137E+01,+3.0587E+02,-2.9707E+02,-2.1949E-01,+1.5441E-05,+1.7540E-04,-
7.2594E-06,-8.8034E-02
"N","WATT1","RATIO1","PHASE1","WATT2","RATIO2","PHASE2"
"","W","%","゚","W","%","゚"
1,-6.7363E+01,+1.0000E+02,+1.0278E+02,+1.5840E-05,+1.0000E+02,+4.7795E+00
2,+6.4257E-03,-9.5390E-03,-2.4951E+01,-1.2366E-07,-7.8064E-01,+9.7468E+01
3,+3.5383E-01,-5.2526E-01,-1.6358E+01,-7.4887E-07,-4.7276E+00,-1.1832E+02
4,+1.8669E-03,-2.7714E-03,+1.9575E+01,-2.5310E-07,-1.5978E+00,+1.0789E+02
5,-1.2927E-01,+1.9189E-01,+1.3167E+02,+4.1097E-07,+2.5945E+00,+8.3283E+01
6,+9.2634E-04,-1.3752E-03,-4.9776E+01,+4.8823E-08,+3.0822E-01,+7.9100E+01
7,+4.5029E-04,-6.6846E-04,-8.9522E+01,-8.3018E-07,-5.2409E+00,-1.4679E+02
8,-4.7267E-04,+7.0168E-04,+1.2438E+02,-9.0838E-07,-5.7346E+00,+1.4041E+02
9,-8.4780E-03,+1.2586E-02,+1.1160E+02,-1.5138E-07,-9.5564E-01,+1.0926E+02
10,-3.6396E-04,+5.4030E-04,+1.3734E+02,+2.3539E-06,+1.4860E+01,-1.5203E+00
11,+1.2904E-03,-1.9156E-03,-8.5958E+01,+2.8652E-07,+1.8088E+00,-4.8524E+01
12,+4.6008E-04,-6.8299E-04,+4.5474E+01,+9.2022E-09,+5.8094E-02,-8.9004E+01
13,+3.5138E-03,-5.2162E-03,+3.9547E+00,+3.2622E-07,+2.0594E+00,+6.9989E+01
14,+1.0265E-05,-1.5238E-05,+8.7235E+01,+2.6686E-07,+1.6847E+00,+4.7870E+01
15,-7.7404E-03,+1.1491E-02,-1.5896E+02,-1.3739E-07,-8.6733E-01,-1.1589E+02
16,+1.8826E-04,-2.7947E-04,+6.7600E+01,-1.8437E-06,-1.1639E+01,+1.7624E+02
17,+5.4396E-03,-8.0751E-03,+1.3493E+00,-8.5045E-07,-5.3689E+00,-1.5486E+02
18,+1.7781E-04,-2.6396E-04,-3.7154E+01,-1.9816E-07,-1.2510E+00,-1.6349E+02
19,-3.6645E-03,+5.4400E-03,-1.7803E+02,+7.5790E-07,+4.7847E+00,-1.1222E+01
20,+1.7362E-04,-2.5774E-04,+5.1104E+01,+1.5069E-08,+9.5133E-02,+8.8137E+01
(4) Data stored in time-series analysis
"HARMONICS(SERIES)"
"Trig.Time","Fund.Freq."
"01-05-31 15:29:36","60.0Hz"
"TIME","RMS(CH1:3)","RMS(CH1:5)","RMS(CH1:7)","T-RMS(CH1)","THD-F(CH1)","THDR(CH2)","POWER(CH1&2:1)","POWER(CH1&2:3)","POWER(CH1&2:5)","POWER(CH1&2:7
)","P-PHASE(CH1&2:3)","P-PHASE(CH1&2:5)","WATT(CH1&2)","PFACTOR(CH1&2)","RMS(CH2:3)","RMS(CH2:5)","RMS(CH3:3)","RMS(CH3:5)","RMS(CH4:3
)","RMS(CH4:5)"
"","V ","V ","V ","V ","% ","% ","W ","W ","W ","W ","","","W ","","A ","A ","V ","V
","A ","A "
"05-31
15:29:36",+3.4962E+00,+2.8201E+00,+1.1647E+00,+1.0264E+02,+4.6530E+00,+8.3525E+
00,-8.4901E+01,+3.8530E-01,-1.3868E-01,-5.1588E-03,-9.9817E+01,+7.9562E+01,-
8.4656E+01,-2.7657E-01,+1.1505E-01,+7.3934E-02,+1.1520E-03,+5.8818E-04,+4.0671E03,+1.1578E-03
"05-31
15:29:40",+3.5346E+00,+2.8267E+00,+1.1337E+00,+1.0302E+02,+4.6614E+00,+7.6556E+
00,-6.5415E+01,+3.5228E-01,-1.2810E-01,-2.4775E-03,-9.2103E+01,+4.6371E+01,-
6.5192E+01,-2.1310E-01,+1.0356E-01,+6.7887E-02,+1.2029E-03,+1.1705E-03,+3.0821E03,+2.9360E-03
"05-31 15:29:44",+3.4455E+00,+2.7576E+00,+9.5788E01,+1.0260E+02,+4.5220E+00,+8.3553E+00,-8.4428E+01,+3.8355E-01,-1.3524E-01,-
6.1030E-03,-1.1616E+02,-1.6450E+01,-8.4199E+01,-2.7497E-01,+1.1607E-01,+7.3884E02,+6.4585E-04,+1.7302E-03,+2.0581E-03,+2.7778E-03
"05-31
15:29:48",+3.5862E+00,+2.7790E+00,+1.1154E+00,+1.0264E+02,+4.6774E+00,+8.3393E+
00,-8.4258E+01,+4.0026E-01,-1.3597E-01,-6.1505E-03,-1.0172E+02,-1.4560E+02,-
8.3998E+01,-2.7448E-01,+1.1540E-01,+7.3301E-02,+9.0558E-04,+1.3632E-03,+3.0954E03,+2.9101E-03
"05-31
15:29:51",+3.6175E+00,+2.8012E+00,+1.1725E+00,+1.0300E+02,+4.7199E+00,+7.8889E+
00,-7.6877E+01,+3.7357E-01,-1.3122E-01,+2.6234E-04,-9.5468E+01,+2.0064E+01,-
7.6627E+01,-2.5025E-01,+1.0702E-01,+7.0269E-02,+5.4344E-04,+9.4710E-04,+2.7862E03,+4.0655E-03
______________________________________________________________________________________________
9.3 Examples of Stored Files
Page 70

66
_____________________________________________________________________________________________
10. Characteristics of CLAMP ON PROBES (Reference
Information)
When a CLAMP ON PROBE is used to make measurements, the accuracy
of both the CLAMP ON PROBE and the 8807-51/8808-51 will affect
measurement accuracy.
In measurements of the direction of a harmonic wave, current value, or other
values, the phase characteristics of the CLAMP ON PROBE significantly
affect the measured values. Carefully check the specifications of the
CLAMP ON PROBE and select the most appropriate unit for the specific
measurement application.
The characteristics of HIOKI CLAMP ON PROBES are given below.
9018-10 CLAMP ON PROBE
Measurement range: 10, 20, 50, 100, 500 AAC
Accuracy: 1.5% rdg. 0.1% f.s (23 5 ,at45to66Hz)
Frequency characteristics: within 1% (at 40 Hz to 3 kHz, deviation from
accuracy)
Phase characteristics: within 2.5 (at 40 Hz to 3 kHz)
)
%
(
n
o
i
t
a
i
v
e
D
)
.
g
e
d
(
e
s
a
h
P
1.5
1.0
0.5
0.0
-0.5
-1.0
-1.5
10 100 1000 Frequency (Hz)
Frequency characteristics (reference data)
3.0
2.0
10 A
1.0
0.0
20 A
50, 100, 200, 500 A
-1.0
-2.0
-3.0
10 100 1000 Frequency (Hz)
Phase characteristics (reference data)
______________________________________________________________________________________________
Page 71

_____________________________________________________________________________________________
67
9132-10 CLAMP ON PROBE
Measurement range: 20, 50, 100, 500, 1000 AAC
Accuracy: 3% rdg., 0.5 mV
Frequency characteristics: within 1% at 40 to 1000 Hz (deviation from 55
Hz)
)
+3
%
(
n
o
+2
i
t
a
i
v
+1
e
D
0
-1
-2
-3
40 50 100 1000 Frequency (Hz)
Frequency characteristics (reference data)
Basedon50Hz
100,200,500 A
50,1000 A
20-A range
)
.
6
5
4
3
50, 100 A
2
200, 500 A
1
0
1000 A
20 A
40 50 100 1000 Frequency (Hz)
Phase characteristics (reference data)
g
e
d
(
e
s
a
h
P
-1
-2
______________________________________________________________________________________________
Page 72

68
_____________________________________________________________________________________________
______________________________________________________________________________________________
Page 73

_____________________________________________________________________________________________
INDEX 1
Index
-A-
Active power 19,41
Analog input channel
Analysis channel
Analysis example (instantaneous)
Analysis example (time-series)
Analysis mode
Analysis result display
Analysis type
Apparent power
Auto print
Auto save
Average processing
23,25,42,47
5,6
28-34
49-51
21,35
23,24
23,24,41
19,41
22,60
22,37
36
-C-
Characteristics of clamp-on probes 66-67
Compression
Content ratio
Conversion rate
CT
Cursor (instantaneous)
Cursor (series)
25,39,43
16,23-24,41
9,10
26,27
45
-H-
Harmonic wave degree 56
Harmonic wave trigger
Harmonic wave trigger type
55
55-58
-I-
Input type 6,27
Input waveform
Internal format
15
63
-L-
Line connection & level check 11,29,34,50
-M-
Magnification 25,39,43
Manual print
Manual trigger
9
Measurement target
Multi-screen
59
53
3
21
-O-
-D-
Over-range check function 2,48
degree of analysis 26,42,47
Display method
DMM
-E-
External trigger 53
-F-
File name 22,37,62
Frequency
Function
______________________________________________________________________________________________
23,24
13-14
21,35
-P-
PC card 62
PT
Partial print
Phase angle
Power content ratio
Power factor
Power phase angle
Pre-trigger
Print channel
3
Printer
16,23-24,31,41,55
17,23,24,41,55
8,9
60
19,41
18
52
22
39,59
Index
Page 74

INDEX 2
_____________________________________________________________________________________________
Printing interval 38
Printing type
38
-Z-
-R-
Reactive power 19,41
Real-time printing
Recording length
Report printing
Rms value
15,23,24,41,55
43,60
36
61
-S-
Scaling 8-10
Screen copy
Scroll
Single-phase 2-wire
Single-phase 3-wire
14,61
46
-T-
Zero position 44,47
3
3
3-phase 3-wire 3
Theory behind harmonic wave trigger
Time-axis range
Timer trigger
Total distortion-F
Total distortion-R
Total rms value
Trigger channel
Trigger condition
Trigger level
Trigger mode
58
36
54
19,41
19,41
19,41,55
56
57
56
52
-V-
Vertical axis range 7,27
-W-
Waveform display color 5,27,43,47
Waveform display range
______________________________________________________________________________________________
Index
26,40
Page 75

HIOKI 8807-51/ 8808-51
HARMONIC WAVE ANALYSIS FUNCTION
Instruction Manual
Publication date: June 2004 Revised edition 1
Edited and published by HIOKI E.E. CORPORATION
Technical Support Section
All inquiries to International Sales and Marketing Department
81 Koizumi, Ueda, Nagano, 386-1192, Japan
TEL: +81-268-28-0562 / FAX: +81-268-28-0568
E-mail: os-com@hioki.co.jp
URL http://www.hioki.co.jp/
Printed in Japan 8807C981-01
All reasonable care has been taken in the production of this manual, but if you
find any points which are unclear or in error, please contact your supplier or
the International Sales and Marketing Department at HIOKI headquarters.
In the interests of product development, the contents of this manual are subject
to revision without prior notice.
Unauthorized reproduction or copying of this manual is prohibited.
Page 76

HEAD OFFICE
81 Koizumi, Ueda, Nagano 386-1192, Japan
TEL +81-268-28-0562 / FAX +81-268-28-0568
E-mail: os-com@hioki.co.jp
HIOKI USA CORPORATION
6 Corporate Drive, Cranbury, NJ 08512, USA
TEL +1-609-409-9109 / FAX +1-609-409-9108
8807C981-01 04-06H
Printed on recycled paper
 Loading...