

Page 1

Instruction Manual
8807-01
8808-01
8807-51
8808-51
MEMORY HiCORDER
January 2009 Revised edition 10 8807A981-10 09-01H
Page 2

Page 3

Contents
Introduction i
Inspection i
Safety Notes
iv
Notes on Use viii
Chapter Summary xii
Chapter 1 Product Overview 1
1.1 Major Features 1
1.2 Identification of Controls and Indicators
Chapter 2 Installation and Preparation 7
2.1 Installation of the Product 7
2.2 Power Supply and Ground Connection 8
2.2.1 Connecting the AC Adapter 8
2.2.2 Installing the Batteries/Battery Pack
2.3 Power On/Off 11
2.4 Connecting the Connection Cord 12
2.5 Connecting the 9322 DIFFERENTIAL
PROBE 13
2.6 Connecting the Logic Probe
2.7 Connecting the 9018-10, 9132-10 CLAMP
ON PROBE
2.8 Connecting the 8992 PRINTER UNIT
2.8.1 Loading Recoding Paper 19
2.8.2 Care of Recording Paper
2.9 Attaching the Strap 22
2.10 Notes on Measurement 23
16
17
18
21
3
9
Page 4

Chapter 3 Basic Button Operation 25
3.1 Screen Display Buttons 26
3.2 Printer Buttons
26
3.3 Item Setting Buttons 27
3.4 Waveform Scrolling Buttons
27
3.5 Input Operation 28
3.6 Measurement Start and Stop
29
3.7 Other Buttons Operation 29
3.8 Key Lock Function
3.9 Changing the Screen
30
31
Chapter 4 Memory Recorder Function 33
4.1 Overview of the Memory Recorder Function 33
4.2 Operation Sequence (MEM)
4.3 Setting Items 36
4.3.1 Setting the Function Mode 36
4.3.2 Setting the Time Axis Range
4.3.3 Setting the Recording Length
4.3.4 Setting the Display Layout
4.3.5 Setting the Auto Save Function
4.3.6 Setting the Print Mode
4.3.7 Setting the Auto Print Function
4.4 Using the X-Y Waveform Plots (MEM) 47
4.5 Waveform Screen Settings (MEM) 49
4.6 Auto Range Function
4.7 Start and Stop Operation (MEM) 51
4.8 Extended Status Screen Setup (MEM)
4.8.1 Channel Usage Settings 53
4.8.2 Setting the Roll Mode
4.8.3 Sequential Save Function
4.9 Numerical Calculation (Measurement) 64
34
37
38
40
42
45
46
50
52
54
55
Page 5

Chapter 5 Recorder Function 71
5.1 Overview of the Recorder Function 71
5.2 Operation Sequence (REC)
72
5.3 Setting Items 74
5.3.1 Setting the Function Mode 74
5.3.2 Setting the Time Axis Range
5.3.3 Setting the Recording Length
5.3.4 Setting the Display Layout
5.3.5 Setting the Auto Save Function
5.3.6 Setting the Print Mode
5.3.7 Setting the Printer Function
(Real Time Printing)
5.3.8 Setting the Display Clear Function
(X-Y only)
75
76
78
80
83
84
85
5.4 Using the X-Y CONT Recorder 86
5.5 Waveform Screen Settings (REC) 88
5.6 Start and Stop Operation (REC)
89
Chapter 6 RMS Recorder Function 91
6.1 Overview of the RMS Recorder Function 91
6.2 Operation Sequence (RMS) 92
6.3 Setting Items
6.3.1 Setting the Function Mode 94
6.3.2 Setting the Time Axis Range
6.3.3 Setting the Recording Length
6.3.4 Setting the Frequency
6.3.5 Setting the Display Layout
6.3.6 Setting the Auto Save Function
6.3.7 Setting the Print Mode
6.3.8 Setting the Printer Function (Real Time
Printing)
6.3.9 Instantaneous Waveform Recording
6.4 Waveform Screen Settings (RMS) 111
6.5 Settings on the Channel Screen (RMS) 112
94
95
96
98
99
101
104
105
106
Page 6

6.5.1 Selecting the Recorder Function or RMS
Function 112
6.6 Start and Stop Operation (RMS) 113
Chapter 7 Input Channel Settings 115
7.1 Overview 115
7.2 Operation Sequence (Input Channel
Setting)
7.3 Setting the Channel Screen
7.3.1 Setting the Waveform Display Color 118
7.3.2 Setting the Waveform Display Graph
7.3.3 Setting the Voltage Axis Range
7.3.4 Setting the Input Coupling
7.3.5 Setting the Magnification/Compression
Ratio Along the Voltage Axis
7.3.6 Setting the Zero Position
7.3.7 Setting the Low-Pass Filter
7.3.8 Setting the Logic Inputs
116
118
119
120
121
123
124
126
127
7.4 Waveform Screen Input Settings 129
7.5 Scaling Function 130
Chapter 8 Trigger Functions 137
8.1 Overview of the Trigger Function 137
8.2 Operation Sequence (Trigger mode setting)
138
8.3 Trigger Mode 140
8.4 Pre-trigger
141
8.5 Trigger Timing (REC only) 143
8.6 Trigger Source AND/OR Linking
144
8.7 Manual Trigger 145
8.8 Internal Trigger
8.8.1 Level Trigger 147
8.8.2 Window-In Trigger
8.8.3 Window-Out Trigger
8.8.4 Voltage Drop Trigger
8.8.5 Waveform Detection Trigger
(Memory Only)
146
150
152
154
156
Page 7

8.8.6 Logic Trigger 160
8.8.7 Trigger Settings from the Waveform
Screen
163
8.9 Timer Trigger Function 164
8.10 External Trigger Function
166
8.11 Trigger Output Terminal 168
8.12 Input Level Monitor Function
170
Chapter 9 Waveform Screen Operation 171
9.1 Using the A/B Cursors 172
9.1.1 Using the Line Cursors (Vertical) 174
9.1.2 Using the Line Cursors (Horizontal)
9.1.3 Using the Trace Cursors
9.1.4 Using the Cursors on the X-Y Screen
175
176
177
9.2 Scrolling the Waveform 178
9.3 Magnification /co mpr e ssion Rat io Along the
Time Axis 179
9.4 DMM Function
180
9.5 Setting the Waveform Display Area 183
Chapter 10 System Settings 185
10.1 Environment Screen (SYSTEM) 186
10.1.1 START Button Activation 186
10.1.2 Start Backup
10.1.3 Grid Type
10.1.4 Time Value
10.1.5 Logic Recording Width
10.1.6 Backlight Saver
10.1.7 Backlight Brightness
10.1.8 Display Color
10.1.9 Language
10.1.10 Printer
187
188
189
190
191
192
193
194
195
10.2 Comment Screen (SYSTEM) 196
10.3 RS© Screen (SYSTEM) 197
10.3.1 Screen Copy Output Destination 197
10.3.2 RS-232C Settings
199
Page 8

10.4 Setting Screen 200
10.5 Initialize Screen 202
10.5.1 Setting the Clock 202
10.5.2 Clearing the Waveform Data
10.5.3 System Reset
10.5.4 Self-check
203
204
205
Chapter 11 Printout of Measurement Data 207
11.1 Printout of Measurement Data Operating
Procedure
11.2 Environment Screen (Printer)
11.2.1 Grid Type 210
11.2.2 Time Value
11.2.3 List&Gauge
11.2.4 Channel Marker
11.2.5 Printer Density
11.3 Comment Screen (Printer) 215
11.3.1 Title Comment Entry 215
11.3.2 Analog and Logic Comment Entry
11.3.3 Text Entry Procedure
11.4 Setting the Status Screen (printout) 223
11.5 Setting the Channel Screen (printout)
11.6 Printing Procedure 225
11.6.1 Manual Print 225
11.6.2 Auto Print (MEM)
11.6.3 Real Time Print (REC, RMS)
11.6.4 Partial Print
11.6.5 Screen Copy
11.6.6 List Print
11.6.7 Report Print
11.7 Example of Printer Output 231
208
210
211
212
213
214
217
220
224
226
227
228
229
229
230
Chapter 12 Storing the Measurement Data 235
12.1 PC Card 236
12.2 Using the PC Card Slot 238
Page 9

12.3 Settings on the File Screen 240
12.3.1 Loading the Data 240
12.3.2 Saving Measurement and Setting Data
12.3.3 Deleting the Files and Directories
12.3.4 Creating the Directory
12.3.5 Initializing
12.3.6 Changing the Names of Fi les and
Directories
243
251
253
256
257
12.4 Settings on the File Configuration Screen
(Application Functions)
12.4.1 Sorting Files 259
12.4.2 Self-check
259
261
12.5 Text File Internal Format 262
Chapter 13 Communication Function 265
13.1 Connecting the RS-232C Cable 266
13.2 Setting the RS-232C Interface 267
Chapter 14 Specifications 269
14.1 General Specifications 269
14.2 Trigger
14.2.1 Harmonic Wave Trigger 274
14.3 Memory Recorder Function 275
14.4 Recorder Function
14.5 RMS Recorder Function 277
14.6 Harmonic Wave Analysis Function
14.6.1 General Specifications 278
14.6.2 Instantaneous Analysis Functions
14.6.3 Time Series Analysis Functions
14.6.4 Additional Functions
14.7 Communication Function 283
14.8 Others
273
276
278
279
280
282
284
Chapter 15 Logic and Analog Inputs 287
15.1 Logic Inputs 287
Page 10

15.2 Analog Inputs 290
Chapter 16 Maintenance and Service 293
16.1 Changing the Battery 293
16.2 9447 BATTERY PACK 295
16.2.1 Battery Charging with the MEMORY
16.2.2 Battery Charging with the 9643
HiCORDER 296
CHARGE STAND
297
16.3 Removing the Battery Before Discarding
the Product
16.4 Cleaning the Printer Head
298
299
16.5 Troubleshooting 300
16.6 Cleaning of the Product
302
Appendix APPENDIX 1
Appendix 1 Messages APPENDIX 1
Appendix 2 Reference APP ENDIX 4
Appendix 3 WaveViewer (Wv)
Appendix 3.1 Starting the Waveform
Viewer APPENDIX 11
Appendix 3.2 Waveform Viewer
Menus
Appendix 3.3 Using the Waveform
Viewer
Appendix 3.4 Conversion to CSV
Format
Appendix 3.5 Converting Multiple Waveform Files
into CSV Files
APPENDIX 10
APPENDIX 12
APPENDIX 14
APPENDIX 18
APPENDIX 20
Index INDEX 1
Page 11

_____________________________________________________________________
Introduction
Thank you for purchasing the HIOKI "8807-01, 8808-01,
8807-51, 8808-51 MEMORY HiCORDER." To obtain
maximum performance from the product, please read this
manual first, and keep it handy for future reference.
Inspection
When you receive the product, inspect it carefully to ensure
that no damage occurred during sh ipping. In particular,
check the panel switches, and connectors. If damage is
evident, or if it fails to operate according to the
specifications, contact your dealer or Hioki representative.
Accessories
i
Instruction Manual
Measurement Guide
Application Disk (CD)
LR6 alkaline batteries
Alkaline battery box
Strap
NOTE
______________________________________________________________
The connector cable is not included with the product.
Use optional 9197, 9198, or 9217 CONNECTION CORD.
Maximum input voltage:
9197: 500 V AC/DC
9198: 300 V AC/DC
9217: 300 V AC/DC
1
1
1
6
1
1
Inspection
Page 12

ii
_____________________________________________________________________
Options
9418-15 AC ADAPTER
(SA145 A-1240V- 6, SI NO AM ERI CAN )
(universal 100 to 240 V AC, 12 V DC output)
9197 CONNECTION CORD
(maximum input voltage: 500 V AC/DC)
9198 CONNECTION CORD
(maximum input voltage: 300 V AC/DC)
9199 CONVERSION ADAPTOR (BNC-Banana female)
9217 CONNECTION CORD (BNC-BNC)
(maximum input voltage: 300 V AC/DC)
9322 DIFFERENTIAL PROBE
(maximum input voltage: CAT ll: 1000 V AC, 2000 V
DC, CAT lll:600VAC/DC)
9234 RECORDING PAPER (18 m/59.06feet, 112 mm/4.41"
width)
9447 BATTERY PACK (7.2 V/2450 mAh)
9643 CHARGE STAND (for Model 9447 BATTERY PACK)
8992 PRINTER UNIT (printing width 100 mm/3.94")
9320-01 LOGIC PROBE
(4-channel digital, contact signal on/off detection)
9321-01 LOGIC PROBE
(4 insulated channels, AC/DC voltage on/off detection)
*9323 CONVERSION CABLE (for connecting 9320, 9321)
9331 WAVE PROCESSOR (Operation software for
personal computer)
9335 WAVE PROCESSOR (Operation software for
personal computer)
9391 CARRYI NG CASE
9612 RS-232C CABLE (mini DIN 9-pin Dsub 9-pin)
*9270CLAMPONSENSOR(20A,5Hzto50kHz)
*9271 CLAMP ON SENSOR (200 A, 5 Hz to 50 kHz)
*9272 CLAMP ON SENSOR (20 A/200 A, 5 Hz to 10 kHz)
9277 UNIVERSAL CLAMP ON CT (20 A, DC to 100 kHz)
9278 UNIVERSAL CLAMP ON CT (200 A, DC to 100 kHz)
*9279UNIVERSALCLAMPONCT(500A,DCto20kHz)
*9555 SENSOR UNIT (used together with 9270 to 9272,
9277 to 9279)
9018-10 CLAMP ON PROBE (10 A to 500 A, 40 Hz to 3 kHz)
9132-10 CLAMP ON PROBE (20 A to 1000 A, 40 Hz to 1 kHz)
*9303 PT
*220H PAPER WINDER
______________________________________________________________
Inspection
Page 13

_____________________________________________________________________
iii
9626 PC CARD 32M
9627 PC CARD 64M
9726 PC CARD 128M
9727 PC CARD 256M
9728 PC CARD 512M
9729 PC CARD 1G
*: no CE marking
NOTE
The 9270 to 9272 CLAMP ON SENSORs and 9277 to 9279
UNIVERSAL CLAMP ON CTs are designed for use only with
the 9555 SENSOR UNIT, and cannot be used alone.
______________________________________________________________
Inspection
Page 14
iv
_____________________________________________________________________
Safety Notes
This product is designed to conform to IEC 61010
WARNING
Safety Symbols
Safety Standards, and has been thoroughly tested for
safety prior to shipment. However, mishandling during
use could result in injury or death, as well as damage
to the product. Be certain that you understand the
instructions and precautions in the manual before use.
We disclaim any responsibility for accidents or injuries
not resulting directly from product defects.
This manual contains information and warnings essential
for safe operation of the product and for maintaining it in
safe operating condition. Before using the product, be sure
to carefully read the following safety notes.
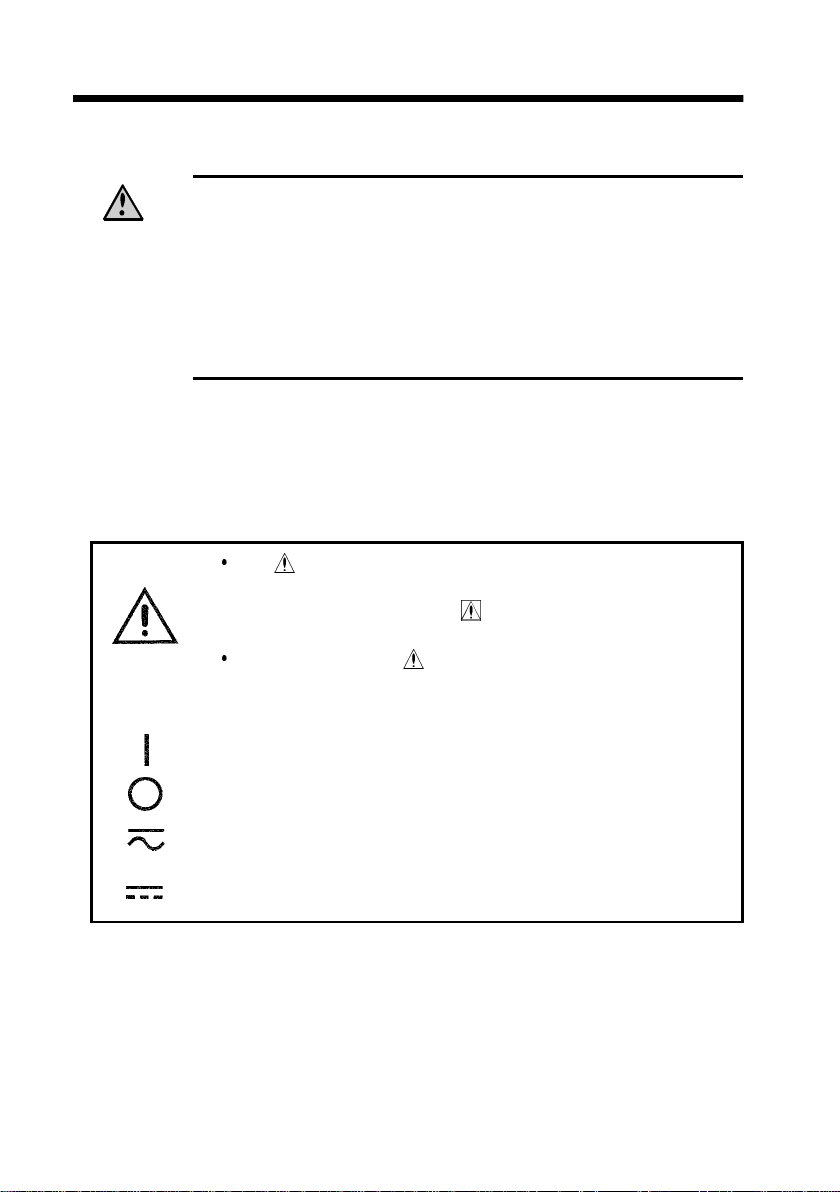
The symbol printed on the product indicates that the
user should refer to a corresponding topic in the
manual (marked with the
relevant function.
In the manual, the symbol indicates particularly
important information that the user should read before
using the product.
symbol) before using the
Indicates the ON side of the power switch.
Indicates the OFF side of the power switch.
Indicates both DC (Direct Current) and AC (Alternating
Current).
Indicates DC (Direct Current).
______________________________________________________________
Safety Notes
Page 15
_____________________________________________________________________
R
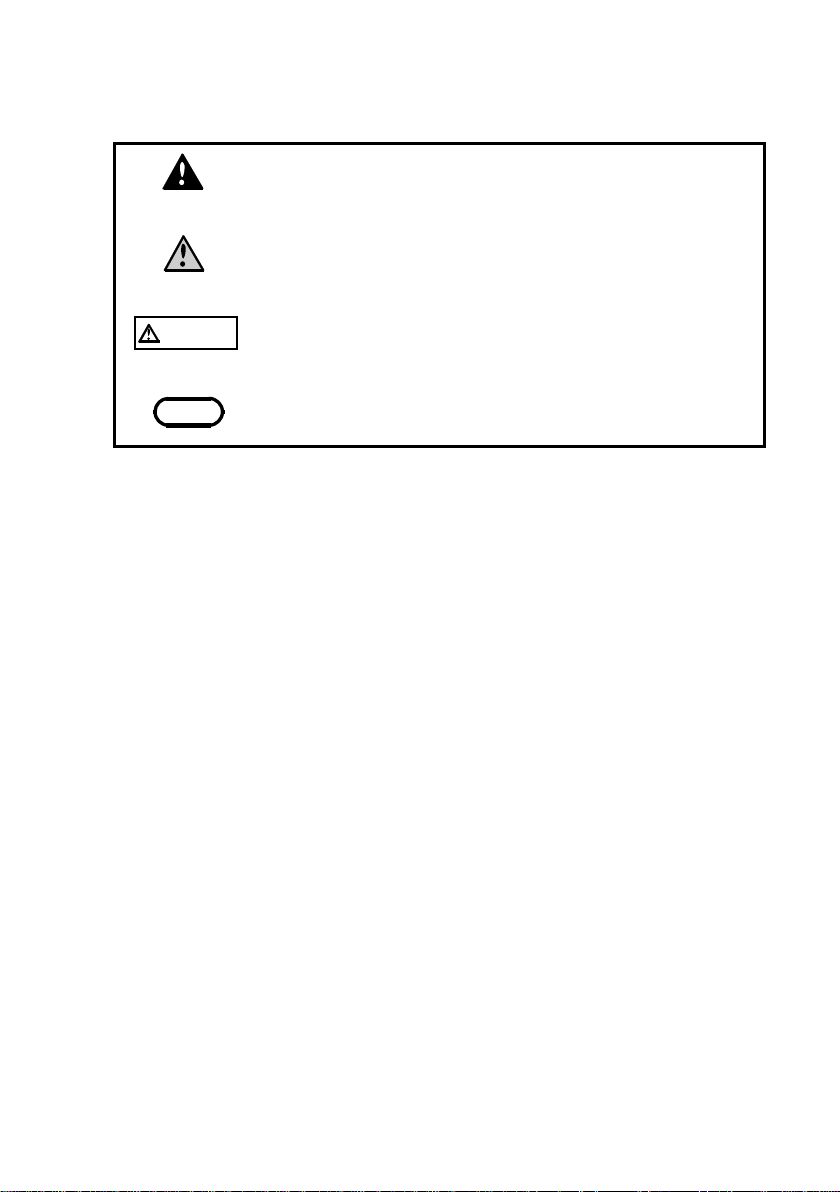
The following symbols in this manual indicate the relative
importance of cautions and warnings.
Indicates that incorrect operation presents an extreme
v
DANGE
WARNING
CAUTION
NOTE
hazard that could result in serious injury or death to
the user.
Indicates that incorrect operation presents a
significant hazard that could result in serious injury or
death to the user.
Indicates that incorrect operation presents a
possibility of injury to the user or damage to the
product.
Advisory items related to performance or correct
operation of the product.
______________________________________________________________
Safety Notes
Page 16

vi
_____________________________________________________________________
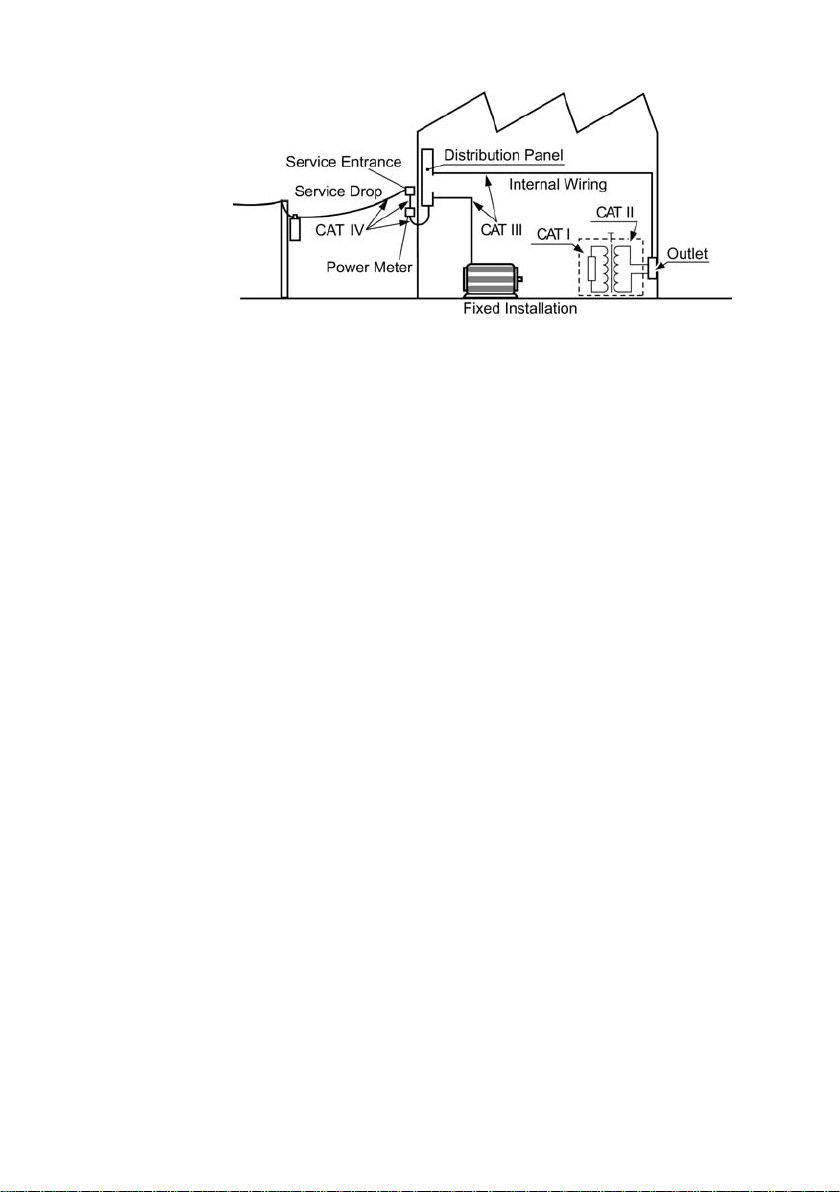
Measurement categories (Overvoltage categories)
This instrument complies with CAT II safety requirements.
To ensure safe operation of measurement instruments, IEC
61010 establishes safety standards for various electrical
environments, categorized as CAT I to CAT IV, and called
measurement categories. These are defined as follows.
CAT I
CAT II
CAT III
CAT IV
Secondary electrical circuits connected to an
AC electrical outlet through a transformer or
similar device.
Primary electrical circuits in equipment
connected to an AC electrical outlet by a power
cord (portable tools, household appliances, etc.)
Primary electrical circuits of heavy equipment
(fixed installations) connected directly to the
distribution panel, and feeders from the
distribution panel to outlets.
The circuit from the service drop to the service
entrance, and to the power meter and primary
overcurrent protection device (distribution
panel).
Higher-numbered categories correspond to electrical
environments with greater momentary energy. So a
measurement device designed for CAT III environments can
endure greater momentary energy tha n a device designed for
CAT II.
Using a measurement instrument in an environment
designated with a higher-numbered category than that for
which the instrument is rated could result in a severe
accident, and must be carefully avoided.
Never use a CAT I measuring instrument in CAT II, III, or
IV environments.
The measurement categories comply with the Overvoltage
Categories of the IEC60664 Standards.
______________________________________________________________
Safety Notes
Page 17
_____________________________________________________________________
vii
Accuracy
We define measurement tolerances in terms of f.s. (full
scale), rdg. (reading) and dgt. (digit) values, with the
following meanings:
f.s. (maximum display value or scale length)
The maximum displayable value or the full length of the
scale.
This is usually the maximum value of the currently selected
range.
rdg. (reading or displayed value)
The value currently being measured and indicated on the
measuring product.
dgt. (resolution)
The smallest displayable unit on a digital measuring
product, i.e., the input value that causes the digital display
to show a "1".
______________________________________________________________
Safety Notes
Page 18
viii
R
_____________________________________________________________________
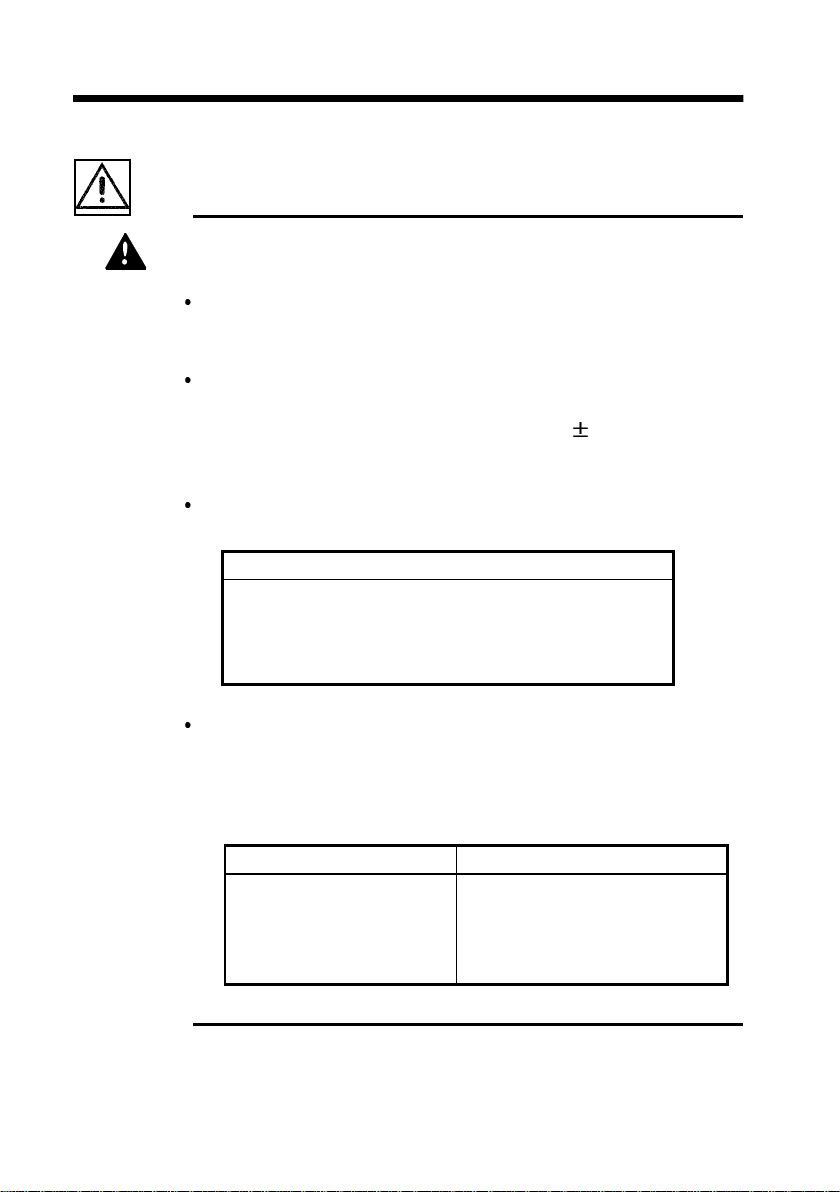
Notes on Use
Follow these precautions to ensure safe operation and to
obtain the full benefits of the various functions.
To avoid the risk of electric shock and damage to the
DANGE
product
Do not apply more than 450 V AC or DC between the
analog inputs and product, or between the analog
inputs.
Use only the specified Model 9418-15 AC ADAPTER
(SA145A-1240V-6, SINO AMERICAN). AC adapter input
voltage range is 100 to 240 V AC (with
10% stability)
at 50/60 Hz. To avoid electrical hazards and damage to
the product, do not apply voltage outside of this range.
Terminal inputs should never exceed the limits
indicated below.
Input/output terminals Maximum input voltage
Analog input 450 V AC/DC
EXT TRIG -5 V to +10 V
TRIG OUT
-20Vto+30V
500 mA max, 200 mW max
The maximum voltage applied to the probe and cables
connecting to the analog input of the product must
never exceed the limits in the following table.
Notwithstanding these limits, the voltage at the analog
input must not exceed 450V AC or DC.
Maximum input voltage
9197 CONNECTION CORD
9217 CONNECTION CORD
9322DIFFERENTIAL
PROBE
500 V AC/DC
300 V AC/DC
1000 V AC, 2000 V DC (CAT ll)
600 V AC/ DC (CAT lll)
______________________________________________________________
Notes on Use
Page 19

_____________________________________________________________________
W
When using the batteries, use LR6 alkaline batteries
ix
ARNING
or 9447 BATTERY PACK. In this case, do not use
new batteries with old ones. Also, do not mix
batteries of different types. We take no responsibility
for an accident using the batteries and battery packs
which are not specified.
The logic inputs are not floating. Although two sets
of logic probes can be connected, they all have a
common ground with the main product.
CAUTION
Use only the specified input cord. Using a non-specified
cable may result in incorrect measurements due to poor
connection or other reasons.
To avoid damage to the product, do not input a
voltage/current exceeding the rated maximum to the
external input terminals.
This product should be installed and operated indoors only,
between 5 and 40
Do not store or use the product where it could be exposed
to direct sunlight, high temperature or humidity, or
condensation. Under such conditions, the product may be
damaged and insulation may deteriorate so that it no longer
meets specifications.
Do not use the product where it may be exposed to
corrosive or combustible gases. The product may be
damaged.
This product is not designed to be entirely water- or dustproof. To avoid damage, do not use it in a wet or dusty
environment.
Preliminary Checks
Before using the product the first time, verify that it
operates normally to ensure that the no damage occurred
during storage or shipping. If you find any damage, contact
your dealer or Hioki representative.
and 35 to 80%RH.
______________________________________________________________
Notes on Use
Page 20

x
_____________________________________________________________________
(1) Before Powering On
Check that the 9418-15 AC ADAPTER (SA145A-1240V-6,
SINO AMERICAN), 9447 BATTERY PACK, or LR6
alkaline batteries are correctly fitted.
When using an AC adapter and if properly grounded three-
pin outlet is available, then using the three-core power cord
provides automatic grounding.
(2) Using the Printer
Avoid using the printer in hot, h umid environments, as this
can greatly reduce printer life.
Printing is not possible if the recording paper is loaded
wrong-side up.
(3) Recording Paper
This product uses a thermal printer. The recording paper
supplied has characteristics finely tuned for use with the
printer.
Using recording paper of a different specification may not
only result in impaired printing quality, but even prevent
the printer from operating. Always use the 9234
RECORDING PAPER.
(4) Storage
Always place the product in the head-up condition when it
is stored for an extended period of time. If the product is
left idle for a long time with the head pressing on the roller,
the roller may be deformed, resulting in uneven prin ting.
(5) Shipment
Use the original packing materials when reshipping the
product, if possible.
______________________________________________________________
Notes on Use
Page 21

_____________________________________________________________________
Handling the CD
xi
CAUTION
Always hold the disc by the edges, so as not to make
fingerprints on the disc or scratch the printing.
Never touch the recorded side of the disc. Do not place the
disc directly on anything hard.
Do not wet the disc with volatile alcohol or water, as there
is a possibility of the label printing disappearing.
To write on the disc label surface, use a spirit-based felt
pen. Do not use a ball-point pen or hard-tipped pen,
because there is a danger of scratching the surface and
corrupting the data. Do not use adhesive labels.
Do not expose the disc directly to the sun's rays, or keep it
in conditions of high temperature or humidity, as there is a
danger of warping, with consequent loss of data.
To remove dirt, dust, or fingerprints from the disc, wipe with
a dry cloth, or use a CD cleaner. Always wipe radially from
the inside to the outside, and do no wipe with circular
movements. Never use abrasives or solvent cleaners.
Hioki shall not be held liable for any problems with a
computer system that arises from the use of this CD, or for
any problem related to the purchase of a Hioki product.
______________________________________________________________
Notes on Use
Page 22

xii
_____________________________________________________________________
Chapter Summary
This manual consists of the following chapters.
"Introduction", "Safety Notes", "Notes on Use" describe
precautions on use, overview, and features of this product.
Be sure to read them all. Next, check Chapter 1 to 3 and
the product to confirm your understanding of the function.
For details on the harmonic wave analysis function of the
8807-51, 8808 -51, refer to the supplement guide "Harmonic
Wave Analysis Function."
Chapter 1 Product Overview
Contains an overview of the product and its features.
Chapter 2 Installation and Preparation
Explains how to set the product up for measurement.
Chapter 3 Basic Button Operation
Explains how to operate the buttons for carrying out basic
measurement functions.
Chapter 4 Memory Recorder Function
Explains how to use the Memory Recorder functions of the
product.
Chapter 5 Recorder Function
Explains how to use the Recorder functions of the product.
Chapter 6 RMS Recorder Function
Explains how to use the RMS Recorder functions of the
product.
Chapter 7 Input Channel Settings
Explains how to make settings using the channel setting
screen.
Chapter 8 Trigger Functions
Explains how to use the Trigger functions of the product.
______________________________________________________________
Chapter Summary
Page 23

_____________________________________________________________________
xiii
Chapter 9 Waveform Screen Operation
Explains how to perform waveform scrolling, how to use
the A/B cursors and so.
Chapter 10 System Settings
Explains how to make settings using the system setting
screen.
Chapter 11 Printout of Measurement Data
Explains how to print out measurement data and how to
read printed charts.
Chapter 12 Storing the Measurement Data
Describes how to save, load and delete measurement data
and settings using a PC Card.
Chapter 13 RS-232C Interface
Describes RS-232C communications.
Chapter 14 Specifications
Contains general specifications and detailed function
specifications.
Chapter 15 Logic and Analog Inputs
Contains specifications and precautions for logic input and
analog inputs.
Chapter 16 Maintenance and Service
Describes maintenance procedures.
Appendix Contains important supplemental material such as error
messages and other information pertaining to product
operation.
______________________________________________________________
Chapter Summary
Page 24

xiv
_____________________________________________________________________
______________________________________________________________
Chapter Summary
Page 25

_____________________________________________________________________
1
Chapter 1
Product Overview
1
1
2
2
3
3
1.1 Major Features
(1) Easy-to-see color LCD
The 5.7-inch color LCD display has a resolution of 320 x
240 dots.
(2) Three functions support a variety of measurements
Memory recorder with up to 2.5 μs (all channels
simultaneously) sampling period (400 kS/s maximum
sampling rate).
Real-time recording capability to paper in Recorder function
RMS recorder function for recording rms values of AC
power supply lines and DC sources.
(3) Powerful trigger functions
Level trigger, window-in trigger, window-out trigger,
voltage drop trigger, waveform detection trigger, pattern
trigger (logic)
(4) Thermal printing with 8992 optional printer
4
4
5
5
6
6
7
7
8
8
9
9
10
10
11
11
12
12
(5) Scaling function
By setting the physical amount and the product to be used
for 1 V input, the measurement result can be converted into
any desired scale.
Two of the HIOKI CLAMP ON PROBEs, the 9018 and the
9132, feature a clamp mode that allows electric current
values to be read directly.
______________________________________________________________
1.1 Major Features
13
13
14
14
15
15
APP
APP
IND
IND
Page 26

2
_____________________________________________________________________
(6) Four isolated analog input channels (8807-01: 2
channels)
The analog inputs are floating, and so each input can be
connected to its own independent potentials.
(7) PC Card Slot provided
Measurement data and settings can be saved to a PC Card.
(8) Equipped with RS-232C standard interface
(9) Dual-language capability
Display language is switchable between Japanese and
English.
(10) Harmonic wave analysis function (8807-51, 8808-51
only)
Harmonic wave analysis function that is a powerful tool for
power supply analysis.
______________________________________________________________
1.1 Major Features
Page 27
_____________________________________________________________________
3
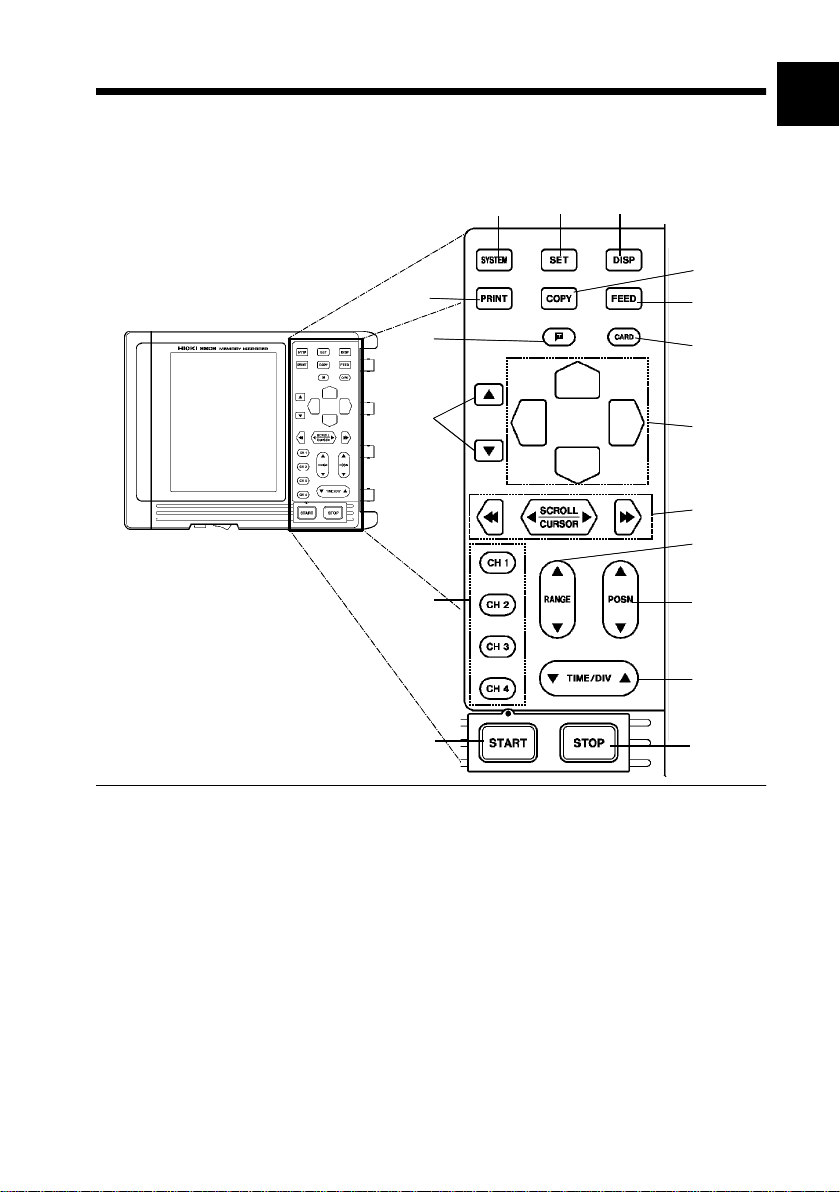
1.2 Identification of Controls and
1
Indicators
12
16
2
123
3
5
4
7
6
8
4
5
9
10
11
13
6
7
8
14
9
15
17
10
11
SYSTEM
1.
SET
2.
DISP
3.
(Waveform display)
PRINT
4.
COPY
5.
______________________________________________________________
button
button
button
button
button
Selects the Environment, Comment, RS©,
setting, and Initialization Screens.
Selects the Status, Channel and Trigger Screens.
Selects the Waveform Screen.
Pressing this button from the Waveform Screen
switches to the DMM Screen.
Serves to print out stored waveforms.
Serves to print out a copy of the current screen
display.
1.2 Identification of Controls and Indicators
12
13
14
15
APP
IND
Page 28

4
_____________________________________________________________________
FEED
6.
button
7. button
(Manual trigger)
CARD
8.
button
9. buttons
10. buttons
scroll/cursor
11.
,
CH1-CH4
12.
buttons
buttons
RANGE
13.
POSN
14.
TIME/DIV
15.
button
button
button
Causes the printer paper to advance for as long as
the button is pressed.
Press this button to activate a trigger event when
manual triggering is enabled.
Using PC card:
Causes the display to show the File Screen.
Using Fax/modem card:
Causes the display to show the FAX&Modem
Screen.
Select and accept settings here.
Moves the flashing cursor in the four directions.
Moves the A/B cursors and scrolls the waveforms.
Input and trigger settings can be made by
displaying the Settings window on the Waveform
Screen.
Sets the voltage axis range for the channel.
Sets the zero position for the channel.
Sets the input signal capture speed. On the
Waveform Screen, press both sides of the
TIME/DIV button for at least 2 seconds to activate
auto-ranging. (Memory recorder only)
16.
START
button
Initiates the measurement and analysis. During
measurement, the LED above the button is lit.
STOP
17.
______________________________________________________________
1.2 Identification of Controls and Indicators
button
Stops measurement and analysis.
Page 29
_____________________________________________________________________
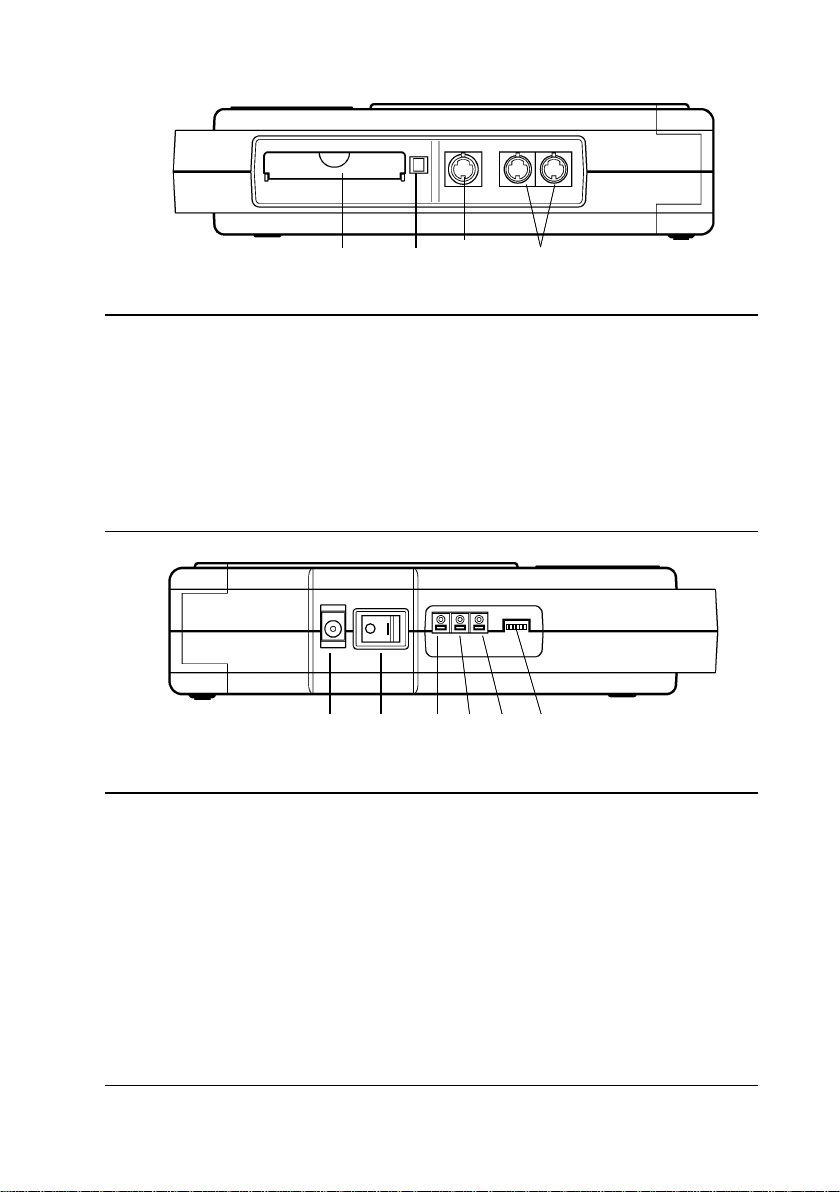
1234
Upper Side View
5
1. PC card slot
2. Eject button
3. RS-232C connecting
Insert the PC card.
Press this button to eject a PC card.
Connect the 9612 RS-232C CABLE.
terminal
4. Logic probe
connectors
Input connector for the logic input
section, designed for the optional 9320-01
and 9321-01 LOGIC PROBEs.
12 3456
Lower Side View
1. AC adapter connecting terminal
2. Power switch
3. External trigger
terminal
(EXT TRIG)
(POWER)
Switches on or off the power supply.
External trigger source input.
(for the AC adapter specified by Hioki)
4. Trigger output
terminal
5. Ground terminal
(TRIG OUT)
(GND)
6. Contrast adjustment
Trigger signals are output.
Used together with the trigger terminal.
Adjusts screen contrast.
knob
______________________________________________________________
1.2 Identification of Controls and Indicators
Page 30
6
_____________________________________________________________________
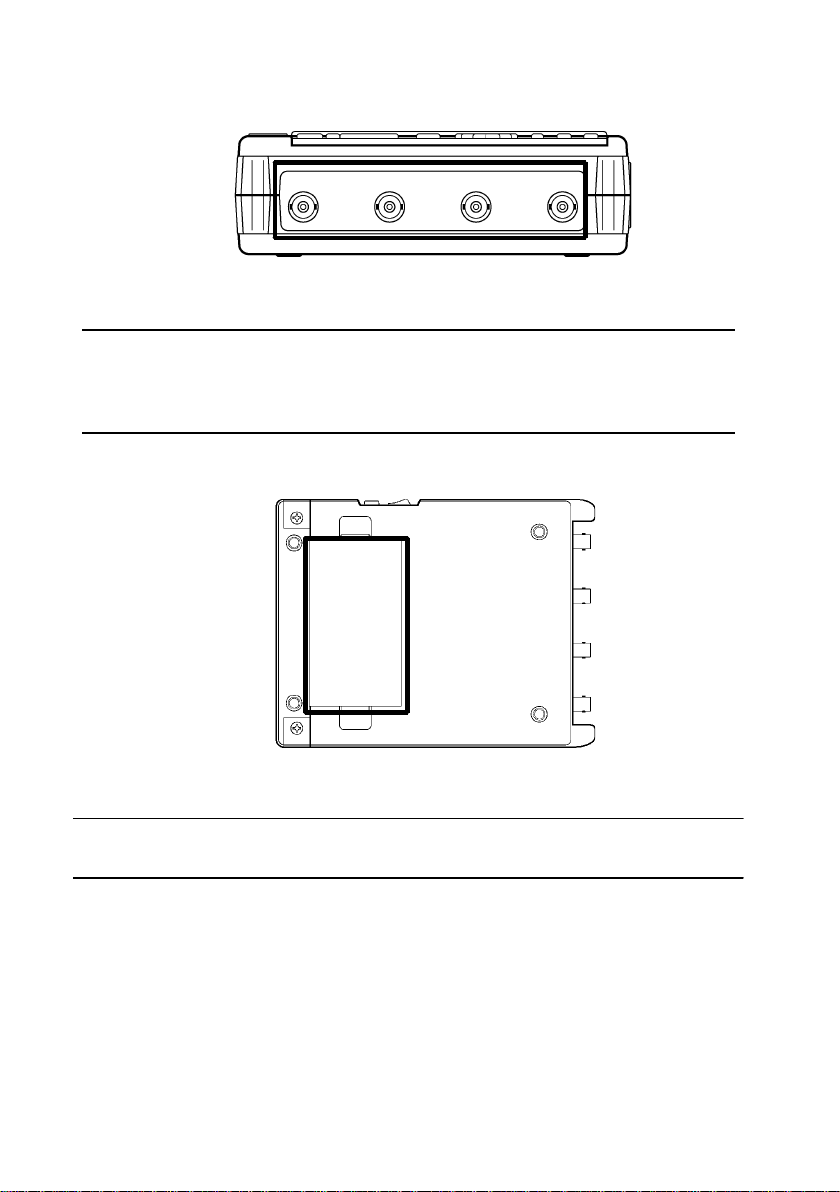
Analog input terminal
CH4 CH3 CH2
Right Side View
CH1
Input terminals for analog inputs, nonbalanced input type
(8808-01, 8808-51: 4-channel input, 880701, 8807-51: 2-channel input)
Bottom Side View
Battery compartment
Six LR6 alkaline batteries or the 9447
BATTERY PACK can be installed.
______________________________________________________________
1.2 Identification of Controls and Indicators
Page 31

_____________________________________________________________________
7
Chapter 2
Installation and Preparation
1
2
3
2.1 Installation of the Product
Ambient conditions
Temperature
5to40
recommended for high-precision measurements.
Humidity
35 to 80%RH (no condensation); 5 0
(no condensation) recommended for high-precision
measurements.
Avoid the following locations:
Subject to direct sunlight.
Subject to high levels of dust, steam, or corrosive gases
(Avoid using the equipment in an environment containing
corrosive gases (e.g., H
that generate harmful gasses (e.g., organic silicones,
cyanides, and formalins).
Subject to vibrations.
In the vicinity of equipment generating strong
electromagnetic fields.
,23 5 (41 to 104 ,73 9 )
,NI2,andCI
S, SO
2
2
10%RH
) or substances
2
4
5
6
7
8
9
10
11
12
13
______________________________________________________________
2.1 Installation of the Product
14
15
APP
Page 32

8
R
_____________________________________________________________________
2.2 Power Supply and Ground Connection
2.2.1 Connecting the AC Adapter
Use only the specified/supplied Model 9418-15 AC
DANGE
ADAPTER (SA145A-1240V-6, SINO AMERICAN). AC
adapter input voltage range is 100 to 240 V AC (with
10% stability) at 50/60 Hz. To avoid electrical hazards
and damage to the product, do not apply voltage
outside of this range.
NOTE
______________________________________________________________
2.2 Power Supply and Ground Connection
The AC adapter is prior to the battery when using together.
Page 33

_____________________________________________________________________
9
2.2.2 Installing the Batteries/Battery Pack
1
2
WARNING
NOTE
Use the specified 9447 BATTERY PACK or LR6 alkaline
batteries. Do not use old and new batteries or batteries
of different types together.
The manufacturer disclaims all responsibility for any
accident or injury except that resulting due to defect in
its specified batteries or Battery packs.
Do not use old and new batteries or batteries of
different types together. If intend to, performance of
the product may suffer.
If not recharge, the 9447 can not be used.
For the details on charging batteries, refer to Section 16.2,
"9447 BATTERY PACK."
If the battery voltage drops while the product is running off of
battery power, the product will automatically switch off the
power supply. If the product is left in this state for an extended
period of time, the battery pack may be discharged too much.
Be sure to turn OFF the power switch on the product.
When the battery capacity is reduced, the power is automatically
turned off. Before turning on the power again with AC adapter
or new batteries, turn the power off and leave for about 30
seconds. If this time is shorter than 30 seconds, the power may
be immediately turned off even if powering on.
When not in use for a long time, to prevent possible corrosion
caused by battery leakage, remove the batteries before storage.
3
4
5
6
7
8
9
10
11
12
______________________________________________________________
2.2 Power Supply and Ground Connection
13
14
15
APP
IND
Page 34

10
_____________________________________________________________________
Installing the Batteries or Battery Pack
1. Turn the power OFF.
2. Take off the cover of the battery compartment.
3. Remove the old batteries and replace them with six new
LR6 alkaline batteries with the correct polarity.
4. Replace the battery cover.
Effective Battery-Powered Operating Time
(typical value at normal temperature)
Operating time is extended with the backlight brightness is
set to Dark.
For details, refer to Section 10.1.7
Not operating (waiting for trigger, etc.)
Alkaline battery: Approx. 60 min (dark)/ Approx. 40 min (bright)
9447 BATTERY PACK: Approx. 180 min (dark)/ Approx. 120
min (bright)
During operating (2 s/DIV 1 Hz sinewave (REC)
Alkaline battery: Impossible
9447 BATTERY PACK: Approx. 120 min (dark)
NOTE
______________________________________________________________
2.2 Power Supply and Ground Connection
Actual performance will change from values indicated in this table
according to the types of batteries, temperature , and printing rate.
The printer cannot be used with alkaline batteries: use either the
9418-15 AC ADAPTER (SA145A-1240V-6, SINO AMERICAN)
or 9447 BATTERY PACK when using the printer.
The backlight is automatically dimmed when the printer is in use.
Page 35

_____________________________________________________________________
11
2.3 Power On/Off
1
WARNING
Check the following points before the power switch is
turned on.
Power supply matches Rated supply voltage (100 to
240 V AC: Voltage fluctuations of
supply voltage are taken into account.) and rated
supply frequency (50/60 Hz).
The Product is correctly installed (See Section 2.1).
Depending on the type and status of power supply of the
product, one of the following messages appears on the
Waveform Screen.
Operating with the AC ADAPTER.
Operating with batteries.
10% from the rated
2
3
4
5
6
7
8
9
10
11
12
Battery capacity is low. Replace the batteries.
NOTE
______________________________________________________________
When the product is turned off, it memorizes the currently used
settings and reestablishes the same settings the next time the
product is turned on again. (Backup function)
2.3 Power On/Off
13
14
15
APP
IND
Page 36

12
f
_____________________________________________________________________
2.4 Connecting the Connection Cord
Never connect the cable to the product while the
WARNING
other end is connected to the measurement object,
as you could receive an electric shock.
Use only the specified connection cable.
To prevent electric shock, an insulated BNC
connector is used. There is the possibility of shock
if a metal BNC is used because the input L terminal
and the metal part of the BNC connector have the
same electric potential.
CAUTION
When disconnecting the BNC connector, be sure to release
the lock before pulling off the connector. Forcibly pulling the
connector without releasing the lock, or pulling on the
cable, can damage the connector.
Using a connection cable other than that specified may
result in damage to the BNC connector, poor contact, or
other symptoms preventing accurate measurement.
Use the optional 9197, 9198, or 9217
CONNECTION CORD
to connect to the analog input terminals.
CONNECTION CORDs
Maximum
input voltage:
9197 9198
500 V 300 V 300 V
9217
Connecting to the main product
1. Align the grooves in the BNC
Groove o
the BNC
connector with the guide pins on
the product input connector, then
turn clockwise while pressing in
to lock the connector.
2. To remove from the product, turn
Connectorguide
the BNC connector
counterclockwise to release the
lock, then pull it.
______________________________________________________________
2.4 Connecting the Connection Cord
Page 37

_____________________________________________________________________
R
13
2.5 Connecting the 9322 DIFFERENTIAL
PROBE
For the 9322, the maximum rated voltage to earth is as
DANGE
follows.
When using grabber clips: 1500 V AC or DC (CAT ll) /
600 V AC or DC (CAT lll)
When using alligator clips: 1000 V AC or DC (CAT lI) /
600 V AC or DC (CAT lll)
To avoid electrical shock and possible damage to the
product, never apply voltage exceeding these limits
between the input terminals and the chassis, or
between the inputs of two 9322s.
The maximum input voltage is 1000 V AC or 2000 V DC
(CAT ll) / 600 V AC or DC (CAT lll).
Do not attempt to measure voltage exceeding these
limits, as doing so may damage the equipment or
cause an accident that might result in injury or death.
High voltage can be present at the inputs to the 9322.
WARNING
______________________________________________________________
To avoid electrical hazard, be sure to turn off the
equipment to be measured before connecting the test
leads. Turn the power on only after the leads have been
securely connected.
Before using the product, make sure that the sheathing
on the probes is not damaged and that no bare wire is
exposed. If there is damage, using the product could
cause electric shock. Contact your dealer or HIOKI
representative.
2.5 Connecting the 9322 DIFFERENTIAL PROBE
Page 38

14
p
p
)
r
_____________________________________________________________________
The Model 9322 is a differential probe that connects to
input modules for the 8800 MEMORY HiCORDER series.
High voltage applied between the H and L terminals is
divided by 1/1000 and output as a voltage signal relative to
GND.
Power jack
(Connect the 9418-10
AC ADAPTER
BNC connecto
(Connect to the analog
input terminal
Grabber cli
Alligator cli
Connection Method
1. Connect the alligator or grabber clips to the 9322.
For the 9322, the maximum rated voltage to earth is as
follows.
When using grabber clips: 1500 V AC or DC (CAT ll) /
600 V AC or DC (CAT lll)
When using alligator clips: 1000 V AC or DC (CAT lI) /
600 V AC or DC (CAT lll)
2. Connect the AC ADAPTER to power jack of the 9322.
The indicator lights when power is applied.
______________________________________________________________
2.5 Connecting the 9322 DIFFERENTIAL PROBE
Page 39

_____________________________________________________________________
15
3. Connect the BNC connector of the 932 2 to the analog
input terminal of the product.
Grooves in the BNC
Connector guide
4. Connect the alligator clip or grabber clip to equipment to
be measured.
5. Select DC, AC or RMS output with the output selector
switch.
DC The voltage between H and L signals is divided
by 1/1000 and output as voltage relative to GND.
AC AC coupling for DC signals, and impulse voltage
is sampled on the carrier voltage.
RMS RMS conversion is applied to DC output signals
and output as a level variation.
NOTE
______________________________________________________________
One 9418-15 AC ADAPTER (SA145A-1240V-6, SINO
AMERICAN) is required for each 9322 to be used.
Refer to the 9322 DIFFERENTI AL PROBE Instruction Manual for
details.
2.5 Connecting the 9322 DIFFERENTIAL PROBE
Page 40

16
y
機
_____________________________________________________________________
2.6 Connecting the Logic Probe
The ground sides of the logic inputs are connected in
WARNING
common to the frame ground of the product. Therefore,
if the product is powered by the AC adapter and the
object to be measured is powered from a different
power source, the possibility exists for electric shock
or damage to the equipment. Furthermore, even when
power is supplied from the same source, a potential
difference can exist due to different ground-side wiring ,
resulting in current flow through the logic probes that
could result in electric shock or damage.
To avoid these hazards, before connecting a logic
probe to the product and the object to be measured,
confirm that power is sup plied from the same
grounded outlet using 3-wire grounded power cords.
Do not connect logic probes other than supplied by
HIOKI to the logic inputs.
Object to
be measured
Outlet
MEMORY
HiCORDER
Power suppl
Ground
The logic input is located on the
top side of the product. Since one
logic probe can record 4 channels,
the combined maximum recording
capability for logic waveforms is 8
channels.
NOTE
______________________________________________________________
2.6 Connecting the Logic Probe
If no logic probe is connected, the corresponding logic
waveform is displayed on the screen at high level.
Carefully read the instruction manual supplied with the 9320-01
or 9321-01 LOGIC PROBE.
Page 41

_____________________________________________________________________
R
17
2.7 Connecting the 9018-10, 9132-10
CLAMP ON PROBE
Always connect the clamp-on probe to the secondary
DANGE
side of a breaker. On the secondary side of a breaker,
even if the lines are shorted the breaker can trip and
prevent an accident. On the primary side, however, the
current capacity may be large, and in the event of a
short-circuit there may be a serious accident.
Before using the 9018-10, 9132-10 CLAMP ON PROBE,
be sure to carefully read its instruction manual and
familiarize yourself with the operation principles of this
product.
This product measures input voltage, so although current
cannot be measured directly, current can be measured by
the voltage output from the HIOKI 9018-10, 9132-10
CLAMP ON PROBEs.
Connect the BNC connector of the CLAMP ON PROBE to
the analog input terminal. For details, refer to Section 2.4.
9018-10
Load
9132-10
Source
Source
NOTE
______________________________________________________________
To measure current, set the input coupling of the product to
"CLAMP." For details, refer to Section 7.3.4.
When the clamp-on probe is used for measurement, the
measurement precision will be affected both by the product
precision and clamp-on probe precision ratings.
When using the 9199 CONVERSION ADAPTOR, the 9018,
9132 CLAMP ON PROBEs can be used.
When measuring electric current, make sure that the direction of
the CLAMP ON PROBE matches the direction of electric
current.The direction of connection for the 9132-10 is opposite
from the 9018-10. If the CLAMP ON PROBE is faced in the
opposite direction, the phase will shift 180 degrees from the
actual value.
2.7 Connecting the 9018-10, 9132-10 CLAMP ON PROBE
Load
Page 42

18
_____________________________________________________________________
2.8 Connecting the 8992 PRINTER UNIT
Before connecting or disconnecting the printer unit, make
sure that the power switch is off. When the printer is not
connected, be sure to install the cover.
1. Using a plastic screwdriver,
remove the two screws that secure
the product's rear cover and lift off
the cover.
2. Insert the 8992 PRINTER UNIT.
3. Secure with the two screws
provided.
If the connector does not mate easily,
rock the printer slightly as shown
while pressing the products together.
NOTE
______________________________________________________________
2.8 Connecting the 8992 PRINTER UNIT
The printer cannot be used with alkaline batteries: use either the
9418-15 AC ADAPTER (SA145A-1240V-6, SINO
AMERICAN) or 9447 BATTERY PACK when using the
printer.
Page 43

_____________________________________________________________________
19
2.8.1 Loading Recoding Paper
1. Lift the stock cover in the direction
of the arrows.
2. Raise the head up/down lever.
3. Insert the leading edge of the
recording paper from bottom into the
gap behind the printer roller, and
pull it out to the other side.
Pressing the
FEED
button feeds
paper.
4. Insert the attachments into the ends
of the roll of recording paper and set
the paper into its holder.
______________________________________________________________
2.8 Connecting the 8992 PRINTER UNIT
Page 44

20
_____________________________________________________________________
5. Pull the end of the recording paper
out at least 10 cm, and make sure
that it is positioned quite straight.
6. Put down the head up/down lever.
7. Pull the recording paper to the
outside through the printer exit slot
in the stock cover.
8. Close the stock cover, and finish by
tearing off the recording paper
against the edge of the printer exit
slot.
NOTE
______________________________________________________________
2.8 Connecting the 8992 PRINTER UNIT
When the stock cover is fully open, attempting to force it open
further may damage the cover.
The paper may jam if i t is not aligned with the roller.
Always place the product in the head-up condition when it is to
be transported or stored for an extended period of time. If the
product is left idle for a long time with the head pressing on the
roller, the roller may be deformed, resulting in uneven printing.
Be careful to correctly orient the recording paper. Nothing will
be printed if the recording paper is loaded with the wrong side
facing the print head.
We recommend using only the specified 9234 RECORDING
PAPER.
Page 45

_____________________________________________________________________
21
2.8.2 Care of Recording Paper
Care of recording paper
While unopened, thermal paper will not be affected by the
environment, provided that ambient temperature and
humidity do not exceed normal levels. For long-term
storage, temperature should be lower than 40
Low temperatures cause no problem.
After opening, protect the paper from strong light, to prevent
discoloration.
Storing data
The recording paper uses a thermochemical reaction.
Note the following points:
To avoid discoloration, do not leave recording paper in
direct sunlight.
Store at not more than 40 (104 ) and 90% RH.
To keep definitive data, make photocopies of the recordings.
Thermal paper will blacken when brought into contact with
alcohol, ester, ketone, or other volatile organic substances.
If the thermal paper absorbs an organic solvent such as
alcohols or ketones it may no longer develop properly, and
recorded information may fade. Soft PVC film and
transparent contact adhesive tape contain such solvents, so
avoid using them with recordings.
Avoid interleaving the thermal r ecordings with damp diazo
copies.
(104 ).
Direct sunlight
______________________________________________________________
2.8 Connecting the 8992 PRINTER UNIT
Organic solvent
Page 46

22
_____________________________________________________________________
2.9 Attaching the Strap
CAUTION
Attach the ends of the strap securely at both attachment
points. If the strap is not attached securely, the product
could drop while being carried.
1. Insert each end of the strap through an attachment point
on the product.
Attachment Point
2. Thread the end of the strap through the buckle twice as
shown below.
3. Finally, slide the stopper over the end of the strap.
Tighten the strap to remove slackness or twisting.
Stopper
______________________________________________________________
2.9 Attaching the Strap
Page 47

_____________________________________________________________________
R
2.10 Notes on Measurement
To avoid the risk of electric shock and damage to the
23
DANGE
product
Do not apply more than 450 V AC or DC between the
analog inputs and product, or between the analog
inputs.
Terminal inputs should never exceed the limits
indicated below.
Input/output terminals Maximum input voltage
Analog input 450 V AC rms, DC
EXT TRIG -5 V to +10 V
TRIG OUT -20Vto+30V
500 mA max, 200 mW max
The maximum voltage applied to the probe and cables
connecting to the analog input of the product must
never exceed the limits in the following table.
Notwithstanding these limits, the voltage at the analog
input must not exceed 450V AC or DC.
Maximum input voltage
9197
CONNECTION CORD
9217
CONNECTION CORD
9322
DIFFERENTIAL PROBE
500 V AC rms, DC
300 V AC rms, DC
1000 V AC, 2000 V DC (CAT ll)
600 V AC, DC (CAT lll)
______________________________________________________________
2.10 Notes on Measurement
Page 48

24
)
(
)
_____________________________________________________________________
Analog Input Zero Position
The zero position may be offset when the input coupling is
DC or GND and the input is open circuit in the highsensitivity (10 mV) range.
The accuracy specifications apply after 30-minute warm-up
following power on. During warm-up, the zero position
drifts as indicated below.
Error
%f.s.
2
1
0.5
0
-0.5
-1
-2
0 5 10 20 30 40 50 60
Time frompower on(minutes
______________________________________________________________
2.10 Notes on Measurement
Page 49

_____________________________________________________________________
25
Chapter 3
Basic Button Operation
Buttons for screen display setting
(Refer to Section 3.1)
Buttons for printer operation
(Refer to Section 3.2)
Buttons for item settings
(Refer to Section 3.3)
Buttons for waveform scrolling
and A/B cursor buttons
(Refer to Section 3.4)
1
2
3
4
5
6
7
8
Buttons for channels and input settings
(Refer to Section 3.5)
Start and stop buttons
(Refer to Section 3.6)
______________________________________________________________
9
10
11
12
13
14
15
APP
IND
Page 50

26
_____________________________________________________________________
3.1 Screen Display Buttons
These buttons switch between the display screens.
SYSTEM
SET
DISP
SYSTEM
button
SET button By pressing this button, you can select the
DISP button Calls up the Waveform Screen.
By pressing this button, you can select the
Environment, Comment, RS©, Setting,
and Initialization Screens.
Status, Channel, Trigger Screens.
Serves to display and observe waveforms.
Pressing this button from the Waveform
Screen switches to the DMM Screen.
3.2 Printer Buttons
These buttons are enabled when the 8992 PRINTER UNIT
is installed. For details, refer to Chapter 11.
PRINT
COPY
FEED
PRINT button Serves to print out the measured data.
COPY button Prints a copy of the displayed screen, or to
save it as a BMP file.
(For output destination, refer to Section 10.3.)
FEED button Forwards the paper while the button is held
down.
______________________________________________________________
3.1 Screen Display Buttons
Page 51

_____________________________________________________________________
27
3.3 Item Setting Buttons
Cursor buttons Serves to move the flashing cursor.
Use to select the Scroll or A/B cursors
and Key Lock ON/OFF functions.
1
2
3
buttons
(Select button)
Serves to set the items.
3.4 Waveform Scrolling Buttons
These buttons move the A/B cursors and scroll the
waveforms. For details, refer to Section 9.1 and 9.2.
Move the A and B cursors or scroll waveforms by these
buttons.
SCROLL
CURSOR
(1) Using the A/B cursors
(2) Scrolling the waveform
Pressing the
The A/B cursors can be used to read a time difference,
frequency, or potential difference on Waveform Screen.
The waveform on the display can be scrolled horizontally.
/ buttons moves quickly.
4
5
6
7
8
9
10
11
12
Press both cursor buttons (
switch the operation for using the A/B cursors or
scrolling the waveform.
______________________________________________________________
and ) simultaneously to
3.3 Item Setting Buttons
13
14
15
APP
IND
Page 52

28
_____________________________________________________________________
3.5 Input Operation
Press a channel select button (CH1 to CH4) on the
Waveform Screen to display the desired Settings window.
CH1
CH2
CH3
CH4
RANGE
POSN
TIME/DIV
CH1-CH4 buttons Display the Settings window for
voltage axis range, magnification, zero
position, filtering, trigger conditions
and more.
RANGE button Serves to set the voltage axis range for
the channel selected.
POSN button Serves to set the zero position for the
channel selected.
TIME/DIV button Serves to set the input signal capture
speed.
Other settings are made by moving the flashing cursor with
the Cursor buttons (
(
/ ) buttons.
) and pressing the Select
______________________________________________________________
3.5 Input Operation
Page 53

_____________________________________________________________________
29
3.6 Measurement Start and Stop
The measurement start/stop operation is separately
determined by each measurement function.
For details, refer to "Start and Stop Operation," which
explains each measurement function.
1
2
3
START
STOP
START
button
STOP button Pressing this button stops the measurement.
Pressing this button starts measurement.
The LED on the upper part of the switch
lights green during measurement.
3.7 Other Buttons Operation
CARD
button
Manual trigger
CARD button Using PC card:
When Manual Trigger is enabled (ON) on
the Trigger Screen, the trigger is activated
by pressing this button during the trigger
wait state.
Pressing the
cursor aligned with a setting item displays
the setting items.
Displays the File Screen.
Using Fax/modem card:
Displays the Fax&Modem Screen.
button with the flashing
4
5
6
7
8
9
10
11
12
______________________________________________________________
3.6 Measurement Start and Stop
13
14
15
APP
IND
Page 54

30
_____________________________________________________________________
3.8 Key Lock Function
This function disables all front-panel button controls of the
product. The function serves to prevent unintended changes
to settings during a measurement.
Press both cursor buttons (
) simultaneously for 3
seconds to switch the key lock on/off.
The key lock function will not be canceled by turning the
pow er off and on.
When the key lock function is active, the indication "
" is shown on the display.
LOCK
KEY
If the backlight saver function is used and the display
backlight turns off, it can be turned on again by touching
any button. The function assigned to the button will not be
activated.
______________________________________________________________
3.8 Key Lock Function
Page 55

_____________________________________________________________________
3.9 Changing the Screen
31
Waveform
display
SET
SET
Extended
status
DISP
MEM
STATUS
Numerical
calculation
CHANNEL
SYSTEM
DMM
DISP
DISP
Settings on the screen
STATUS
CHANNEL
REC
Initialize
SET
CommentEnvironmen
SYSTEM
RS©
SYSTEM
RMS
STATUS
CHANNEL
SCALING
TRIGGER
(MEM)
SCALING
TRIGGER
(REC)
SCALING
TRIGGER
(RMS)
(MEM): Memory recorder function/ (REC): Recorder function/
(RMS): RMS recorder function
______________________________________________________________
3.9 Changing the Screen
Page 56

32
_____________________________________________________________________
______________________________________________________________
3.9 Changing the Screen
Page 57

_____________________________________________________________________
33
Chapter 4
Memory Recorder Function
1
2
3
4.1 Overview of the Memory Recorder
Function
The memory recorder function has the following features.
(1) After being stored in the internal memory, input signal data
can be displayed and printed.
(2) All input channel data are recorded on the same time axis.
Since data for all channels can be superimposed, the
relative relationship between input signals can be observed
visually.
(3) Time axis setting
200 μs/DIV to 5 min/DIV
(4) Time axis resolution 80 points/DIV
(5) Storage capacity (DIV)
Model
8807-01, 8807-51
8808-01, 8808-51
(6) Waveform magnification/compression display and print
Time axis direction: x10 to x1/500
Voltage axis direction: x10 to x1/2
(7) Display layout
Time axis waveform: single, dual, quad displays
X-Y waveform: single display (dot, line)
(8) Logging function
Numeric printout of waveform data
(9) Memory segmentation (Sequential save) function helps to
reduce dead time of continuous recording.
(10) Numerical calculation functions
Eleven types of numerical calculation can be performed,
such as frequency and RMS measurements.
______________________________________________________________
4.1 Overview of the Memory Recorder Function
Number of channels
1 2 4
3200
3200
1600
1600
---
800
4
5
6
7
8
9
10
11
12
13
14
15
APP
IND
Page 58

34
_____________________________________________________________________
4.2 Operation Sequence (MEM)
Memory recorder operating procedures are described by the
following flowcharts.
Preparation
Settings on the Status Screen
Settings on the Status Screen
Function
Time axis range
Recording length
Display layout
Auto save
Printer recording format
Auto-print
Extended Status Screen
Extended Status Screen
Using channel
Refer to Chapter 2
Press the SET button to display the
Status Screen.
Select MEMORY (memory recorder
function).
Set the speed with which the input signal
waveform is captured.
Set the length of the data sample
for a single measurement.
Select the layout of the Waveform Screen
and for printing.
Select whether data is automatically saved.
Select whether measurement data is to be
printed as a waveform or numerically.
Select whether waveform data is to be
printed automatically.
Use this function, if necessary.
Configure memory allocation for
measurement data.
.
SET
Roll mode
Sequential save
Numerical Calculation Screen
Extended Status Screen
Requires connection of the optional 8992 PRINTER
UNIT.
Scrolls the waveform display if the time
axis is 10 ms/div to 5 min/div.
Segments memory into blocks, and records
a waveform in each block.
Refer to Section 4.8.3.
Input waveforms data is extrapolated and
displayed numerically. Refer to Section 4.9.
______________________________________________________________
4.2 Operation Sequence (MEM)
Page 59

_____________________________________________________________________
Settings on the Channel Screen
Settings on the Channel Screen
Channel Screen
Scaling Screen
Conversion ratio method
2-point method
Press the SET button to
display the Channel Screen.
Set the waveform display color,
voltage axis range, zero position,
etc. Refer to Chapter 7.
The scaling function can be used to
convert the output voltage
from a sensor, for example, to a
physical property of the measured
object.
Refer to Section 7.5.
35
SET
1
2
3
4
5
6
Settings on the Trigger Screen
Settings on the Trigger Screen
Start measurement
Press the START button to start measurement.
To avoid inadvertent measurements, the START button
activation condition can be selected. Refer to Section 10.1.1,
for details.
Zero adjustment is performed automatically for every
measurement.
Press the SET button to
display the Trigger Screen.
Set the trigger source, type and
condition, and pre-trigger condition.
Refer to Chapter 8.
SET
7
8
9
START
10
11
12
13
14
15
______________________________________________________________
4.2 Operation Sequence (MEM)
APP
IND
Page 60

36
A
y
_____________________________________________________________________
4.3 Setting Items
4.3.1 Setting the Function Mode
The 8807-01, 8808-01 has three function modes.
Additionally, the 8807-51, 8808-51 also offers a harmonic
wave analysis function. Select the Memory recorder
function.
Procedure
Status/ Channel/ Trigger Screen
1. Press the
SET
button to display the Status, Channel, or
Trigger Screen.
2. Move the flashing cursor to the position shown in the
figure below and select
Memory Recorder Function
Analog input signals are converted by the A/D converter to digital values
for display and storage in the internal memory.
X-Y combined plotting of multiple channels is possible.
nalog
input signal
Input voltage
A/D Converter
Digital
signal
MEMORY
Flashing cursor
RAM
using the buttons.
Digital processing
Display
Samplingperiod
Time
Screen displa
______________________________________________________________
4.3 Setting Items
Page 61

_____________________________________________________________________
37
4.3.2 Setting the Time Axis Range
1
Procedure 1
Procedure 2
Set the speed for inputting and storing the waveform of the
input signal. Time axis range setting expresses the time for
1 division.
Status Screen
1. Press the
2. Move the flashing cursor to
axis range using the
Pressing the
automatically to the Time Axis position for setting.
Waveform Screen
1. Press the
2. Move the flashing cursor to the position shown in the
figure below and use the
SET
button to display the Status Screen.
Time/DIV
buttons.
TIME/DIV
DISP
button to display the Waveform Screen.
button moves the flashing cursor
buttons to make a setting.
and select the time
The data interval for the
time axis range setting is
1/80 (1 DIV=80 data
points).
Flashing cursor
2
3
4
5
6
7
8
9
10
11
Flashing cursor
Pressing the
the flashing cursor position.
______________________________________________________________
TIME/DIV
button sets the time axis regardless of
4.3 Setting Items
12
13
14
15
APP
IND
Page 62

38
_____________________________________________________________________
4.3.3 Setting the Recording Length
The length of recording for one measurement operation
(number of divisions) can be set.
Constant recording length mode
Variable recording length mode
be selected by the user.
Status Screen
Procedure1 Constant recording length mode
1. Press the
SET
button to display the Status Screen.
2. Move the flashing cursor to
length using the
buttons.
: Select the recording length.
: Variable recording length can
Shot
and select the recording
Flashing cursor
Depending on the number of channels to be used, the
recording length is limited. (For setting the number of
channels, refer to
Using channels Constant recording length [DIV]
1 channel 20, 50, 100, 200, 400, 800, 1600, 3200
1 and 2 channels 20, 50, 100, 200, 400, 800, 1600
1 to 4 channels
(8808-01, 8808-51
only)
______________________________________________________________
4.3 Setting Items
Section 4.8.1
20, 50, 100, 200, 400, 800
.)
Page 63

_____________________________________________________________________
Procedure2 Variable recording length mode
39
1. Press the
2. Move the flashing cursor to
3. Press the
4. Using the
the digit to be set and use the
SET
button to display the Status Screen.
Shot
.
Flashing cursor
In variable recording-length
mode, the symbol "#" is
displayed before the
recording length.
button to set for variable recording length.
cursor buttons, move the flashing cursor to
buttons to make a
setting.
To return to the constant recording length mode, press the
button again.
______________________________________________________________
4.3 Setting Items
Page 64

40
.
_____________________________________________________________________
4.3.4 Setting the Display Layout
The display layout of input waveforms can be set for the
Waveform Screen and for printing.
The layouts Single, Dual, Quad, X-Y (Dot/Line) are
available.
Single Display
Display and record as one graph.
Quad Display
Display and record as four graph.
Display and record as two graph
(Dot) Linear interpolation
(smoothing) is not performed.
(Line) Linear interpolation is
performed.
Dual Display
X-Y Display
______________________________________________________________
4.3 Setting Items
Page 65

_____________________________________________________________________
41
Procedure
Status Screen
1. Press the
2. Move the flashing cursor to
display format using the
Single
Dual
Quad
X-Y (Dot)
X-Y (Line)
SET
button to display the Status Screen.
Display Format
and select the
buttons.
Flashing cursor
Display and record as one graph.
Display and record as two graphs.
Display and record as four graphs.
Display and record the waveform as an X-Y (Dot)
Screen.
Display and record the waveform as an X-Y (Line)
Screen.
When the Dual or Quad display is selected, the channel to
be displayed in each screen partition can be set.
For details, refer to Section 7.3.2, and for the settings on
the X-Y Screen, refer to Section 4.4.
______________________________________________________________
4.3 Setting Items
Page 66

42
_____________________________________________________________________
4.3.5 Setting the Auto Save Function
When the function is enabled, measurement data are
automatically stored on PC card after they are captured.
This function stores a file in the directory currently selected
on the File Screen.
Procedure
(1) Select the data format for Auto Save.
Status Screen
SET
1. Press the
button to display the Status Screen.
2. Move the flashing cursor to
saving using the
OFF
Binary
Text
Auto save is disabled.
Data are stored as binary data.
Data are stored as text data.
Data stored in the text format is not readable by
the product.
buttons.
Auto Save
and select the type of
Flashing cursor
______________________________________________________________
4.3 Setting Items
Page 67

_____________________________________________________________________
43
(2) If using the A/B cursors on the screen, specify the
area to save.
Flashing cursor
Move the flashing cursor to the position shown in the
figure below and use the
keys to make a setting.
ALL
A-B
Store data for all captured waveforms.
If A cursor is in use, data is saved from the
cursor to the end of input.
If both A and B cursors are in use, data between
the cursors is saved.
(3) Enter the file name to be used for Auto Save.
Once the file name has been entered, measurement data is
automatically saved as the entered name.
When multiple files are saved in succession, numbers are
appended to the file name. If the file name entry is left
blank, the file name is automatically set as "AUTO,
AUTO0001", etc.
1. Move the flashing cursor to
File Name
and use the
buttons to display the Comment Entry Screen.
2. Move the cursor to the desired character to enter using the
buttons. For details, refer to Section 11.3.3.
Flashing cursor
______________________________________________________________
4.3 Setting Items
Page 68

44
_____________________________________________________________________
(4) Enable thinning.
When the text data format is selected, enable t hinning.
Move the flashing cursor to
Thin Out
and use the
buttons to make a setting.
Flashing cursor
NOTE
Data for the channel for which the waveform is displayed is
saved.
During measurement, if remaining PC card capacity runs low
enough for a warning message to appear, press the STOP button,
then remove the PC card once measurement ha s been suspended.
Data may be lost if the PC card is inserted or removed during
measurement.
Files will be saved in the currently selected directory.
______________________________________________________________
4.3 Setting Items
Page 69

_____________________________________________________________________
45
4.3.6 Setting the Print Mode
This mode is available when the 8992 PRINTER UNIT is
connected. Select whether to print measurement data as
waveform or numeric values.
Procedure
Status Screen
1. Press the
2. Move the flashing cursor to
select
Wave
Logging
3. Press the buttons to set
when
(1 division = 80 points) when
SET
button to display the Status Screen.
Print Mode
WaveorLogging
Prints measurement data as a waveform.
Select Smooth Print to print smoother
waveforms, but with slower print speed.
Print measurement data numerically.
Set the print interval.
Wave
is selected, or to set the print interval
using the buttons.
Smooth Print
Logging
and
Flashing cursor
to ON or OFF
is selected.
NOTE
______________________________________________________________
When "Wave" is selected, Smooth Print can be set only for the
Memory Recorder function. Instantaneous waveforms recorded
by the RMS Recorder can be smoothed.
When "Logging" is selected, if the print interval is set longer
than the record length, only the first point will print.
4.3 Setting Items
Page 70

46
_____________________________________________________________________
4.3.7 Setting the Auto Print Function
This function is available when the 8992
connected. Printout is carried out automatically after a
waveform has been captured for the specified recording
length.
Procedure
Status Screen
1. Press the
2. Move the flashing cursor to
using the
NOTE
OFF
ON
When cursor A and B are enabled, partial printing is executed.
For using the A/B cursors, refer to Section 9.1.
When the roll mode is enabled and the time-axis range is 10
ms/DIV to 5 min/DIV, data is displayed and printed
simultaneously.
The printer cannot be used with alkaline batteries: use either the
9418-15 AC ADAPTER (SA145A-1240V-6, SINO
AMERICAN) or 9447 BATTERY PACK when using the
printer.
SET
button to display the Status Screen.
buttons.
Disables the auto print.
Enables the auto print.
Auto Print
PRINTER UNIT
is
and set to ON or OFF
Flashing cursor
______________________________________________________________
4.3 Setting Items
Page 71

_____________________________________________________________________
47
4.4 Using the X-Y Waveform Plots (MEM)
X-Y combined plotting can be performed when the Display
Layout is set to X-Y display on the Status Screen. For the
8808-01, 8808-51 when the X axis is assigned to one
analog channel, up to three X-Y combined plots are
possible.
Voltage axis magnification/compression is active also when
using X-Y combined plotting.
Using the A/B cursors, it is possible to specify the data
between the cursors for partial plotting.
Procedure
Status/ Channel Screen
1. Press the
2. Move the flashing cursor to
X-Y DotorX-Y Line
(
3. Press the
SET
button to display the Status Screen.
Display Format
and select format
) using the buttons.
Flashing cursor
SET
button with the Status Screen displayed to
display the Channel Screen.
4
5
4. Select the display color using the buttons.
5. Move the flashing cursor to the channel to use as the X
axis, and select it using the
buttons.
Channels other than the one selected for the X axis are the
Y-axis channels.
______________________________________________________________
4.4 Using the X-Y Waveform Plots (MEM)
Page 72

48
_____________________________________________________________________
Partial X-Y plot
Using the A/B cursors, it is possible to specify a range for
partial X-Y plotting. Refer to Section 9.1. (Normal X-Y
plotting covers all data of the recording length.)
Procedure
Status/ Channel/ Waveform Screen
1. Display the input waveforms, except for the X-Y display.
2. Using the A/B cursors, specify the desired portion for
plotting.
SET
3. Press the
4. Select format (
button to display the Status Screen.
X-Y dotorX-Y line
) on the
Display Format
item.
5. On the Channel Screen, select the channel to use as the x
axis, using the
6. Press the
DISP
buttons.
button to display the Waveform Screen.
NOTE
______________________________________________________________
4.4 Using the X-Y Waveform Plots (MEM)
Partial X-Y plotting is disabled when using the horizontal
cursor.
When using only cursor A, X-Y combined plotting is applied
only to the range from cursor A to the end of the
measurement.
When the number of channels to be used is set to one, X-Y
combined plotting is not available.Refer to Section 4.8.1.
Page 73

_____________________________________________________________________
4.5 Waveform Screen Settings (MEM)
Settings for the Waveform Screen are described below. For
details, refer to Section 4.3.
49
Procedure
1 Function MEMORY/RECORD/RMS
2 Time axis range 200 μs to 5 min/DIV
3 Magnification/
4 Trigger mode SING/REP/AUTO
5 Pre-trigger 0 to 100, -95%
6 Waveform display
7 PC card indicator Appears when a PC card is installed
8 Power indicator Appears the type of power supply of the
Waveform Screen
1. Press the
button to display the Waveform Screen.
DISP
2. Move the flashing cursor to the item to be set.
3. Use the
1
2
Compression of the
time axis
area
buttons to make a setting.
34 5 67 8
x10 to x1/500
Full/partitioned display
(SRAM/ ATA/ FAX)
product or battery low mark.
NOTE
Input-related settings are accessible by pressing a channel select
button (CH1 to CH4) from the Waveform Screen. For details,
refer to Section 7.4.
______________________________________________________________
4.5 Waveform Screen Settings (MEM)
Page 74

50
_____________________________________________________________________
4.6 Auto Range Function
This function automatically selects the time axis range,
voltage axis and zero position (excluding when the setting
of input coupling is "CLAMP").
The time axis range is applied to the lowest numbered
channel with waveform display enabled, and is
automatically set to record 1 to 2.5 cycles on the Waveform
Screen.
Procedure
Waveform Screen
1. Press the
button to display the Waveform Screen.
DISP
2. Press both sides of the
seconds to activate auto-ranging.
3. Press the
START
to cancel. To cancel forcibly during auto-range operation,
press the
button. If measurement has started using the
STOP
auto-range function:
Conditions related to the input
channels
Voltage axis range, zero position:
Value set automatically
Magnification/compression ratio along
the voltage axis:
Single display x1
Other displays x1/2
Low-pass filter, Input coupling:
OFF, DC
Status conditions
Time axis range (time/div):
Value set automatically
(Magnification/compression ratio: x1
Sequential save: OFF
(all channels)
TIME/DIV
button for at least 2
button to execute, or press the
Trigger conditions (one channel only)
Trigger mode: AUTO
AND/OR for internal and external
triggers: OR
Pre-trigger: 20%
Internal trigger:
Enables only the waveform display
channel with the lowest number. (If
the difference between maximum and
minimum is 2 divisions or less, the
next channel is enabled.)
Trigger type : Level
Slope: rising
Trigger level: value set automatically
Filter: OFF
STOP
button
NOTE
When the auto-range function is engaged a trigger output signal
is generated. Take suitable precautions when using the autorange function concurrently with the trigger output connector.
______________________________________________________________
4.6 Auto Range Function
Page 75

_____________________________________________________________________
4.7 Start and Stop Operation (MEM)
51
Measurement
start
Trigger
conditions are
met
Recording data
SINGLE
Measurement
NOTE
REPEAT
Trigger
mode
end
Press the
START
LED lights in green. The
button to start measurement, and
START
button activation
condition can be selected. Refer to Section 10.1.1.
When pre-trigger is activated, the trigger is not
enabled until the specified pre-trigger data has been
read.("Pre-trig wait" is displayed.)
"Wait for trig" is displayed until the trigger condition
occurs.
Data recording starts when the trigger conditions are
met. When trigger mode is AUTO, the product waits
for about 1 second for trigger conditions to be met.
After this interval, data recording starts, regardless of
trigger state.
During recording, "Storing" is displayed.
When the Roll mode is enabled, measurement data is
displayed (scrolling) as it is recorded. When automatic
printing is also enabled, data prints at the same time it
is displayed.
Measurement can be aborted by pressing the
STOP
button twice during measurement.
Then the waveform data until the
STOP
button is
pressed is displayed and saved. When the auto saving
is enabled, the data until a forced termination is
automatically saved. (automatic printing will not
AUTO
execute)
Trigger mode: REP/AUTO
Activates the trigger waiting condition. Input resumes
when the trigger conditions are met.
STOP
Trigger mode: SING
Measurement can be aborted by pressing the
STOP
button twice (automatic printing will not execute).
Trigger mode: REP/AUTO
During measurement, pressing the
STOP
button once
records up to the set recording length (waveform
display, printing and auto-save are executed).
Measurement can be aborted by pressing the
STOP
button twice (automatic printing will not execute).
If measurement is aborted after a trigger event occurs, waveform
data up to the abort are retained. However, no data is retained if
measurement is aborted before a trigger event. If the trigger
mode is Continuous or Auto, and waveforms remain from a
previous trigger event, the waveforms are displayed (excluding
maximum recording length).
______________________________________________________________
4.7 Start and Stop Operation (MEM)
Page 76

52
_____________________________________________________________________
4.8 Extended Status Screen Setup (MEM)
Application settings can be made in Memory recorder
function on the Extended Status Screen.
Procedure
Status Screen
1. Press the
2. Move the flashing cursor to
button to display the Status Screen.
SET
Extended Status
... and press the
buttons to display the Extended Status Screen.
Flashing cursor
3. To return to the Status Screen, move the flashing cursor to
Back
, and press the buttons or
SET
button.
Flashing cursor
______________________________________________________________
4.8 Extended Status Screen Setup (MEM)
Page 77

_____________________________________________________________________
53
4.8.1 Channel Usage Settings
Set segmenting of measurement data memory.
The record length can be made longer when using fewer
channels.
Procedure
Extended Status Screen
1. Press the
2. Move the flashing cursor to
Extended Status Screen using the
3. Move the flashing cursor to
using the
1CH
2CH
4CH
button to display the Status Screen.
SET
Extended Status
and display the
buttons.
Use Channel
and select channel
buttons.
Flashing cursor
Internal memory is allocated to channel 1, so
measurement data on channels 2 and above
cannot be stored to internal memory. Only
Channel A can be used for logic.
Internal memory is allocated to channel 1 and 2, so
measurement data on channels 3 and above cannot
be stored to internal memory. Channels A and B
can be used for logic.
Internal memory is allocated for the four channels
(Model 8808-01, 8808-51).
Channels A and B can be used for logic.
______________________________________________________________
4.8 Extended Status Screen Setup (MEM)
Page 78

54
_____________________________________________________________________
4.8.2 Setting the Roll Mode
This mode can be used at a time axis range setting of 10
ms/DIV to 5 min/DIV. When roll mode is set to ON, the
waveform is displayed immediately at the start of recording
(the screen scrolls).
When the 8992 PRINTER UNIT is connected and the Roll
Mode and Auto Print are enabled, printing occurs
concurrently with waveform display.
Procedure
NOTE
Extended Status Screen
1. Press the
2. Move the flashing cursor to
Extended Status Screen using the
3. Move the flashing cursor to
using the
OFF
ON
Disables the roll mode.
Enables the roll mode.
Even if set to ON, the Roll Mode is inoperative when the time
axis range is set faster than 10 ms/div.
When Roll mode is set to ON, the settings for sequential saving
is automatically turned OFF.
button to display the Status Screen.
SET
Extended Status
Roll Mode
and set to ON or OFF
buttons.
and display the
buttons.
Flashing cursor
______________________________________________________________
4.8 Extended Status Screen Setup (MEM)
Page 79

_____________________________________________________________________
g)
4.8.3 Sequential Save Function
This function divides the memory into separate blocks, each
of which can be used for waveform recording.
Input signal capture is carried out continuously using the
trigger, storing waveform data successively in each block.
During recording, no display or printout is carried out.
This reduces dead time (non-sensitivity periods due to
display and printing delays).
When continuous print (auto print) is being performed in
REPEAT trigger mode
Recordinglength Recordinglength Recordinglength
Briefphenomena maynot register
55
Using sequential save
Recordinglength Recordinglength Recordinglength
Data are divided into blocks and recorded in memory.
Dead time: (interval in which no sampling occurs due to display
andprintprocessin
Recordinglength
______________________________________________________________
4.8 Extended Status Screen Setup (MEM)
Page 80

56
_____________________________________________________________________
Sequential Save Setting Procedure
START
Extended Status Screen
Select ON/OFF
Set the Recording Length
Set the Number of Divisions
Select Subsequent
Waveform Display
Select the Display Block
Select the Starting Block
Select the End Block
END
Display the Extended Status Screen.
Select whether to enable Sequential Save.
Set the per-block recording length.
Set the number of memory blocks.
Select whether waveforms should be
displayed on screen after recording to each
block.
Select which blocks to display on screen
after measurement.
Select the block at which to start
measurement.
Select the block at which to end
measurement.
Press the SET button to return to the Status
Screen.
NOTE
Dead time during which no further data is sampled, in order to
permit display and recording after the acquired data is recorded
to one block, is about 4 ms.
Dead time, however, may slightly fluctuate by key operation.
While the roll mode is being used in memory recorder function
(on the Extended Status Screen), the sequential save function is
disabled.
______________________________________________________________
4.8 Extended Status Screen Setup (MEM)
Page 81

_____________________________________________________________________
57
Procedure
Extended Status Screen (MEM)
(1) Display the Extended Status Screen.
1. Press the
2. Move the flashing cursor to
button to display the Status Screen.
SET
Extended Status
... and press the
buttons to display the Extended Status Screen.
Flashing cursor
(2) Enable or disable the sequential saving function.
Move the flashing cursor to
or OFF using the
Sequential Save
buttons.
and set to ON
Flashing cursor
______________________________________________________________
OFF
ON
Disables the sequential save function.
Enables the sequential save function.
4.8 Extended Status Screen Setup (MEM)
Page 82

58
_____________________________________________________________________
(3) Set the recording length.
Shot
Move the flashing cursor to
length using the
buttons.
and set the recording
Flashing cursor
When setting the recording length for Sequential Save, the
recording length setting (on the Status Screen) is
automatically set to the same length.
The variable recording length can be set. Refer to Section
4.3.3.
(4) Set the number of divisions
Move the flashing cursor to
Divide
and use the buttons
to make a setting.
Flashing cursor
______________________________________________________________
4.8 Extended Status Screen Setup (MEM)
Page 83

_____________________________________________________________________
The recording length and maximum number of divisions are
automatically determined according to the number of
available channels, as shown in the tables below. Refer to
Section 4.8.1 for details.
Maximum number of divisions
59
Recording channels
length (DIV)
Number of
1 2 4
20 32 32 32 16
50 32 32 16 8
100 32 16 8 4
200 16 8 4 2
400 8 4 2 --800 4 2 --- ---
1600 2 --- --- ---
*This shows the number of divisions for the instantaneous
waveform recording (Memory Recording) of the RMS Recorder
function.
Instantaneous
waveform
recording *
(5) Follow-up waveform display
Enabling Subsequent Waveform Display causes the
waveforms that were input to each block following a trigger
event during Sequential Save to be displayed one by one
(resulting in longer dead time).
Move the flashing cursor to
using the
______________________________________________________________
OFF
ON
After all blocks are recorded, the waveform of the last
block only is displayed.
Each block is recorded and displayed.
buttons.
4.8 Extended Status Screen Setup (MEM)
Following
and set to ON or OFF
Flashing cursor
Page 84

60
_____________________________________________________________________
(6) Set the block to be displayed.
Move the flashing cursor to
to be displayed using the
Display Block
buttons to make a setting.
and set the block
Flashing cursor
After measurement starts, the displayed block is updated by
the recorded block. When measurement is completed, the
most recently recorded block is displayed.
(7) Set the first block
Move the flashing cursor to
block to be displayed using the
______________________________________________________________
4.8 Extended Status Screen Setup (MEM)
Start Block
and set the first
buttons.
Flashing cursor
Page 85

_____________________________________________________________________
61
(8) Set the last block
Move the flashing cursor to
to be displayed using the
End Block
buttons.
and set the last block
Flashing cursor
(9) Finishing sequential save setting
Back
When finished setting, move the flashing cursor to
press the
buttons or
button to return to the Status
SET
and
Screen.
Flashing cursor
(10) Stored block display procedure
Extended Status Screen
1. Move the flashing cursor to
2. Specify the block to be displayed using the
The blocks shown by
Display Block
.
buttons.
indicate that measured data has
been saved to the blocks.
______________________________________________________________
4.8 Extended Status Screen Setup (MEM)
Page 86

62
_____________________________________________________________________
3. Press the
button to display the Waveform Screen. The
DISP
data specified by step 2 is displayed.
Flashing cursor
Display block, date,
time, and time axis
range are displayed
when the trigger
occurs.
Waveform Screen
1. Press the
button to display the Waveform Screen.
DISP
2. Press a Channel Select button (CH1 to CH4) to display the
block allocation status.
The blocks shown by
indicate that measured data has
been saved to the blocks.
3. Move the flashing cursor to position 1 and specify the
block to be displayed, or use the Cursor buttons to specify
the block 2 and press the
buttons to display the
waveform in the specified block.
1
2
______________________________________________________________
4.8 Extended Status Screen Setup (MEM)
Page 87

_____________________________________________________________________
Relation between trigger mode and sequential save function
63
Measurement
start
First block
Last block
Waveform display
Auto saving
Auto print
SINGLE
Trigger
mode
REPEAT
AUTO
STOP
Press the
START
button to start measurement, and
LED lights in green. Data recording starts when trigger
conditions are met.
First block is stored by trigger setting.
The following waveform display ON:
waveform is displayed.
The following waveform display OFF:
waveform is not displayed.
Last block is stored by trigger setting.
The following waveform display ON:
waveform is displayed.
The following waveform display OFF:
waveform is not displayed.
Displays last block waveform.
When auto saving is enabled, waveforms in all blocks
are saved in a batch.
When auto printing is enabled, all blocks are printed
from the first block while individual blocks are
displayed.
Trigger mode: REP/AUTO
Activates the trigger waiting condition. Input resumes
when the trigger conditions are met.
Trigger mode: SING
STOP
button once
Measurement
end
Measurement can be aborted by pressing the
button twice (automatic printing will not execute).
Trigger mode: REP/AU TO
During measurement, pressing the
STOP
records up to the end of the block (waveform display,
printing and auto-save are executed).
Measurement can be aborted by pressing the
STOP
button twice (automatic printing will not execute).
______________________________________________________________
4.8 Extended Status Screen Setup (MEM)
Page 88

64
yp
_____________________________________________________________________
4.9 Numerical Calculation (Measurement)
Numerical calculations apply to recording by the Memory
Recorder and Instantaneous waveform recording in RMS
Recorder. Results of calculations are displayed numerically
(by printing or saving). Waveforms stored by the
Instantaneous waveform recording in RMS Recorder are
calculated using the Memory Recorder function. When the
A/B cursors are used, calculations are performed on the
data between the cursors.
The following eleven types of calculations can be
performed.
(1) Average value (2) Peak-to-peak value (3) Maximum value
(4) Time to maximum value (5) Minimum value
(6) Time to mini mum value (7) Rms value
(8) Period (9) Frequency (10) Area value
(11) XY area value
Settings Screen
Display
ON/OFF Setting
Calculation Selection
Channel Selection
for Calculation
Print Calculation
Results
Save Calculation
Results
Calculation
Execution
Displaythe Numerical calculation Screen.
OFF
ON
Average
Average
Average
Average
Value
Value
Value
Value
CH1
CH1
CH1
OFF
ON
OFF
ON
New Data
Existing
Data
Numerical calculation is not performed.
Numerical c alculation is performed.
Up to four simultaneous calculations
(numbered 1 to 4) can be set.
Channels which are disabled for
displaying and recording are also
disabled for calculations.
Calculation results are not printed.
Calculation results are printed.
Calculation results are not saved to PC
card.
Calculation results are saved to PC card.
Display the Waveform Screen, and press
the START button to start calculations.
Waveform input data is subject to
calculation.
Calculation is applied to the waveform
data in internal memory. Move the
flashing cursor to Execute, and execute
ressingthe buttons.
b
______________________________________________________________
4.9 Numerical Calculation (Measurement)
Page 89

_____________________________________________________________________
65
Procedure
Measurement Screen
(1) Display the Measurement Screen.
SET
1. Press the
2. Move the flashing cursor to
Numerical calculation Screen using the
button to display the Status Screen.
Measurement
and display the
buttons.
Flashing cursor
(2) Set the numerical calculation to on or off.
Move the flashing cursor to
off using the
buttons.
Measurement
and set to on or
Flashing cursor
______________________________________________________________
OFF
Disables the numerical calculation.
ON
Enables the numerical calculation.
4.9 Numerical Calculation (Measurement)
Page 90

66
_____________________________________________________________________
(3) Select the numerical calculation to perform.
Up to four simultaneous calculations (numbered 1 to 4) can
be set.
Move the flashing cursor to the items (No.1 to No.4) to be
set and select the item to be calculated using the
buttons.
Flashing cursor
(4) Select the channels for numerical calculation.
Move the flashing cursor as shown in the figure below and
set the channel using the
______________________________________________________________
4.9 Numerical Calculation (Measurement)
ALL
CH1 to CH4
Perform calculations on all channels.
Perform calculations only on the selected channels.
buttons.
Flashing cursor
Page 91

_____________________________________________________________________
67
(5) Set whether to print calculation results after
display.
Move the flashing cursor to
using the
buttons.
Print Result
and set to on or off
Flashing cursor
OFF
ON
(6) Set whether to save calculation results to a PC
card after display.
Move the flashing cursor to
using the
OFF
ON
Calculation results are not printed.
Calculation results are printed.
Save Result
and set to on or off
buttons.
Flashing cursor
Calculation results are not saved.
Calculation results are saved to PC card in the text
format.
Data stored in the text format is not readable by the
product.
______________________________________________________________
4.9 Numerical Calculation (Measurement)
Page 92

68
_____________________________________________________________________
(7) Execute numerical calculation (with existing data)
Calculates the data stored in memory and read from a PC
card.
Move the flashing cursor to
Execute
and use the
buttons to make a setting.
Flashing cursor
Operational Example of Numerical Calculation
Partitioning Display
NOTE
Full Screen Display
Refer to Section 9.5 for information about waveform display
area setting.
Numerical calculation results cannot be displayed when the
Settings window is open on the Waveform Screen: press the
Channel select button (CH1 to CH4) to close the Settings
window to display calculation results.
______________________________________________________________
4.9 Numerical Calculation (Measurement)
Page 93

_____________________________________________________________________
69
Numerical Calculation with New Data
NOTE
From the Waveform Screen, press the
START
button to
begin measurement. Data input begins when trigger
conditions are met. After the specified data record amount
is input, numerical calculation starts, and when calculation
is finished the results are displayed. If printing or saving of
calculation results has been enabled, those processes
execute.
When starting to input subsequent data, the previous data is
cleared.
The calculation area can be specified by the A/B cursors. If only
cursor A is used, the calculation area extends from the cursor to
the end of the measurement data. The (horizontal) line cursor is
not used to specify calculation area.
When both numerical calculation and sequential save are
enabled at the same time, calculation starts after sequential save
finishes. All blocks are processed by the calculation, so the
calculation result is refreshed and the final calculation result is
that of the last block. To view the results of all calculations,
enable printing or saving of the calculation results.
______________________________________________________________
4.9 Numerical Calculation (Measurement)
Page 94

70
_____________________________________________________________________
______________________________________________________________
4.9 Numerical Calculation (Measurement)
Page 95

_____________________________________________________________________
71
Chapter 5
Recorder Function
1
2
3
5.1 Overview of the Recorder Function
The recorder function has the following features.
(1) Real time display and printing of the input signal
(2) Real time continuous recording of the input signal
(3) All input channel data are recorded on the same time axis.
Since data for all channels can be superimposed, the relative
relationship between input signals can be observed visually.
(4) Time axis setting
100 ms/DIV to 1 h/DIV (14 steps)
(5) Time axis resolution 80 points/DIV (printer)
(6) Sampling period 2.5 μsfixed
(7) Waveform magnification/compression display and printout
Time axis direction: x1tox1/500
Voltage axis direction: x10 to x1/2 (single)
(8) Display layout
Time axis waveform: single, dual, and quad displays
X-Y waveform: single display (dot/line)
(9) Storage capacity
400 divisions of the data are stored in memory.
(10) Logging function
Numeric printout of waveform data
(11) Reprinting capability
The last 400-division quantity of data is stored in memory,
and can be printed repeatedly.
4
5
6
7
8
9
10
11
12
13
14
______________________________________________________________
5.1 Overview of the Recorder Function
15
APP
IND
Page 96

72
_____________________________________________________________________
5.2 Operation Sequence (REC)
Recorder operating procedures are described by the
following flowcharts.
Preparation
Settings on the Status Screen
Settings on the Status Screen
Function
Time axis range
Recording length
Display layout
Auto save
Printer recording format
Print function
Display Clear
Refer to Chapter 2
Press the SET button to
display the Status Screen.
Refer to section 5.3.
Select RECORD (recorder function).
Set the speed with which the input signal
waveform is captured.
Set the length of the data sample
for a single measurement.
Select the layout of the Waveform Screen
and for printing.
Select whether data is automatically saved.
Select whether measurement data is to be
printed as a waveform or numerically.
Select whether or not to print out
simultaneously with screen display.
During continuous XY measurement, clear
the waveforms of the previous screen. This
setting is enabled when setting the XY
Screen.
SET
Requires connection of the optional 8992 PRINTER
UNIT.
______________________________________________________________
5.2 Operation Sequence (REC)
Page 97

_____________________________________________________________________
73
1
Settings on the Channel Screen
Settings on the Channel Screen
Channel Screen
Scaling Screen
Conversion ratio method
2-point method
Settings on the Trigger Screen
Settings on the Trigger Screen
Start measurement
Press the START button to start measurement.
To avoid inadvertent measurements, the START button
activation condition can be selected. Refer to Section 10.1.1,
for details.
Zero adjustment is performed automatically for every
measurement.
Press the SET button to
display the Channel Screen.
Set the waveform display color,
voltage axis range, zero position,
etc. Refer to Chapter 7 for details.
The scaling function can be used to
convert the output voltage
from a sensor, for example, to a
physical property of the measured
object.
Refer to Section 7.5.
Press the SET button to
display the Trigger Screen.
Set the trigger source, type and
condition, and pre-trigger condition.
Refer to Chapter 8.
SET
SET
START
2
3
4
5
6
7
8
9
10
11
12
______________________________________________________________
5.2 Operation Sequence (REC)
13
14
15
APP
IND
Page 98

74
_____________________________________________________________________
5.3 Setting Items
5.3.1 Setting the Function Mode
The 8807-01, 8808-01 has three function modes.
Additionally, the 8807-51, 8808-51 also offers a harmonic
wave analysis function. Select the Recorder function.
Procedure
Status, Channel, Trigger Screen
1. Press the
SET
button to display the Status, Channel, or
Trigger Screen.
2. Move the flashing cursor to the position shown in the
figure below and select
Recorder Function Description
Input signals converted to digital data are displayed and printed in real
time (when the 8992 PRINTER UNIT is connected).
When measurement is finished, the last 400-division quantity is stored in
internal memory, so reverse scroll viewing and reprinting are possible.
RECORD
Flashing cursor
using the buttons.
Recording paper
Stored in internal memory
______________________________________________________________
5.3 Setting Items
(400 DIV)
Display
Page 99

_____________________________________________________________________
75
5.3.2 Setting the Time Axis Range
1
Procedure 1
Procedure 2
Set the speed for inputting and storing the waveform of the
input signal. Time axis range setting expresses the time for
1 division. The sampling period is fixed to 2.5 μs (400
kS/s).
Status Screen
1. Press the
2. Move the flashing cursor to
axis range using the
Pressing the
automatically to the Time Axis position for setting.
Waveform Screen
1. Press the
2. Move the flashing cursor to the position shown in the
figure below and use the
SET
button to display the Status Screen.
Time/DIV
buttons.
TIME/DIV
DISP
button to display the Waveform Screen.
button moves the flashing cursor
buttons to make a setting.
and select the time
Flashing cursor
The data interval for the
time axis range setting is
1/80 (1 division=80 data
points).
2
3
4
5
6
7
8
9
10
11
12
Flashing cursor
Pressing the
the flashing cursor position.
______________________________________________________________
TIME/DIV
button sets the time axis regardless of
5.3 Setting Items
13
14
15
APP
IND
Page 100

76
_____________________________________________________________________
5.3.3 Setting the Recording Length
The length of recording for one measurement operation
(number of division) can be set.
Constant recording length mode
Variable recording length mode
be selected by the user.
Status Screen
Procedure1 Constant recording length mode
1. Press the
SET
button to display the Status Screen.
2. Move the flashing cursor to
length using the
: Select the recording length.
: Variable recording length can
Shot
and select the recording
buttons.
Flashing cursor
NOTE
______________________________________________________________
5.3 Setting Items
When the recording length is set to Cont., the last 400-division
quantity is stored in internal memory.
Stored in Internal Memory
(400 DIV)
 Loading...