

Page 1

Instruction Manual
8715-01
POWER HiCORDER
January 2009 Revised edit ion 9 8714A981-09 09-01H
Page 2

Page 3

Contents
Introduction i
Inspection i
Safety Notes iv
Notes on Use viii
Chapter 1 Product Overview 1
1.1 Major Features 1
1.2 Identification of Controls and Indicators
Chapter 2 Installation and Preparation 7
2.1 Installation of the Unit 7
2.2 Power Supply and Ground Connection
2.2.1 Connecting the AC Adapter 8
2.2.2 Installing the 9447 BATTERY PACK
2.3 Power On/Off 11
2.4 Connection of the Connection Cord
2.5 Connecting the 9322 DIFFERENTIAL
PROBE
2.6 Connecting the Clamp on Probe
2.7 Loading Recording Paper
2.8 Care of Recording Paper
2.9 Attaching the Strap
12
14
16
20
22
23
2
8
9
Chapter 3 Waveform Measurement Mode 25
3.1 Outline of the Waveform Measurement
Mode
3.2 Operation Sequence (Waveform)
3.3 Setting Items (Waveform)
3.3.1 Setting the Measurement Mode 28
3.3.2 Setting the Time Axis Range
3.3.3 Setting the Recording Length
3.3.4 Setting the Auto Print Function
25
27
28
29
30
31
Page 4

3.4 Input Channel Setting (Waveform) 32
3.4.1 Setting the Input Mode 32
3.4.2 Setting the Measurement Range
3.4.3 Setting the Waveform Position
3.4.4 Setting the Low-Pass Filter
3.4.5 Setting the Waveform Display
3.4.6 Setting the Zoom
33
34
35
36
37
3.5 Trigger Functions 38
3.5.1 Level Trigger 40
3.5.2 Window-In/Out Trigger
3.5.3 Voltage Drop Trigger
3.5.4 Period Trigger
3.5.5 Waveform Detection Trigger
3.5.6 Setting the Pre-Trigger
3.5.7 Input Level Monitor Function
43
45
47
51
54
55
3.6 Waveform Display Screen Settings 56
3.7 Start and Stop Operation (Waveform)
3.8 Sequential Save Function
57
58
Chapter 4 RMS Trend Measurement Mode 59
4.1 Outline of the RMS Trend Measurement 59
4.2 Operation Sequence (Trend)
4.3 Setting Items (Trend)
4.3.1 Setting the Measurement Mode 61
4.3.2 Setting the Time Axis Range
4.3.3 Setting the Frequency
4.3.4 Setting the Printer (Real Time Printing)
4.4 Input Channel Setting (Trend) 66
4.4.1 Setting the Input Mode 66
4.4.2 Setting the Measurement Range
4.4.3 Setting the Waveform Position
4.4.4 Setting the Low-Pass Filter
4.4.5 Setting the Waveform Display
4.4.6 Setting the Print Value
4.4.7 Setting the Zoom
60
61
63
64
65
67
68
70
71
72
73
Page 5

4.5 Instantaneous Waveform Recording
(Memory Record)
4.5.1 Setting the Instantaneous Waveform
Recording
4.5.2 Setting the Instaneous Waveform Trigger
4.5.3 RMS Level Trigger
4.5.4 RMS Window-In/Out Trigger
4.5.5 Voltage Drop Trigger
4.5.6 Setting the Pre-Trigger
4.5.7 Instantaneous Waveform Recording Display
Procedure
74
74
77
79
81
83
85
86
4.6 Waveform Display Screen Settings 88
4.7 Start and Stop Operation (Trend)
89
Chapter 5 Advanced Functions 91
5.1 Using the A/B Cursors 92
5.2 Scrolling the Waveform
5.3 Magnification/compression Ratio Along the
Time Axis
5.4 DMM Function
5.5 Key Lock Function
5.6 External Trigger Function
5.7 Trigger Output Terminal
95
96
97
98
99
101
Chapter 6 Advanced Settings 103
6.1 Environment Settings 104
6.1.1 Start Backup 104
6.1.2 Grid Type
6.1.3 LCD Saver
6.1.4 Display Color
6.1.5 Language
6.1.6 List & Gauge
6.1.7 Screen Copy Output Destination
105
106
107
108
109
110
Page 6

6.2 Using the Previous State Settings 112
6.2.1 Storing Settings 112
6.2.2 Loading Previously Saved State Settings
6.2.3 Deleting saved state settings
6.2.4 Auto Setting
114
115
116
6.3 Initialize Screen Settings 117
6.3.1 Setting the Clock 117
6.3.2 Clearing the Waveform Data
6.3.3 System Reset
6.3.4 Self-check
118
119
120
6.4 Extended Setting 122
6.4.1 Auto Save Settings 122
6.4.2 Sequential Save Function
125
Chapter 7 Printout of Measurement Data 127
7.1 Printing Procedure 128
7.1.1 Manual Print 128
7.1.2 Auto Print (Waveform)
7.1.3 Real Time Print (Trend RMS Recording)
7.1.4 Partial Print
7.1.5 Screen Copy
7.2 Example of Printer Output 134
129
130
132
133
Chapter 8 Storing the Measurement Data 135
8.1 PC Card 136
8.2 Using the PC Card Slot
8.3 Settings on the File Screen
8.3.1 Loading the Data 138
8.3.2 Saving Measurement and Setting Data
8.3.3 Entering the File Name
8.3.4 Deleting the Files and Directories
8.3.5 Creating the Directory
8.3.6 Initializing
8.3.7 Changing the Names of Files and
Directories
137
138
142
148
151
152
154
155
Page 7

Chapter 9 Specifications 157
9.1 General Specifications 157
9.2 Analog Inputs
9.3 Measurement Modes
9.4 Others
160
163
166
Chapter 10 Maintenance and Service 167
10.1 Changing the 9447 BATTERY PACK 168
10.2 Recharging the 9447 BATTERY PACK
170
10.3 Removing the Battery Before Discarding
the Instrument
10.4 Cleaning the Printer Head
10.5 Troubleshooting
10.6 Cleaning of the Instrument
171
172
173
174
Chapter 11 Appendix 175
11.1 Messages 175
11.2 RMS Value
11.3 Text File Internal Format
11.4 Waveform Viewer (Wv)
11.4.1 Starting the Waveform Viewer 181
11.4.2 Waveform Viewer Menus
11.4.3 Using the Waveform Viewer
11.4.4 Conversion to CSV Format
11.4.5 Converting Multiple Waveform Files into
CSV Files
177
178
180
182
184
188
190
Index INDEX 1
Page 8

Page 9

_____________________________________________________________________
Introduction
Thank you for purchasing the HIOKI "8715-01 POWER
HiCORDER." To obtain maximum performance from the
instrument, please read this manual first, and keep it handy
for future reference.
Inspection
When you receive the instrument, inspect it carefully to
ensure that no damage occurred during shipping. If damage
is evident, or if it fails to operate according to the
specifications, contact your dealer or Hioki representative.
Accessories
i
Instruction Manual
Measurement Guide
Application Disk (CD)
Strap
9234 RECORDING PAPER
Attachment (for printer)
9418-15 AC ADAPTER
AMERICAN)
1
(SA145A -1240 V-6, SINO
9197 CONNECTION CORD
______________________________________________________________
1
1
1
1
1
1
4
Inspection
Page 10

ii
_____________________________________________________________________
Options
Cord, Adapter
9199 CONVERSION ADAPTOR (BNC-Banana female)
9217 CONNECTION CORD (BNC-BNC)
(maximum input voltage: 300 V AC/DC)
9322 DIFFERENTIAL PROBE
(maximum input voltage: CAT ll: 1000 VAC, 2000 VDC,
CAT lll: 600 VAC, DC)
9094 OUTPUT CORD
(for connecting with the 3283, 3284, and 3285)
Clamp
9010-10 CLAMP ON PROBE
(10 A to 500 A, 40 Hz to 1 kHz)
9018-10 CLAMP ON PROBE
(10 A to 500 A, 40 Hz to 3 kHz)
9132-10 CLAMP ON PROBE
(20Ato1000A,40Hzto1kHz)*1
3283 CLAMP ON LEAK HiTESTER
(10 mA to 200 A 40 Hz to 2 kHz)*2
3284 CLAMP ON AC/DC HiTESTER
(20Ato500A 40Hzto2kHz)*2
3285 CLAMP ON AC/DC HiTESTER
(20Ato500A 40Hzto3kHz)*2
PC Card
9626 PC CARD 32M
9627 PC CARD 64M
9726 PC CARD 128M
9727 PC CARD 256M
9728 PC CARD 512M
9729 PC CARD 1G
*1: This device is not approved for CE marking.
*2: This device requires the 9094 OUTPUT CORD (sold
separately).
______________________________________________________________
Inspection
Page 11

_____________________________________________________________________
iii
Others
9335 WAVE PROCESSOR
9418-15 AC ADAPTER (SA145A-1240V-6, SINO
AMERICAN)
9447 BATTERY PACK (7.2 V/2450 mAh)
9643 CHARGE STAND
9391 CARRYING CASE
9234 RECORDING PAPER
(18 m/59.06 feet, 112 mm width)
220H PAPER WINDER *1
*1: This device is not approved for CE marking.
______________________________________________________________
Inspection
Page 12

iv
R
_____________________________________________________________________
SafetyNotes
This instrument is designed to conform to IEC 61010
Safety Standards, and has been thoroughly tested for
DANGE
Safety Symbols
safety prior to shipment. However, mishandling
during use could result in injury or death, as well as
damage to the instrument. Be certain that you
understand the instructions and precautions in the
manual before use. We disclaim any responsibility for
accidents or injuries not resulting directly from
instrument defects.
This manual contains information and warnings essential
for safe operation of the instrument and for maintaining it
in safe operating condition. Before using the instrument,
be sure to carefully read the following safety notes.
The symbol printed on the instrument indicates that
the user should refer to a corresponding topic in the
manual (marked with the
relevant function.
symbol) before using the
In the manual, the symbol indicates particularly
important information that the user should read before
using the instrument.
Indicates the ON side of the power switch.
Indicates the OFF side of the power switch.
Indicates both DC (Direct Current) and AC (Alternating
Current).
Indicates DC (Direct Current).
______________________________________________________________
Safety Notes
Page 13

_____________________________________________________________________
R
The following symbols in this manual indicate the relative
importance of cautions a nd warnings.
Indicates that incorrect operation presents an extreme
v
DANGE
WARNING
CAUTION
NOTE
hazard that could result in serious injury or death to
the user.
Indicates that incorrect operation presents a
significant hazard that could result in serious injury or
death to the user.
Indicates that incorrect operation presents a
possibility of injury to the user or damage to the
instrument.
Advisory items related to performance or correct
operation of the instrument.
______________________________________________________________
Safety Notes
Page 14

vi
_____________________________________________________________________
Measurement categories (Overvoltage categories)
This instrument complies with CAT II safety requirements.
To ensure safe operation of measurement instruments,
IEC61010 establishes safety standards for various electrical
environments, categorized as CAT I to CAT IV, and called
measurement categories. These are defined as follows.
CAT l
Secondary electrical circuits connected to an
AC electrical outlet through a transformer or
similar device.
CAT ll
CAT lll
CAT lV
Primary electrical circuits in equipment connected to
an AC electrical outlet by a power cord (portable
tools, household appliances, etc.)
Primary electrical circuits of heavy equipment (fixed
installations) connected directly to the distribution
panel, and feeders from the distribution panel to
outlets.
The circuit from the service drop to the service
entrance, and to the power meter and primary
overcurrent protection device (distribution panel).
Higher-numbered categories correspond to electrical
environments with greater momentary energy. So a
measurement device designed for CAT III environments can
endure greater momentary energy than a device designed
for CAT II.
Using a measurement instrument in an environment
designated with a higher-numbered category than that for
which the instrument is rated could result in a severe
accident, and must be carefully avoided.
Never use a CAT I measuring instrument in CAT II, III, or
IV environments.
The measurement categories comply with the Overvoltage
Categories of the IEC60664 Standards.
______________________________________________________________
Safety Notes
Page 15

_____________________________________________________________________
vii
Accuracy
We define measurement tolerances in terms of f.s. (full
scale), rdg. (reading) and dgt. (digit) values, with the
following meanings:
f.s.
(maximum display value or scale length)
The maximum displayable value or the full length of the
scale.
This is usually the maximum value of the currently
selected range.
rdg.
(reading or displayed value)
The value currently being measured and indicated on the
measuring instrument.
dgt.
(resolution)
The smallest displayable unit on a digital measuring
instrument, i.e., the input value that causes the digital
display to show a "1".
______________________________________________________________
Safety Notes
Page 16

viii
R
_____________________________________________________________________
Notes on Use
Follow these precautions to ensure safe operation and to
obtain the full benefits of the various functions.
To avoid electric shock and damage to the instrument, do not
DANGE
apply more than 450 V AC or DC between the analog inputs
and instrument, or between the analog inputs.
Use only the supplied 9418-15 AC adapter (SA145A-1240V-6,
SINO AMERIC A N). AC adapter input voltage range is 100 to
240 VAC (with
10% stability) at 50/60 Hz. To avoid electrical
hazards and damage to the instrument, do not apply voltage
outside of this range.
To avoid damaging the instrument, do not apply voltage
exceeding the selected range to the input terminals, and never
exceed the maximum ratings for the analog input connection
cable or probe shown in the following table. In addition to
these limits, note that the absolute maximum analog input
voltage is 450V AC/DC.
Input/output terminal Maximum input voltage
Analog input 450 V AC, DC
EXT TRIG -5 V to +10 V
TRIG OUT -20Vto+30V
500 mA max, 200 mW max
Maximum input voltage
9197 CONNECTION CORD 500 V AC, DC
9217 CONNECTION CORD 300 V AC, DC
9448 CONSENT INPUT
CORD
9322 DIFFERENTIAL PROBE 1000 V AC, 2000 V DC (CAT ll)
125 V
600 V AC, DC (CAT lll)
For battery operation, use only the Hioki Model 9447
WARNING
BATTERY PACK. We cannot accept responsibility for
accidents or damage related to the use of any other
batteries.
NOTE
The 8715-01 POWER HiCO R DERs are not affected by a drop in
power lasting 40 ms or less. However, a drop in power lasting
more than 40 ms may interrupt the power supply. Check the
power supply conditions at the installation site in advance.
______________________________________________________________
Notes on Use
Page 17

_____________________________________________________________________
1
Chapter 1
Product Overview
1.1 Major Features
(1) Two Power Monitoring Modes
・ The Waveform Measurement Mode measures the
waveform level of commercial power lines.
・ The RMS Trend Measurement Mode records the trend in
the rms value of power line levels over a long term.
(2) Attached printer simultaneously prints measured waveforms
instantaneously on site.
(3) Current Measurement Capabilities
Current measurements capabilities are available when using
our clamp sensors, with which current values can be read
directly.
(4) Isolated Analog Inputs Satisfy Safety Concerns
・ The four channels of the 8715-01 are completely isolated
from the instrument's ground (GND), allowing worry-free
connections to points of independent potential.
・ Accepts direct connection to and measurement of 400V
lines.
______________________________________________________________
1.1 Major Features
Page 18

2
_____________________________________________________________________
1.2 Identification of Controls and
Indicators
2 31
4
5
6
9
10
11
12 13
14
15
16
17
7
8
______________________________________________________________
1.2 Identification of Controls and Indicators
Page 19

_____________________________________________________________________
3
1. SET key
2. CH SET key
3. DISP key
4. PRINT key
5. COPY key
6. FEED key
7. DMM key
8. CARD key
9. / keys
10. Cursor keys
11. Scroll keys
12. CH1 - CH4
keys
13. RANGE key
14. POSN key
15. TIME/DIV
key
16. START key
17. STOP key
Selects the Basic Setting screen.
Selects the CH SETTING screen.
Selects the Waveform Display screen.
Serves to print out stored waveforms.
Serves to print out a copy of the current
screen display.
Causes the printer paper to advance for
as long as the key is pressed.
Selects the DMM screen.
Selects the File screen.
Select and accept settings here.
Moves the flashing cursor in the four
directions.
Moves the A/B cursors and scrolls the
waveforms.
Input and trigger settings can be made
by displaying the Settings window on
the Waveform Display screen.
Sets the voltage axis range for the
channel.
Sets the display position for the
channel.
Sets the input signal capture speed.
Initiates the measurement and analysis.
During measurement, the LED above
the key is lit.
Stops measurement.
______________________________________________________________
1.2 Identification of Controls and Indicators
Page 20

4
_____________________________________________________________________
Upper Side View
21
1. PC card slot
2. Eject button
Insert the PC card.
Press this button to eject a PC card.
Lower Side View
4
5
132
6
1. AC adapter connecting terminal (for the AC adapter
specified by Hioki only)
2. Power switch
3. External trigger terminal
(EXT TRIG)
4. Trigger output terminal
(TRIG OUT)
5. Ground terminal
(GND)
6. Contrast adjustment knob
Switches on or off the power supply.
External trigger source input.
Trigger signals are output.
Used together with the trigger
terminal.
Adjusts screen contrast.
______________________________________________________________
1.2 Identification of Controls and Indicators
Page 21

_____________________________________________________________________
5
Right Side View
CH4 CH3 CH2
1
1. Analog input terminal
Bottom Side View
CH1
Input terminals for analog inputs,
non-balanced input type
(8715-01: 4-channel input)
1
1. Battery compartment
9447 BATTERY PACK can be
installed.
______________________________________________________________
1.2 Identification of Controls and Indicators
Page 22

6
_____________________________________________________________________
______________________________________________________________
1.2 Identification of Controls and Indicators
Page 23

_____________________________________________________________________
7
Chapter 2
Installation and Preparation
2.1 Installation of the Unit
Ambient conditions
Temperature
5to40
recommended for high-precision measurements.
Humidity
35 to 80%RH (no condensation); 50 10%RH
(no condensation) recommended for high-precision
measurements.
Avoid the following locations:
・ Subject to direct sunlight.
・ Subject to high levels of dust, steam, or corrosive gases
(Avoid using the equipment in an environment containing
corrosive gases (e.g., H
substances that generate harmful gasses (e.g., organic
silicones, cyanides, and formalins).
・ Subject to vibrations.
・ In the vicinity of equipment generating strong
electromagnetic fields.
,23 5 (41 to 104 ,73 9 )
,NI2,andCI
S, SO
2
2
)or
2
______________________________________________________________
2.1 Installation of the Unit
Page 24

8
R
_____________________________________________________________________
2.2 Power Supply and Ground Connection
2.2.1 Connecting the AC Adapter
Use only the supplied 9418-15 AC adapter (SA145A-
DANGE
1240V-6, SINO AMERICAN). AC adapter input voltage
range is 100 to 240 V AC (with
Hz. To avoid electrical hazards and damage to the
instrument, do not apply voltage outside of this range.
10% stability) at 50/60
The 8715-01 POWER HiCORDERs are not affected by a drop
NOTE
______________________________________________________________
2.2 Power Supply and Ground Connection
・
in power lasting 40 ms or less. However, a drop in power
lasting more than 40 ms may interrupt the power supply.
Check the power supply conditions at the installation site in
advance.
Page 25

_____________________________________________________________________
W
9
2.2.2 Installing the 9447 BATTERY PACK
For battery operation, use only the Hioki Model 9447
ARNING
BATTERY PACK. We cannot accept responsibility for
accidents or damage related to the use of any other
batteries.
Installing the 9447 BATTERY PACK
1. Turn the power OFF.
2. Take off the Blank box.
3. Install the 9447 BATTERY PACK.
Effective Battery-Powered Operating Time
(typical value at normal temperature)
When the LCD power save function is on, the maximum
operating time will be longer than listed in the table below.
For details, see 6.1.3, "LCD Saver".
Operating condition 9447 BATTERY PACK
Approx. 180 min
Not operating
(waiting for trigger, etc.)
(LCD power save ON)
Approx. 120 min.
(LCD power save OFF)
During operating
2s/DIV1Hzsinewave
______________________________________________________________
2.2 Power Supply and Ground Connection
Approx. 120 min
(LCD power save ON)
Page 26

10
_____________________________________________________________________
If not recharge, the 9447 can not be used. For the details on
NOTE
・
charging batteries, refer to Section 10.2, "Recharging the 9447
BATTERY PACK."
If the battery voltage drops while the instrument is running off
・
of battery power, the 8715-01 will automatically switch off the
power supply. If the instrument is left in this state for an
extended period of time, the battery pack may be discharged
too much. Be sure to turn OFF the power switch on the
instrument.
When the battery capacity is reduced, the power is
・
automatically turned off. Before turning on the power again
with AC adapter or new batteries, turn the power off and leave
for about 30 seconds. If this time is shorter than 30 seconds,
the power may be immediately turned off even if powering on.
The values listed in the table above may vary depending on
・
ambient temperature and the coverage rate in printing.
When the printer is printing, the 8715-01 automatically reduce
・
backlight brightness and enter LCD power save mode.
______________________________________________________________
2.2 Power Supply and Ground Connection
Page 27
_____________________________________________________________________
W
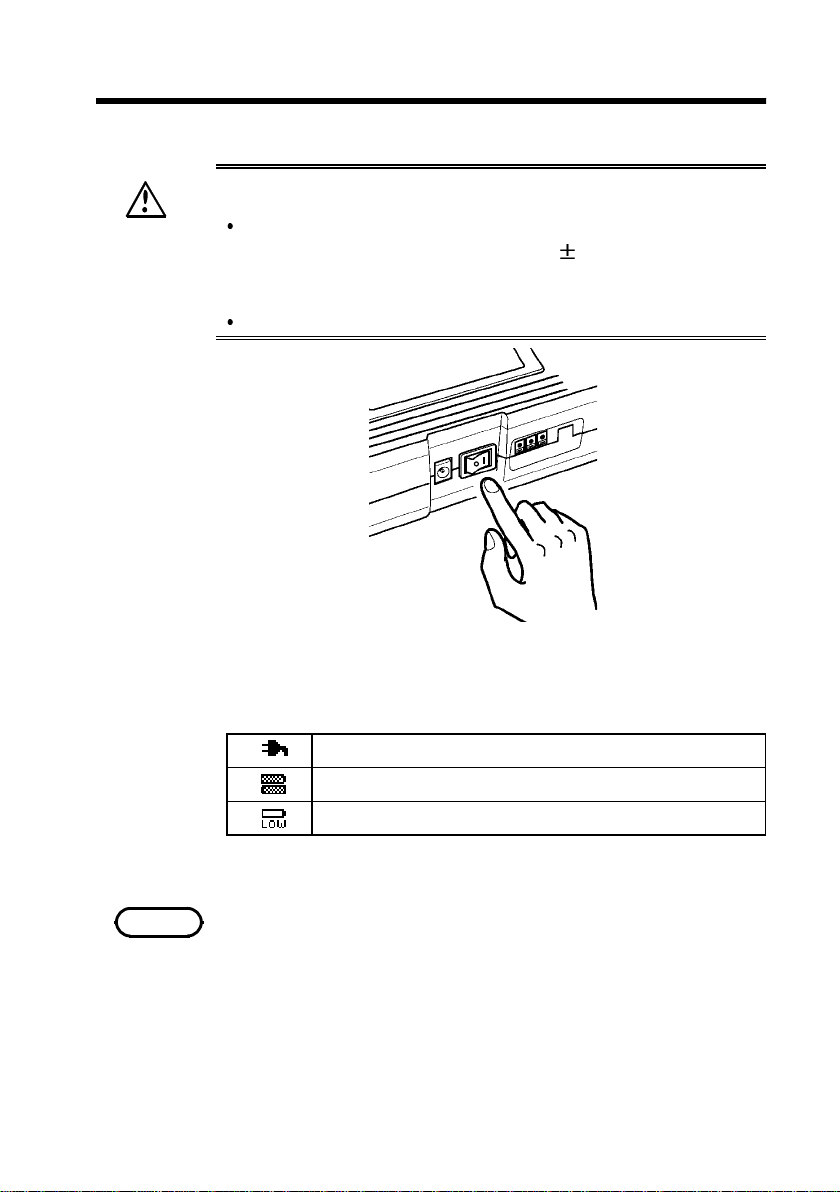
2.3 Power On/Off
Check the following points before the power switch is
turned on.
11
ARNING
Power supply matches Rated supply voltage (100 to
240 VAC: Voltage fluctuations of
10% from the
rated supply voltage are taken into account.) and
rated supply frequency (50/60 Hz).
The Unit is correctly installed (Section 2.1).
Depending on the type and status of power supply of the
8715-01, one of the following messages appears on the
Waveform Display screen.
Operating with the AC ADAPTER.
Operating with 9447 BATTERY PACK.
Battery capacity is low. Replace the batteries.
NOTE
______________________________________________________________
When the instrument is turned off, it memorizes the currently
used settings and reestablishes the same settings the next time
the instrument is turned on again. (Backup function)
2.3 Power On/Off
Page 28

12
_____________________________________________________________________
2.4 Connection of the Connection Cord
Never connect the cable to the 8715-01 while the cable
is already connected to the measurement object.
WARNING
Otherwise there is a risk of electric shock.
CAUTION
NOTE
When disconnecting the BNC connector, be sure to release
the lock before pulling off the connector. F orcibly pulling the
connector without releasing the lock, or pulling on the
cable, can damage the connector.
Use only the connection cord specified by Hioki. Using a nonspecified cable may result in incorrect measurements due to
poor connection or other reasons.
Use the supplied 9197 or optional connection cord for
analog input.
9197
Maximum input voltage: 500 V
9217
Maximum input voltage: 300 V
______________________________________________________________
2.4 Connection of the Connection Cord
Page 29

_____________________________________________________________________
r
13
Connecting to the main unit
Grooves in the BNC connecto
Connector guide
1. Align the grooves in the BNC connector with the guide
pins on the instrument input connector, then turn
clockwise while pressing in to lock the connector.
2. To remove from the instrument, turn the BNC connector
counterclockwise to release the lock, then pull it.
______________________________________________________________
2.4 Connection of the Connection Cord
Page 30

14
R
_____________________________________________________________________
2.5 Connecting the 9322 DIFFERENTIAL
PROBE
When using grabber clips, the 9322's maximum rated
DANGE
WARNING
voltage to earth is 1500 V AC or DC (CAT ll) / 600 V
AC or DC (CAT lll); when using alligator clips, it is
1000 V AC or DC (CAT ll) / 600 V AC or DC (CAT lll).
To avoid electrical shock and possible damage to the
instrument, never apply voltage greater than these
limits between the input channel terminals and
chassis, or across the input of two 9322s.
Maximum input voltage is 1000 VAC/2000 VDC (CAT
ll) / 600 V AC or DC (CAT lll). Do not measure voltage
in excess of these limitations, as doing so may
danger the instrument or cause an accident that
might result in injury or death.
9322 input part is applied with high voltage. To avoid
electric accident, be sure to turn off the power of
equipment to be measured before connecting. After
connection is properly handled, turn the power on.
Before using the instrument, make sure that the
insulation on the probes is undamaged and that no
bare conductors are improperly exposed. Using the
instrument in such conditions could cause an electric
shock, so contact your dealer or Hioki representative
for repair.
9322 is a differential probe that connects to analog input.
After high voltage is input to H and L terminal and divided
by 1/1000, the difference is output as signal to GND.
______________________________________________________________
2.5 Connecting the 9322 DIFFERENTIAL PROBE
Page 31

_____________________________________________________________________
p
A
p
p
ginp
15
Power jack
Connects o
tional AC adapter
BNC connector
connects to BNC connector on analo
ut.
Grabber cli
lligator cli
Connection Method
1. Connect the alligator or grabber clips to the 9322
DIFFERENTIAL PROBE.
2. Connect 9418-15 AC ADAPTER (SA145A-1240V-6,
SINO AMERICAN) to power jack. When power is
supplied, indicator turns on.
3. Connect 9322 BNC connector to analog input.
Grooves in the BNC
Connector guide
4. Connect alligator clip or grabber clip to equipment to be
measured.
5. Set the output selector switch to DC.
NOTE
______________________________________________________________
One 9418-15 AC ADAPTER (SA145A-1240V-6, SINO
AMERICAN) is required for each 9322 to be used.
Refer to the 9322 DIFFERENTI AL PROBE Instruction Manual for
details.
2.5 Connecting the 9322 DIFFERENTIAL PROBE
Page 32

16
R
φ
_____________________________________________________________________
2.6 Connecting the Clamp on Probe
Clamp-on probe should only be connected to the
DANGE
secondary side of a breaker, so the breaker can
prevent an accident if a short circuit occurs.
Connections should never be made to the primary side
of a breaker, because unrestricted current flow could
cause a serious accident if a short circuit occurs.
To avoid short circuits and accidents that could result
in injury or death, use clamp testers only with power
lines carrying 600 V rms or less.
The 8715-01 is fundamentally a voltage measuring device.
Although it does not measure current directly, current
measurement is possible using the voltage output of a
clamp sensor.
9010-10, 9018-10
Range: AC10/20/50/100/200 A
9010-10: 40 Hz to 1 kHz
9018-10: 40 Hz to 3 kHz
46 mm, 50 mm X 20 mm
9132-10
Range: 20/50/100/200/500/1000 A AC
40 Hz to 1 kHz
φ 55 mm, 80 mm X 55 mm
3283
Range: 10m/100m/1/10/200 A AC
40 Hz to 2 kHz
φ 40 mm max.
3284
Range: 20/200 A
DC, 10 Hz to 2 kHz
φ 33 mm max.
3285
Range: 200/2000 A
DC, 10 Hz to 1 kHz
φ 55 mm max.
______________________________________________________________
2.6 Connecting the Clamp on Probe
Page 33

_____________________________________________________________________
17
Using the 9010-10, 9018-10, and 9132-10
1. Align the grooves in the clamp sensor's BNC plug with
the connector guide pins on the analog input connector
on the 8715-01.
2. Push the BNC plug all the way in, and then turn it to the
right (clockwise). Confirm that the connectors are
securely mated.
3. To remove from the instrument, turn the BNC connector
counterclockwise to release the lock, then pull it.
Grooves in the BNC
Connector guide
CAUTION
______________________________________________________________
When disconnecting the BNC connector, be sure to release
the lock before pulling off the connector. F orcibly pulling the
connector without releasing the lock, or pulling on the
cable, can damage the connector.
2.6 Connecting the Clamp on Probe
Page 34

18
_____________________________________________________________________
Using the 3283, 3284, and 3285
Connection to the 8715-01 requires the 9199
CONVERSION ADAPTER and 9094 OUTPUT CORD.
1. Connect the 9199 to the 8715-01.
Refer to 2.4, for the connection procedure.
2. Connect the 9094 to the 9199.
(The connections are non-polarized, so red and black
may be reversed.)
3. Connect the 9094 to the OUTPUT terminal of the
CLAMP-ON HiTESTER.
9199
OUTPUT terminal
9094
______________________________________________________________
2.6 Connecting the Clamp on Probe
Page 35

_____________________________________________________________________
y
19
Setting the 3283, 3284, and 3285
LCD displa
Press the RANGE key on the clamp-on HiTESTER to set
the appropriate range.
Press the OUTPUT key to display [MON] (Waveform
output: AC).
Be sure to use the AC adapter when measuring over a long
period.
When the clamp-on probe is used for measurement, the
NOTE
・
measurement precision will be affected both by the instrument
precision and clamp-on precision ratings.
Set the range of the clamp sensor to match that of the 8715-
・
01. If set to different ranges, the display will show incorrect
values.
______________________________________________________________
2.6 Connecting the Clamp on Probe
Page 36

20
_____________________________________________________________________
2.7 Loading Recording Paper
1. Lift the stock cover in the
direction of the arrows.
2. Raise the head up/down lever.
3. Insert the leading edge of the
recording paper from bottom
into the gap behind the printer
roller, and pull it out to the
other side.
Pressing the FEED key feeds
paper.
4. Insert the attachments into the
ends of the roll of recording
paper and set the paper into
its holder.
______________________________________________________________
2.7 Loading Recording Paper
Page 37

_____________________________________________________________________
21
5. Pull the end of the recording
paper out at least 10 cm, and
make sure that it is positioned
quite straight.
6. Put down the head up/down
lever.
7. Pull the recording paper to the
outside through the printer exit
slot in the stock cover.
8. Close the stock cover, and
finish by tearing off the
recording paper against the
edge of the printer exit slot.
When the stock cover is fully open, attempting to force it open
NOTE
・
further may da mage the cover.
The paper may jam if it is not aligned with the roller.
・
For shipping or long-term storage, be certain that the recording
・
head is in the raised position. Otherwise the rollers could be
deformed and cause uneven printing.
Be careful to correctly orient the recording paper. Nothing will
・
be printed if the recording paper is loaded with the wrong side
facing the print head.
We recommend using only the specified 9234 RECORDING
・
PAPER.
______________________________________________________________
2.7 Loading Recording Paper
Page 38

22
_____________________________________________________________________
2.8 Care of Recording Paper
Care of recording paper
While unopened, thermal paper will not be affected by
the environment, provided that ambient temperature and
humidity do not exceed normal levels. For long-term
storage, temperature should be lower than 40
Low temperatures cause no problem.
After opening, protect the paper from strong light, to
prevent discoloration.
Storing data
As the recording paper is thermally sensitive, be aware of
the following points:
・ To avoid paper discoloration, do not expose it to direct
sunlight, and store at no more than 40
・ For permanent storage of important recorded data,
photocopy the recording paper.
・ If the thermal paper is exposed to an organic solvent such
as alcohol or ketone, it may no longer develop properly,
and recorded data may fade.
・ Also, the thermal recording paper is ruined by contact
with wet Daizo copy paper.
(104 ).
and 90%RH.
Direct sunlight
______________________________________________________________
2.8 Care of Recording Paper
Organic solvent
Page 39

_____________________________________________________________________
23
2.9 Attaching the Strap
CAUTION
Attach the ends of the strap securely at both attachment
points. If the strap is not attached securely, the instrument
could drop while being carried.
1. Insert each end of the strap through an attachment point
on the instrument.
Attachment Point
2. Thread the end of the strap through the buckle twice as
shown below.
3. Finally, slide the stopper over the end of the strap.
Tighten the strap to remove slackness or twisting.
Stopper
______________________________________________________________
2.9 Attaching the Strap
Page 40

24
_____________________________________________________________________
______________________________________________________________
2.9 Attaching the Strap
Page 41

_____________________________________________________________________
25
Chapter 3
Waveform Measurement Mode
3.1 Outline of the Waveform Measurement
Mode
The Waveform Measurement Mode provides a variety of
settable triggers that can be used to easily record waveform
anomalities associated with high-speed transient phenomena
such as instantaneous power dropouts and brownouts.
Features of the Waveform Measurement Mode are as
follows.
(1) Measures instantaneous commercial mains power
waveforms
・ Measures instantaneous, impulse and overvoltage
mains voltage waveforms
・ Measures peak load current when used with a clamp
sensor
(2) Powerful waveform judgment triggers
・ Judges waveforms in real time at 125-μsintervals
・ 2.5-μs sampling interval allows measuring nearly
instantaneous impulses
(3) Voltage-drop trigger effectively detects momentary
power dropouts
・ Detect momentary dropouts as small as one-half
cycle, or optionally set voltage drop detection
according to effective value (rms) level.
______________________________________________________________
3.1 Outline of the Waveform Measurement Mode
Page 42

26
_____________________________________________________________________
The Number of Waveform
The number of waveform anomalities that can be
sequentially recorded (the sequence limit) depends on the
selected recording length. When the number of sequentially
recorded waveforms has reached the sequence limit, the
earliest recorded waveform is overwritten.
Refer to 3.3.3 "Setting the Recording Length" for sequential
recording setup, and 3.8 "Sequential Save Function" for the
display procedure for sequentially saved waveforms.
______________________________________________________________
3.1 Outline of the Waveform Measurement Mode
Page 43
_____________________________________________________________________
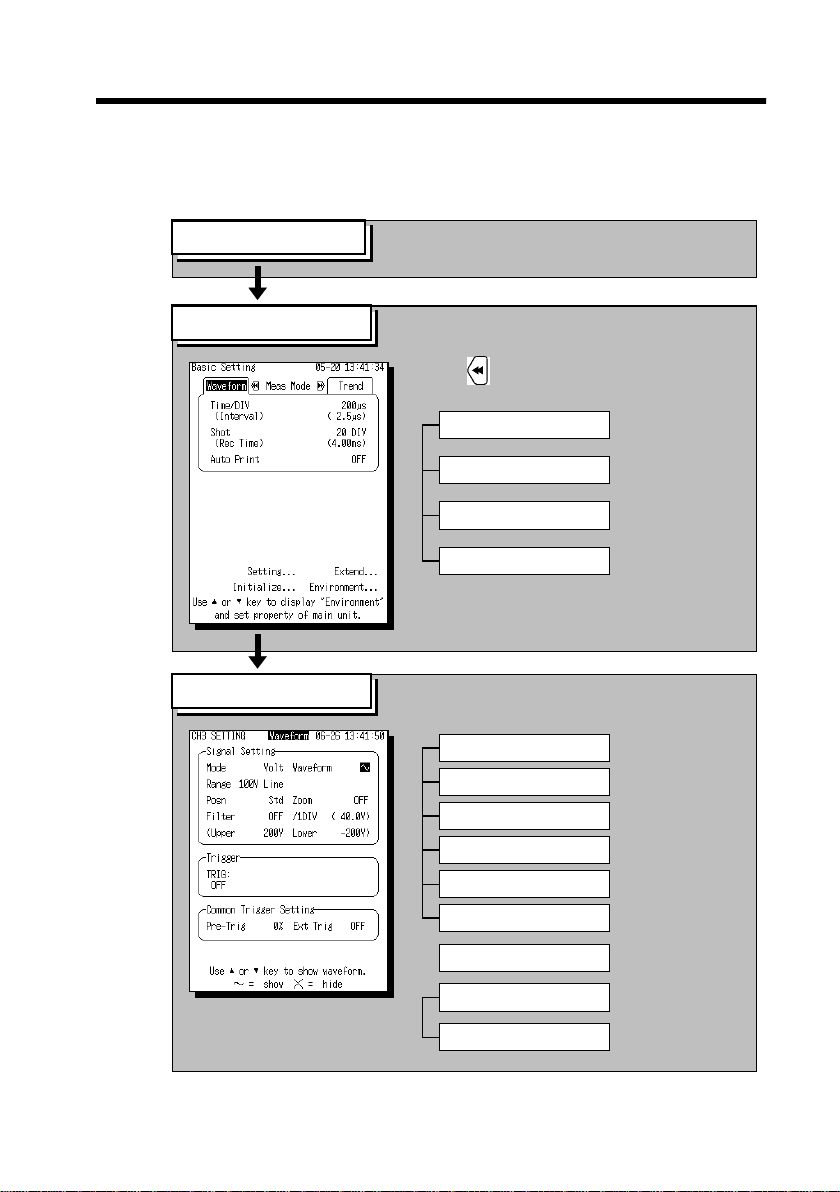
3.2 Operation Sequence (Waveform)
Waveform measurement mode operating procedures are
described by the following flowcharts.
27
Preparation
基本設定の
Basic Setting screen
CH SETTING screen
See Chapter 2.
Press the SET key to display the Basic
Setting screen.
Use the key to select the Waveform
measurement mode.
Measurement Mode
Time Axis Range
Recording Length
Auto Print
Press the CH SET key to display the desired
CH SETTING screen.
Input Mode
Measurement Range
Waveform Position
See 3.3.1.
See 3.3.2.
See 3.3.3.
See 3.3.4.
See 3.4.1.
See 3.4.2.
See 3.4.3.
Low-Pass Filter
Waveform Display
Zoom
Trigger
Pre-Trigger
Ext Trig
See 3.4.4.
See 3.4.5.
See 3.4.6.
See 3.5.
See 3.5.6.
See 5.6.
______________________________________________________________
3.2 Operation Sequence (Waveform)
Page 44

28
_____________________________________________________________________
3.3 Setting Items (Waveform)
3.3.1 Setting the Measurement Mode
The 8715-01 has two measurement modes. Select the
Waveform measurement mode.
Procedure Screen: Basic Setting
1. Press the SET key to display the Basic Setting screen.
2. Press the
key to select Waveform measurement mode.
______________________________________________________________
3.3 Setting Items (Waveform)
Page 45

_____________________________________________________________________
29
3.3.2 Setting the Time Axis Range
Set the speed for inputting and storing the waveform of the
input signal. Time axis range setting expresses the time for
1DIV.
Procedure-1 Screen: Basic Setting
1. Press the SET key to display the Basic Setting screen.
2. Move the flashing cursor to Time/DIV and select the
time axis range using the
keys.
Flashing cursor
The data interval for the
time axis range setting is
1/80 (1 DIV=80 data points).
Pressing the TIME/DIV key moves the flashing cursor
automatically to the Time Axis position for setting.
Procedure-2 Screen: Waveform Display
1. Press the DISP key to display the waveform display
screen.
2. Move the flashing cursor to the position shown in the
figure below and use the
Flashing cursor
keys to make a setting.
Pressing the TIME/DIV key sets the time axis regardless of
the flashing cursor position.
______________________________________________________________
3.3 Setting Items (Waveform)
Page 46

30
_____________________________________________________________________
3.3.3 Setting the Recording Length
The l ength of recording for one measurement operation
(number of divisions) can be set.
Procedure Screen: Basic Setting
1. Press the SET key to display the Basic Setting screen.
2. Move the flashing cursor to Shot and select the recording
length using the
Recording Length and Sequential Save
The maximum number of events that can be sequentially
recorded (the sequence limit) depends on the recording
length set for each event. For sequential save operation, the
internal memory is partitioned for storing multiple sets of
data.
In the Waveform Measurement Mode, when the number of
sequentially recorded waveforms has reached the sequence
limit and a trigger event occurs, the earliest recorded
waveform is overwritten.
Refer to 3.8 "Sequential Save Function" for more details.
keys.
Flashing cursor
Shot(DIV
Sequence Limit 32 16 8 4 2
______________________________________________________________
3.3 Setting Items (Waveform)
)
20 50 100 200 400
Number of waveforms that can currently
be displayed
Number of measurement events that
can be sequentially saved
Page 47

_____________________________________________________________________
31
3.3.4 Setting the Auto Print Function
Waveforms print out automatically after measurement starts
and each sequential save recording length (block size) has
been acquired.
Procedure Screen: Basic Setting
1. Press the SET key to display the Basic Setting screen.
2. Move the flashing cursor to Auto Print and set to ON or
OFF using the
keys.
Flashing cursor
OFF
ON
NOTE
______________________________________________________________
When cursor A and B are enabled, partial printing is executed.
For using the A/B cursors, see Section 5.1.
Disables the auto print.
Enables the auto print.
3.3 Setting Items (Waveform)
Page 48

32
_____________________________________________________________________
3.4 Input Channel Setting (Waveform)
3.4.1 Setting the Input Mode
Select the input mode (measurement object) for each
channel. The settable range is determined by the selected
input mode.
Procedure Screen: CH SETTING / Waveform Display
1. Press the CH SET key to display the desired
CH SETTING screen.
2. Move the flashing cursor to the Mode position.
3. Use the
keys to make a setting.
Flashing cursor
Volt
9322
9010 to 3285
______________________________________________________________
3.4 Input Channel Setting (Waveform)
Measure voltage
Measure voltage using the
9322 DIFFERENTIAL PROBE
Measure cur rent using a clamp sensor
Page 49

_____________________________________________________________________
33
3.4.2 Setting the Measurement Range
Select the measurement range for each channel. The settable
range is determined by the selected input mode.
The vertical and horizontal dimensions of each frame
correspond to the set range, and the upper and lower limits
are displayed on the screen.
Procedure-1 Screen: CH SETTING
1. Press the CH SET key to display the desired
CH SETTING screen.
2. Move the flashing cursor to the Range position.
3. Use the
keys to make a setting.
Flashing cursor
Procedure-2 Screen: Waveform Display
1. Press the DISP key to display the waveform display
screen.
2. Press the CH1 - CH4 key to display the setting window.
3. Move the flashing cursor to the position shown in the
figure below and use the
Flashing cursor
keys to make a setting.
Pressing the RANGE key moves the flashing cursor
automatically to the Time Axis position for setting.
______________________________________________________________
3.4 Input Channel Setting (Waveform)
Page 50

34
_____________________________________________________________________
3.4.3 Setting the Waveform Position
Set the waveform display position.
The waveform display can be repositioned if it is obscured,
such as by an overlapping window.
Procedure-1 Screen: CH SETTING
1. Press the CH SET key to display the desired
CH SETTING screen.
2. Move the flashing cursor to the Posn position.
3. Use the
keys to make a setting.
Flashing cursor
Procedure-2 Screen: Waveform Display
1. Press the DISP key to display the waveform display
screen.
2. Press the CH1 - CH4 key to display the setting window.
3. Move the flashing cursor to the position shown in the
figure below and use the
Flashing cursor
keys to make a setting.
Pressing the POSN key moves the flashing cursor
automatically to the Time Axis position for setting.
______________________________________________________________
3.4 Input Channel Setting (Waveform)
Page 51

_____________________________________________________________________
35
3.4.4 Setting the Low-Pass Filter
Effective for removing unneeded high-frequency
components.
Procedure Screen: CH SETTING
1. Press the CH SET key to display the desired
CH SETTING screen.
2. Move the flashing cursor to the Filter position.
3. Use the
keys to make a setting.
Flashing cursor
OFF
500 Hz
5 kHz
______________________________________________________________
No low-pass filter is connected.
Connect a filter with a cutoff frequency of 500 Hz
Connect a filter with a cutoff frequency of 5 kHz
Filter: OFF Filter: 500 Hz
3.4 Input Channel Setting (Waveform)
Page 52

36
_____________________________________________________________________
3.4.5 Setting the Waveform Display
Enable/disable waveform measurement and display.
The 8715-01 can record and display up to four channels.
Procedure Screen: CH SETTING / Waveform Display
1. Press the CH SET key to display the desired
CH SETTING screen.
2. Move the flashing cursor to the Waveform position.
3. Use the
keys to make a setting.
Flashing cursor
Colors on the Waveform Display screen are used to indicate
channels as follows, a nd are not changeable.
CH1 :Red CH3 : Yellow
CH2 :Green CH4 :Blue
______________________________________________________________
3.4 Input Channel Setting (Waveform)
Page 53

_____________________________________________________________________
37
3.4.6 Setting the Zoom
The voltage axis can be independently magnified or
compressed for display and recording of each channel.
Magnification and compression are applied relative to the
center of the display.
Procedure Screen: CH SETTING / Waveform Display
1. Press the CH SET key to display the desired
CH SETTING screen.
2. Move the flashing cursor to the Zoom position.
3. Use the
keys to make a setting.
Flashing cursor
OFF
ON
Display and record without magnification
Display and record with magnified voltage axis
OFF ON
______________________________________________________________
3.4 Input Channel Setting (Waveform)
Page 54

38
_____________________________________________________________________
3.5 Trigger Functions
・ The term "trigger" refers to a signal which is used to
control the timing for recording start. The term
"triggering has occurred" refers to the state when such a
signal has activated recording start.
・ Trigger settings can be made on each CH SETTING
screen or on the Waveform Display screen. This
document mainly describes the CH SETTING screen
settings.
Press the
CH1 - 4 key
Trigger conditions for the Waveform Measurement
Mode, with primary usage examples
・ Level Trigger
・ Window-In/Out Trigge r
In-rush current measurement
Overvoltage (or current)
・ Voltage Drop Trigger
・ Period Trigger
Momentary voltage dropouts and brownouts
Power frequency anomalities
・ Waveform Detection Trigger
______________________________________________________________
3.5 Trigger Functions
Surgeandnoisemeasurement
Page 55

_____________________________________________________________________
39
・ A trigger condition can be enabled by setting an OR
condition with other triggers. The OR condition causes a
trigger to occur when any of several trigger conditions are
satisfied.
・ Pre-trigger and external trigger settings can be made only
on the CH SETTING screen.
・ Refer to 5.6 "External Trigger Function" for external
trigger details.
______________________________________________________________
3.5 Trigger Functions
Page 56

40
_____________________________________________________________________
3.5.1 Level Trigger
Triggering occurs when the input signal crosses the preset
trigger level with the preset trigger slope (
, ).
Trigger point
Trigger level
Input signal
Upward trigger direction
(slope :
Procedure Screen: CH SETTING / Waveform Display
)
Downward trigger direction
(slope :
)
1. Press the CH SET key to display the desired
CH SETTING screen.
2. Move the flashing cursor to the TRIG position and select
LVL (level) using the
keys.
Trigger point
Flashing cursor
______________________________________________________________
3.5 Trigger Functions
Page 57

_____________________________________________________________________
41
3. Move the flashing cursor to the position shown in the
figure below, and set the trigger level using the
keys.
Flashing cursor
4. Move the flashing cursor to the position shown in the
figure below, and set the trigger slope using the
keys.
Flashing cursor
Triggering occurs when the rising trigger slope
(
) crosses the trigger level.
Triggering occurs when the falling trigger slope
(
) crosses the trigger level.
5. Move the flashing cursor to the position shown in the
figure below, and set the trigger filter using the
keys.
Flashing cursor
OFF
ON
______________________________________________________________
Trigger filter is disabled.
Trigger filter is enabled. Filter width: 0.5 DIV
3.5 Trigger Functions
Page 58

42
_____________________________________________________________________
Trigger Filter
Triggering occurs when the trigger conditions are met
within the filter width (0.5 DIV). This is useful to prevent
spurious triggering by noise
Rising trigger slope :
Filter width (0.5 DIV)
Trigger point
Trigger level
Triggering does not occur here
To cause triggering at point A or point B with the sine
wave shown below, make the following settings.
Point A
Trigger level: 200 mV,
Trigger slope: rising ( )
200 mV
0V
A
Point B
Trigger level: -600 mV,
Trigger slope: falling ( )
0V
-600 mV
B
______________________________________________________________
3.5 Trigger Functions
Page 59

_____________________________________________________________________
3.5.2 Window-In/Out Trigger
Window-In Trigger
Set upper limit level and lower limit level and activated
when the input signal enters the range between these limits.
Window-Out Trigger
Set upper limit level and lower limit level and activated
when the input signal leaves this range.
43
Window-In Trigger
Window-Out Trigger
Procedure Screen: CH SETTING / Waveform Display
1. Press the CH SET key to display the desired
CH SETTING screen.
2. Move the flashing cursor to the TRIG position and select
IN or OUT using the
keys.
Flashing cursor
______________________________________________________________
3.5 Trigger Functions
Page 60

44
_____________________________________________________________________
3. Move the flashing cursor to the position shown in the
figure below, and set the lower limit of the trigger level
using the
keys.
Flashing cursor
4. Move the flashing cursor to the upper limit, and set the
upper limit of the trigger level using the
keys.
The upper limits must not be smaller than the lower
limits, or the lower limits must not be larger than the
upper limits.
5. Move the flashing cursor to the position shown in the
figure below, and set the trigger filter using the
keys.
Flashing cursor
OFF
ON
Trigger filter is disabled.
Trigger filter is enabled. Filter width: 0.5 DIV
If the trigger condition has already occurred before
measurement starts, the trigger is not activated. However,
after the trigger condition clears, the trigger is activated
when the condition next occurs.
______________________________________________________________
3.5 Trigger Functions
Page 61

_____________________________________________________________________
45
3.5.3 Voltage Drop Trigger
The 8715-01 is designed to measure commercial power
supplies (50/60 Hz), and detects momentary voltage drops
in commercial power supplies
Triggering occurs when peak voltage drops below the
specified level for morethan one-half cycle.
Procedure Screen: CH SETTING / Waveform Display
1. Press the CH SET key to display the desired
CH SETTING screen.
2. Move the flashing cursor to the TRIG position and select
DROP using the
keys.
Flashing cursor
______________________________________________________________
3.5 Trigger Functions
Page 62

46
_____________________________________________________________________
3. Move the flashing cursor to the position shown in the
figure below, and set the frequency to be measured using
the
keys.
Flashing cursor
50 Hz
60 Hz
This measurement is made using a 50-Hz
commercial power supply.
This measurement is made using a 60-Hz
commercial power supply.
4. Move the flashing cursor to the position shown in the
figure below, and set the trigger level using the
keys.
The RMS value is displayed on the right side of the
trigger level.
Flashing cursor
______________________________________________________________
3.5 Trigger Functions
Page 63

_____________________________________________________________________
47
3.5.4 Period Trigger
This function sets both the period reference voltage and the
period range, and measures the rise (fall) period of the
reference voltage. When the measured period deviates from
the specified range, triggering occurs.
Procedure Screen: CH SETTING / Waveform Display
1. Press the CH SET key to display the desired
CH SETTING screen.
2. Move the flashing cursor to the TRIG position and select
PRIOD using the
keys.
Flashing cursor
3. Move the flashing cursor to the position shown in the
figure below, and set the lower limit of the trigger level
(period range) using the
Flashing cursor
keys.
4. Move the flashing cursor to the upper limit, and set the
upper limit of the trigger level (period range) using the
keys.
______________________________________________________________
3.5 Trigger Functions
Page 64

48
_____________________________________________________________________
5. Move the flashing cursor to the position shown in the
figure below, and set the trigger slope using the
keys.
Flashing cursor
Triggering occurs when the rising trigger slope
(
) crosses the trigger level.
Triggering occurs when the falling trigger slope
(
) crosses the trigger level.
6. Move the flashing cursor to the position shown in the
figure below, and set the reference level using the
keys.
Flashing cursor
______________________________________________________________
3.5 Trigger Functions
Page 65

_____________________________________________________________________
49
Triggering Position of the Period Trigger
The system monitors the period of the signal that crosses
the set reference level.
When the monitored period deviates from the set range,
triggering occurs. The trigger position is determined by the
set period range and the measurement signal period.
Signal with a period to be measured that is smaller than
lower limit of the period trigger (trigger slope:
Signal cycle
Reference level
Lower limit 1
Lower limit 2
):
When the signal crosses the reference level at the set trigger
slope before the lower limit of the set period range appears
on the screen, the intersection is always defined as the
triggering position.
Signal with a period to be measured that is larger th an the
upper limit of the period trigger (trigger slope:
Signal cycle
Reference level
Lower limit 1
Lower limit 2
):
When the upper limit of the set period range appears on the
screen before the signal crosses the reference level at the set
trigger slope, the upper limit is defined as the triggering
position. The triggering position is determined by the
position of the upper limit in the period range, as shown in
the figure above.
______________________________________________________________
3.5 Trigger Functions
Page 66

50
W
p
p
p
_____________________________________________________________________
Example for period Trigger
To measure a 50-Hz power trend waveform with period
deviation trigger conditions between 19 ms (about 52.6 Hz)
and 21 ms (about 47.6 Hz), set the following:
Lower limit: 19 ms Upper limit: 21 ms
Reference level: 0.000 V Slope:
Reference level
0.000 V
22 ms
20 ms 20 ms
21 ms
ithin the
eriod range
Within the
eriod range
Upper limit of
the
eriod range
______________________________________________________________
3.5 Trigger Functions
Page 67

_____________________________________________________________________
3.5.5 Waveform Detection Trigger
The waveform detection trigger function compares the
measured signal with a pre-defined control waveform range,
and triggers if the signal deviates from the control range
voltage. The control range consists of a positive and
negative amplitude offset from either a standard sine wave
or the previous input cycle.
51
Measurement data
Triggerpoint
0V
control
range
For purposes of creating a control range for a standard
waveform (either a sine wave or the previous cycle), one
cycle period is considered to begin at the positive-going 0volt crossing (positive 0 crossing).
(1) Sine Wave
The control range is based on a sine wave (with RMS
value voltage) at the mains frequency.
(2) Previous Cycle
The control range of each cycle is based on the previous
cycle of the input waveform. This selection is used
when gradual changes should not cause t riggering.
0V
Previous Cycle (one cycle)
The control range is applied to this
cycle's waveform
Input Waveform (one cycle)
This cycle is compared with
the previous cycle for
detection
______________________________________________________________
3.5 Trigger Functions
Page 68
52
_____________________________________________________________________
・ This function is not available in the 20-ms time axis
range.
・ The settable standard voltage and control range are
limited by the voltage range setting.
・ We recommend setting the standard voltage after
verifying the actual rms voltage with the DMM function.
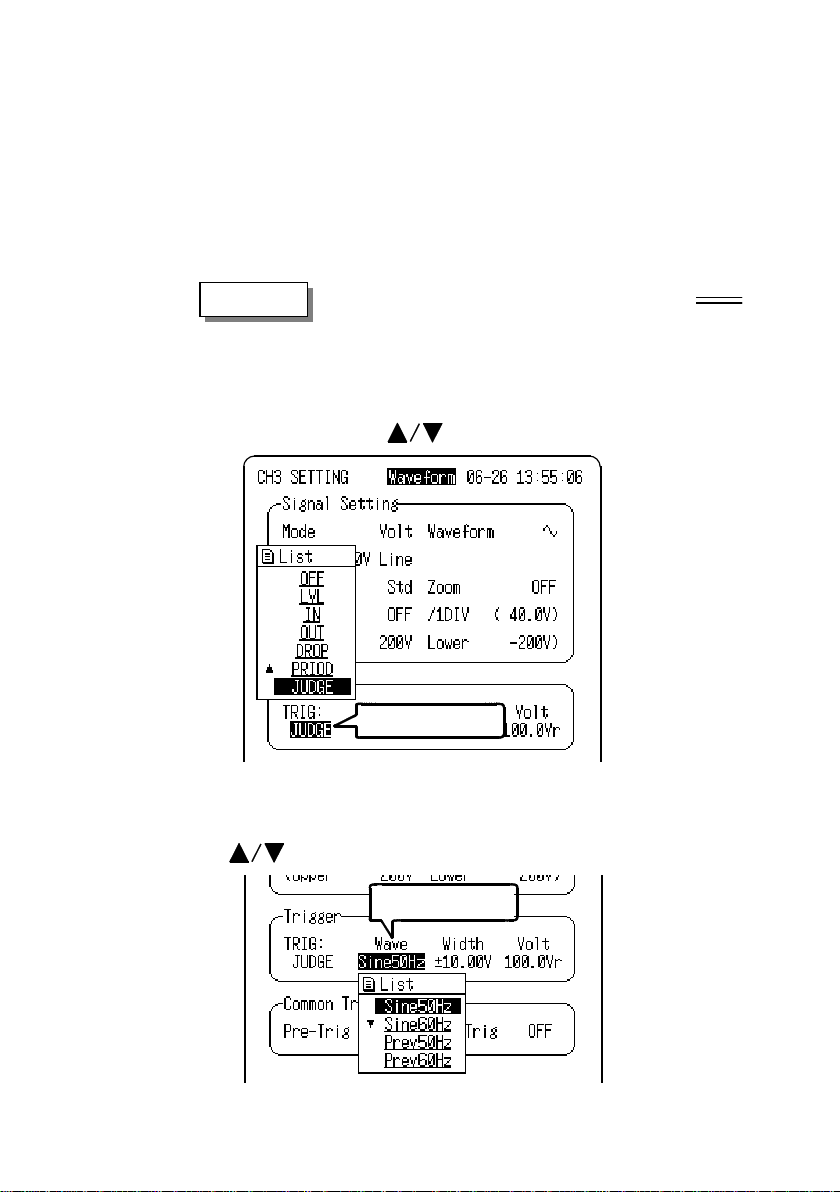
Procedure Screen: CH SETTING / Waveform Display
1. Press the CH SET key to display the desired
CH SETTING screen.
2. Move the flashing cursor to the TRIG position and select
JUDGE using the
keys.
Flashing cursor
3. Move the flashing cursor to the position shown in the
figure below and select the reference waveform using the
keys.
Flashing cursor
______________________________________________________________
3.5 Trigger Functions
Page 69

_____________________________________________________________________
53
4. Move the flashing cursor to the position shown in the
figure below and set the control range using the
keys.
Flashing cursor
5. When 50- or 60-Hz Sine Wave was selected in step 3, set
the Standard Voltage.
Move the flashing cursor to the position shown in the
figure below and set the standard voltage using the
keys.
When measuring 100-V commercial lines: Set the standard
voltage to 100 Vr.
When measuring 200-V commercial lines: Set the voltage
to 200 Vr.
Flashing cursor
______________________________________________________________
3.5 Trigger Functions
Page 70

54
_____________________________________________________________________
3.5.6 Setting the Pre-Trigger
The pre-trigger function serves to record the waveform not
only after but also before triggering has occurred.
In the Waveform measurement mode, using the recording
start point as 0% and the recording end point as 100%, the
trigger point can be specified in percent. When all trigger
sources are set to OFF, the pre-trigger setting is invalid.
Trigger point
Pre-trigger: OFF
Pre-trigger: 50%
Pre-trigger: 100%
Procedure Screen: CH SETTING
1. Press the CH SET key to display the CH SETTING
screen.
2. Move the flashing cursor to the Pre-Trig position and use
the
keys to make a setting.
Flashing cursor
・ In Waveform measurement mode, when the pre-trigger is
set, the trigger will not be registered for a certain period
after the start of measurement. (During this interval, Pretrig wait is shown on the Waveform display screen.)
・ When the trigger can be registered, the indication Wait
for trig is shown on the waveform display screen.
______________________________________________________________
3.5 Trigger Functions
Page 71

_____________________________________________________________________
play
3.5.7 Input Level Monitor Function
・ The in put signal is monitored in real time when waiting
for the trigger in Waveform measurement mode.
・ The input settings can be made for a particular channel
using the Channel Select keys (CH1 to CH4) while
monitoring on the Waveform Display screen.
Analogchannels
55
Input
level
CH1 to 4, left-to-right
When the input level is not displayed on the
screen displayrange
The input level exceeds the upper limit.
The input level exceeds the lower limit.
Waveform
dis
range
______________________________________________________________
3.5 Trigger Functions
Page 72

56
_____________________________________________________________________
3.6 Waveform Display Screen Settings
This section describes the settings on the Waveform
Display screen. Pressing CH1 to CH4 displays the input
channel and trigger settings. Press the same key again to
return to the previous screen.
2
1
3
4
5
6
Display item Selection Reference
1. Time axis range 200 μs to 20 ms /DIV 3.3.2
2. Magnification/
Compression of the
time axis
3. A/B cursor measurement or waveform scrolling 5.1, 5.2
4. Input channel setting Sets each channels 3.4
5. Trigger setting Sets each channels 3.5
6. Sequential save
______________________________________________________________
3.6 Waveform Display Screen Settings
X10 to X1/50 5.3
When multiple waveforms
have been stored, select
one to display.
3.8
Page 73

_____________________________________________________________________
3.7 Start and Stop Operation (Waveform)
Measurement start
57
測定開始
Trigger conditions
are met
Recording data
Pressing the START key causes a
confirmation window to appear.
Press the START key again to start
measurement.
The LED lights green when measurement
starts.
When pre-trigger is activated, the trigger is
not enabled until the specified pre-trigger data
has been read.("Pre-trig wait" is displayed.)
"Wait for trig" is displayed until the trigger
condition occurs.
Data recording starts when the trigger
conditions are met.
If no trigger conditions are enabled, data
acquisition starts when measurement starts.
During recording, "Storing" is displayed.
When automatic printing is selected, data is
printed after display.
Wait for trigger
Measurement end
測定終了
Measurement can be aborted by pressing the
STOP key twice.
Waveform data acquired before the Stop key
was pressed is displayed and saved.(automatic
printing will not execute)
・ If measurement is aborted before a trigger event has
occurred, no waveforms are stored. However, if a
waveform was acquired during a previous trigger event,
that waveform is displayed (unless it was the maximum
recording length).
・ When the number of recorded trigger events has reached
the sequence limit, the earliest recorded data is
overwritten.
______________________________________________________________
3.7 Start and Stop Operation (Waveform)
Page 74

58
_____________________________________________________________________
3.8 Sequential Save Function
When multiple trigger events occur during measurement
and several waveforms are acquired, the last-acquired
waveform is displayed by the Sequential Save function.
Waveform Display Procedure
Press CH1 to CH4 to display Sequential.
The selected number is d ispla yed in a reversed block in the
figure.
This block indicates the waveform currently displayed on the
Waveform Display screen.
To change the display, move the blinking cursor to the
position of the desired number or directly to the block
and press the keys to change
.
(
),
When measurement is restarted, all previous waveforms are
deleted and recording commences from the first block.
______________________________________________________________
3.8 Sequential Save Function
Page 75

_____________________________________________________________________
59
Chapter 4
RMS Trend Measurement
Mode
4.1 Outline of the RMS Trend
Measurement
The RMS Trend Measurement Mode records mains voltage
and changes in current levels as effective (rms) values.
This mode has the following features:
(1) Measures rms values of commercial power (50/60 Hz).
・ Mains voltage measurement
・ Load current measurement when used with clamp
sensor
・ Leakage current measurement when used with clamp
sensor (3283)
(2) Continuous real-time recording
・ Records rms value trends on the printer
・ Capability to print measured value at specified
intervals (1 frame) simultaneously with rms trend
waveform (hybrid recording)
Instantaneous waveform recording on the Basic Setting
screen must be enabled (ON) in order to set or change the
instantaneous waveform trigger for the time axis, recording
length and the channel screen for instantaneous waveform
recording.
______________________________________________________________
4.1 Outline of the RMS Trend Measurement
Page 76

60
_____________________________________________________________________
4.2 Operation Sequence (Trend)
RMS Trend Measurement Mode operating procedures are
described by the following flowcharts.
Preparation
基本設定の
Basic Setting screen
CH SETTING screen
See Chapter 2.
Press the SET key to display the Basic
Setting screen.
Use the key to select the Trend
measurement mode.
Measurement Mode
Time Axis Range
Frequency
Real Time Print
Memory Record
Press the CH SET key to display the desired
CH SETTING screen.
Input Mode
Measurement Range
Waveform Position
See 4.3.1.
See 4.3.2.
See 4.3.3.
See 4.3.4.
See 4.5.
See 4.4.1.
See 4.4.2.
See 4.4.3.
Low-Pass Filter
Waveform Display
Print Value
Zoom
Memory Trigger
Pre-Trigger
Ext Trigger
See 4.4.4.
See 4.4.5.
See 4.4.6.
See 4.4.6.
See 4.5.
See 4.5.6.
See 5.6.
______________________________________________________________
4.2 Operation Sequence (Trend)
Page 77

_____________________________________________________________________
61
4.3 Setting Items (Trend)
4.3.1 Setting the Measurement Mode
The 8715-01 has two measurement modes. Select the RMS
Trend Measurement Mode.
Procedure Screen: Basic Setting
1. Press the SET key to display the Basic Setting screen.
2. Press the
mode.
With the RMS Trend Mode (rms recording), the rms value
is continuously recorded in real time from the moment the
START key is pressed to start measuring until the STOP
key is pressed.
Up to 200 divisions of data are stored in internal memory,
after which data is overwritten.
After measurement, data stored in internal memory can be
viewed by reverse scrolling, or printed later.
The relationship between the time axis range and the
recording time storage capacity of the internal memory is
indicated in the following table. The maximum possible
recording time is the instrument of the time axis and 200
divisions.
Time/DIV Recording Time Time/DIV Recording Time
1s 3 min 20 s 1 min 3h20min
2s 6 min 40 s 2 min 6h40min
5s 16 min 40 s 5 min 16 h 40 min
10 s 33 min 40 s 10 min 1day9h20min
30 s 1h40min 30 min 4 day 4 h
key to select RMS Trend measurement
1h 8 day 8 h
______________________________________________________________
4.3 Setting Items (Trend)
Page 78

62
_____________________________________________________________________
When the time axis ranges from 1 to 5 s/DIV, simultaneous
NOTE
・
numerical data printing is unavailable.
If the instrument is used with battery pack 9447, simultaneous
・
printing is unavailable at 1 s/DIV of the time axis.
______________________________________________________________
4.3 Setting Items (Trend)
Page 79

_____________________________________________________________________
63
4.3.2 Setting the Time Axis Range
Set the speed for inputting and storing the waveform of the
input signal. Time axis range setting expresses the time for
1DIV.
Procedure-1 Screen: Basic Setting
1. Press the SET key to display the Basic Setting screen.
2. Move the flashing cursor to Time/DIV and select the
time axis range using the
keys.
Flashing cursor
The data interval for the
time axis range setting is
1/80 (1 DIV=80 data
points).
Pressing the TIME/DIV key moves the flashing cursor
automatically to the Time Axis position for setting.
Procedure-2 Screen: Waveform Display
1. Press the DISP key to display the waveform display
screen.
2. Move the flashing cursor to the position shown in the
figure below and use the
Flashing cursor
keys to make a setting.
Pressing the TIME/DIV key sets the time axis regardless of
the flashing cursor position.
______________________________________________________________
4.3 Setting Items (Trend)
Page 80

64
_____________________________________________________________________
4.3.3 Setting the Frequency
Serves to set the frequency of the signal to be measured.
Procedure Screen: Basic Setting
1. Press the SET key to display the Basic Setting screen.
2. Move the flashing cursor to Frequency and select the
frequency using the
keys.
Flashing cursor
50 Hz
60 Hz
______________________________________________________________
4.3 Setting Items (Trend)
Measure rms value of 50 Hz signal
Measure rms value of 60 Hz signal
Page 81

_____________________________________________________________________
4.3.4 Setting the Printer (Real Time Printing)
The input waveform is continuously printed in real time.
Procedure Screen: Basic Setting
1. Press the SET key to display the Basic Setting screen.
2. Move the flashing cursor to Print and use the
keys to make a setting.
Flashing cursor
65
OFF
ON
Disables the print.
Enables the print.
Relationship between time axis (recording speed)
and amount of remaining recording paper
For the Trend RMS Recording, the maximum print time is
the instrument of the time axis and the remaining amount
of recording paper (cm). Be particularly aware of the
remaining amount of paper during simultaneous printing.
Time/DIV Printing Time Time/DIV Printing Time
1s Approx. 30 min 1 min Approx. 30 h
2s Approx. 60 min 2 min Approx. 2 day 12 h
5s Approx. 2h 30min 5 min Approx. 6 day 6 h
10 s Approx. 5h 10 min Approx. 12 day12 h
30 s Approx. 15h 30 min Approx. 37 day12 h
1h Approx. 73 day
Applicable when using a new roll (1800 cm) of 9234 RECORDING PAPER
When the time axis ranges from 1 to 5 s/DIV, simultaneous
NOTE
______________________________________________________________
・
numerical data printing is unavailable.
If the instrument is used with battery pack 9447, simultaneous
・
printing is unavailable at 1 s/DIV of the time axis.
4.3 Setting Items (Trend)
Page 82

66
_____________________________________________________________________
4.4 Input Channel Setting (Trend)
4.4.1 Setting the Input Mode
Select the input mode (measurement object) for each
channel. The settable range is determined by the selected
input mode.
Procedure Screen: CH SETTING / Waveform Display
1. Press the CH SET key to display the desired
CH SETTING screen.
2. Move the flashing cursor to the Mode position.
3. Use the
keys to make a setting.
Flashing cursor
Volt
9322
Measure voltage
Measure voltage using the
9322 DIFFERENTIAL PROBE
9010 to 3285
______________________________________________________________
4.4 Input Channel Setting (Trend)
Measure current using a clamp sensor
Page 83

_____________________________________________________________________
67
4.4.2 Setting the Measurement Range
Select the measurement range for each channel. The settable
range is determined by the selected input mode.
The vertical and horizontal dimensions of each frame
correspond to the set range, and the upper and lower limits
are displayed on the screen.
Procedure-1 Screen: CH SETTING
1. Press the CH SET key to display the desired
CH SETTING screen.
2. Move the flashing cursor to the Range position.
3. Use the
keys to make a setting.
Flashing cursor
Procedure-2 Screen: Waveform Display
1. Press the DISP key to display the waveform display
screen.
2. Press the CH1 - CH4 key to display the setting window.
3. Move the flashing cursor to the position shown in the
figure below and use the
Flashing cursor
keys to make a setting.
Pressing the RANGE key moves the flashing cursor
automatically to the Time Axis position for setting.
NOTE
______________________________________________________________
In the DC 100 V range, RMS values are not calculated; rather,
instantaneous waveforms are recorded.
4.4 Input Channel Setting (Trend)
Page 84

68
_____________________________________________________________________
4.4.3 Setting the Waveform Position
Set the waveform display position.
The waveform display can be repositioned if it is obscured,
such as by an overlapping window.
Procedure-1 Screen: CH SETTING
1. Press the CH SET key to display the desired
CH SETTING screen.
2. Move the flashing cursor to the Posn position.
3. Use the
keys to make a setting.
Flashing cursor
Procedure-2 Screen: Waveform Display
1. Press the DISP key to display the waveform display
screen.
2. Press the CH1 - CH4 key to display the setting window.
3. Move the flashing cursor to the position shown in the
figure below and use the
Flashing cursor
keys to make a setting.
Pressing the POSN key moves the flashing cursor
automatically to the Time Axis position for setting.
______________________________________________________________
4.4 Input Channel Setting (Trend)
Page 85

_____________________________________________________________________
g
g
In the RMS Trend Measurement Mode, voltage and current
display positions are different.
69
RMS Voltage Recordin
Up+5
Up+4
Up+3
Up+2
Up+1
Std
Down-1
Down-2
Down-3
Down-4
Down-5
Zeroposition
RMS Current Recordin
______________________________________________________________
4.4 Input Channel Setting (Trend)
Page 86

70
_____________________________________________________________________
4.4.4 Setting the Low-Pass Filter
Effective for removing unneeded high-frequency
components.
Procedure Screen: CH SETTING
1. Press the CH SET key to display the desired
CH SETTING screen.
2. Move the flashing cursor to the Filter position.
3. Use the
keys to make a setting.
Flashing cursor
OFF
500 Hz
5 kHz
______________________________________________________________
4.4 Input Channel Setting (Trend)
No low-pass filter is connected.
Connect a filter with a cutoff frequency of 500 Hz
Connect a filter with a cutoff frequency of 5 kHz
Filter: OFF Filter: 500 Hz
Page 87

_____________________________________________________________________
71
4.4.5 Setting the Waveform Display
Enable/disable waveform measurement and display.
The 8715-01 can record and display up to four channels.
Procedure Screen: CH SETTING / Waveform Display
1. Press the CH SET key to display the desired
CH SETTING screen.
2. Move the flashing cursor to the Waveform position.
3. Use the
keys to make a setting.
Flashing cursor
Colors on the Waveform Display screen are used to indicate
channels as follows, a nd are not changeable.
CH1 :Red CH3 : Yellow
CH2 :Green CH4 :Blue
______________________________________________________________
4.4 Input Channel Setting (Trend)
Page 88

72
_____________________________________________________________________
4.4.6 Setting the Print Value
In the RMS Trend Measurement Mode, if numerical value
printing is enabled (ON) when printing an rms recording,
the measured value for each frame is printed along with the
rms waveform.
Procedure Screen: CH SETTING
1. Press the CH SET key to display the desired
CH SETTING screen.
2. Move the flashing cursor to the Print Value position.
3. Use the
Numerical Value Printing Example
keys to make a setting.
Flashing cursor
NOTE
______________________________________________________________
4.4 Input Channel Setting (Trend)
When the time axis ranges from 1 to 5 s/DIV, simultaneous
numerical data printing is unavailable.
Page 89

_____________________________________________________________________
73
4.4.7 Setting the Zoom
The voltage axis can be independently magnified or
compressed for display and recording of each channel.
Magnification and compression are applied relative to the
center of the display.
Procedure Screen: CH SETTING / Waveform Display
1. Press the CH SET key to display the desired
CH SETTING screen.
2. Move the flashing cursor to the Zoom position.
3. Use the
keys to make a setting.
Flashing cursor
Std
Exp
Display and record without magnification
Display and record with magnified voltage axis
OFF ON
______________________________________________________________
4.4 Input Channel Setting (Trend)
Page 90
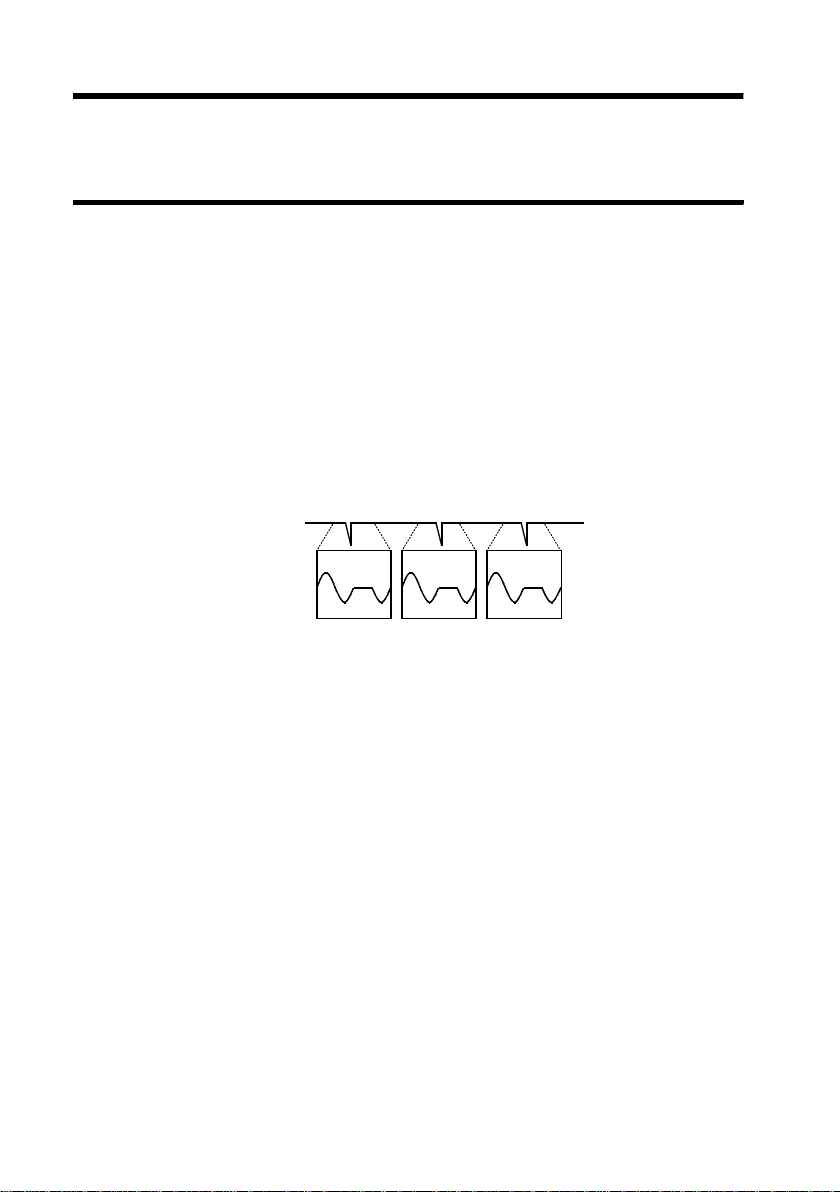
74
_____________________________________________________________________
4.5 Instantaneous Waveform Recording
(Memory Record)
4.5.1 Setting the Instantaneous Waveform
Recording
When Instantaneous Waveform Recording is enabled, an
abnormal phenomena that occurs during measurement is
captured by the trigger and recorded in parallel by the
Instantaneous Waveform Recording using high-speed
sampling.
Sequential Save Recording Function
Multiple waveforms can be recorded
______________________________________________________________
4.5 Instantaneous Waveform Recording(Memory Record)
Page 91

_____________________________________________________________________
Procedure Screen: Basic Setting
75
(1) Set Instantaneous Waveform Recording on or off.
1. Press the SET key to display the Basic Setting screen.
2. Move the flashing cursor to the Memory Record
(Instantaneous Waveform Recording) item and set to on
or off using the
keys to make a setting.
Flashing cursor
OFF
Disables Instantaneous Waveform Recording
(Memory Recording)
ON
Enables Instantaneous Waveform Recording
(Memory Recording)
NOTE
If the power supply is interrupted during measurement and
Instantaneous Waveform Recording is enabled, then the
effective value waveform data will not be saved but
instantaneous waveform data will be saved.
(2) Set the time axis of the Instantaneous Waveform
Recording.
When Instantaneous Waveform Recording is turned on,
settings for the memory waveform are displayed.
Set the time axis for the memory waveform.
Move the flashing cursor to Time/DIV and use the
keys to make a setting.
Flashing cursor
______________________________________________________________
4.5 Instantaneous Waveform Recording(Memory Record)
Page 92

76
_____________________________________________________________________
(3) Set the recording length the Instantaneous
Waveform Recording.
Move the flashing cursor to Shot and use the
keys to
make a setting.
Flashing cursor
(4) Set the trigger for the Instantaneous Waveform
Recording. For details, see Section 4.5.2.
Recording Length and Sequential Save
The maximum number of events that can be sequentially
recorded (the sequence limit) depends on the recording
length set for each event. For sequential save operation, the
internal memory is partitioned for storing multiple sets of
data.
When the number of waveforms acquired reaches the
sequence limit, no more waveforms will be acquired in
response to further trigger events.
Refer to Section "6.4.2 Sequential Save Function" for the
details.
______________________________________________________________
4.5 Instantaneous Waveform Recording(Memory Record)
Page 93

_____________________________________________________________________
77
4.5.2 Setting the Instaneous Waveform Trigger
・ The term "trigger" refers to a signal which is used to
control the timing for recording start. The term
"triggering has occurred" refers to the state when such a
signal has activated recording start.
・ Instantaneous waveform triggering can be set when
instantaneous waveform recording in the RMS Trend
Measurement Mode is enabled (ON).
・ The instantaneous waveform trigger can be set on each
CH SETTING screen, or on the Instantaneous Waveform
Display screen in RMS Trend Measurement Mode. This
document mainly describes the CH SETTING screen
settings.
Press the
CH1 - 4key
Instantaneous Waveform Trigger Types and Primary
Applications
・ RMS Level Trigger
Instantaneous power trend waveforms
・ RMS Window In/Out Trigger
Instantaneous power trend waveforms
・ Voltage Drop Trigger
Voltage Dropouts, Instantaneous stop waveforms
・ Leve l Trigger and Window In/Out Trigge
______________________________________________________________
DC measure voltage (100V DC range only)
4.5 Instantaneous Waveform Recording(Memory Record)
Page 94

78
_____________________________________________________________________
・ A trigger condition can be enabled by setting an OR
condition with other triggers. The OR condition causes a
trigger to occur when any of several trigger conditions are
satisfied.
・ Pre-trigger and external trigger settings can be made only
on the CH SETTING screen.
・ Refer to 5.6 "External Trigger Function" for external
trigger details.
・ Refer to Sections 3.5.1 and 3.5.2 for the trigger under the
100 V DC range condition.
______________________________________________________________
4.5 Instantaneous Waveform Recording(Memory Record)
Page 95

_____________________________________________________________________
79
4.5.3 RMS Level Trigger
Triggering occurs when the input signal crosses the preset
trigger level (rms value) with the preset trigger slope (
).
,
Trigger level
RMS value
Input signal
Procedure Screen: CH SETTING / Waveform Display
1. Press the CH SET key to display the desired
2. Move the flashing cursor to the TRIG position and select
Trigger point
Upward trigger direction
(slope :
)
CH SETTING screen.
RMS using the
keys.
Trigger point
Downward trigger direction
(slope :
)
Flashing cursor
3. Move the flashing cursor to the position shown in the
figure below, and set the trigger level using the
keys.
______________________________________________________________
4.5 Instantaneous Waveform Recording(Memory Record)
Page 96

80
_____________________________________________________________________
Flashing cursor
4. Move the flashing cursor to the position shown in the
figure below, and set the trigger slope using the
keys.
Flashing cursor
Triggering occurs when the rising trigger
slope (
) crosses the trigger level.
Triggering occurs when the falling trigger
slope (
) crosses the trigger level.
______________________________________________________________
4.5 Instantaneous Waveform Recording(Memory Record)
Page 97
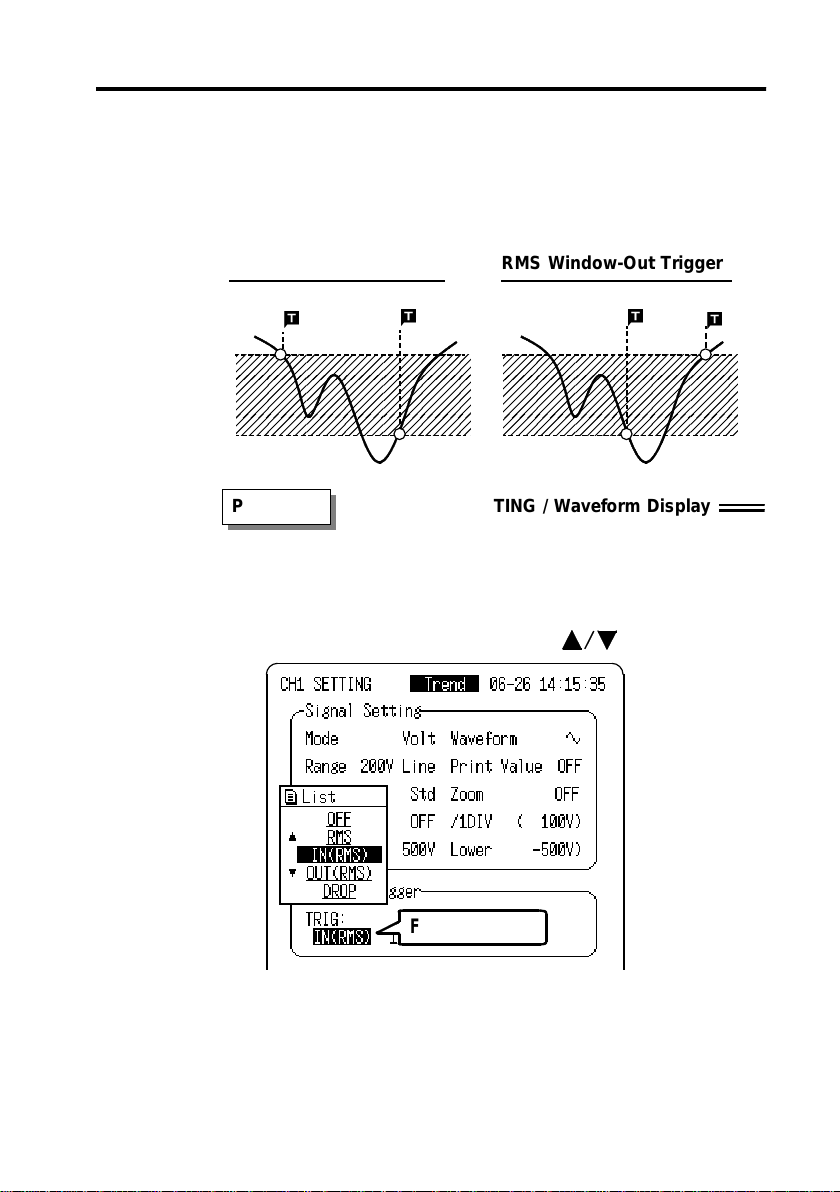
_____________________________________________________________________
4.5.4 RMS Window-In/Out Trigger
Set RMS upper limit level and lower limit level and
activated when the input signal enters or leaves the range
between these limits.
81
RMS Window-In Trigger
RMS Window-Out Trigger
Procedure Screen: CH SETTING / Waveform Display
1. Press the CH SET key to display the desired
CH SETTING screen.
2. Move the flashing cursor to the TRIG position and select
IN(RMS) or OUT(RMS) using the
keys.
Flashing cursor
______________________________________________________________
4.5 Instantaneous Waveform Recording(Memory Record)
Page 98

82
_____________________________________________________________________
3. Move the flashing cursor to the position shown in the
figure below, and set the lower limit of the trigger level
using the
keys.
Flashing cursor
4. Move the flashing cursor to the upper limit, and set the
upper limit of the trigger level using the
keys.
The upper limits must not be smaller than the lower
limits, or the lower limits must not be larger than the
upper limits.
If a trigger condition exists at the time of starting
measurement, the trigger will be activated simultaneously
with the start of measurement.
______________________________________________________________
4.5 Instantaneous Waveform Recording(Memory Record)
Page 99

_____________________________________________________________________
83
4.5.5 Voltage Drop Trigger
When the peak of the voltage falls lower than the setting
RMS level, the trigger will occur.
Procedure Screen: CH SETTING / Waveform Display
1. Press the CH SET key to display the desired
CH SETTING screen.
2. Move the flashing cursor to the TRIG position and select
DROP using the
keys.
Flashing cursor
______________________________________________________________
4.5 Instantaneous Waveform Recording(Memory Record)
Page 100

84
_____________________________________________________________________
3. Move the flashing cursor to the position shown in the
figure below, and set the frequency to be measured using
the
keys.
Flashing cursor
50 Hz
This measurement is made using a 50-Hz
commercial power supply.
60 Hz
This measurement is made using a 60-Hz
commercial power supply.
4. Move the flashing cursor to the position shown in the
figure below, and set the trigger RMS level using the
keys.
Flashing cursor
・ The settable range of the trigger level is limited by the
selected measurement range.
・ When the Voltage Drop trigger level setting is made on
the Waveform Display screen, a level bar (dotted line) is
displayed at the top of the screen to indicate the set level.
______________________________________________________________
4.5 Instantaneous Waveform Recording(Memory Record)
 Loading...