

Page 1

Instruction Manual
3390
POWER ANALYZER
December 2010 Revised edition 1 3390A981-01 10-12H
Page 2

Page 3

Contents
Introduction.................................................................................1
i
Contents
1
Confirming Packa g e Co n te n ts.............. .. ... .. ... ..................... ... .. ..1
Safety Notes... .. .. ...................... .. ... .. ...................... .. ... .. ..............3
Usage Notes................................................. ..............................5
Chapter 1
Overview___________________________________ 9
1.1 Product Overview ................................................................9
1.2 Features ........................................................ .................... 10
1.3 Operating Overview ..........................................................12
Chapter 2
Names and Functions of Parts,
Basic Operations & Screens__________________ 13
2.1 Names and Functions of Parts ..........................................13
2.2 Basic Operations ........................................... ............ ........16
2
3
4
5
6
7
2.3 Display Items and Screen Types ......................................17
2.3.1 Common Disp la y Ite m s ................... .......................................17
2.3.2 Measurement Scr een .............................................................18
2.3.3 Screen Types ............................ ................ .............................19
Chapter 3
Measurement Preparations___________________ 23
3.1 Operations in general ........................................................23
3.2 Initial Instrument Preparations ..........................................24
3.3 Pre-Operation Inspection ..................................................26
3.4 Connecting the Power Cord ..............................................27
3.5 Grounding the Instrument's Functional Earth
(when measuring in noisy environments) .........................27
3.6 Connecting the Voltage Measurement Cables .................28
3.7 Connecting the Current Sensors .......................................28
3.8 Turning the Power On and Off ..........................................29
8
9
10
11
12
付
3.9 Selecting the Wiring Mode ................................................30
3.10 Attaching to the Lines to be Measured and Zero Adjustment 34
3.11 Verifying Correct Wiring (Connection Check) ...................36
録
索
引
Page 4

ii
Contents
Chapter 4
Viewing Measurement Values_________________37
4.1 Measurement Value Display Procedure ...........................37
4.2 Viewing Power Measurements, and Changing the
Measurement Configuration .............................................41
4.2.1 Displaying Power Measurements .......................................... 41
4.2.2 Selecting Ranges ...................................................................43
4.2.3 Selecting the Sync Source ..................................................... 47
4.2.4 Frequency Measurement Settings .........................................49
4.2.5 Selecting the Rectification Method .........................................50
4.2.6 Setting Scaling (when using VT(PT) or CT) ...........................51
4.2.7 Setting the Low-Pass Filter .................................................... 52
4.3 Integration Value Observation ..........................................53
4.3.1 Displaying Integration Values ................................................53
4.3.2 Setti ng the Integration Mode ........................................ ..........56
4.3.3 Manual Int egration Method ................. ................ ...................57
4.3.4 Integration Combined with Timing Control .............................59
4.4 Viewing Harmonic Measurement Values ..........................62
4.4.1 Displayi ng the Harmonic Bar Graph ....................... .. .............62
4.4.2 Displaying the Harmonic List .................................................64
4.4.3 Displaying Harmonic Vectors ................................................. 65
4.4.4 Selecting the Harmonic Sync So ur c e .................................... 67
4.4.5 Selectin g the THD Calculation Method ............................ .. .... 68
4.5 Viewing Waveforms ..........................................................69
4.5.1 Displaying Waveforms ........................................................... 69
4.5.2 Resizing Waveforms .............................................................. 71
4.6 Viewing Noise Measurement Values (FFT Function) .......72
4.6.1 Displaying Noise Voltage and Current ...................................72
4.6.2 Setting the Sampling Frequency and Points ..........................73
4.6.3 Setting the Minimum Noise Frequency ..................................74
4.6.4 Measurement Channel and Window Function Settings ......... 76
4.7 Viewing Efficiency and Loss Measurement Values ..........77
4.7.1 Displaying E ffi c iency and Loss ... ...................................... .....77
4.7.2 Selecting the Calculation Formu la ......................................... 78
4.7.3 Measuremen t E x a m p le s ........... .. .................... ....................... 79
4.8 Viewing Motor Measurement Values
(With Hioki 9791 or 9793 installed) ...................................82
4.8.1 Motor Input Settings ...............................................................84
4.8.2 Measuring Mo to r Electrical Angle ............. ............................. 89
Page 5

Chapter 5
11
Operating Functions ________________________ 91
5.1 Timing Control Functions ..................................................91
iii
Contents
11
5.2 Averaging Function ...........................................................93
5.3 Data Hold and Peak Hold Functions .................................94
5.3.1 Data Hold Function .................................................................94
5.3.2 Peak Hold Function ..................................... .. .........................95
5.4 X-Y Plot Function ..............................................................97
5.5
Chapter 6
Changing System Settings ___________________99
6.1 Initializing the Instrument (System Reset) ......................101
6.2 Factory Default Settings ..................................................102
Chapter 7
Data Saving and File Operations _____________103
7.1 Inserting and Removing Storage Media ..........................104
7.2 The File Operation Screen ..............................................105
Δ-YConversion Function ...................................................98
12
12
13
3
4
4
5
5
6
6
7
7
7.3 CF Card Formatting ........................................................106
7.4 Saving Operations ..........................................................107
7.5 Measurement Data Saving .............................................108
7.5.1 Manually Saving Measurement Data ....................................108
7.5.2 Auto-Saving Measurement Data ..........................................110
7.5.3 Selecting Measurement Items to Save .................................112
7.6 Saving Waveform Data ...................................................114
7.7 Saving Screen Capture Images ......................................114
7.8 Saving Setting Configurations .........................................115
7.9 Reloading Setting Configurations ...................................116
7.10 File and Folder Operations .............................................117
7.10.1 Creating Folders ...................................................................117
7.10.2 Copying Files and Folders ................................. ...................118
7.10.3 Deleting Files and Folders ....................................................120
7.10.4 Renaming Files and Folders .................................................121
8
9
10
付
録
索
引
Page 6

iv
Contents
Chapter 8
Connecting External Devices ________________123
8.1 Connecting a Printer (to print captured screen images) .123
8.1.1 Printer Preparation and Connection .....................................124
8.1.2 Settings to Use Printer ......................................................... 125
8.1.3 Printing Screen Captures .....................................................126
8.2 Connecting a Thermometer (to acquire temperature data) 127
8.3 Connecting Multiple 3390 (Synchronized Measurements) 129
8.4 Using Analog and Waveform D/A Output Options
(must be factory installed before shipping) .....................132
8.4.1 Connecting Application-Specific Devic es to the Instrument .132
8.4.2 Output Item Selection ..........................................................134
8.4.3 Output Level ........................................................................ 136
8.4.4 D/A Output Exa m p le s ................................................... ....... 137
8.5 Using the Motor Testing Option (when specified before
factory shipping, for motor analysis) ...............................138
Chapter 9
Operation with a Computer __________________141
9.1 Control and Measurement via Ethernet ("LAN") Interface 142
9.1.1 LAN Settings and Network Environment Configuration ....... 142
9.1.2 Instrument Connection .........................................................144
9.2 Remote Control of the Instrument by Internet Browser ..146
9.2.1 Connecti ng to the Instrument ...............................................146
9.2.2 Operati ng Procedure ...........................................................147
9.3 Control and Measurement via USB Interface .................148
9.3.1 Connecti ng to the Instrument ...............................................148
9.3.2 After Connec ting .......... ..................................... ................... 14 8
Chapter 10
Specifications_____________________________149
10.1 General Specifications ....................................................149
10.2 Functions Specifications .................................................156
10.3 Setting Specifications .....................................................160
10.4 Measurement Item Details ..............................................162
10.5 Calculation Formula Specifications .................................166
Page 7

Chapter11
11
Maintenace and Service ____________________ 175
11.1 Cleaning ........................................................ .................. 175
v
Contents
11
11.2 Trouble Shooting .............................................................175
11.3 Error Indication ................................................................177
11.4 Disposing of the Instrument ............................................181
Appendix__________________________________A1
Appendix1Block Diagram............................................................. A1
Appendix2Measurement Data Saving Format.............................. A2
Appendix3Physical Illustration...................................................... A4
Appendix4Rack Mounting............................................................. A5
Index ______________________________________ i
12
12
13
3
4
4
5
5
6
6
7
7
8
9
10
Appendix
Index
Page 8

vi
Contents
Page 9
Introduction
3390 POWER ANALYZER ....................... 1
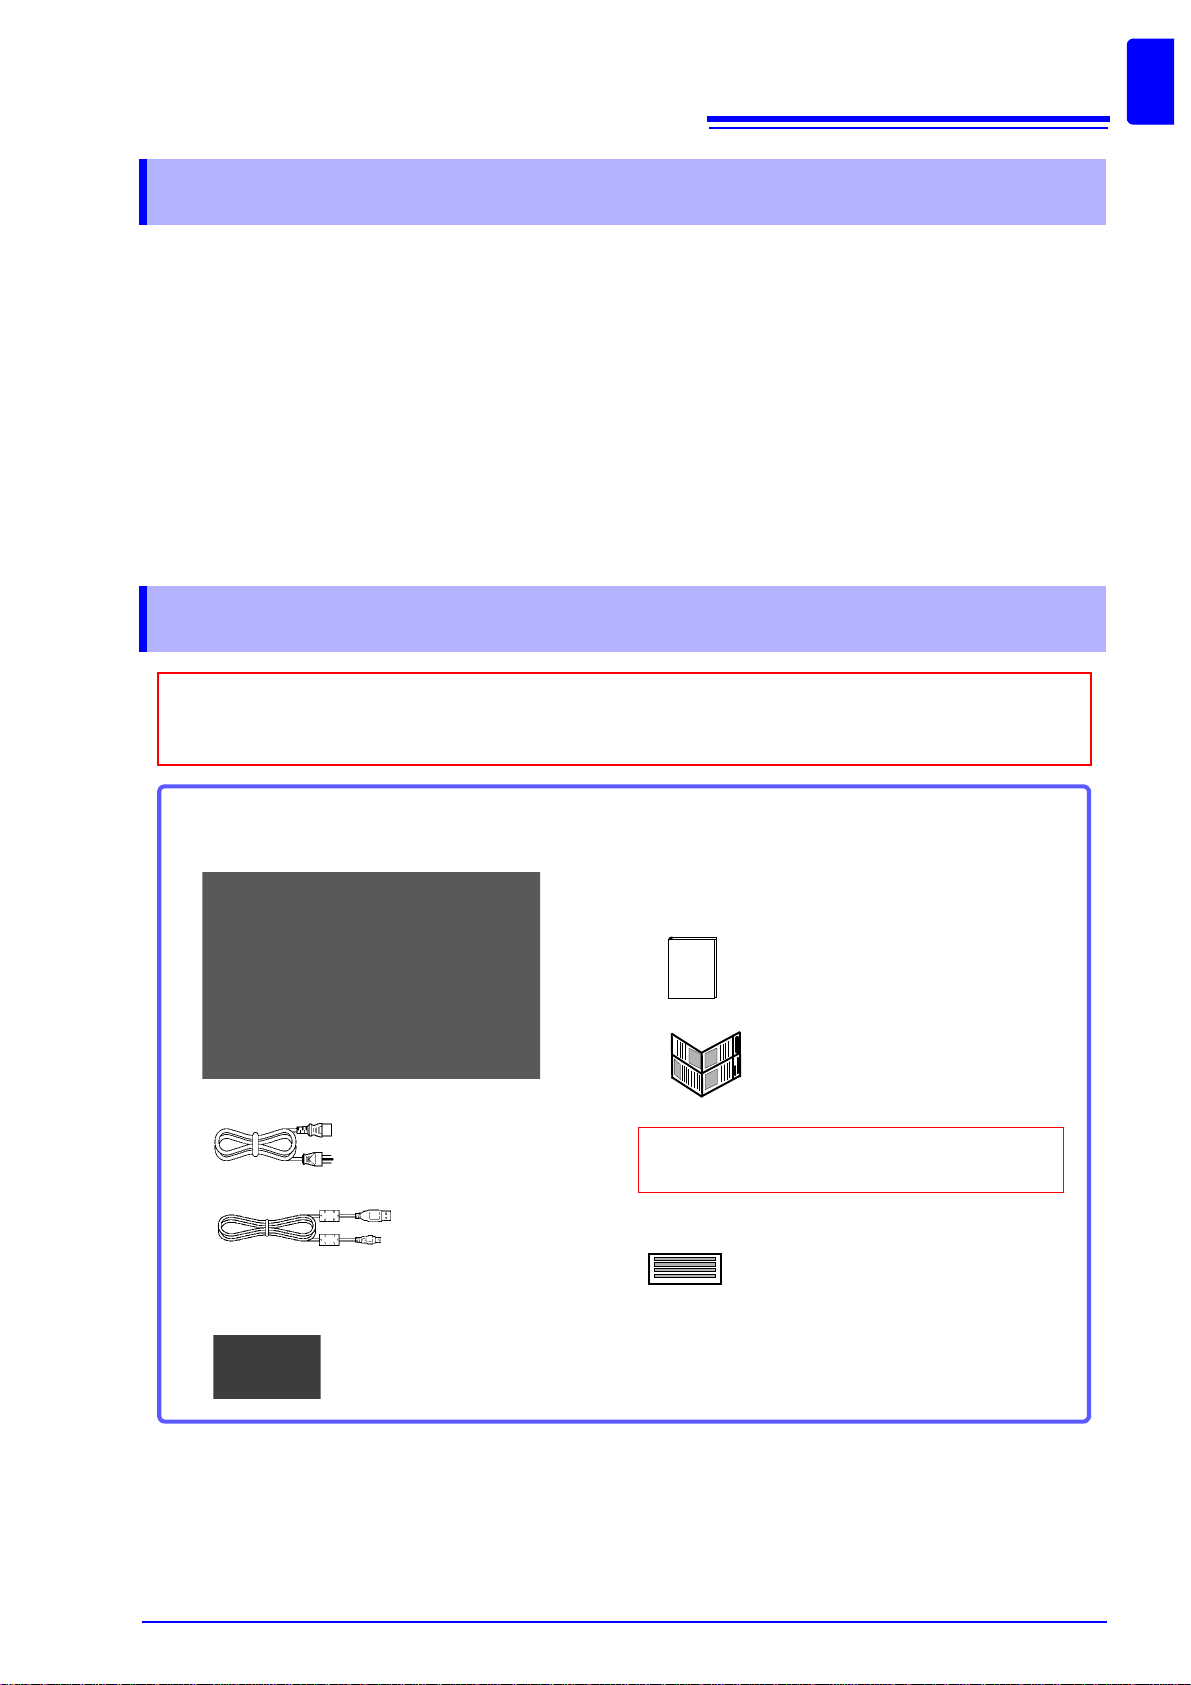
Confirm that these contents are provided.
Accessories
When you recei ve the instrument, in spect it careful ly to ensure that no damage occurred dur ing shipping. In particular, check the accesso ries, panel swit ches, and con nectors. If dam age is eviden t, or if it
fails to operate according to the specifications, contact your dealer or Hioki representative.
Instruction Manual......................................1
Measurement Guide...................................1
Grounded power cord................................ 1
USB Cable........... ...... ....... ......................... 1
D-Sub Connector....................................... 1
(for use only with Model 9792 or
9793 D/A output options)
Input Cable Labels....... ...... ....... ...... ....... .... 2
(to identify volta ge cab le lea ds and input ch ann els)
Please attach to the instrument before use.
(p. 24)
Introduction
Thank you for purcha si ng t he HI OKI " 339 0 P OW ER ANALYZER". To obtain maximum performance fr om
the product, please read this manual first, and keep it handy for future reference.
In this document, the "instrument" means the Model 3390 Power Analyzer.To measure current, the power
analyzer requires cla mp- o n c urr ent prob es o r AC /DC c urr en t p ro bes ( Opti ons , ( p. 2), a fter war ds re ferr ed
to generically as “current sensors”). See your current sensor’s instruction manual for details.
Registered trademarks
• CompactFlash is a regi ste red tr ade mar k of Sa ndi s k Corp or ation ( USA ) .Wind ows is a regis te re d trademark of Microsoft Corporation in the United States and/or other countries.
• Sun, Sun Micros ystems, Java, and any logos containing S un or Java are trademarks or register ed
trademarks of Sun Microsystems, Inc. in the United States and other countries.
• Adobe and Reader are either regist ered tradem arks or trademar ks of Ado be Systems In corporated in
the United States and/or other countries.
Confirming Package Contents
1
Page 10
2
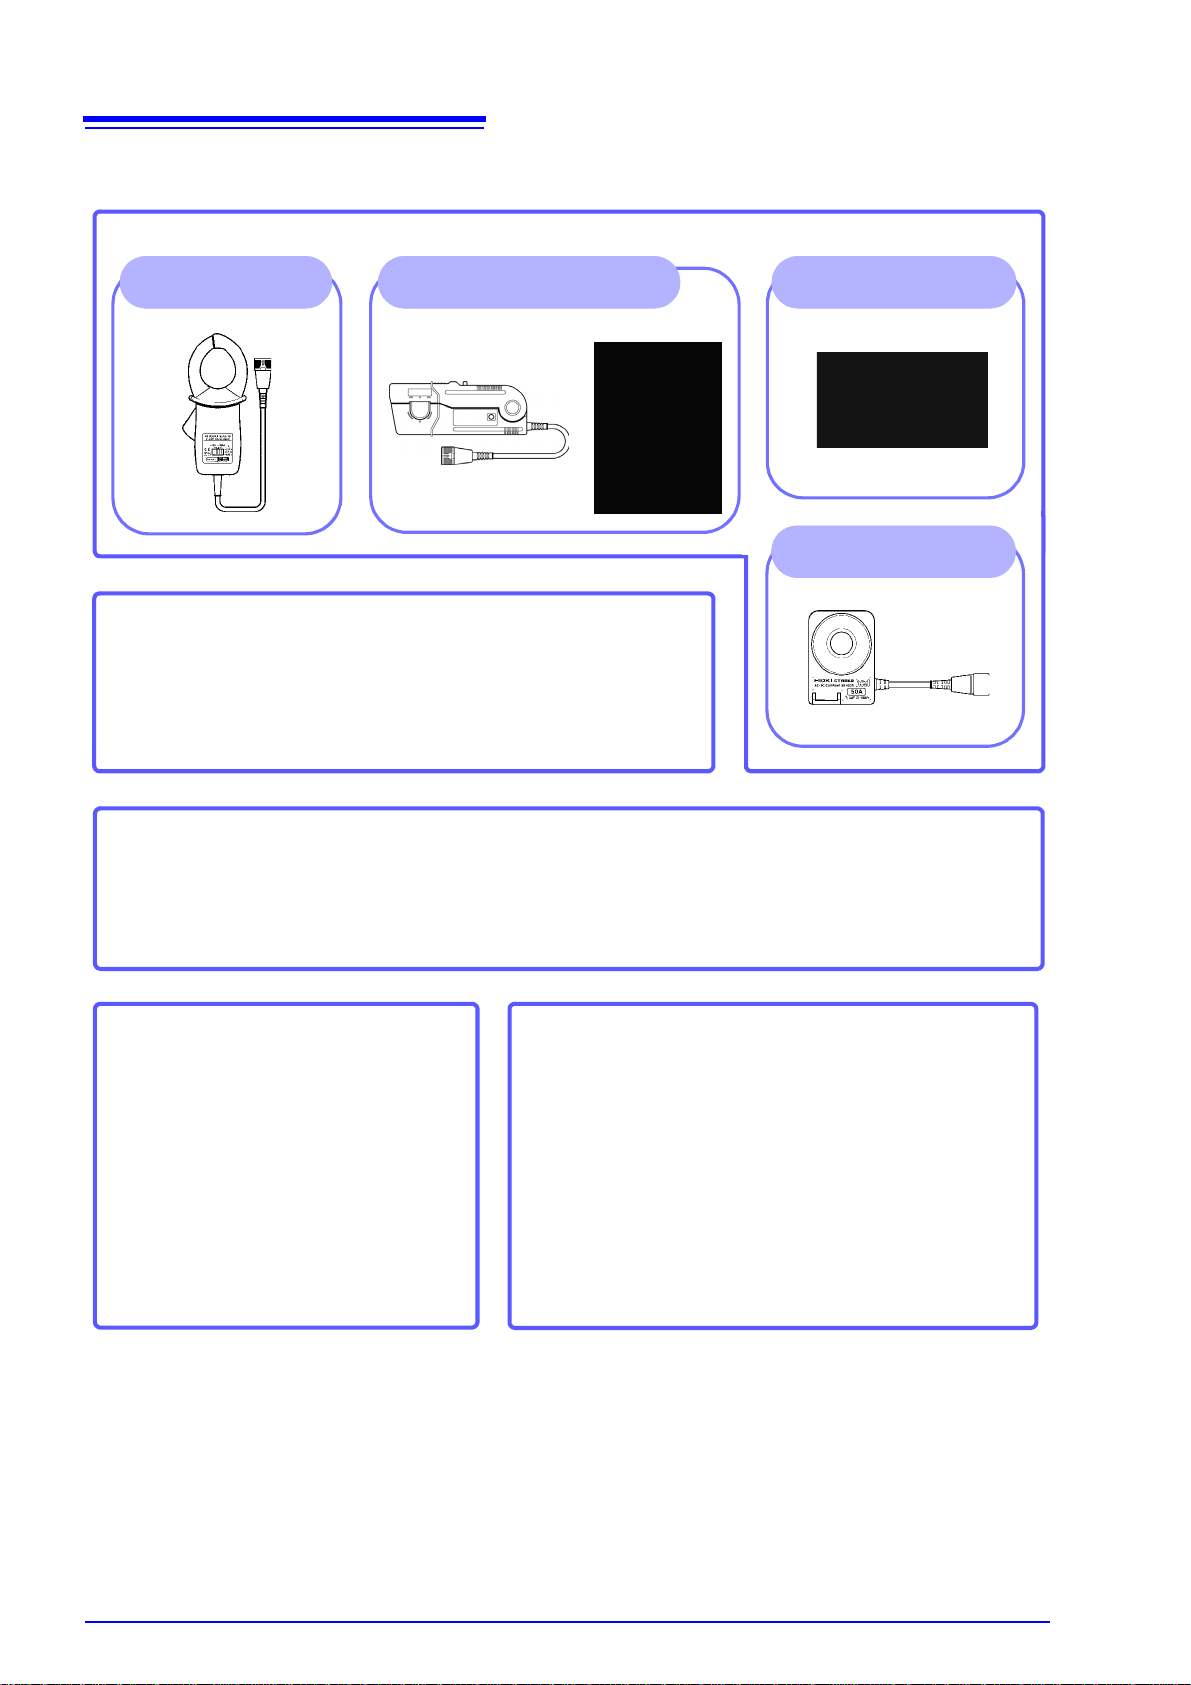
9272-10
Clamp On Sensor
Option
Others
• 9794 Carrying Case
• L9217 Connection Cord
(for Model 9791 and the 9793)
See "8.5 Using the Motor Testing Option (when specified
before factory shipping, for motor analysis)" (p. 138)
• 9683 Connection Cable (for synchronization)
See "Connecting Multiple 3390 (Synchronized Measure-
ments)" (p. 129)
Current Sensors
For Vol tage Measurement
• L9438-50 Voltage Cord (p. 24)
• 9243 Grabber Clip
• 9448 Concent Input Cord
For Computer Connection
• 9642 LAN Cable
• 9726 PC Card 128M
(128MB CFCard + Adapter)
• 9727 PC Card 256M
(256MB CFCard + Adapter)
• 9728 PC Card 512M
(512MB CFCard + Adapter)
• 9729 PC Card 1GB
(1GB CFCard + Adapter)
• 9830 PC Card 2GB
(2GB CFCard + Adapter)
9277, 9278, 9279
Universal Clamp On CT
For Printing
• 9670 Printer (includes one thermal paper roll, Sanei Electric Model BL-80RS II)
• 9671 AC Adapter (Sanei Electric Model BL-100W)
• 9237 RECORDING PAPER (thermal paper 80 mm × 25 m, 4 rolls)
• 9638 RS-232C Cable
CT6862, CT6863
AC/DC Current Sensor
9709
AC/DC Current Sensor
Confirming Package Contents
Page 11
Safety Notes
Safety Notes
This instrument is designed to comply with IEC 61010 Safety Standards, and has
been thoroughly tested for safety prior to shipment. However, mishandling during use could result in injury or death, as well a s damage t o the instrume nt. However, using the instrument in a way not described in this manual may negate the
provided safety features.
Be certain that you understand the instructions and precautions in the manual
before use. We disclaim any responsibility for accidents or injuries not resulting
directly from instrument defects.
This manual contains infor mation and warnings es sential for sa fe operati on of the produc t and for ma intaining it in safe operating condi tion. Before using the product, be sure to carefully read the following
safety notes.
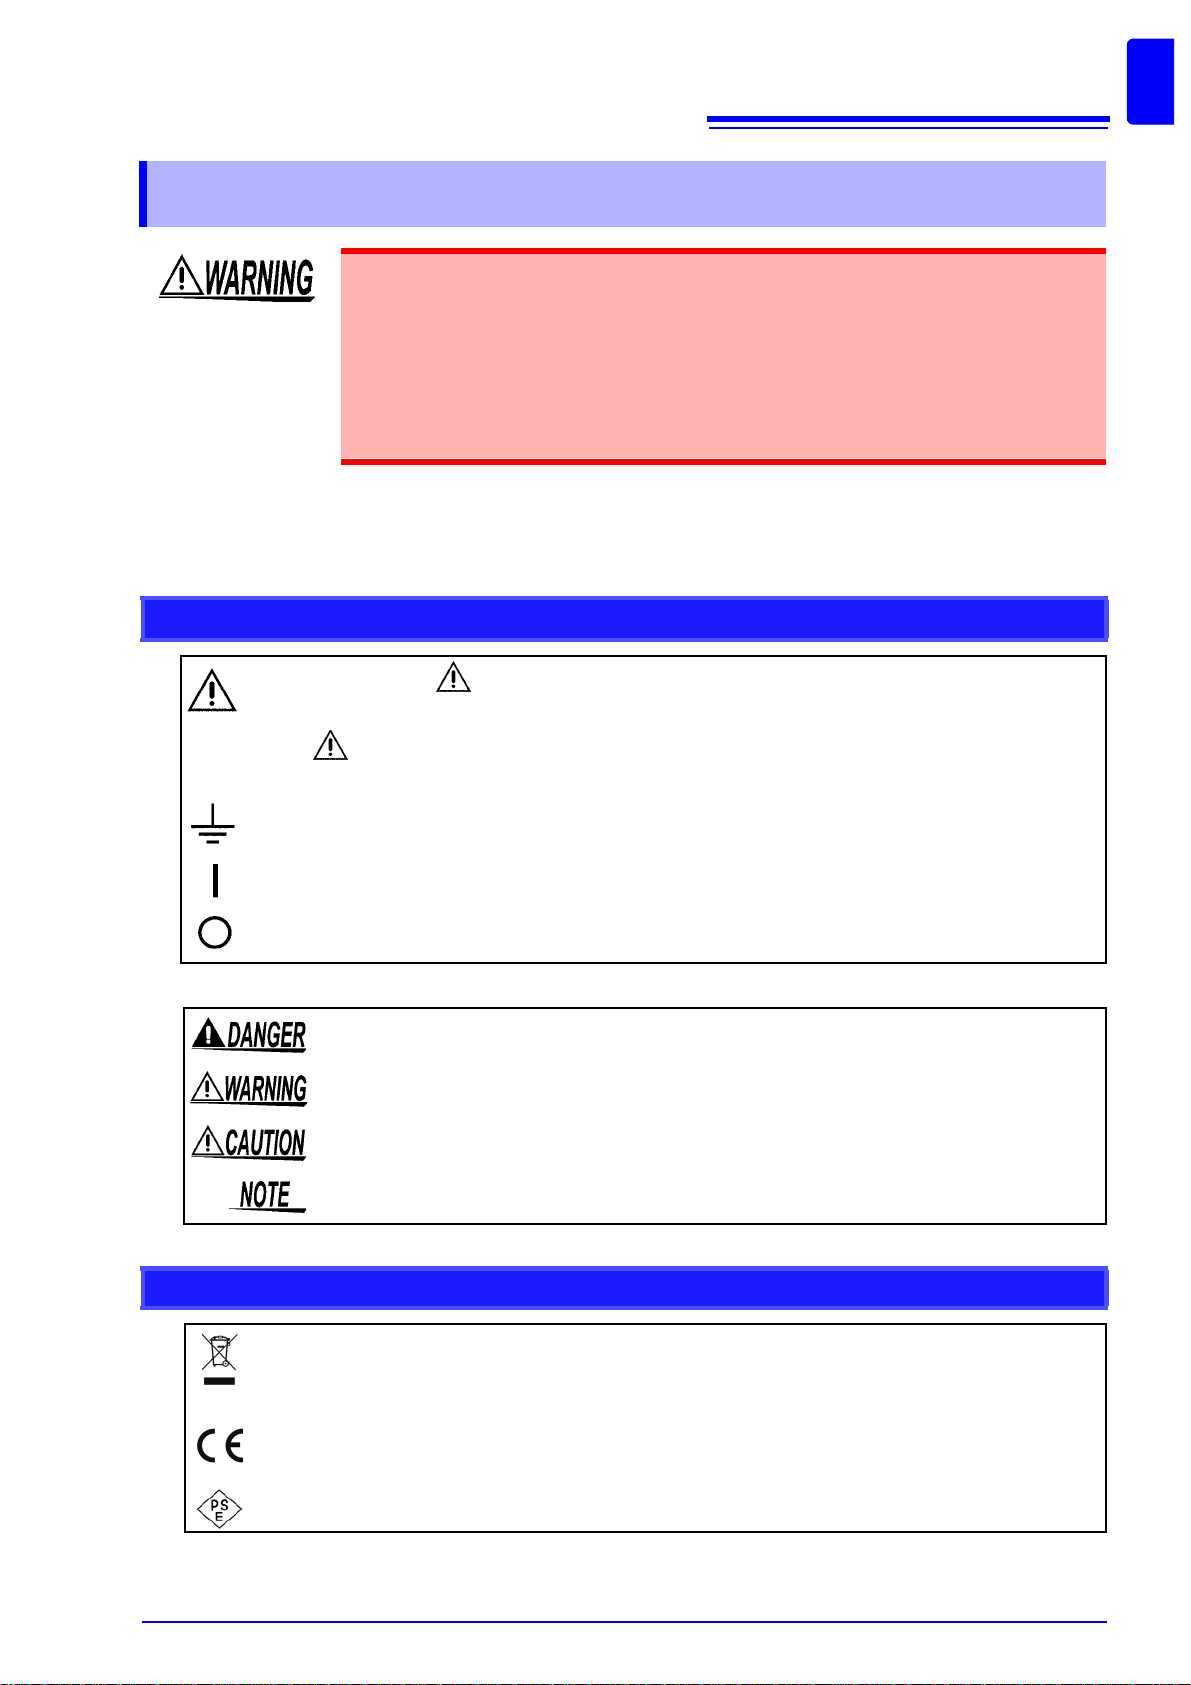
Safety Symbols
3
In the manual, the symbol indicates particularly important information that the user should
read before using the product.
The symbol printed on the product indicates that the user should refer to a corresponding
topic in the manual (marked with the symbol) before using the relevant function.
Indicates a grounding terminal.
Indicates the ON side of the power switch.
Indicates the OFF side of the power switch.
The following symbols in this manual indicate the relative importance of cautions and warnings.
Indicates that incorrect operation presents a significant hazard that could result in serious injury
or death to the user.
Indicates that incorrect operation presents a significant hazard that could result in serious injury
or death to the user.
Indicates that incorrect operation presents a possibility of injury to the user or damage to the
product.
Advisory items related to performance or correct operation of the product.
Symbols for Various Standards
WEEE marking:
This symbol indicates that the electrical and electronic appliance is put on the EU market after August
13, 2005, and producers of the Member States are required to display it on the appliance under Article
11.2 of Directive 2002/96/EC (WEEE).
This symbol indicates that the product conforms to safety regulations set out by the EC Directive.
This symbol indicates applicability to the Electrical Appliance and Material Safety law (Japan on ly).
Page 12
4
Safety Notes
Other Symbols
Symbols in this manual
Indicates the prohibited action.
(p. )
*
[ ]
CURSOR
(Bold character)
Windows
Dialog
Indicates the location of reference information.
Indicates quick references for operation and remedies for troubleshooting.
Indicates that descriptive information is provided below.
Menus, commands, dialogs, buttons in a dialog, and other names on the screen and the keys
are indicated in brackets.
Bold characters within the text indicate operating key labels.
Unless otherwise specified, “Windows” represents Windows 95, 98, Me, Widows NT4.0, Windows 2000, Windows XP, or Windows Vista.
Dialog box represents a Windows dialog box.
Mouse action terminology
Click: Press and quickly release the left button of the mouse.
Right-click: Press and quickly release the right button of the mouse.
Double click: Quickly click the left button of the mouse twice.
Drag:
Activate: Click on a window on the screen to activate that window.
While holding down the left button of the mouse, move the mouse and then release the left
button to deposit the chosen item in the desired position.
Accuracy
We define measurement tol erances in terms of f.s. ( full sc ale), rdg. (readi ng) and dg t. (dig it) val ues, wi th
the following meanings:
f.s. (maximum display value or
scale length):
rdg. (reading or displayed value): The value currently being measured and indicated on the measuring instrument.
dgt. (resolution): The smallest disp layable unit o n a digital m easuring instru ment, i.e., the input
The maximum displ ay abl e v alu e o r scale length. This is u sua ll y th e name of
the currently selected range.
value that causes the d igital display to show a "1" as the l east-significa nt digit.
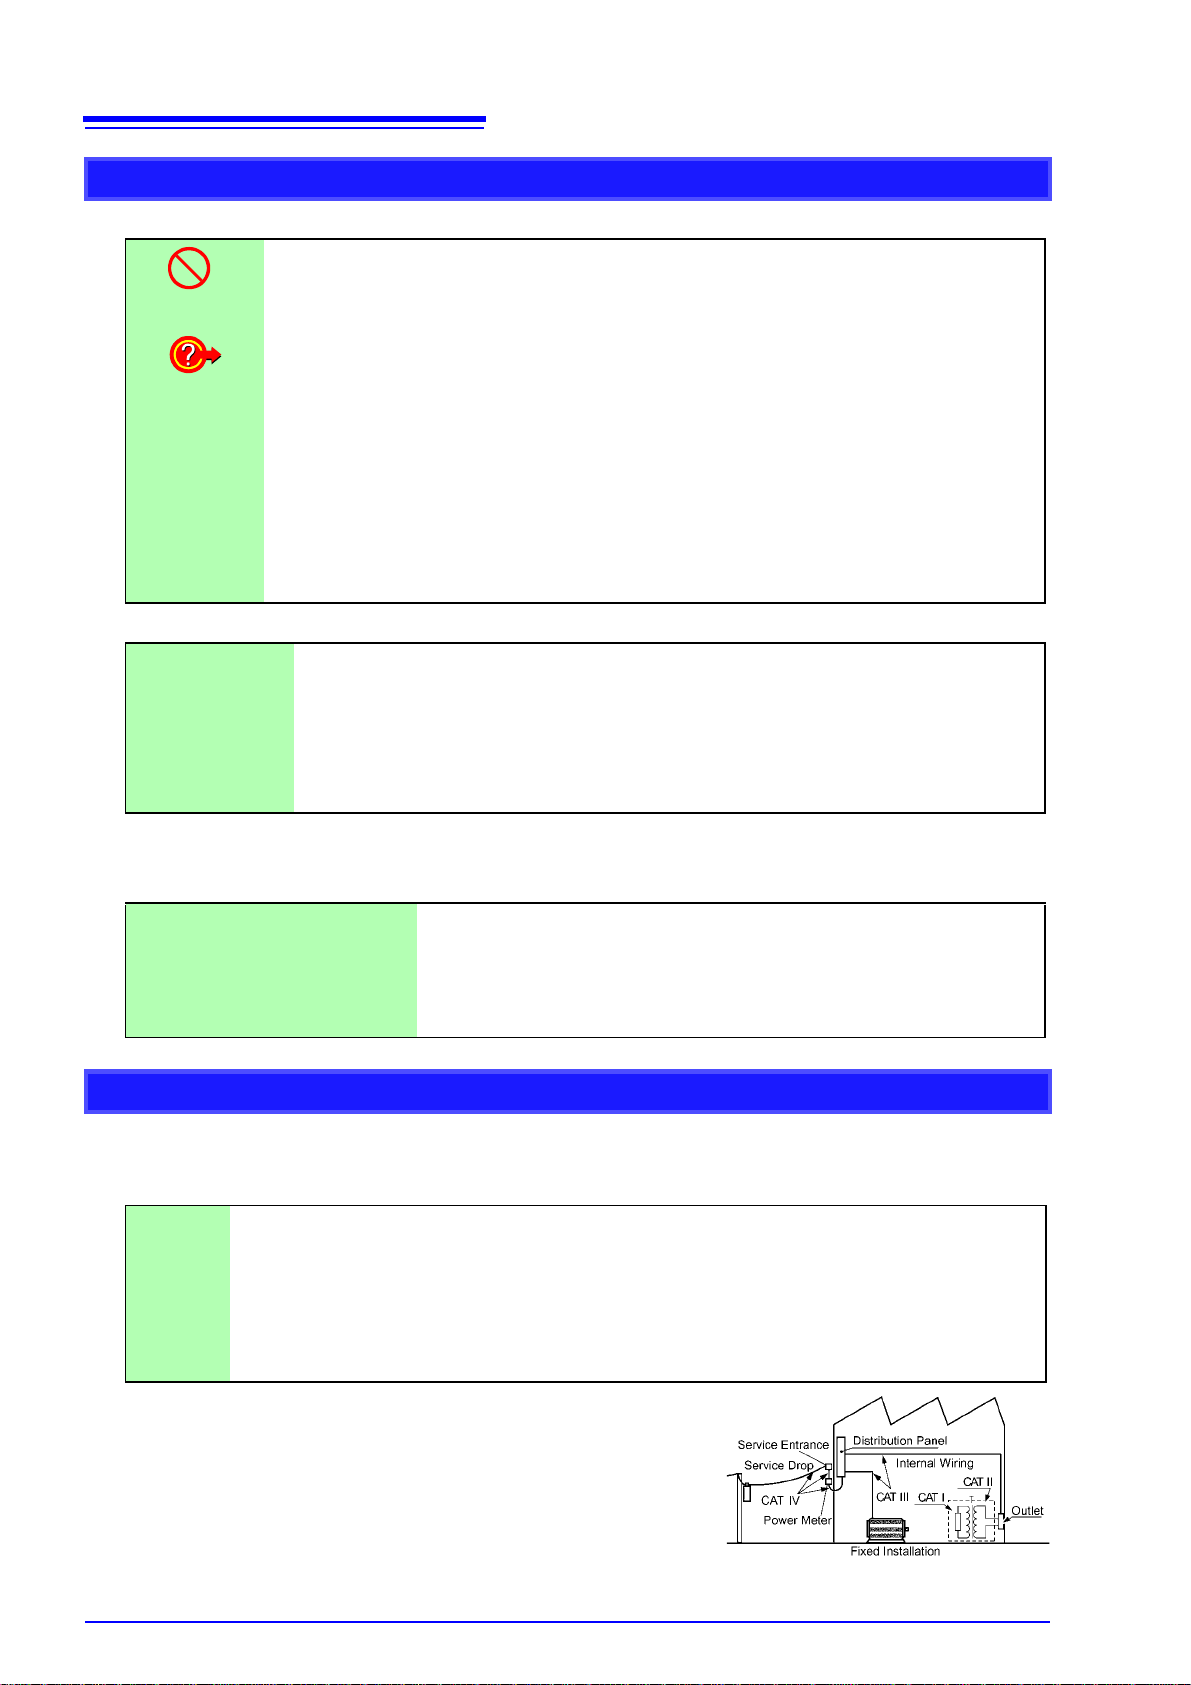
Measurement categories (Overvoltage categories)
This instrument complies with CAT II (1000 V)/ III (600 V) safety requirements.
To ensure saf e operation o f measur ement instr uments, IEC 61010 establishe s safety standards for v arious electrical envi r onm ents, c ateg oriz ed as C AT I to CAT IV, and called measurem ent categories. These
are defined as follows.
CAT Ⅰ :
CAT Ⅱ :
CAT Ⅲ :
CAT Ⅳ :
Higher-numbered categories correspond to electrical environments
with greater momentary energy. So a measurement device
designed for CAT III environments can endure greater momentary
energy than a device designed for CAT II.
Using a measurement instrument in an envi ronment designat ed with a
higher-numbered category than that for which the instrument is rated
could result in a seve re accid ent, an d m ust be car efu lly avoi ded.
Never use a CAT I measuring instrument in CAT II, III, or IV environments.
The measurement categories comply with the Overvoltage Categories of the IEC60664 Standards.
Secondary electrical circuits connected to an AC electrical outlet through a transformer or similar device.
Primary electrica l circuits i n equipmen t connected to an AC el ectrical outle t by a pow er cord (por table
tools, household appliances, etc.) CAT II covers directly measuring electrical outlet receptacles.
Primary electrical circuits of heav y equipment (fixed installations) c onnected directly to the distribution
panel, and feeders from the distribution panel to outlets.
The circuit from the service drop to the service entrance, and to the power meter and primary over-
current protection device (distribution panel).
Page 13
Usage Notes
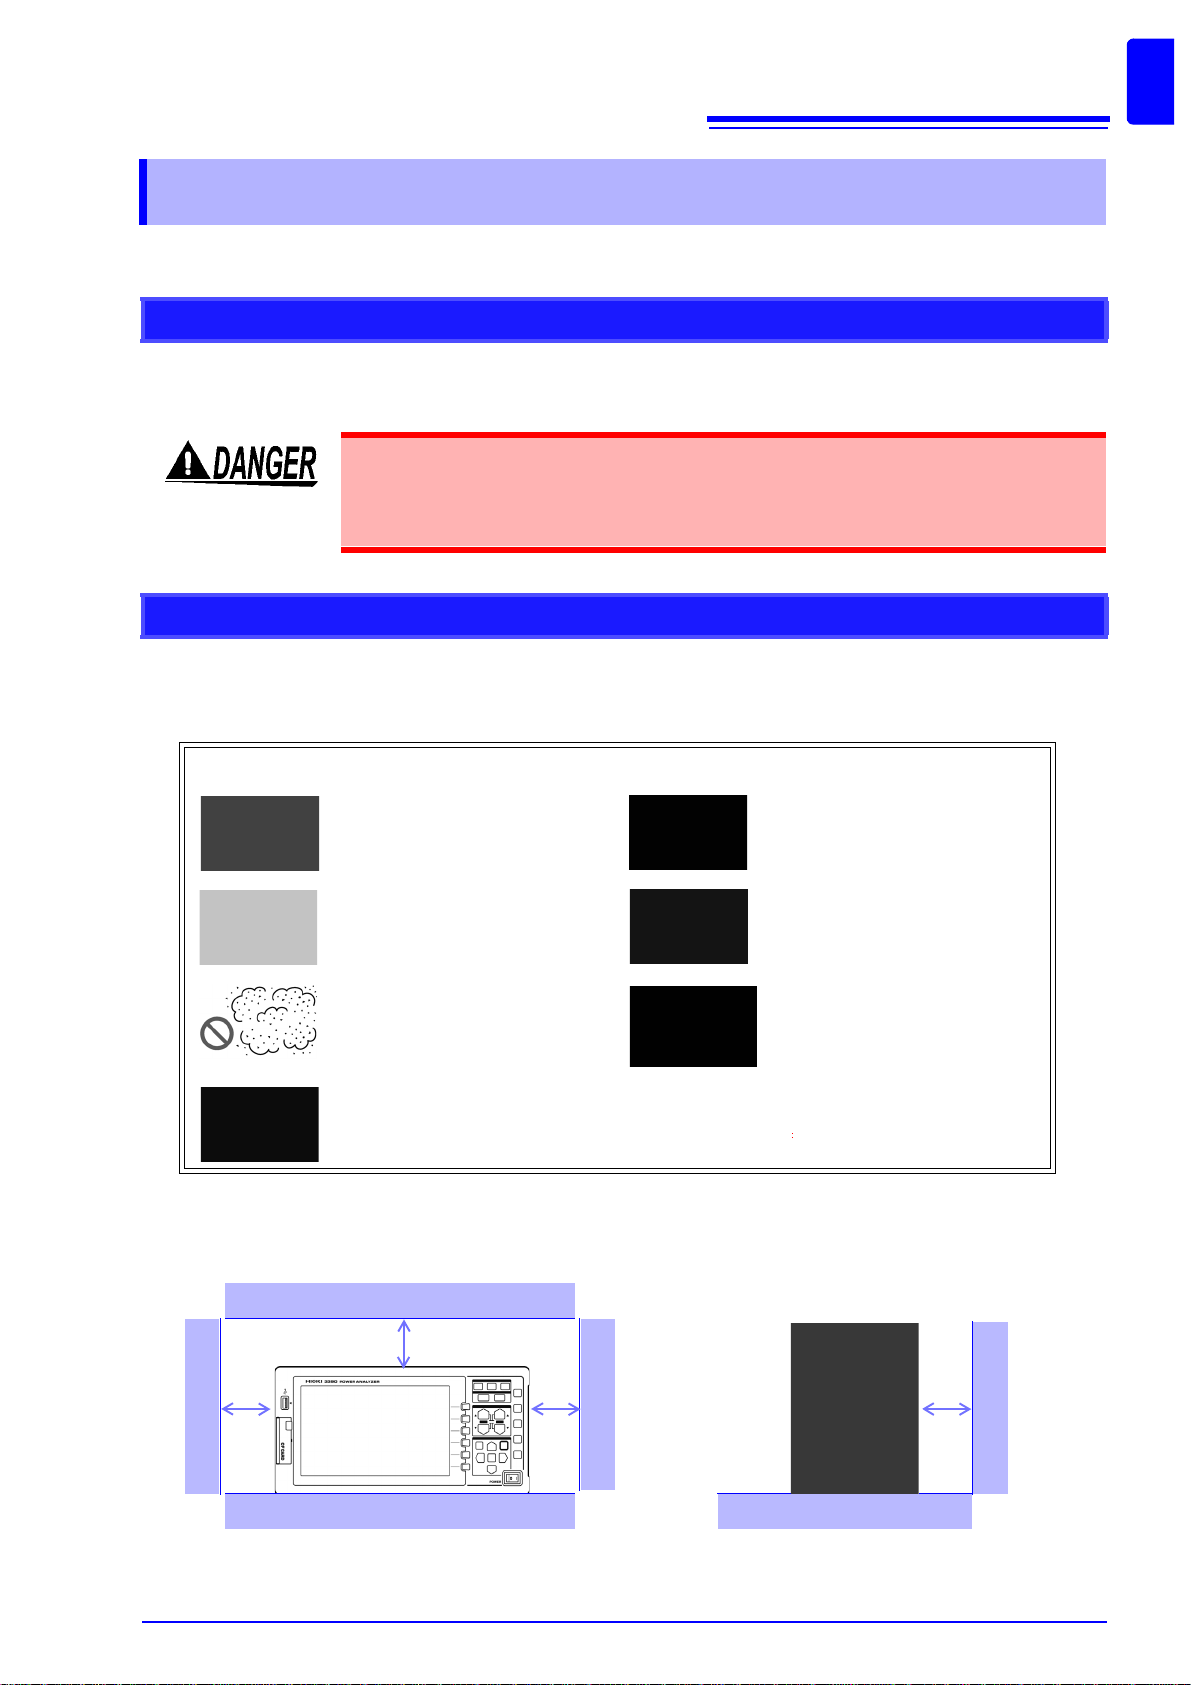
50 mm or more
50 mm or more
Usage Notes
Follow these precautions to ensure safe operation and to obtain the full benefits of the various functions.
Before Use
Before using the ins trument the first ti me, verify that it operates normall y to ensure that t he no damage
occurred during storage or shipping. If you find any damage, contact your dealer or Hioki representative.
Before using the instrumen t, make sure that t he insulation on the v oltage cords
is undamaged and that no bare conductors are improperly exposed. Using the
instrument in such conditions could cause an electric shock, so contact your
dealer or Hioki representative for replacements.
Instrument Installation
5
Operating temperature and humidity to RH or l ess, Indoors only (non-condensatingStoring tempe rature
and humidity to RH or l ess, In doors only (non-c ondens ating Temperature and humidity range for guar anteed accuracy, RH or less
Avoid the following locations that could cause an accident or damage to the instrument.
Exposed to direct sunlight
Exposed to high temperature
Exposed to liquids
Exposed to high humidity or
condensation
Exposed to high levels of particulate dust
Subject to vibration
In the presence of corrosive or
explosive gases
Exposed to strong electromagnetic fields
Near electromagnetic radiators
Near induction heating systems
(e.g., high-frequency induction
heating systems and IH cooking
utensils)
Installing
• The instrument should be operated only with the bottom or rear side downwards.
• Vents (on the right side of the instrument) must not be obstructed.
Page 14

6
Usage Notes
Shipping precautions
Hioki disclaims respo nsibili ty for any di rect or indi rect da mages that ma y occ ur when this instrume nt has
been combined with other devices by a systems integrator prior to sale, or when it is resold.
Handling the Instrument
To avoid electric shock, do not remo ve the ins trument's case. The interna l components of the instrument carry high voltages and may become very hot during
operation.
• If the instrument ex hib its ab nor ma l o per ation or dis pl ay du ri ng use , rev ie w the inf or mation in Trouble shooting section "11.2 Trouble Shooting" (p. 175) and E rror Indications section "11.3 Error Indication" (p. 177) before contacting your dealer or
Hioki representative.
• To avoid damage to the instrument, protect it from physical shock when transporting
and handling. Be especially careful to avoid physical shock from dropping.
• To avoid damage to the instrument, protect it from physical shock when transporting
and handling. Be especially careful to avoid physical shock from dropping.
• To move the instrument, first d isconnect all cables, remo ve any CF card and USB
memory, and carry it by the handle.
• Do not apply hea vy downward pressure wit h the stand extended. The stand c ould
be damaged.
See "Using the Handle as a Stand" (p. 13)
Page 15
Handling the cords and current sensors
Connect the current sensors or voltage cords to the instrument first, and then to
the active lines to be measu red. Observe the following to avoid electric sho ck
and short circuits.
• Do not allow the voltage cord clips to touch two wires at t he same time. Never
touch the edge of the metal clips.
• When the current sensor is opened, do not allow the metal part of the clamp to
touch any exposed metal, or to short between two lines, and do not use over
bare conductors.
• T o avoid short ci rcuits and potentially life-threatening haz ards, never att ach the
current sensor to a circu it that operates at more than the ma ximum rated voltage to earth (See your current sensor's instruction manual for its maximum ratings.) Current sensor and voltage cables should only be connected to the
secondary side of a breaker, so the breaker can prevent an ac cident if a short
circuit occurs. Connections should never be made to the primary side of a
breaker, because unrestricted current flow could cause a serio us accident if a
short circuit occurs.
• Connect only those voltage cables necessary for measurement.
7
Usage Notes
In order to use the 9709 AC/DC Current Sens or, the line to be measured must be
temporarily disconnected.
To avoid shock and short circuits,turn off the power to lines to be measured
before making connections to terminals to be measured and turning on the
instrument.
• To avoid electric shock and short-circuit accidents, use only the specified voltage
cord to connect the instrument input terminals to the circuit to be tested.
• For safety reasons, when taking measurements, only use the optional voltage cord.
• Avoid stepping on or pinching cables, which could damage the cable insulation.
• To avoid breaking the cables, do not bend or pull them.
• To prevent an electric shock accident, con firm that the white or red portion (insulation layer) inside the cab le is not exp osed. I f a colo r insid e the ca ble is expo sed, do
not use the cable.
• To avo id damaging the power cord, grasp the plug, not the cord, when unplugging it
from the power outlet.
• Keep the cables well away from heat sources, as bare conductors could be exposed
if the insulation melts.
• Be careful to avo id dropping the current sensors or otherwise subjecting them to
mechanical shock, which could damage the mating surfaces of the core and
adversely affect measurement.
• Be careful when handling the cords, since the conductor being measured may
become very hot.
• When disconnecting the con nec to r, be sure to release t he l oc k befo re pul li ng off the
connector. Forcibly pulling the connector without releasing the lock, or pulling on the
cable, can damage the connector.
• To prev ent dam age to th e in st ru men t and cu rre nt s ens ors , nev er c on nec t or di s co nnect a sensor while the power is on, or wh ile the sensor i s clamped aroun d a conductor.
Page 16

8
Usage Notes
Before Connecting Measurement Cables
• The maximum input voltage is 1500 VDC, 1500 Vrms. Attempting to measure
voltage in excess of the maximum input could destroy the instrument and
result in personal injury or death.
• Never exceed a current sensor’s input current rating. Doing so could destroy
the instrument and cause personal injury.
• The maximum rated voltage between input terminals and the ground is as follows;
(CAT II) 1000 VDC, 1000 Vrms
(CAT III) 600 VDC, 600 Vrms
Attempting to measure voltages exceeding this level with respect to ground
could damage the instrument and result in personal injury.
• Before turning the inst rument on, make sure the source voltage matches that
indicated on the instrument's power connector. Connection to an improper
supply voltage may damage the product and present an electrical hazard.
• To avoid electrical accidents and to maintain the safety speci fications of this
instrument, connect the power cord only to a 3-contact (two-conductor +
ground) outlet.
The power supply voltage for this product is switchable. To avoid electrical accidents, check that the voltage selector is set correctly for the supply voltage you
are using.
Before Connecting to the Lines to be Measured
To avoid electrical hazards and damage to the instrument, do not apply voltage/
exceeding the rated maximum to the external input terminals.
• To avoid electrical accidents, confirm that all connections are secure. The
increased resistance of loose connections can lead to overheating and fire.
• Ensure that the input does not exceed the maximum input voltage or current to
avoid instrument damage, short-circuiting and electric shock resulting from
heat building.
• When the power is turned off, do not apply voltage or current to the voltage input terminals, current input termina ls, or curren t sensors. Do ing so may damag e the instru ment.
• Note that the instrument ma y be damaged if the ap plied voltage or curr ent exceeds
the measurement range.
While Measuring
If an abnormality such as smoke, strange sound or offensive smell occurs, stop
measuring immediately, disconnect from the measurement lines, turn off the
instrument, unplug the power cord from the outlet, and undo any changes to the
wiring. Contact your dealer or Hioki representative as soon as possible. Continuing to use the instrument may result in fire or electric shock.
Page 17

9
The HIOKI 3390 Power Analyzer is a high-precision, broad-range instrument for measuring electrical
power from DC to inverter freque ncies. Four input channels are provided to support single- and th reephase inverter motor system measurements.
For developing and evaluating high ef ficiency inverter motors
For developing and evaluating alternative energy sources such as solar,
wind power, and fuel cells
For inverter motor maintenance
1.1 Product Overview
1
Overview Chapter 1
1.1 Product Overview
• High precision and stability ensure highly reproducible power measurements
• Electrical phase angle measurements necessary for motor analysis
• Measure motor efficiency by connecting with a high precision torque meter or encoder.
Chapter 1 Overview
• Simu ltaneou sl y mea sure AC and DC power.
• Separate ly measure p ower inp ut, sold, co nsumed, a nd regener ated usin g the DC mo de and the current and integrated power (electrical energy) in RMS mode.
• Save long-term measurement data to high-capacity storage media.
• Easily measure inverter secondary power on site.
• Simultaneously measure primary and secondary inverter power.
• Measure inverter noise.
Page 18

10
Supports multiple power system configurations
High accuracy over a broad range
Provides both fast data processing and high accuracy
Extensive data analysis functions are included as st andard fe atures
Simultaneous analysis of all parameters
Supports measurements with both easy-to-use clamp probes and highprecision penetrating probes
Single-unit instrument ideal for portable as well as rack-mount
applications
1.2 Features
• Four isolated voltage and curren t input channels are pr ovided to support simultaneous multisystem measurements such as inverter primary and secondary power.
• Measure power system wiring configurations from single-phase to three-phase, four-wire.
• Broad frequency range (0.5 Hz to 5 kHz fundamental) supports DC to inverter frequencies.
• Basic accuracy is ±0.05% rdg. ±0.05% f.s. at DC and from 0.5 Hz to 150 kHz.
• Precise measurements over a broad range of inverter carrier frequencies: ±0.2% rdg. ±0.1% f.s.
at 10 kHz, and ±1.5% rdg. ±0.5% f.s. at 100 kHz.
• Whil e maintaining high accuracy, power measurements and harmonic analy sis updates every
50 ms.
• Durin g low-frequenc y measurem ents, data is automatica lly updated i n sync with frequen cy, so
no refresh (data update rate) switching is needed when changing from low to high rotation
rates.
• Simultaneously measure RMS, mean, AC and DC components, and fundamental waveforms.
th
• Perf orm harmonic analysis up to th e 100
kHz.
• Display high-speed waveforms sampled at up to 500 kS/s.
• Perform multifaceted analysis with X-Y graph functions.
• Simultaneously analyzes harmonics and noise while performing integration and displaying
waveforms.
order and inverter noise (FFT) analysis up to 100
• Select from various AC and AC/DC clamp-on current probes with ranges from 20 to 500 A.
• Measure high currents with high precision using clamp-on current sensor probes.
• Clamp-on current probes eliminate the need for problematic direct contact with wiring.
• In-phase effects on inverter measurements are greatly reduced by isolating current sensors
from the measurement objects.
• Small and light weight (4.8 kg), with a convenient carrying handle (p. 13).
• Rack mountable in 170 mm (EIA 4U) vertical space (p. 179).
Page 19

11
V ariety of interfaces are equipped in standard
PC application program provides remote control and data acquisition (p. 141)
Wiring confirmation function avoids wiring mistak es (p. 36 )
Multi-instrument synchronization capability supports additional
measuremnet channels (p. 129)
Prepared for motor evaluation options (p. 138)
D/A output option for waveform output (p. 132)
Easy-to-see color LCD (p. 13)
Radiation thermometer connection support (p. 127)
Printer connection support (p. 123)
1.2 Features
• Includes 100 Mbps Ethernet and USB 2.0 High Speed communications interfaces.
• Supp or ts high-spe ed data communication systems.
• Provides a dedicated front-panel USB port and CF card slot for removable storage devices.
• Supports high-capacity media for high-speed data storage.
• With the instrument connected to a computer by Ethernet or USB cable, use the PC application
program to acquire data on the computer and control the instrument remotely. Download the PC
application program from Hioki's website. (http://www.hioki.com)
• Even without the PC application program, the same operations can be performed using a
browser to access the HTTP server function.
1
Chapter 1 Overview
• The vector display avoids wiring mistakes by confirming even complicated three-phase wiring.
• Measure with up to four instruments simultaneously.
• Slave instruments measure and record data in synchronization with the master instrument.
• Usin g the PC a pplic ation p rogram, sync hronous ly acqui re an d recor d data on up to f our in struments.
• Motor power can be determined by measuring torque meter output and rotation rate.
• Supports both analog DC and frequency-output-type torque measurement inputs.
• Supports both analog DC and rotation pulse outputs for measurement inputs.
• Supports encoder Z-phase signals for phase measurements with standard encoder pulses.
• Outputs up to 16 analog measurement parameters on 16 D/A output channels.
• Voltage and current waveforms sampled at 500 kHz in the waveform output mode provide
safely isolated voltage and current waveforms for other waveform measuring instruments.
• Includes a 9-inch color TFT LCD.
• Easily view waveforms and graphs on the wide-screen 800 × 480 dot display.
• Connect to the RS-232C interface for simultaneous temperature recording.
• Connect an optional printer to print screen captures on site.
Page 20
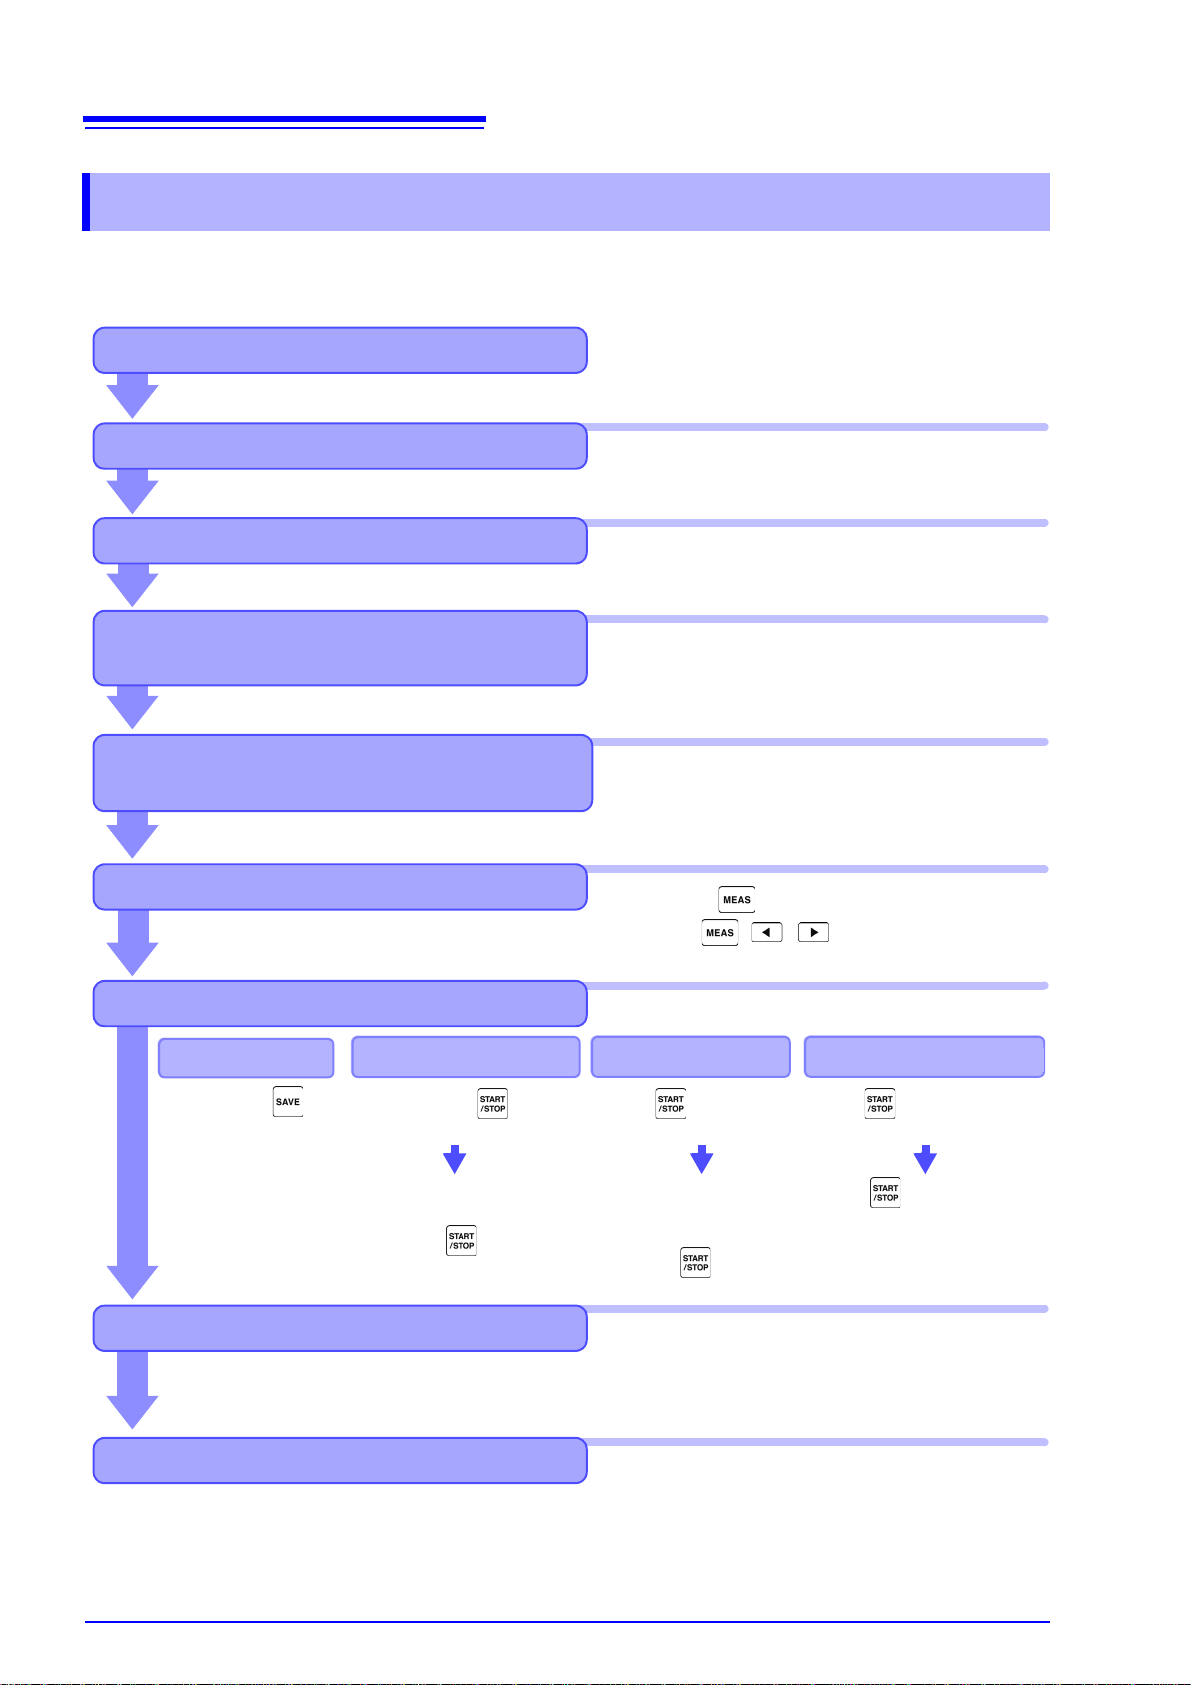
12
Saving
Turning Power Off
Analyzing Saved Data on a Computer
Installing the Instrument
Initial Instrument Preparations
Stops automatically at the
specified stop time.
Press the key to force
stop.
After pressing saving
starts at the specified start
time.
Connect the instrument to a computer with the supplied USB cable or an Ethernet cable and use the
dedicated PC applicati on program to transfer data to
the computer for analysis. This also enables remote
operation and control of the instrument.
See 3.2 ( p.24)
See 3.3 ( p.26)
See 3.4 ( p.27) to 3.8 ( p.29)
See 3.9 ( p.30) to 3.11 ( p.36)
See Chapter 7 ( p.103)
See "Instrument Installation" (p. 5)
See Chapter 9 ( p.141)
Press the key, and select display contents
with the , and F keys.
See "2.2 Basic Operations" (p. 16)
Viewing Measurement Values
Press the .
Manual saving
Pre-Operation Inspection
Connecting Cables and Probes, and
Turning Power On
Connecting and Checking Connections
to Measurement Objects
See 3.8 ( p.29)
Always perform these checks before connecting, and when turning the power on.
See Chapter 4 ( p.37)
For high-precision measurements, allow at least
30 minutes warm-up after power-on before executing zero adjustment.
Always execute zero adjustment before connecting to measurement objects.
Press to save for
a specified time span.
Save timer control
Press to start.
Save the specified time span.
Press to stop.
When the timer and real -time
control are set, stops at the
specified time.
Stops automatically
when the specified time
has elapsed.
Press the key to
force stop.
Save interval control
Save in realtimecontrol
1.3 Operating Overview
Be sure to read "Usage Notes" (p. 5) before measuring.
Follow the proced ures belo w to perform measurements. Da ta saving and an alysis on the computer can
be performed as necessary.
Page 21
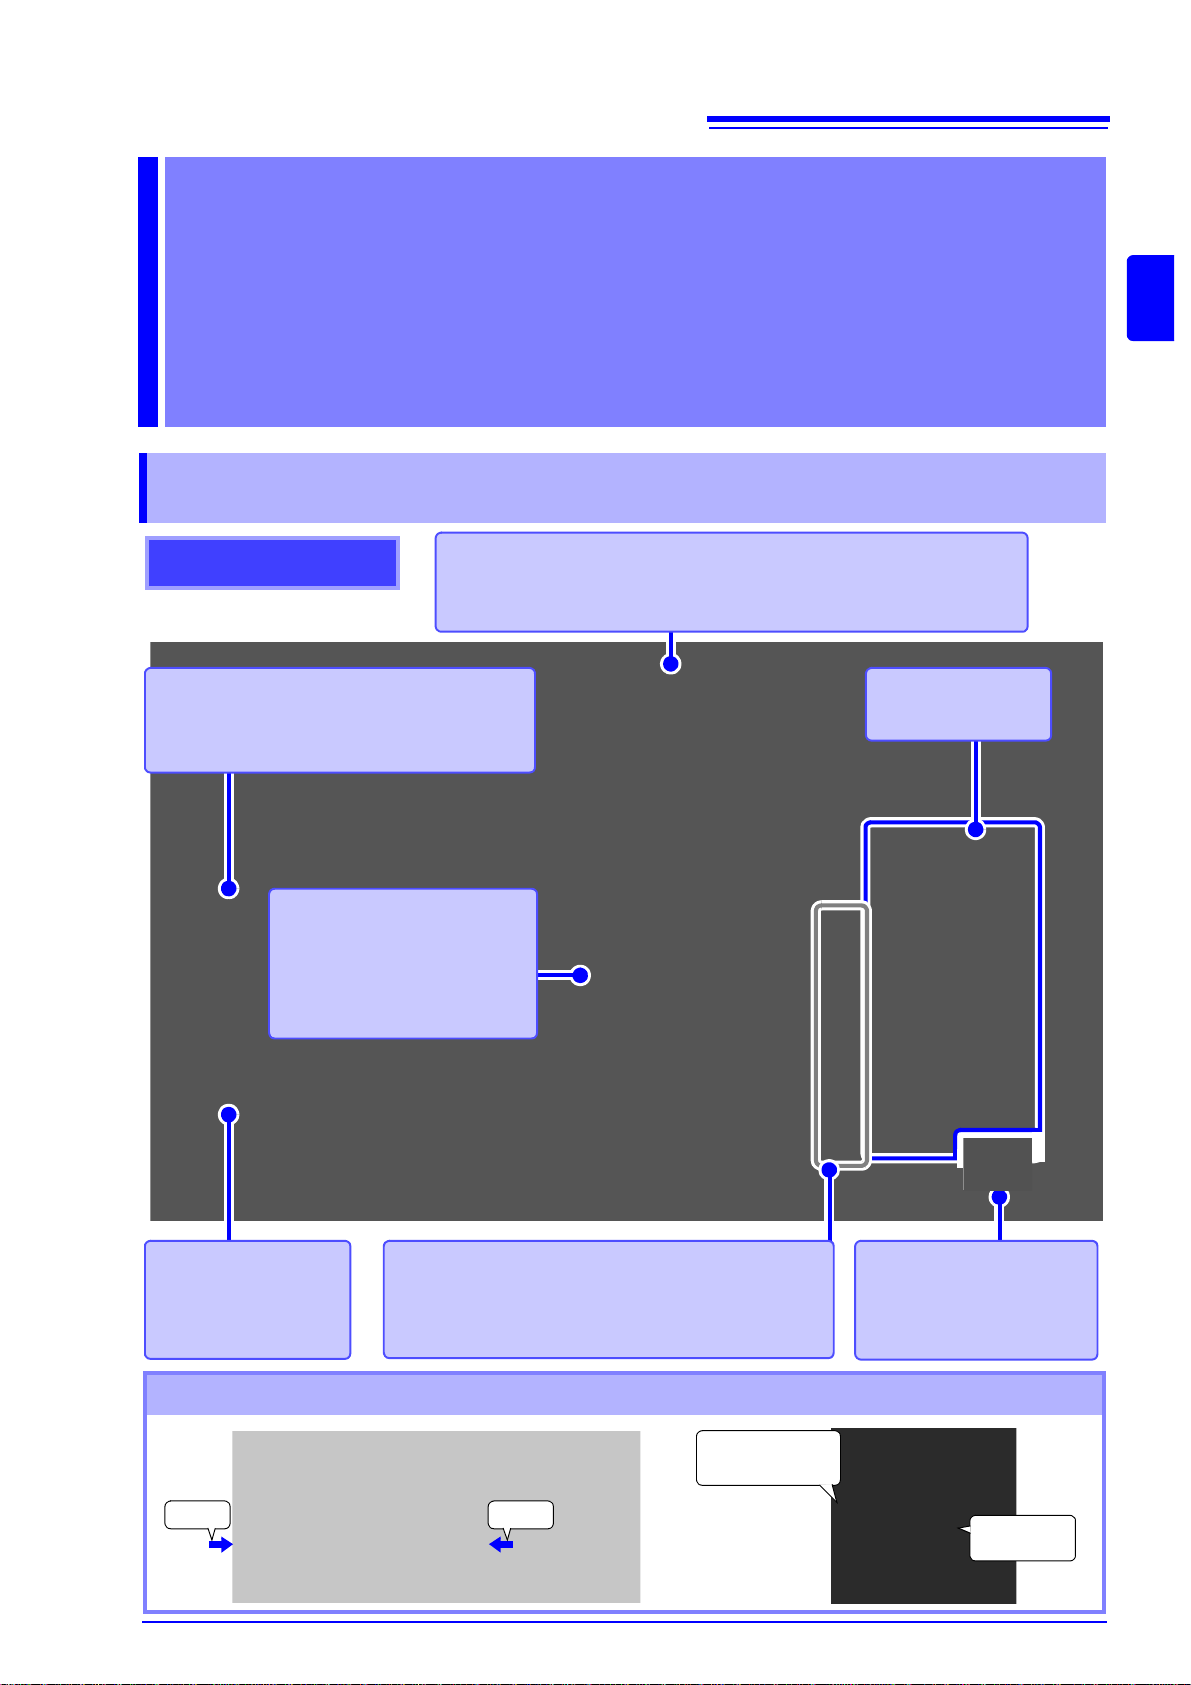
13
Display
Displays the Measurement,
Setting, or File Operation
screen.
See (p. 17)
CF card interface
Insert a CF card.
See (p. 104)
Front
F key (Function key)
Select and change display contents and settings.
See (p. 16)
Operation keys
See (p. 14)
Handle
Use to carry the instrument, and fold it down to serve as a stand.
See Latter of this chapter
Power switch
Turns the instrument on
and off.
See (p. 29)
USB memory interface
Connect a USB flash drive storage device.
See (p. 103)
Press Press
Keep on
pressing
Rotate the handle
to the click point.
12
2.1 Names and Functions of Parts
Names and Functions of Parts,
Basic Operations
& Screens Chapter 2
2.1 Names and Functions of Parts
2
Chapter 2 Names and Functions of Parts, Basic Operations & Screens
Using the Handle as a Stand
Page 22
14
SHIFT key
(Lit when running)
Activates alternate key functions.
START/STOP key
(Lit when running)
Starts and stops integration and saving operations.
To restart integrat ion and saving: Press the
DA TA RESET key to reset integration val-
ues, then press this key. (Press the START/
STOP key without resetting t he integrated
value if you wish to add the integration result to the previous one.)
SAVE key
Saves data to the storage media.
See 7.5.2 (p.110)
(Screen Capture)
Press SAVE while holding the
SHIFT key to capture a screen
image to the specified storage
media. (p. 114)
ESC key
Cancels the last
change to a setting,
and returns it to its o riginal state.
(Key-lock)
Hold for three seconds
to toggle the key lock.
The key lock st ate is indicated at the top of the
screen.(p. 17)
Operation keys
DATA RESET key
Resets the integratio n valu es .
See 4.3.1 (p.53)
0 ADJ key
Performs zero adjustment and
current sensor degaussin g.
See 3.10 (p.34)
HOLD key
(Lit when running)
Toggles the peak-hol d function.
See 5.3 (p.94)
RANGE keys
•The U + and – keys
change the voltage
measurement range,
and the I + and –
keys change the cur rent measurement
range.
• Pressing the + and –
keys at the same
time activates Auto
Ranging (p. 44).
• These keys also set
the low-pass filter (p.
52) and the lower
measurement limit
setting (p. 49).
PAGE key
Changes the screen
page.
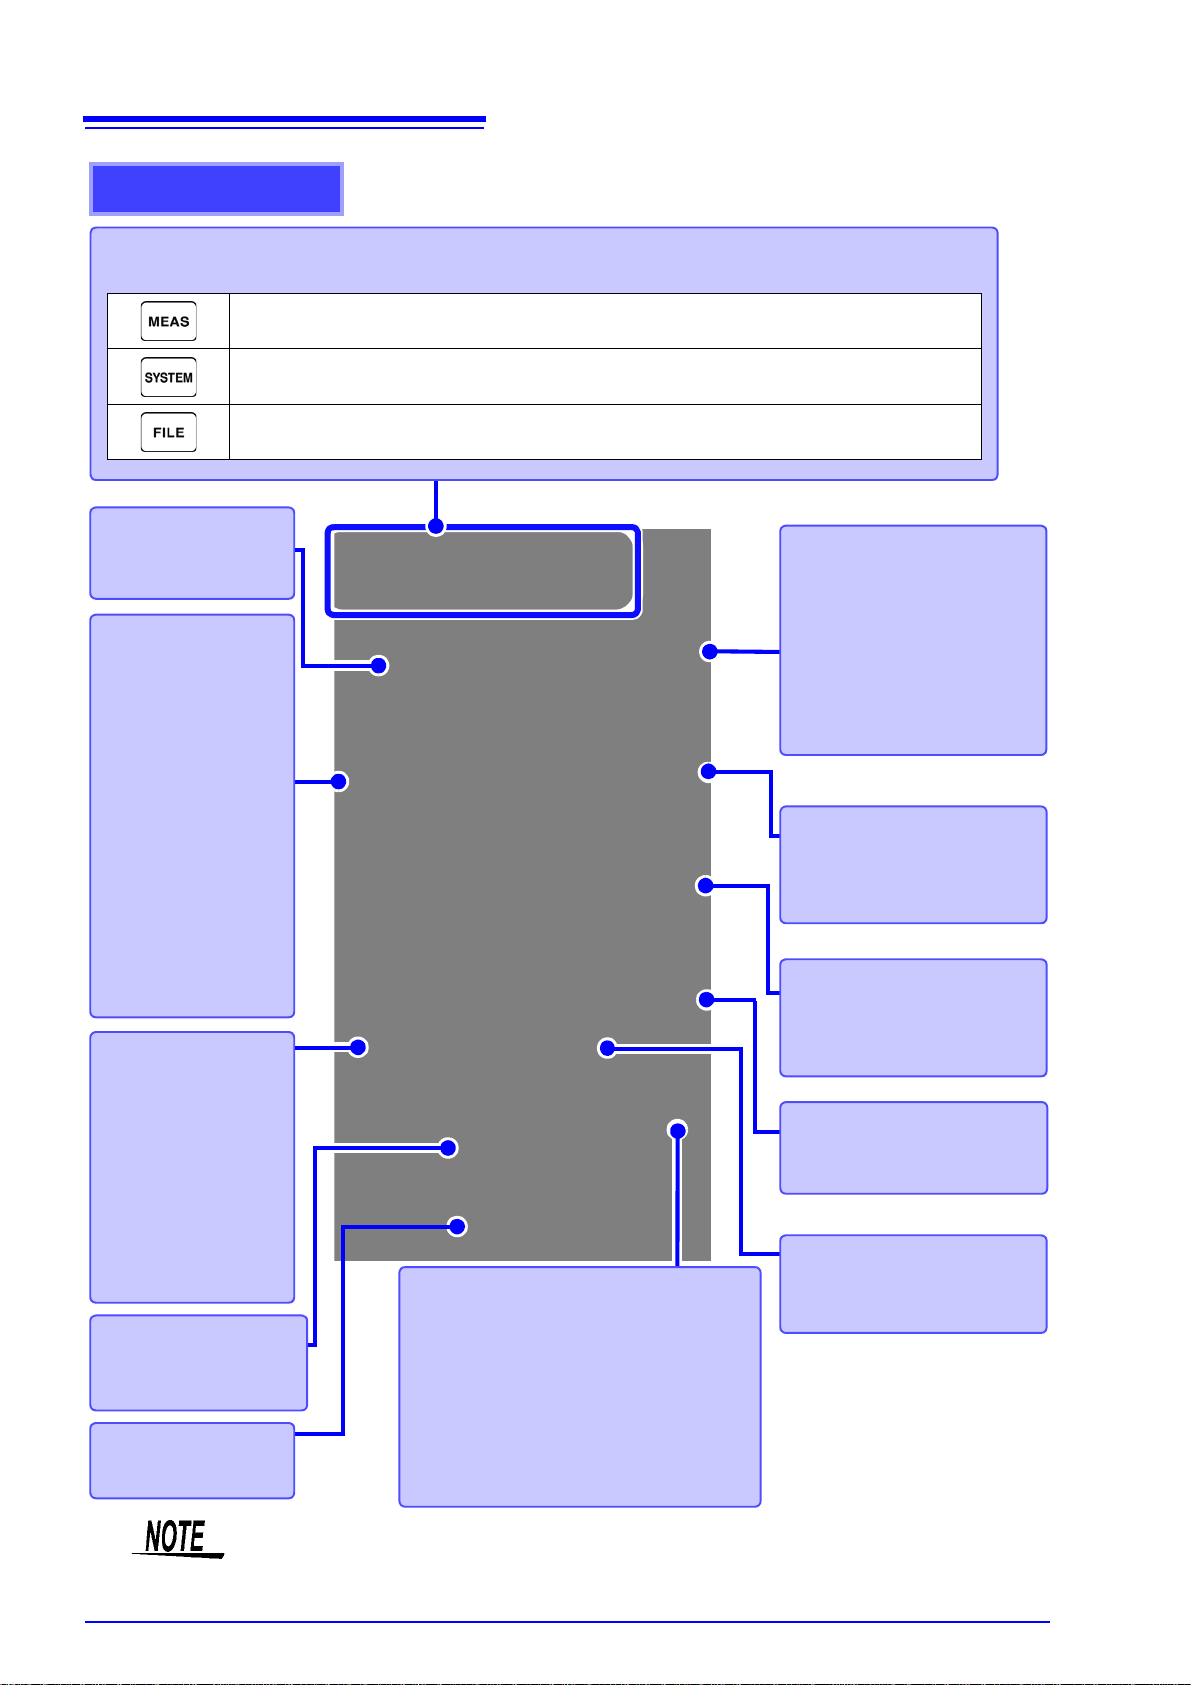
MENU keys (Screen selection)
Press a key to select a screen (the lit key indicates the current selection).
Displays the Measurement screen for viewing measurement values. Voltage and current ranges can be selected, and low-pass filter settings can be changed.
(p. 19)
Displays the Setting screen for setting measurement criteria, wiring mode (phase systems), wiring check and system environment configuration.
(p. 20)
Displays the Fil e Operation sc reen for perf orming fil e operations on data saved to
storage media, and selecting data file formats.
(p. 21)
ENTER key
Accepts selections and
changes to settings.
CURSOR key
Move the cursors.
2.1 Names and Functions of Parts
• When the key lock function is enabled, all other key operations are disabled.
• The key lock state is retained even when power is off.
Page 23
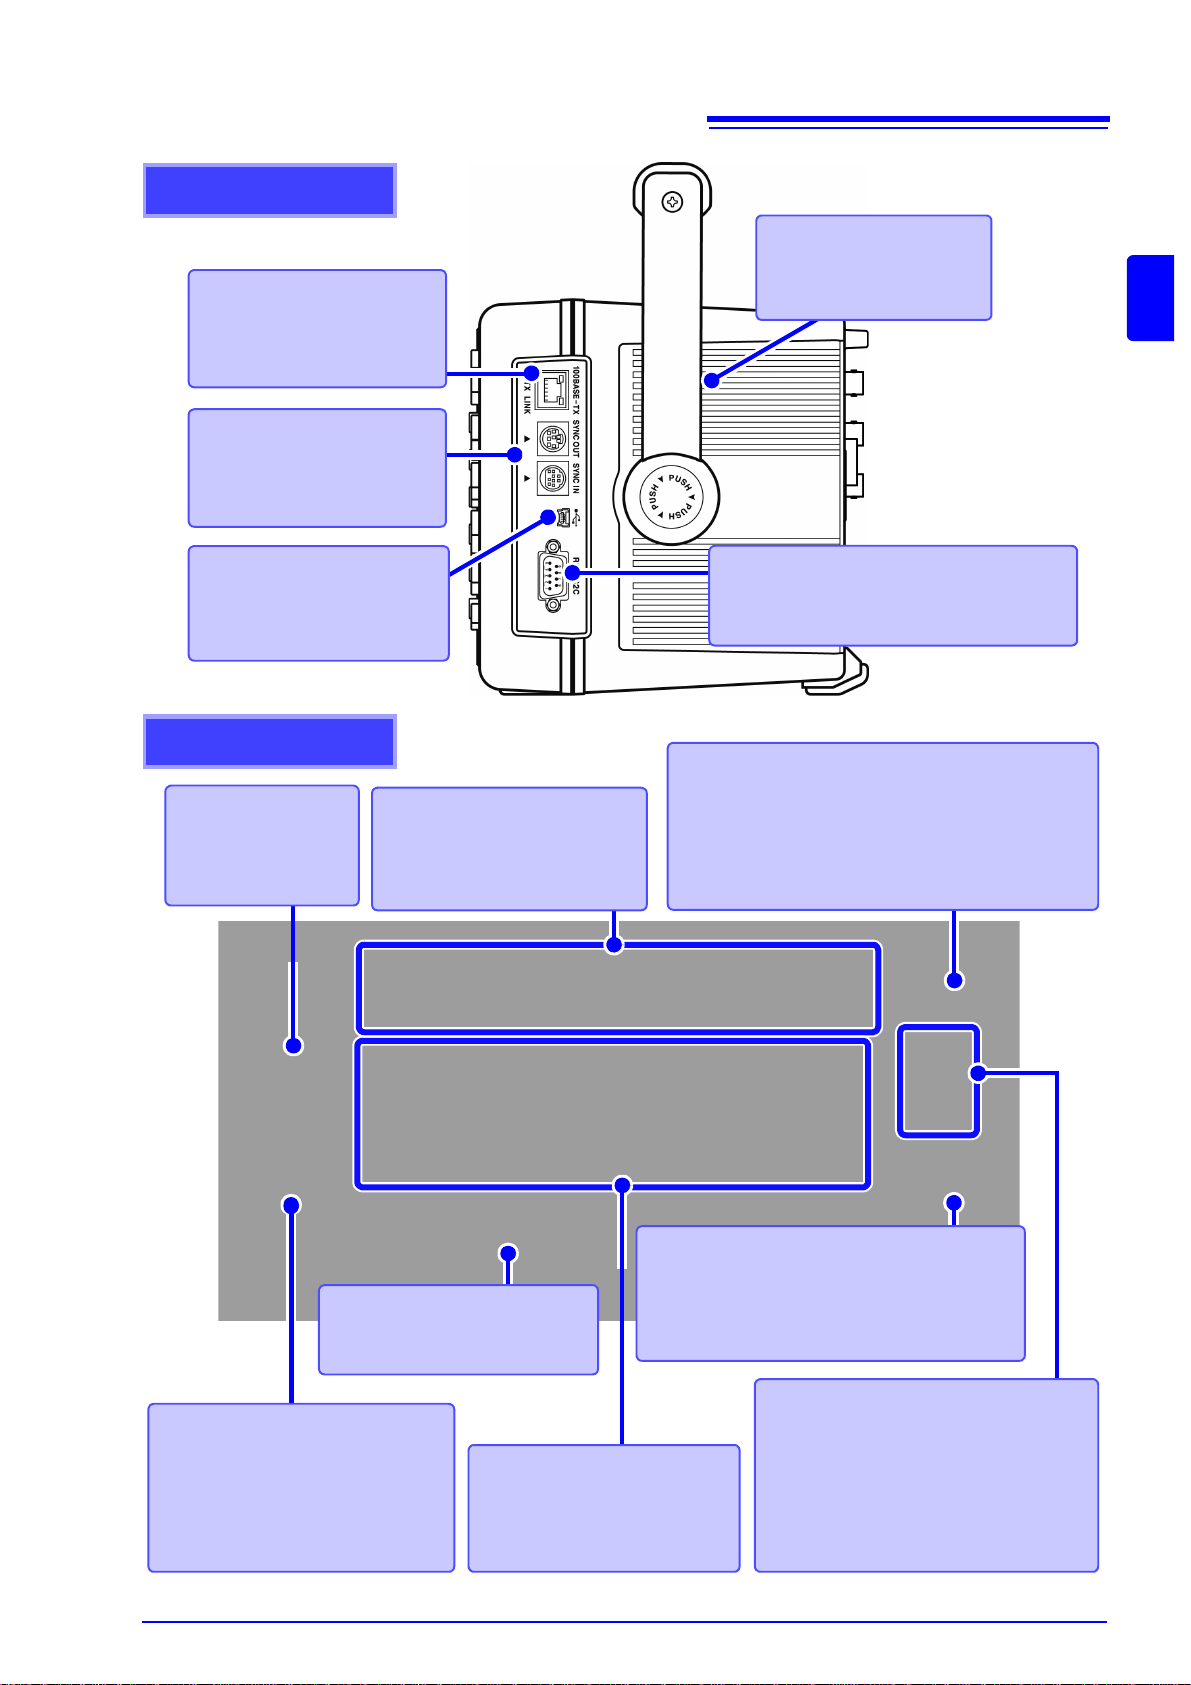
15
Right side
Ethernet interface jack
For LAN connection with an
Ethernet cable.
See (p. 144)
Sync interface
For synchronizing cables, as
needed.
See (p. 129)
Vent
Keep clear of obstructions.
See (p. 5)
RS-232C interface
For RS-232C cable connection, as needed.
See (p. 123), (p. 127)
USB port
For the supplied USB cable,
as needed.
See (p. 148)
Rear
Voltage input termi nals
Connect Hioki-specified voltage
measurement cables.
See (p. 28)
Current input terminals
Connect an Hioki-specified current sensor.
See (p. 28)
Power inlet
Connect the supplied
power cord.
See (p. 27)
Output terminal
Connect the supplied D-sub plug (only when
using the 9792 D/A Output option or the 9793
Motor Evaluation and D/A Output option).
See (p. 132)
CH A torque signal input BNC jack
Connect the Hioki L9217 BNC connection cable to
this terminal (only when using the 9791 Motor Evaluation option or the 9793 Mot or Evaluatio n and D/A
Output option).
See (p. 138)
CH B and CH Z rotation signal
input BNC jacks
Connect the Hioki L92 17 BNC connection
cable to these terminals (only when using
the 9791 Motor Evaluation option or the
9793 Motor Evaluation and D/A output option).
See (p. 138)
Serial No.
This is the in stru men t’ s s er ial
number.
Functional gr ou nd te r mi nal
Connect this terminal to a clean
common ground to suppress electrical nois e when measuring in an
electrically noisy envi ronm en t.
See (p. 27)
2.1 Names and Functions of Parts
2
Chapter 2 Names and Functions of Parts, Basic Operations & Screens
Page 24
16
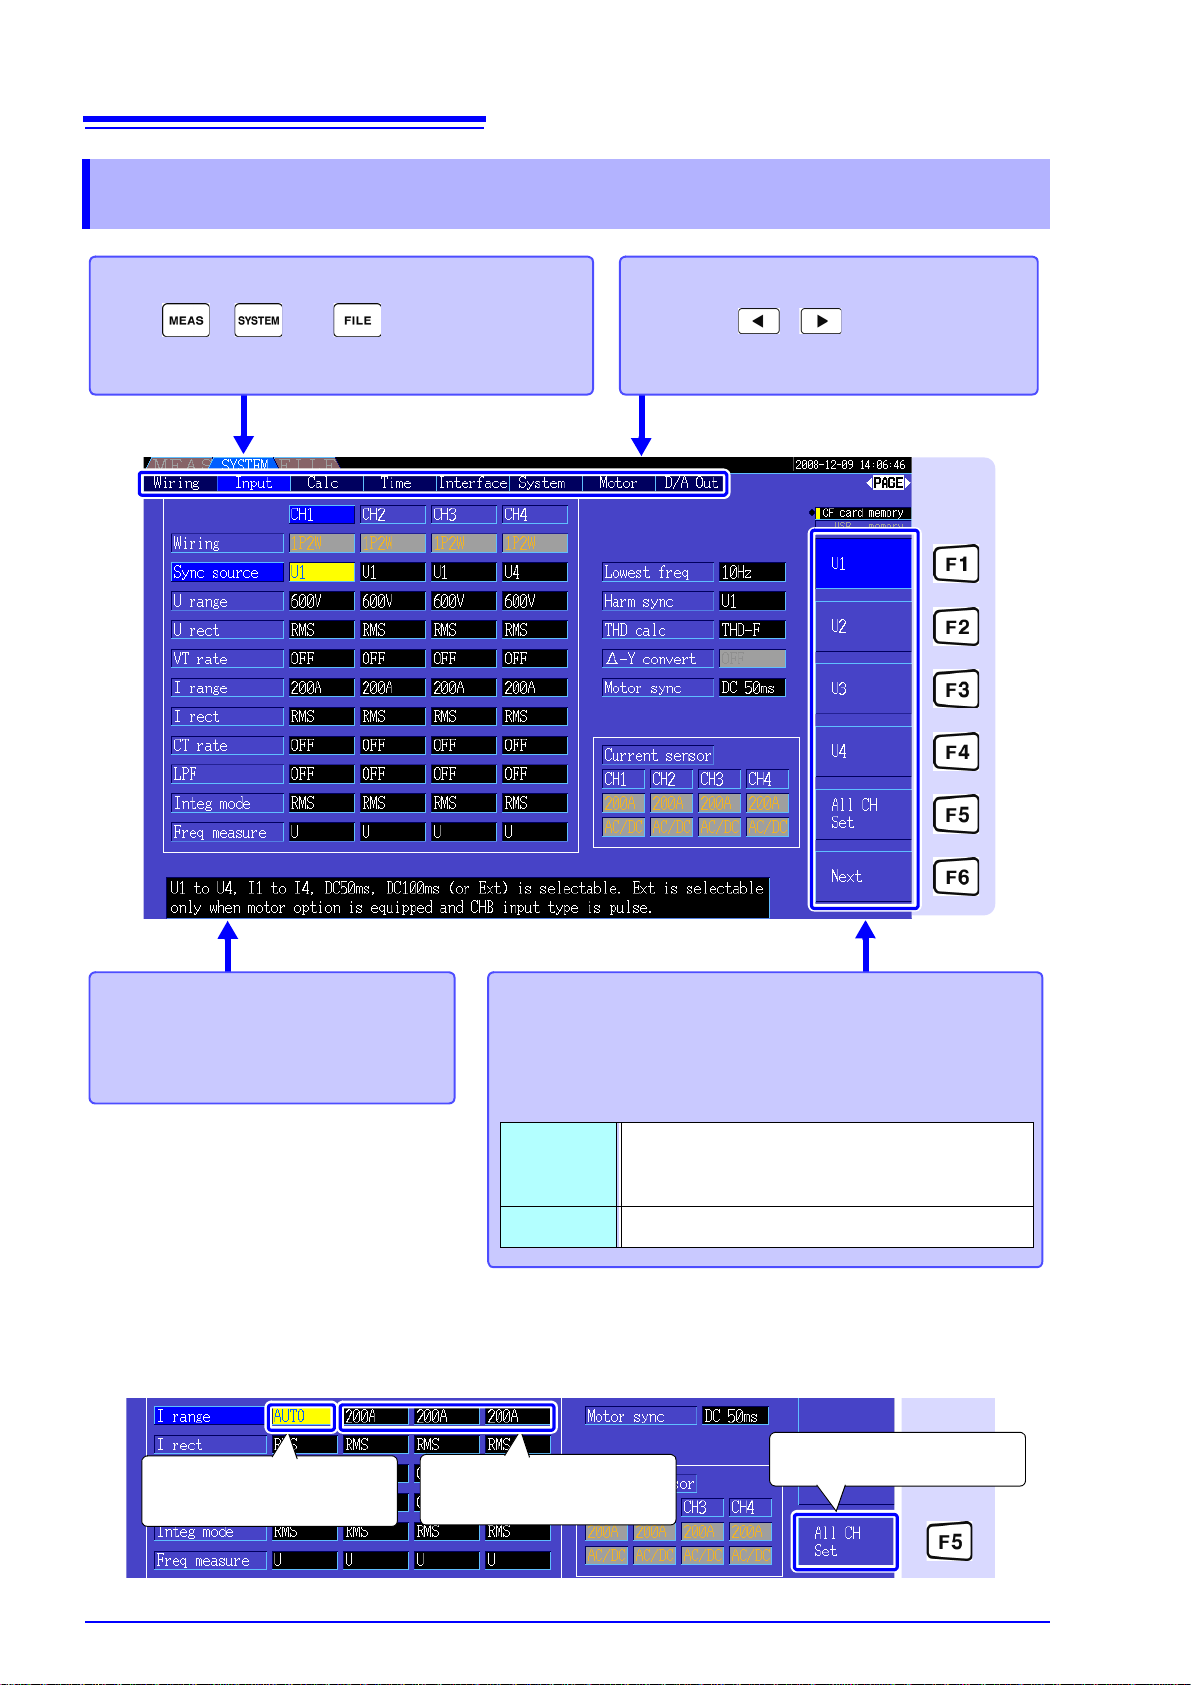
To select a display screen
Press , , or to display the corresponding screen.
See (p. 19) to (p. 21)
Help comment
Describes the object at the current
cursor position (only on Setting and
File Operations screens).
Set any channel to
[AUTO].
1
All channels are set to
[AUTO].
3
Select [All CH Set]
2
Using [All CH Set]
(For example, to enable auto-ranging on all channels.)
CH1 CH2 CH3 CH4
To select the displayed screen page
Press the keys to change.
See (p. 19), (p. 21)
T o select and c hange displ ay co ntents and settings
Press one of the F keys to select and change d isplay contents and settings. The displayed function labels depend on
the currently displayed screen.
Special Setting Items
Next
This appears when more than six setting
items are available. Press F6 to display the
function labels of the additional items.
All CH S et Select to apply th e same se tting t o a ll chan nel s.
2.2 Basic Operations
2.2 Basic Operations
Page 25
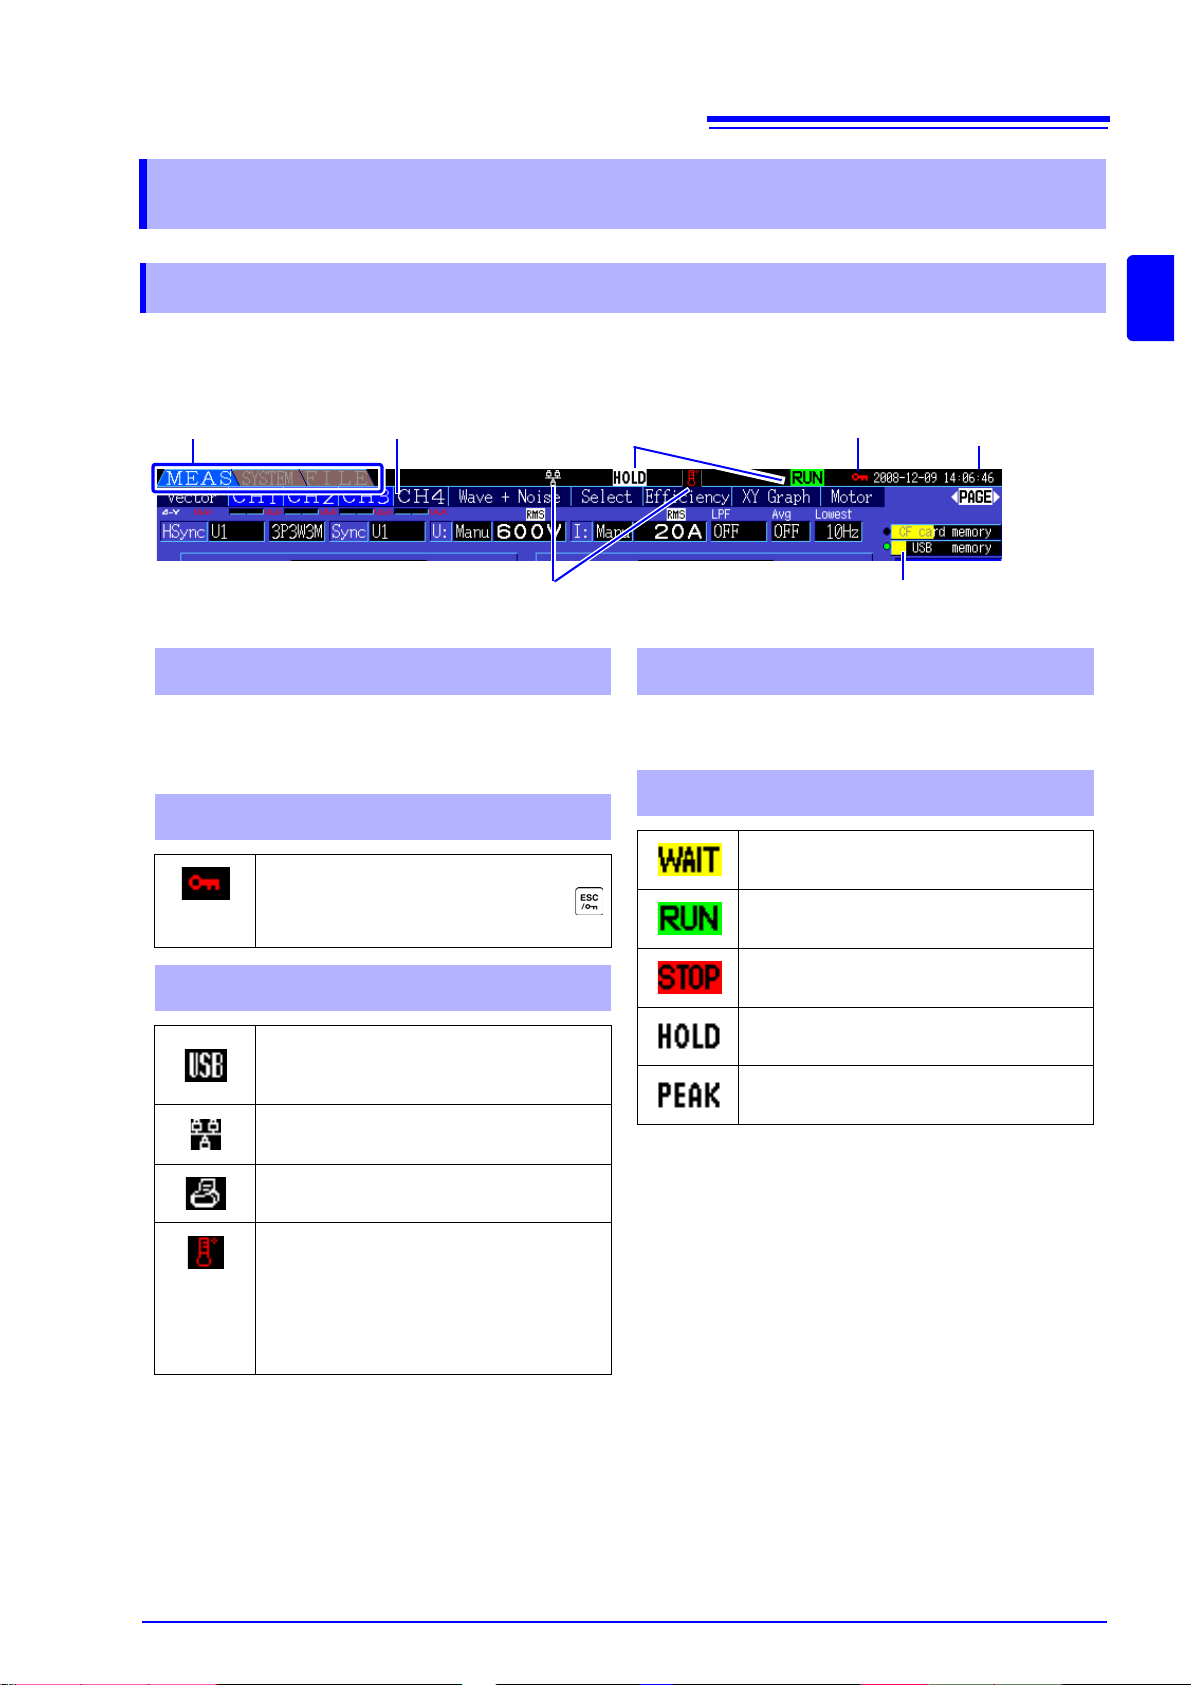
2.3 Display Items and Screen Types
Displayed Screen
Real-Time Clock
Operating State Indicators
Interface Indicators
Media-Busy Indicator
13
45
Key-Lock Indicator
2
Level indicators for the CF card and USB memory
stick. The used sto rage space is indicated in yellow, and it turns to red when the media is 95% full.
1 Storage Media Indicators
2 Key-Lock Indicator
Lights to indicate Key Lock is active
(keys are locked), after holding the
key for three seconds.
3 Interface Indicators
Lights when the instrument is connected to a computer by USB cable
(and the computer is on).
Lights when the instrument is connected to a LAN.
Indicates a pr inter is connected to the
RS-232 interface.
Indicates a the rmometer is connected
to the RS-232 interface.
Red: Temperature data has not been
acquired.
Blue: Temperature data has been
acquired.
Displays the current date and time.
To set the Clock: (p. 101)
4 Real-time clock
5 Operating State Indicators
Lights during integration and recording.
Indicates integration is in progress.
Indicates integration is stopped.
Indicates Data Hold is active.
Indicates Peak Hold is active.
Displayed Page
2.3 Display Items and Screen Types
17
2.3.1 Common Display Items
These items are displayed on every screen.
2
Chapter 2 Names and Functions of Parts, Basic Operations & Screens
Page 26
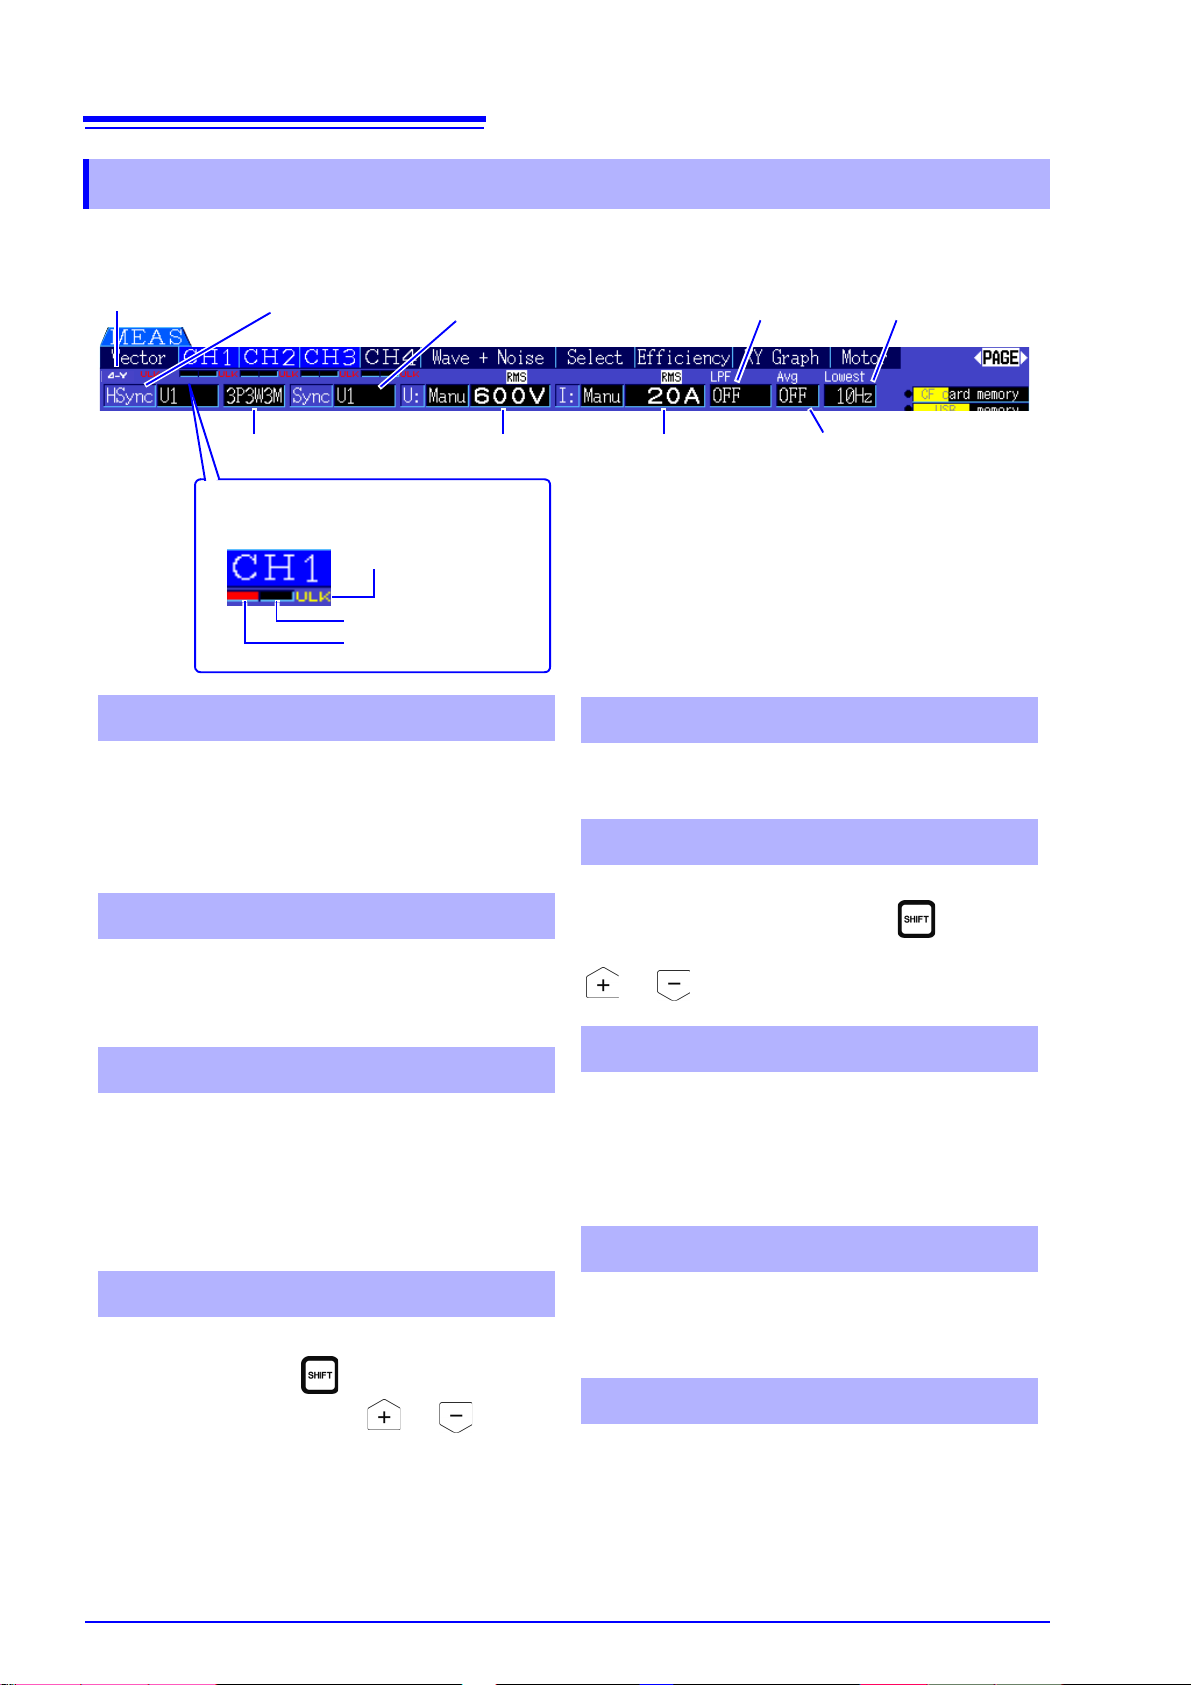
18
Current peak overrange
Voltage peakoverrange
Sync Unlocked
Peak Over display indicators
1
These indicators appear in red at the bottom of
each channel pag e tab (CH1 to CH4). These indicate (from the left) whe n voltage and curren t peaks
ranges are exce eded (p. 40), and when s ynchronization is unlocked (p. 48).
Indicates the selected wiring mo de (p. 30 ). The wi ring mode (phase system selection) must be set to
match actual measurement connections.
• Indicate the voltage and current range settings.
• The settings are made by the RANGE keys (p. 44).
• Wh en the range has been set manually, [MANU]
appears.
• When the auto-ranging is enabled, [AUTO]
appears (p. 43).
Indicates the low-pass filter setting (p. 52).
To change, hold the key while pressing an
LPF key (one of the left-most or RANGE
keys).
1 Peak Over display indicators
2 Wiring mode
3 Voltage range/Current range
4 Low-pass filter
Indicates the averaging setting state (p. 93).
The setting is made on the Setting screen.
Displays the lower measurement limit setting (p. 49).
To change the setting, hold the key while
pressing a LOW FREQ ke y (one of the right-most
or RANGE keys).
Indicates the synchronization source signal that
determines the period (between zero crossings)
used as the basis for all cal c ula tio ns .(p. 47) The setting is made on the Input Settin gs page of the Settings screen.
Indicates the synchronization signal source used for
harmonic measurem ents.(p. 67) The setting is made
on the Input Settings page of the Settings screen.
Indicates whether D-Y conversion is enabled or disabled (ON/OFF).(p. 98 ) The setting is mad e on the
Input Settings page of the Settings screen.
5 Average
6 Lower measurement limit
7 Sync source
8 Harmonic sync source
9 Δ-Y Conversion
Wiring mode
2
Voltage range
3
Current range
3
Average
5
low-pass filter
4
lower measurement limit
6
Sync source
7
Harmonic sync
source
8
Δ-Y Conversion
9
2.3 Display Items and Screen Types
2.3.2 Measurement Screen
These display items appear only on the Measurement screen.
Page 27
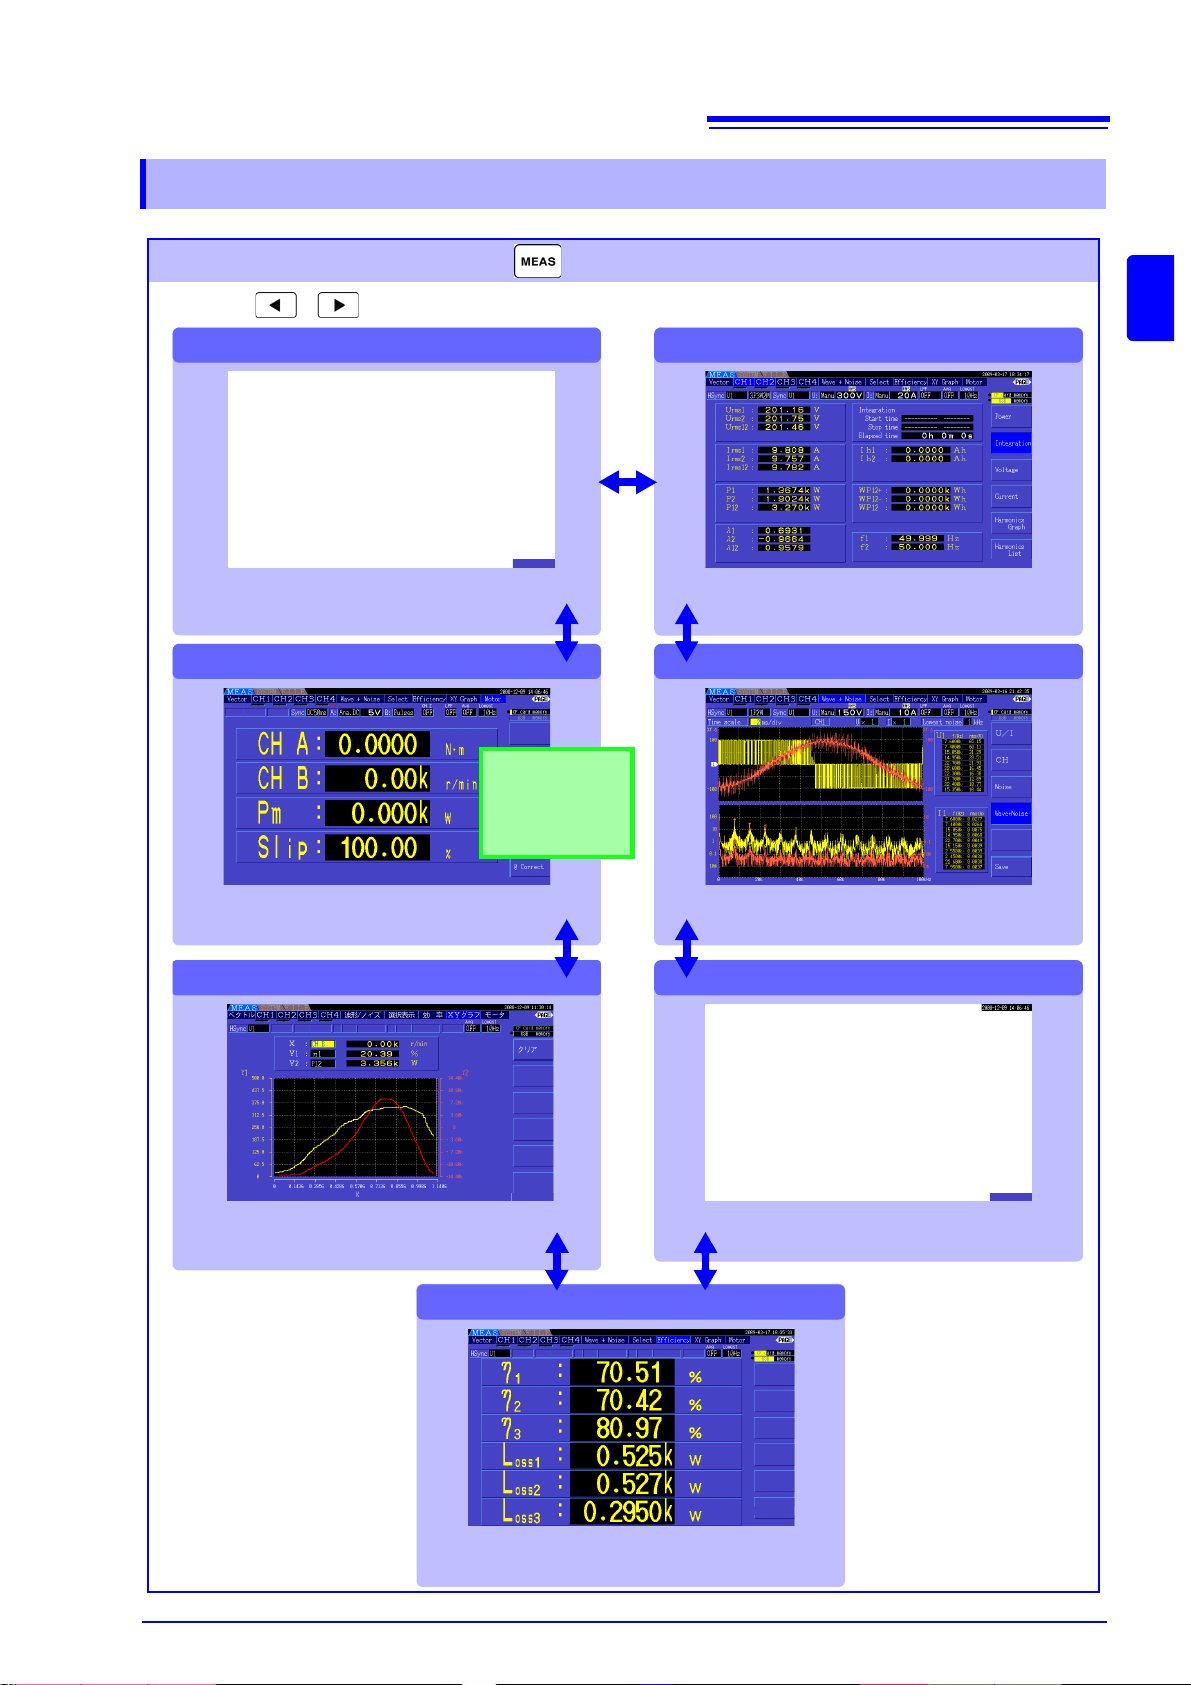
2.3.3 Screen Types
[CH1 to CH4]
[Efficiency]
[Motor]
[XY Graph]
[Wave + No is e]
[V ector]
[Select]
Measurement Screen (Press the key to display)
Press the keys to change the screen page as follows.
This screen displays measurement values.
This page displays measured voltage, current, and
power on channels 1 to 4 as numerical values
and as vectors.
This page display s measured values for the
motor analysis options.
This page displays an X-Y graph of measurement
parameters selected for horizontal and vertical
axes.
This page displays the numerical values of efficiency
and loss determined by calculation formulas.
This page displays measured power, voltage and current
values, integration values, and provides access to
harmonic graphs and lists for each channel.
This page displays vo ltage, current, an d noise
waveforms. The waveforms can be saved.
Select any parameter on this page for display.
Appears only when
the Model 9791 Motor Testing option or
the 9793 Motor Testing & D/A Output option is installed.
19
2.3 Display Items and Screen Types
2
Chapter 2 Names and Functions of Parts, Basic Operations & Screens
Page 28
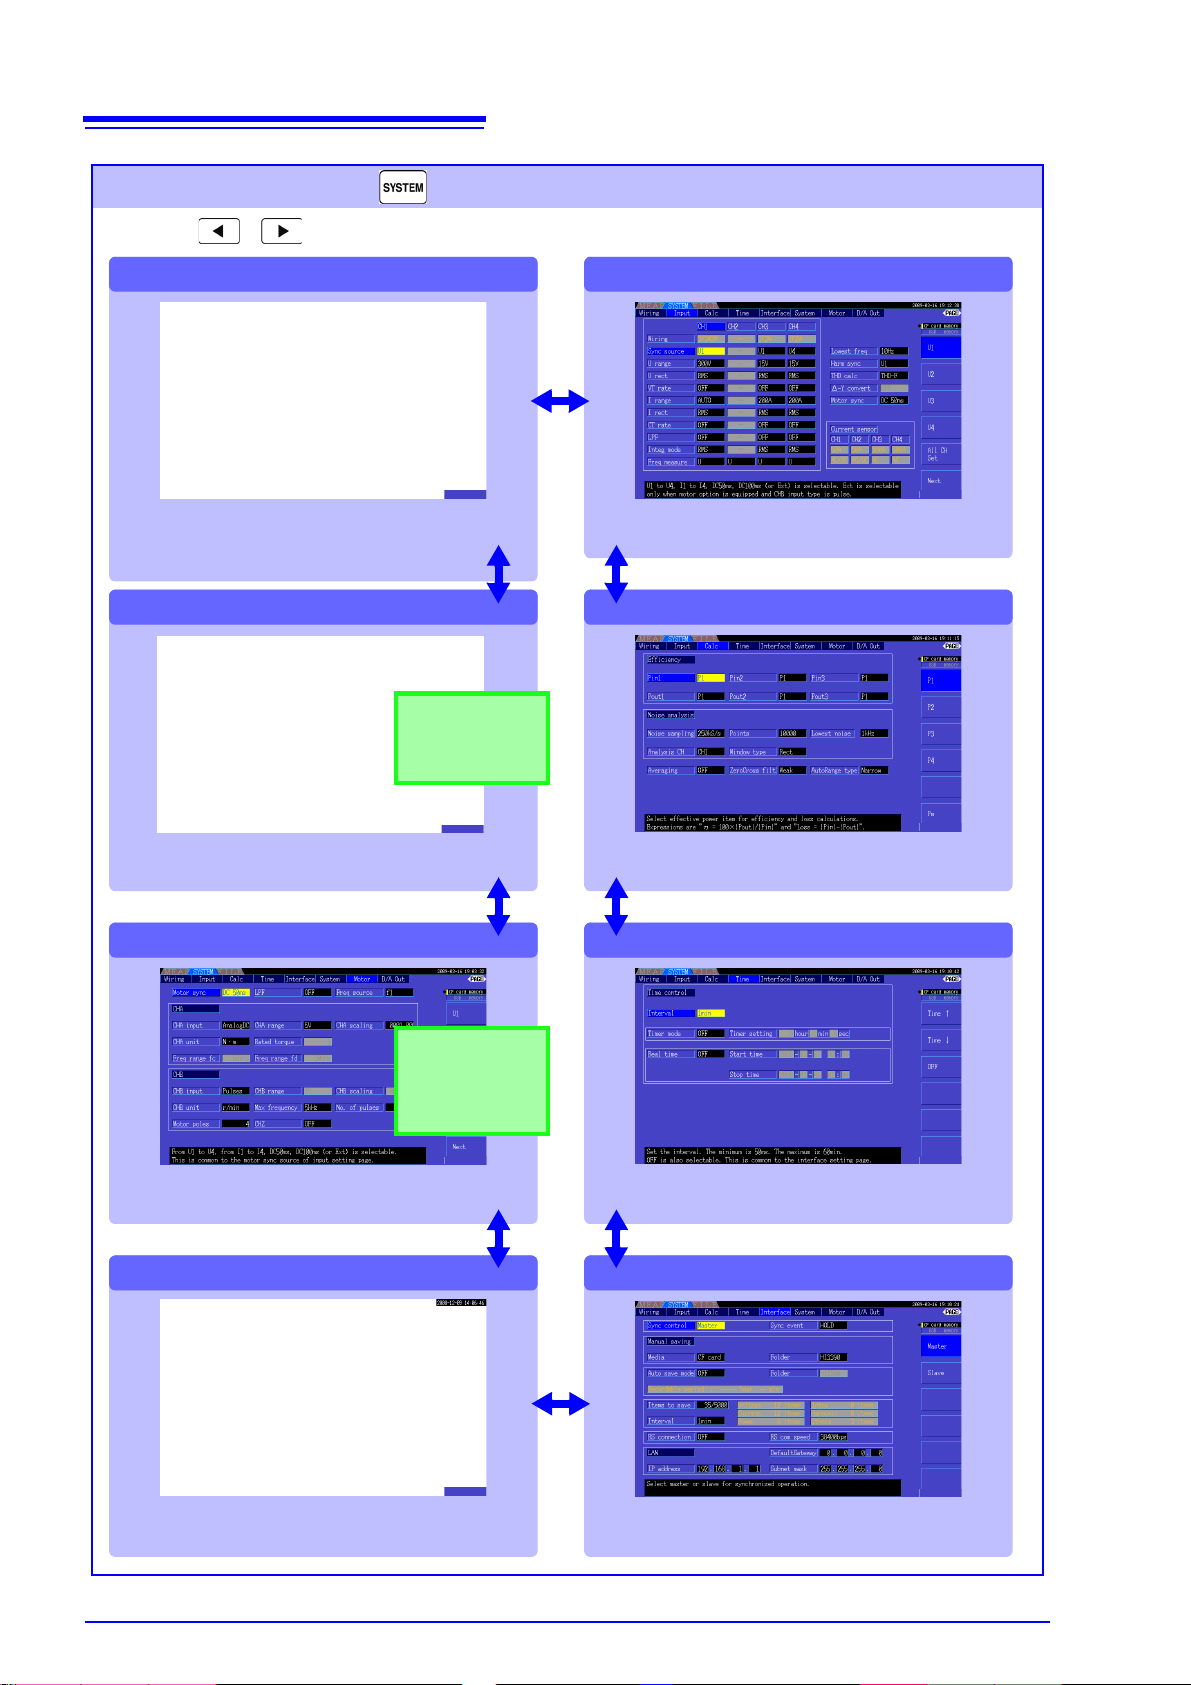
20
[Motor]
[Wiring]
[D/A Out]
[System]
Select the appropriate wiring mode (phase system configurations) and execute quick setup on this page. Wiring diagrams for each mode depict the appropriate
measurement cable connections.
Make D/A output-related settings on this page.
Make motor measureme nt-rela ted se ttings
on this page.
Configure system enviro nm ent settin gs and
perform system reset on this page.
[Input]
Make detailed measuremen t criteria settin gs on
this page.
[Calc]
Make calculation-related settings on this page.
[Time]
Set measurement timers and the number of parameters to save on this page.
[Interface]
Make settings related to synchronization, data
saving and interfaces on this page.
Setting Screen (Press the key to display)
Press the keys to change the screen page as follows.
Use this screen to view and change setti ngs for mea suremen t criteri a,
wiring mode, wiring check and system environment con figu ratio n.
Appears only when
the Model 9791 Motor Testing option or
the 9793 Motor Testing & D/A Output option is installed.
9792 D/A Output option or the 9793 Motor Testing & D/A
Output option is installed.
2.3 Display Items and Screen Types
Page 29
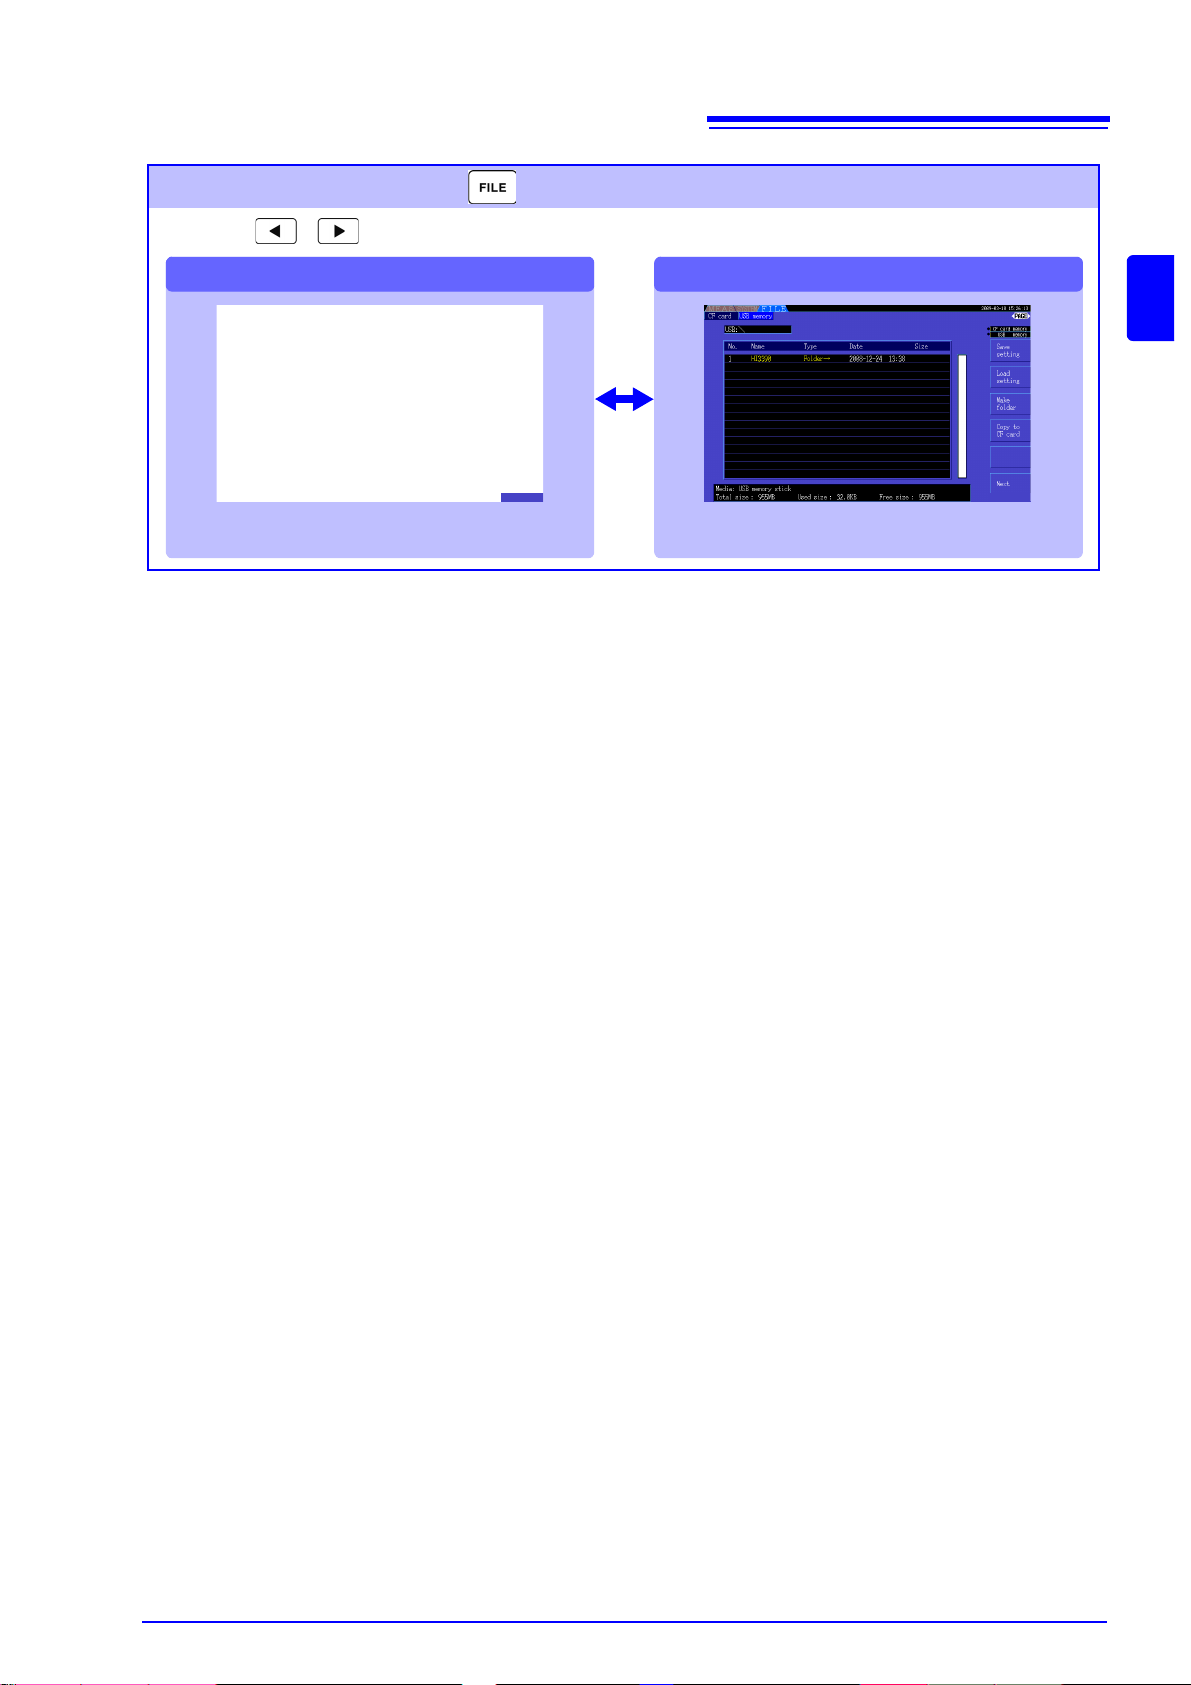
21
[USB drive][CF card]
File Operations Screen (Press the key to display)
Press the keys to change the screen page as follows.
Use this screen to configure savi ng of dat a fi les to removabl e
storage media, and to save and rel oad setti ngs fi les.
This page displays data files on a CF card. This page displays data files on a USB flash
drive.
2.3 Display Items and Screen Types
2
Chapter 2 Names and Functions of Parts, Basic Operations & Screens
Page 30

22
2.3 Display Items and Screen Types
Page 31

23
See 3.6 ( p.28)
Installing the Instrument
Initial Instru m e n t P r epar a ti o n s
See 3.2 ( p.24)
See 3.3 ( p.26)
See 3.7 ( p.28)
See 3.11 ( p.36)
See "Instrument Installation" (p. 5)
Pre-Operation Inspection
Verifying Correct Wiring
Always perform these checks before connecting, and when turning the power on.
Always execute zero adjustment before connecting to measurement objects.
See 3.10 ( p.34)
Connecting to the Lines to be Measured
See 3.9 ( p.30)
Setting the wiring mode
See 3.8 ( p.29)
Turning Power On
See 3.4 ( p.27)
Back side
Apply the approp riate adhesive lab els near the
input jacks and around the voltage and cu rrent
sensor measuremen t cables. Then bundle the
voltage cables together with the spiral tubes.
Connecting the V oltage Measurement
Cables
Connecting the Current Sensors
Connecting the Power Cord
For best precision, allow at least 30 minutes
warm-up before executing zero adjustm ent an d
measuring.
3.1 Operations in general
Measurement
Preparations Chapter 3
3.1 Operations in general
3
Chapter 3 Measurement Preparations
Page 32

24
Before applying the labels
Wipe any dust from the surface of the voltage measurement cables and current sensors,
and ensure that it is dry.
Measurement Cable Labels
For each input jack, apply labels
with the same color near the jack
and to its corresponding voltage
measurement cable lead or clamp
sensor cable.
Apply labels to both
ends of the volt age
measurement cables
Apply labels to both
ends of the current
sensor cables.
Red
Yellow
Blue
Gray
L9438-50 Voltage Cord
Alligator Clips (two, one each red and black)
Banana Plug Leads (two, one each red and black)
Spiral Tubes (five, for cable bundling)
3.2 Initial Instrument Preparations
3.2 Initial Instrument Preparations
Perform the following before starting measurement the first time.
Put the provided input cor d labels f or ea ch voltage cord and current sensor
The labels are provided to clearly indicate which cable connects to each input jack.
Bundle the voltage measurement cable leads with the spiral tubes
Five spiral tubes are supplied with the Model L9438-50 voltage measurement cables.
Use the spiral tubes as needed to wrap red and black leads together.
Preparation items
Page 33

Procedure
Red
Black
Spiral tube
3.2 Initial Instrument Preparations
Hold two cable leads (one each red and black) side-by-side.
1.
Start bundling from one end of the leads.
25
Wind the spiral tube around the leads.
2.
Wrap the two leads together with the spiral tube. The five supplied spiral
tubes should be applied with suitable spacing.
3
Chapter 3 Measurement Preparations
Page 34

26
Before using the instr ument the f irst ti me, v erify that i t operat es no rmally to e nsure that the n o dam age
occurred during storage or shipping. If you find any damage, contact your dealer or Hioki representative.
An error is displayed
Do not use if damage is present, as
you could receive an electric shock.
Contact your dealer or H ioki repres entative if you find any damage.
Metal Exposed
Yes
No Metal Exposed
No
No
Yes
Contact your dealer or Hioki representative if you find any damage.
No
Yes
Initial Screen
HIOKI 3390 POWER ANALYZER 1.00
Pre-connection inspection
1
Power-on confirmation
2
Inspect the current sensors
Is a clamp cracked or damaged?
Inspect t he instrument
Is damage to the instrument evident?
Inspect the voltage measurement cables
Does any cable insul ati on app ear da mag ed,
or is bare metal exposed?
Does the self-test (model and version) display
appear?
(The version number may be changed t o the latest version number.)
The power cord may be damaged, or
the instrument may have internal
damage.
Please contact your dealer or Hioki
representative.
When the self-test finishes, does the [Wiring]
page of the Setting or Measurement screen
Yes
Inspection complete
The instrument may be
damaged internally.
Please contact yo ur dealer
or Hioki representative.
3.3 Pre-Operation Inspection
3.3 Pre-Operation Inspection
Page 35

3.4 Connecting the Power Cord
Plug the power cord into the mains outlet.
Back side of the instrument
1. Check that the instrument’s power switch is turned
off.
2. Confirm that the line voltage matches instrument
requirements, and plug the power cord into the
power inlet on the instrument.
3. Pl ug the other end of the power cord into an outlet.
Turn off the power before disconnecting
the power cord.
Power Inlet
Power cord
About the outlet with ground pin
Functional earth
3.4 Connecting the Power Cord
Be sure to read the "Usage Notes" (p. 5) before connecting power.
Connect the power cord to the power inlet on the instrument, and plug it into an outlet.
Connection Procedure
27
3
Chapter 3 Measurement Preparations
3.5 Grounding the Instrument's Functional
Earth (when measuring in noisy environments)
Ground the instrument's function al earth .
Connect the functional ground term inal to a c lean co mmon ground to s uppress noi se effects when m easuring in an electrically noisy environment. When measuring AC power lines using a VT (PT), connect the
PT ground to the same grounding point.
Page 36

28
Plug the voltage cables into the appropriate channels’ voltage
measurement jacks.
Insert the plugs into the terminals as far as they will go.
With the arrow on top of the plug, plug each current sensor cable
into the appropriate channel’s current measurement jack.
Insert each plug until you hear it lock.
To disconnect:
Holding the plug aro und its arrow, sl ide it forward to unlock, then pu ll out.
3.6 Connecting the Voltage Measurement Cables
3.6 Connecting the V oltage Measurement
Cables
Be sure to read the “Usage Notes” (p. 7) before connecting measurement cables.
Plug the voltage m easurement cable leads in to the voltage measurement jacks on the instrument (th e
number of connections depends on the lines to be measured and selected wiring mode).
Connection Procedure
3.7 Connecting the Current Sensors
Be sure to read the "Usage Notes" (p. 5) before connecting measurement cables.
Plug the current sensor cables into the current measurement jacks on the instrument (the number of connections depend s on the lines to be measure d and selected wiring mod e). See the instruction ma nual
supplied with the current sensor for specification details and usage procedures.
Connection Procedure
T o measure volt age and current beyond the range of the instrument or current sensor
Use an external VT (PT) or CT. By specifying the VT or CT winding ratio on the instrument, the input level
at the primary side can be read directly.
See"4.2.6 Setting Scaling (when using VT(PT) or CT)" (p. 51)
During wiring, avoid touc hing the VT(PT), CT or input termina ls. Exposed live contact s can cause electri c shock or other acc ident resultin g in personal inju ry or death.
• When using an external VT (PT), avoid short-circuiting the secondary winding.
If voltage is applied to the primary when the secondary is shorted, high current
flow in the secondary could burn it out and cause a fire.
• When using an external CT, avoid open-circuiting the secondary winding. If
current flows through the primary when the secondary is open, high voltage
across the secondary could present a dangerous hazard.
• Phase difference in an external VT (PT) or CT can cause power measurement
errors. For optimum power me as ur eme nt accu ra cy , use a VT (PT ) or CT that exh ib its minimal phase difference at the operating frequency.
• To ensure safe ty when u si ng a V T ( PT) or CT, one side of the secondar y shoul d be
grounded.
Page 37

3.8 Turning the Power On and Off
Turn the POWER switch on ().
The instrument performs a 10-second power-on self test.
See 3.3 ( p.26)
The instrument performs a 10-second power-on self test.
When the self test finishes, the [Wiring] page of the Se tting screen appear s (initial
screen). If [Start page] is set to [Last Screen] (p. 101), the last displayed Measure -
ment screen appears.
Turn the POWER switch off ( ).
3.8 Turning the Power On and Off
Be sure to read the “Usage Notes” (p. 7) before turning the instrument on.
Connect the power cord and voltage and current measurement cables before turning the instrument on.
Turni ng the power on
29
3
Chapter 3 Measurement Preparations
If the self-test fails, operation sto ps at the self-test scr een. If the fault recurs after turning the power off and on, the instrument m ay be damaged . Perform the fo llowing procedure:
1. Stop measuring, di sconnect the measurement cables from the o bject being measured, and turn the instrument off.
2. Disconnect the power cord and all cables from the instrument.
3. Contact your dealer or Hioki representative.
For best precision, allow at least 30 minutes warm-up before executing zero adjustment and measuring.
Turni ng the power off
Page 38

30
2
3
To accept the selection:
Press (or the key)
To cancel the selection:
Press (or the key)
1
Press the key to select
[Select] (or press the key)
to display the pull-down menu.
2
1
3
Select the wiring mo de
Accepting the selection displays the wiring
diagram of the selected wiring mode.(p. 31)
3.9 Selecting the Wiring Mode
3.9 Selecting the Wiring Mode
Select the wiring mode to match the phase system(s) to be measured. Eight wiring modes are available.
To open the [Wiring] page
Press the key and select the [Wiring] page with the .
To select the wiring mode
• To measure multiph ase powe r, use the sa me type of current sens or on ea ch phase
line. For example, to me asure 3-phase 4-wire power, us e the same model current
sensors on channels 1 to 3.
• When using a c urrent sensor with switchable sensor rating (such as Mode l 9272-
10), set the sensor rating to match the rating of the line.
• When the selected wiring m ode uses multiple channels, channel-specific settings
(such as voltage range) are linked to the first channel’s settings.
Page 39

Wiring configuration diagram
Wiring Mode 1. Single-phase, 2-wire (1P2W) × 4
Wiring configuration diagram
See
Pages 172 and 173 f or additional wiring diagrams.
Wiring Mode 2. Single-phase, 3-wire (1P3W) + single-phase, 2-wire (1P2W) × 2
Wiring Mode 3. 3-phase, 3-wire (3P3W2M) + single-phase, 2-wire (1P2W) × 2
31
3.9 Selecting the Wiring Mode
3
Chapter 3 Measurement Preparations
Page 40

32
Wiring Mode 4. Single-phase, 3-wire (1P3W) × 2
Wiring Mode 5. 3-phase, 3-wire (3P3W2M) + single-phase, 3-wire (1P3W)
Wiring Mode 6. 3-phase, 3-wire (3P3W2M) × 2
3.9 Selecting the Wiring Mode
Page 41

33
Wiring Mode 7. 3-phase, 3-wire (3P3W3M) + single-phase, 2-wire (1P2W)
Wiring Mode 8. 3-phase, 4-wire (3P4W3M) + single-phase, 2-wire (1P2W)
3.9 Selecting the Wiring Mode
3
Chapter 3 Measurement Preparations
Page 42

34
3. Press the key.( to cancel.)
[Executing zero adjustment] is displayed for 30
seconds, until finished.
2. Press the key.
[Execute Zero Adjust.] is displayed.
1. Press the key.
Securely clip the leads to metal parts such as load-side screw ter mi nal s or
bus bars.
Example:
Secondary side of breaker
L9438-50 Voltage Cord
3.10 Attaching to the Lines to be Measured and Zero Adjustment
3.10 Attaching to the Lines to be Measured and Zero Adjustment
Be sure to read the “"Usage Notes" (p. 5) before attaching to the lines.
Always perform zero adjustment before attaching to the lines.
Then attach the voltage meas urement clips and curr ent sensors to the meas urement lines acc ording to
the on-screen wiring diagrams. For proper accuracy, attach to the lines exactly as shown.*
* The diagram appears when the wiring mode is selected.(p. 30)
Although the instrument can measure multiple lines at the same time, to avoid
electric shock and short-circuit accidents, do not attach any unnecessary
cables.
The phases are named A, B, and C on the wiring diagram display. Substitute with
equivalent names such as R,S, and T or U,V, and W, as appropriate.
Zero Adjustment and Degaussing (DMAG)
To obtain the spe cified accuracy, after 30 minu tes warm-up, perform zero-adjustmen t on both voltage
and current measurement channels.
When using an AC/DC current sensor, perform degaussing (DMAG) along with zero adjustment.
• Perform zero adju st ment onl y after plu gging the curr ent se nsor into t he instr ument (proper adjustment requires that the current sensor be connected).
• Perform zero adjustm ent before attaching to the li nes to be me asured (prop er
adjustment requires the absence of any input voltage or current).
• For optimum measurement accuracy, zero adjustment should be performed
within the specified ambient temperature range.
• The operating keys are disabled during zero adjustment.
• When using a motor evalua tion option, zero adjustment is not applicable for
analog DC input on chann els A and B. Perform the special zero adj ustment
from the Motor screen.
See"4.8 Viewing M otor Meas urement Values (With Hioki 9791 or 9793 insta lled)" (p. 82)
Attach voltage measurement cables to measurement lines
Page 43

3.10 Attaching to the Lines to be Measured and Zero Adjustment
OK
Shield
(Example: 9272-10)
Source
side
Line
Load side
Current Flow
Direction Arrow
Be sure to attach each clamp around only one conductor.
Correct measurement cannot be obtained if a clamp is attached around more than one conductor.
Make certain that the current flow direction
arrow points toward the load.
If measurement line power is off, turn it on before performing quick setup.
Select [Easy Set] with the key.
A confirmation dialog box appears.
2
1
1
To execute: Press
To cancel: press .
What settings are affected by quick setup?
For accurate measurements, settings such as range and sync source must be properly configured. Executing qu ick setup automatic ally configures th e following settings to the Hioki-recommended values for the sel ected w iring mode (phase sy stem): voltage and c urrent ranges, s ync
source, lower measurement frequency limit, integration mode, harmonic sync source and rectification system.
Execute quick setup when using the instrument the first time, and when changing to a different
line configuration.
Attach current sensors to measurement lines
35
3
Chapter 3 Measurement Preparations
Easy set
Page 44

36
Voltage Current
For 1P2W systems For systems other than 1P2W
• Verify that an appropriate measurement
value is displayed.
• Verify that the vectors
are displayed with the
appropriate range.
Measured voltage value
Measured current value
Measured active power value
Verify that an appropriate
measurement value is displayed.
Vector line range
Colors match the corresponding lines in the wiring diagram.
If the measured voltage value is
too high or too low
If the measured current value is
not correct
If the measured active power
value is negative
If vectors are too short, or
unequal
If vector direction (phase) or
color is incorrect
• The display rang e of the vector diagrams assu mes inductive loads (su ch as with a motor).
The vectors may appear out of rang e when me asuring near- zero power fact or, or capacitive loads.
• When measuring multiple 1P3 W or 3-phase li nes at the same time, vectors are no t displayed correctly when the harmoni c sync source fr equency is dif feren t from that of the lines t o be measured .
• When measuring 3P3 W2M systems, the active p ower (P) measured on each c hannel may
be negative.
3.11 Verifying Correct Wiring (Connection Check)
3.11 Verifying Correct Wiring (Connection Check)
Correct attachment to the lines is necessary for accurate measurements.
Refer to the measured values and vector displays to verify that the measurement cables are corre ctly attached .
In this case Check
• Are the cables securely plugged into the voltage measurement jacks on
the instrument? (p. 28)
• Are the voltage measurement cables properly attached to the lines? (p. 34)
• Are the cables securely plugged into the current measurement jacks on
the instrument? (p. 28)
• Are the current sensors properly attached to the lines? (p. 35)
• Are the current sensors appropriate for the line current to be measured?
• If using the 9272-10 Clamp Sensor, is the sensor range set correctly?
• Are the voltage measurement cables properly attached to the lines? (p. 34)
• Is the arrow marker on the current sensors pointing toward the load? (p. 35)
Voltage vectors:
• Are the cables securely plugged into voltage measurement jacks on the
instrument? (p. 28)
• Are the voltage measurement cable clips pr operly attached to the l ines? (p. 34)
Current vectors:
• Are the cables securely plugged into the current measurement jacks on
the instrument? (p. 28)
• Are the current sensors properly attached to the lines? (p. 35)
• Are the current sensors appropriate for the line current to be measured?
• If using the 9272-10 Clamp Sensor, is the sensor range set correctly?
Voltage vectors:
• Check that the voltage measurement clips are attached to the lines
according to the wiring diagram.
Current vectors:
• Check that the current sensors are attached to the lines according to the
wiring diagram.
Page 45

4.1 Measurement Value Display Procedure
Display the
[CH] page
See Displays the Harmonic Graph or Harmonic List.
"4.4 Viewing Harmonic Measurement Values" (p. 62)
The above screen is specific to the wiring mode (here showing four 1P2W systems)
he number of measurement items displayed depends on the selected wiring mode.
See Section "3.9 Selecting the Wiring Mode" (p. 30) to set the wiring mode.
Use the F keys to select
display contents
Viewing
Measurement
Values Chapter 4
4.1 Measurement Value Display Procedure
37
The following procedure display s mea sure men t valu es.
Display Procedure (the following shows 1P2W wiring mode)
4
Chapter 4 Viewing Measurement Values
Page 46

38
Four-Item Display Eight-Item Display
Sixteen-Item Display Thirtytwo-Item Display
4.1 Measurement Value Display Procedure
Selecting Measured Items for Display
From all measured items, select those you want to display on one screen.
Press to display the [Select] page.
First press an F key to select the number of items to be displayed.
Page 47

Display Item Selection Procedure
Display the
[Select] page
(a blinking cursor appears)
Enter
Select the item to
display
Cancel
Press when finished making changes.
Move the cursor
to the item to change
Accept
(the pull-down menu
appears)
39
4.1 Measurement Value Display Procedure
4
Chapter 4 Viewing Measurement Values
Page 48

40
Peak Over vol tage
Peak Over cur rent
(red indicators)
4.1 Measurement Value Display Procedure
About Valid and Displayable Ranges
The valid measur ement range (the ra nge of gua ranteed ac curacy) is 1% to 110% of the full-scale range
(except that valid voltage is limited to 1000 V in the 1500 V scale).
The display range of this unit is between the zero surpress level to 120% of the measurement range.
The following display indicates over-range measurement.
See Zero surpress level: OFF, 0.1%f.s., 0.5%f.s. (initial setting) (p. 101)
About Peak Over Indicators
Peak Over indicators light when an input voltage or current waveform peak value exceeds three times the
full-scale range (except the 1500 V range, when the voltage exceeds ±2000 V, see the figure below). The
indicators are shown on all screens, so that Peak Over can be seen even on channels not currently
selected.
Example. The following display indicates that the CH 1 voltage and CH 3 current are at Peak Over levels.
Page 49

41
RMS Voltage
RMS Current
Power Factor
Active Power
Apparent Power
Reactive Power
Power Phase Angle
Frequency
• Average rectified RMS c onver te d va lue is displayed for Urms or Irm s a ccor di ng to the r ecti fication setting.
See"4.2.5 Selecting th e Rectif ication Met hod" (p . 50)
• Polarity of power factor (λ), Reactive power (Q), and power phase angle (φ) shows the LEAD
or LAG. "No polarity sign" means "LAG" and "-" means "LEAD".
• The polarity of powe r factor, reactive power and pow er ph as e a ngle m ay n ot b e s table whe n
the voltage and current has big level difference or power phase angle is around zero.
• Each channel value of effective power (P), Reactive power (Q), Apparent power (S) and
power factor (
λ) is meaningless in the 3P 3W 2M wir ing. U se only the sum values (P12, P34,
etc.)
4.2 Viewing Power Measurements, and Changing the Measurement Configuration
4.2 Viewing Power Measurements, and
Changing the Measurement Configuration
4.2.1 Displaying Power Measurements
When viewing power measuremen ts, [P ow er], [Voltage], and [Current] are displayed so that measur ed
values can be confirmed . Press to display the Me asur ement s creen, and selec t the desire d [CH]
page with the keys. Power measurements can be displayed in a list, and detailed voltage
and current values can be displayed.
Displaying Power
Press . (The screen shows values for Wiring mode 1, four 1P2W systems.)
4
Chapter 4 Viewing Measurement Values
Page 50

42
RMS Voltage
Rectified Mean Valu e of
RMS Conversion
THD Voltage Percentage
Fundamental Voltage
Content
Voltage Waveform Peak+
AC Voltage Content
Frequency
Simple Averaged Voltage
Voltage Waveform Peak-
When the Wiring mode is 3P3W3M or 3P4W, voltage unbalance Uunb [%] is displayed.
RMS Current
Rectified Mean Value of
RMS Conversion
THD Current Percentage
Fundamental Current Cont ent
Current Waveform Peak+
AC Current Content
Simple Averaged Current
Current Waveform Peak-
When the Wiring mode is 3P3W3M or 3P4W, current unbalance Iunb [%] is displayed.
Frequency
4.2 Viewing Power Measurements, and Changing the Measurement Configuration
Displaying Voltage
Press . (The screen shows values for Wiring mode 1, four 1P2W systems.)
Displaying Current
Press . (The screen shows values for Wiring mode 1, four 1P2W systems.)
Page 51

43
Voltage Range Current Range
4.2 Viewing Power Measurements, and Changing the Measurement Configuration
4.2.2 Selecting Ranges
Measurement ranges are selected as described below.
• If the maximum voltage or current rating is exceeded , immediately stop measuring, shut off power to the measurement lines , and disconnec t from the measurement object.
• Continuing to measure when maximum ra tings are exceeded may d amage the
instrument and result in injury or death.
• The maximum input voltage is +/-2000V DC, 1500Vrms AC. Do not use the voltage exceeding it to avoid damaging the unit or injury.
• Never exceed the maximum rated input current to the current sensor, as damage to the instrument or injury or death can result.
4
Chapter 4 Viewing Measurement Values
Types of Range Setting
Measurement ranges can be selected in two ways:
Manual range setting
Auto-Ranging
Select the range manually
(Press RANGE or to select the desired range.)
Each voltage and current range is se t automatically acc ording to the meas urement inputs
for each wiring system. (Press RANGE and at the same time.)
Range Display
The active range selection is displayed at the locations on the Measurement screen shown below (except
on the [Efficiency], [XY Graph], and [Motor] pages). Manual range selections are indi cated by [Manu],
and Auto-ranging selections by [Auto].
Page 52

44
For M anual range selection, press R ANGE or
to select the desired range.
Current RangeVoltage Range
For Auto range selection, press RANGE an d at
the same time.
Display the
[Vector] page
Press the RANGE keys to select the range
Select the channel to
change
Press the RANGE keys to select
the range
Select the channel to
change
Display the
[Wave + Noise] page
Select the channel to
change
Press the RANGE keys to select the
range
Select [U/I]*
* Press to display [CH]
for changing.
4.2 Viewing Power Measurements, and Changing the Measurement Configuration
Range Setting Procedure
Ranges can be set on the following Measurement sc reen pages: [Vector], [CH] (any) , [Wave + N ois e],
[Select], and [Input]. Change the range with the RANGE and keys.
Setting from the [Vector] Page of the Measurement Screen
Setting from the [CH] Pages of the Measurement Screen
Setting from the [Wave + Noise] Page of the Measurement Screen
Page 53

4.2 Viewing Power Measurements, and Changing the Measurement Configuration
Display the
[Select] page
Select the channel
to change
Press the RANGE keys to select the range
Display the
[Input] page
Press the RANGE keys to select
the range
(Changes the selected [U range] or
[I range])
Select the channel
to change
To c hange the [U range] or [I range], select it with the
cursor and press , , or to change the
range.
See About [All CH Set] "2.2 Basic Opera-
tions" (p. 16)
When measuring multiple channels with a Wiring mode other than 1P2W, all channels are
forced to the same range. In this ca se, the r ange of ea ch chann el is s et to matc h the cha nnel
set to the lowest range.
Setting from the [Select] Page of the Measurement Screen
45
4
Chapter 4 Viewing Measurement Values
Setting from the [Input] Page of the Setting Screen
Page 54

46
13⁄
When Δ-Y conversion is enabled (p. 98), the range-decrementing voltage is
(approximately 0.57735) f.s.
Display the
[Calc] page
Select with the F keys
Select
[AutoRange type]
• If the range switches frequently even when the [Wide] setting for [AutoRange type] is
selected, Manual range setting is recommended.
See"4.2.2 Selecting Ran ges" (p. 4 3)
• When integration starts, the ran ge selected at that tim e becomes fixed, and a uto-ranging is
disabled.
4.2 Viewing Power Measurements, and Changing the Measurement Configuration
Auto-Ranging Span
This setting determines auto-ranging behavior, and can be specified for each wiring system. Select
[Wide] if the range changes frequently due to large fluctuations.
• The measurement ran ge incr ements by one when a Pe ak Over state occurs or when
Narrow
Wide
any RMS value exceeds 105% f.s.
• The measurement range de crements by on e when all RMS values fal l below 40% f.s.
(unless a Peak Over state would result in the lower range). This is the default setting.
• The measurement ran ge incr ements by one when a Pe ak Over state occurs or when
any RMS value exceeds 110% f.s.
• he measurement rang e decrements by two when a ll RMS values fall b elow 10% f.s.
(unless a Peak Over state would result in the lower range).
Setting Procedure
Page 55

47
Select with the F keys
Select [Sync source]
for the channel to be
changed.
See [All CH Set] and [Next].
"2.2 Basic Operations" (p. 16)
Display the
[Input] page
• When measuring AC in put wit h [DC50 ms] a nd [DC100 ms] settings, dis played va lues fluctuate and proper measurement is not possible. Select any of [U1] to [U4] or [I1] to [I4].
• Voltage and current share the same sync source on each channel.
• [DC50 ms] is the fastest calculation interval for DC measurements. However, if input interference (50/60-Hz p ower line noise) causes measurement values to fluc tuate, select [DC100
ms].
• When U or I is selected as a sync source, amplitude should remain at least 30% f.s.
• Also when U or I is selected as a sync source, if a frequency is applied above 5 kHz or below
the minimum measuremen t frequency, the displayed frequency may differ from the input frequency.
For the sync sou rce, select an in put with a fundamen tal frequency of 0.5 Hz t o 5 kHz, and
specify the corresponding minimum measurement frequency .
• The measurement va lues may get uns table at the frequenc y around the lo west measurabl e
frequency, because the synchronization is unlocked.
4.2 Viewing Power Measurements, and Changing the Measurement Configuration
4.2.3 Selecting the Sync Source
Select the source to determine the fundamental cycle (between zero crossings) on which various calculations are to be based.
Select from the followin g 11 items for each Wiring mode. Pres s to make the setting on the S etti ng
screen.
U1 to U4 (Default setting), I1 to I4, DC50 ms, DC100 ms, Ext*
The selected synchronization source is displayed as [Sync] on the Measurement screen.
* Selectable when a Model 9791 or 9793 Motor Testing Option is installed and CH B is set for pulse input.
Sync Source Setting Procedure
4
Chapter 4 Viewing Measurement Values
Page 56

48
(Ex.)
Set to display waveforms from “0”.
When [OFF] is s e le cted, accuracy is u nd ete rm in ed , s o al way s
select the Weak or Strong settin g when vi ewing measu reme nt valu es.
0
Display the
[Calc] page
Select with the F keys
Select
[ZeroCross filt]
Harmonic sync source unlocked
See "4.4.4 Selecting the Harmonic Sync Source"
(p. 67)
Red Indicates sync is unlocked.
The channel cannot be measured accurately.
Yellow “ULK” lights yellow when the frequency of any
sync source channel is at or below 99% (or at or
above 101%) of the harmoni c sync sourc e. In this
case, the harmonic s of each measured val ue, the
fundamental conten t (Ufnd and Ifnd), and the total
harmonic ripple distortion percentages (Uthd and
Ithd) cannot be measured correctly.
Example. When the frequency of the harmonic
sync source is 50 Hz and the frequency of the sync
source channel is 49.5 Hz or less, or 50.5 Hz or more.
Harmonic sync source unlocked
4.2 Viewing Power Measurements, and Changing the Measurement Configuration
Setting the Zero-Crossing Filter
When U or I is selected, set the level of the zero-crossing filter.
OFF
Weak This is the normal (default) setting.
Strong
Select this setting if synchronization i s lost because the input fundamental and the carrier freq uency
are too close together, such as when measuring an inverter secondary.
Zero-Crossing Filter Setting Procedure
About the Sync Unlock Indicators
When a sync signal cannot be acquired,
tors for all channels are displayed on all screens, so sync unlock events are visible even when they occur
on channels that are not currently selected for display.
Example. The following case indicates that CH 2 sync is unlocked.
* its Sync Unlock indicator appears (see figure below). The indic-
* If the frequency of the sel ected sync source (input) is not betwee n 0.5 Hz and 5 kHz, or if there is no
sync source input signal, or if the input amplitude is too low (below 30% f.s.)
Page 57

49
Display the
[Input] page
Select
[Freq measure]
Select with the F keys
See About [All CH Set]. "2.2 Basic
Operations" (p. 16)
This setting is available on all Measurement screen pages.
Press the LO W FREQ and
keys to make the setting
4.2 Viewing Power Measurements, and Changing the Measurement Configuration
4.2.4 Frequency Measurement Settings
By configuring U or I settings for each input channel, the instrument can simultaneously measure multiple
frequencies in different wiring systems.
Frequency Measurement Display System
• 0.5000 Hz → 9.9999 Hz → 10.000 Hz → 99.999 Hz → 100.00Hz → 999.99 Hz → 1.0000 kHz →
5.0000 kHz
• 0.5000 Hz ← 9.8999 Hz ← 9.900 Hz ← 98.999 Hz ← 99.00 Hz ← 989.99 Hz ← 0.9900 kHz ←
5.0000 kHz
• For o ther mea su remen t i npu t f re quen ci es ( no t b etwe en 0.5 Hz a nd 5 k Hz ): “ 0.0 000 Hz ” i s displ ay ed for
frequencies below 0.5 Hz, and “------ Hz” for 5 kHz and above.
4
Frequency Measurement Source Setting Procedure
Specify the lowest (limit) measurement frequency for frequency measurements.
Set the lowest measurement frequency according to the input frequency.
The setting is displayed as the [Lowest] value on the Measurement screen.
Chapter 4 Viewing Measurement Values
Setting the lowest measur ement frequency on the Measurement screen
Page 58

50
Display the
[Input] page
Select
[Lowest freq]
Select with the F keys
• The frequency meas urement range is 0.5 Hz to 5 kHz (within th e sync frequency range).
Input frequencies outside of this range cannot be measured.
• The guaranteed accuracy of frequen cy measurement stip ulates sine wave inpu t of at least
30% of the measurement range of the frequency measurement source. Frequency measurement may not be possible with other input signals.
• For input signals of 45 Hz and below, the data update rate depends on the input frequency.
• If a frequency is appli ed above 5 kHz or below the minimum mea surement frequency, the
displayed frequency may differ from the input frequency.
Select with the F keys
Select a [U rect]
and [I rect]
for the
channel being set.
Display the
[Input] page
See About [All CH Set]. "2.2 Basic
Operations" (p. 16)
4.2 Viewing Power Measurements, and Changing the Measurement Configuration
Setting the Lowest Measurement Frequency on the Setting Screen
4.2.5 Selecting the Rectification Method
Select the voltage or current rectification method to be used for calculating apparent power, reactive
power, and power factor. Two rectification methods ar e selectable for each voltage and current input.
Make this selection before measurement.
RMS True root mean square value (default setting)
MEAN Rectified mean value of RMS conversion
[MEAN] and [RMS] settings for each range are made on the [CH] pages.
Setting Procedure
Page 59

51
When [OFF] is selected, VT and CT ratios are both 1.00.
Select with the F keys
Select a [VT rate]
and [CT rate] for
the channel being
set.
Display the
[Input] page
See About [All CH Set].
"2.2 Basic Operations" (p. 16)
4.2 Viewing Power Measurements, and Changing the Measurement Configuration
4.2.6 Setting Scaling (when using VT(PT) or CT)
Set the VT or CT ratio when using an external VT(PT) or CT.
When a ratio has been set, [VT] or [CT] is displayed above each range setting on the [CH] pages.
The settable range is as follows.
VT rate
CT rate
OFF/ 0.01 to 9999.99
(Setting is not available when VT × CT exceeds 1.0E+06.)
OFF/ 0.01 to 9999.99
(Setting is not available when VT × CT exceeds 1.0E+06.)
Setting Procedure
4
Chapter 4 Viewing Measurement Values
Page 60

52
The setting can be made from the [Vector], each [CH], [Wave + Noise], and [Select] page on the Measurement screen.
Press the LPF and
keys to make the setting
Display any of
these pages
Display the
[Input] page
Select with the F keys
Select a [LPF] for the
channel being set.
See About [All CH Set]."2.2 Basic Operations" (p. 16)
4.2 Viewing Power Measurements, and Changing the Measurement Configuration
4.2.7 Setting the Low-Pass Filter
The instrument includes a low-pass filter function to limit the measurement frequency range.
Enable the filter to remove harmonic components or extraneous noise when measuring.
Filter cut-off frequency can be selected from the following four settings, and can be set differently for each
wiring system.
OFF Specified accuracy applies only at 150 kHz and below.
100 kHz
5 kHz Specified accuracy applies only at 500 kHz and below.
500 Hz
The low-pass filter setting appears below [LPF] on the Measurement screen.
Specified accuracy applies only at 20 kHz and below.
except 10 kHz to 20 kHz, add ±1% rdg.
Specified accuracy applies only at 60 kHz and below.
add ±0.1% f.s.
Setting the Cut-Off Frequency on the Measurement Screen
Selecting the Cut-Off Frequency on the Setting screen.
Page 61

4.3 Integration Value Observation
Press , select a channel [CH] with , then press .
RMS Voltage
RMS Current
Active Power
Power Factor
Integration Time Items
Frequency Measurem ent
Source Frequency
* Displayed only for DC integration mode
Current Integration Values
Ih2+ CH 2 positive current integration value*
Ih2- CH 2 negative current integration value*
Ih2 CH 2 total current integration value
Example. With 1P2W Wiring mode selected, and DC integration mode
WP2+ CH 2 positive active power integration value
WP2- CH 2 negative active power integration valu e
WP2 CH 2 total active power integration value
Active Power Integration Values
Integration in progress
Integration stopped
Waiting for integration to s tart by real-time clo ck control
Items that can be integrated depend on the selected wiring and integration mode.
See "3.9 Selecting the Wiring Mode" (p. 30), "4.3.2 Setting the Integration Mode" (p. 56)
4.3 Integration Value Observation
4.3.1 Displaying Integration Values
Current (I) and activ e power (P) are integrated on all chan nels simultaneously. Positive, negative a nd
total values are displayed.
Displaying Integration Contents
53
4
Chapter 4 Viewing Measurement Values
Page 62

54
1. Verify that the clock is set correctly.
See "Clock" (p. 101)
2. Select the integration mode.
See 4.3.2 ( p.56)
3. Set the desired time control functions (interval, timer, and clock controls).
See 4.3.4 ( p.59)
Set "OFF" for time settings when integrating manually.
4. Make appropri ate settings for saving to CF card, and for D/A output, as needed.
See "7.3 CF Card Formatting" (p. 10 6), "8.4 Using Analog and Waveform D/A Output O pt ion s (m us t be fa cto ry
installed before shipping)" (p. 132)
Start integration: press once
Stop integration:
* press again
Resets integration: press when integration
is finished
Always reset the integration values when
changing other settings.
* When timer or clock control
is enabled, integration stops
automatically at the s pecified
stop time.
• Integration start, s top and value reset cann ot be performed on the Sett ing or File Ope ration
screens. These functions are available only on the Measurement screen.
• Remote control by USB or LAN communications can be performed us ing the same operations on the remote control application program screen.
See"Chapter 9 Operat ion with a Comp uter" (p. 14 1)
4.3 Integration Value Observation
Before Starting Integration
Starting, Stopping, and Resetting Integration
These functions can be controlled by key operations or by communication commands.
Page 63

55
• Maximum integration time is 9999 hours, 59 minutes and 59 seconds, after which integration
automatically stops.
• Integration start, sto p a nd reset by the operating keys an d e xter nal contr o l a ct on al l int egr ation items simultaneously.
• The following physic al qua nti tie s ca n be mea su re d by in tegr at ion for each wi ring sy s tem and
DC integration mode.
• Calculation results for each channel are integrated at 20 times per second, so integration values may differ for measurement devices with different response or samp ling rates, and for
different calculation metho ds .
• When auto-ranging is ena ble d for any it em, the actu al mea su re men t range bec om es fixed at
its current setting the mom ent integration s tarts, so set the range b eforehand to avoi d overrange input.
• For current integrati on, the DC mode integra tes instantaneous current, and the RMS mode
integrates RMS current.
• For power integration, the DC mode integrates instantaneou s power, and the RMS mode
integrates active power.
• When integration is enabled (including “Wait” for clock control) , settings can not be change d
other than switching screens and the Data and Peak Hold functions.
• When Data or Peak Hold is activ e, in tegration conti nues inter nally e ven wh en dis play ed va lues are fixed. Even so, it is the displayed data that is output to CF card and D/A outputs.
• Integration display values are unaffected by the Peak Hold state.
• System reset stops int egration an d rese ts integra tion val ues se ttings t o factor y defaul ts."6.1
Initializing the Instrument (System Reset)" (p. 101)
• If a power outage occurs during integration, integration restarts when power is restored.
Mode Name Physical Quantities
1P2WvDC Mode Ih+, AIh-, Ih, WP+, WP-, WP
1P2W Ih, WP+, WP-, WP
1P3W, 3P3W
(using CH 1 and CH 2)
Ih1, Ih2, WP12+, WP12-, WP12
3P3W3M, 3P4W
(using CH 1, CH 2 and CH 3)
Ih1, Ih2, Ih3, WP123+, WP 123-, WP123
4.3 Integration Value Observation
4
Chapter 4 Viewing Measurement Values
Page 64

56
Display the
[Input] page
Select with the F keys
Select the channel
to change
See About [All CH Set]. "2.2 Basic Operations" (p. 16)
Display of THD (to tal harmonic distortion) or RF (ripple fac tor) of the measurement value is
determined according to the integration mode setting.
When the RMS int egration mode is selected, THD is dis played, and when the DC mode is
selected, RF is displayed.
4.3 Integration Value Observation
4.3.2 Setting the Integration Mode
Select the integration mode for each channel.
Two choices are available for each wiring system.
Integrates instanta neo us curre nt an d pow e r val ues for each polarity during eve r y sa mp li ng
interval (at 500 kHz sampling frequency)
DC Integration
Mode
Only selectable for 1P2W wiring with AC/DC current sensors (Models CT6862, CT6863, 9709,
9277, 9278, and 9279)
Integration is performe d sim ul tan eou sly on three current values (Ih+, Ih-, and Ih) and three
active power values (WP+, WP+, and WP)
RMS Integration
Mode
Setting Procedure
Integrates RMS current and active power during every measurement interval (50 ms).
Each polarity is integrated only for active power.
Page 65

4.3.3 Manual Integration Method
Manual Integration Operations
Additional Integration Ope ra tio n
Disable (set to [OFF]) the interval, timer and clock
timing control settings.
See "Integration Combined with Timing Control" (p. 5 9)
Press .
(The key lights green, and is
displayed to indicate the operating state.)
Press again.
(The light turns off, and is
displayed.)
Press again.
(The key lights green, and is
displayed to indicate the operating state.)
Press when finished integration.
Stop
Before starting integration
Start
Additional integration
(resumes integration with the values acquired previously)
Reset the integration value
Reset
Held Constant
Displayed Integration Value
Start
Time
Stop
Resume
Held Constant
Displayed Integration Value
Start
Time
Stop
Additional
This method starts and stops integration by manual operation.
Procedure
57
4.3 Integration Value Observation
4
Chapter 4 Viewing Measurement Values
Page 66

58
1. Sel e ct the integration data to be saved at each interval.
See 7.5.3 ( p.112) (Press [Integ] to select the integration items to save.)
2. Set saving (ON/OFF), and specify the folder, if needed.
See "7.5.2 Auto-Saving Measurement Data" (p. 110), "7.10.1 Creating Folders" (p. 117)
3. Select the interval time.
See 5.1 ( p.91)
4. Press to start saving at the selected intervals. (Press again to stop.)
• The data at each i nterv al i s not displayed if only in te rval ti ming is e nabled. Auto-saving must
also be enabled.
• The maximum integration time is 9999 hours, 59 minutes, and 59 seconds.
• When auto-saving is enabled, it is toggled by the key . Disable auto-saving (set to [OFF])
when not needed.
See"7.5.2 Auto-Saving M easurement D ata" (p. 110)
• When Data or Peak Hold is activ e, in tegration conti nues inter nally e ven wh en dis play ed va lues are fixed. Even so, it is the displayed data that is output to CF card and D/A outputs.
4.3 Integration Value Observation
Saving Integration Data at Each Interval
During manual integration, integration values can be saved in combination with interval time.
Measurement items selected as described in sec tion "7.5.3 S electing Measur ement Items to Save" (p.
112) can be saved to CF card at the specified interval.
See Can be set in "Interface" page of setting screen.
Procedure
Page 67

4.3 Integration Value Observation
Manually Controlled
Integration
Press to start integration.
Press again to stop integration.
See "4.3.3 Manual Integration Method"
(p. 57)
Reset
Keep
Integrated value
Start
Time
Stop
Timer-Controlled
Integration
開始 停止 リセット
Timer Setting Value
Automatic stop
Press to start integration.
Integration stops automatically
when the timer expires.
See "Timer-Controlled Integration" (p. 60)
Start ResetStop
Keep
Time
Integrated value
Clock-Controlled
Integration
Press .
Integration starts and stops at the
specified times.
See "Clock-Controlled Integration" (p. 61)
Stop Time
Wait Time Clock-Controlled Time
Start Time
Automatic Start Automatic Stop
Integrated value
Start Reset
Keep
Time
When an interval ti me is enabled, activating Data or Peak Hold by pressing the HOLD key
causes the display to update at each interval.
Also, when timer or clock control is enabled, the final measurement data is displayed at the
specified stop time.
4.3.4 Integration Combined with Timing Control
After specifying timer and clock settings, press to cause integration to start and stop at the specified
times. Integration can be controlled by the following three timing methods.
59
4
Chapter 4 Viewing Measurement Values
Page 68

60
Display the
[Time] page
to enable (set to [ON])
To interrupt integration:
Press again.
lights green
Use the F keys to set the timer
Press to start integration, which stops
automatically after the set time elapses.
Select [Timer mode]
Select a [Timer setting]
digit
• Integration stops when the timer expires (or the clock stop time occurs). When this oc curs
before the end of an interval, the last interval is ignored.
• Setting range is 10 seconds (“0 hour 0 min 10 sec”) to “9999 hour, 59 min 59 sec”.
• If clock timing con trol is set l onger than the timer setting, i ntegration starts at the c lock start
time and stops when the timer has expired (the clock stop time is ignored).
• Pressing befor e the timer expires d uring timer controll ed integration stops integ ration
and retains the integrati on v al ue s. I n thi s ins tance, pr es sing again resumes integ ra tio n
and continues for the set timer duration (additional integration).
4.3 Integration Value Observation
Timer-Controlled Integration
Integration is per formed for the spec ified durat ion, and s tops when the timer expi res. Calcu lation res ults
are held constant when the timer stops.
If auto-saving is enabled, integration values are saved to CF card when integration starts and stops. If an
interval time is also specified, total integration values up to that point are saved at each interval.
See "7.5.2 Auto-Saving Measurement Data" (p. 110)
Setting Procedure
Page 69

4.3 Integration Value Observation
Display the
[Time] page
Select [Real time]
to enable (set to
[ON])
Select a [Start time] and
[Stop time] digit
(automatically starts and stops
at the specified clock times)
During wait: blinks green
At the start time: lights green
To abort automatic control (while waiting):
Press again.
Use the F keys to set the timer
• Clock control settings are in 1-minute units.
• Clock setting years are AD (Christian Era), and 24-hour time (e.g., December 6th 2009,
10:16 PM appears as 2009-12-06 22:16)
• If a specified clock time has already passed, clock control is considered to be disabled
(OFF).
• When integration is interrupted during clock timing control, clock control is disabled (OFF).
• If clock timing con trol is set l onger than the timer setting, i ntegration starts at the c lock start
time and stops when the timer has expired (the clock stop time is ignored).
• Integration stops after 9999 hou rs, 59 minutes, and 59 seconds if the time betw een clock
start and stop times is set longer than that.
• Setting time upper limits are as follows:
Start Time 2077-12-31 23:59
Stop Time 2079-12-31 23:59
Clock-Controlled Integration
After pressing , the instr ument waits until the s pecified cl ock start time. Integ ration then be gins and
continues until the specified clock stop time.
If auto-saving is en abl ed, in tegr a tion v alues a re sav ed to CF c ard at the sp ec ifi ed s tart and s to p t ime s. If
an interval time is also specified, total integration values up to that point are saved after each interval.
Setting Procedure
61
4
Chapter 4 Viewing Measurement Values
Page 70

62
Harmonic
Voltage
Harmonic
Current
Harmonic
Active
Power
Amplitude
Content (%)
Phase Angle
Harmonic Sync Source Frequency
Change the selected order.
The green bar indicates the selected order.
These selections correspond to the orders on the
Harmonic List screen.
Shows the measured values of the
cursor-selected order.
4.4 Viewing Harmonic Measurement Values
4.4 Viewing Harmonic Measurement Values
4.4.1 Displaying the Harmoni c Ba r Gra ph
The results of harmonic analy sis of voltage, current and activ e power on the same channel can be displayed as a bar graph. Numerical data for the cursor-selected order is also displayed.
Press to display the Measurement screen.
Press to select the desired [CH] page, and press .
Changing the Displayed Order
Page 71

Changing Display Settings
MEAS_HARM_CH.bmp
Select the item
Enter
Selects from the pu ll-down
menu
Cancel
Displays the pul l-down
menu
Channels in the same wiring
Displayed item
Vertical axis display
Maximum harm onic order to display
Channel Changes channels in the same wiring system.
(Example) In the 3P4W wiring
CH1, CH2, CH3, CH123
Display
Contents
Changes the display contents
Amplitude, Content, Phase angle
• The phase angle of harmonic active po wer is equiva lent to the harmonic vol tagecurrent phase difference.
• The scale of the vertica l ax is is a per c en ta ge of th e ra ng e of the se le ct ed amplit u de .
• This selection is the same as on the Harmonic List screen.
A gray bar may be displ ayed when phase an gle is selected , indicating that th e corresponding amplitude is very low (less than 0.01% f.s.) .
Highest Order
Display
Changes the highest order displayed
100th order, 50h order, 25th order
This selection is the same as on the Harmonic List screen.
Depending on the sync frequency used for measurement, the specified maximum
order may not be displayable.
See "Highest order analysis" (p. 152)
Vertical Axis
Display Type
Changes the vertical axis display type.
Linear Linear display
Log Logarithmic display (allows easier viewing of small values)
When the displa y content is ph ase angle, th e [Linear] setting i s fixed and cannot be
changed.
63
4.4 Viewing Harmonic Measurement Values
4
Chapter 4 Viewing Measurement Values
Page 72

64
Displayed
Item
Display
Contents
Highest
Displayed
Order
Displayed
Item
Changes item (physical quantity) to be displayed.
(Example) In the 3P4W wiring
U1, I1, P1, U2, I2, P2, U3, I3, P3, P123
Display
Contents
Changes the highest order displayed
Amplitude, content (%) and phase angle
• The phase angle of ha rmonic active pow er is equivalent to the harmonic voltagecurrent phase difference.
• This selection is the same as on the Harmonic Bar Graph screen.
Highest
Displayed
Order
Changes the highest order displayed
100th order, 50h order, 25th order
This selection is the same as on the Harmonic Bar Graph screen.
Depending on the sync frequency used for measurement, the specified maximum
order may not be displayable.
See "Highest order analysis" (p. 152)
4.4 Viewing Harmonic Measurement Values
4.4.2 Displaying the Harmonic List
The results of harmonic analysis of voltage, current and active power on the same channel can be
displayed as a list. Numerical data for the cursor-selected order is also displayed.
Press to display the Measurement screen.
Press to select the desired [CH] page, and press .
Changing Display Settings
See P.63 for the procedures to change the display settings.
Page 73

4.4 Viewing Harmonic Measurement Values
Vector Plot
Measurement Channel Measurement Data
Change vector display
magnification
• Voltage and current for all channels are displayed on one screen.
• Voltage-current phase angles are determined relative to the (0
°) standard of the fundamental
waveform used as the harmonic sync source.
• The phase angle of harmonic active power is equivalent to the harmonic voltage-current
phase difference of the same order on the same channel.
Changes the order.
Displays the vectors
for the selected order.
This selection is the same as on the Harmonic Bar
Graph screen.
Changes to the measurement va lu e s of th e
cursor order.
4.4.3 Displaying Harmonic Vectors
The voltage, curren t, and phase angle of ea ch harmonic order are displayed in a vect or plot showing the
phase relationship between voltage and current. Numerical values for the selected order are also displayed.
Press and then to select the [Vector] page.
65
4
Chapter 4 Viewing Measurement Values
Changing the Displayed Order
Page 74

66
Select the item (channel)
Enter
Selects from the pull-down
menu
Cancel
Displays the pull-down
menu
Measurement Channel
4.4 Viewing Harmonic Measurement Values
Changing Display Settings
Measurement
Channel
Change the channels to be displayed. Setting channels that are not used to
[OFF] can simplify the display.
ON Vector and numerical values are displayed
OFF Vector and numerical values are not displayed
Page 75

4.4 Viewing Harmonic Measurement Values
Display the
[Input] page
Select with the F keys
See About [Next].
"2.2 Basic Operations" (p. 16)
Select the item
• The same harmonic sync source is shared by all channels. Harmonic analysis cannot be performed correctly o n chan nels with in put fre quenc y different fr om the sele cte d harm onic sy nc
source.
• The harmonic sy nc source selected he re is also us ed as the s ync source f or waveform di splays.
• Correct analysis is not possible in the following situations:
1. If the sync source signal is very distorted
2. If the sync source signal frequency is below the lower limit of the valid range
3. If the sync source frequency is unstable
4.4.4 Selecting the Harmonic Sync Source
The [Harm sync src] has to be selected for harmonic analysis. Available se lections depend on the inp ut
source.
• Using a measurement voltage or current input as the sync source
U1 to U4, I1 to I4
The frequency of the measurement voltage or current waveform is sampled for harmonic analysis synchronization.
For all channels, the ( 0
form of the harmonic sync source.
°) reference point for all ph as e an gle me as ureme nts is the fun dam ental wa ve-
67
• Using the instrument's internal fixed clock as the sync source
DC50 ms, DC100 ms
Waveforms are sampled in synchronization with the 50 ms timing used by the instrument for data
update and for harmonic analysis. Use this source when no input is stable enough for synchronization.
When DC100 ms is selected, 50 Hz is mea sured as the fifth-orde r harmon ic, and 60 Hz as the sixthorder harmonic.
Using an external signal as the sync source
•
Ext
This setting is available only when a Model 9791 Motor Testing Option or 9793 Motor Testing and D/A
Output Option is i ns talle d an d CH B is set for pulse i nput. Waveforms are sampled in sy nc hronization
with the rising edges of the pulses input on CH B to perform harmonic analysis.
See"4.8.1 Motor Input Settings" (p. 84)
4
Chapter 4 Viewing Measurement Values
Page 76

68
Display the
[Input] page
Select with the F keys
What is THD?
THD is an abbreviatio n for total harm onic distor tion: the total amount of si gnal distor tion cause
by all harmonics.
Select the item
4.4 Viewing Harmonic Measurement Values
4.4.5 Selecting the THD Calculation Method
Select whether to use T HD-F o r THD-R m etho d to calculated total harmon ic di st or tio n. Th e s el ec ted ca lculation method is applicable to both harmonic voltage and current.
THD-F The percentage of total harmonics relative to the fundamental waveform
THD-R
The percentage of total ha rmo nic s relati ve t o the sum of t he tot al ha rmo nic s and the fundamental waveform
Page 77

4.5 Viewing Waveform s
Display the
[Wave + Noise]
page
Select [U/I]
(Current/Voltage)
Displays four overlapping voltage waveforms
Displays four ove rlap ping current wavefo rms
Negative Peak Value (pk-)
Positive Peak Value (pk+)
Waveform color ap pears when enabled (O N).
Waveform Display Enable/Disable (p. 70)
RMS (rms)
Select [CH]
(Separate Channel)
RMS (rms)
Waveform Display Enable/Disable (p. 70)
Negative Peak
Value (pk-)
Positive Peak
Value (pk+)
Voltage Scale
(Positive-only display)
Current Scale
(Negative-only display)
Waveform color appears when enabled
(ON).
4.5 Viewing Waveforms
4.5.1 Displaying Waveforms
Waveforms of voltage and current meas ur ed on up to four ch ann els ca n be di s pla ye d separately according to voltage, current, or channel.
Waveforms are sampled at 500 kS/s, with the displayed time span per screen determined by the timing of
the harmonic sync source.
The waveform span displayed on one screen is determined by the [Time scale] setting.
Displaying Voltage and Current Waveforms Separately
69
4
Chapter 4 Viewing Measurement Values
Displaying Separate Channel Waveforms
Page 78

70
• Waveforms and numerical me asurement values displayed at th e right are not sync hronized
with measurement timing.
• Displayed waveform values are not the calculated RMS and peak numerical values.
• The vertical axis of the waveform is displayed as a percentage of the full-scale range of each
channel, so the amplitudes of different channels are not directly comparable.
• To display waveforms startin g from zero amplitude , see "Zer o-Crossi ng Filter Se tting Proc edure" (p. 48).
• The waveform and noise display cannot be updated by pressing the HOLD key when the unit
is under HOLD condition.
Selects from the
pull-down menu
Displays the pull-down
menu
Select the channel to
change
Enter Cancel
4.5 Viewing Waveforms
Hiding and Displaying Waveforms
Select whether to display or not display waveforms.
Available settings are [U/I] and [CH].
ON Display waveforms
OFF Do not display waveforms
Page 79

4.5 Viewing Waveform s
1
1
2
Press or
2
Selects from the
pull-down menu
Displays the pulldown menu
Enter
Cancel
Select the de si re d ma gn if ication from 1/4× to 100×
Select U (voltage)
or I (current)
for resizing
Selects from the
pull-down menu
See Chart in below.
Displays the pull-down
menu
Select [Time scale]
Enter Cancel
• The waveform sampling rate is fixed at 500 kS/s.
• Available timebase selections depend on the selected number of noise analysis points, as follows.
Selected No. of
Points
Timebase Selections
1000 0.2 ms/div 0.4 ms/div 1 ms/div 2 ms/div 4 ms/div 10 ms/div
5000 1 ms/div 2 ms/div 5 ms/div 10 ms/div 20 ms/div 50 ms/div
10000 2 ms/div 4 ms/div 10 ms/div 20 ms/div 40 ms/div 100 ms/div
50000 10 ms/div 20 ms/div 50 ms/div 100 ms/div 200 ms/div 500 ms/div
4.5.2 Resizing Waveforms
Waveforms can be reduced and enlarged for convenient viewing, and to confirm details. Make this setting
using the cursor keys on the [Wave + Noise] page.
See "4.5.1 Displaying Waveforms" (p. 69)
Changing Vertical Axis Magnification
Voltage and current waveforms can be vertically resized (magnification is the same for all channels).
71
4
Chapter 4 Viewing Measurement Values
Changing Horizontal Axis Magnification (Timebase)
Page 80

72
Select [Noise]
Display the
[Wave + Noise] page
Noise Voltage Graph
Noise Current Graph
Noise Voltage Numerical Value
Noise Current Numerical Value
Select [Wave + Noise]
Display the
[Wave + Noise] page
Voltage and Current Waveforms
Voltage and Current Noise Graphs
Noise Voltage Numerical Value
Waveform Colors
Voltage Yellow
Current Red
Noise Current Numerical Value
The waveform and noise display cannot be updated by pressing the HOLD key when the unit is
under HOLD condition.
4.6 Viewing Noise Measurement Values (FFT Function)
4.6 Viewing Noise Measurement Values
(FFT Function)
Perform FFT analysis on a selected channel's voltage and current to display noise up to 100 kHz as a
graph and as numerical values. This fun cti on is c on ve nie nt for m oni tor ing an inverter's carrier freq uen cy,
harmonic noise ingress on commercial power lines, or DC power.
The numerical noise values can be saved to storage media.
See "7.6 Saving Waveform Data" (p. 114)
4.6.1 Displaying Noise Voltage and Current
Noise voltage and current can be displayed in separate graphs along with numerical values.
Numerical noise volta ge and curre nt values at te n frequencie s are displayed i n order of decreasing am plitude.
Horizontal Axis Linear frequency scale
Vertical Axis Logarithmic noise amplitude scale
Displaying Noise
Displaying Waveforms and Noise
The waveform to be analyzed and it's noise analysis results can be displayed at the same time.
Page 81

4.6 Viewing Noise Measurement Values (FFT Function)
Select the item
Display the
[Calc] page
Select with the F keys
See Screen display proced ure:"Displaying
Noise" (p. 72)
Select the item
Enter
Selects from the pull-do wn
menu
Cancel
Displays the pull-down
menu
4.6.2 Setting the Sampling Frequency and Points
Set the FFT sampling rate and number of points according to the frequency of the noise to be analyzed.
These settings are on the [Calc] page of the Setting screen.
73
4
Chapter 4 Viewing Measurement Values
Sampling can be selected at the [Noise] setting on the [Wave + Noise] page of the Measurement screen.
See How to display: "Displaying Noise" (p. 72)
Changing Sampling on the Measurement Screen
Page 82

74
Sampling Rate
Points
• The instrument‘s internal anti-aliasing filter is set automatically according to the sampling setting, so that aliasing effects are suppressed even at slow sampling rates.
• Changing the sam pling rate does no t affect power measurem ents or the measurement frequency range of harmonic measurements.
• Noise analysis di splay updating is not l inked to other measuremen t data such as power or
harmonics.
Data saving is not synchronized with saving of power or harmonic data.
• The number of points determines the amount of time required for analysis, so larger numbers
of points result in slower update times. Updating 1,000 points takes approximatel y 400 ms,
5,000 points approxim ately 1 s, 10 ,000 points approx imate ly 2 s, an d 50,000 points appr oximately 15 s.
• To analyze noise frequency d etails, sel ect fast sampli ng or a large n umber of points (e .g., to
analyze the difference between 50 and 60 Hz, select a frequency resolution of 10 Hz or less).
• The sampling rate setting is linked to the waveform timebase display setting.
See Screen display proc ed ure:"4.6.1 Display in g N o is e
Voltage and Current" (p. 72)
Select the numerical
value
Enter
Select [Lowest Noise]
Enter Cancel
4.6 Viewing Noise Measurement Values (FFT Function)
The highest frequency that can be analyzed depends on the sampling setting as follows.
Sampling Rate 500 kS/s 250 kS/s 100 kS/s 50 kS/s 25 kS/s 10 kS/s
Highest Frequency 100 kHz 50 kHz 20 kHz 10 kHz 5 kHz 2 kHz
Also, the frequency resoluti on of noi se anal ysis depen ds on the sampl ing rate s etting an d the numb er of
points.
500 kS/s 250 kS/s 100 kS/s 50 kS/s 25 kS/s 10 kS/s
1000 500 Hz 250 Hz 100 Hz 50 Hz 25 Hz 10 Hz
5000 100 Hz 50 Hz 20 Hz 10 Hz 5 Hz 2 Hz
10000 50 Hz 25 Hz 10 Hz 5 Hz 2.5 Hz 1 Hz
50000 10 Hz 5 Hz 2 Hz 1 Hz 0.5 Hz 0.2 Hz
4.6.3 Setting the Minimum Noise Frequency
Set the minimum acquisition frequency for numerical noise values according to the noise frequency to be
analyzed. The lower limit can be set from 0 Hz to 10 kHz in 1-kHz steps. The setting applies to both
[Noise] and [Wave + Noise]. Make this setting on the [Calc] page of the Setting screen.
Setting on the Measurement Screen
Page 83

4.6 Viewing Noise Measurement Values (FFT Function)
Select the item
Display the
[Calc] page
Select with the F keys
Minimum Noise FrequencyFrequency
Level
The range of availabl e settings for the minimum n oise frequency dep ends on the noise sampling rate setting.
Noise Sampling Rate 500 kS/s 250 kS/s 100 kS/s 50 kS/s 25 kS/s 10 kS/s
Minimum Noise
Frequency
0 to 10 kHz 0 to 9 kHz 0 to 4 kHz 0 to 1 kHz
Settings on the Setting Screen
75
4
Chapter 4 Viewing Measurement Values
A numerical noise value is recognized as a peak value when its amplitude is greater than the levels of the
next lower- and higher-frequency points in voltage and current FFT calculation results, and the ten highest peak values are acquired.
In this case, frequencies below the set minimum noise frequency are ignored.
Page 84

76
Select with the F keys
Display the [Calc] page
Select [Analysis CH] or
[Window type]
What is a Window type?
Noise analysis is performed by applying FFT calculations to a specific interval of a waveform
defined by the specified number of points at the specified sampling rate. The processing of an
extracted interval of a waveform is called "Window processing." The FFT calculation of the
specified waveform interval is supposed to be repeated periodically.
On this instrument, the displayed waveform is shown with the defined window.
When the number of points specified for FFT calculation does not coincide with the measurement waveform period , the edges of the waveform within the wind ow become discontinuous
(called "leakage errors"), and non-existent noise is detected.
The Window type provide means of suppressing leakage errors by smoothly connecting the
edges of the waveforms.
Original Time Waveform
Supposed Waveform for FFT
Time Waveform
Set No. of Points
Set No. of PointsTime Waveform
4.6 Viewing Noise Measurement Values (FFT Function)
4.6.4 Measurement Channel and Window Function Settings
Select the measurement channels and Window function for noise analysis calculations.
Measurement Ch Select the measurement channel for noise analysis calculations.
Window type Select a Window type.
CH1, CH2, CH3, CH4
Rectangular
Hann
Flat-Top
This type of window function is effective when the measurement waveform period is an integer multiple of the FFT calculation interval.
This type of window functi on is effective whe n the rectangular w indow is
not, and when frequency resolution is the primary concern.
This type of window functi on is effective whe n the rectangular w indow is
not, and when amplitude resolution is the primary concern.
Page 85

4.7 Viewing Efficiency and Loss Measurement Values
• Motor power (Pm) measurem ent requires the Mo del 9791 Motor Testing Option or the 9793
Motor Testing & D/A Output Option.
• Measurement values may be scattered when measuring severely fluctuating or transient
loads.
• On wiring systems with different power ranges, calcul ations use the data from the highest
power range.
• On wiring system with different sync sources, calculations use the most recent data at calculation time.
Press and then to select the [Efficiency] page.
Efficiency
Loss
• The display range for Efficiency (η [%]) is 0.00% to 200.00%.
• The display range for Loss [W] is 0 to
±120% of the power range.
4.7 Viewing Efficiency and Loss Measurement Values
This instrument uses active power and motor power values to calculate and display efficiency (η [%]) and
loss [W]. For examp le, inverter in put-output efficienc y and internal loss, and motor input-output efficient
and loss, as well as total efficiency , can be calculated by a single instrument.
77
4
Chapter 4 Viewing Measurement Values
4.7.1 Displaying Efficiency and Loss
Page 86

78
Display the
[Calc] page
Select the item
Select with the
F keys
[Pm] can be selected when the Model 9791 or 9793 Motor Testing Option is installed, and with
the following settings.
CH A units mN• m, N• m, kN• m
CH B units r/min
4.7 Viewing Efficiency and Loss Measurement Values
4.7.2 Selecting the Calculation Formula
Up to three formulas (η1 to η3, and Loss1 to Loss3) can be selected for Efficien cy (η) and Loss calculations. Select the calculation items from all Pin and Pout active power values to be applied to the following
formulas.
η = 100 × |Pout|/|Pin|
Loss = |Pin| - |Pout|
Page 87

4.7 Viewing Efficiency and Loss Measurement Values
Required items:
• L9438-50 Voltage Cord(2)
• 9272-10 Clamp On Sensor(1)......input side
• 9277 Universal Clamp On CT (1).output side
input side output side
Switching
Power Supply
Wiring Mode 1
[1P2W] × 4 systems
Set Pin1 to P1,
and Pout1 to P2
Calculation Formula
η1 = 100 × |P2|/|P1|
Loss1 = |P1| - |P2|
4.7.3 Measurement Examples
Here is an efficiency and loss measurement example.
Before measuring, perform the preparations in "Chapter 3 Measurement Preparations" (p. 23)), and
make the appropriate connections and settings.
Measuring Efficiency and Loss of a Switching Power Supply
Example. The inpu t and out put sides of the switching power sup ply are c onnected to CH 1 and CH 2 of
the instrument, respectiv el y.
Connection Example
79
4
Chapter 4 Viewing Measurement Values
Wiring Mode Setting
Calculation Formula Setting
Page 88

80
Required items:
• L9438-50 Voltage Cord(2)
• 9272-10 Clamp On Sensor(1).......input side
• 9278 Clamp On Sensor (2)...........output side
input side
output side
Inverter
Wiring Mode 3
[3P3W2M] + [1P2W] × 2 systems
Set Pin1 to P3,
and Pout1 to P12
Calculation Formula
η1 = 100 × |P12|/|P3|
Loss1 = |P3| - |P12|
4.7 Viewing Efficiency and Loss Measurement Values
Measuring Efficiency and Loss of an Inverter
Example. Inverter in put is connected to CH 3, and the outputs are connected to CH 1 and CH 2 of the
instrument.
Connection Example
Wiring Mode Setting
Calculation Formula Setting
Page 89

4.7 Viewing Efficiency and Loss Measurement Values
Required items:(Requires Model 9791 Motor Testing Option or 9793 Motor Testing & D/A Output Option)
• L9438-50 Voltage Cord(4)
• 9272-10 Clamp On Sensor(2)........input side
• 9709 AC/DC Current Sensor (2)....output side
• Tachometer(1)......With pulse output capability
• Torque Meter(1)
• L9217 Connection Cord(2)
input side
output side
Inverter
Motor
Tachometer
Torque
Meter
Model 9791 or 9793
Wiring Mode 6
[3P3W2M] × 2 systems
Set Pin1 to P12,
and Pout1 to P34
Calculation Formula
Inverter η1 = 100 × |P34|/|P12|, Loss1 = |P12| - |P34|
Motor η2 = 100 × |Pm|/|P34|, Loss2 = |P34| - |Pm|
Total η3 = 100 × |Pm|/|P12|, Loss3 = |P12| - |Pm|
Set Pin2 to P34,
and Pout2 to Pm
Set Pin3 to P12,
and Pout3 to Pm
The torque meter and tachometer should have the fastest possible output response time.
Measuring Efficiency and Loss of an Inverter and Motor
Example. Inverter inputs are con nected to CH 1 and CH 2, inverter outputs to CH 3 and CH 4 of the
instrument, analog outpu t from the tachometer to rotation signa l input CH B, and analo g output from the
torque meter to torque signal input CH A.
See How to connect torque meter or tachometer: 8.5 ( p.138)
Connection Example
81
4
Chapter 4 Viewing Measurement Values
Wiring Mode Setting
Calculation Formula Setting
Page 90

82
Torque
Rotation Rate
Motor Power
Slip
Press and then to select the [Motor] page.
Motor Sync Source Setting CH A Range Setting CH B Range Setting
• When [CH A] m easurement units are set to [V] and [Hz], or [CH B] units are set to other
than [r/min], motor power [Pm] display is always disabled (“OFF”).
• When [CH B] measurement units are set to [V], slip cannot be calculated, and
[- - - - - -] is
displayed.
4.8 Viewing Motor Measurement Values (With Hioki 9791 or 9793 installed)
4.8 Viewing Motor Measurement Values
(With Hioki 9791 or 9793 installed)
Motor analysis i s avai la ble when the M odel 9791 Motor Testing Option or 9793 Motor Testing & D/A Output Option (afterwards called the motor analysis function) is installed.
When the motor analysis function is installed, the [Motor] page appears on the Measurement and Setting
screens.
The motor analys is fu nction ac quir es sign als from rotat ion-sen sing devices such as a tor que sens or an d
rotary encoder and measures motor analysis items (torque, rotation rate, motor power and slip).
Motor efficiency, total efficiency and loss can be calcul ated when combined with the"4.7 Viewing Efficiency and Loss Measurement Values" (p. 77) functions.
Setting the Motor Sync Source
See Motor measurements can be displayed simultaneously with motor input voltage and current, power measure-
ments and motor efficiency. "Selecting Measured Items for Display" (p. 38)
Page 91

83
Select
(a confirmation dialog box appears)
Enter Cancel
Display the
[Motor] page
• This particular ze ro adjustment function applies only to the motor analysis opti ons, so the
other input channels (CH 1 to CH 4) are unaffected. To execute zero adjustment on those channels, see section "3.10 Attaching to the Lines to be Measured and Zero Adjustment" (p. 34).
• Zero adjustment is only applicable to analog DC input channels.
• The maximum zero adjustment span is ±10% of the full-scale range, outside of which no
adjustment occurs.
4.8 Viewing Motor Measurement Values (With Hioki 9791 or 9793 installed)
Executing Zero Adjustment
Execute zero adjustment to compensate for input signal bias before measuring analog DC voltage on CH
A or CH B.
If a non-zero value is displayed for torque or rotation rate when no torque or rotation is occurring, execute
zero adjustment before applying any torque or rotation input.
4
Chapter 4 Viewing Measurement Values
Page 92

84
Display the [Motor]
page
Select with the F keys
Torque input setting
Revolution signal input setting
Motor Sync Source Low-Pass Filter Input Frequency Source
Select the item
• All motor analysis items depend on the same sync source.
• When measurin g motor efficienc y in combin ation with th e functions of section "4.7 Viewing
Efficiency and Loss Measurement V alues" (p. 77), select the same sync source as that of the
motor voltage and current input channels. Optimum measurement accuracy is possible when
the calculation periods are the same.
• [Ext] is only selectable when CH B is set for pulse input.
• The LPF setting is the same for CH A and CH B. Independent setting is not available.
• When CH A is set for frequency input and CH B is set for pulse input, the LPF setting has no
effect.
4.8 Viewing Motor Measurement Values (With Hioki 9791 or 9793 installed)
4.8.1 Motor Input Settings
Set to suit the motor to be measured, or the connected torque sensor or tachometer.
See "8.5 Using the Motor Testing Option (when specified before factory shipping, for motor analysis)" (p. 138)
Basic Operating Procedure
Selecting the Motor Sync Source
Select the source o f the signal that dete rmin es the pe riod to serve as the ba sis fo r motor an alys is calc ulations. Motor analysis items are measured according to the period of the source selected here.
U1, U4, I1, I4, DC50 ms (Default setting), DC100 ms, Ext
See "4.2.3 Selecting the Sync Source" (p. 47)
The selected motor sync source is displayed as [Sync] on the Motor screen.
Low-Pass Filter (LPF) Settings
When CH A or CH B is set for Analog DC input, enable the filter to suppress harmonic noise.
Measurements should no rmally be made with the filter disabled (OFF), bu t it should be enabled (ON)
when measurement values are destabilized by the effects of external electrical noise.
ON, OFF (Default setting)
Page 93

4.8 Viewing Motor Measurement Values (With Hioki 9791 or 9793 installed)
Input Frequency - CH B Display Value
Input Frequency
2 × 60 × Input Frequency - CH B Display Value× Set No. of Poles
2 × 60 ×Input Frequency
• To calculate slip, set CH B to suit the rotation input signal.
• As the input frequency, select the most stable signal from the voltage and current supplied to
the motor.
CHA range 10 V
CHA scaling 50
CHA unit N•m
CHA range Select to suit the output voltage of the torque sensor.
1 V Range, 5 V Range, 10 V Range,
The CH A ran ge can be selec ted with the vol tage range keys f rom the Motor page of
the Measurement screen.
Selecting the Input Frequency Reference Source
To calculate motor slip, select a reference source for measuring the motor input frequency.
f1, f2, f3, f4
See "4.2.4 Frequency Measurement Settings" (p. 49)
Slip Calculation Formula
CH B Measurement Units Calculati on Formula
When [Hz]
100 ×
85
When [r/min]
100 ×
Setting Torque Input (CH A)
Select the type of input signal from the torque sensor connected to CH A.
CHA input
AnalogDC When the sensor outputs a DC voltage proportional to the torque
Freq When the sensor outputs a frequency proportional to the torque
Available setting items depend on the state of the following settings.
When [AnalogDC] is selected
When [CHA input] is set to [AnalogDC], set these three items to suit the sensor: [CHA range], [CHA scaling], and [CHA unit].
Example. When the rated torque is 500N
• m and the torque sensor’s output range is ±10 V.
4
Chapter 4 Viewing Measurement Values
Page 94

86
CHA scaling Settable from 0.01 to 9999.99.
The measurement value displayed for CH A = CH A input voltage × CH A scaling value.
Set [CHA unit] according to the torque va lue that corresponds to one volt of torque
sensor output.
(Scaling value = max. rated torque of sensor
÷ output scale voltage value)
In this example, the scaling value is 50.
(50 = 500 N
• m ÷ 10)
+1, -1 10 V
Digit←, Digit→ 50
CHA unit Set to suit the torque sensor.
V Select to display raw input voltage.
mN• m Select this for torque sensors rated at 1 mN• m to 999 mN• m per volt output.
N• m Select this for torque sensors rated at 1 N• m to 999 N• m per volt output.
kN• m Select this for torque sensors rated at 1 kN• m to 999 kN• m per volt output.
When CH A units are set to [V], motor power [Pm] is not displayed.
CHA unit N• m
Rated torque 500
Freq range fc 60 kHz
Freq range fd 20 kHz
CHA unit kN• m
Rated torque 2
Freq range fc 10 kHz
Freq range fd 5 kHz
4.8 Viewing Motor Measurement Values (With Hioki 9791 or 9793 installed)
When [Freq] is selected
When [CHA input] is set to [Freq], make these four settings to suit the sensor: [CHA unit], [Rated torque],
[Freq range fc], and [Freq range fd].
Example 1. Using a torque sensor rated at 500
Example 2. Using a torque sensor rated at 2 k
output, and maximum negative rated torque providing 5 kHz output
N• m for an output span of 60 kHz ±20 kHz
N• m, with maximum positive rated torque providing 15 kHz
Page 95

87
CHA unit Set to suit the connected torque sensor.
Rated torque Enter an integer from 1 to 99 9. Set the maxi mum r ated torqu e of the torqu e sensor in
the corresponding CH A units.
Freq range fc
Freq range fd
Set a value between 1 kHz to 100 kHz in 1 kHz steps.
Set fc to the center frequency corresponding to zero torque, and set fd to the frequency corresponding to maximum rated torque.
Hz, mN• m, N• m, kN• m
• When CH A units are set to [Hz], motor power [Pm] is not displayed.
• Select fc+fd for frequ encies bel ow 100 kHz, and fc -fd for frequ encies above 1 kHz.
Setting beyond the numerical value limits is not possible.
CHB range Select to suit the applied rotation signal voltage input.
CHB scaling Settable from 0.01 to 9999.99 . The measurement value display ed for CH B = CH B
input voltage
× CH B scaling value. Set [CH B Units] according to the rotation rate that
corresponds to one volt of rotation signal.
CHB unit Always select r/min when measuring motor power (Pm).
1 V, 5 V, 10 V
V, Hz, r/min
• The CH B range can be selected with the current range keys from the Motor page of
the Measurement screen.
• Set the number of motor poles when measuring the slip.(p. 88)
4.8 Viewing Motor Measurement Values (With Hioki 9791 or 9793 installed)
4
Setting the Rotation Signal Input (CH B)
Select the type of rotation signal to be applied to CH B
CHB input
Analog DC For DC voltage proportional to the rotation rate
Pulse For pulse signals proportional to the rotation rate
Available setting items depend on the state of the following settings.
When [Analog DC] is selected
When [CHB input] is set to [AnalogDC], set these three items to suit the rotation signal: [CHB range],
[CHB scaling], and [CHB unit].
Chapter 4 Viewing Measurement Values
Page 96

88
CHB unit Always select [r/min] when measuring motor power (Pm).
Hz, r/min
The measurement range when CH B units are set to Hz is 0.5 Hz to 5 kHz.
Measurement values are calculated as
When the pulse signal inp ut frequenc y is highe r than the me asureme nt range , set the
appropriate pulse count .
No. of Poles×Pulse Input Frequency
2 ×Pulse Count Setting
Max frequency Determine the full-scale measurement value for CH B.
(When CH B is set for D/A Output, this setting is the full-scale value.)
100 Hz, 500 Hz , 1 kHz, 5 kHz
Pulse Count Set the number of pulses per mechanical rotation, from 1 to 60,000.
Available setting values are multiples of half the number of motor poles.
(For a incremental type rotary encoder that provides 1000 pulses per rotation, set to 1000.)
+1/2 the number of motor poles,
-1/2 the number of motor poles
Increment or decrement by 1/2 the number
of motor poles.
+1/2 × 10 times the number of motor poles,
-1/2
× 10 times the number of motor poles
Increment or decre me nt by 1 /2 × 10 times
the number of motor poles.
+1/2 × 100 times the number of motor poles,
-1/2
× 100 times the number of motor poles
Increment or decrement by 1/2 × 100 times
the number of motor poles.
No. of Motor
Poles
Set the number of motor poles as an even number between 2 and 98.
(The slip calcula tion and the rotation signal in put as the frequency corresp onding to
the mechanical rotation angle are converted to the frequency corresponding to the
electrical angle.)
+2, -2 Increment or decrement by 2.
+10, -10 Increment or decre me nt by 10.
• The motor pole setting is enabled by pressing (Set). Be sure to press (Set)
after changing the setting.
• When using pulse synchronization with an electrical angle (motor input voltage, or the same
frequency as the current frequency), se t the number of motor p oles at CH B inpu t to 2.
CHZ Make CH Z settings.
Enable (set to ON) to use the original rotation angle (usually called the Z phase) signal
to reset pulse division to zero.
ON Use CH Z.
OFF Ignore CH Z (no connection to CH Z jack)
4.8 Viewing Motor Measurement Values (With Hioki 9791 or 9793 installed)
When [Pulses] is selected
When [CHB input] is set to [Pulses], make these five settings to suit the rotation signal: [CHB unit],
[Max frequency], [No. of pulses], [Motor poles], and [CHZ ].
Page 97

4.8 Viewing Motor Measurement Values (With Hioki 9791 or 9793 installed)
Single Pulses Multiple Pulses
Fundamental Frequency(U1)
Calculation Range
Calculation Range
Fundamental Frequency(U1)
External Sync Signal
External Sync Signal
Reference
Reference Reference Reference
Phase difference
• Harmonic analy sis by synchronization with the r otation signal input pulse requir es that the
pulse count be an integer multiple of the input frequency. For example, a 4-pole motor
requires a pulse cou nt that is an integ er mult iple of two , and a 6-pol e motor require s a puls e
count that is an integer multiple of three.
• When a motor with wye internal wiring is measured as a 3P3W3M wiring system, the voltage
and current phase angles can be measured using the
Δ-Y conversion function.
4.8.2 Measuring Motor Electrical Angle
If the [Harm sync src] is set to [Ext] when pulses are input to CH B fo r the rotation sig nal, voltage and
current phase shift based on the pulses can be seen.
Measuring Electrical Angle with Multiple Pulses
• Use o f the o riginal sign al (Z pha se) is recommen ded. The origin al (CH Z) signal s erves as a r eference
pulse for consistent phase measu rements.
• When multiple pulses a re used as the ro tation signal i nput witho ut the or iginal (CH Z) sign al, the refe rence pulse is dete rmined upon syn chronizat ion, so u pon res ynchron ization afte r sync un lock occ urs, a
different pulse may become the reference standar d.
89
4
Chapter 4 Viewing Measurement Values
Page 98

90
• Phase zero adjus tment is available only when CH B is se t for pulse input and [Harm sync
src] is set to [Ext]. Otherwise, performing this key operation has no effect.
• When harmonic synchronization is unlocked, this key operation has no effect.
• Press and then to clear the correcti on value.
1. Without providing current to a motor, rotate it from the load side whil e me as uring the v ol tage indu ce d
at its input terminals.
2. Perform phase zero adjustment.
(Zero out any phase difference between the fundamental wavefo rm of the induced voltage input as
U1 and the pulse signal.)
3. Without providing current to a motor, rotate it from the load side whil e me as uring the v ol tage indu ce d
at its input terminals.
Apply current to rotate the motor.
(The voltage-current pha se angle measured by the instrum ent is the electrical angle based on th e
induced voltage phase.)
Phase difference is affected by t he rotation input signal pul se waveform and the instr ument’s
internal circuit delay, which cause measurement errors when mea suring fr equenc ies muc h different from that at which phase zero adjustment was performed.
4.8 Viewing Motor Measurement Values (With Hioki 9791 or 9793 installed)
Phase Zero Adjustment (PHASE ADJ)
Press and then to correct (zero) any phase difference betwee n the rotation si gna l inp ut pu ls e
and U1 fundamental content.
Electrical Angle Measurement Example
Page 99

5.1 Timing Control Functions
Before starting integration and saving using timing control functions
•
Before using automatic saving or integration, ensure that the real-time clock is correctly set (p. 101).
• The timing control cannot be set to CF card saving and integration independently.
• Integration is always active, so when a timing contr ol functi on is active, appears on the display.
When timing control has stoppe d, press to reset integratio n and clear the indicator.
• Even when a timing con trol f unct ion is en abl ed, yo u m ust p ress to begin operation .
About interval timing control
• If the timer or clock contr o l is not a c tive, int egra tio n a ut omatica lly st ops at 9999 hours, 59 minut es, an d
59 seconds. In this case, press to reset the integr ation value and rest art integ ration .
• Interval timing is not ava ilable when the interv al time set ting i s longer than t he time r or clo ck (sta rt/sto p)
settings.
• When the ending time of the timer or clock settings is different from the ending time of the last interval,
the timer or clock setting has priority.
• When changing the interval set ting, the num ber of reco rdable da ta items (p. 112) also changes (longer
intervals allow more dat a items to be recor ded).
About timer timing control
• When clock control settings define a time span longer than the timer setting, integration starts at the
specified clock start time, and stops when the timer setting has elapsed (any clock control stop time is
ignored).
• During integration and be fore the timer stops, pres sing interrupts in tegration but retains the
integration value. In this case, pressing again resumes integration until the timer stops
("additional integration").
About clock timing control
• When clock control is enabled for a time span longer than the timer setting, integration begins at the
specified clock start time, and stops when the timer setting has elapsed (any clock control stop time is
ignored).
• When the set time has elapsed, real-ti me control is consi dered disab led [OFF].
• When integration is interrupted duri ng the clock contro l period, clock con trol is disable d [OFF].
See the graph in "4.3.4 Integration Combined with Timing Control" (p. 59) for integration operations.
Operating
Functions Chapter 5
5.1 Timing Control Functions
Three types of timing controls are available: interval, count-down timer, and real-time clock settings. Timing control can be applied to CF card saving and integration operations.
See"4.3 Integration Value Observation" (p. 53), "7.5.2 Auto-Saving Measurement Data" (p. 110)
Interval timing control Controls repeating operations at a specific interval.
91
Timer timing control
Real-time clock timing
control
Controls operation for a specific count-down time. Combine with interval timing to
specify the duration of interval timing operation.
Controls operation between specific real-time start and stop times. Combined with
interval timing to specify when interval timing operation begins and ends.
5
Chapter 5 Operating Functions
Page 100

92
Interval control setting
Timer control setting
Clock control settings
1
Use F keys to set.
Select the
item
5.1 Timing Control Functions
Setting Method
Press and the keys to display the [Time] page.
Interval (The interval setting is also available on the [Interface] page.)
Timer mode/
Real time
Timer setting
Start time
Stop time
Time↑/ Time↓
OFF Inter val time control is disabled.
ON Timer control / clock control is enabled.
OFF Timer control / clock control is disabled.
Set the count-down timer. Settable range is 10 s to 9999 h 59 m 59 s.
+1↑/ -1↓ Increments/decrements by 1.
+10↑/ -10↓ Increments/decrements by 10.
Digit←/ Digit→ Moves to the [hour] digits.
Set start and stop times for clock timing. Select the year and the 24- hour time
(e.g., 16 December, 2009 10:16 PM → [2009/12/06 22:16])
+1↑/ -1↓ Increments/decrements by 1.
+10↑/ -10↓ Increments/decrements by 10.
Select an interval time from 50, 100, 200, or 500 ms; or 1, 5,
10, 15, or 30 s; or 1, 5, 10, 15, 30, or 60 min.
 Loading...