

Page 1

Instruction Manual
3145-20
NOISE HiLOGGER
Contains explanation and
instructions regarding the
3145-20 NOISE HiLOGGER’s
operating method and functions.
April 2013 Revised edition 5 3145A981-05 13-04H
Page 2

Page 3

Contents
Contents
i
Introduction.................................................................................1
Verifying Package Contents.......................................................2
Safety Information .................................. ... ... ..............................3
Operating Precautions................................................................5
Chapter 1 Overview__________________________ 7
1.1 Product Overview .........................................................7
1.2 Features ....................................................................... 8
1.3 Measuring Principle ......................................................9
1.3.1 Monitor Measuring and Logging Measuring ...........10
1.3.2 Merits of the Measurement Method of this
Instrument ...............................................................1 1
1.4 Names and Functions of Parts ...................................12
1.5 Display Screen ...........................................................16
1.5.1 Screen Layout .........................................................16
1.5.2 Logging Screen .......................................................17
1.5.3 Monitor Screen .......................................................20
1.5.4 Icon Summary .........................................................22
1.5.5 Submenus ...............................................................24
Chapter 2 Measurement Preparations _____25
2.1 Attaching the Strap .....................................................26
2.2 Install the Ferrite Cores ..............................................27
2.3 Connecting the AC Adapter .......................................28
2.4 Supplying Power with the Battery Pack .....................29
2.4.1 Installing the Battery Pack ......................................29
2.4.2 Charging the Battery Pack ......................................30
2.4.3 Battery Pack Life .....................................................32
2.5 Connect the CLAMP ON NOISE SENSOR ................33
2.6 Turning the Power On and Off ...................................36
2.7 Using the PC Card .....................................................37
2.7.1 Inserting the PC card ..............................................37
2.7.2 PC Card Initialization ..............................................38
2.8 Pre-Operation Inspection ......... ..................................40
1
2
3
4
5
6
7
8
9
A
Index
Page 4

ii
Contents
Chapter 3 Measurement____________________ 41
3.1 The Measurement Process ....................................... 42
3.2 Check the Current Input (Monitor Measurement) ...... 43
3.3 Record Changes Over Time (Logging Measurement) 45
3.4 "O.F." Display and "U.F." Display .............................. 50
Chapter 4 Useful Functions ________________ 51
4.1 View the Latest Logging Measurement Value or
Peak Value ................................................... ... ... ....... 52
4.2 Check Using a Bar Graph (Monitor Measurement) ... 52
4.3 View Past Waveforms (Scroll Function) .................... 53
4.3.1 Scrolling the Waveform ..........................................53
4.3.2 Auto Scrolling .........................................................54
4.4 A/B Cursor Measurement .......................................... 55
4.5 Using the Alarm Function .......................................... 56
4.5.1 Settings on the Logging Screen or the
Monitor Screen. ......................................................56
4.5.2 Setting on the Set Up Screen .................................59
4.5.3 Take the Alarm Reference Value (Monitor Screen) 65
4.6 Adding Event Marks to Waveforms ........................... 66
4.6.1 How to Add an Event Mark .....................................66
4.6.2 Searching Event Marks ..........................................67
4.7 Highlighting a Specific Band ...................................... 68
4.8 Preventing Malfunctions (Key Lock) ........... .. ... ... .. ..... 69
4.9 Saving the Display Screen to PC Card
(Screen Capture) 70
Chapter 5
Setting the Measurement Conditions ______ 71
5.1 Inputting Comments ..................................... ... .......... 72
5.1.1 Comment Input Method Details ..............................73
5.2 Setting the Input Type ............................................... 74
5.3 Setting the Range ..... ............................... ... ............... 75
5.4 Setting the Recording Interval ................................... 76
5.5 Setting the Recording Time ....................................... 77
5.6 Setting the Waveform Color ...................................... 79
Page 5

Chapter 6 Saving and Reading Data________81
6.1 Saving Data during Measurement ............ ... .. .............82
6.1.1 Select "3145 Form" .................................................82
6.1.2 Filenames ............................................................... 83
6.1.3 Save Mode ..............................................................84
6.1.4 Specify the File Save Target ...................................89
6.2 Planning to Save Text after Measurement .................90
6.3 Saving Data after Measurement .............................. ..91
6.4 Saving Settings Data ..................................................94
6.5 Reading Measurement and Settings Data .................97
6.6 File Operation .............................................................99
6.6.1 Moving between Folders .......................................100
6.6.2 Deleting Files and Folders ....................................101
6.6.3 Creating Folders ...................................................102
6.6.4 Changing File Names and Folder Names .............104
6.6.5 Changing the File Order .......................................105
6.7 Calculation Method for “3145 Form” Files ................106
6.8 Content Format for Text Format Files ......................107
Chapter 7 System Screen_________________ 109
iii
Contents
1
2
3
4
5
6
7.1 Env (Environment) Screen .................................... ...110
7.1.1 Start Key Receive Condition
(Malfunction Prevention) 110
7.1.2 Start Backup After Power Loss .............................111
7.1.3 Grid Type ..............................................................112
7.1.4 Time Format when Saving Text ............................11 3
7.1.5 External Trigger Input (Event Marker) ..................114
7.1.6 External Trigger Filter ...........................................115
7.1.7 Copy Key Function (Monitor) ................................116
7.1.8 Save Color ............................................................117
7.1.9 Backlight Saver .....................................................118
7.1.10Backlight Brightness .............................................119
7.1.11Screen Color Scheme ...........................................120
7.1.12Display Language .................................................121
7.2 Setting Screen ..........................................................122
7.2.1 Saving Settings .....................................................122
7.2.2 Loading Setting Conditions ...................................124
7.2.3 Deleting Setting Conditions ..................................125
7.2.4 Automatically Loading ...........................................126
7
8
9
A
Index
Page 6

iv
Contents
7.2.5 Auto Setup ............................................................126
7.3 Init (Initialization) Screen ......................................... 127
7.3.1 Setting the Clock ..................................................127
7.3.2 Erasing Logging Measurement Data ....................128
7.3.3 System Reset .......................................................129
7.3.4 Self-check .............................................................130
Chapter 8 Using the CD ___________________131
8.1 CD Contents ............................................................ 131
8.2 Installing the Software ............................................. 132
8.3 Running the Software ............ .................................. 133
8.4 Deleting the Application (Uninstall) ..................... .. ... 134
8.5 Opening the Instruction Manual (PDF Format) ........ 135
Chapter 9 Specifications __________________137
9.1 General Specifications ............................................. 137
9.2 Input Area Specifications .. .. ..................................... 140
9.3 Accuracy ........................ .......................... ................ 142
9.4 Function Specifications ............................ ................ 143
9.5 Application Software Specifications ......................... 146
Chapter 10 Maintenance and Service_____147
10.1 Troubleshooting ....................................................... 148
10.1.1Before Returning for Repair ..................................148
10.1.2System Reset .......................................................149
10.2 Warning Messages .................................................. 150
10.3 Cleaning .................................................................. 152
10.4 Replacing the Backup Battery ............... .. ... .. ... ... ..... 153
10.5 Removing the Battery Before Discarding the
Instrument 154
Appendix____________________________________ A1
Appendix 1 The Carrying Case ......................................................A1
Appendix 2 Trigger Terminals ........................................................A2
Appendix 2.1EXT TRIG Terminal .............................................A2
Appendix 2.2TRIG OUT Terminal .............................................A5
Appendix 3 Glossary of Terms.......................................................A7
Page 7

Introduction
Thank you for purchasing the HIOKI "Model 3145-20 NOISE HiLOGGER." To obtain maximum performance from the instrument, please
read this manual first, and keep it handy for future reference.
The following instruction manuals are included with the 3145-20 NOISE
HiLOGGER. Refer to them as they pertain to your usage of the instrument.
Manuals Contents
Measurement Guide
1
1
Introduction
Read first.
Offers an introduction to the 314520's basic measuring method for first
time users.
Instruction Manual
2
(this manual)
CD
"DATA VIEWER for
3145"
3
Instruction Manual
"Communications"
4
Instruction Manual
"Communication
Commands"
5
Instruction Manual
Use the optional Clamp on Noise Sensor for measuring current. Read
uction manual included with the Clamp on Noise Sensor and fol-
the instr
low all safety precautions.
User's License The "DATA VIEWER for 3145" software is included with the instrument.
Th
is software requires a license agreement. Please use it only after
reading and accepting the license agreement at the back of the book.
Registered
Trademarks
Windows, Microsoft Excel, and MS-DOS are registered trademarks of
Microsoft Corporation in the United States and/or other countries.
Contains explanation and instructions
rding the instrument's operating
rega
method and functions.
Contents
Contains information about PC soft-
ware which can analyze the measurement data recorded by the
instrument.
Explains the communication functions
which can be used via the LAN and
RS-232C interfaces.
Explains the commands for remote
control of the instrument via the LAN
and RS-232C interfaces.
Page 8
2
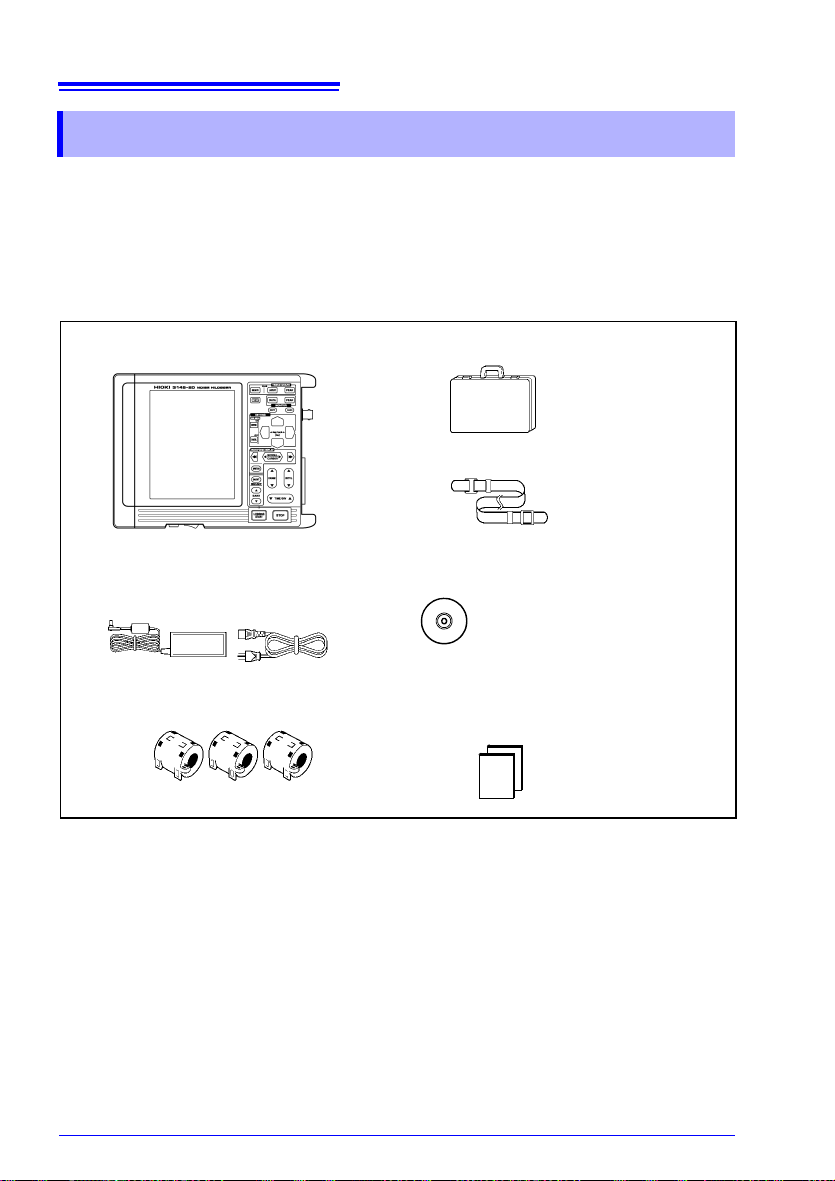
Carrying case........................................1
Strap......................................................1
CD (Software, Instruction Manuals)
...................................................................1
Instruction Manual (this manual)/
Measurement Guide ..................each one
• "DATA VIEWER for 3145"
Software and Instruction Manual
• "Communications”
Instruction Manual
• "Communication Commands"
Instruction Manual
Model 3145-20 NOISE HiLOGGER ......1
Accessories
Model 9418-15 AC ADAPTER..............1
Ferrite cores........................................ ..3
Verifying Package Contents
Verifying Package Contents
• When you receive the instrument, inspect it carefully to ensure that no damage occurred
during shipping. In particular, check the accessories, panel switches, and connectors. If
damage is evident, or if it fails to operate according to the specifications, contact your
dealer or Hioki representative.
• Use the original packing materials when transporting the instrument, if possible.
Please check to make sure that no items are missing from your package.
Options Model 9754 CLAMP ON NOISE SENSOR
Model 9418-15 AC ADAPTER
Model 9447 BATTERY PACK (7.2 V, 2400 mAh)
Model 9643 CHARGE STAND (For the 9447 BATTERY PACK)
Model 9612 RS-232C CABLE
(9-pin mini DIN to 9-pin Dsub, cross cable, for PC)
Model 9721 RS-232C CABLE
(9-pin mini DIN to 9-pin Dsub, straight cable, for modem)
Model 9726 PC CARD 128M
Model 9727 PC CARD 256M
Model 9728 PC CARD 512M
Model 9729 PC CARD 1G
Model 9642 LAN CABLE
Page 9
Safety Information
3
Safety Information
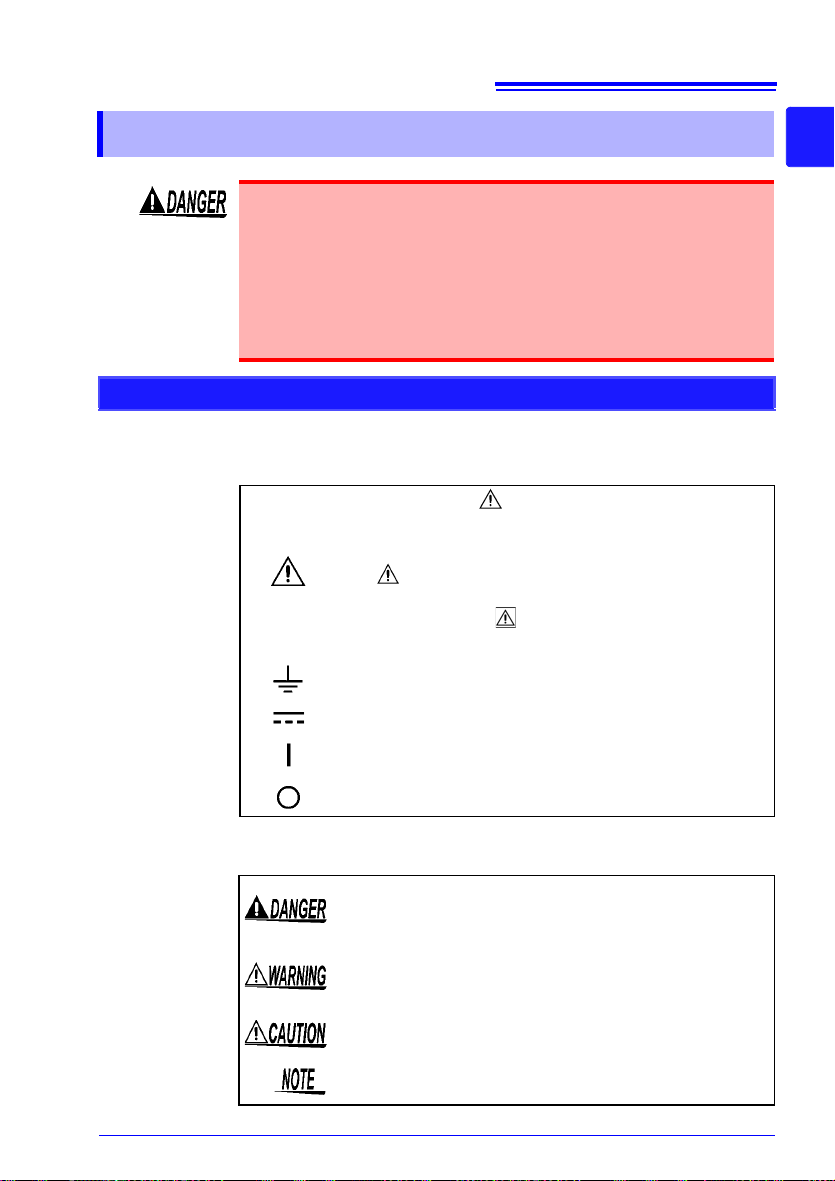
Notation
Symbols
Safety
This instrument is designed to comply with IEC 61010 Safety Standards, and has been thoroughly te
ment. However, mishandling during use
death, as well as damage to the instrument. Using the instrument
in a way not described in this manual may negate the provided
safety features.
Be certain that you understand the instruc
the manual before use. We disclaim any responsibility for accidents or injuries not resulting directly from instrument defects.
This manual contains information and warnings essential for safe operation of the instrument and for maintaining it in safe operating condition.
using it, be sure to carefully read the following safety precautions.
Before
In the manual, the symbol indicates particularly important information that the user should read before using
the in
strument.
The symbol printed on the instrument indicates that
the user should refer to a corresponding topic in the man-
ual (marked with the symbol) before using the relevant
function.
Indicates a grounding terminal.
Indicates DC (Direct Current).
Indicates the ON side of the power switch.
sted for safety prior to ship-
could result in injury or
tions and precautions in
Indicates the OFF side of the power switch.
The following symbols in this manual indicate the relative importance of
ns and warnings.
cautio
Indicates that incorrect operation presents an extreme
haza
rd that could result in serious injury or death to the
user.
Indicates that incorrect operation presents a significant
haza
rd that could result in serious injury or death to the
user.
Indicates that incorrect operation presents a possibility of
injur
y to the user or damage to the instrument.
Indicates advisory items related to performance or correct
oper
ation of the instrument.
Page 10

4
Safety Information
Others
Indicates a prohibited action.
p
Indicates the location of reference information.
Indicates quick references for operation and remedies for
oubleshooting.
tr
Indicates that descriptive information is provided below.
*
Accuracy We define measurement tolerances in terms of rdg. (reading) valu e, with
the follo
wing meanings:
rdg. (reading or displayed value)
The value currently being measured and indicated on the measuring
instrument.
Measurement categories
To ensure safe operation of measurement instrument, IEC 61010 establishes safety standards for various electrical environments, categorized as CAT II to CAT IV, and called measurement categories.
CAT II
CAT III
CAT IV
Using a measurement instrument in an envi-
onment designated with a higher-numbered
r
category than that for which the instrument is
rated could result in a severe accident, and
must be carefully avoided.
Use of a measurement instrument that is not
CAT-rated in CAT II to CAT IV measurement
applications could result in a severe accident,
and must be carefully avoided.
Primary electrical circuits in equipment connected to an AC electrical
outlet by a power cord (portable tools, household appliances, etc.)
CAT II covers directly measuring electrical outlet receptacles.
Primary electrical circuits of heavy equipment (fixed installations) connected directly to the distribution panel
panel to outlets.
The circuit from the service drop to the service entrance, and to the power
meter and primary overcurrent protection instrument (distribution panel).
, and feeders from the distribution
Page 11
5
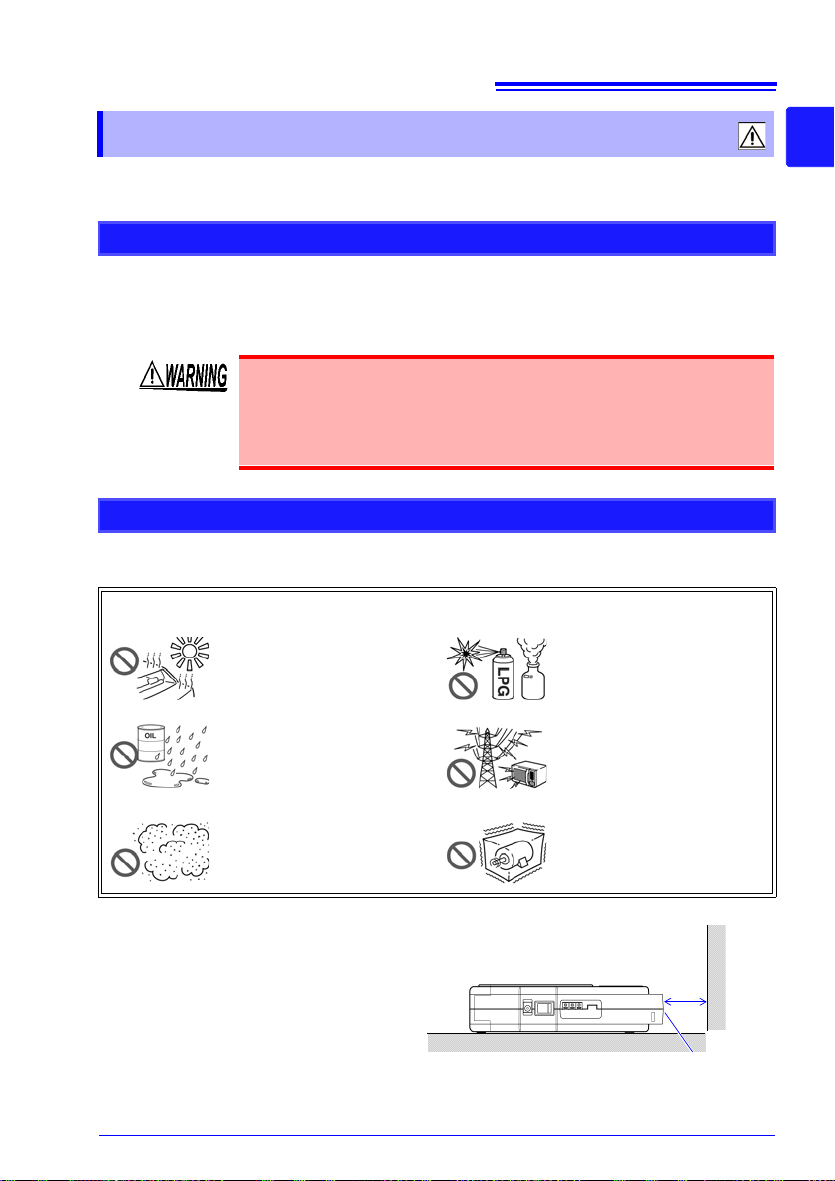
Installing the instrument
• Vents must not be obstructed.
• The instrument should be operated
only with the bottom side downwards.
• Do not place on an unstable stand or
on an incline.
10 cm or more
Ventilation holes
Operating Precautions
Operating Precautions
Follow these precautions to ensure safe operation and to obtain the full benefits of the various functions.
Preliminary checks
Before using the instrument the first time, verify that it operates normally to ensure that the
n
o damage occurred during storage or shipping. If you find any damage, contact your
dealer or Hioki representative.
Before using the instrument, make sure that the insulation on the
test leads is undamaged and that no bare conductors are improperly exposed. Using the instrument i
cause an electric shock, so contact your dealer or Hioki representative for repair.
Installing the instrument
Operating temperature & humidity: 0 to 40°C (32 to 104°F), 80%RH or less (non-condensating)
Operating temperature & humidity for guaranteed accuracy: 23
Avoid the following locations that could cause an accident or damage to the instrument.
n such conditions could
± 5°C (73 ± 9°F), 80%RH or less
Exposed to direct sunlight
Exposed to high temperature
Exposed to liquids
Exposed to high humidity
or
condensation
Exposed to high levels of
p
articulate dust
In the presence of corrosive or explosive gases
Exposed to strong electromagnetic fields
Near electromagnetic radiators
Subject to vibration
Page 12

6
Operating Precautions
Handling the instrument
To avoid electric shock, do not remove the instrument's case. The
internal components of the instrument carry high voltages and
may become very hot during operation.
To avoid damage to the instrument, protect it from physical shock when
transporting and handling. Be especially careful to avoid physical shock
from dropping.
To avoid problems with battery operation, remove the batteries from the
instrument if it is to be stored for a long time.
Handling the CD
• Always hold the disc by the edges, so as not to make fingerprints on
the disc or scratch the printing.
• Never touch the recorded side of the disc. Do not place the disc
directly on anything hard.
• Do not wet the disc with volatile alcohol or water, as there is a possibility of the label printing disappearing.
• To write on the disc label surface, use a spirit-based felt pen. Do not
use a ball-point pen or hard-tipped pen, because there is a danger of
scratching the surface and corrupting the data. Do not use adhesive
labels.
• Do not expose the disc directly to the sun's rays, or keep it in conditions of high temperature or humidity, as there is a danger of warping,
with co
• To remove dirt, dust, or fingerprints from the disc, wipe with a dry
cloth, or use a CD cleaner. Always wipe radially from the inside to the
outside, and do no wipe with circular movements. Never use abrasives or solvent cleaners.
• Hioki shall not be held liable for any problems with a computer system
tha
t arises from the use of this CD, or for any problem related to the
purchase of a Hioki product.
nsequent loss of data.
Page 13
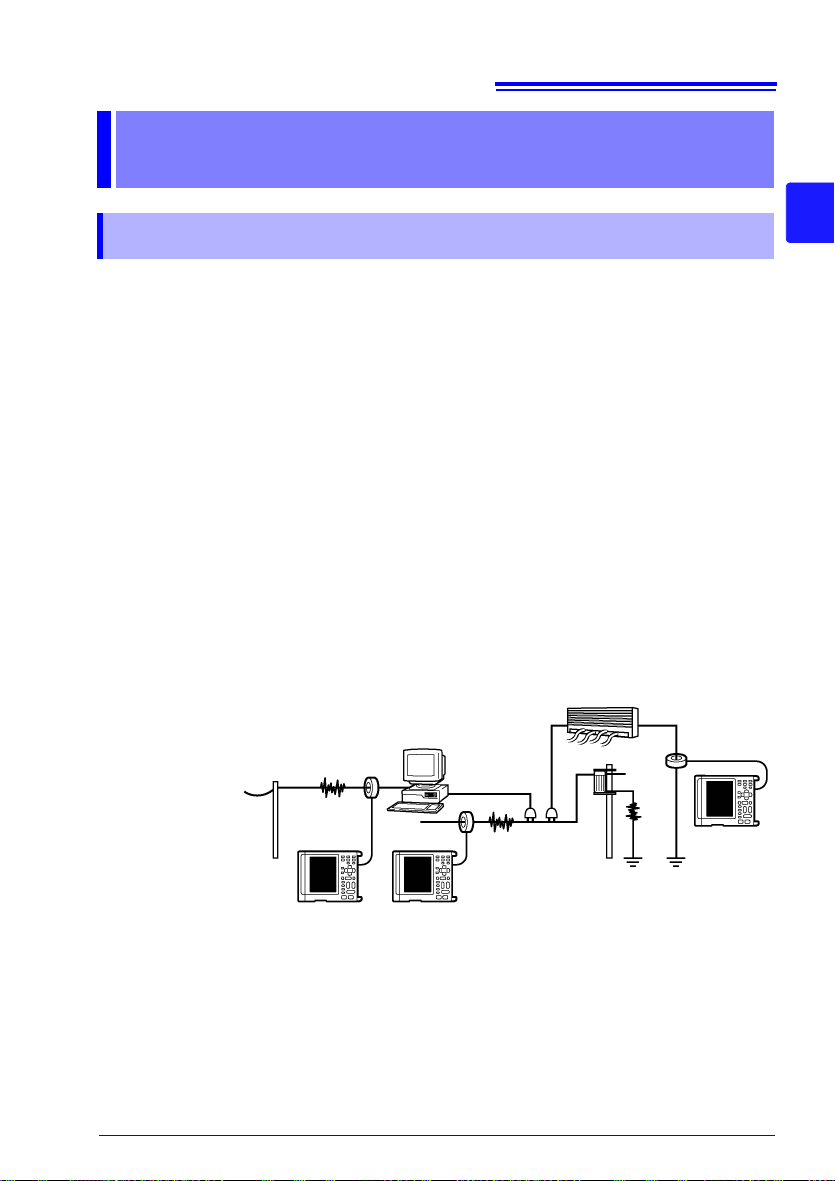
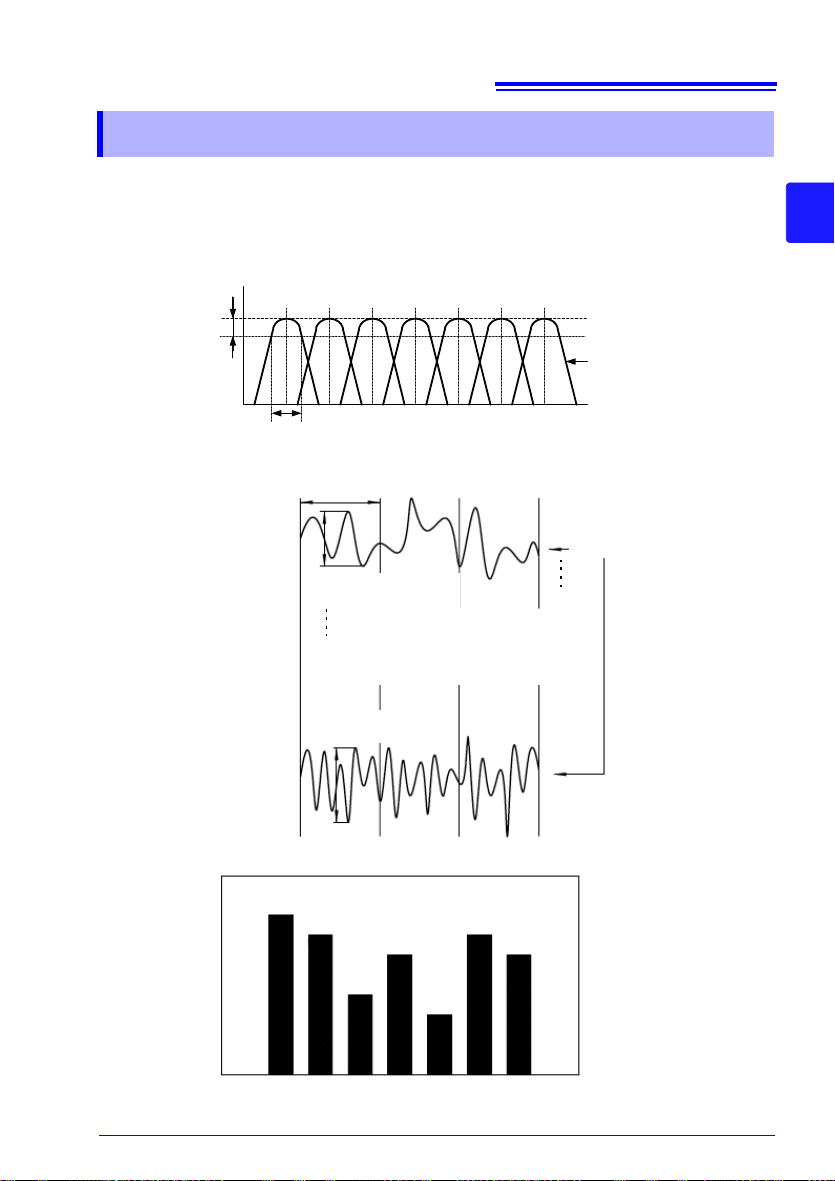
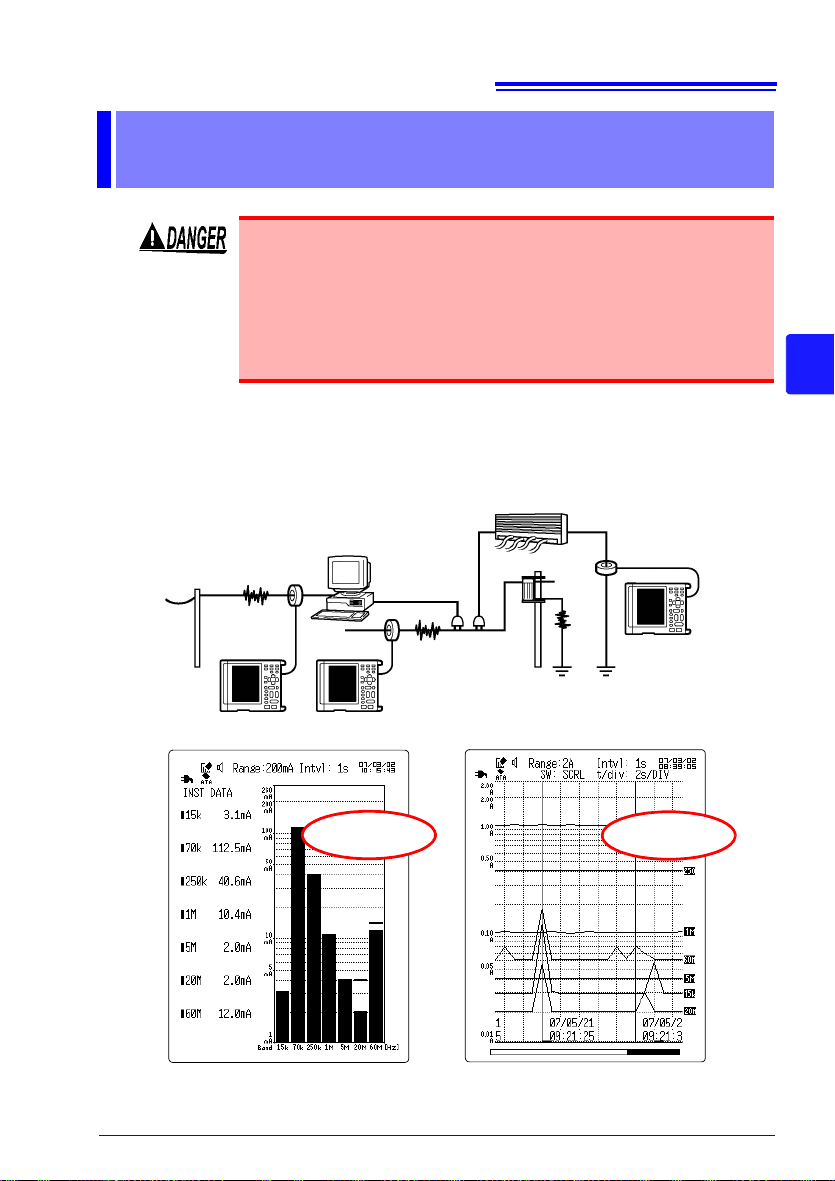
1.1 Product Overview
Communication
lines
Electrical
lines
Ground
lines
Overview Chapter 1
7
1.1 Product Overview
The 3145-20 NOISE HiLOGGER is the ideal measuring instrument for
measuring current on lines which can easily become channels for noise
penetration, such as communication lines, electric power cords and
ground lines which connect to electronic equipment.
By clamping with the 9754 CLAMP ON NOISE SENSOR the 3145-20
detects noise without touching the sample. Therefore it can perform
measurements on instruments in their normal operational state, without
worry of communication malfunction due to probe contact, or electrical
shock or electrical short circuit accidents from electrical lines. Furthermore, it can reliably detect sudden surges which may occur unexpectedly, such as thunder surges and open-close surges.
With the use of the logging function, long term or cyclic noise level fluctuations can be understood. Recorded data is shown on the instrument's
color LCD display as a chronological graph. Additionally, transferring
data to a PC and checking the chronological graph can be done using
the "DATA VIEWER for 3145" software on the included CD. This can be
useful for examining noise counter-measures after an occurance of
noise interference.
1
Chapter 1 Overview
Page 14

8
1.2 Features
1.2 Features
Simple and safe measurements
With the use of the optional Clamp on Noise Sensor, noise can be measured on
power cords, various communications lines, and ground lines without making contact or grounding.
Wide frequency range (5 kHz - 100 MHz)
The instrument is effective for detecting switching regulator noise, inverter noise,
electrostatic discharge noise, and FM broadcast wave noise.
Surge detection
The instrument detects lightning surges, power-related switching surges, and
electrostatic discharge noise.
Logging measurement function
Long-term and cyclic noise levels can be ascertained, and the times at which the
noise and interference occured can be investigated.
Alarm function and event mark function
An alarm level for alarm output can be set, and event marking can be enacted at
the time an event occurs.
Remote measuring with an HTTP server
Remote control of the instrument's settings, data acquisition and data display can
be performed using a web-based browser such as IE.
A portable, dedicated noise measurement instrument intended for onsite use
The instrument supports two types of power sources, recharchable batteries
designed for on-site use, and an AC adaptor power supply for long period observation and remote measuring. The recharchable battery can also be used as a
backup in case of power failure.
Page 15
-3dB
Q=fo/B=1
15kHz 70kHz 250kHz 1MHz 5MHz 20MHz 60MHz
-40dB/dec
Center frequency f
0
Attenuation property
Frequency
Band width B
Amplification
15kHz
70kHz
250kHz
1MHz
60MHz20MHz
5MHz
f0 = 15 kHz
f
1
= 70 kHz
f
2
= 250 kHz
f
3
= 1 MHz
f
4
= 5 MHz
f
5
= 20 MHz
f
6
= 60 MHz
Sampling time
Measurement
values at each
band
Measures and displays Peak to Peak
values during sampling time at each
PBF.
Peak to Peak value
within sampling time
Peak to Peak value
within sampling time
9
1.3 Measuring Princi ple
1.3 Measuring Principle
The instrument separates input noise waves into frequency bandwidths using a seven
band-pass filter (7 frequency waves) and detects and displays peak values (Peak to Peak
values) for each respective frequency range.
1
Chapter 1 Overview
Page 16

10
The current input levels of each frequency are displayed
as a bar graph and numbers.
Noise measurement can be made easily in the tester interval.
With the logging measurement function the change over
time of the noise level of each frequency band is recorded. When and at what frequency band
noise penetrated can be easily ascertained. The time that
the interference occured and the type of noise that occured at that time can be understood.
The peak value within the manually set recording interval
segment is saved in the internal memory and displayed in
a chronological bar graph. The recording interval can be
set between 1 second and 60 seconds.
Measurement data can be saved on PC card.
Daily and weekly changes in the noise can be observed using the "DATA VIEWER for 3145" software on the included CD to conduct daily and
weekly calculation displays of the recorded data.
1.3 Measuring Principle
1.3.1 Monitor Measuring and Logging Measuring
This instrument has two measuring modes, monitor and logging.
Monitor measurement
Logging measurement
Page 17

1.3 Measuring Princi ple
Electrostatic discharge
Electric railway induction
Flourescent light
Motor for power
Arc-welding machine
Medium wave radio
Lightning surge
Switching
Neon sign
Elevator
The 3145-20 possible
measurement range
1G
100M
10M
1M
100k
10k
1k
The cause of the noise
Frequency (Hz)
Cellular phone
Television
Personal wireless radio
Banned CB wireless radio
Amateur radio
FM broadcast
Short wave radio
Inverter
Electric power induction
1.3.2 Merits of the Measurement Method of this
Instrument
11
Simultaneous noise measurement of each frequency bandwidth from 10 kHz
to 100 MHz.
Noise exists in a wide bandwidth and its frequency differs depending on
its cause. With this instrument a wide bandwidth of noise can be
checked all at once.
Peak-detection function for capturing surge events
Surge incidents of noise such as lightning surges and electrostatic discharge noise sometimes occur. Using the instrument's peak function,
incidents of surge noise can be accurately captured.
1
Chapter 1 Overview
Page 18
12
Display ( p. 16)
Front Panel
Key operations
1.4 Names and Functions of Parts
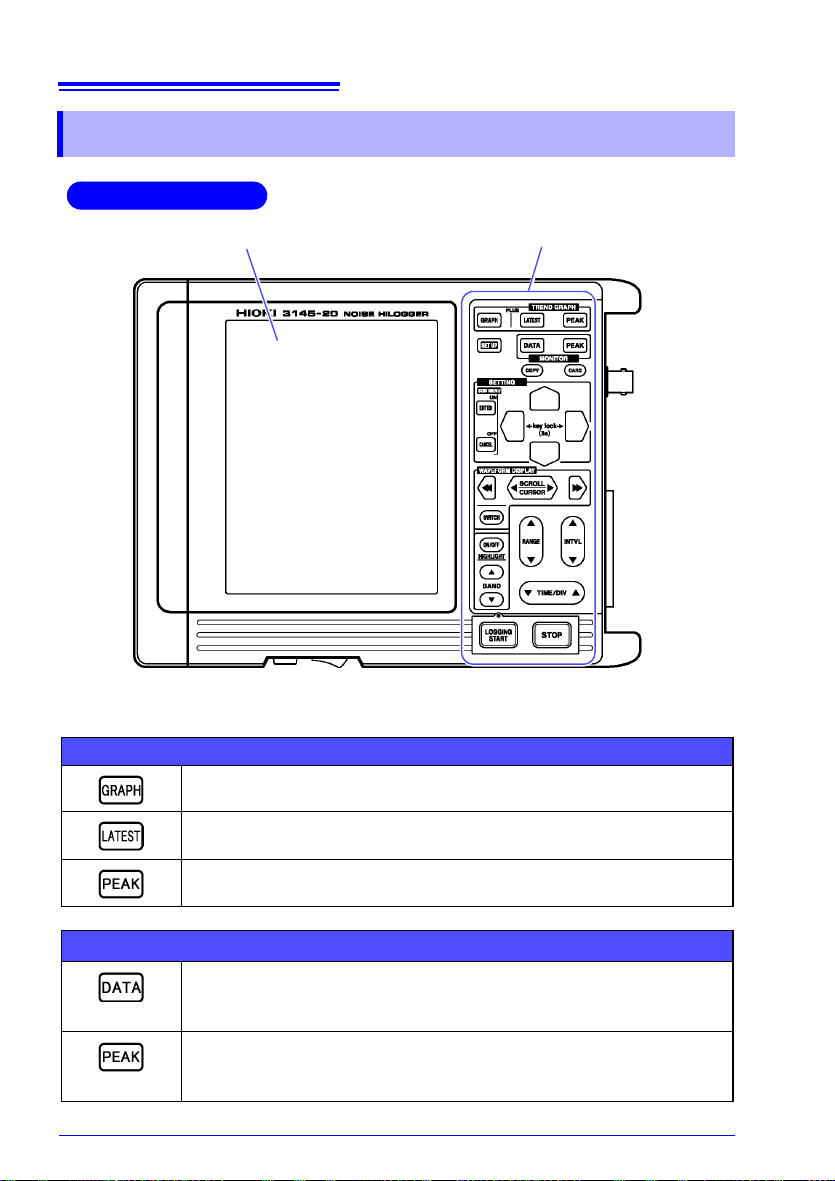
1.4 Names and Functions of Parts
Key operations
Logging (time series graph)
Monitor (level meter)
Displays the waveforms on the full screen.
Displays the latest value on the left side, and the waveforms on the right
side of the screen.
Displays the peak value on the left side, and the waveforms on the right
side of the screen.
Displays the instantaneous values as a bar graph.
Displays the instantaneous values on the left side, and a bar graph on the
right side of the screen.
Displays the peak values as a bar graph.
Displays the peak values on the left side, and the bar graph on the right
side of the screen.
Page 19
Key operations (continued)
Displays the Set up screen (the screen for setting the measurement conditions).
Saves an image of the display screen to a PC card.
Takes the alarm reference value from the measurement value.
Displays the PC card screen. Performs loading and saving of measurement
and other data.
Displays the settings contents summary. Turns off the settings contents display.
Cancels the item selected with the cursor.
Moves the cursor up, down, left and right.
Scrolls the waveform. Moves the A/B cursor.
Switches between waveform scroll and A/B cursor movement.
Highlights and displays a particular waveform during logging measurement.
Selects the band to highlight.
13
1.4 Names and Functions of Parts
1
Chapter 1 Overview
Sets the range.
When the input category is current sensor: selects between 200 mA, 2 A
and 20 A.
When the input category is voltage: selects between 10 mV, 100 mV and
1 V.
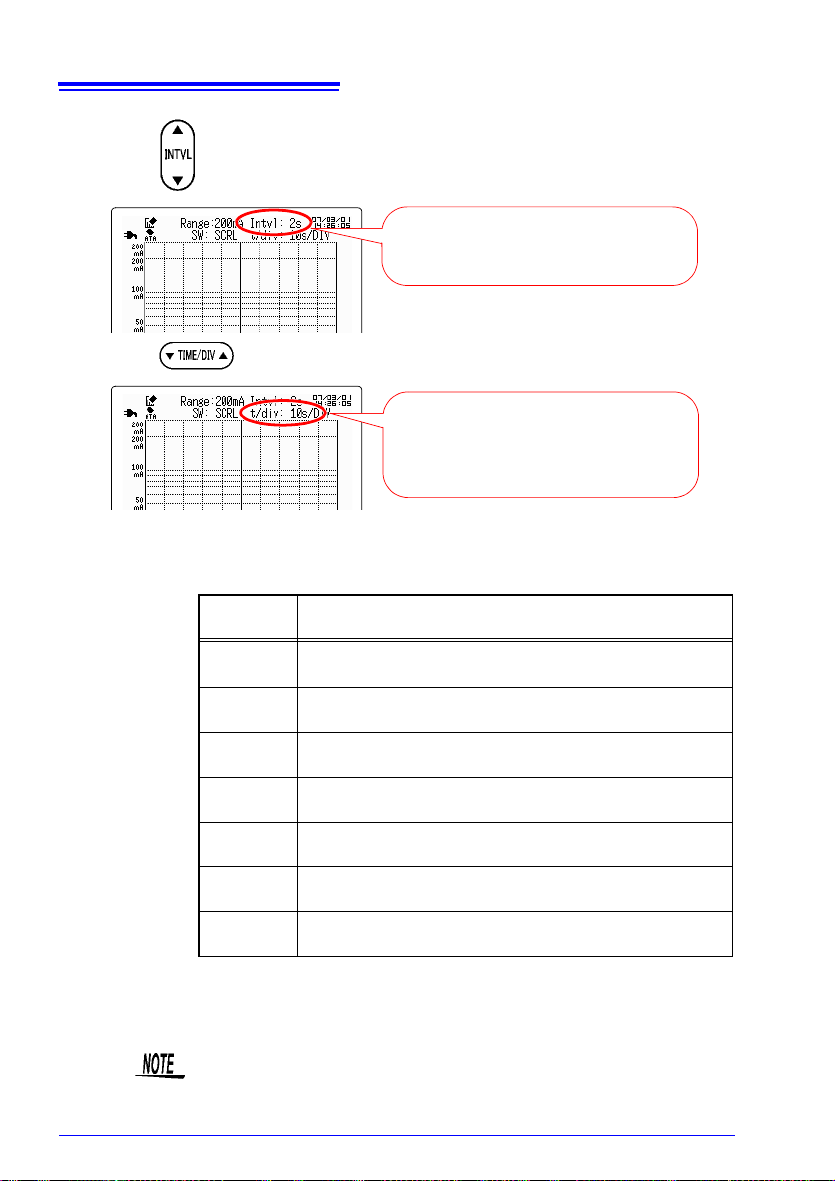
The possible measurement range differs depending on the selected range.
Sets the interval for taking data.
Select 1s, 2s, 5s,10s, 20s, 30s or 60s to suit the object to be measured.
Shortening the recording interval causes the maximum recording time to be
decreased.
Sets the logging measurement time axis (horizontal axis).
Select 2s, 5s, 10s, 20s, 30s, 1min, 2min, 5min, 10min, 20min, 30min, 1h,
2h, 5h,10h, 12h or 1d.
The time axis indicates the time of 1 mass in the horizontal axis direction.
Commences logging measurement. Adds an event marker if pressed during measurement.
(regarding the key LED display)
Green light : Performing logging measurement; backlight OFF
Flashing green light : Performing settings; backlight OFF
Red light : Performing battery charge with the power turned off.
Press twice to stop logging measurement.
Page 20
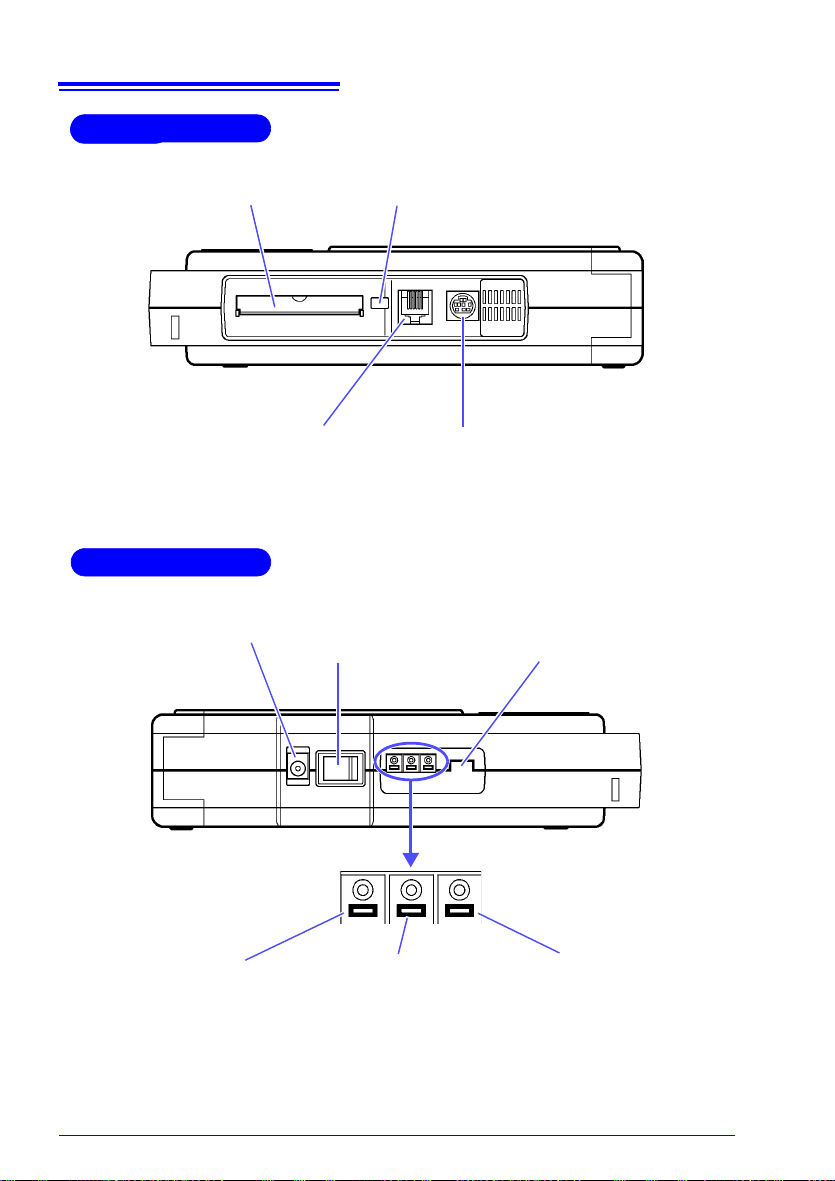
14
Eject button
Ejects the PC card.
PC card slot
10BASE-T Ethernet connection port
Connects with a 9642 LAN CABLE.
RS-232C port
Connects with the 9612 RS-232C CABLE
(cross cable for PC use) or the 9721 RS-232C
CABLE (straight cable for modem use).
è„ ñþ
Upper Panel
Lower Panel
AC adaptor input connector
Power switch
(POWER)
Contrast adjustment control
(CONTRAST)
EXT TRIG terminal
(external trigger)
Used for entering event markers during logging measurement. (
p. A2)
TRIG OUT terminal
(trigger output)
Outputs a signal during
warning. (
p. A5)
GND terminal
Used in combination with the
trigger terminals
1.4 Names and Functions of Parts
Page 21
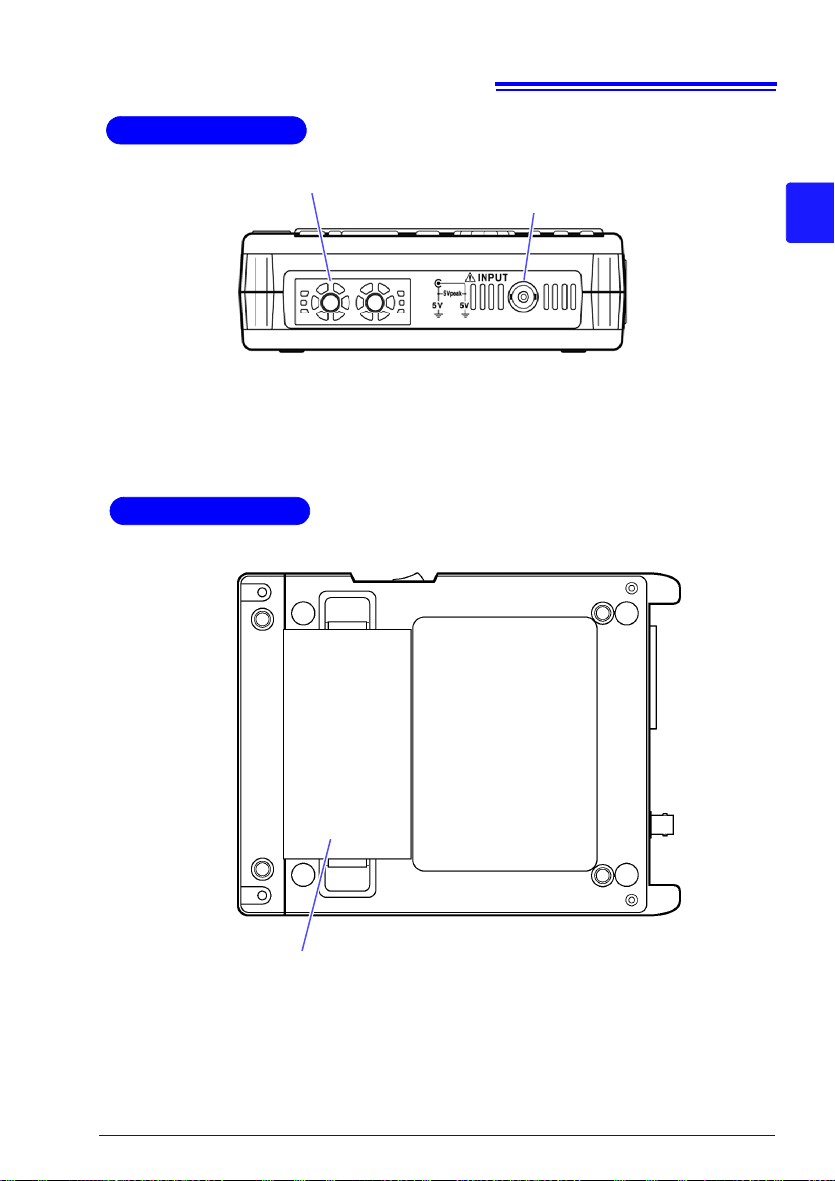
15
Right Panel
Input terminal
Connects with the Clamp on Noise Sensor.
Ventilation holes
Bottom Panel
Battery box
For installing the 9447 BATTERY PACK
1.4 Names and Functions of Parts
1
Chapter 1 Overview
Page 22
16
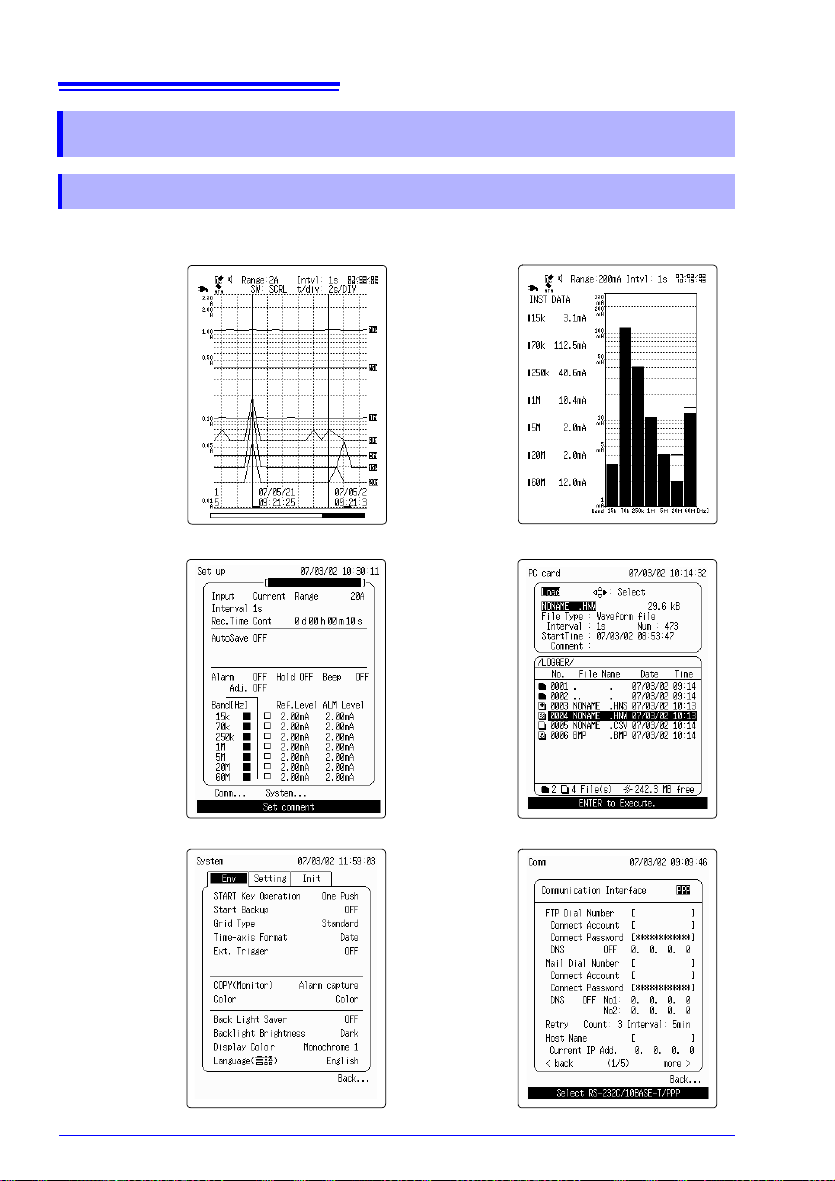
Logging
Screen
•Full
• Latest values
• Peak values
(Full screen
shown right)
Set up
Screen
System
Screen
•Env
• Setting
•Init
Monitor
Screen
• Instantaneous values
• Peak values
(Instantaneous
value shown
right)
PC card
Screen
Comm
Screen
1.5 Display Screen
1.5 Display Screen
1.5.1 Screen Layout
Broadly classified, the instrument has the following 6 different display screen layouts.
Page 23

17
Displays the waveforms on the full screen.
Displays the latest value on the
left side, and the waveforms on
the right side of the screen.
Displays the peak value on the left
side, and the waveforms and date
and time on the right side of the
screen.
1.5 Display Screen
1.5.2 Logging Screen
The logging screen has three display types: full screen display, latest value display, and
peak value display.
1
Chapter 1 Overview
Page 24
18
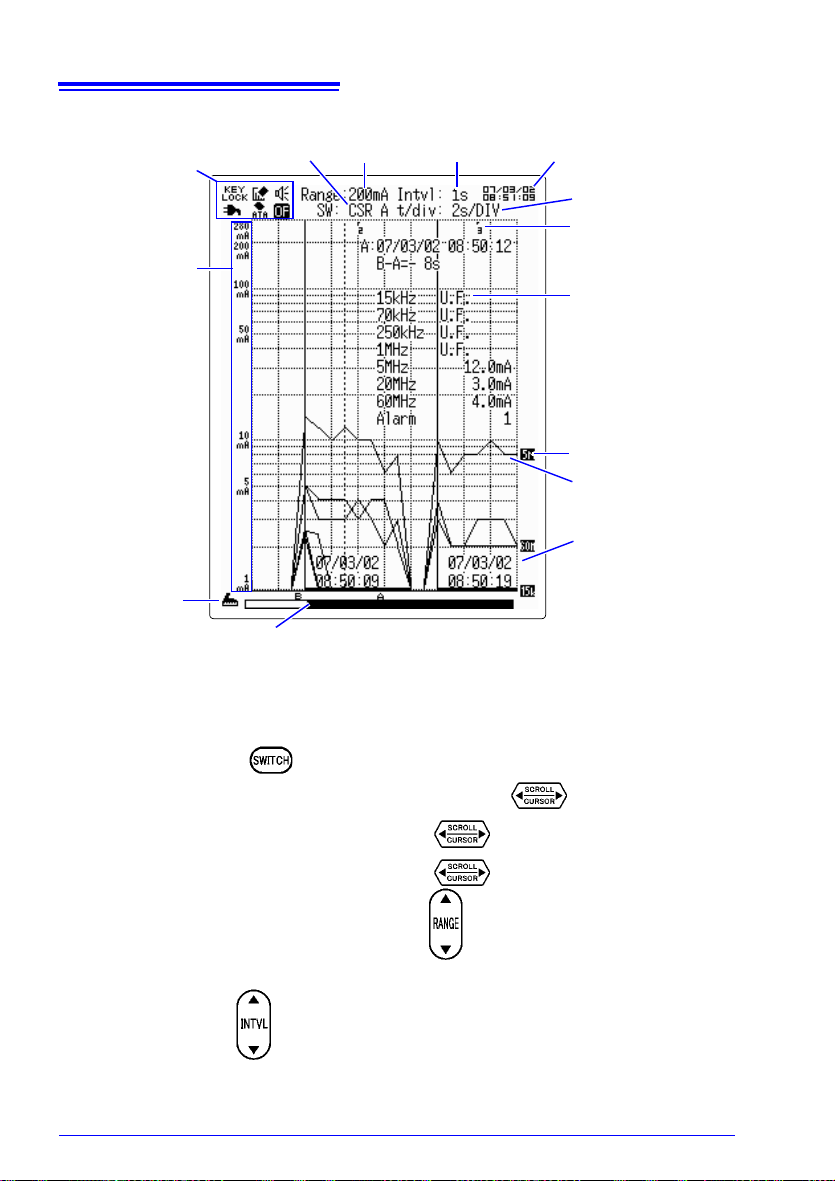
Range Recording interval Time
Time axis
Toggle
Icon
Gauge
Time display
Band waveform
Event mark
A/B cursor
values
Band marker
View
Icon
1.5 Display Screen
Logging screen
Icon Displays various aspects of the instrument's current state. ( p. 22)
Gauge The vertical axis of the graph (logarithmic display).
Toggle Press to toggle between the following functions:
Scroll: Scroll through the waveform using .
Cursor A: Move cursor A using .
Cursor B: Move cursor B using .
Range The measurement range. Use to set.
Recording
int
The recording interval for logging measurement.
erval
Use to set.
Page 25
19
Marker
O.F. icon
1.5 Display Screen
Time Displays the current time. Set using the System Init screen.
Time axis The period of time for 1 mass in the time access direction. Use
to set.
Event mark A mark can be added by pressing during logging measurement.
1
Chapter 1 Overview
A/B cursor
values
Band marker Indicates which waveform band is being displayed.
Individual
ban
waveform
Time display The graph's horizontal axis (measurement time) display.
Alarm
aveform
w
Overflow
(O.F.)
The read value of the measurement value.
The measurement waveforms for each individual band.
d
Toggles between time, date and time, and data number for the current
display e
play the display format changes each time is pressed.
If the alarm function is set and the measurement value exceeds the judgment value a marker appears at the bottom of the graph.
View The display position of the currently displayed waveform (the section of
wavefo
Also displays the positions of the A cursor and B cursor.
If the measurement value exceeds the measurement range, a marker
appears at the top of the graph. Also, the icon is displayed in the
upper left of the screen.
ach time the key is pressed. For example, during full screen dis-
rm being displayed relative to the full waveform).
Underflow
U.F.)
(
Underflow occurs when the measurement value is lower than the measurement range.
Page 26
20
Displays the instantaneous values on the left side, and a bar graph on the
right side of the screen.
Displays the peak value with its date and time on the left side, and a bar
graph on the right side of the screen.
1.5 Display Screen
1.5.3 Monitor Screen
The monitor screen has two display types: instantaneous value display and peak value display.
Page 27
Monitor screen
Range
Time
Icon
Peak
Alarm judgment
value
Band display
Level bar
21
1.5 Display Screen
1
Chapter 1 Overview
Alarm judg-
Band display The frequency band display.
Icon Displays various aspects of the instrument's current state. ( p. 22)
Range The measurement range. Use to set.
Time Displays the current time. Set using the System Init screen.
ment value
Level bar The current input value.
The value at which an alarm is triggered at each band when using the
alar
m function.
Peak The peak value at the time of the screen display.
Page 28
22
Icon
1.5 Display Screen
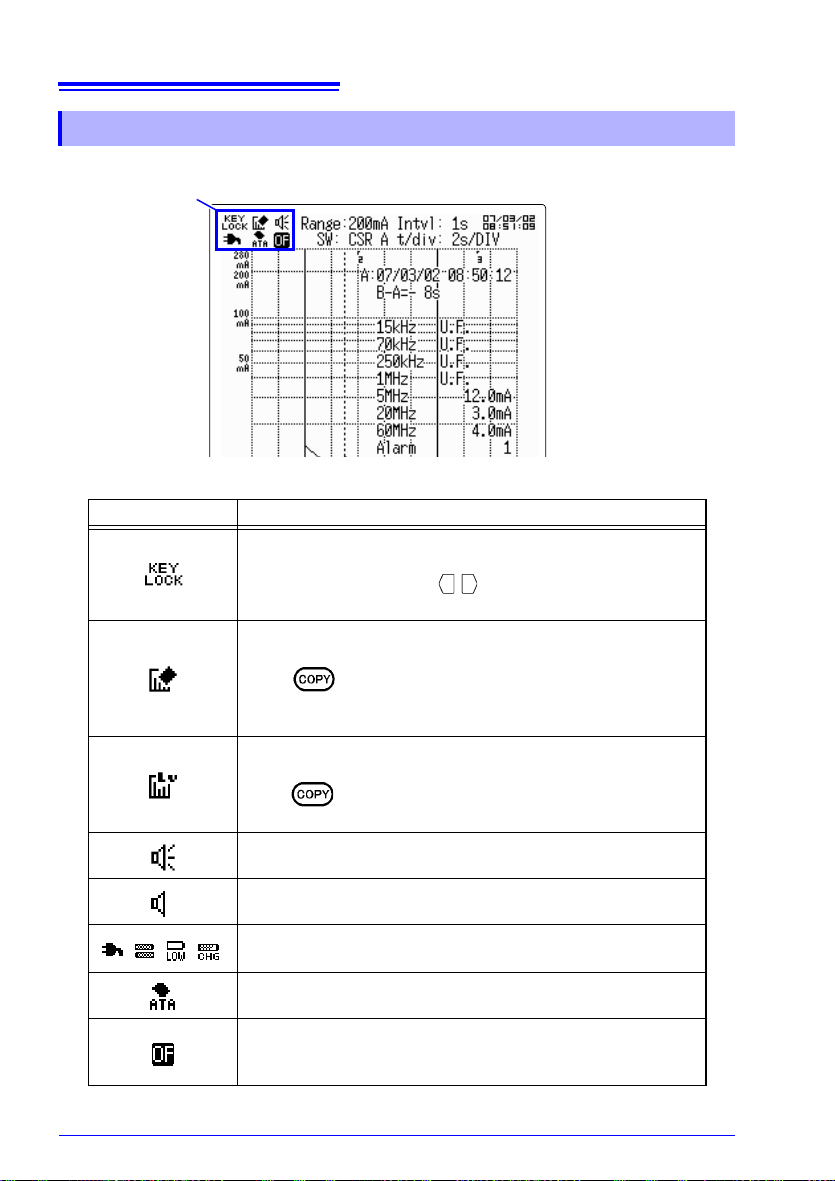
1.5.4 Icon Summary
The following icons are displayed in the upper left of the logging and monitor screens.
(Logging screen shown above)
Icons Explanations
Indicates that the instrument cannot receive commands from
the fr
ont panel keys (Key lock).
Simultaneously pressing / for 3 seconds or more will
switch between Lock and Unlock.
Indicates that the System Env screen copy key is set to
"Scree
n capture".
When is pressed the display screen is BMP saved to
the PC card.
Refer to "7.1.7 Copy Key Function (Monitor)" ( p. 116)
Indicates that the System Env screen copy key is set to "Alarm
captur
e".
When is pressed the alarm reference value is taken.
Refer to "7.1.7 Copy Key Function (Monitor)" ( p. 116)
Indicates that the instrument is in alarm state.
Indicates that the instrument is not in alarm state.
Indicates the type of power source being used.
Refer to "2.6 Turning the Power On and Off" ( p. 36)
Indicates that a PC card is set in the instrument.
Indicates that the measurement value is an overflow value.
During the logging peak value screen or the monitor peak
value scr
een the overflow display is retained.
Page 29
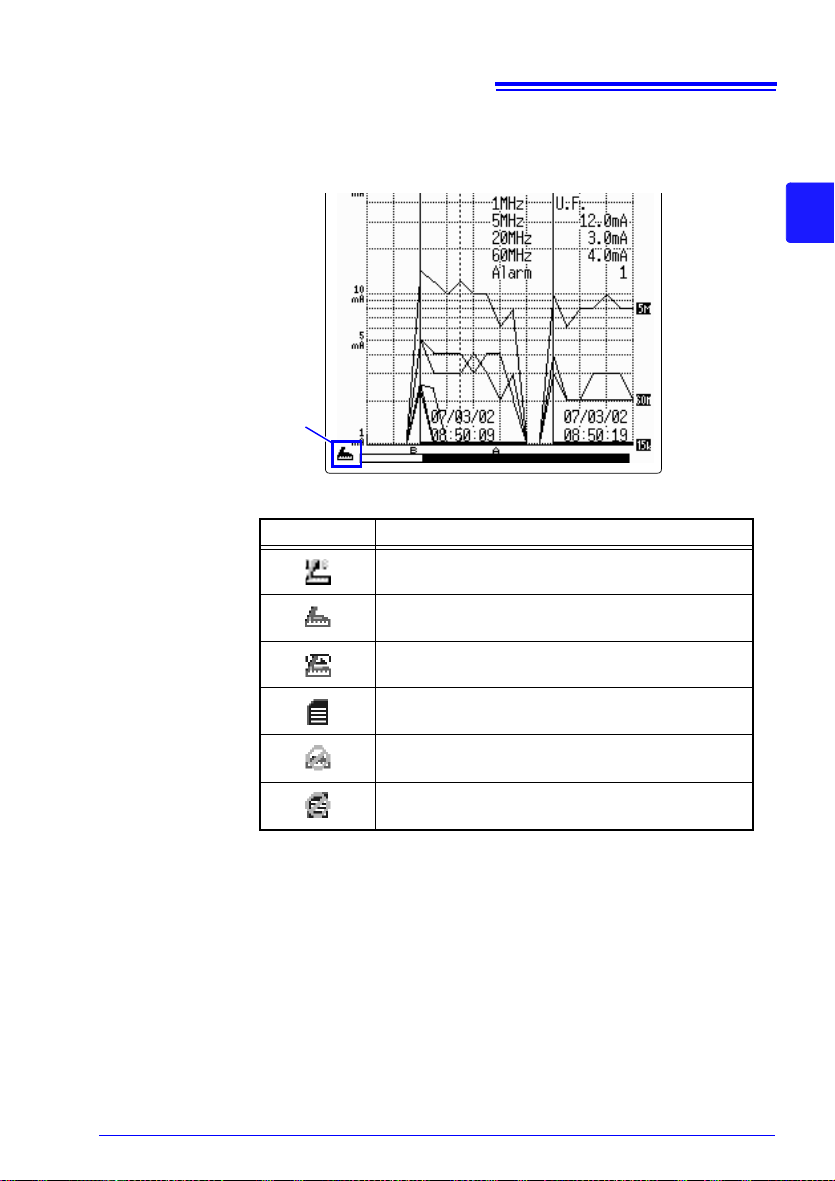
23
Icon
1.5 Display Screen
The following icons are displayed in the lower left of the display screen.
They indicate the save condition of the measurement data.
(Logging screen shown above)
Icons Explanations
Performing auto save (erase save).
Performing auto save (file full).
1
Chapter 1 Overview
Performing auto save (endless).
Text save is set.
Auto save is not possible because there is not
ficient space on the PC card.
suf
Text save is not possible because there is not suf-
ficient space on the PC card.
Page 30
24
Recording time
Alarm function
Event mark
(logging screen)
Alarm judgment
value
Submenu
Waveform color
(Logging screen
shown here)
1.5 Display Screen
1.5.5 Submenus
From the logging display or the monitor display, press to display
the submenu.
Measurement conditions can be set right on the screen. Press to
close the submenu.
Changing the settings
1. Press the keys to move the blinking cursor to the position of the setting
to be changed, and press to open the selection window.
2. Use the up and down / keys to select the desired item in the selection
window, and press to set.
Page 31

Measurement
Charge the battery pack.
Connect the Clamp on Noise Sensor.
Install the battery pack.
Connect the AC adapter to the 3145-20.
Install the strap.
Install ferrite cores onto the AC adapter,
Clamp on Noise Sensor, and LAN cables.
( p. 26)
(
p. 27)
(
p. 28)
(
p. 29)
(
p. 30)
(
p. 33)
Initialize the PC card.
Perform pre-measurement check.
Insert the PC card.
Turn on the power.
( p. 36)
(
p. 37)
(
p. 38)
(
p. 40)
(At time of
purchase)
Commence measurement.
( p. 41)
25
Preparations
The step-by-step preparations for measuring are as follows.
Chapter 2
2
Chapter 2 Measurement Preparations
Page 32

26
Attachment Point
Attachment Point
Front Panel
Stopper
Strap
Buckle
(1)
(2)
(3)
2.1 Attaching the Strap
2.1 Attaching the Strap
Attach the Strap at attachment point of the instrument.
Attach both ends of the Strap securely to the instrument. If insecurely
attached, the instrument may fall and be damaged when carrying.
1. Insert each end of the Strap through an attachment point on the instrument.
2. Thread the end of the Strap through the buckle.
3. Finally, slide the stopper over the end of the Strap.
Page 33

27
(AC adapter shown here)
Install as close as possible to
the pre-installed ferrite core.
Termination box
2.2 Install the Ferrite Cores
2.2 Install the Ferrite Cores
In order to prevent malfunctions due to external magnetic waves, install ferrite cores onto
the AC adapter, Clamp on Noise Sensor, and LAN cables.
1. Wrap the output side of the cable two times around the ferrite core.
2. Close the ferrite core until it makes a clicking sound.
• In the case of the Clamp on Noise Sensor, install the ferrite core as
close as possible to the termination box.
• In the case of the LAN cable, install the ferrite core as close as possible to the connector which connects to the 3145-20.
2
Chapter 2 Measurement Preparations
Page 34
28
Lower Panel
AC Adapter
2.3 Connecting the AC Adapter
2.3 Connecting the AC Adapter
Connect the AC adapter to the 3145-20 and supply power to the instrument. The 3145-20
can receive power from two types of power sources: either AC adapter or battery pack.
When both are supplied at the same time, the AC adapter is used.
Please use the instrument with the battery pack always in place, as it is also a countermeasure in the case of power outage.
• Turn the instrument off before connecting the AC adapter to the
instrument and to AC power.
• Use only the supplied Model 9418-15 AC ADAPTER. AC adapter
input voltage range is 100 to 240 VAC (with
60 Hz. To avoid electrical hazards and damage to the instrument,
do not apply voltage outside of this range.
• Data can be retained for about ten minutes after power is interrupted
(when the Battery pack is not installed). Operation after power interruption depends on the setting for Resume Recording After Power
Loss.
Refer to "2.7.2 PC Card Initialization" ( p. 38) and "7.1.2 Start
Backup After Power Loss" ( p. 111).
• This instrument will not run erratically under a momentary power
outage lasting less than 40 ms. However, if a momentary outage
of 40 ms or more occurs, the instrument turns off temporarily, so
the power condition at the installation location should be considered beforehand. Therefore, consider the p
tions at your installation site before installing the instrument.
±10% stability) at 50/
ower supply condi-
1. Make sure the instrument is OFF.
2. Connect the AC adapter to the instrument.
3. Plug the AC adapter into the power outlet.
Page 35

29
Bottom Panel
Model 9447 BATTERY PACK
2.4 Supplying Power with the Battery Pack
2.4 Supplying Power with the Battery Pack
By using battery power to run the 3145-20 NOISE HiLOGGER, it can be used even in
places with no commercial power outlets.
The 9447 BATTERY PACK is rated for approximately 1 hour of continuous use (backlight:
bright; after approximately 2.5 hours charging the battery). When longer periods of continuous measurement are required, please prepare multiple battery packs.
The 3145-20 can also receive power from its AC adapter. When both are supplied at the
same time, the AC adapter is used. Please use the instrument with the battery pack always
in place, as it is also a counter-measure in the case of power outage.
• To avoid electric shock, turn off the power switch and disconnect
the cables before replacing the batteries.
• For battery operation, use only the HIOKI Model 9447 BATTERY
PACK. We cannot accept responsibility for accidents or damage
related to the use of any other batteries.
2.4.1 Installing the Battery Pack
At the time of purchase, the back side of the instrument is equipped with a battery box.
Remove the battery box and install the 9447 BATTERY PACK.
2
Chapter 2 Measurement Preparations
1. Turn off the power switch.
2. Remove the battery compartment.
3. Insert the 9447 BATTERY PACK until it clicks.
The battery pack is subject to self-discharge. Be sure to charge
the battery pack before initial use. (Please refer to the next page)
Page 36

30
Lower Panel
AC Adapter
Charging
Charged
2.4 Supplying Power with the Battery Pack
2.4.2 Charging the Battery Pack
The battery pack may be charged in the 3145-20 itself, or in the optional 9643 CHARGE
STAND.
Charging with the 3145-20 NOISE HiLOGGER
The 9447 BATTERY PACK can be charged whether the 3145-20's power switch is turned
ON or OFF (both during and after measurement).
1. Install the battery pack and con-
nect the AC adapter.
2. Rapid charge of the battery pack
begins.
(When the power switch is OFF)
The LED lights up red, and turns
off when rapid battery charge is completed.
(When the power switch is ON)
The mark is displayed at the top of
the screen, and the mark is disp lay ed
when rapid battery charge is completed.
3. It takes approximately 2.5 hours to
complete rapid charge.
Rapid charge alone provides approximately 70% of the battery life that full
charge provides.
After completion of rapid charge, supplementally charging for approximately 10
additional hours will bring the battery
pack to full charge.
Supplemental charging continues even after the battery pack is fully
charged to prevent the battery pack self discharging.
Page 37

2.4 Supplying Power with the Battery Pack
Charge stand
Battery Pack
AC Adapter
Charging with the optional 9643 CHARGE STAND
1. Place the battery pack in the
charge stand.
31
2. Connect the AC adapter to the
charge stand.
The LED will blink red, and then continually remain lit as rapid charge commences.
3. Rapid charge is completed in
approximately 2 hours.
The green LED lights up, and supplemental charging begins.
• The ambient temperature should be between 0 and 40 °C when charg-
ing. If charging is done outside this temperature range, the battery
rial will degrade and the battery may not be able to be sufficiently
mate
charged, or the battery life may be shortened.
• Do not use chargers made by other companies.
• If the battery pack expires and the instrument automatically shuts off,
sure to turn off the power switch. If left as is with the power switch
be
turned on for a long period of time, the battery pack may be in danger
of overdischarging.
2
Chapter 2 Measurement Preparations
• The battery pack is subject to self-discharge. If stored or otherwise not
used
for a long time, the battery pack should be discharged and then
recharged at least once every two months. Battery capacity may be
degraded if stored for a long time without charging.
Page 38

32
Low battery display
2.4 Supplying Power with the Battery Pack
2.4.3 Battery Pack Life
If the battery life is considerably short even with correct charging,
replace the battery pack with a new one. As the battery pack charge is
depleted, the low battery mark will be displayed in the upper left of
the logging screen or monitor screen. Alternatively, the following warning
is displaye
charge the battery pack.
d: "WARNING 620: Battery low.". In such cases, please
Page 39

33
2.5 Connect the CLAMP ON NOISE SENSOR
2.5 Connect the CLAMP ON NOISE SENSOR
Connect the Clamp on Noise Sensor to the terminals of the 3145-20, and clamp the line to
be measured.
Before using, read the instruction manual included with the Clamp on Noise Sensor and follow all safety precautions.
• To avoid electric shock, do not to uch th e po r tio n be yon d t he p rotective barrier during use.
• To avoid short circuits and potentially life-threatening hazards,
never attach the clamp to a circuit that operates at more than 600
V (CAT II) / 300 V (CAT II ), or over bare conductors.
• To avoid electrical shock, be careful not to damage the insulation
of the conductor being measured.
• To avoid electrical shock, follow the precautions below to ensure
no dangerous voltage from the power of the instrument being
connected to or its other measuring terminals (those not connected to this instrument) is impressed upon the 9754 CLAMP
ON NOISE SENSOR. If dangerous voltage is impressed upon
this instrument, dangerous voltage will be generated in its BNC
connector and inner circuitry, presenting an extreme hazard.
Only connect to instruments which are constructed with double
insulation and use a protective earth.
Confirm that basic insulation which meets the measurement category, working voltage and pollution degree of the circuit being
tested, is used to isolate the other measurement terminals of the
instrument being connected to.
If you are not sure basic insulation is used between the terminals
of the measurement instrument, do not input voltage which
exceeds the Separated Extra-Low Voltage Earthed (SELV-E) level
into the other terminals of the instrument.
Observe all safety precautions of the instrument you are using.
Refer to the following standards regarding the meanings of
underlined terms.
IEC 61010-1
IEC 61010-031
IEC 61010-2-032
2
Chapter 2 Measurement Preparations
To avoid electric shock when measuring live lines, wear appropriate protective gear, such as insul
safety helmet.
ated rubber gloves, boots and a
Page 40
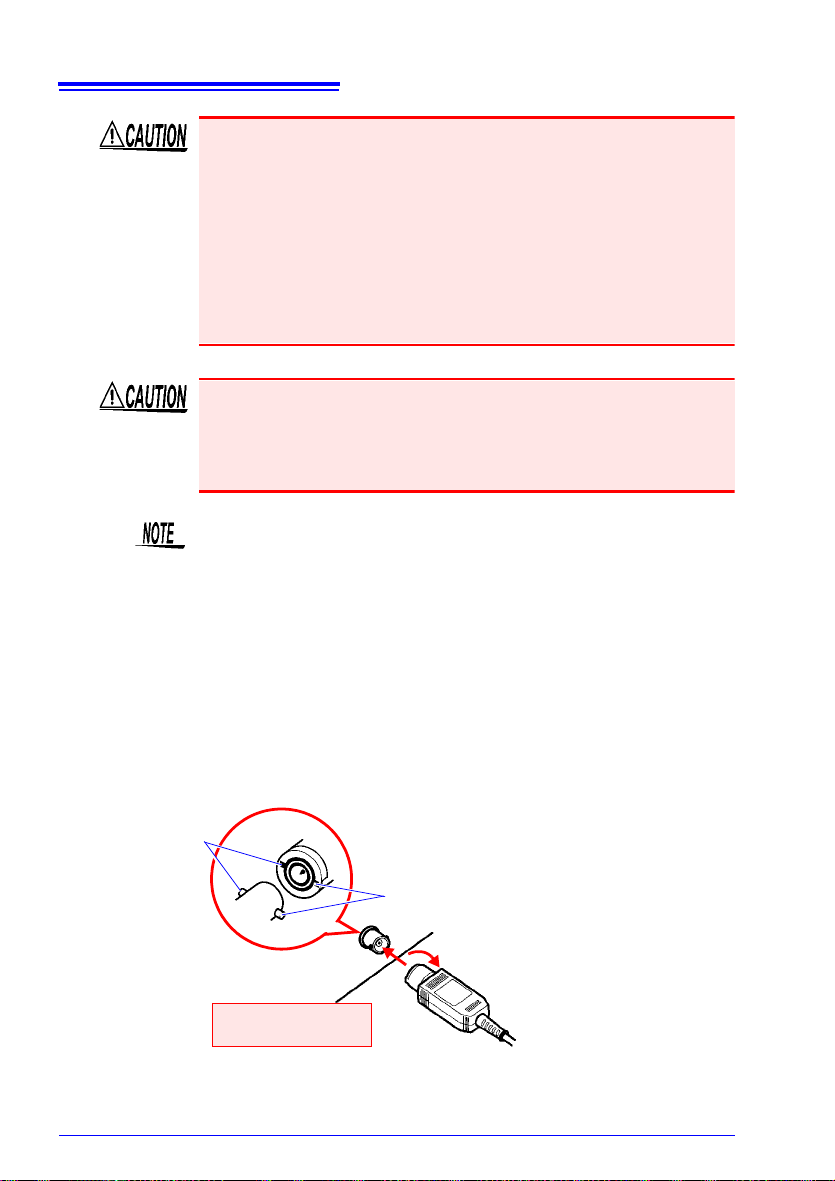
34
Line up
Line up
(1)
(2)
Turn until it clicks
2.5 Connect the CLAMP ON NOISE SENSOR
To avoid damaging the instrument, do not apply current that exceeds
the maximum continuous input range.
* Maximum continuous input range:
This range is based on heat that is internally generated during sine
wave
input at a prescribed frequency at room temperature. It varies
according to the frequency of the measured current. (Use the 9754
CLAMP ON NOISE SENSOR at the highest effective value within the
maximum continuous input range.) In addition to the maximum continuous input range, there is also the "maximum peak current value 15
Apeak"
product specification. This indicates an upper waveform
response limit of 15 Apeak.
• When disconnecting the BNC connector, be sure to release the lock
before pulling off the connector. Forcibly pulling the connector without
releasing the lock, or pulling on the cable, can damage the connector.
• To avoid damaging the instrument, always open the clamp by using
the
slider.
Apart from the Clamp on Noise Sensor, near magnetic field probes or
antennae may be connected in a similar fashion to the Clamp on Noise
Sensor to check and record individual band levels. Please use near
magnetic field probes or antennae which match the characteristics of
the Clamp on Noise Sensor. The measurement range, frequency char
acteristics and input impedance are as follows.
Measurement range : 1 Vp-p to 0.15 mVp-p
Frequency bandwidth : 5 kHz to 100 MHz (-3 dB bandwidth)
Input impedance : 50
-
1. Connect the BNC connector of the 9754 CLAMP ON NOISE SENSOR to the
input terminal of the instrument being connected to.
Page 41

2.5 Connect the CLAMP ON NOISE SENSOR
Current
Current direction
indicator
Make sure that the current direction indicator arrow matches the direction of current flow on the conductor being
measured.
Make sure also that the conductor is
clamped in the center of the clamp opening.
Communication
lines
Electrical
lines
Ground lines
<Connection example>
2. Pull the slider on the sensor to open the clamp.
35
3. Clamp the conductor to be measured and close the clamp.
4. Press on the slider until it clicks to lock shut.
Press the sensor slider until the "UNLOCK" message disappears and "LOCK" is displayed,
and confirm that the slider is firmly locked and the clamp securely closed.
5. When disconnecting the 9754 CLAMP ON NOISE SENSOR, pull the sensor
slider to open the clamp and remove the Clamp on Noise Sensor from the conductor being measured.
2
Chapter 2 Measurement Preparations
Page 42

36
Marks Explanations
Operating with the AC adapter.
Operating with the 9447 BATTERY
PACK.
Battery capacity is low.
Charge the battery pack.
Charging the battery pack
2.6 Turning the Power On and Off
2.6 Turning the Power On and Off
Power On
1. Turns on ( ) the POWER switch.
2. Depending on the type and condition of the power supplied to the instrument,
one of the following messages appears on the display.
3. During initial use after purchasing, set the time using the System Init screen.
Refer to "7.3.1 Setting the Clock" ( p. 127).
Power Off
1. Turns off ( ) the power switch.
2. Remove the Clamp on Noise Sensor from the conductor being measured.
3. Remove the AC adaptor plug from its electrical outlet.
• After power is turned off, the last waveform data is retained for about
10 minutes.
• When power is turned on, the instrument restores the settings used
immediately before power was turned off last (backup function).
Page 43

2.7 Using the PC Card
Some PC Cards are susceptible to static electricity. Exercise care when
using such products because static electricity could damage the PC
Card or cause malfunction of the instrument.
37
2.7 Using the PC Card
2.7.1 Inserting the PC card
When saving logging measurement data or setting conditions to a PC card, insert the PC
card into the slot at the top of the 3145-20.
Important
Use only PC Cards sold by Hioki.
Compatibility and performance are not guaranteed for PC cards made by other manufacturers. You may be unable to read from or save data to such cards.
Hioki options PC cards (includes adapter)
Model 9726 PC CARD 128M, Model 9727 PC CARD 256M,
Model 9728 PC CARD 512M, Model 9729 PC CARD 1G
PC card insertion
1. Open the cover and insert the PC card with
the arrow facing up and in the direction of
the PC card slot, as far as it will go.
Inserting a PC card upside down, backwards or in
the wrong direction may damage the instrument
2. Before using a new PC Card, it must be ini-
tialized.
2
Chapter 2 Measurement Preparations
Removing the PC card
1. Press the eject button and pull out the PC
card.
2. Always close the cover when no PC Card
is installed.
Page 44

38
2.7 Using the PC Card
2.7.2 PC Card Initialization
Initialize the PC card. All files on the PC card will be erased, and a system file resistant to
power outage will be created.
When using a PC card with the instrument, be sure to format the card
before its initial use using the instrument. When formatting in "FAT 16"
using a PC (personal computer), please note that the Power Fault Protection function will be ineffective. Furthermore, do not use the "FAT
32
" format, as doing so will result in error.
When recording for long durations, format the card before measurement, and make a backup copy of the resulting waveform files on your
PC or ot
mended that you re-format the card before measurement in order to
ob
her storage media. When re-using a PC card, it is recom-
tain maximum performance.
1. Press to open the PC card screen.
2. Press / to choose [Format].
3. Press to open the initialize screen.
Page 45

39
Selectable
items
Explanations
Quick
The PC Card is not tested for
bad sectors.
Entirely
The PC Card is tested for bad
sectors, which are removed
from use if possible.
When using a brand new PC
card for the first time, select
[Entirely].
2.7 Using the PC Card
4. Press to move the flashing cursor to [Method], and press to open the
contents.
2
Chapter 2 Measurement Preparations
5. Use the up and down / keys to select [Entirely], and press to set.
6. Press to move the blinking cursor to [Execute], and press to execute
initialization.
To cancel, move the blinking cursor to [Back] and press .
• If a PC card is formatted by the instrument, a /LOGGER/ directory will
be created, and when you attempt to save a file into the root directory
automatically it will be saved to this directory instead. When the saving operation begins, you will automatically be moved to the /LOGGER/ directory.
• You cannot change the name of the /LOGGER/ directory or delete the
direct
ory.
Page 46
40
Yes
No
Is the probe free from any torn insulation or
exposed metal?
Yes
Check complete
No
Model 9754 CLAMP ON NOISE SENSOR
Is the 3145-20 chassis completely free of
damage?
Discontinue use and
contact the store
where you bought
the instrument, or
your closest HIOKI
dealer or business
office.
Yes
No
Are the cables free of any torn insulation or
exposed metal?
Yes
Does the "HIOKI" logo appear on the screen
when the power is turned on?
Yes
Yes
No
No
No
Model 3145-20 NOISE HiLOGGER
Is the clamp free from any cracks or damage?
Is the logging screen or monitor screen
displayed after startup?
2.8 Pre-Operation Inspection
2.8 Pre-Operation Inspection
Before beginning measuring, check the following points.
Page 47
41
Communication
lines
Electrical
lines
Ground
lines
Monitor screen
Logging screen
<Connection example>
Waveform display
Bar graph display
Measurement Chapter 3
• The maximum input voltage is 5 V peak. Attempting to measure
voltage in excess of the maximum input could destroy the instrument and result in personal injury or death.
• The maximum rated voltage between input terminals and ground
is 5 V. Attempting to measure voltages exceeding 5 V with
respect to ground could damage the instrument and re sult in personal injury.
Clamp the Clamp on Noise Sensor to the place to be measured on the communication line,
power line or ground line. With monitor display, the measured values of each band * are
shown as a bar graph. With logging measurement, change of the measurem ent values over
time can be displayed and this data saved to a PC card.
3
Chapter 3 Measurement
* Band: the frequency band of the measured waveform.
Page 48

42
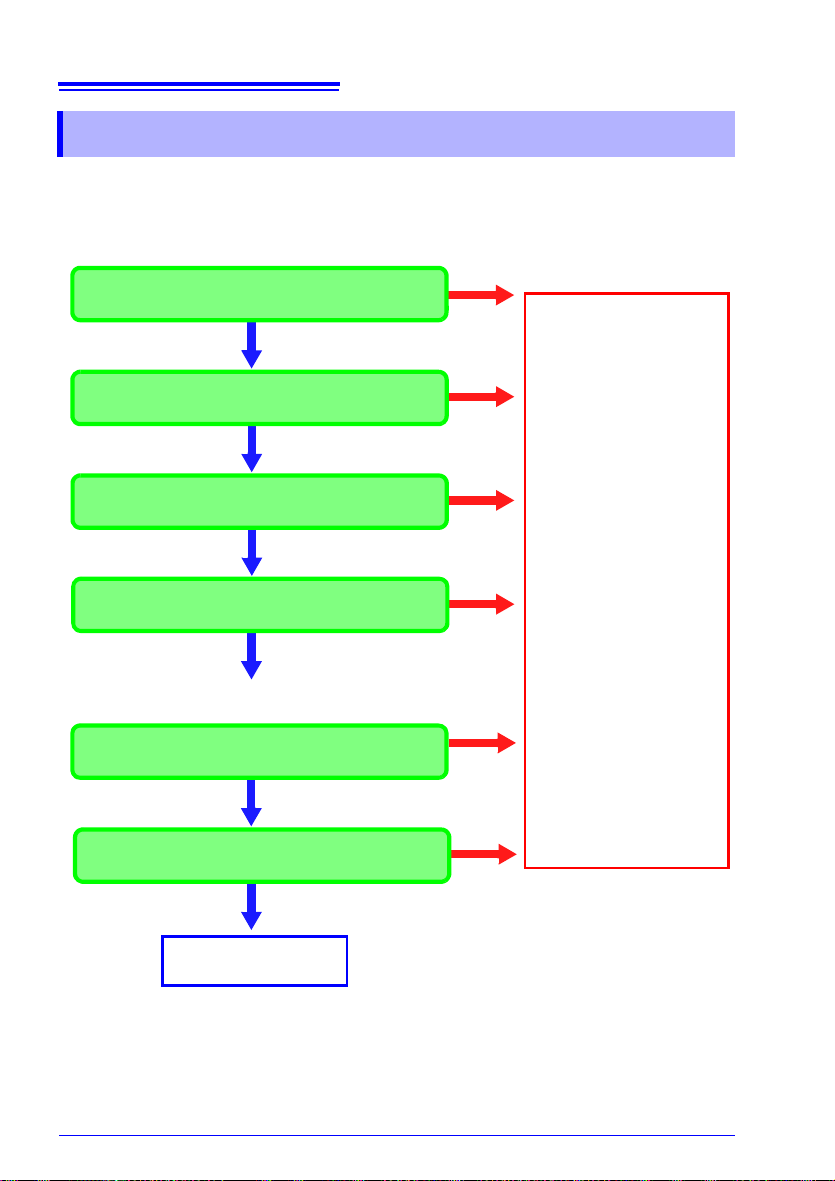
Begin measurement.
Complete measurement.
Set automatic save. ( p. 82)
Set the alarm function
( p. 56)
Perform monitor measurement.
Check the current input
Monitor measurement ( p. 43)
Set the time axis.
Record changes over time
Set the recording time.
( p. 77)
Set the recording interval.
Set the measurement range.
Display the logging screen.
Logging Measurement ( p. 45)
To initialize settings, refer to "7 .3. 3 Syste m
Reset" (
p. 129).
Pre-measurement preparations
( p. 25)
Set the alarm function. ( p. 56)
Set the measurement range.
Display the monitor screen.
Pre-measurement preparations
( p. 25)
Set the input type. ( p. 74)
Set the input type. ( p. 74)
3.1 The Measurement Process
3.1 The Measurement Process
Page 49

43
The instantaneous values for each band are displayed on the left side of the screen, and the level meter is displayed on the right.
The peak values for each band are displayed on
the left side of the screen, and the level meter is
displayed on the right.
The peak value during monitor measurement is
the peak value from the time of switching to monitor display until the present. When switching
from the logging screen back to the monitor
screen, the peak value will have been cleared.
The peak value is also cleared by pressing
.
3.2 Check the Current Input (Monitor Measurement)
3.2 Check the Current Input
(Monitor Measurement)
The measurement values for each individual band (15kHz, 70kHz, 250kHz, 1MHz, 5MHz,
20MHz, 60MHz) can be checked on the screen. The data cannot be saved.
1. Make preparations for measurement referring to "Chapter 2 Measurement
Preparations" ( p. 25).
2. Set the input type to [Current ] or [Voltage] on the Set up screen. ( p. 74)
3. Press to display the instantaneous values.
3
Chapter 3 Measurement
4. Press to display the peak values.
Page 50

44
Selectable ranges: 200mA, 2A, 20A
As a general reference, select 200mA for
communications, 2A for power supply and
20A for lightning surge.
When checking using voltage levels, set the
input type to "Voltage" on the Set up screen.
(
p. 74)
Set the range to 10mV, 100mV or 1V.
3.2 Check the Current Input (Monitor Measurement)
5. Press to select the range.
The noise measurement range differs depending on the current or voltage range selected. See the chart below.
Measurement object
Current
(When using the 9754)
Voltage
Measurement range
20 A
2 A
200 mA
1 V
100 mV
10 mV
Measurable noise range
28 A
to 200 mA
P-P
2.8 A
P-P
280 mA
1.4 V
P-P
140 mV
14 mV
to 20 mA
P-P
to 20 mV
P-P
to 0.2 mV
P-P
to 2 mA
to 2 mV
P-P
P-P
P-P
P-P
P-P
P-P
"O.F."
display
(Overflow display)
If the measured value exceeds the upper value of the selected range,
the numerical value on the left side of the screen will become "O.F."
"U.F."
display
Increase the range in such a case.
(Underflow display)
If the measured value is lower than the lower value of the selected
range, the numerical value on the left side of the screen will become
"U.F." Decrease the range in such a case.
To sound an alarm when the measurement value exceeds the set value:
Set the alarm function. Refer to "4.5 Using the Alarm Function" ( p. 56).
Page 51

45
Selectable ranges: 200 mA, 2 A, 20 A
As a general reference, select 200mA for
communications, 2A for power supply and
20A for lightning surge.
When checking using voltage levels, set the
input type to "Voltage" on the Set up screen.
(
p. 74)
Set the range to 10mV, 100mV or 1V.
3.3 Record Changes Over Time (Logging Measurement)
3.3 Record Changes Over Time
(Logging Measurement)
With logging measurement, the change over time of the measurement values at each band
(15kHz, 70kHz, 250kHz, 1MHz, 5MHz, 20MHz and 60MHz) can be viewed.
1. Make preparations for measurement referring to "Chapter 2 Measurement
Preparations" ( p. 25).
2. Set the input type to [Current ] or [Voltage] on the Set up screen. ( p. 74)
3. Press to display the logging full screen, and to select the range.
3
Chapter 3 Measurement
• The noise measurement range differs depending on the current or
voltage range selected. See the left chart.
• Upon starting a new logging session, previously logged and recorded
data will be automatically deleted from the internal memory. Be sure
to save any required measurement data to the PC Card before starting a new logging session.
Page 52
46
Selectable ranges:
1s, 2s, 5s, 10s, 20s, 30s, 60s
Selectable ranges:
2s, 5s, 10s, 20s, 30s, 1min, 2min,
5min, 10min, 20min, 30min,
1h, 2h, 5h, 10h, 12h, 1d
3.3 Record Changes Over Time (Logging Measurement)
4. Press to select the recording interval.
5. Press to change the time axis.
The selectable range of the time axis differs depending on the recording
l setting. See the chart below.
interva
Recording
interval
1s
2s
5s
10s
20s
30s
60s
The range, recording interval and time axis can also be set with the Set
up scre
p. 71).
The range and recording interval cannot be changed during logging
measurement.
Possible time axis settings
2s, 5s, 10s, 20s, 30s, 1min, 2min, 5min, 10min, 20min,
30m
in, 1h, 2h, 5h, 10h, 12h, 1d
10s, 20s, 30s, 1min, 2min, 5min, 10min, 20min, 30min,
1h, 2h, 5h, 10h, 12h, 1d
10s, 20s, 30s, 1min, 2min, 5min, 10min, 20min, 30min,
1h, 2h, 5h, 10h, 12h, 1d
20s, 30s, 1min, 2min, 5min, 10min, 20min, 30min, 1h, 2h,
5h, 10
h, 12h, 1d
1min, 2min, 5min, 10min, 20min, 30min, 1h, 2h, 5h, 10h,
12h, 1
d
1min, 2min, 5min, 10min, 20min, 30min, 1h, 2h, 5h, 10h,
12h, 1
d
2min, 5min, 10min, 20min, 30min, 1h, 2h, 5h, 10h, 12h,
1d
en. Refer to "Chapter 5 Setting the Measurement Conditions" (
Page 53

47
Selectable
items
Explanations
OFF Does not save data.
3145 Form
Auto saves in binary format
readable by the instrument
and the "DATA VIEWER for
3145" software on the
included CD.
Text
Auto saves in text format
readable by personal computer spreadsheet programs.
(Cannot be read by the
3145-20)
3.3 Record Changes Over Time (Logging Measurement)
6. In order to save data to the PC card simultaneously while measuring, press
to open the Set up screen.
When using a new PC card for the first time, initialize the PC card.
7. Press to move the flashing cursor to [Auto Save] , and press to
open the selection window.
3
Chapter 3 Measurement
8. Use the up and down / keys to select [3145 Form], and press to
set.
Normally, the save mode is set to [Normal], [Full]. This setting saves a wave file for each
measurement, then stops measurement when the PC card becomes full.
To perform detailed settings, refer to "6.1.3 Save Mode" (
• By setting auto save to "Text", after completion of measurement the
• By setting auto save to OFF, data is saved in the 3145-20 internal
Setting the recording time:
Set the recording time to [Time] on the Set up screen.
Refer to "5.5 Setting the Recording Time" ( p. 77).
To sound an alarm when the measurement value exceeds the set value:
Set the alarm function. Refer to "4.5 Using the Alarm Function" ( p. 56).
data which remains in internal memory is auto-saved.
emory (32MB). Please note that when the internal memory becomes
m
full, old data is erased. Data in the internal memory can be saved to
PC card following measurement. ( p. 91)
p. 84).
( p. 90)
Page 54

48
Logging latest value display
Logging peak value display
3.3 Record Changes Over Time (Logging Measurement)
9. Press to commence logging measurement.
If auto save mode is set to [Ref. Time], when starting measurement the "Sync fixed time“
message is displayed until the recording interval synchronizes to reference time.
10.Press to view the latest value. Press to view the peak value.
If "O.F." or "U.F." is displayed on the screen, then the measurement value is outside of the
measurement range. Please change the range.
11.Press twice to stop logging measurement.
If the recording time has been specified and the recording ti me expires, then logging measurement automatically stops.
Page 55

49
3.3 Record Changes Over Time (Logging Measurement)
• If the auto save setting is OFF in the Set up screen, when commencing a new measurement after a prior measurement the recorded data
in the internal memory is erased. To retain the data, use the PC card
screen to save it to PC card. Refer to "6.3 Saving Data af ter Me asure ment" ( p. 91).
• If power is interrupted before the first data refresh, no data is stored,
and a file is created with zero bytes.
• When the recording period is set to [Cont] (Continuous) and automatic saving is set to [Text], the data remaining on the internal mem-
ory will be saved automatically.
• During automatic saving, if an abnormality occurs on the PC Card
while recording, one of the following messages appears near the bottom of the screen.
Messages Descriptions
No PC Card
PC Card has error
PC Card is full
Appears when no PC Card is installed
in the PC Card slot.
Appears when a fault occurs on the
PC Card, and when recording is not
possible.
Appears when the available space on
the PC Card reaches or falls below the
specified amount.
Be sure to stop measurement before
replacing the PC card. If the PC card
is removed during measurement the
data may be damaged.
This message does not appear when
deleting and saving files.
3
Chapter 3 Measurement
Page 56

50
3.4 "O.F." Display and "U.F." Display
3.4 "O.F." Display and "U.F." Display
If the measurement value for each frequency wave range is lower than
the selected measurement range, "U.F." (Underflow) will be displayed.
Alternatively, if the measurement value for each frequency wave range
is higher than the selected measurement range, "O.F." (Overflow) will be
displayed.
"O.F." (Overflow) display will also occur if the input value exceeds the
measu
rement range.
In the case of "O.F." display, change the range.
If overflow occurs during logging measurement, the "O.F." marker will be
displayed at the top of the graph display screen for the section where the
overflow occurred. Also, the icon is displayed in the upper left of the
screen. The icon remains displayed during the logging peak value
or the monitor peak value screen.
screen
Page 57

51
Useful Functions Chapter 4
The 3145-20 NOISE HiLOGGER has the following useful functions.
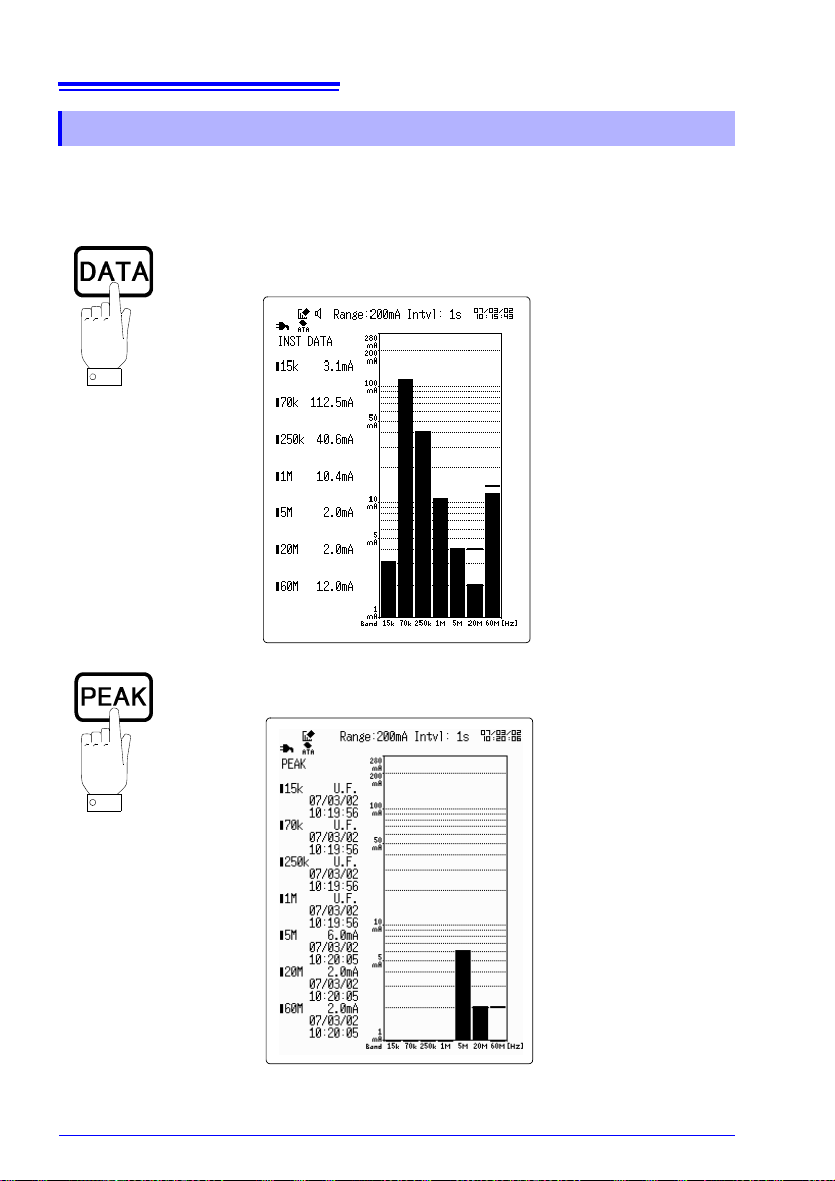
Please make use of them as necessary.
Functions Logging Monitor
"4.1 View the Latest Logging Measurement
Value or Peak Value" ( p. 52)
"4.2 Check Using a Bar Graph (Monitor Measurement)" ( p. 52)
"4.3 View Past Waveforms (Scroll Function)"
( p. 53)
"4.4 A/B Cursor Measurement" ( p. 55) Available --
"4.5 Using the Alarm Function" ( p. 56) Available Available
"4.6 Adding Event Marks to Waveforms" ( p.
66)
"4.7 Highlighting a Specific Band" ( p. 68) Available --
"4.8 Preventing Malfunctions (Key Lock)" (
p. 69)
"4.9 Saving the Display Screen to PC Card
(Screen Capture)" ( p. 70)
Available --
-- Available
Available --
Available --
Available Available
Available Available
4
Chapter 4 Useful Functions
Page 58

52
Displays the latest value on the left
side, and the waveforms on the
right side of the screen.
Displays the peak value on the left
side, and the waveforms on the right
side of the screen.
Displays the instantaneous values
on the left side, and a bar graph on
the right side of the screen .
Displays the peak values on the left
side, and the bar graph on the right
side of the screen.
4.1 View the Latest Logging Measurement Value or Peak Value
4.1 View the Latest Logging Measurement V alue
or Peak Value
4.2 Check Using a Bar Graph
(Monitor Measurement)
When saving a file there may be a delay before the graph is displayed.
You can clear the peak value during monitor measurement by pressing
. When moving to the screen other than the monitor screen, the
peak value will be cleared.
Page 59

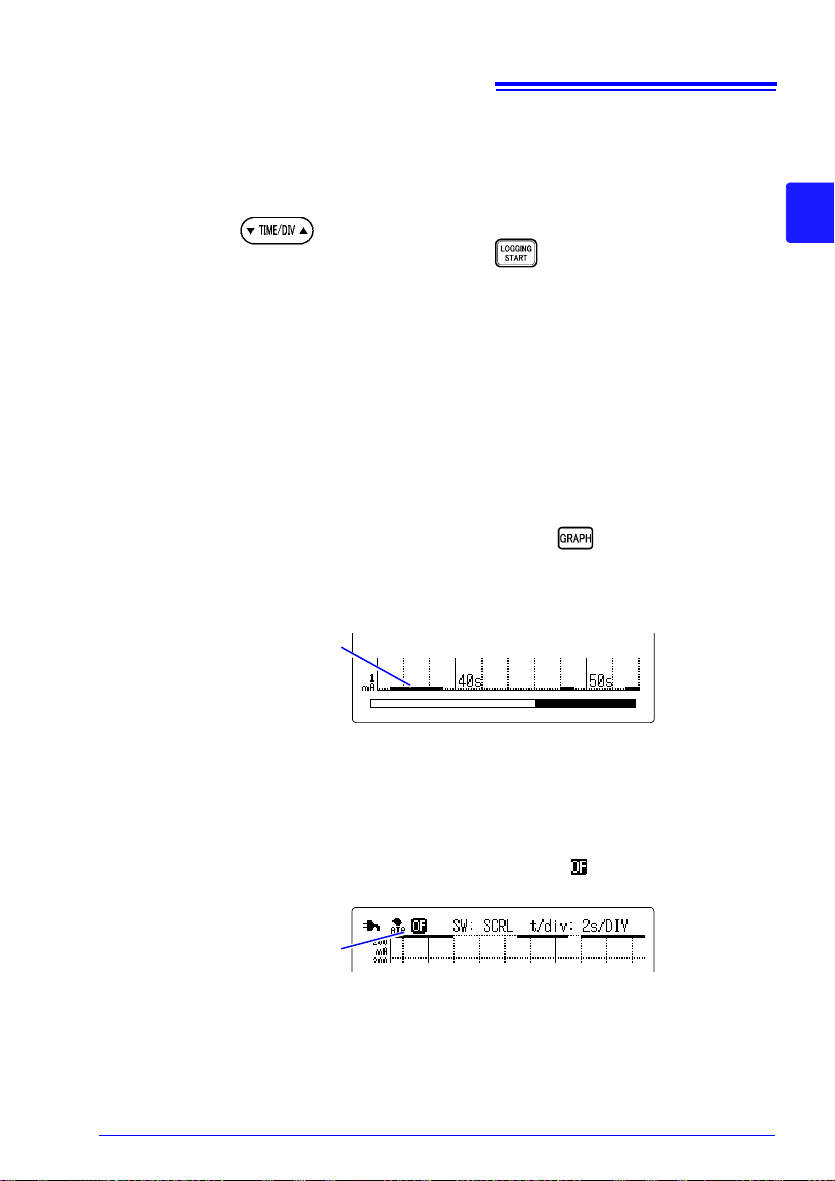
4.3 View Past Waveforms (Scroll Function)
Scroll Left
Display
Display
<Example>
4.3 View Past Waveforms (Scroll Function)
Waveforms on the Logging screen can be scrolled horizontally.
4.3.1 Scrolling the Waveform
1. Press and switch the position to [SCRL].
53
4
Chapter 4 Useful Functions
2. Press to scroll the waveform.
Scroll the waveform fast. : or
Move to the head of the data stored in instrument memory. : and
Move back to the current waveform. : and
Page 60
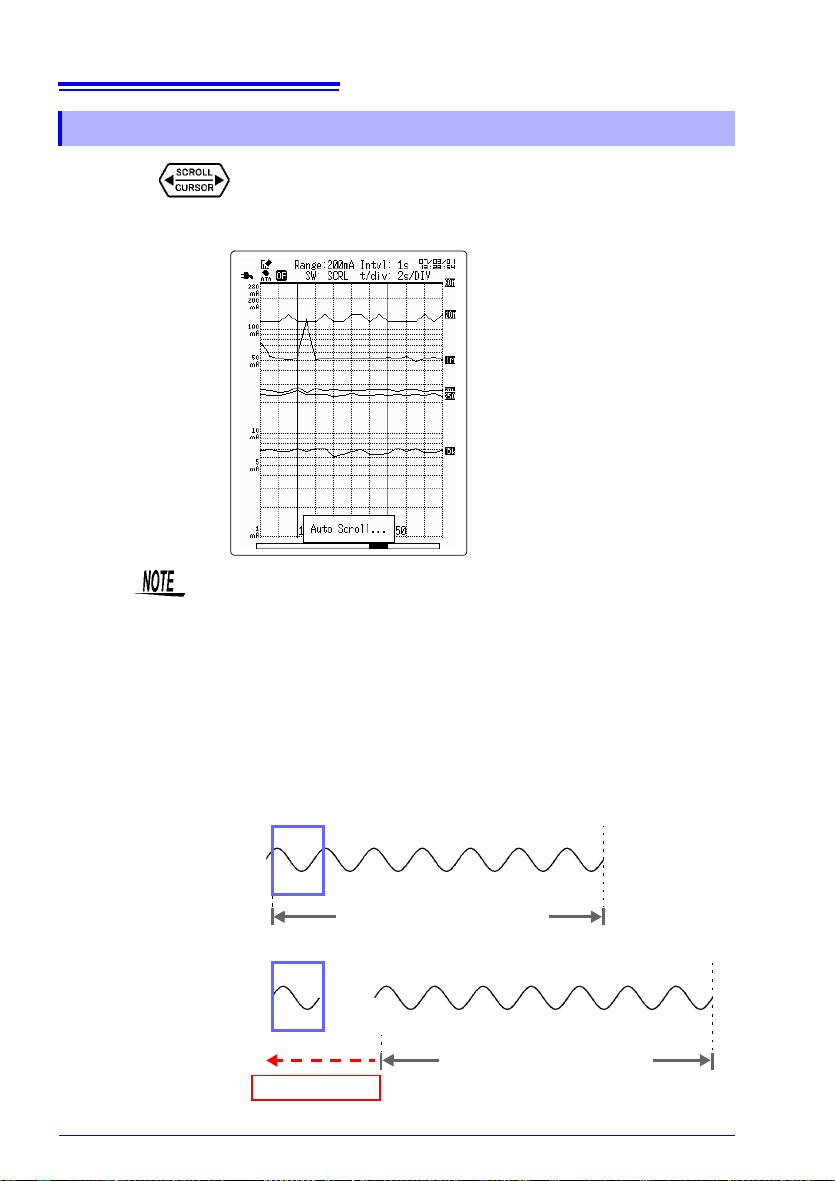
54
Instrument Memory
(Max. Recording Time)
Display
Erased data
Recording Data
Recording Data
Display
Instrument Memory
(Max. Recording Time)
4.3 View Past Waveforms (Scroll Function)
4.3.2 Auto Scrolling
Holding the for five seconds activates automatic waveform scrolling ("Auto
Scroll" is displayed). Press any key to cancel auto scrolling.
• During measurement auto scroll cannot be performed.
• The amount of time which can be saved (maximum recording time) in
the instrument's internal memory differs depending on the recording
interval setting, so please refer to "The relationship between recording
interval and maximum recording time"( p. 78).
• When the recording time is
when the instrument's internal memory capacity is exceeded. By
scrolling the waveform past waveforms are displayed on the display
screen, but take note that the data may not be saved in internal memory.
• When the recording time is
[Cont] (Continuous), old data is erased
[Time], old data is not overwritten.
Page 61

55
The values read by the A cursor
Full record of internal memory
Displayed waveform
A Cursor position
B Cursor position
Alarm 0
Alarm 1: The alarm state occured
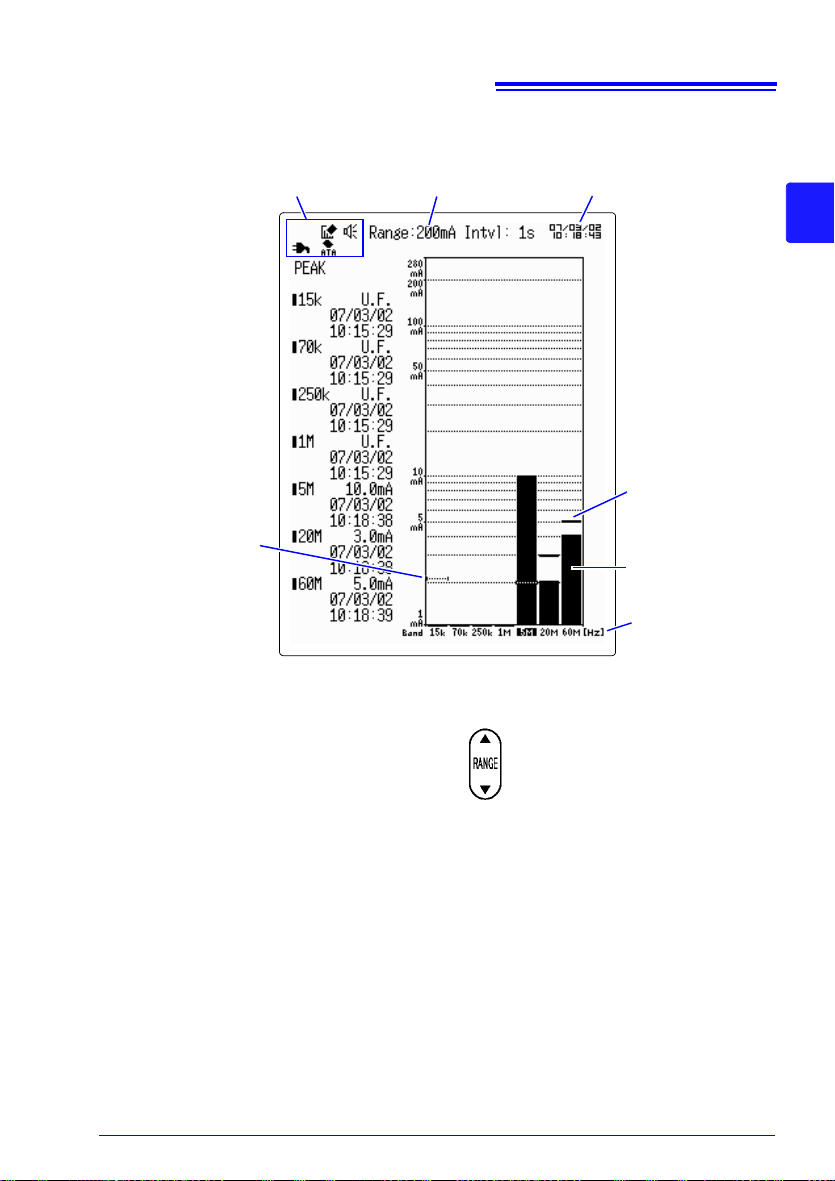
4.4 A/B Cursor Measurement
4.4 A/B Cursor Measurement
Measurement data at a particular position on a waveform can be read using the A-B cursors. The A-B cursor operations are available while measuring.
For the values read by the A and B cursors, values outside the measur ement r ange are d isplayed as "O.F." or "U.F."
1. Press and switch the position to [CSR A] or [CSR B].
2. Press to move the cursor and read the measurement values.
4
Chapter 4 Useful Functions
(When the alarm function is ON)
Page 62

56
(Logging screen shown here)
4.5 Using the Alarm Function
4.5 Using the Alarm Function
If the measurement values at each individual band exceed the alarm judgment values, the
following actions are taken as notification.
• The alarm state notification icon is displayed on the screen.
• The alarm sound sounds
• A signal is output via the TRIG OUT terminal (LOW active)
• An email is sent to computer or cellular phone (only available during logging measurement)
Refer to the "Communications" instruction manual on the included CD.
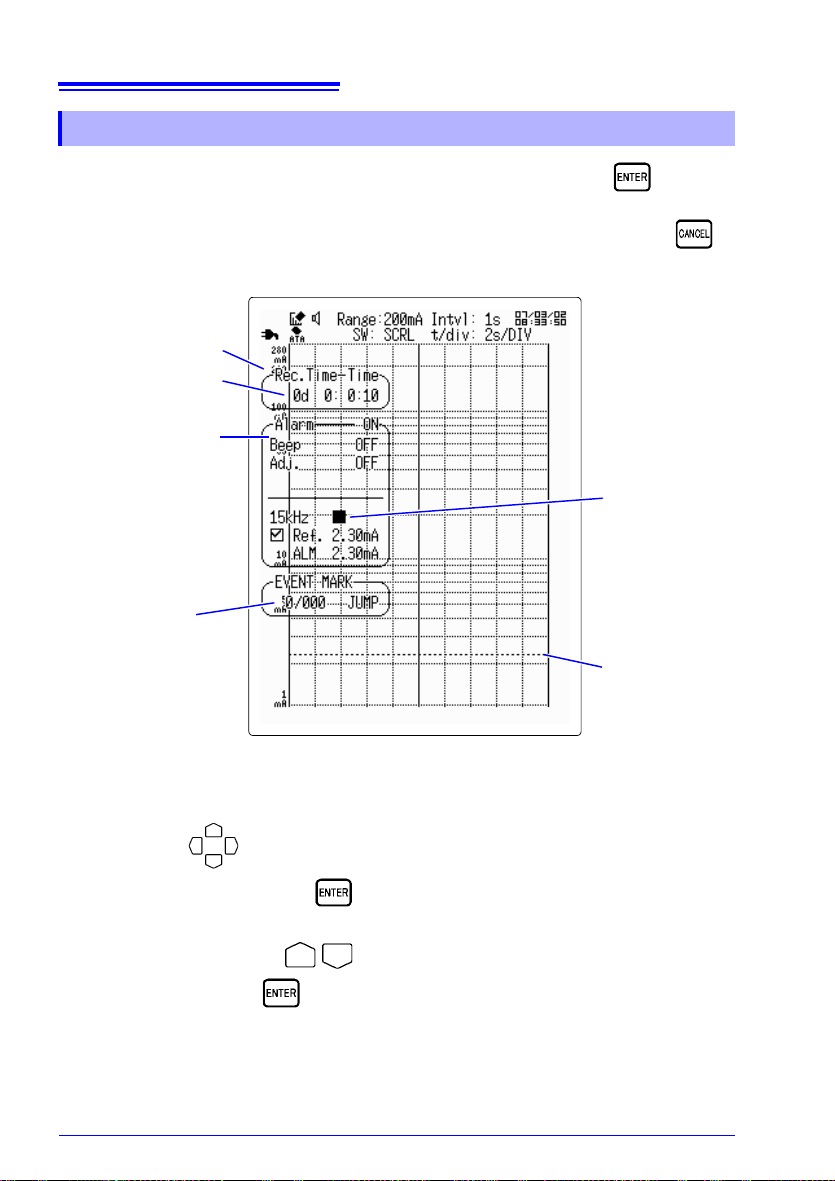
4.5.1 Settings on the Logging Screen or the Monitor Screen.
1. Press to display the submenu.
2. Press to move the blinking cursor to [Alarm], and press to open
the selection window.
3. Press / to select [ON], and press to set.
4. Press to move the blinking cursor to [Beep], and press to open the
selection window.
5. Press / to select the alarm sound as ON or OFF, then press to set.
6. Press / to select the band for which to set the alarm.
Page 63

57
The band for setting the alarm
: The instrument is not in alarm state.
: The instrument is in alarm state.
The time period when the alarm state occurred.
4.5 Using the Alarm Function
7. Press to move the blinking cursor to the reference value position, and
press to set it to ON.
8. Press to move the blinking cursor to the value position, and press to
open the selection window.
4
9. Press / to select the reference value, and to set.
If the compensation setting is OFF, then the reference value will be tre ated as the judgment
value. If the measured value exceeds the judgment value, the instrument en ters al arm state.
To compensate the reference value to calculate the judgment value, refer to the next page to
make the setting. To continue the state of alarm, set the alarm conti nue function to ON on
the Set up screen. (
p. 59)
Chapter 4 Useful Functions
10.When performing logging measurement, press to commence measure-
ment.
In the case of monitor measurement, press to display the monitor
screen.
• The alarm judgment takes place every recording interval during logging measurement, or every 100 ms during monitor measurement.
• During logging measurement, the alarm judgment takes place every
recording interval even if the monitor screen is displayed.
Page 64

58
Selectable
items
Explanations
ON
Judgment Value =
Reference Value x Gain + Offset
OFF
The reference value is the judgment value.
4.5 Using the Alarm Function
Set the compensation value
1. Press to move the blinking cursor to [Adj.], and press to open the
selection window.
2. Press / to select [ON], and press to set.
3. Press to move the blinking cursor to gain value, and press to
open the selection window.
4. Press / to select the gain value, and to set.
5. Press to move the blinking cursor to offset value, and press to
open the selection window.
6. Press / to select the offset value, and to set.
Page 65

59
Selectable
items
Explanations
ON
Turns the alarm function ON.
OFF Turns the alarm function OFF.
4.5 Using the Alarm Function
4.5.2 Setting on the Set Up Screen
1. Press to open the Set up screen.
2. Press to move the blinking cursor to [Alarm], and press to open
the selection window.
4
Chapter 4 Useful Functions
3. Press / to select [ON], and press to set.
Page 66

60
Selectable
items
Explanations
ON
If the measured value exceeds
the alarm judgment value, the
alarm state is continued.
OFF
The alarm state will not continue.
4.5 Using the Alarm Function
Set the time to continue the alarm
When alarm continue is set to ON, the alarm output continues even after one instance of
exceeding the alarm judgment value.
Alarm output is stopped by stopping measurement.
1. Press on the Set up screen to move the blinking cursor to [Hold], and
press to open the selection window.
2. Press / to select On or Off, and press to set.
To cancel, press .
Page 67

61
Selectable
items
Explanations
ON
When the measurement value
exceeds the alarm judgment
value, the alarm sound
sounds.
OFF
The alarm sound does not
sound.
4.5 Using the Alarm Function
Set the alarm sound
If the alarm sound is set to ON, when the alarm judgment value is exceeded the alarm
sound will be output from the instrument's internal speakers.
1. Press on the Set up screen to move the blinking cursor to [Beep], and
press to open the selection window.
4
Chapter 4 Useful Functions
2. Press / to select On or Off, and press to set.
To cancel, press .
• The alarm sound can be set via submenu from the logging screen or
the monitor screen. The submenu is displayed by pressing .
• As the Set up screen cannot be displayed during logging measurement, please set using the submenu.
Page 68

62
Input type Setting range
Current
28.0 A to 2.00 mA
Voltage
1.40 V to 100
V
4.5 Using the Alarm Function
Set the alarm reference value
This reference value is used as the alarm function judgment value. It will be used as is for
the alarm judgment value if the compensation function is OFF. If the compensation function
is ON, the compensated reference value will be the judgment value.
1. Press on the Set up screen to move the blinking cursor to the position
of the band for which to set the alarm.
2. Press to check.
3. Press to move the blinking cursor to reference value and press to
open the selection window.
4. Press / to select the reference value, and to set.
To cancel, press .
5. To set the alarm for other bands, repeat the above steps 1 through 4.
Alarm judgment will be performed only for the checked bands. Uncheck any bands for which
alarm judgment is not desired.
Page 69
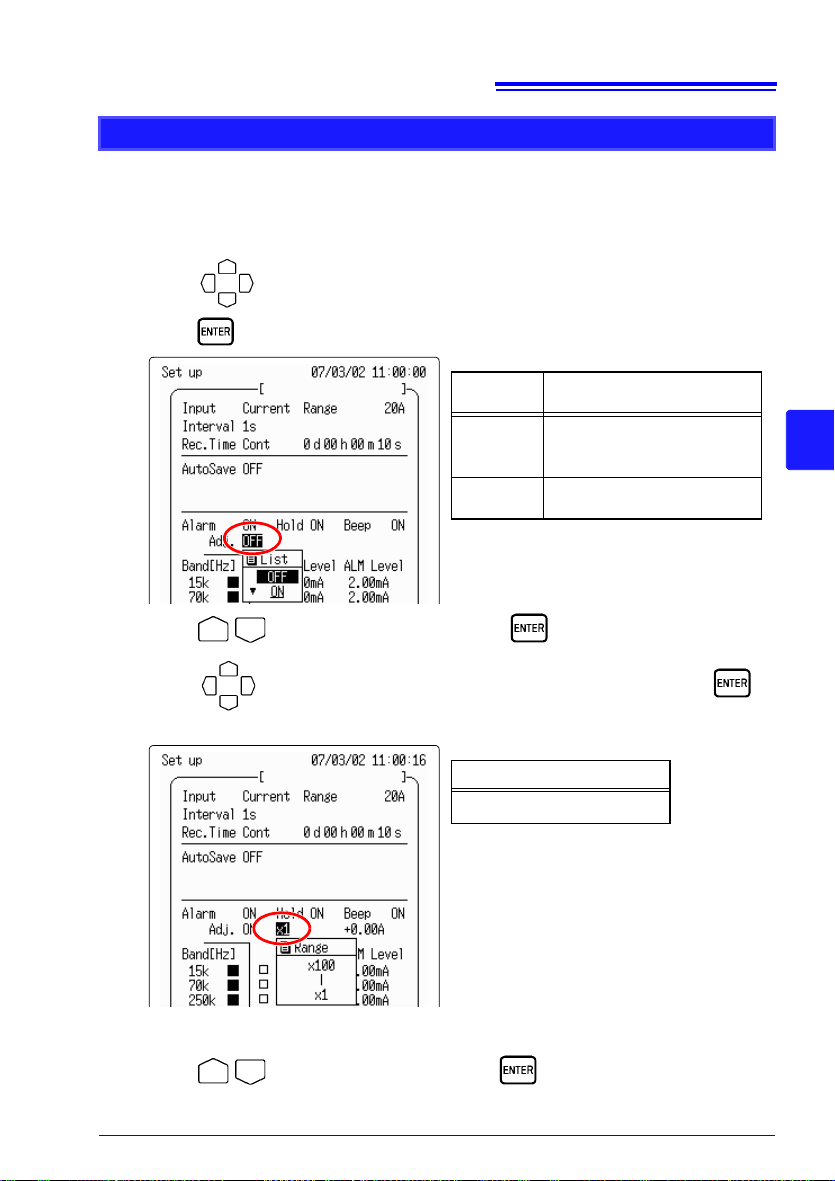
63
Selectable
items
Explanations
ON
Judgment Value =
Reference Value x Gain + Offset
OFF
The reference value is the
judgment value.
Setting range
×1 to ×100
4.5 Using the Alarm Function
Set the compensation value
To use the alarm reference value as the judgment value, set compensation to OFF. Alternatively, to calculate the judgment value by compensensating the reference value, turn
compensation ON and set the gain and offset.
1. Press on the Set up screen to move the blinking cursor to [Adj.], and
press to open the selection window.
4
Chapter 4 Useful Functions
2. Press / to select On or Off, and press to set.
3. Press to move the blinking cursor to gain value, and press to
open the selection window.
For example, selecting "x 3" will make the judgment value equal to three times the reference
value.
4. Press / to select the gain value, and to set.
Page 70

64
Setting range
0.00 A to 28.0 A
4.5 Using the Alarm Function
5. Press to move the blinking cursor to offset value, and press to
open the selection window.
6. Press / to select the offset value, and to set.
To cancel, press .
Page 71

65
(Monitor instantaneous screen shown here)
4.5 Using the Alarm Function
4.5.3 T ake the Alarm Reference Value
(Monitor Screen)
The monitor screen measurement value can be set to the alarm re ference value. If the input
value exceeds the alarm judgment value, the instrument enters alarm state.
1. Check that the copy key function on the System Env screen is set to "Alarm
capture". ( p. 116)
2. Press to take the current measurement value as the reference value.
Press to take the maximum value (peak bar value) as the reference
value.
4
Chapter 4 Useful Functions
3. Press to display the confirmation message, then press to set.
If the input value exceeds the judgment value, the instrument enters alarm sta te.
Page 72

66
Each event mark is given a number in
the order by which it is marked.
EXT TRIG Terminal (External Trigger)
4.6 Adding Event Marks to Waveforms
4.6 Adding Event Marks to Waveforms
By using the event mark function, an event mark can be added to any data during measurement (up to 100 marks maximum). Event marks can also be searched.
4.6.1 How to Add an Event Mark
1. Press to commence logging measurement.
2. Press to add an event mark at the desired moment.
Adding an event mark via external signal input
Event marks can be added by inputting an external signal into the EXT
TRIG input on the lower face of the 3145-20. To do this, set the external
trigger input on the System Env screen to "Event".
Refer to "7.1.5 External Trigger Input (Event Marker)" ( p. 114) and
"Appendix 2.1 EXT TRIG Terminal" ( p. A2).
Page 73

4.6 Adding Event Marks to Waveforms
4.6.2 Searching Event Marks
Each event mark can be searched.
1. Press to display the submenu.
2. Press to move the blinking cursor to the event number, and press
to open the selection window.
3. Press / to select the event number, and to set.
67
4
Chapter 4 Useful Functions
4. Press to move the blinking cursor to [Jump], and to search for the
event number.
Page 74
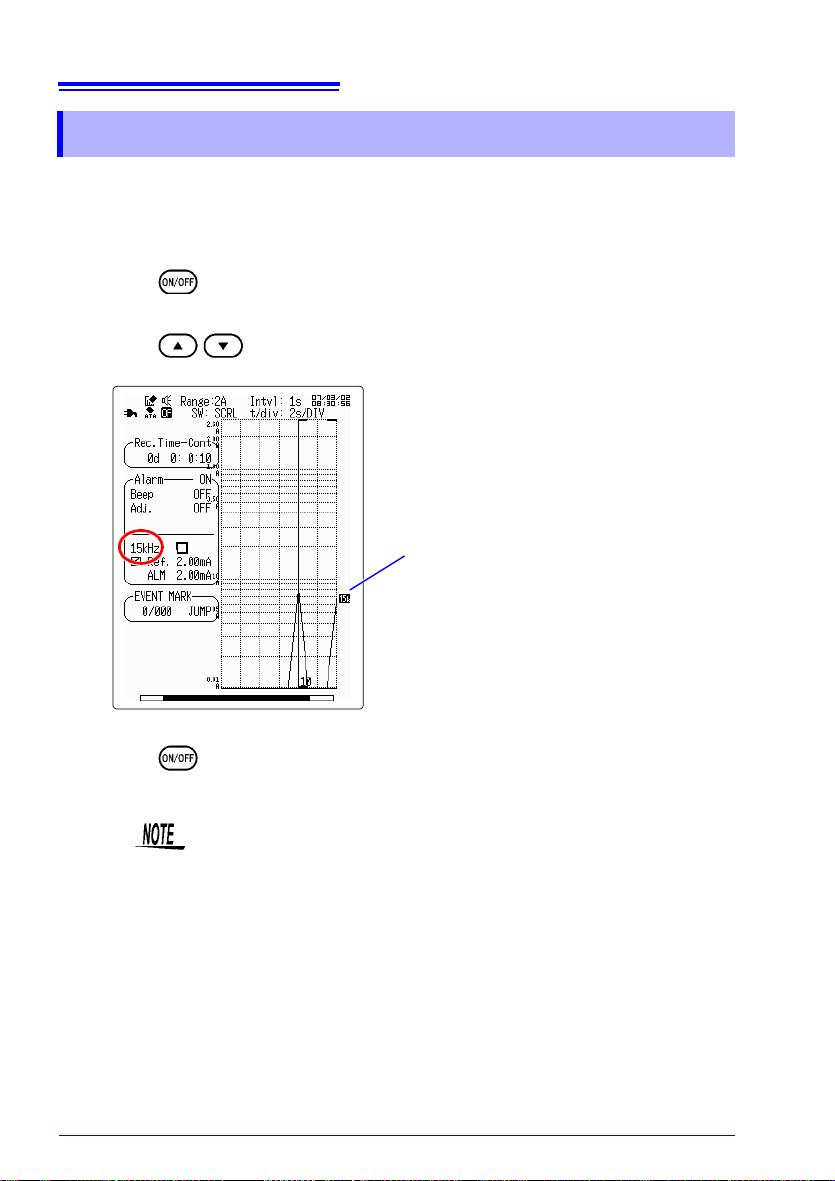
68
The highlight band
The color of all bands other than the selected
band becomes gray.
4.7 Highlighting a Specific Band
4.7 Highlighting a Specific Band
In order to more easily view a specific band, all bands other than the selected one are displayed as gray.
1. Press to enter highlighting display.
2. Press / to select the band to be highlight.
3. Press again to return the display to normal.
• When displaying the A/B cursors, only the highlight band value will be
displayed.
• This function is only valid when the screen color scheme is set to color
1 or 2.
Page 75

69
Press simultaneously for
approximately 3 seconds
or more.
4.8 Preventing Malfunctions (Key Lock)
4.8 Preventing Malfunctions (Key Lock)
This feature disables input from all of the 3145-20's front panel keys. It prevents malfunctions during measurement.
1. Press and simultaneously for approximately 3 or more seconds to place
the instrument in key lock mode.
On the logging screen and the monitor screen, [KEY LOCK] is displayed in the upper left.
4
Chapter 4 Useful Functions
On screens other than the logging screen and monitor screen , [KEY LOCK] is displayed at
the bottom of the screen.
2. To cancel Key Lock, press and again for approximately 3 seconds or
more.
Page 76

70
4.9 Saving the Display Screen to PC Card (Screen Capture)
4.9 Saving the Display Screen to PC Card
(Screen Capture)
The display screen can be saved to PC card.
1. Check that a PC card is inserted into the 3145-20.
2. Display the screen to be saved.
To save the monitor screen, set the copy key in the System Env screen to [Screen capture].
The initial setting is [Alarm capture]. (
p. 116)
3. Press .
The display screen is saved to the PC card.
4. Press to check the saved file.
• The color for saving the screen (color or grayscale) can be changed
on the System Env screen.
• The saved file cannot be read by the 3145-20.
Page 77

Setting the Measurement
Waveform color
(
p. 79)
Press this key to open the Set up screen.
Current range
/Voltage range
(
p. 75)
Comment
(
p. 72)
Input (
p. 74)
Interval (
p. 76)
Rec. Time (
p. 77)
Clock (setting can be
changed with the System
Init screen)
On the logging screen or the monitor
screen, pressing will display the
submenu for setting the measurement
conditions.
Submenu
Alarm function
(
p. 56)
Auto Save
(
p. 82)
71
The following measurement conditions can be set with the Set up screen.
Conditions
Chapter 5
5
Chapter 5 Setting the Measurement Conditions
Page 78

72
Comment input area
Character selection area
Explanation of shortcut keys
Comment input position
5.1 Inputting Comments
5.1 Inputting Comments
By inputting comments, they will be saved along with the logging measurement data onto
the PC card. It can be useful to enter information such as the measurement location.
Set the comments only as deemed necessary. Measurement will not be effected even if no
comments are entered.
1. Press to open the Set up screen.
2. Press to move the blinking cursor to the comment input position.
3. Press to open the comment input window.
4. Press to move the cursor to the character to be input, and press to
select.
To erase a character, press .
Refer to the following page for more a detailed explanation of the input method.
5. Once the comment is completely entered, press to move the blinking
cursor to [OK].
6. Press to confirm the comment.
To cancel, move the blinking cursor to [CANCEL] and press .
Page 79

5.1.1 Comment Input Method Details
Comment input area
Move the cursor to the beginning:
Move the cursor to the end:
Move the cursor one space to the left or
right:
Character selection area
Move the cursor:
Character input:
(1) (2)
(3)
(4)
(5) (6)
Comment input window
73
5.1 Inputting Comments
When the cursor is moved to (1) - (7) in the comment input window and is pressed,
the following actions take place. Alternatively, the shortcut keys effect the same actions.
However these are only valid within the comment input window.
Action Description
(1) Write mode
(2) Delete Erases the character at the cursor.
(3) Backspace
(4) Move input position
(5) Cancel
(6) Confirm Confirms the comment input.
Can be toggled between [INS] and [OVER] (Overwrite).
Erases the character one space to the left of the cursor.
When the cursor is at the first character, backspace
acts the same as delet e.
Moves the input position to the right or le ft within the
comment input window.
Returns to the Set up screen from the comment input
window.
Shortcut key
--
--
5
Chapter 5 Setting the Measurement Conditions
Page 80

74
Selectable
items
Explanations
Current
Select when using the 9754
CLAMP ON NOISE SENSOR
for measurement.
Voltage
Select when using products
other than the 9754 CLAMP
ON NOISE SENSOR for measurement.
5.2 Setting the Input Type
5.2 Setting the Input Type
Depending on the type of object being measured, you can choose between [Current] and
[Voltage] (general purpose) input. Select [Voltage] for using general purpose input, such as
measuring radiant noise from antennae or measuring noise with a magnetic field probe.
1. Press to open the Set up screen.
2. Press to move the blinking cursor to [Input], and press to open
the selection window.
3. Press / to select the input type, and to set.
To cancel, press .
Page 81

75
As a general rule, select 200mA for communications , 2A for power supply and 20A
for lightning surge noise measurement.
Input type Selectable ranges
Current
20 A, 2 A, 200 mA
Voltage 1 V, 100 mV, 10 mV
5.3 Setting the Range
5.3 Setting the Range
Set the current (or voltage) range. The possible measurement range differs depending on
the selected range.
Refer to "9.2 Input Area Specifications" ( p. 140) regarding the instrument's ran ge configuration and measurement range. If the input value exceeds the measurement value, "O.F."
(Overflow) will be displayed. Alternatively, if the input value is too low for the measurement
range, "U.F." (Underflow) will be displayed.
1. Press to open the Set up screen.
2. Press to move the blinking cursor to [Current Range] (Voltage Range),
and press to open the selection window.
5
Chapter 5 Setting the Measurement Conditions
3. Press / to select the range, and to set.
To cancel, press .
Page 82

76
Recording interval
1s, 2s, 5s, 10s, 20s, 30s, 60s
5.4 Setting the Recording Interval
5.4 Setting the Recording Interval
Sets the interval between each time data is taken. Please select a recording interval which
suits the object being measured. Increasing the recording interval causes the maximum
recording time to be increased. Regarding the maximum recording time, refer to "The relationship between recording interval and maximum recording time"( p. 78)."
1. Press to open the Set up screen.
2. Press to move the blinking cursor to [Interval], and press to open
the selection window.
3. Press / to select the recording interval, and to set.
To cancel, press .
Page 83

77
Selectable
items
Explanations
Time
The recording time can be set
to any value.
Cont
Continuous measurement
between the start of measure-
ment and pressing twice
can be performed.
5.5 Setting the Recording Time
5.5 Setting the Recording Time
Sets the amount of time to record a single logging measurement. The recording time is limited based on the recording interval.
1. Press to open the Set up screen.
2. Press to move the blinking cursor to [Rec. Time], and press to
open the selection window.
5
Chapter 5 Setting the Measurement Conditions
3. Press / to select the recording time, and to set.
To cancel, press .
Page 84

78
Selectable
items
Explanations
Day
0 to 970
Hour 0 to 23
Minute 0 to 59
Second 0 to 59
5.5 Setting the Recording Time
4. If set to [Time], continue on to set the recording time.
Press to move the blinking cursor to the time to be set, and press to
open the selection window.
5. Press / to select the recording time, and to set.
To cancel, press .
• When "Continuous" is selected, the recording time setting will be
ignored.
• When auto saving measurement data to PC card, if the measurement
data exceeds the maximum recording time, please set to
tinuous).
• If the measurement time exceeds the maximum recording time, the
internal memory will be erased starting with the oldest data.
The relationship between recording interval and maximum recording time
Recording interval Maximum recording time (32 MB internal memory)
1s 16 days 4 hours 21 minutes 41 seconds
2s 32 days 8 hours 43 minutes 22 seconds
5s 80 days 21 hours 48 minutes 25 seconds
10s 161 days 19 hours 36 minutes 50 seconds
20s 323 days 15 hours 13 minutes 40 seconds
30s 485 days 10 hours 50 minutes 30 seconds
60s 970 days 21 hours 41 minutes 0 seconds
[Cont] (Con-
Page 85

5.6 Setting the Waveform Color
Selectable colors
Green, yellow, red, light blue, purple, blue
and white (For color display)
5.6 Setting the Waveform Color
Sets the waveform color for each band.
1. Press to open the Set up screen.
2. Press to move the blinking cursor to waveform, and press to open
the selection window.
79
5
Chapter 5 Setting the Measurement Conditions
3. Press / to select the waveform color, and to set.
To cancel, press .
Page 86

80
5.6 Setting the Waveform Color
Page 87

Saving and
No
Yes
Save during
measurement?
Set auto save on the Set up
screen to [3145 Form].
Format for saving?
Plan before
measurement to save?
Set auto save on the
Set up screen to [Text].
Save from the PC card screen
after measurement.
( p. 82)
(
p. 90)
(
p. 91)
Yes
No
3145-20 Format
Text Format
81
Reading Data
Logging measurement data and setting data can be saved to PC card to read by the 314520 NOISE HiLOGGER or by personal computer when needed.
• Insert the PC card beforehand. When using a newly purchased PC
card for the fist time, be sure to initialize it.
• The instrument's PC card can be externally accessed via FTP, but do
ot access and manipulate the files simultaneously with FTP or the
n
3145-20 and via telnet. This may cause unwanted file operations to
occur.
Chapter 6
( p. 38)
Saving measurement data
6
Chapter 6 Saving and Reading Data
Saving
formats
Setting data Data such as the range, recording time, and time axis data can be
3145 Form
Text
saved. As needed, the data can be loaded by the 3145-20 and measurement can repeatedly be performed under the same conditions. (File
extension: HNS)
Auto saves in binary format readable by the instrument and the "DATA VIEWER fo r 3145" software on
the included CD.
Auto saves in text format readable by personal computer spreadsheet programs. (Cannot be read by
the 3145-20.)
Explanations
File
extension
HNW
CSV
Page 88

82
Selectable
items
Explanations
OFF
Does not save data.
3145 Form
Auto saves in binary format
readable by the instrument and
the "DATA VIEWER for 3145"
software on the included CD.
Text
Auto saves in text format readable by personal computer
spreadsheet programs. (Cannot be read by the 3145-20.)
6.1 Saving Data during Measurement
6.1 Saving Data during Measurement
6.1.1 Select "3145 Form"
Set auto save on the Set up screen to [3145 Form] When measurement is commenced, the
data is automatically saved to the PC card.
1. Press to open the Set up screen.
2. Press to move the blinking cursor to [Auto Save], and press to
open the selection window.
3. Press / to select [3145 Form], and press to set.
To cancel, press .
• The data save interval is one minute.
• Data saved in the “3145 Form” is readable by the 3145-20 and the
"DATA VIEWER for 3145" software on the included CD.
• When using text format, save after measurement completion.
Page 89

83
6.1 Saving Data during Measurement
6.1.2 Filenames
By inputting a filename, auto save files will be saved with that name.
1. Press on the Set up screen to move the blinking cursor to the filename
location.
2. Press to open the filename input window.
6
Chapter 6 Saving and Reading Data
3. Press to move the cursor to the character to be input, and press to
select.
Press to erase a character.
Refer to "5.1 Inputting Comments" (
p. 72) regarding the input method.
4. Af ter completing the filename input, press / to move the cursor to [OK].
5. Press to confirm the filename.
To cancel, move the blinking cursor to [CANCEL] and press .
• Continually saving multiple times adds successive numbers to the filenames.
Example: 3145D, 3145D001, 3145D002, 3145D003...
• If a filename has not been entered, the filename will default to "NONAME".
Example: NONAME, NONAME01, NONAME02, NONAME03...
• Filenames using all 8 characters will appear as follows.
Example: ABCDEFGH, ABCDEFG1, ABCDEFG2, ABCDEFG3...
Page 90

84
Selectable
items
Explanations
Normal
Carrying out one measurement
creates one file.
Interval
The file is created by dividing
the data in a period of time
(Partition length) from the starting measurement.
Ref. Time
Set the reference time in 24
hours and create a file by dividing the data in a period of time
(Partition time) from the fixed
reference time.
6.1 Saving Data during Measurement
6.1.3 Save Mode
Normally, the save mode is set to "Normal", "Full".
1. Press on the Set up screen to move the blinking cursor to [File], and
press to open the selection window.
2. Use the up and down / arrow keys to select the method of wave mea-
surement, and press to set.
Normally, select "Normal".
When dividing a file per time and saving, select "Interval" or "Ref. Time".
Page 91

85
Partition length
8:30
9:30
10:30
11:30
12:30
13:30
14:30
15:30
7:30
(Starting measurement)
Segmental time
7:30
8:00 (Reference time)
10:00
11:00
12:00
13:00
14:00
15:00
9:00
(Starting measurement)
Selectable
items
Explanations
Full
If the PC card reaches full
capacity, the save will be canceled.
Endless
If the PC card reaches full
capacity, the earliest data in
the recording file is overwritten.
The latest data will be saved
up to the file capacity.
Delete
At the beginning or in the
midst of auto save if the available space on the PC card is
not sufficient, then the oldest
file in the folder currently being
saved to will be erased.
If it becomes impossible to
erase files, the state will
become the same as endless
save.
6.1 Saving Data during Measurement
<Example> Wave file
When selecting "Interval" and the partition length is 1 hour
When selecting "Ref. Time", reference time 8:00 and the partition length is 1 hour
3. Press to move the blinking cursor to the side, and to open the selec-
tion window.
6
4. Press / to select the PC card saving method, and press to set.
[Full] is normally selected.
Chapter 6 Saving and Reading Data
Page 92

86
Folder
The oldest data is overwritten with the new data, and measurement continues.
File being saved
Folder
The oldest file in the folder is erased. A new file is then created
and the data is saved.
File being saved
(New)
6.1 Saving Data during Measurement
<Example>
Behavior when the PC card reaches full capacity.
When [Endless] is selected
When [D
elete] is selected
The conditions for erase save are as follows.
• Only files in the same folder in which the auto save file is being saved
are deleted.
• Files with the extension ".HNW" are recognized as waveform files.
Even if a file with the ".HNW" extension is not a waveform file, it will be
recognized as one and may be deleted.
• The age of a file is determined by the file's time stamp (when it was
cre
ated).
• If there is only one or less recorded file in the folder, no file will be
erased. If the size of the file to be erased is too large relative to the
capacity of the PC card, it may not be able to be erased. As a general
rule, a single file should take up less than 1/4 the capacity of the PC
card.
• No more than 10,000 files may be referenced in a single folder. If that
num
ber is exceeded, the oldest file may be erased.
• When saving in segments, the instrument acts the same as if normal
non
-segmented auto save is executed multiple times. In other words,
out of a set of segmented files created from a single measurement,
the one created first will be erased.
Page 93

6.1 Saving Data during Measurement
Selectable
items
Explanations
Day 0 to 30
Hour 0 to 23
Minute 0 to 59
When selecting “Interval”
When selecting [Interval], the length of data to partition can be set.
1. Press to move the blinking cursor to [Length], and press to open
the selection window.
87
6
2. Press / to select the length of data to partition, and press to set.
To cancel, press .
Chapter 6 Saving and Reading Data
Page 94

88
Selectable items
1 min, 2 min, 5 min, 10 min, 15 min,
20 min, 30 min, 1 hour, 2 hour, 3 hour,
4 hour, 6 hour, 8 hour, 12 hour, 1 day
Selectable
items
Explanations
Hour 0 to 23
Minute 0 to 59
6.1 Saving Data during Measurement
When selecting “Ref. time”
When selecting [Ref. Time], set the length of the data partition and the reference time.
1. Press to move the blinking cursor to [Time], and press to open
the selection window.
2. Press / to select the length of the data partition, and press to set.
3. Press to move the blinking cursor to [Ref. Time], and press to open
the selection window.
4. Press / to select the reference time, and press to set.
To cancel, press .
Page 95

6.1 Saving Data during Measurement
6.1.4 Specify the File Save Target
The folder in which files are saved during auto save is set in the following manner.
1. Press to open the PC card screen.
2. Press / to select the folder to move to.
To move one folder up, select the ". ." folder.
89
3. Press to move to the folder. Each time the key is pressed, it toggles
between one level up and down.
4. Move to the logging screen and begin measurement.
The measurement data is auto saved to the set folder. If auto save is set to OFF, auto save
will not be performed.
• If the root folder is selected and there is a /LOGGER/ folder, files will
be saved in the /LOGGER/ folder. PC cards formatted with the 314520 contain a created /LOGGER/ folder. If there is no /LOGGER/ folder,
files will be saved to the root folder.
• The root folder has an upper limit to the number of files which can be
saved in it. When saving numerous files, please create new folders to
save them in.
• When a folder has been moved to in the PC card screen, that folder
becom
es the auto save destination.
6
Chapter 6 Saving and Reading Data
Page 96

90
Selectable
items
Explanations
OFF
Does not save data.
3145 Form
Auto saves in binary format
readable by the instrument and
the "DATA VIEWER for 3145"
software on the included CD.
Text
Auto saves in text format readable by personal computer
spreadsheet programs. (Cannot be read by the 3145-20.)
6.2 Planning to Save Text after Measurement
6.2 Planning to Save Text after Measurement
Set auto save to [Text] on the Set up screen. When measurement is completed, the data
remaining in the instrument's internal memory (32 MB) will be automatically saved to the
PC card. Data saved in the text format can be read by software such as personal computer
spreadsheet programs. (It cannot be read by the 3145-20.)
1. Press to open the Set up screen.
2. Press to move the blinking cursor to [Auto Save], and press to
open the selection window.
3. Press / to select [Text], and press to set.
To cancel, press .
4. Set the file name. ( p. 83)
5. Upon completion of logging measurement, the data is saved in text format to
the PC card.
Saving takes a bit of time. Take note that pressing while saving will interrupt and cancel the save.
• When the recording time is set to [Cont], the data remaining in the
instrument's internal memory is auto saved. When set to "Time", it
cannot be set to greater than the internal memory.
• If there is not sufficient space on the PC card, it will not be saved.
• The data which remains in the instrument (32MB of internal memory
capacity) differs depending on the recording interval setting. ( p. 78)
• During text format save, data at the time of a power outage is not
saved.
• Files saved in text format are comparatively larger than those saved in
“3145 Form”.
• Saving in “3145 Form” is recommended.
Page 97
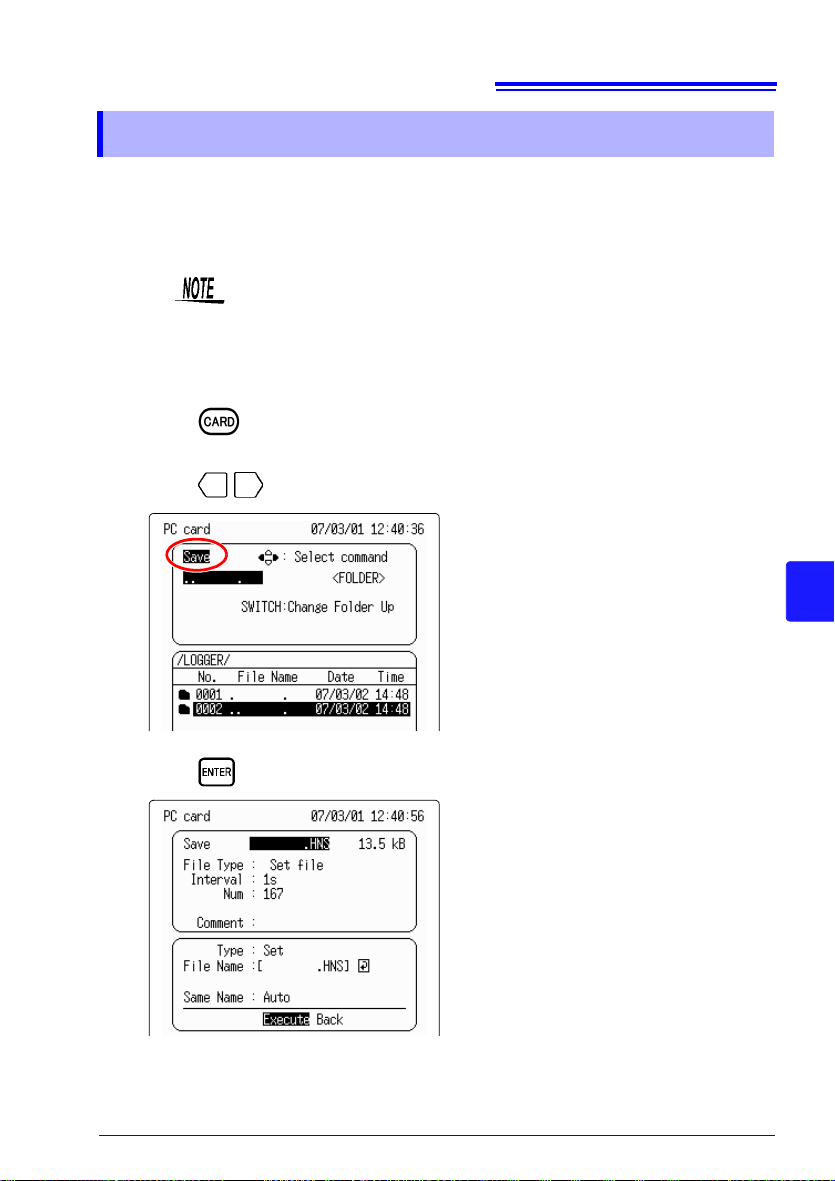
91
6.3 Saving Data after Measurement
6.3 Saving Data after Measurement
Saves measurement data and settings data to the PC card. In order to save measurement
data, it must be saved to the internal memory. (If measurement data is displayed on the logging screen, then the data exists in the internal memory.)
• Up to four settings data items can be stored in the 3145-20's internal
memory. Refer to
• For saving data during measurement, refer to "6.1 Saving Data during
Measurement" ( p. 82).
"7.2 Setting Screen" ( p. 122).
1. Press to open the PC card screen.
2. Press / to select the [Save] command.
6
3. Press to open the save screen.
Chapter 6 Saving and Reading Data
Page 98

92
Selectable
items
Explanations
3145 Form
Auto saves in binary format
readable by the instrument and
the "DATA VIEWER for 3145"
software on the included CD.
Set The settings are saved.
Te xt (for
Spread-
sheet)
Auto saves in text format readable by personal computer
spreadsheet programs. (Cannot be read by the 3145-20.)
Selectable
items
Explanations
ALL
Saves data for all captured
waveforms.
A-B
If only the A cursor is enabled,
data from the cursor to the end
of input is saved. If both A and
B cursors are enabled, only
data between the cursors is
saved.
6.3 Saving Data after Measurement
4. Press to move the blinking cursor to [Type], and press to open the
selection window.
5. Press / to select either [3145 Form] or [Text] (for spreadsheet), and
press to set.
6. Set the file name. ( p. 83)
7. Press to move the blinking cursor to [Area], and press to open the
selection window.
8. Press / to select [ALL] or [A-B].
Display the A and B cursors on the logging screen and specify the saving range first.
Page 99

93
Selectable
items
Explanations
Auto
This mode saves files with the
same name by automatically
appending a number after the
file name. If the last file was
saved with a number
appended, the next file is saved
with the number incremented.
<Example>
TEST0001, TEST0002 . . . . .
Overwrite
This mode saves files with the
same name, overwriting the
previous the same namefile.
6.3 Saving Data after Measurement
9. Press to move the blinking cursor to [Same Name], and press to
open the selection window.
10.Press / to select [Auto] or [Overwrite], and press to set.
11.Press to move the blinking cursor to [Execute] , and press to exe-
cute.
To cancel, move the blinking cursor to [Back] and press .
• When it is desired to view data which has been saved in [3145 Form]
with a personal computer, the "DATA VIEWER for 3145" software can
be used to easily view waveforms and convert the data to CSV file for
analysis in spreadsheet software. Refer to the "DATA VIEWER for
3145" instruction manual on the included CD.
• Refer to "6.7 Calculation Method for “3145 Form” Files" ( p. 106)
regarding the capacity of “3145 Form” files.
6
Chapter 6 Saving and Reading Data
Reference for calculating the approximate saving capacity in number of days
Recording interval
PC card (Capacity
af
ter initializing)
9726 PC CARD 128M
(120.4 MB)
Use the above chart as a reference for calculating the approximate saving capacity in number of days for the 9727 PC CARD 256M, 9728 PC CARD 512M, and 9729 PC CARD 1G.
However, the longest possible save time for a single measurement is 999 days, 23 hours,
59 minutes and 59 seconds.
1s 2s 5s 10s 20s 30s 60s
60 days 120 days 300 days 1.7 years 3.3 years 5 years 10 years
Page 100

94
6.4 Saving Settings Data
6.4 Saving Settings Data
Data such as the range, recording time, and time axis data can be saved. As needed, the
data can be loaded by the 3145-20 and measurement can repeatedly be performed under
the same conditions. (File extension: HNS)
Up to four settings data items can also be saved in the instrument's internal memory. Refer
to "7.2 Setting Screen" ( p. 122).
1. Press to open the PC card screen.
2. Press / to select the [Save] command.
3. Press to open the save screen.
 Loading...