

Page 1

Instruction Manual
3144-20
NOISE SEARCH TESTER
Aprio 2013 Revised edition 5 3144A981-05 13-04H
Page 2

Page 3

i
Contents
Contents
Introduction ...............................................................1
Inspection..................................................................1
Safety Notes .............................................................2
Operating Precautions..............................................5
Chapter 1 Overview 11
1.1 Product Overview......................................11
1.2 Features....................................................13
1.3 Names and Functions of Parts..................14
1.4 Quick Reference........................................21
Chapter 2 Measurement Preparations 25
2.1 Attaching the Strap....................................26
2.2 Installing the Batteries...............................27
2.3 Connecting the AC Adapter.......................29
2.4 Connecting the 9741 CLAMP ON
VOLTAGE SENSOR............................. .. ..30
2.4.1 Connecting the Sensor to the
Voltage Sensor Input Terminal.......30
2.4.2 Connecting the Instrument to the
Line being Measured......................32
2.5 Connecting Signals to the BNC Input
Terminal ....................................................34
2.6 Connecting to Ground...............................36
2.7 Turning the Power On/Off.........................38
2.8 Connecting the Earphone..........................40
2.9 Connecting Signals to the
Output Terminal.........................................41
Page 4

Contents
ii
Chapter 3 Setup and Measurement 43
3.1 Sample Measurement........................... .... 43
3.2 Monitoring Measurement Data [MONI] ..... 48
3.3 Recording Data [REC]............. ..................50
3.4 Deleting Memory ....................................... 53
3.5 Viewing Recorded Data [VIEW]................ 54
3.6 Setting Date and Time.............................. 55
Chapter 4 Analysis of Recorded Data 57
4.1 General.....................................................57
4.2 Installing Software Drivers ........................ 58
4.3 Installing PC Application Software............ 60
4.4 Setting the Clock ....................................... 61
4.5 Transferring Data to the PC...................... 63
4.6 Analyzing Recorded Data on the PC ........ 68
4.7 Saving Images of Waveform Windows ..... 75
4.8 Printing a Waveform Window....................76
4.9 Analyzing Saved Recorded Data with
Excel .........................................................78
4.10 Error Information.......................................79
Chapter 5 Specifications 83
5.1 Main Unit Specifications............................83
5.2 Clamp Specifications......... ... .....................90
Page 5

iii
Contents
Chapter 6 Maintenance and Service 93
6.1 Battery Replacement.................................93
6.2 Cleaning and Storage................................94
6.3 Repair and Servicing.................................94
6.4 Error Indications and Corrective Action.....95
6.5 System Mode.................................. ..........96
6.6 Instrument Disposal.................................101
Page 6

Contents
iv
Page 7

1
Introduction
Thank you for purchasing the HIOKI "Model 314420 NOISE SEARCH TESTER." To obtain maximum performance from the instrument, please
read this manual first, and keep it handy for future
reference.
Registered Trademarks:
Windows and Excel are registered trademarks of
Microsoft Corporation in the United States and/or
other countries.
Inspection
When you receive the instrument, inspect it carefully to ensure that no damage occurred during
shipping. In particular, check the accessories, panel
switches, and connectors. If damage is evident, or if
it fails to operate according to the specifications,
contact your dealer or Hioki representative.
Confirming package contents
• 9741 CLAMP ON VOLTAGE SENSOR..........1
• Instruction Manual..........................................1
• LR6 alkaline batteries.....................................6
• 9445-02 AC ADAPTER or
9445-03 AC ADAPTER..................................1
• PC software(CD-R) ........................................1
• USB cable......................................................1
• Earphone........................................................1
• Strap...............................................................1
• Carrying case.................................................1
Introduction
Page 8
Safety Notes
2
Safety Notes
This instrument is designed to comply with
IEC 61010 Safety Standards, and has been
thoroughly tested for safety prior to shipment. However, mishandling during use
could result in injury or death, as well as
damage to the instrument. Using the instrument in a way not described in this manual
may negate the provided safety features.
Be certain that you understand the instructions and precautions in the manual before
use. We disclaim any responsibility for accidents or injuries not resulting directly from
instrument defects.
This manual contains information and warnings
essential for safe operation of the instrument and
for maintaining it in safe operating condition.
Before using it, be sure to carefully read the following safety precautions.
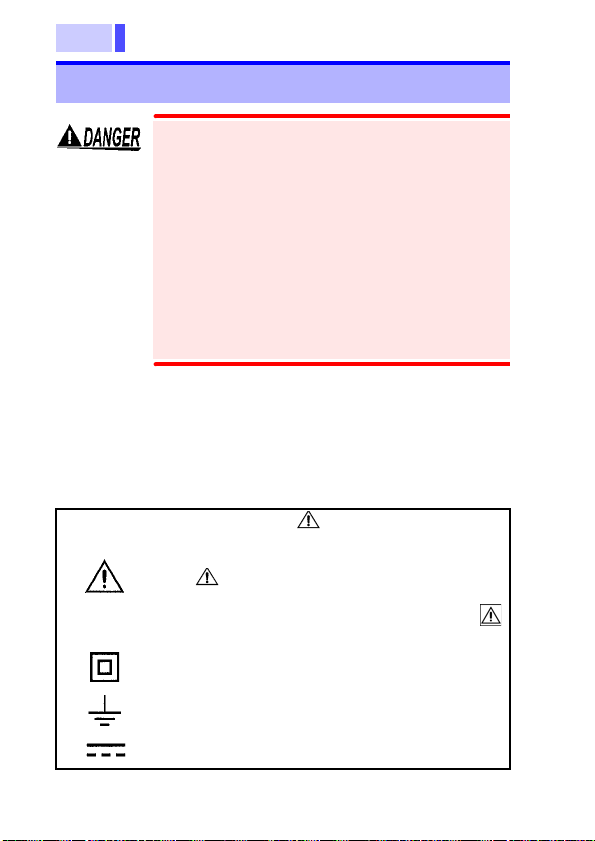
Safety Symbols
In the manual, the symbol indicates particularly important information that the user should
read before using the instrument.
The symbol printed on the instrument indicates that the user should refer to a correspond-
ing topic in the manual (marked with the
symbol) before using the relevant function.
Indicates a double-insulated device.(9741)
Indicates a grounding terminal.
Indicates DC (Direct Current).
Page 9
3
Safety Notes
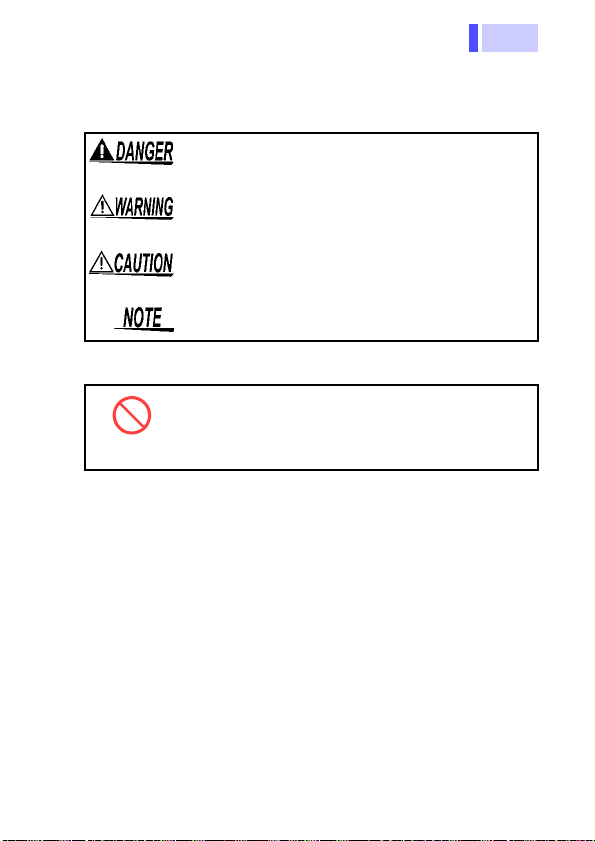
Symbols in Use
The following symbols in this manual indicate the
relative importance of cautions and warnings.
Indicates that incorrect operation presents an
extreme hazard that could result in serious injury
or death to the user.
Indicates that incorrect operation presents a significant hazard that could result in serious injury
or death to the user.
Indicates that incorrect operation presents a possibility of injury to the user or damage to the
instrument.
Indicates advisory items related to performance
or correct operation of the instrument.
Indicates the prohibited action.
Indicates the location of reference information.
Accuracy
We define measurement tolerances in terms of f.s.
(full scale) and rdg. (reading) with the following
meanings:
• f.s. (maximum display value or scale length)
The maximum displayable value or scale length.
This is usually the name of the currently selected
range.
• rdg. (reading, displayed or indicated value)
The value currently being measured and indicated on the measuring instrument.
Page 10
Safety Notes
4
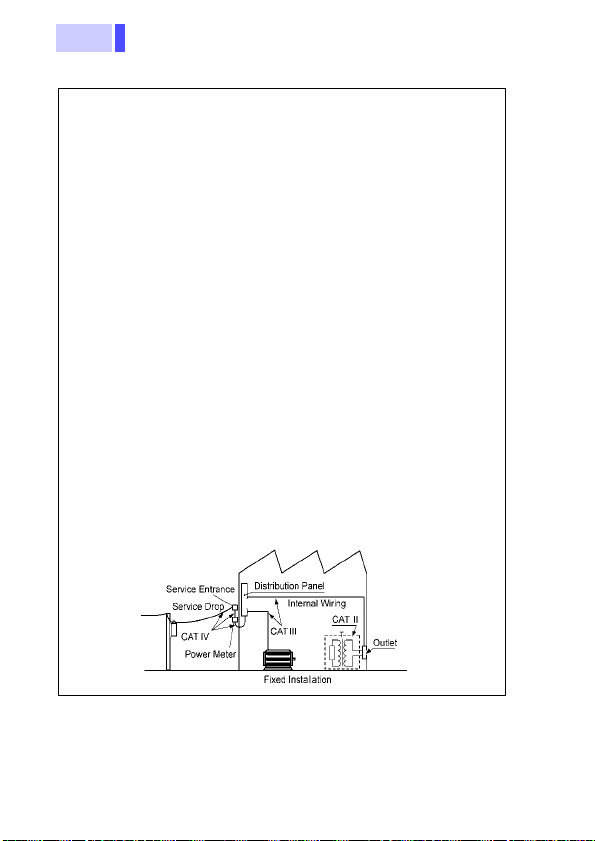
The 9741 CLAMP ON VOLTAGE SENSOR complies with
CAT III 200 V safety requirements.
To ensure safe operation of measurement instrument, IEC
61010 establishes safety standards for various electrical environments, categorized as CAT II to CAT IV, and called measurement categories.
CAT II Primary electrical circuits in equipment connected to
an AC electrical outlet by a power cord (portable
tools, household appliances, etc.)
CAT II covers directly measuring electrical outlet receptacles.
CAT III Primary electrical circuits of heavy equipment (fixed
installations) connected directly to the distribution
panel, and feeders from the distribution panel to outlets.
CAT IV The circuit from the service drop to the service en-
trance, and to the power meter and primary overcurrent protection device (distribution panel).
Using a measurement instrument in an environment designated with a higher-numbered category than that for which the instrument is rated could result in a severe accident, and must
be carefully avoided.
Use of a measurement instrument that is not CAT-rated in
CAT II to CAT IV measurement applications could result in a
severe accident, and must be carefully avoided.
Measurement categories
Page 11

5
Operating Precautions
Before Use
Installation, Operating Environment, and Handling
of the Instrument
Operating Precautions
Follow these precautions to ensure safe operation
and to obtain the full benefits of the various functions.
• Before using the instrument the first time, verify
that it operates normally to ensure that the no
damage occurred during storage or shipping. If
you find any damage, contact your dealer or
Hioki representative.
• Before using the instrument, make sure that the
insulation on the 9741 CLAMP ON VOLTAGE
SENSOR is undamaged and that no bare conductors are improperly exposed. Using the
instrument in such conditions could cause an
electric shock, so contact your dealer or Hioki
representative for repair.
• Do not allow the instrument to get wet, and
do not take measurements with wet hands.
This may cause an electric shock.
• Do not use the instrument where it may be
exposed to corrosive or combustible
gases. The instrument may be damaged or
cause an explosion.
Page 12

Operating Precautions
6
Operating Environment
Observe the following to avoid damage to
the instrument.
• Installation and Operating Environment
Between 0°C and 40°C; 80% RH or less;
indoors only.
• Do not store or use the instrument where it
could be exposed to direct sunlight, high
temperature or humidity, or condensation.
Under such conditions, the instrument may
be damaged and insulation may deteriorate so that it no longer meets specifications.
• This instrument is not designed to be
entirely water- or dust-proof. To avoid damage, do not use it in a wet or dusty environment.
• Do not use the instrument near a device
that generates a strong electromagnetic
field or electrostatic charge, as these may
cause erroneous measurements.
• To avoid damage to the instrument, protect
it from vibration or shock during transport
and handling, and be especially careful to
avoid dropping.
Page 13
7
Operating Precautions
Handling of Cables
• To avoid corrosion from battery leakage,
remove the batteries from the product if it
is to be stored for a long time.
• Adjustments and repairs should be made
only by technically qualified personnel.
• If the protective functions of the product
are damaged, either remove it from service
or mark it clearly so that others do not use
it inadvertently.
Accurate measurement may be impossible in the
presence of strong magnetic fields, such as near
transformers and high-current conductors, or in
the presence of strong electromagnetic fields such
as near radio transmitters.
• To avoid breaking the cables, do not bend or pull
them.
• Avoid stepping on or pinching cables, which
could damage the cable insulation.
Page 14

Operating Precautions
8
T erminals
• The instrument is provided with various
types of external connectors. When plugging cables into the connectors, be carefu l
not to misconnect.
• The voltage sensor input terminal of the
instrument is dedicated to the 9741
CLAMP ON VOLTAGE SENSOR. Be sure
to use the 9741 sensor specified by HIOKI.
Keep in mind that using any other type of
sensor may result in electric shock or malfunction.
• Note the following maximum input voltage
and maximum rated voltage to earth of the
BNC input terminal. If their voltages are
exceeded, this device will be damaged and
personal injury will result. Therefore, do
not perform measurement in this case.
Maximum input voltage: 5 V
PEAK
Maximum rated voltage to earth: 5 V
To protect against dirt and dust, always leave the
protective cover in place, unless using the terminals.
Page 15

9
Operating Precautions
Care and Handling of CD-R
• Always hold the disc by the edges, so as not to
make fingerprints on the disc or scratch the printing.
• Never touch the recorded side of the disc. Do not
place the disc directly on anything hard.
• Do not wet the disc with volatile alcohol or water,
as there is a possibility of the label printing disappearing.
• To write on the disc label surface, use a spiritbased felt pen. Do not use a ball-point pen or
hard-tipped pen, because there is a danger of
scratching the surface and corrupting the data.
Do not use adhesive labels.
• Do not expose the disc directly to the sun's rays,
or keep it in conditions of high temperature or
humidity, as there is a danger of warping, with
consequent loss of data.
• T o remove dirt, dust, or fingerprints from the disc,
wipe with a dry cloth, or use a CD cleaner.
Always wipe radially from the inside to the outside, and do no wipe with circular movements.
Never use abrasives or solvent cleaners.
• Hioki shall not be held liable for any problems
with a computer system that arises from the use
of this CD-R, or for any problem related to the
purchase of a Hioki product.
• In the interests of ongoing product developments, there may be minor discrepancies
between screen displays and the operating
instructions, and in the data conversion process.
• Hioki shall not be held liable for any problems
with a computer system that arises from the use
of this CD-R, or for any problem related to the
purchase of a Hioki product.
Page 16

Operating Precautions
10
Page 17

11
Chapter 1 Overview
Overview Chapter 1
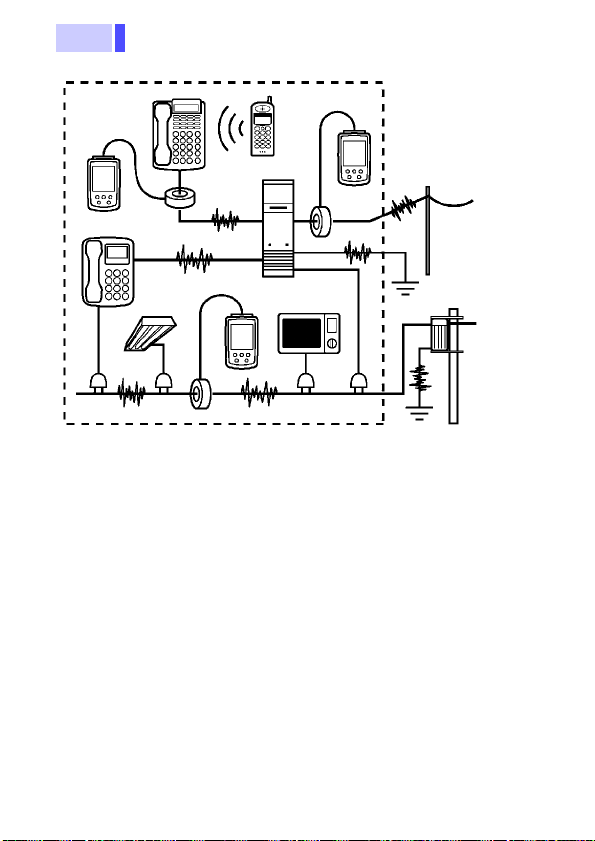
1.1 Product Overview
Noise is propagated through diverse routes such
as communication lines and power supply lines.
Many cases of trouble, including false operation
and malfunction caused by noise, are currently on
the rise. To avoid such trouble, it is essential to
identify the noise frequency bands and routes
through which noise enters, and to take appropriate corrective action.
The 3144-20 NOISE SEARCH TESTER can
search for noise frequency bands and routes of
penetration by simply clamping the 9741 CLAMP
ON VOLTAGE SENSOR to the line being measured.
Moreover, the logging function of the instrument
enables long-time monitoring. The USB interface
allows recorded data to be transferred to a PC,
displayed in graphs, and output to a printer.
Page 18
Chapter 1 Overview
12
Cell phone
Penetrates through
communication
lines
Penetrates through power
supply lines
Extension line
Lighting apparatus
Home appliances
Power supply
lines
Communication lines
Penetrates through
ground wires
Main unit
3144-20
Penetrates directly
Noise sources:
There are many noise sources, such as power
transmission lines, electric railways, inverter units,
and CB radios.
Penetration routes:
Some noise enters through communication lines,
power supply lines, and ground wires, while other
noise penetrates devices directly.
Propagation routes:
Noise is propagated through various routes,
including communication lines and power supply
lines.
The instrument can search for noise frequency
bands and penetration routes by simply attaching
the 9741 CLAMP ON VOLTAGE SENSOR.
Page 19

13
1.2 Features
Noncontact type of voltage sensor
Searches for noise in a system in operation, without affecting circuits currently in communication or
damaging cables.
Measuring frequency band range: 500 Hz
to 30 MHz
Covers a wide band ranging from noise on power
transmission lines to that of CB radios.
Noise indicated on a large-LCD level
meter
Indicates detected noise on a level meter, separately by frequency band.
PEAK HOLD function
Indicates the peak value in each frequency band
and the time measured.
Memory function for up to 64,000 items of
data
Records measurement data and measurement
times for up to 64,000 items of data.
Equipped with USB interface
Using the PC software supplied with the instrument enables the transfer of data to a PC, display
of time series data, and output to a printer.
Compatible with two different power
sources: Batteries and AC adapter
Applicable to field measurements, given its portability and long-time monitoring capability.
Handy type
A compact, lightweight noise measuring tool that
can be used just like a simple circuit-tester.
Chapter 1 Overview
Page 20
Chapter 1 Overview
14
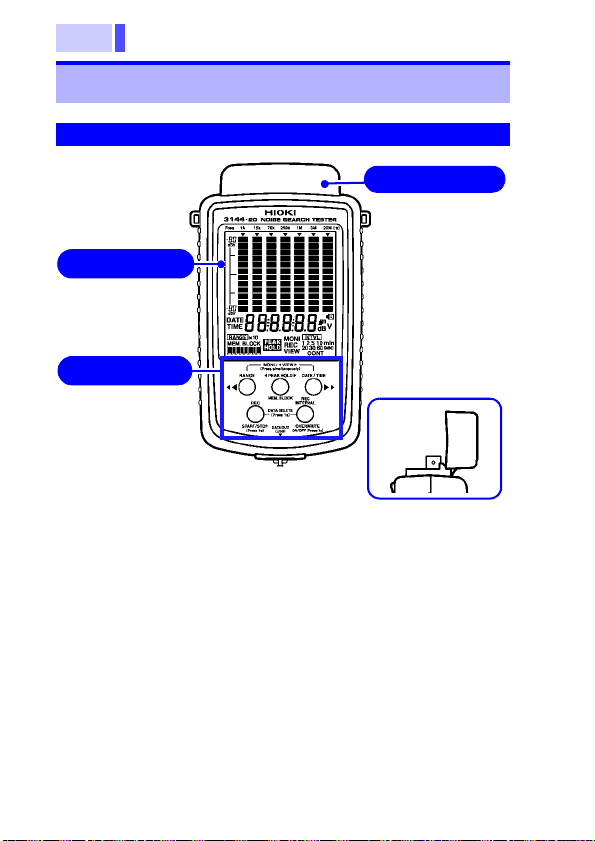
Front
page 17
Protective cover
for the voltage sensor input terminal,
BNC input terminal, and output terminal.
When not using
the instrument,
place the protective cover back in
place.
page 18
Protective cover
Operating keys
LCD display
Cover fastening method
when instrument in use
3144-20 NOISE SEARCH TESTER
1.3 Names and Functions of Parts
Page 21
15
Chapter 1 Overview
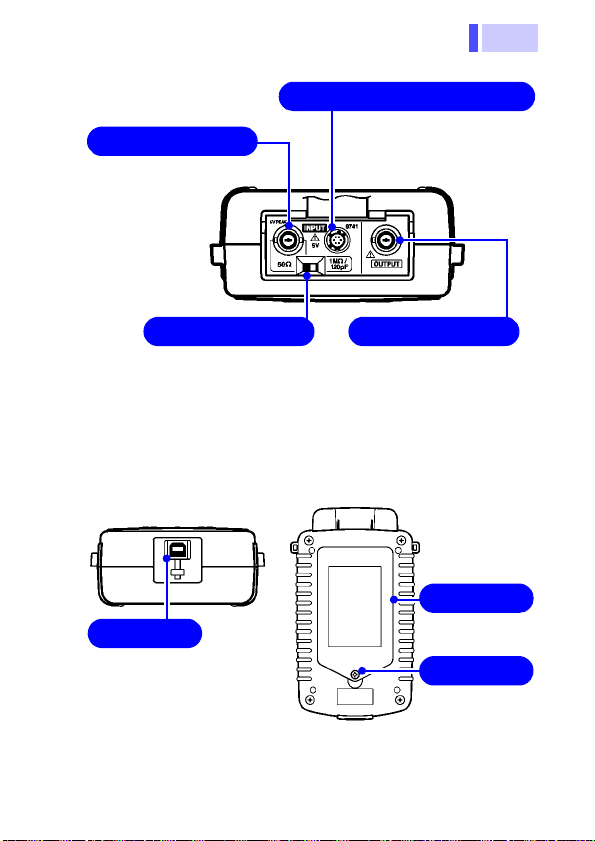
Top
Input terminal for
external signals,
excluding signals
from the 9741.
Effective when the
instrument is not
connected to the
9741.
page 34
Output terminal for waveforms applied to the voltage
sensor input terminal or
BNC input terminal.
page 41
Connect the supplied 9741
CLAMP ON VOLTAGE
SENSOR here.
page 30
Switch to select the input
impedance of the BNC input
terminal.
(50 /1 M approx. 120 pF
page 34
Voltage sensor input terminal
BNC input terminal
Output terminalSelector switch
Bottom Surface
Plug the USB cable in
this terminal.
Rear Side
USB terminal
Battery cover
Setscrew
Page 22

Chapter 1 Overview
16
Left Side
page 38
page 26
Right Side
Regulates the sound volume of the earphone.
Audible band monitoring
output terminal. Plug in the
earphone used to listen to
noise here.
page 40
Plug in the 9445-02 or 9445-03 AC
ADAPTER (supplied with the instrument) here.
Ground terminal for this instrument.
page 36
Protective cover
(when fastened)
Strap hole
POWER switch
Volume control knob
AC adapter connection terminal
Ground terminal
Earphone terminal
Page 23
17
Chapter 1 Overview
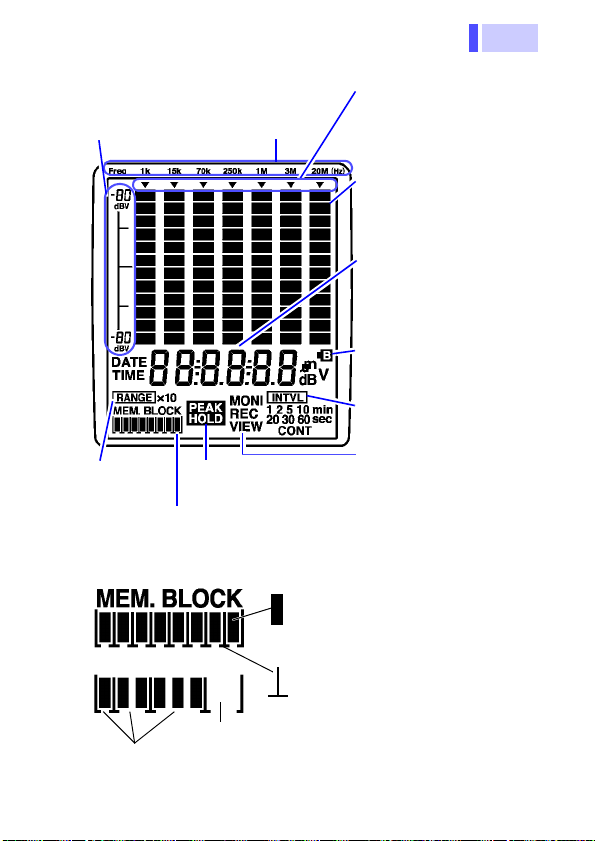
Frequency range
indication
Display Section
Scale indication
[In decibels (dBV)]
Indication of Memory Blocks
Remains on when the
PEAK HOLD function is
ON.
Indication of
measuring
range
Indicates the frequency
range at peak detection, with
the PEAK HOLD function
ON.
Level meter (indicates for
each frequency range in 12
steps).
Indicates when noise is detected.
Indicates the date and time,
with the PEAK HOLD function OFF.
Indicates the peak detection
time, with the PEAK HOLD
function ON.
Battery mark
(Lights when the supply voltage drops below 6.5 V.)
Indication of recording time
interval
MONI: Remains on during
monitoring.
REC: Remains on during
recording.
VIEW: Remains on during
display of recorded
data.
Blocks (Storage units of recorded
data)
One block can hold up to 8,000
items of data.
Indicates the delimiter of files, with
each file covering the start to the
end of a recording. A file consists
of one to eight blocks, depending
on the number of data items recorded.
Empty blocks
Blocks occupied
by files
Indication of Memory Blocks
Page 24
Chapter 1 Overview
18
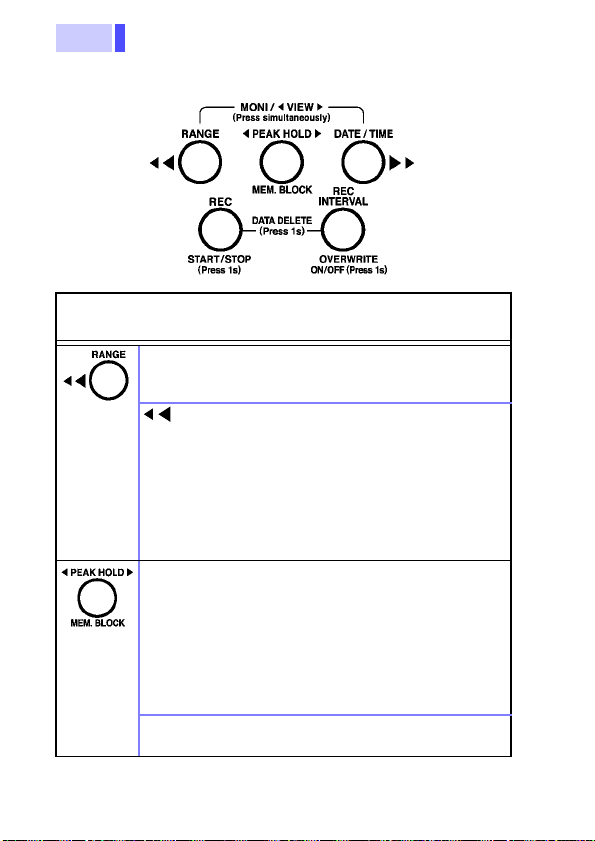
Operation Keys
Key
Press for 1 sec.
RANGE key
key
PEAK HOLD
key
MEM.BLOCK
key
(The functions of keys vary, depending on
the settings made.)
Selects the measuring range (on the
monitoring screen [MONI] with the
PEAK HOLD function OFF.)
Selects the frequency range corresponding to the peak detection time to
be indicated (with the PEAK HOLD
function ON).
Scrolls recorded data (on the data view
screen [VIEW]).
Sets the date and time (in date and
time setup). (Values DOWN)
Sets the PEAK HOLD function on and
off (on the monitoring screen [MONI] or
recording screen [REC]).
Each pressing of this key shifts flashing to the setting position in order of
Year Month Day Hour
Minute Second (in date and time
setup).
Explanation
Defines the settings of date and time.
Selects the memory block (on the data
view screen [VIEW]).
Page 25
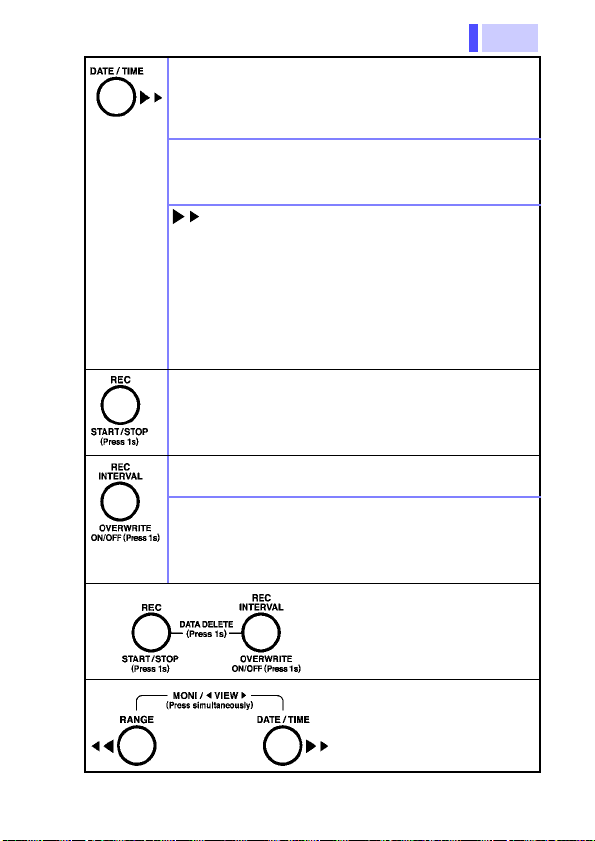
19
DATE/TIME
key
DATE/TIME
key
Press for 1
sec.
key
REC key
Press for 1
sec.
Chapter 1 Overview
Switches the current indication to a
date or time (on the monitoring screen
[MONI] with the PEAK HOLD function
OFF).
Enables date and time setup.
Selects the frequency range corresponding to the peak detection time to
be indicated (with the PEAK HOLD
function ON).
Scrolls recorded data (on the data view
screen [VIEW]).
Sets the date and time (in date and
time setup). (Values UP)
Starts or stops recording.
(Starts on the monitoring screen [MONI]).
(Stops on the recording screen [REC]).
REC INTERVAL key
OVERWRITE ON/
OFF key
Press for 1
sec.
Sets the recording interval (on the
monitoring screen [MONI]).
Switches between Automatic Stopping
Mode and Overwrite Recording Mode
for recording (on the monitoring screen
[MONI]).
Deletes all recorded data
(on the monitoring screen
[MONI] or data view screen
[VIEW]). (When pressed for
1 sec.)
Switches between monitoring screen [MONI] and data
view screen [VIEW] (when
pressed simultaneously).
Page 26
Chapter 1 Overview
20
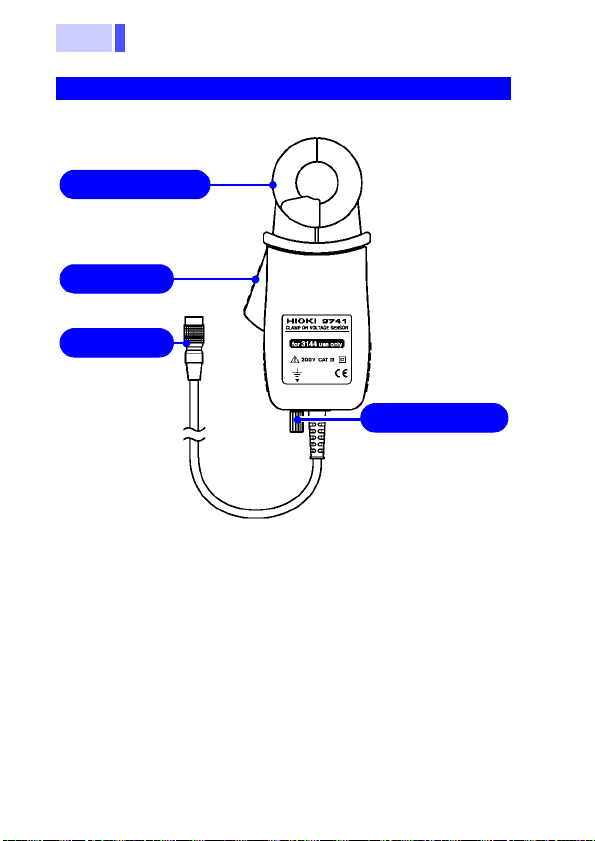
9741 CLAMP ON VOLTAGE SENSOR
Clamp section
Connector
Lever
page 36
page 30
page 32
Pressing the lever
opens the clamp
section.
Ground terminal
Page 27
21
Date indication
Time indication
DATE
TIME
To cancel: Press any key
other than the above.
Press for
1 sec.
Value setting
DOWN UP
Shifts to setting position
(Year
Month Day
Hour Minute
Second)
End of setup.
The setting position
flashes.
Set the value
at the flashing
position.
Each pressing of the
key changes the indication.
Chapter 1 Overview
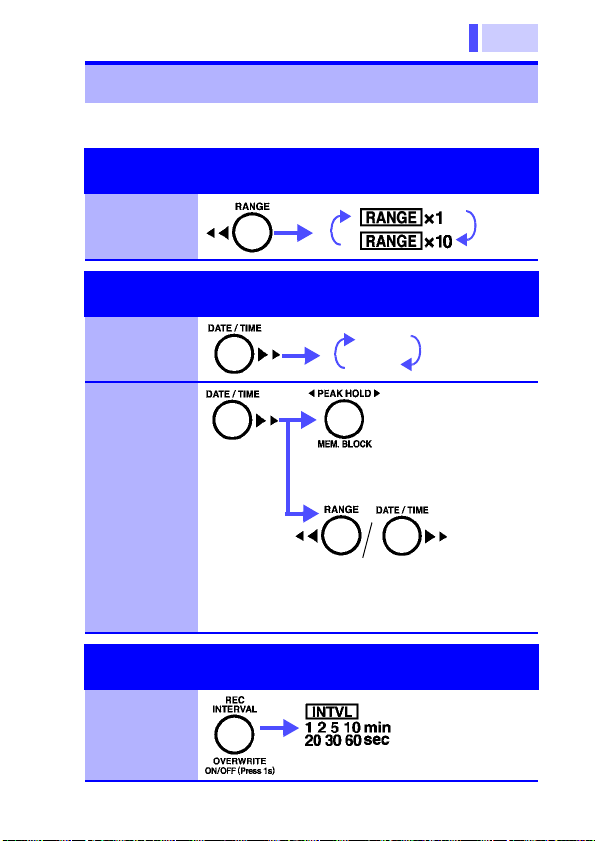
1.4 Quick Reference
[MONI]: Monitoring screen/ [REC]: Recording screen/
[VIEW]: Data view screen
Measuring Range
(On [MONI] with the PEAK HOLD function OFF)
Switching of
range
Date and Time Indication
(On [MONI] with the PEAK HOLD function OFF)
Switching of
indication
Change of
settings
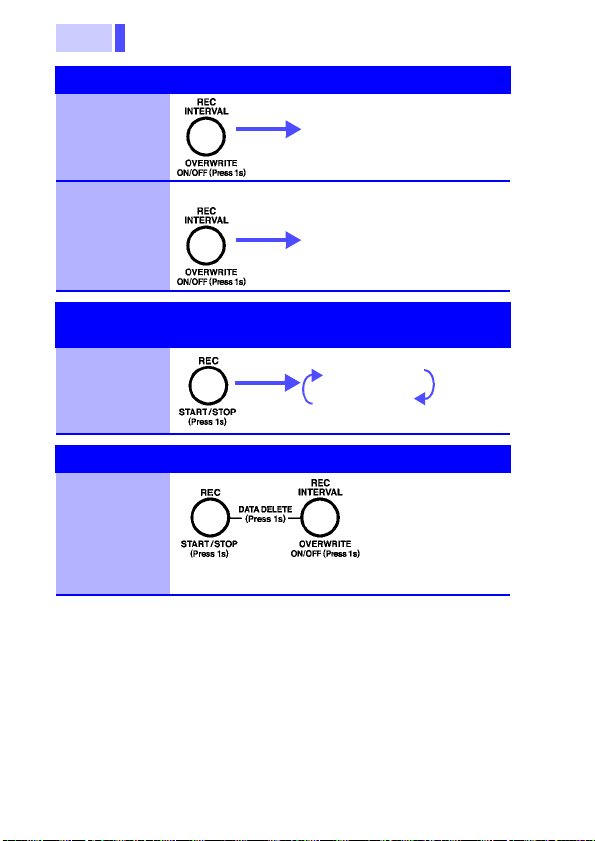
Recording Interval
(On [MONI])
Change of
settings
Page 28
Chapter 1 Overview
22
CONT
Lights.
When memory becomes full, new data is
written over old data to
continue recording.
Press for
1 sec.
remains on.)
(CONT
Goes off.
When memory becomes full, recording
stops automatically.
Press for
1 sec.
CONT
REC
MONI
Recording is started.
Recording is stopped.
Lights.
Lights.
Press for
1 sec.
Press for 1 sec simultaneously.
All recorded data is
deleted.
Data Saving Method (On [MONI])
Save by
overwriting
Save without
overwriting
Start and Stop of Measurement
(Start on [MONI], Stop on [REC])
Start and
stop of measurement
Data deletion (On [MONI] or [VIEW])
Deletion
(Batch dele-
tion)
Page 29
23
Chapter 1 Overview
Lights.
Shifts to
the left.
Shifts to
the right.
Indicates the peak value of
the range in which is
lighting, and the detection
time.
Goes off.
Press simultaneously
MONI
VIEW
Lights.
Lights.
Monitoring screen [MONI]
Data view screen [VIEW]
Allows monitoring recorded data.
Each pressing of the key
switches the
blocks.
123
Back
Forward
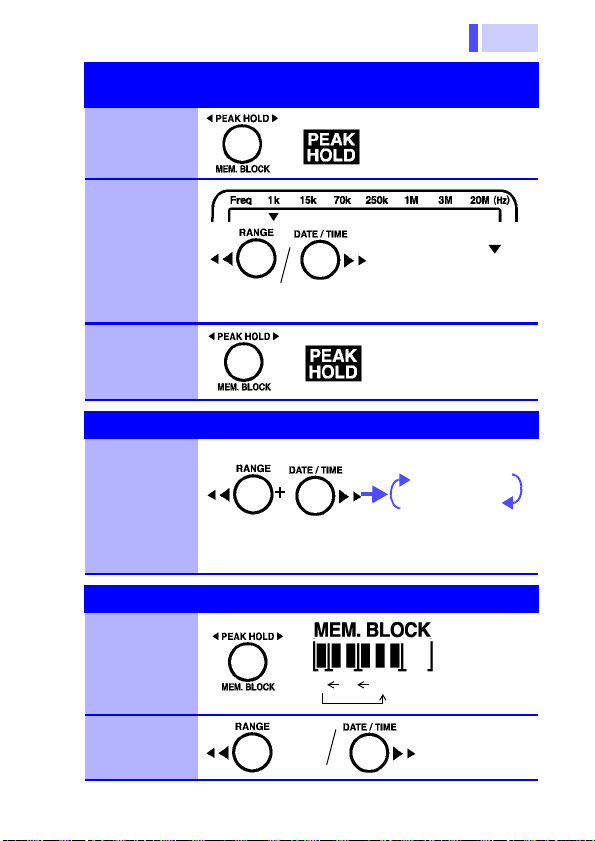
Peak Value Indication (PEAK HOLD function)
(On [MONI] or [REC])
Activating
the PEAK
HOLD function
Selecting the
frequency
range to be
indicated
(Effective only
with PEAK
HOLD ON)
Deactivating
the function
Switching of Screens
Switching
between
monitoring
screen
[MONI] and
data view
screen
[VIEW]
Viewing of Recorded Data (On [VIEW])
Selecting the
memory
block
Scrolling the
data
Page 30

Chapter 1 Overview
24
Page 31

25
Chapter 2 Measurement Preparations
Connect to the
output terminal.
page 41
Attach the strap.
page 26
1 Install the batteries.
page 27
2 Connect the AC
adapter.
page 29
3 Connect the 9741.
page 30
4 Turn on the POWER
switch.
page 38
Rear side
Attach the
earphone.
page 40
Connect to ground.
page 36
Connect the USB cable.
Connect to the BNC
input terminal.
page 34
Measurement
Preparations
Please read the "Operating Precautions" (page 5) before setting
up this instrument.
Chapter 2
Page 32

Chapter 2 Measurement Preparations
26
Tighten the strap sufficiently to prevent loosening or twisting.
3144-20
Attach the two rings of the
strap to the respective locations in the 3144-20.
2.1 Attaching the Strap
Use the strap to carry the instrument, or to hang it
up at the installation location.
Attach both ends of the strap securely to the
instrument. If insecurely attached, the instrument
may fall and be damaged when carrying.
Page 33

27
Chapter 2 Measurement Preparations
2.2 Installing the Batteries
The instrument operates on battery power or AC
through the adapter. When using the AC adapter
and batteries together, AC adapter power is
employed.
When powering the instrument using the batteries,
the operating time is as follows:
About five hours when indications are shown on
the monitoring screen [MONI]
(Ambient temperature: 23°C, reference value)
The operating time varies depending on the ambient temperature and type of batteries used.
Do not mix old and new batteries, or different
types of batteries. Also, be careful to obse rve
battery polarity during installation. Otherwise,
poor performance or damage from battery
leakage could result.
• Do not use other than the specified type of batteries (LR6 alkaline batteries). Using manganese
batteries will result in a shorter operating time
than when using alkaline batteries.
• When measurement data must be recorded, use
the AC adapter.
• The indicator appears when battery voltage
becomes low. Replace the batteries as soon as
possible.
• After use, always turn OFF the power.
• To replace the batteries, see 6.1, "Battery
Replacement" (page 93).
Page 34

Chapter 2 Measurement Preparations
28
1. Make sure that the POWER
switch of the 3144-20 is OFF
and disconnect all cables.
2. Turn over the 3144-20, then
loosen the setscrew to detach
the battery cover.
3. Install six LR6 alkaline batter-
ies in the battery compartment, and confirm the correct
polarity.
(Replace all batteries at the
same time.)
4. Put the battery cover back in
place, then tighten the screw.
3144-20
Tool required for installation:
Six LR6 alkaline batteries , Phillips-head screwdriver
Page 35

29
Chapter 2 Measurement Preparations
1. Connect the output plug of
the AC adapter to the AC
adapter connection terminal.
2. Plug the AC adapter into a
power outlet.
AC adapte
r connection terminal
Right side of the 3144-20
2.3 Connecting the AC Adapter
• Use only the supplied Model 9445-02 AC
ADAPTER or 9445-03 AC ADAPTER .
AC adapter input voltage range is 100 to
240 VAC (with ±10% stability) at 50/60 Hz.
To avoid electrical hazards and damage to
the instrument, do not apply voltage outside of this range.
• Turn the instrument off before connecting
the AC adapter to the instrument and to
AC power.
To avoid damaging the power cord, grasp the plug,
not the cord, when unplugging it from the power
outlet.
When using the AC adapter and batteries together,
AC adapter power is employed.
If AC power supply is interrupted for some reason,
the instrument will automatically switch to battery
power.
Page 36

Chapter 2 Measurement Preparations
30
2.4 Connecting the 9741 CLAMP ON VOLTAGE SENSOR
2.4.1 Connecting the Sensor to the Voltage Sensor Input Terminal
The voltage sensor input terminal of the
instrument is dedicated to the 9741 CLAMP
ON VOLTAGE SENSOR. Always use the
9741 as designated by HIOKI. Keep in mind
that connecting any other type to the terminal
could result in electric shock or malfunction.
• To prevent damage to the instrument and sensor, never connect or disconnect a sensor while
the power is on, or while the sensor is clamped
around a conductor.
• To avoid damaging the output cable, grasp the
connector, not the cable, when unplugging the
cable.
• Be careful to avoid dropping the clamps or otherwise subjecting them to mechanical shock,
which could damage the mating surfaces of the
core and adversely affect measurement.
Page 37

31
Chapter 2 Measurement Preparations
Plug in the 9741 CLAMP ON
VOLTAGE SENSOR.
Voltage sensor input
terminal
Top side of the 3144-20
Plugging in
Unplugging
Hold the upper part of the
connector to plug it in.
(The connector cannot be
inserted if held by the metallic part.)
Tip of the 9741's connector
Insert the connector by
aligning its protrusion with
the groove of the voltage
sensor input terminal.
Hold the metallic part of the
connector to unplug it.
(The connector cannot be
unplugged if held by the upper part.)
Page 38

Chapter 2 Measurement Preparations
32
2.4.2 Connecting the Instrument to the Line being Measured
The 9741 CLAMP ON VOLTAGE SENSOR
should first be plugged into the 3144-20
before being connected to the live line being
measured. To avoid short-circuiting or electric shock, observe the precautions below.
• To avoid short circuits and potentially lifethreatening hazards, never attach the
clamp to a circuit that operates at more
than 200 VAC, or over bare conductors.
• The 9741 should only be connected to th e
secondary side of a breaker, so the
breaker can prevent an accident if a short
circuit occurs. Connections should never
be made to the primary side of a breaker,
because unrestricted current flow could
cause a serious accident if a short circuit
occurs.
To avoid electric shock when measuring live
lines, wear appropriate protective gear, such
as insulated rubber gloves, boots and a
safety helmet.
To prevent damage to the instrument and sensor,
never connect or disconnect a sensor while the
power is on, or while the sensor is clamped around
a conductor.
Page 39

33
Chapter 2 Measurement Preparations
OK
Secure the conductor in the center of the clamp.
• Max. diameter of clamp: 20 mm
• Cable diameter that can be clamped:
No larger than 20 mm
Due to the principles of measurement, the detecting sensitivity of the 9741 varies with the diameter
of the cable to be measured, cable position inside
the clamp, permittivity of the cable covering, and
other factors. See the typical characteristics data
for the relationship between the diameter of cable
being measured and the sensitivity, and between
the cable position inside the clamp and the sensitivity (page 91). Especially when data must be
recorded for an extended period of time, fix the
position of the cable being measured inside the
clamp.
Page 40

Chapter 2 Measurement Preparations
34
2.5 Connecting Signals to the BNC Input Terminal
Note the following maximum input voltage
and maximum rated voltage to earth of the
BNC input terminal. If their voltages are
exceeded, this device will be damaged and
personal injury will result. Therefore, do not
perform measurement in this case.
Maximum input voltage: 5 V
PEAK
Maximum rated voltage to earth: 5 V
When disconnecting the BNC connector, be sure
to release the lock before pulling off the connector.
Forcibly pulling the connector without releasing the
lock, or pulling on the cable, can damage the connector.
To apply external signals output from a near-magnetic field probe or antenna (excluding those from
the 9741) to the instrument, connect the signals to
the BNC input terminal.
The level in each frequency band can be checked
or recorded in the same way as with the 9741.
Input to the BNC input terminal is effective when
the instrument is not connected to the 9741.
The measuring range is the same as for input from
the 9741 (0 to -50 dBV).
Page 41

35
Selector switch
Top side of the 3144-20
Insert the connector by aligning
the groove of the BNC connector with the connector guide on
the 3144-20 side.
Turn clockwise to lock.
To unplug the connector, unlock it by turning it counterclockwise, then pull it out.
Lock
BNC input terminal
connector guide
pins
BNC connector
BNC input terminal
1. Plug the BNC connector into
the BNC input terminal.
2. Use the selector switch to
select the input impedance
(50/ 1M, approx. 120 pF).
Plugging in and unplugging the BNC connector
Chapter 2 Measurement Preparations
Page 42

Chapter 2 Measurement Preparations
36
1. Loosen the screw of the 9741
ground terminal and pass the
ground wire through the earthing hole.
2. Tighten the screw to lock the
ground wire.
3. Connect the other end of the
ground wire to ground.
Required tools: Ground wire
About ground wires
Applicable wires: Solid or stranded wire 2.1 mm or less in
diameter
Connecting the 9741 CLAMP ON VOLTAGE SENSOR
to ground
Earthing hole
Ground terminal
screw
2.6 Connecting to Ground
Connect the ground terminal of the 9741 CLAMP
ON VOLTAGE SENSOR or 3144-20 NOISE
SEARCH TESTER to ground.
The noise detected when using the 9741 is that in
a common mode which exists between communication lines/power supply lines and the earth. By
connecting that terminal to ground, noise against
the earth can be detected.
Moreover, ground connection reduces the influence of the surroundings (coupling with metallic
materials in the surroundings), excluding the cable
being measured, by means of the shielding effect.
Failure to connect the instrument to ground would
make the measurement susceptible to effects from
objects other than the cable being measured, thus
making it impossible to conduct correct measurement.
Page 43

37
Chapter 2 Measurement Preparations
1. Insert the ground wire into the
earthing hole while pressing
the ground terminal of the
3144-20 with a flat-tip screwdriver.
2. Release the screwdriver to
lock the wire in place.
3. Connect the other end of the
ground wire to ground.
Required tools: Ground wire, flat-tip screwdriver
About ground wires
• Applicable wires
Solid wire: 0.4 mm (AWG26) to 1.2 mm (AWG16) in dia.
Stranded wire: 0.3 mm
2
(AWG22) to 1.25 mm2 (AWG16)
in dia.
Diameter of strand: 0.18 mm or more
• Recommended applicable tool: Flat-tip screwdriver with tip
width of 2.6 mm
Connecting the 3144-20 NOISE SEARCH TESTER
Right side of the 3144-20
Ground terminal
Earthing hole
Page 44

Chapter 2 Measurement Preparations
38
Switching the power on:
Turn on the POWER switch.
The screen will appear.
Switching the power off:
Turn off the POWER switch.
Left side of the 3144-20
2.7 Turning the Power On/Off
Before turning the instrument on, make sure
the supply voltage matches that indicated on
the its power connector. Connection to an
improper supply voltage may damage the
instrument and present an electrical hazard.
• If the battery mark ( at the upper right of the
screen) lights when power is turned on, the batteries are depleted. Replace with new ones.
2.2, "Installing the Batteries" (page 27)
6.1, "Battery Replacement" (page 93)
• The settings of the immediately preceding measurement are retained even when power is
turned off. Turning power on again restores the
immediately preceding settings. Note that any
data recording in progress at the time is stopped.
• After use, always turn OFF the power.
Page 45

39
Chapter 2 Measurement Preparations
Model indicated
Date indicated
Time indicated
Data memory checked
Monitoring screen
POWER switch turned ON
The following are indicated on the screen when
power is turned on:
The checking time for data memory varies
depending on the contents of memory.
Page 46

Chapter 2 Measurement Preparations
40
1. Plug the earphone into the
earphone terminal.
Insert the plug securely as far
as it will go.
2. Adjust the sound volume by
turning the VOLUME control
knob.
Right side of the 3144-20
Connect the earphone
here.
2.8 Connecting the Earphone
To avoid damage to the instrument, do not apply
current or voltage to Earphone terminal.
The earphone outputs a detected noise signal that
is converted into an envelope component of the
audible range.
It can be used as an aid, for example, in identifying
the type of noise signal.
Page 47

41
Chapter 2 Measurement Preparations
Connect this to the input terminal of an oscilloscope or
other measuring instrument.
Output terminal
Top side of the 3144-20
2.9 Connecting Signals to the Output Terminal
To avoid damage to the instrument, do not shortcircuit the output terminal and do not input voltage
to the output terminal.
The instrument outputs the waveform of a
detected noise signal.
This terminal can be used to check a detected signal by its waveform.
Page 48

Chapter 2 Measurement Preparations
42
Page 49

43
Chapter 3 Setup and Measurement
• Location of measurement: Indoors
• Facility being measured: ADSL circuit
• Measured object: Noise signal
• Measurement period: 8 hours
• Data storage: Saved in internal memory.
• Measuring conditions: Range x1
Recording interval: 1 min.
• 3144-20
• 9445-02 or 9445-03 AC ADAPTER
• 9741 CLAMP ON VOLTAGE SENSOR
• USB cable
• Others (PC, PC software, ground wire, tools)
Setup and
Measurement
3.1 Sample Measurement
In this sample measurement, the frequency band of a
noise signal propagated through an ADSL circuit will be
identified.
Equipment to be prepared:
Chapter 3
Page 50

Chapter 3 Setup and Measurement
44
1. Connect the AC adapter to the
instrument and to a power outlet.
2. Connect the 9741 CLAMP ON
VOLTAGE SENSOR to the voltage sensor input terminal of the
instrument.
3. Connect the ground wire to the
ground terminal of the instrument.
4. Connect the ground wire to
ground.
5. Turn on the POWER switch of
the instrument.
6. Clamp the 9741 CLAMP ON
VOLTAGE SENSOR to the ADSL
circuit.
1
2
3
3144-20
ADSL circuit
4
5
9741
6
Connecting the instrument and peripherals
1
Page 51

45
Chapter 3 Setup and Measurement
Set up the parameters according to the intended measurement.
1. Check the current time, then set the date and time.
3.6, "Setting Date and Time" (page 55)
2. Set the range to ×1.
3. Set the recording interval
to one minute.
4. Set up the recording
method.
3.3, "Recording Data
[REC]" (page 50)
Press for 1
sec.
Lights.:
Overwrite Recording Mode
Goes off.:
Automatic Stopping
Mode
Press this key for 1 sec. to start recording.
Setting up recording conditions
2
Starting data recording
3
Page 52

Chapter 3 Setup and Measurement
46
Peak Hold can be indicated, as required.
"Activation/deactivation of PEAK HOLD function"
(page 48)
Recording in progress
1. Press this key once again for 1 sec. to stop
recording.
2. Remove the 9741 CLAMP ON VOLTAGE SENSOR from
the ADSL circuit.
3. Turn off the POWER switch.
4. Disconnect the AC adapter, 9741, and ground wire from
the instrument.
Stopping data recording
4
Page 53

47
Chapter 3 Setup and Measurement
1. Connect the USB cable to the USB terminals of the instru-
ment and the PC.
2. Turn on the POWER switch of the instrument.
3. Activate the PC software supplied with the instrument.
Chapter 4, "Analysis of Recorded Data" (page 57)
Before using the instrument for this purpose for the first
time, be sure to install the application program supplied.
4.2, "Installing Software Drivers" (page 58)
4.3, "Installing PC Application Software" (page 60)
4. Transfer recorded data from the 3144-20 to the PC.
4.5, "Transferring Data to the PC" (page 63)
5. Display time-series data in waveforms and check the
noise level, peak value, peak detection time, etc., corresponding to each frequency band.
4.6, "Analyzing Recorded Data on the PC" (page 68)
The waveform data can be saved in CSV format.
4.9, "Analyzing Saved Recorded Data with Excel"
(page 78)
Moreover, the images of waveform windows can be
saved in BMP format and output to a printer.
4.7, "Saving Images of Waveform Windows" (page 75)
4.8, "Printing a Waveform Window" (page 76)
Analyzing recorded data on the PC
5
Page 54

Chapter 3 Setup and Measurement
48
3.2 Monitoring Measurement Data [MONI]
When the instrument is switched on, the monitoring screen appears (MONI lights), indicating the
voltage levels of various frequency ranges on the
level meter.
Selection of range________________________
Select the range for the input voltage.
Each pressing of the RANGE key changes the
indications of range and scale.
×1........1V range
(Scale indication: 0 to -30 dBV)
×10......0.1V range
(Scale indication: -20 to -50 dBV)
Activation/deactivation of PEAK HOLD function
When the PEAK HOLD function is currently active
(ON), the instrument shows the peak value of the
level detected in each frequency range and the
detection time.
PEAK HOLD lights: Peak hold ON
PEAK HOLD goes off: Peak hold OFF
Each pressing of the PEAK HOLD key changes
the ON/OFF setting of the PEAK HOLD function.
Page 55

49
Chapter 3 Setup and Measurement
Frequency
range
Peak value
Peak detection
time indicated
Date and time are
displayed alternately.
• The indications of peak values and the detection
times cover the time range from the start of
recording to the present time. When the PC software is used, the indications of peak values and
detection times cover all recorded data that was
downloaded to the PC. For this reason, if data
was acquired in overwrite recording mode, the
3144-20 and PC software may indicate different
peak values and detection times.
• When there are multiple peak values, the time of
the peak value detected first will be indicated.
Checking peak values and peak detection times
When PEAK HOLD is on, the frequency ranges
can be switched to check the corresponding peak
values and detection times.
Use the key or key to select the frequency range.
Page 56

Chapter 3 Setup and Measurement
50
3.3 Recording Data [REC]
Pressing the REC key on the monitoring screen
[MONI] for 1 sec. displays the recording screen
(REC lights), and the instrument starts recording
measurement data in memory at the preset interval.
Two recording modes are available. Either should
be set before recording.
• Automatic Stopping Mode
When memory becomes full (64,000 data items),
recording stops automatically.
When there are empty blocks in memory, recording can be repeatedly started and stopped to
continue measurement.
Memory Block: (page 17)
• Overwrite Recording Mode
When memory becomes full, older data is overwritten to continue measurement.
When data already exists before the start of
recording, the data must be deleted to start
recording.
Data deletion: (page 53)
• To record data, use the 9445-02 or 9445-03 AC
ADAPTER. When the instrument is operated on
batteries, all data may not be saved since the
time of continuous use depends on the service
life of batteries in use.
• Due to the principles of measurement, the
detecting sensitivity of the 9741 varies with the
diameter of the cable to be measured, cable
position inside the clamp, permittivity of the
cable covering, and other factors. See the typical characteristics data for the relationship
between the diameter of cable being measured
and the sensitivity, and between the cable position inside the clamp and the sensitivity ( page
91). Especially when data must be recorded for
an extended period of time, fix the position of
the cable being measured inside the clamp.
Page 57

51
Chapter 3 Setup and Measurement
Setup before recording ____________________
Make the following settings before starting recording (on the monitoring screen [MONI]). Once
recording gets under way, the settings cannot be
changed, except the ON/OFF setting of the peak
value indication, until the recording is stopped.
1. Set the current time and measuring con-
ditions.
• Date and time setup(page 55)
• Setup of measuring range and ON/OFF of peak
value indication (page 48)
2. Set the recording interval.
This setting cannot be changed while recording is
in progress.
Each pressing of the REC key switches the indication of recording intervals.
1/ 2/ 5/ 10/ 20/ 30 sec
1/ 2/ 5/ 10/ 20/ 30/ 60 min
The maximum recording time varies with the
recording mode selected.
"Recording Time" (page 85)
3. Set the recording mode.
Press the OVERWRITE key for 1 sec. to select the
recording mode. Each pressing of the key
switches the mode.
• When Overwrite Recording is ON (Overwrite
Recording Mode): CONT remains on.
• When Overwrite Recording is OFF (Automatic
Stopping Mode): CONT remains off.
Page 58

Chapter 3 Setup and Measurement
52
When measurement is stopped, a delimiter appears at the end of the blocks.
Start of record ing ________________________
Press the REC key for 1 sec.
The recording screen [REC] opens. (REC lights.)
The occupied state of memory is displayed on the
screen.
End of recording _________________________
Press the REC key again for 1 sec.
(REC goes off.)
The instrument stops recording and returns to the
monitoring screen [MONI].
Page 59

53
Chapter 3 Setup and Measurement
Press these keys simultaneously for 1 sec.
3.4 Deleting Memory
All recorded data is deleted. Before deleting
recorded data, download the necessary data to the
PC.
4.5, "Transferring Data to the PC" (page 63)
The following window appears:
Recorded data can be deleted through monitoring
screen [MONI] or data view screen [VIEW]. After
the data is deleted, operation returns to the monitoring screen [MONI].
• Note that, once initiated, data deletion cannot be
cancelled.
It takes up to about 30 seconds to delete data.
• Data deletion cannot be executed block by block.
Page 60

Chapter 3 Setup and Measurement
54
Back Forward
3.5 Viewing Recorded Data [VIEW]
1. Open the data view screen [VIEW].
Press the RANGE key and DATE/TIME key simultaneously on the monitoring screen [MONI] to
open the data view screen [VIEW]. (VIEW lights.)
If there is no data stored in memory, an error
(E_NULL) will be displayed. Pressing either key
returns operation to the monitoring screen [MONI].
6.4, "Error Indications and Corrective Action"
(page 95)
2. Select the memory b lo ck.
Press the MEM.BLOCK key to select the memory
block from which you wish to display data. The last
data of the block selected will be shown.
3. Select the data you want to display.
Use the key or key to scroll data
recorded in the selected memory block.
Page 61

55
Chapter 3 Setup and Measurement
3.6 Setting Date and Time
Set the current date and time on the 3144-20.
Once saved, the date and time will be stored on
the 3144-20.
When the instrument is connected to a PC through
the USB cable, the time of the PC's system clock
can also be set using the supplied PC software.
4.4, "Setting the Clock" (page 61)
1. Activate date and time setup mode.
Press the DATE/TIME key for 1 sec. on the monitoring screen [MONI] (with the PEAK HOLD function OFF).
The digits of the year flash.
2. Set the date and time.
Move the flashing digits to the position you want to
change.
Each pressing of PEAK HOLD shifts the flashing
as follows:
Year Month Day Hour Minute Second End
Change the flashing digits.
: Values DOWN
: Values UP
Page 62

Chapter 3 Setup and Measurement
56
Pressing either key shown at
left before defining the settings will cancel the settings,
and return operation to the
monitoring screen [MONI].
3. Define the setting.
Move the flashing position to second digit, then
press the PEAK HOLD key again to define the setting.
Operation returns to the monitoring screen
[MONI].
Cancellation of settings
Page 63

57
Chapter 4 Analysis of Recorded Data
Analysis of
Recorded Data
(Application Software)
4.1 General
Data recorded on the 3144-20 can be downloaded to a PC and
analyzed using the PC software supplied with the instrument.
To download data from the 3144-20, you must install the driver
and application of the PC software on the PC beforehand.
(page 58), (page 60)
Operating Environment
Compatible OSWindows 2000, XP, Vista, 7, 8
HDD capacity 10 MB or more of disk space
Interface USB Ver.1.1 or later
Composition of CD-R
Folder File Explanation
Japanese driverSetup.msi Driver Installer (Japanese)
English driverSetup.msi Driver Installer (English)
(Japanese or English; 64-bit support limited to
Windows 7 or 8)
The CPU, memory, display, and other hardware environments should conform to those
recommended by the OS.
Only one 3144-20 unit can be connected to
the PC at a time.
setup.exe PC Software Installer (Japanese)
setup.exe PC Software Installer (English)
Chapter 4
Select "Small Font" for use with the OS. Using "Large
Font" may cause irregularities in screen indications.
Page 64

Chapter 4 Analysis of Recorded Data
58
4.2 Installing Software Drivers
Perform this procedure before connecting the the
instrument to the PC with a USB cable.
If already connected, disconnect the USB cable
while you perform the procedure.
Installation Procedure_____________________
1. Log into the PC using the "administrator" account
or other account with administrative pri vileges.
2. Exit all applications runn ing on the PC before
installing the hardware drivers.
3. Execute the following software from the
included CD:
X:\English\driverSetup.msi (where X: indicates
the CD-ROM drive)
After executing driverSetup.msi, follow the
instructions on the screen to continue the
installation.
A warning message will be displayed since the
software has not been certified under the Windows
logo program. Continue the installation.
4. Once the installation is complete, t he 3144-20
will be automatically detected when the main
unit is connected to the PC with a USB cable.
If the "Found New Hardware" wizard dialog box is
displayed, select [No, not this time] under "Can
Windows connect to Windows Update to search
for software?" and select [Install the software
automatically].
Page 65

59
Chapter 4 Analysis of Recorded Data
When a 3144-20 unit with a different serial No. is
connected, the instrument may indicate that a new
device has been detected.In such case, install the
device driver by following the instructions appearing on the screen.
A warning message will be displayed since the
software has not been certified under the Windows
logo program. Continue the installation.
Uninstallation Procedure___________________
Select [Control Panel] -[Add and Remove Pro-
grams] and delete HIOKI USB Single Driver.
Page 66

Chapter 4 Analysis of Recorded Data
60
4.3 Installing PC Application Software
Installation Procedure_____________________
1. Log into the PC using the "administrator" account
or other account with administrative pri vileges.
2. Exit all applications runn ing on the PC before
installing the software.
3. Execute X:\English\setup.exe from the included
CD. (where X: indicates the CD-ROM drive).
After executing setup.exe follow the instructions on the screen to continue the installation.
A warning message will be displayed since the
software has not been certified under the Windows
logo program. Continue the installation.
4. Once the installation is complete, make all the
necessary connections and then launch the
program by selecting [Programs]-[HIOKI]-[DA TA
VIEWER for 3144]-[DATA VIEWER for 3144].
Uninstallation Procedure __________________
Select [Control Panel]-[Add and Remove Pro-
grams] and delete HIOKI DA TA VIEWER for 3144.
Page 67

61
Chapter 4 Analysis of Recorded Data
4.4 Setting the Clock
The clock of the 3144-20 can be set to the same
date and time as the PC.
1. Switch on the 3144-20 and activate "DATA
VIEWER for 3144-20."
2. Connect the 3144-20 and PC by using the USB
cable supplied with the instrument (and insert the
plugs securely).
The 3144-20 will display "USb" and all keys except
the POWER switch will be disabled.
• Only one 3144-20 unit can be connected to the
PC at a time.
• If the 3144-20 is displaying an error, the USB
cable will not be recognized even when connected to the 3144-20. Clear the error by pressing any key on the 3144-20.
• When connecting the 3144-20 and a PC by using
the USB cable, limit the cable length to less than
two meters to avoid effects of noise.
3. Select [Communication] - [Clock setting] from
the menu bar of "DATA VIEWER for 3144-20," or
left-click the mouse button on (Clock) on the
toolbar.
The clock setting window will appear.
Page 68

Chapter 4 Analysis of Recorded Data
62
4. Left-click the mouse button on [OK].
5. When the following window appears, click [OK],
disconnect the USB cable from the 3144-20 and
PC, then switch off the 3144-20.
• Dates are valid for the year 2000 and subsequent years. Data may not be handled for other
years.
• Clock setting cannot be made while the instrument is recording data.
• When data transfer is not to be made, disconnect
the USB cable from the 3144-20.
Moreover, refrain from plugging in or unplugging
the USB cable, unless absolutely necessary.
When the instrument is operated on batteries,
such action may shorten the time of continuous
battery use.
Page 69

63
Chapter 4 Analysis of Recorded Data
4.5 Transferring Data to the PC
Recorded data is transferred from the 3144-20 to a
PC. On the PC, the data can be saved in CSV format.
1. Switch on the 3144-20 and activate "DATA
VIEWER for 3144-20" on the PC.
2. Connect the 3144-20 and the PC by using the
USB cable supplied with the instrument (and insert
the plugs securely).
The procedure is the same as that for "4.4, "Setting the Clock" (page 61).
• Only one 3144-20 unit can be connected to the
PC at a time.
• Recorded data cannot be transferred while the
instrument is still recording.
• When connecting the 3144-20 and a PC by using
the USB cable, limit the cable length to less than
two meters to avoid effects of noise.
•
3. Select [Communication] - [Data transfer] from
the menu bar of "DATA VIEWER for 3144-20," or
left-click the mouse button on (Transfer) on
the toolbar to open the "3144-20 Data list" window.
Page 70

Chapter 4 Analysis of Recorded Data
64
A listing of files contained in memory of the 314420 will appear in the "3144-20 Data list" window.
Item on Screen Explanation
Transfer all
Transfer
Update list
Delete all
Close The "3144-20 Data list" window is closed.
All data recorded on the 3144-20 is transferred to the PC.
Data of the selected file is transferred to the
PC. Select the desired file by checking the
check box located to the left of the file No.
The file list of the 3144-20 is acquired again.
Execute this command when a 3144-20 unit
with a different serial No. has been reconnected while the "3144-20 Data list" window
is displayed.
All data recorded on the 3144-20 is deleted.
Keep in mind that recorded data cannot be
restored once deleted.
Page 71

65
Chapter 4 Analysis of Recorded Data
4. Transfer recorded data to the PC.
• To transfer all data:
Left-click the mouse button on [Transfer all].
All data recorded on the 3144-20 is transferred to
the PC.
• To transfer selected data:
Select the file to be transferred by checking the
check box located to the left of the file No., then
click [Transfer].
• While data transfer is in progress, do not plug in
or unplug the USB cable. Such action will hinder
normal transfer.
• It takes up to about five minutes to transfer
recorded data.
5. Left-click the mouse button on [Close] to close the
"3144-20 Data list" window.
Page 72

Chapter 4 Analysis of Recorded Data
66
6. When recorded data has been transferred to the
PC, a waveform window appears for each file
transferred.
7. Save the recorded data that has been transferred.
(page 67)
Delete any recorded data remaining on the 314420 that is no longer necessary.
(page 67)
8. Disconnect the USB cable from the 3144-20 and
PC, then switch off the 3144-20.
Page 73

67
Chapter 4 Analysis of Recorded Data
Saving the recorded data that has been
transferred ______________________________
1. Activate (display on top of other windows) the wave-
form window of the recorded data to be saved by
left-clicking the mouse button in the window.
2. Select [File] - [Save As] from the menu bar or left-
click the mouse button on (Save As) on the
toolbar.
The "Save As" window will appear.
3. Specify the file name and saving location, then left-
click the mouse button on [Save].
Execute saving on all waveform windows displayed.
The files are saved in CSV format, delimited with
commas.
Deleting data recorded on the 3144-20 _______
Delete all data recorded on the 3144-20 that is not
necessary.
1. Select [Communication] - [Data transfer] from
the menu bar of "DATA VIEWER for 3144-20," or
left-click the mouse button on (Transfer) on
the toolbar to open the "3144-20 Data list" window.
In this operation, leave the USB cable connected.
2. Left-click the mouse button on [Delete all] to
delete all data recorded on the 3144-20.
• It takes about 30 seconds to delete all data.
• Recorded data cannot be restored once deleted.
Therefore, before deleting data recorded on the
3144-20, be sure to transfer the data to the PC.
• Recorded data can also be deleted through operation on the 3144-20 only.
3.4, "Deleting Memory" (page 53)
Page 74

Chapter 4 Analysis of Recorded Data
68
4.6 Analyzing Recorded Data on the PC
Recorded data saved on a PC can be displayed in
waveforms for analysis purposes.
Displaying recorded data__________________
1. Activate "HIOKI Data Viewer for 3144-20."
2. Select [File] - [Open] from the menu bar or left-
click the mouse button on (Open) on the toolbar. The "Open file" window will appear.
3. Select the recorded data saved on th e PC, then
left-click the mouse button on [Open].
The waveform window of the recorded data will
appear.
• The operation above is not necessary when
waveform windows are currently displayed, such
as immediately after data transfer has been
made from the 3144-20 to the PC.
• Waveforms may not be shown in waveform windows that are overly reduced. In such case,
enlarge the window size.
Page 75

69
Chapter 4 Analysis of Recorded Data
1
2
3
4
67
8
9
10
5
Explanation of Windows
Waveform Wind ow________________________
1 Menu bar
2 Toolbar
3 Level (Vertical axis)
4 Date and time (Horizontal axis)
5 Display range
6 Cursor A
7 Cursor B
8 Data recorded in each frequency range
9 Horizontal axis
scroll bar
10 Vertical axis scroll
bar
"Menu" (page 71)
"Toolbar" (page 73)
Indication in dBV
Indicates the range within which waveforms are displayed among all data.
Can be moved around when dragged with
the left mouse button held down.
Can be moved around when dragged with
the left mouse button held down.
Allows movement of the waveform to display when the horizontal axis is displayed
in an enlarged size.
Allows movement of the waveform to display when the vertical axis is displayed in
an enlarged size.
Page 76

Chapter 4 Analysis of Recorded Data
70
12
4
9
3
56
78
Information Window ______________________
1
File name
2
Settings for
recording
3
Cursor position Positions (dates and times) of cursors A
4
ON/OFF of
waveform
indication
5
Waveform color Allows the waveform color of each frequen-
6
Name of frequency range
7
Peak of all data * Detection times and values of peaks among
8
Peak between
A-B*
9
Values of
cursors A and B
*: When there are multiple peak values, the time of the peak value dete ct-
ed first will be indicated.
Settings of a recording performed with the
3144-20
and B in the waveform window. The Up and
Down buttons located to the right allow corresponding cursor movement right and left.
Allows whether to display the waveform of
each frequency range in the waveform window.
cy range in the waveform window to be
changed. Select the desired color in the
"Color Setup" window by left-clicking the
mouse button, then left-click the mouse button on [OK].
all recorded data
Detection times and values of peaks of re-
corded data covered between cursors A
and B
Measurement values of each frequency
range at the positions of cursors A and B
Page 77

71
Chapter 4 Analysis of Recorded Data
Menu
File
Open Selects a file and opens a waveform window.
Close Closes the waveform window currently open.
Save As
Print
Preview Displays a sample of waveform printout.
Print Settings
Exit
Saves the recorded data currently open to another file.
Prints waveforms.
4.8, "Printing a W aveform Wind ow" (p age 76)
Used to make print settings.
4.8, "Printing a W aveform Wind ow" (p age 76)
Edit
Saves the image of a waveform window in a bit
Save Image
Copy
map.
4.7, "Saving Images of Waveform Win-
dows" (page 75)
Copies the images of a waveform window and
information window to the Clipboard. Both images can be pasted to such software as Paint
Brush or Word.
Page 78

Chapter 4 Analysis of Recorded Data
72
View
• Vertical axis: Creates an enlarged view of the
Zoom In
Zoom Out
Total View Creates a reduced view showing all the data.
Color setting
Independent-lyDisplays the waveforms of each frequency
Toolbar Allows whether to select display on the toolbar.
Status Bar
• Time axis: Creates an enlarged view of the
• Vertical axis: Creates a reduced view of the
• Time axis: Creates a red uced view of the
• 1 kHz to 20 MHz:
Allows the waveform color of each frequency
range to be changed.
• Background:
Allows the background color of the waveform
window to be changed.
•Frame:
Allows the frame color of the graph to be
changed.
• Default:
Restores all the colors above to the standard
colors.
range divided into separate frames.
Allows whether to select display of the status
bar.
vertical axis.
horizontal axis.
vertical axis.
horizontal axis.
Communication
Data transfer
Clock setting
Transfers recorded data from the 3144-20 to a
PC.
4.5, "Transferring Data to the PC" (page 63)
Sets the clock of the 3144-20 to the same time
as the PC.
4.4, "Setting the Clock" (page 61)
Page 79

73
Chapter 4 Analysis of Recorded Data
Enlarge time axis
Enlarges the time base
of a graph.
Reduce time axis
Reduces the time base
of a graph.
Total View
Displays an entire
graph.
Independently
Display a graph in a
split form.
Transfer
Transfers recorded
data from the 3144-20
to a PC.
Clock
Sets the clock of the
3144-20.
Open
Opens a file.
Save As
Saves a file.
Copy
Copies a window to the
Clipboard.
Print
Prints a file.
Enlarge vertical axis
Enlarges the vertical
axis of a graph.
Reduce vertical axis
Reduces the vertical
axis of a graph.
Toolbar
Window
New Window
Cascade
Tile
Displays another of the same waveform window.
Multiple open waveform windows are displayed
in an overlapped form.
Multiple open waveform windows are displayed
side by side.
Help
About Data Viewer
for 3144-20
Shows the version information of "DATA
VIEWER for 3144-20."
Page 80

Chapter 4 Analysis of Recorded Data
74
Popup Menu
Right-clicking the mouse button in a waveform
window displays the Popup Menu.
Copy
Zoom In
Zoom Out
Total View
Color settings
Jump
Put cursor
Performs the same function as [Edit] - [Copy] on
the menu.
Performs the same function as [View] - [Enlarge] on the menu.
Performs the same function as [View] - [Reduce] on the menu.
Performs the same function as [View] - [Total
View] on the menu.
Performs the same function as [View] - [Color
Setup] on the menu.
Moves the cursor to the selected position when
the time base is displayed in an enlarged size.
The position can be selected from: "Start" (Beginning of data), "End" (Terminal end of data),
"Cursor A," and "Cursor B."
Moves cursor A or B to the position where rightclicked on the mouse button.
Page 81

75
Chapter 4 Analysis of Recorded Data
4.7 Saving Images of Waveform Windows
The waveform windows and information windows
can be saved in bit maps.
1. Activate (display on top of the others) the wave-
form window to be saved.
2. Select [Edit] - [Save Image] - [Graph and Info.] or
[Graph only] from the menu bar.
• Graph and Info.
Saves the images of a waveform window and
information window.
• Graph Only
Saves the image of a waveform window.
The "Save As" window will appear.
3. Specify the saving location, file name, and type of
file, then left-click the mouse button on [Save].
The desired type of file can be selected from the
following:
• Full-color bit map
• Monochromatic bit map
• Gray scale bit map
If any part of an image is hidden, it may not be
saved normally. The same applies to copying to
the Clipboard.
Page 82

Chapter 4 Analysis of Recorded Data
76
4.8 Printing a Waveform Window
Waveform images of the recorded data currently
displayed can be output to the printer of a PC.
1. Make sure that the printer connected to the PC in
use is ready to print.
2. Select [File] - [Print Settings] - [Page Settin gs]
from the menu bar.
The "Page Settings" window will appear. After set-
ting the margins, if necessary, click [OK].
3. Select [File] - [Print Settings] from the menu bar,
then left-click the mouse button on the color in
which you wish to print.
Make a selection according to the printer. "Color,"
"Gray Scale," or "Monochrome" can be selected.
To check a print image beforehand, select [File] [Preview] from the menu bar.
4. Select [File] - [Print] from the menu bar or left-click
the mouse button on (Print) on the toolbar.
The "Printer Settings" window will appear.
For setting the printer, refer to the operation manual of the printer you are using.
5. Start printing by left-clicking the mouse button on
[OK].
Page 83

77
Chapter 4 Analysis of Recorded Data
• The image printed out may differ depending on
the type of printer used.
• If excessively large margins are set, printing may
be inhibited. In such case, set smaller margins.
Likewise, printing may be inhibited when a paper
size too small is selected.
Sample Printout
Page 84

Chapter 4 Analysis of Recorded Data
78
4.9 Analyzing Saved Recorded Data with Excel
The recorded data transferred to and saved on a
PC can be loaded to Excel.
• Note that data edited with Excel and saved may
not be opened with "DATA VIEWER for 3144-
20."
• If time must be indicated down to the second on
a data sheet of Excel, the cell format must be set.
• The date and time indicated at the end of the
"Time" row denote when measurement was completed.
Sample display by Excel
Page 85

79
Chapter 4 Analysis of Recorded Data
4.10Error Information
If an error occurs during data recording or file
operation, the error information is recorded on the
2nd line of recorded data that is saved on the PC.
This information can be checked when the file is
loaded to Excel or Memo Pad.
The following describes the character strings and
contents of error information.
Table of Error Indications
1.Errors arising from the 3144-20
Error Description
Stop By Battery
Low
Stop By Memory
Error
Stop By FIFO
Error
Recording was stopped due to low battery
voltage. Replace the batteries of the 3144-20
with new ones.
Recording was stopped due to frequent errors
that occurred in 3144-20 memory. The error is
related to flash memory of the 3144-20.
The 3144-20 must be repaired.
Recording was stopped due to a FIFO error
that occurred in 3144-20 memory. The error is
related to flash memory of the 3144-20.
The 3144-20 must be repaired.
Page 86

Chapter 4 Analysis of Recorded Data
80
2.Errors arising from the 3144-20 or USB
Error Description
Header Memory
Error
End Memory
Error
Data Memory
Error
USB File No.
Error
USB Start Time
Error
USB Interval
Error
USB Range
Error
USB End Time
Error
USB Data Num
Error
Error involving abnormal end due to power
outage, etc., during data recording, or error
arising from USB data reception. Check the
3144-20 and PC connections according to the
operation manuals. If this does not resolve the
problem, an error involving an abnormal end
due to a power outage, incorrect polarity of
batteries during data recording, or other similar reason may be the cause.
Error in the File No. at USB data reception.
Check the 3144-20 and PC connections according to the operation manuals.
Error in the recording start time at USB data
reception.
Check the 3144-20 and PC connections according to the operation manuals.
Error in the recording interval at USB data reception.
Check the 3144-20 and PC connections according to the operation manuals.
Error in range information at USB data reception
Check the 3144-20 and PC connections according to the operation manuals.
Error in the recording end time at USB data
reception.
Check the 3144-20 and PC connections according to the operation manuals.
Error in data count information at USB data
reception
Check the 3144-20 and PC connections according to the operation manuals.
Page 87

81
Chapter 4 Analysis of Recorded Data
2.Errors arising from the 3144-20 or USB
Error Description
Data Number
Error
Error in the data count at USB data reception.
There is a discrepancy between the number
of data items actually received and the data
count information.
Check the 3144-20 and PC connections according to the operation manuals, and then try
reception again.
3.Errors arising from files stored on the PC
Error Description
Open Time Error
Open Interval
Error
Open Range
Error
Open Peak Error
Open Data Error
Error in the recording start time at file opening.
Possibility of error in normal file save of information. Or possibility that the file was overwritten using Excel or other application.
Error in the recording interval at file opening
Possibility of error in normal file save of information. Or possibility that the file was overwritten using Excel or other application.
Error in range information at file opening
Possibility of error in normal file save of information. Or possibility that the file was overwritten using Excel or other application.
Error in the peak time at file opening
Possibility of error in normal file save of information. Or possibility that the file was overwritten using Excel or other application.
Data read error at file opening
Possibility of error in normal file save of information. Or possibility that the file was overwritten using Excel or other application.
Page 88

Chapter 4 Analysis of Recorded Data
82
Page 89

83
Chapter 5 Specifications
Specifications Chapter 5
5.1 Main Unit Specifications
General Specifications
Configuration of
input section
Input impedance
Maximum input
voltage
Maximum rated
voltage to ground
Frequency bandwidth
Measuring range
Detection method
Input terminal dedicated to the 9741.
BNC input terminal (with priority given to
the 9741)
• Input dedicated to the 9741:
50 ±10% (100 kHz)
• BNC input: 50 ±10% (100 kHz),
1 M±10%/ 120 pF±30 pF
(Capacity: 100 kHz) (Selected with
manual switch)
5 V
PEAK
5 V
500 Hz to 30 MHz
Separated into the following seven bands
(-3dB band)
• 500 Hz to 3 kHz (1 kHz range)
• 7.5 kHz to 22.5 kHz (15 kHz range)
• 35 kHz to 105 kHz (70 kHz range)
• 125 kHz to 375 kHz (250 kHz range)
• 0.5 MHz to 1.5 MHz (1 MHz range)
• 1.5 MHz to 4.5 MHz (3 MHz range)
• 10 MHz to 30 MHz (20 MHz range)
(BNC input terminated at 50 )
• ×1 range: 0 dBV [1 V] f.s.
Measuring range (0 dBV to -30 dBV)
• ×10 range: -20 dBV [0.1 V] f.s.
Measuring range (-20 dBV to -50 dBV)
Effective value conversion
Page 90

Chapter 5 Specifications
84
500 Hz to below 1 MHz: ±1.5 dBV
Detection accuracy
1 MHz to 30 MHz: ±2.0 dBV
(BNC input terminated at 50 )
Accuracy is not guaranteed when the indicator is on.
Measuring Functions
1.Monitoring function
The measuring voltage level of each frequency range is displayed in levels on an LCD (equivalent to 2.5 dBV/SEG).
2.Logging function
Measurement data and time are saved in internal memory at
each preset recording interval.
Internal memory
Amount of recorded
data
Number of measure-
ments
Recording mode
Memory backup
Recording interval
Data deletion
Recording time
8 blocks
(1 block: Up to 8,000 data items)
Up to 64,000 data items
(8 blocks × 8,000 data)
1 to 8 measurements (depending on number of blocks used in each measurement)
• Automatic Stopping Mode
When internal memory becomes full,
the measurement is completed (up to
64,000 data items).
• Overwrite Recording Mode (CONT)
When internal memory becomes full,
the measurement continues by overwriting older data. (Guaranteed minimum number of data items: 56,000)
Provided (By backup battery when power
is turned off)
Life of backup battery: About 5 years
(Reference value)
1/ 2/ 5/ 10/ 20/ 30 seconds
1/ 2/ 5/ 10/ 20/ 30/ 60 minutes
All data is deleted.
See the attached table (page 85)
Page 91

85
Chapter 5 Specifications
Recording Time
(When using AC adapter)
Recording
Interval
Automatic Stopping
Mode
Max. Recording Time
Overwrite Recording Mode
(CONT)
Guaranteed Minimum
Recording Time
1 second 17.7 hours 15.5 hours
2 seconds 1.4 days 1.2 days
5 seconds 3.7 days 3.2 days
10 seconds 7.4 days 6.4 days
20 seconds 14.8 days 12.9 days
30 seconds 22.2 days 19.4 days
1 minute 1.4 months 1.2 months
2 minutes 2.8 months 2.5 months
5 minutes 7.1 months 6.2 months
10 minutes 1.1 years 1 year
20 minutes 2.3 years 2.0 years
30 minutes 3.5 years 3.1 years
60 minutes 7.1 years 6.2 years
3.Data display function
• The recorded data of each frequency range acquired by the
logging function is displayed on an LCD, along with the time it
was measured.
• The data can be scrolled in the direction of the time base.
• The settings used in logging (measuring range, recording
interval, recording mode) are displayed.
• The peak value of data recorded in each frequency range is
displayed by the PEAK HOLD function.
Page 92

Chapter 5 Specifications
86
4.PEAK HOLD function
The peak value and the peak detection time of each frequency
range are displayed by the monitoring function, logging function,
or data display function. (Only peak values are displayed when
using the data display function.)
5.Output function
Waveform
monitoring
Bandwidth
Output
resistance
Input/output
ratio
Output accuracy
Max. open
voltage
Audible band
monitoring
Outputs input signals applied through input dedicated to the 9741 or BNC input.
500 Hz to 30 MHz (-3 dB) (when terminated at 50)
50±10% (1 kHz)
2:1 (when terminated at 50)
±5%rdg.±10 mV
(when terminated at 50 and 100 kHz)
±4.5 V
Outputs an envelope of the detected sig-
nal (with volume control provided).
Can be monitored through the earphone
provided.
Display section
Display unit TN Type LCD
Page 93

87
Chapter 5 Specifications
Power supply
• When using six LR6 alkaline batteries:
1.5 VDC x 6
• When using the 9445-02 AC ADAPTER
Rated voltage
Maximum rated
power
Time of continuous
use
or 9445-03 AC ADAPTER:
9 VDC, 500 mA, from rated supply voltage of 100 to 240 VAC(Voltage fluctuations of ±10% from the rated supply
voltage are taken into account.), 50/60
Hz, maximum rated current: 250 mA
4.0 VA max (9741 included)
About 5 hours (when using batteries with
monitoring function, and at ambient temperature of 23°C as reference value)
Communicating functions
Description of communication
Interface USB Ver1.1
Data recorded in internal memory of the
3144-20 is transferred to a PC.
Ancillary functions
Battery life warning
Time setting
The mark appears when the supply
voltage drops below 6.5 V.
The year, month, day, hour, minute, and
second are set by key operation.
Environment, standards, and others
Temperature and
humidity for guaranteed accuracy
Guaranteed accuracy period
Operating temperature and humidity
23±5°C (73±9°F), 80%RH or less (noncondensating)
1 year
0 to 40°C (32 to 104°F), 80%RH or less
(non-condensating)
Page 94

Chapter 5 Specifications
88
Storage temperature and humidity
Operating environment
Applicable
Standards
Effect of conducted
radio-frequency
electromagnetic
field
Dimensions and
Mass
Accessories
-10 to 50°C (14 to 122°F), 80%RH or less
(
non-condensating
Indoors, altitude up to 2000 m (6562-ft.)
Safety:EN61010
Pollution degree 2
(anticipated transient overvoltage
330 V)
EMC: EN61326
(When using the 9445-03 AC ADAPTER)
EN61000-3-2
EN61000-3-3
±5 dB at 3 V (max.)
Approx. 98W × 179H × 46D mm
(3.86"W × 7.05"H × 1.81"D)
Approx. 430 g (15.2 oz.) (without batteries)
• 9741 CLAMP ON VOLT A GE SENSOR 1
• Carrying case.................................... 1
• PC software(CD-R)........................... 1
• LR6 alkaline batteries ....................... 6
• USB cable......................................... 1
• Strap ................................................. 1
• 9445-02 AC ADAPTER or
9445-03 AC ADAPTER..................... 1
• Earphone .......................................... 1
• Instruction Manual ............................ 1
)
Page 95

89
Chapter 5 Specifications
Application Software Supplied with Instrument
• Indication of data list
• Data download
• Indication of time-series data in waveforms
Functions
• Indication of peak values and peak
detection times
• Enlarging and reducing functions
• Pasting to the Clipboard
• Data save
•BMP save
• Print function
Page 96

Chapter 5 Specifications
90
5.2 Clamp Specifications
Sensor structure
Frequency band
Detecting sensitivity
Sensor output
Output impedance 50±10%(1 kHz)
Max. clamp dia. 20 mm dia.
Maximum rated volt-
age to earth
Cord length Approx. 1 m (39.37")
Functional ground
terminal
Supply voltage
Maximum rated
power
Operating tempera-
ture and humidity
Storage tempera-
ture and humidity
Operating environ-
ment
Electrostatic coupling type of noncontact
voltage sensor
600 Hz to 30 MHz
(-3 dB or more with respect to 100 kHz)
Influence of conductor diameter
For Typical Characteristics, see Figure 1
(page 91).
(Condition: Conductor located in the center of the clamp)
Fluctuation of sensitivity due to conductor
position
For Typical Characteristics, see Figure 2
(page 91).
Voltage output
Outputs voltage corresponding to the detecting sensitivity.
200 VAC
Provided
±5 V (Supplied through connection to the
3144-20)
0.5 VA max
0 to 40°C (32 to 104°F), 80%RH or less
(non-condensating)
-10 to 50°C (14 to 122°F), 80%RH or less
(
non-condensating
Indoors, altitude up to 2000 m (6562-ft.)
)
Page 97

91
Chapter 5 Specifications
Frequency [kHz]
Detecting Sensitivity [dB]
(Input voltage 1 V)
Safety EN61010
Pollution degree 2
Applicable
Standards
Dimensions and
Mass
Temperature and
humidity for guaranteed accuracy
Guaranteed accuracy period
Measurement Category III,
(anticipated transient overvoltage 4000 V)
EMC
EN61326
Approx. 62W × 158H × 40D mm
(2.44"W× 6.22"H×1.57"D)
Approx. 260 g (9.2 oz.)
23±5°C (73±9°F), 80%RH or less (noncondensating)
1 year
Figure 1. Frequency Characteristics
Page 98

Chapter 5 Specifications
92
Y-Direction
X-Direction
Distance between Conductor and Clamp Center [mm]
in X-Direction
Distance between Conductor and Clamp Center [mm]
in Y-Direction
Variation of Detecting Sensitivity [dB]
-15 -10 -5 0 5 10 15
-15 -10 -5 0 5 10 15
7
6
5
4
3
2
1
0
-1
7
6
5
4
3
2
1
0
-1
(Input voltage 1 V)
Figure 2. Fluctuation of Sensitivity due to
Conductor Position
Page 99

93
Chapter 6 Maintenance and Service
Maintenance and
Service
6.1 Battery Replacement
• Before replacing the batteries, turn off the
POWER switch and disconnect the cables
to prevent accidents involving electric
shock.
• After replacing the batteries, replace the
cover and screws before using the instrument.
• Do not mix old and new batteries, or different types of batteries. Also, be careful to
observe battery polarity during installation.
Otherwise, poor performance or damage
from battery leakage could result.
About used batteries
• To avoid the possibility of explosion, do not
short circuit, disassemble or incinerate batteries.
• Handle and dispose of batteries in accordance with local regulations.
Chapter 6
For precautions on and how to install the
batteries, see the following subsection
2.2, "Installing the Batteries" (page 27)
Page 100

Chapter 6 Maintenance and Service
94
6.2 Cleaning and Storage
Cleaning • To clean the instrument, wipe it gently with a soft
cloth moistened with water or mild detergent.
Never use solvents such as benzene, alcohol,
acetone, ether, ketones, thinners or gasoline, as
they can deform and discolor the case.
• Wipe the LCD gently with a soft, dry cloth.
Storage • To avoid corrosion from battery leakage, remove
the batteries from the instrument if it is to be
stored for a long time.
• After use, always turn OFF the power.
6.3 Repair and Servicing
Never modify the instrument. Only Hioki service
engineers should disassemble or repair the instrument. Failure to observe these precautions may
result in fire, electric shock, or injury.
• The instrument contains a built-in backup lithium
battery, which offers a service life of about five
years. If the date and time deviate substantially
when the instrument is switched on, it is the time
to replace that battery. Contact your dealer or
Hioki representative.
• If the instrument seems to be malfunctioning,
confirm that the batteries are not discharged
before contacting.
• When sending the instrument for repair, remove
the batteries and pack carefully to prevent damage in transit. Include cushioning material so the
instrument cannot move within the package. Be
sure to include details of the problem. Hioki cannot be responsible for damage that occurs during
shipment.
 Loading...