

Page 1
Engineered Humidification Systems
Load Calculation Guide
H e r r m i d i f i e r® | w w w . h e r r m i d i f i e r- h v a c . c o m
Page 2

L o a d C a l c u l a t i o n G u i d e
TABLE OF CONTENTS
SECTION I PREFACE
Preface ...........................................................................................................................................................3
SECTION II BASIC INFORMATION
Denition Of “Relative Humidity” ....................................................................................................................4
“Dry Air” From Heating ....................................................................................................................................4
“Dry Air” From Cooling .................................................................................................................................... 4
The Psychrometric Chart ................................................................................................................................5
Equilibrium Moisture Content .........................................................................................................................5
“Regain” Of Hygroscopic Materials.................................................................................................................5
“Dry Air” And Comfort .....................................................................................................................................5
Humidity And Dust ..........................................................................................................................................6
Humidity And Its Effect On Bacteria And Virus Life ........................................................................................ 6
“Dry Air” And Static Electricity ......................................................................................................................... 6
“Dry Air” And Hygroscopic Materials ............................................................................................................... 7
Woodworking And Humidication ................................................................................................................... 8
Paper Products And Humidication ................................................................................................................8
Printing And Humidication.............................................................................................................................9
Textiles And Humidication .............................................................................................................................9
Food Storage, Processing And Humidication ............................................................................................... 9
Leather Processing And Humidication .......................................................................................................... 10
A Humidication Synopsis .............................................................................................................................. 10
SECTION III LOAD CALCULATIONS
The Psychrometric Chart ................................................................................................................................11
Heating Load ..................................................................................................................................................12
Cooling Load ..................................................................................................................................................14
Product Load ..................................................................................................................................................15
Process Reduction .........................................................................................................................................16
People Reduction ...........................................................................................................................................16
SECTION IV TYPES OF EQUIPMENT
Atomization .....................................................................................................................................................17
Evaporation ....................................................................................................................................................19
Steam .............................................................................................................................................................19
2 w w w. h e r r mi di f i e r- h v a c . co m
L o a d C al c u l a t io n G u i de
Page 3

Preface
L o a d C a l c u l a t i o n G u i d e
HERRMIDIFIER welcomes you to the world of engineered
humidication systems. HERRMIDIFIER was founded in
1945 and humidication is our only business. We are your
“Total Capability Humidication Resource.”
This Guide will familiarize you with both the need and the
benets of controlled humidication. It will also acquaint you
with the technical facets of accurately calculating humidication demand loads and the selection of the best and most
appropriate system for your application.
HERRMIDIFIER’s recognized leadership position within the
industry is borne from many reasons.
They include:
•Committed to Quality
•Broadest Range of Humidication Systems
-Electrode Steam Generators
-Electric Resistive Steam Generators
-Central Steam
-Steam to Steam
-Air/Water Atomizing Systems
-High Pressure Water Atomizing Systems
-In-Duct Systems
-In-Space Systems
-Water Pretreatment Systems
•Factory Trained Sales Force
-A nationwide network of factory-trained technical sales
representatives.
•Technical Support
-Or Engineering staff will custom design a system to ll
your specic needs.
•Technical Leadership
-State-of-the-art, engineered and patented energy efcient system development.
•Market Diversication Telecommunications
-Computer Rooms
-Electronic Manufacturing
-Textile
-Woodworking
-Printing
-Paper Storage
-Food Storage
-Hospitals
-Ofce Buildings
•Service
We trust this Guide answers your questions. We have more
engineering data for your use and we are ready to help you
solve your dry air problems. Give us a call!
L o a d C al c u l a t io n G u i de
w w w. h e r r mi di f i e r- h v a c . co m
3
Page 4
L o a d C a l c u l a t i o n G u i d e
CU. FT.
7.80 Grains
CU. FT.
.78 Grains
SECTION II BASIC INFORMATION
Relative Humidity and Its Place in Environmental Control
“Dry Air” From Heating
Since the beginning of modern day engineering, environmental control in factories, ofces and homes has become
increasingly more important as its benets to personnel and
product alike were realized. There are three basic parts to
environmental control:
1) air quality-its cleanliness and purity,
2) temperature
3) relative humidity
Of the three, the most ignored is the level of relative humidity-probably because the effects of temperature and air quality are more easily seen and felt than the effects of relative
humidity. Relative humidity is important as it can affect human health and comfort, operation of production machinery,
quality and workability of production material. Proper control
of relative humidity can also be an important factor in the
total energy use and operating efciency of a factory. To develop an understanding of relative humidity and its effect, it
is rst necessary to dene some terms.
Denition Of “Relative Humidity”
HUMIDITY is dened as “the amount of moisture in the air.”
This moisture must be in the form of water vapor. Visible water droplets that have not evaporated to the vapor state do
not affect humidity. The term RELATIVE HUMIDITY is used
to describe “the amount of moisture in a given volume of
air as compared with the greatest amount of moisture that
that volume of air could contain at the same temperature,
expressed as a percentage,” so that:
%RH = (Ma/Mg)
Ma = Amount of moisture in the air
Mg = Maximum amount of moisture in the air
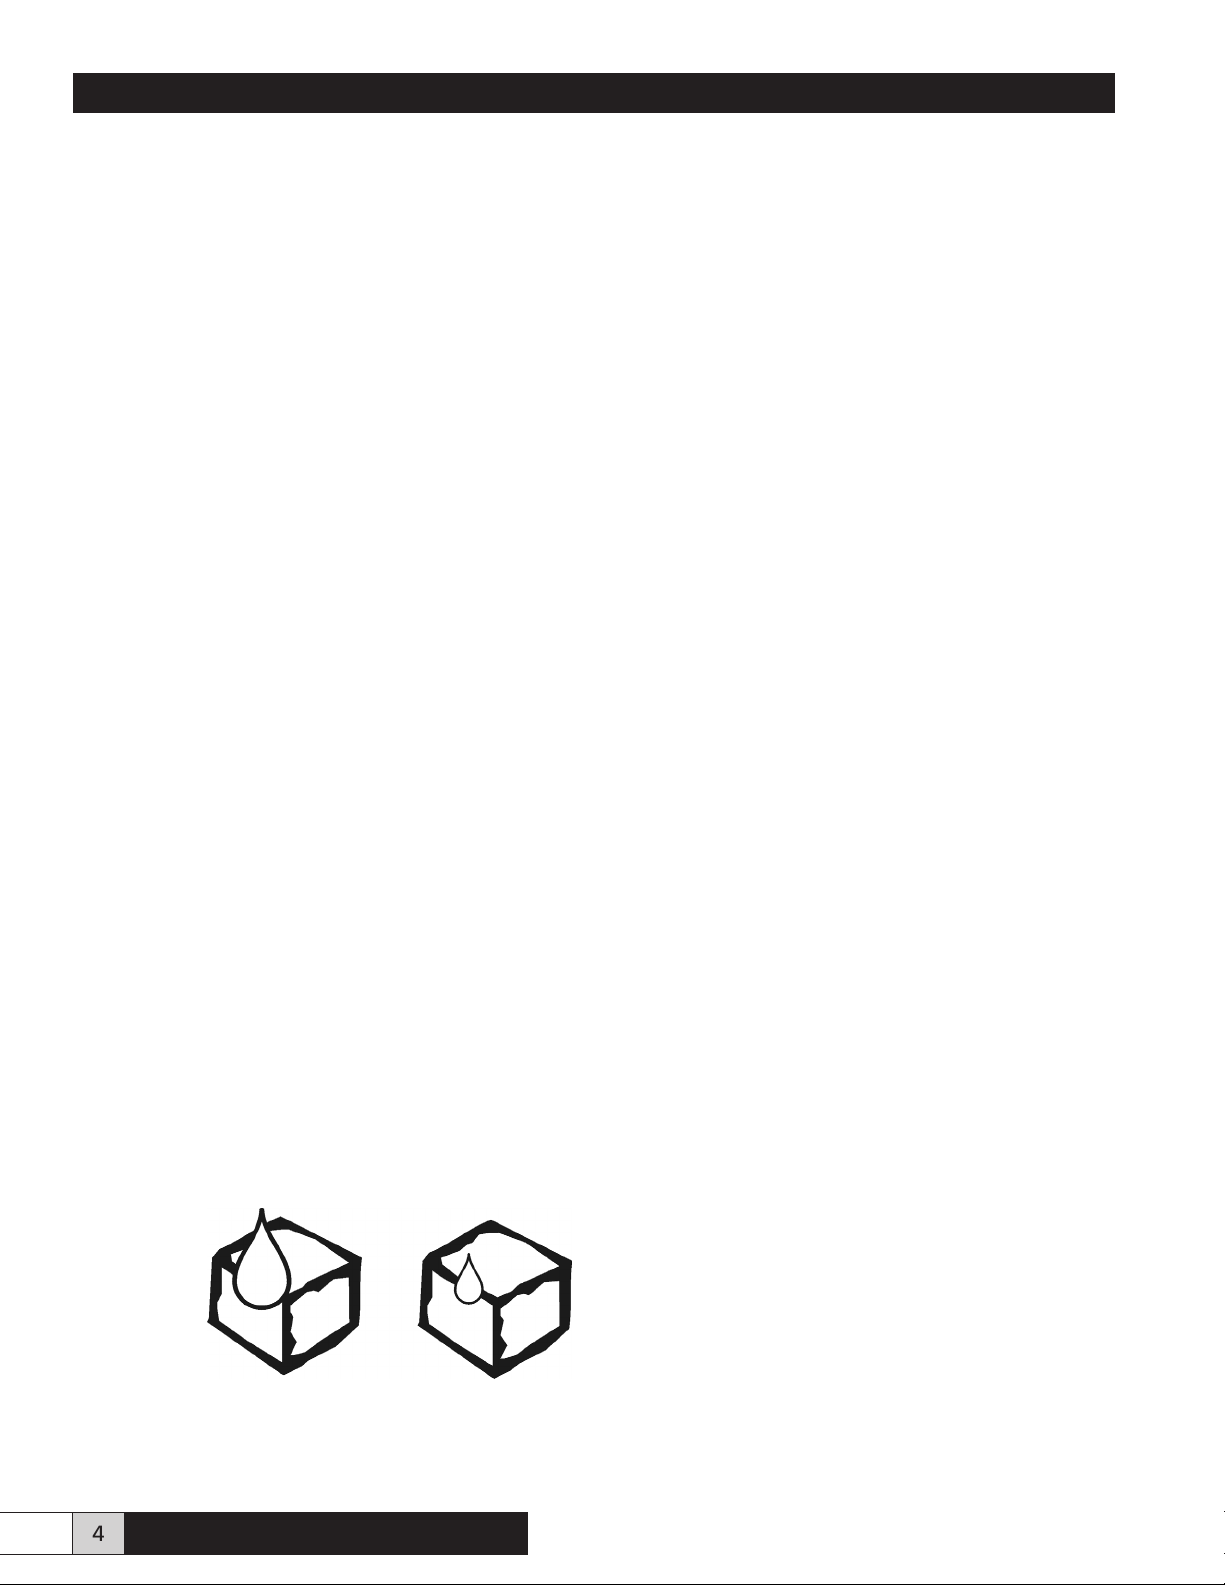
If that cubic foot of air is saturated at 1O°F (100% R.H.) and
raised to 69°F, without adding or subtracting any moisture,
it will now contain only 1/10 the amount of moisture it could
hold at saturation; thus it now has a relative humidity of
10%...2-1/2 times drier than the Sahara Desert!
This is essentially why, during the heating season, air is drier.
The cold, moist outdoor air, brought in by forced air makeup,
exhaust, or natural inltration is heated and becomes warm
dry air. To bring this air to an acceptable level of relative humidity, moisture must be added.
“Dry Air” From Cooling
Under certain conditions, cooling by air conditioning and
refrigeration can remove moisture from the air and reduce
its relative humidity to unsatisfactory low levels. This occurs
when the air is cooled below its DEW POINT-the temperature at which the air becomes saturated and if cooled further
the excess moisture will condense out of the air. For example: Air at 70°F and 75% R.H. will have about 6.08 grains of
moisture per cubic foot.
Air at 55°F can hold only 4.89 grains of moisture per cubic foot at saturation. Therefore, if the 70°F 75% R.H. air is
cooled to 55°F it will now be at 100% R.H. and will contain
a maximum of 4.89 grains of moisture per cubic foot having
lost the excess of 1.19 grains (6.08-4.89 = 1.19) by condensation. When this 55°F 100% R.H. air is discharged back into
the room and again warms to 70°F it will now have a relative
humidity of 60% since it now contains only 4.89 grains of
moisture per cubic foot instead of the original 6.08 grains.
1.19 grains of moisture per cubic foot must now be added to
return the air to its original level of 75% R.H.
The greatest amount of moisture that a given volume of air
can contain changes as the temperature of that air changes. The higher the temperature of that air, the greater the
amount of moisture it can hold when saturated. The key word
here is “temperature.” For example: a cubic foot of air at 69°F
can hold ten (10) times as much moisture as the same cubic
foot of air at 1O°F.
FIGURE 1
4 w w w. h e r r mi di f i e r- h v a c . co m
69°F
10°F
L o a d C al c u l a t io n G u i de
Page 5
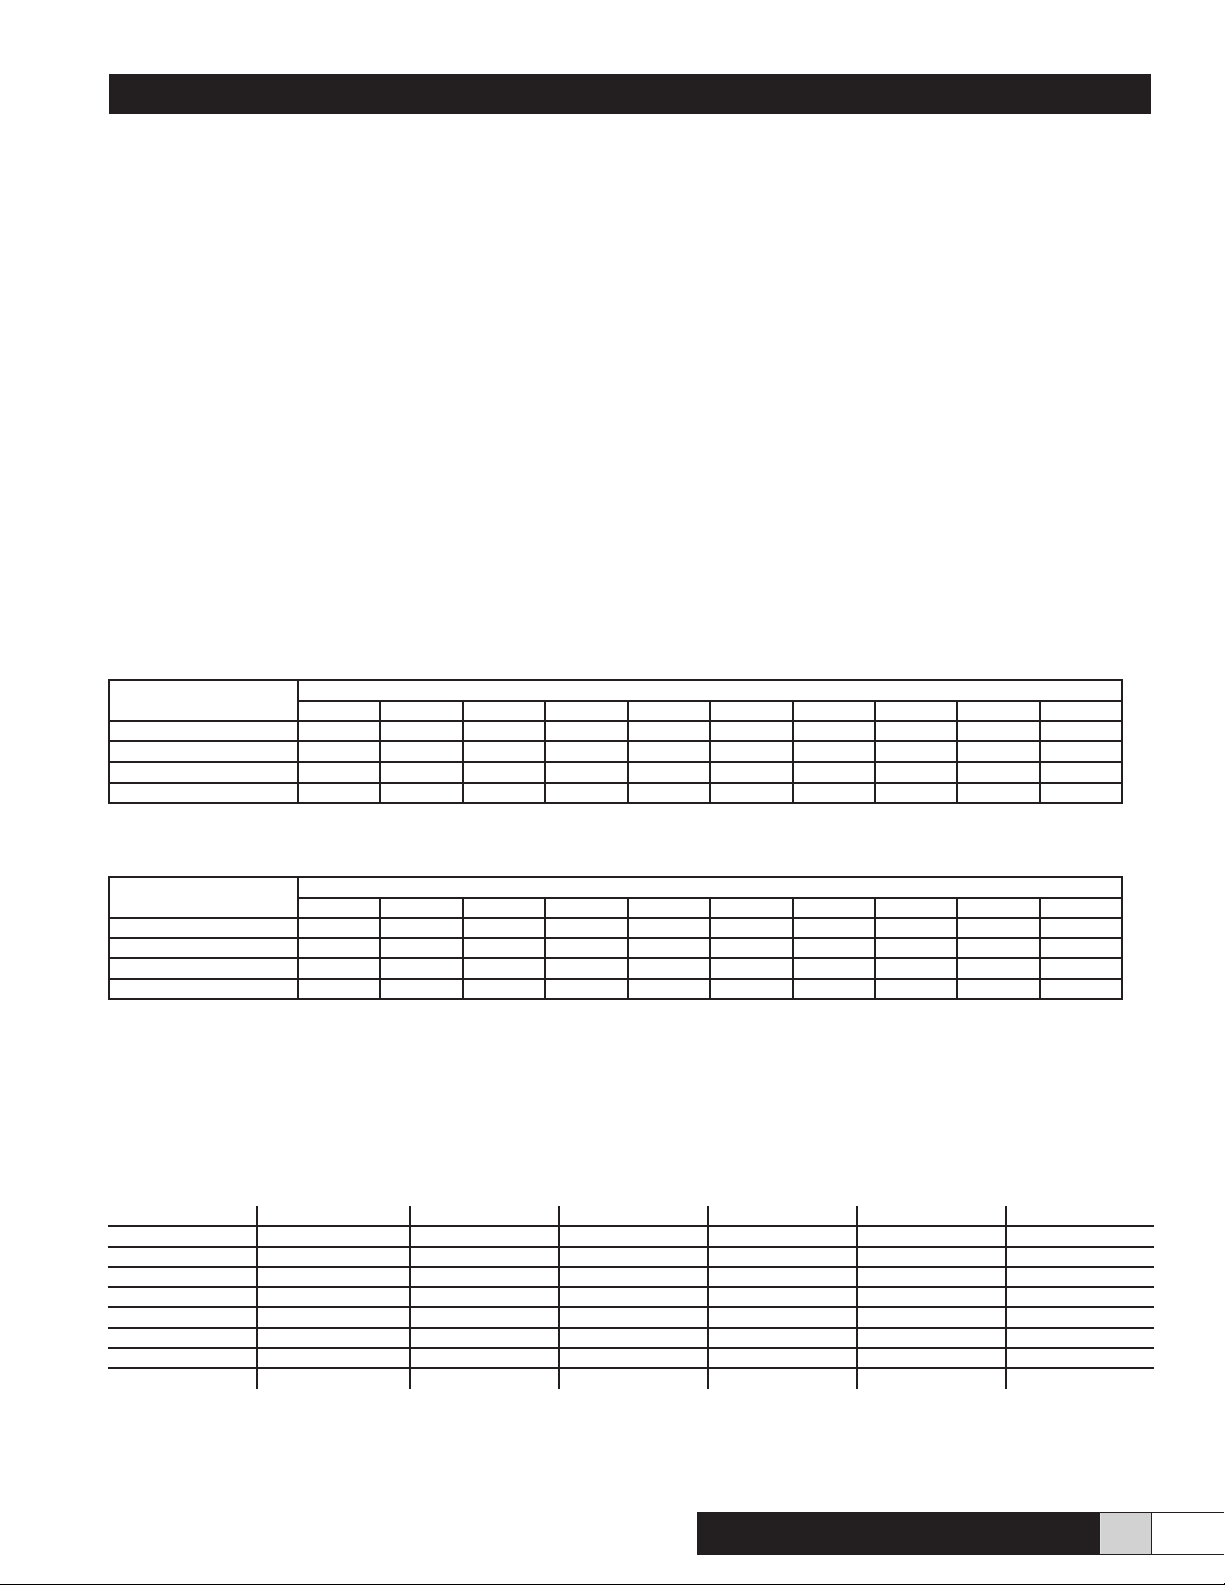
The Psychrometric Chart
L o a d C a l c u l a t i o n G u i d e
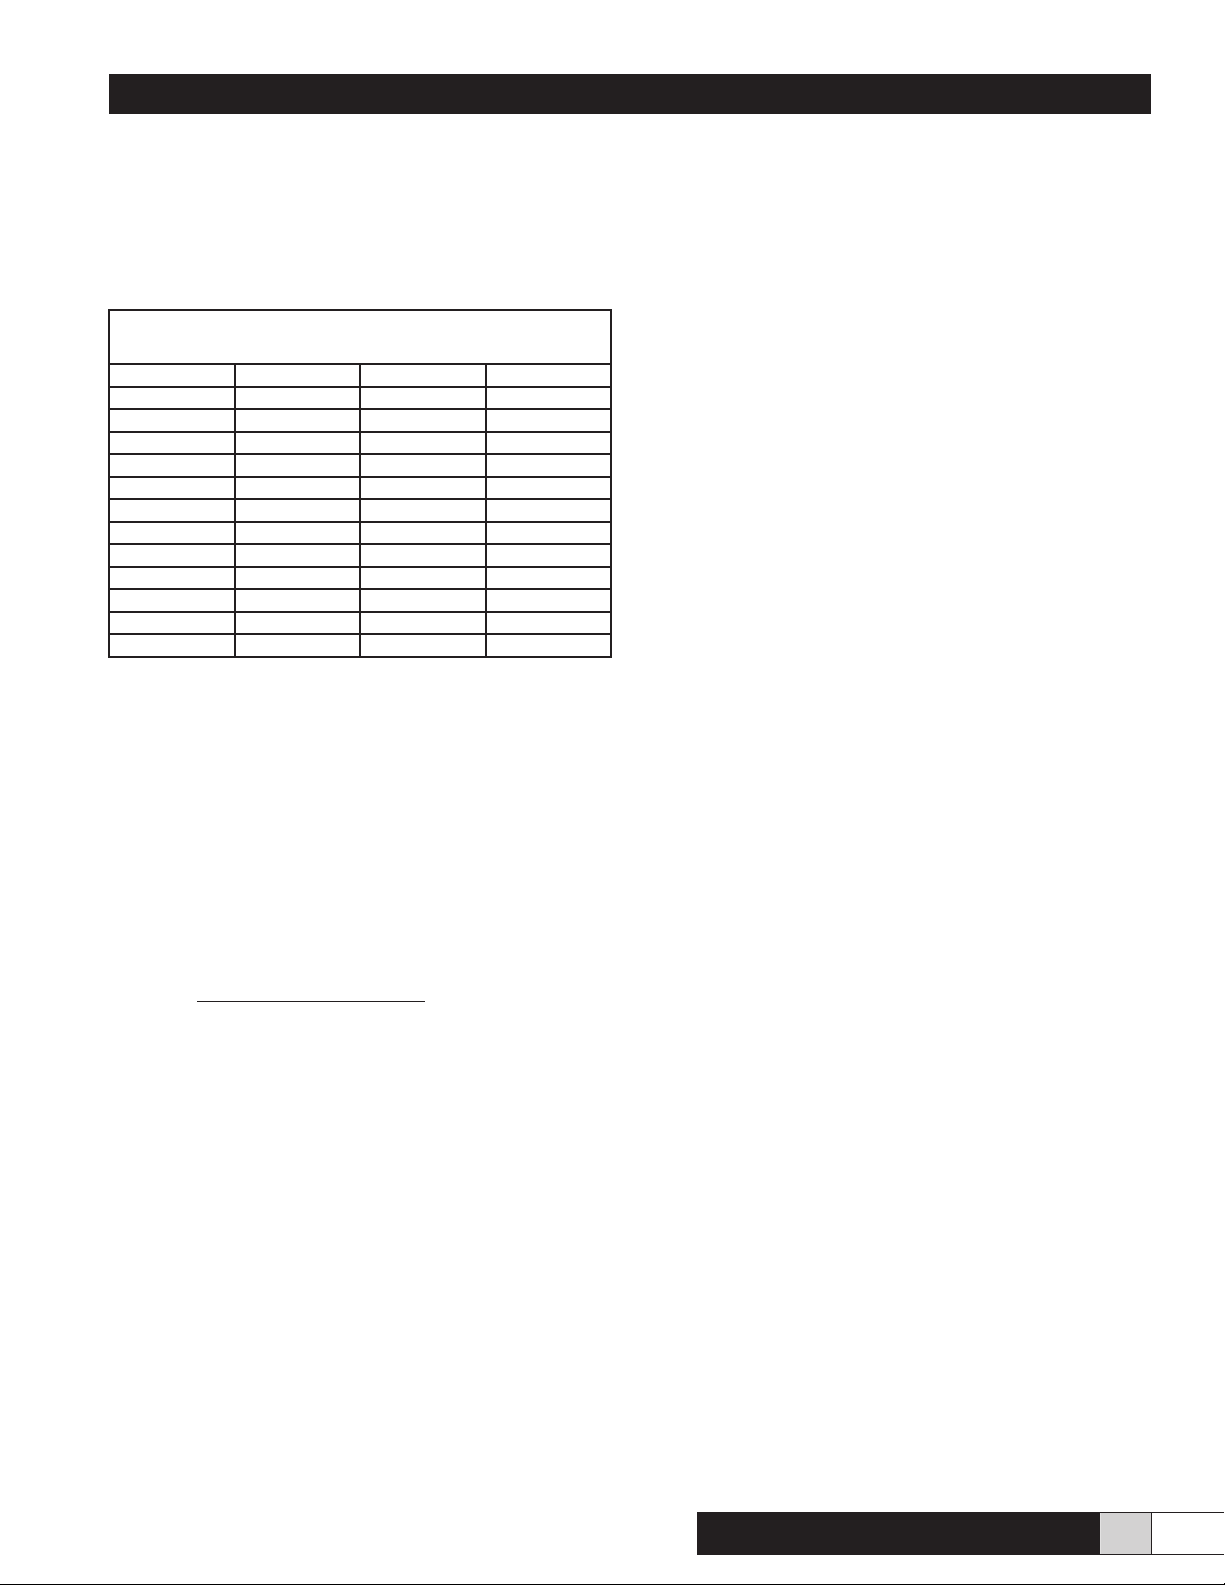
To further illustrate the moisture holding ability of air at various temperatures, following is a chart showing the grains of
water per cubic foot of saturated air, at various temperatures.
This chart was abstracted from the ASHRAE Handbook.
Table 1-A
GRAINS OF WATER PER CUBIC FOOT (AIR)
Saturated Air, Various Temperatures
°F Grains °F Grains
0 .475 60 5.795
5 .609 65 6.845
10 .776 70 8.055
15 .984 75 9.448
20 1.242 80 11.04
25 1.558 85 12.87
30 1.946 90 14.94
35 2.376 95 17.28
40 2.863 100 19.95
45 3.436 105 22.95
50 4.106 110 26.34
55 4.889 115 30.13
As you can see, from the above Table 1 -A, as the temperature of the air increases, so does its ability to hold moisture.
Determinations of MAXIMUM HUMIDIFICATION DEMAND
LOAD are made from this chart. To determine a heating humidication load, simply take the maximum indoor and minimum outdoor temperatures, refer to the chart above, and
write down the corresponding grains of moisture. Then multiply these times the percent of relative humidity desired. Use
the lowest design R. H. for the outdoor gure. Now subtract
the lower temperature gure from higher temperature gure
and insert the result into the following formula for Grains/
Cu. Ft., also inserting the cubic foot of air to be humidied
per hour:
LOAD = Grains/Cu. Ft. X Cu. Ft./Hr.
(Lbs. Water/Hr.) 7000/Grains/lb.
Other factors inuencing the maximum humidication demand load are:
• Natural Air Inltration
• Exhaust Equipment
• Make-up Air
• Construction of Building
• Air Conditioning or Refrigeration
• Vacuum Equipment
• Vapor Barriers
• Window Area
• Hygroscopic Material
Because of all the factors involved, humidication can be
simple or rather complicated. It is best to consult a humidication expert such as Herrmidier Co., Inc. and allow them to
conduct a humidication survey. (Free help can be obtained
by lling out Herrmidier’s form DI-5 and mailing it to us. This
form contains all necessary information for us to help you
design a project).
Equilibrium Moisture Content
Dry air pulls moisture from everything it contacts- HYGROSCOPIC materials (able to absorb or emit moisture), living tissues, etc. Conversely, moist air gives up moisture to
dry hygroscopic materials. An equilibrium will eventually be
reached when the moisture gain of a material equal its moisture loss. This is the EQUILIBRIUM MOISTURE CONTENT
OR “EMC.” This “EMC” changes with temperature, R.H. and
from material to material. The reaching of this “EMC” can
sometimes be detrimental as we shall see.
“Regain” Of Hygroscopic Materials
All hygroscopic materials-and a long list is so classied-take
on or give off moisture when the EMC is disturbed. At a given
level of R.H. a given hygroscopic material will hold a certain
amount of moisture. The weight of this moisture so help compared with the dry weight of the material is called “Regain”
and is expressed as a percentage. Regain varies with R.H.
for a given material. For example: EMC values for average
wood are 5.9% Regain with 30% R.H. air; 9.3% Regain with
50% R.H. air; 14% Regain with 70% R,.H. air; etc. A standard Regain is often specied for hygroscopic items sold by
weight. If the standard Regain is not attained, economic loss
to the seller results.
Variations in Regain cause hygroscopic materials to change
in dimensions, weight, quality, workability, etc.; therefore, it
is best to stabilize the Regain at the most desirable level for
manufacturing, processing, testing, storage, use, consumption, etc. To do this, the R.H. of the air in contact with the material must be stabilized at the proper level, as we shall see.
“Dry Air” And Comfort
Dry air pulls moisture from anything it contacts, including
the human body. Dry air will cause moisture to evaporate
more readily from the surface of the skin, causing a feeling
of chilliness-even at temperatures as high as 75°F! Dry air
also pulls moisture from living membranes, such as the nasal
passages, throat, eyes and ears, leading to the uncomfortable parched throat and sore eyes of winter. Proper control
of relative humidity can help to eliminate these problems.
L o a d C al c u l a t io n G u i de
w w w. h e r r mi di f i e r- h v a c . co m
5
Page 6
L o a d C a l c u l a t i o n G u i d e
When moisture evaporates from the surface of the skin it
causes a degree of evaporative cooling. During the winter,
when heated air is dry, this evaporation occurs more readily,
causing a higher degree of evaporative cooling and a feeling of chilliness. Raising the temperature will help alleviate
the feeling of chilliness, but will actually aggravate the other
problems of dry, parched throat and eyes, because the air
at this higher temperature can now hold still more moisture
(refer to Table 1 -A), which causes the R. H. to drop and the
pull for moisture from body to air becomes even greater.
More comfort can readily be obtained by raising the level of
relative humidity. Often, by raising the R.H. the temperature
can then be lowered while maintaining the same comfort
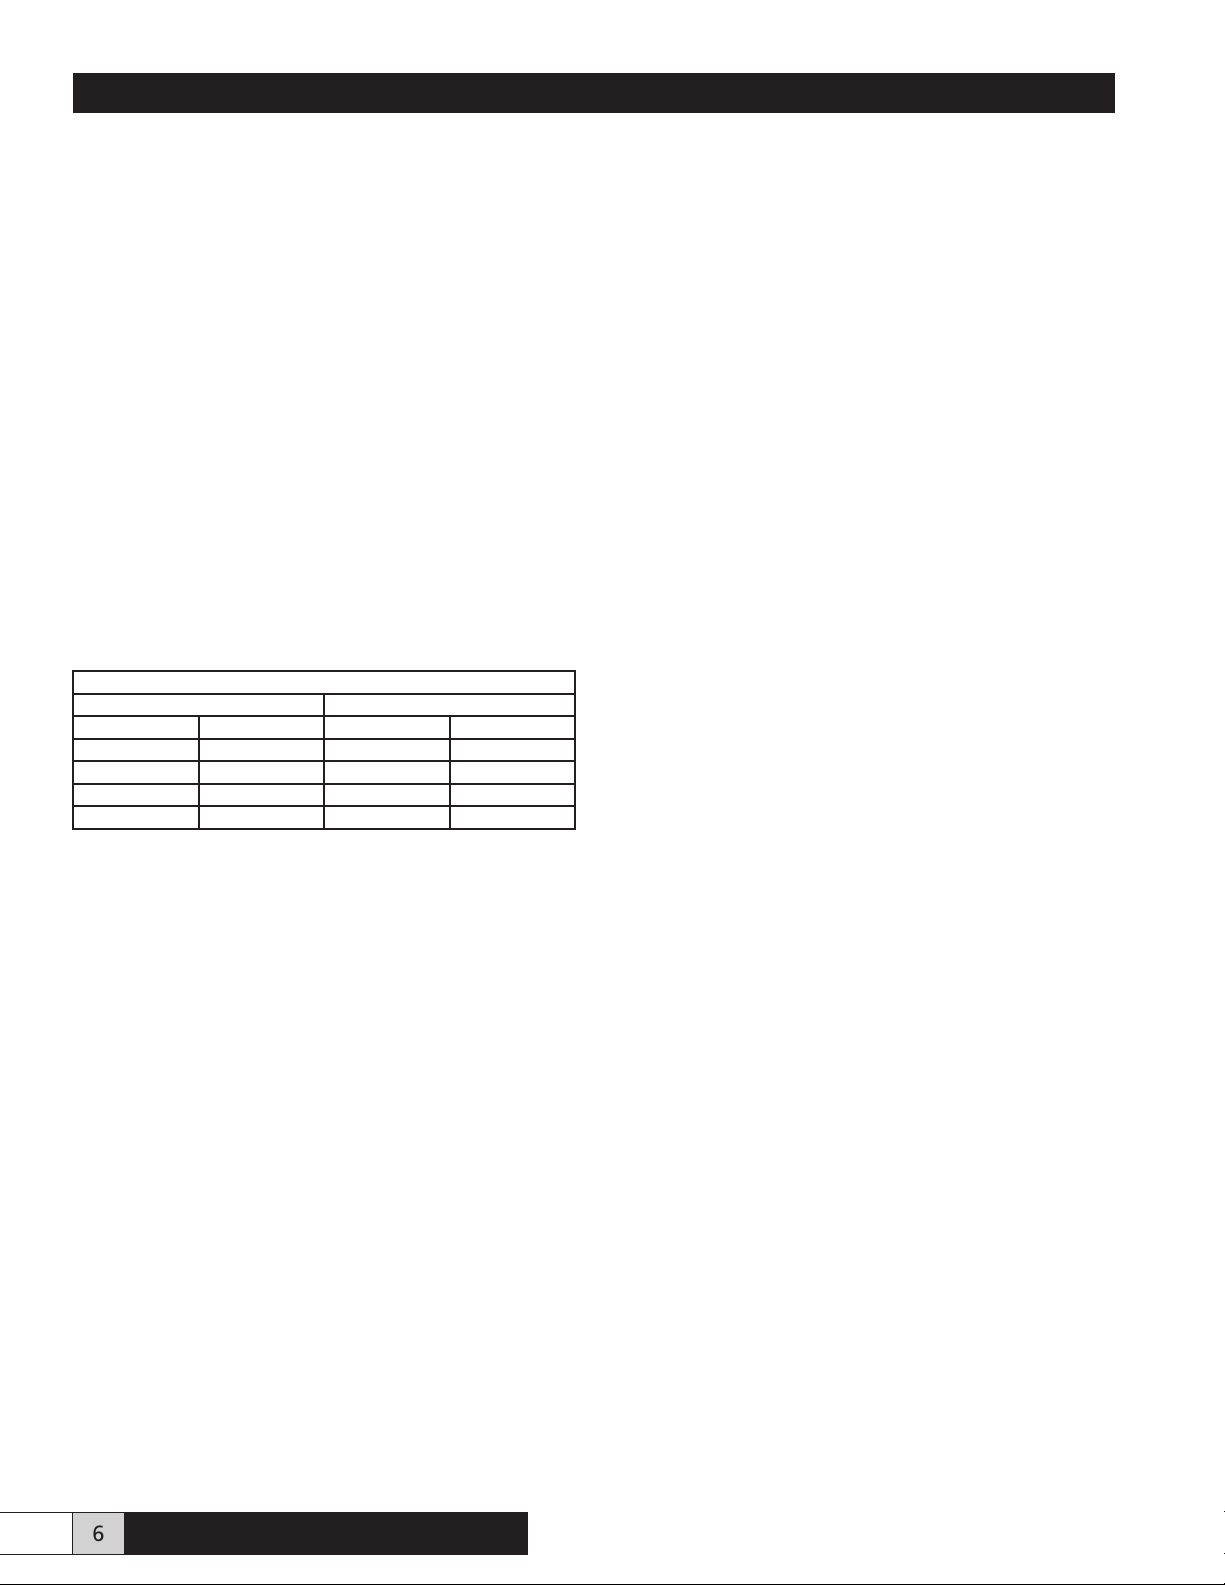
level. The following Table 1 -B illustrates various comfort
levels possible. As you can see from the chart, raising
the R.H. could result in your being able to lower the temperature, thereby saving energy. In this age of expensive
energy, this could be a big boost for any industry, ofce or
home. In addition the annoying parched throat, sore eyes
and dry nose may be eliminated. Generally, R.H. levels of
35% to 50% are considered to be in the comfort range.
Table 1-B
Comfort Levels vs. Temperature/Humidity
Factory Ofce
°F % RH °F % RH
65 40 68 45
68 30 70 40
72 20 76 25
78 10 79 20
Humidity And Dust
Dust is not only a cleaning and maintenance nuisance but
a common vehicle for microorganisms. It is well known
that the R.H. of the air will signicantly affect the amount of
dust in the air. A higher level of R.H. (50%) will cause the
particles to settle out of the air.
Also, dry air will pull moisture from the bers of carpets and
rugs causing them to become brittle, break off and oat in
the air. By raising the level of R.H. in the air this problem
can be signicantly reduced. For example, in one study a
carpet cleaned weekly, under low levels of relative humidity, produced 3 to 4 bags of broken bers or “fuzz.” After the
R.H. in the ofce was raised to 50% the weekly cleaning
produced only a half bag of “fuzz.” Needless to say, the
carpet life was probably extended, as well as a reduction of
dust from the bers of the carpet achieved.
Humidity And Its Effect On Bacteria And Virus Life
Several studies on various bacterial strains and viruses
have shown that at R.H. levels close to 50% these microorganisms fail to survive for long periods of time. Possible
explanations of this are that at low levels of R.H. these microorganisms can enter a “dormant” state and simply oat
around in the air until such time as they contact a moist
surface where they can become “active” again. At high levels of R.H. there is enough moisture in the air that these microorganisms may be able to thrive “actively.” In the middle
levels of R.H., near 50%, there is enough moisture in the
air that these microorganisms cannot remain “dormant,” but
not enough that they can thrive “actively” either.
“Dry Air” And Static Electricity
Dry air permits the buildup of static electricity charges
on machinery, materials and people. These electrostatic
charges may cause production problems because of the
electrostatic attraction built up between materials, unpleasant shocks to personnel, and in some cases, explosion
hazards.
Static electricity charges are built up by movement of
machinery and materials, such as in a printing press or
a spinning machine, by people walking across carpeted
oors, etc. These charges are constantly being generated
and their buildup and discharge are affected by the level
of R.H. Relative humidity levels above 45% will serve to
eliminate electrostatic charge buildup and discharge. What
happens when R.H. is higher is that an invisible moisture
lm will form on the surface of materials and equipment.
This lm contains impurities, from the air, which allow it to
be a conductor. As electrostatic charges are generated, this
lm conducts the charges to ground before they can build
up sufciently high to cause a spark to jump.
Control of static electricity is important in many industries.
Printing plants need to eliminate the static electricity caused
problems of erratic feeding, sticking sheets, tacky ink and
misregistration of color. Textile mills can ill afford to have
huge electrostatic charges build up on spindles and cards.
Data Processing is especially sensitive to static electricity
as it can cause malfunction by improper feeding of cards
and paper, brittle tape and electrostatic discharges. Explosive production areas must be humidied. To chance a
static discharge in an explosive atmosphere is extremely
dangerous.
6 w w w. h e r r mi di f i e r- h v a c . co m
L o a d C al c u l a t io n G u i de
Page 7
“Dry Air” And Hygroscopic Materials
L o a d C a l c u l a t i o n G u i d e
HYGROSCOPIC materials (those able to take on or give
up moisture) are particularly sensitive to humidity changes
in their environment. Materials so classied would include
wood and wood products, paper and paper products, textiles, leather, ceramics, food and a long list of others.
These materials respond to their environment by taking on or
giving up moisture, thereby changing their REGAIN. When
these materials nally reach a balance, where they are stable and no longer take on or give off moisture, they are said
to have reached their EQUILIBRIUM MOISTURE CONTENT
(EMC).
When a hygroscopic material is stabilized at is EMC for a
particular temperature and R.H., there is little effect on the
material. The problems begin when the R.H. begins to drop
and the air pulls moisture from the material, upsetting its
EMC. When the material loses moisture it will shrink, warp,
crack, check, become thirsty for solvents, etc. This causes
problems not only with the material, but also with the machinery, nishing processes, coatings and so on. Weight and
texture are also affected.
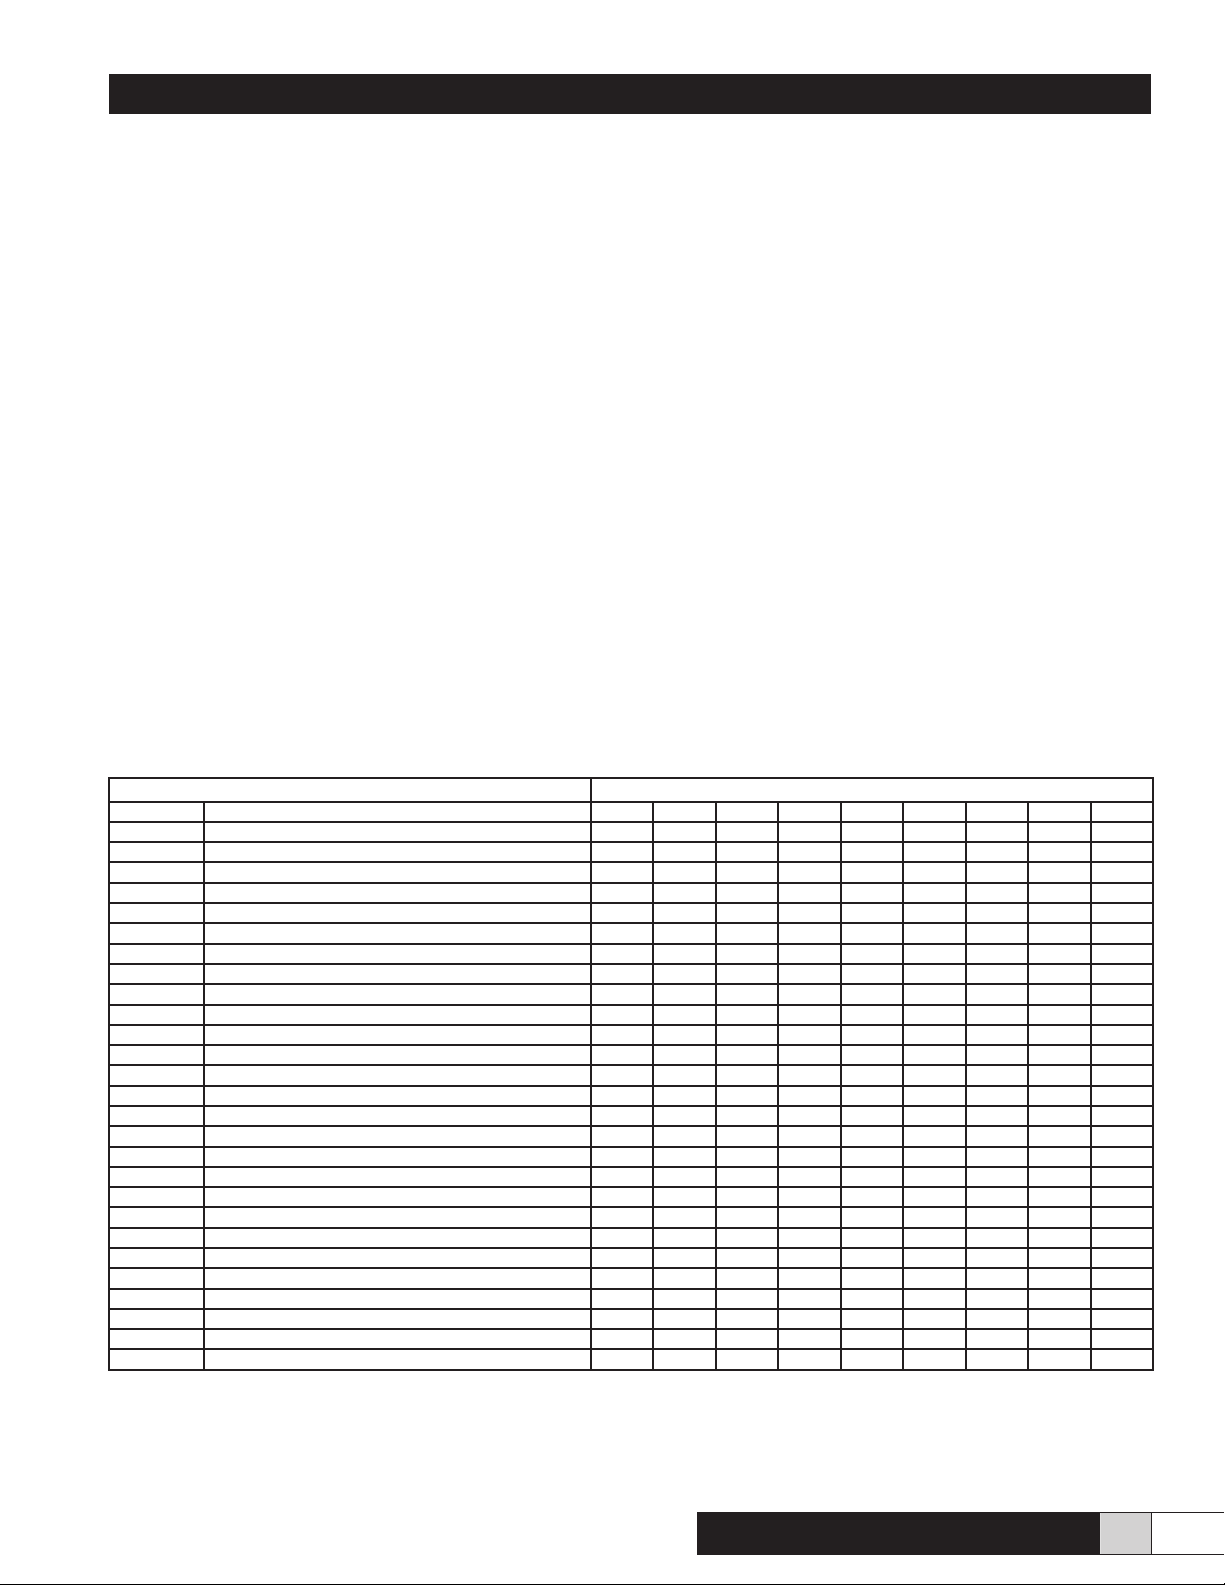
Table 1-C
Hygroscopic materials lose moisture to dry air... pick up moisture from humidied air. This can materially affect your prot!
REGAIN OF HYGROSCOPIC MATERIALS
Moisture Content expressed in Percent of Dry Weight of the Substance at Various Relative Humidities - Temperature 75 °F
When the EMC is upset to the point of damaging a product (cracking, splitting, warping) and rendering it unsaleable,
economic loss results. This includes the loss of any and all
energy required to make that product, (from the raw material rening to the nished product) if the product must be
scrapped, the additional energy input and labor expense
if the product is reworked, down time when machinery is
jammed or damaged and higher per piece costs if machinery must be run slower than normal to prevent electrostatic
buildup. For example, one woodworking plant reported savings of $900 a week after introducing controlled humidity to
the plant. One investment castings company reported savings of $4,800 per week and the textile industry was even
more dramatic with $6,700 per week! These savings are realized from better product workability, faster machine operation and production of less non-saleable units. Following is
a charge listing the Regain for several materials, after which
we shall take a look at some industries in depth.
Industry Materials Relative Humidity %
10 20 30 40 50 60 70 80 90
Baking: Crackers 2.1 2.8 3.3 3.9 5.0 6.5 8.3 10.9 14.9
Flour 2.6 4.1 5.3 6.5 8.0 9.9 12.4 15.4 19.1
White Bread 0.5 1.7 3.1 4.5 6.2 8.5 11.1 14.5 19.0
Leather: Sole Oak, Tanned 5.0 8.5 11.2 13.6 16.0 18.3 20.6 24.0 29.2
Printing: Paper-Com. Ledger - 75% Rag., 1% Ash 3.2 4.2 5.0 5.6 6.2 6.9 8.1 10.3 13.9
Paper-M.F. Newsprint - 24% Ash 2.1 3.2 4.0 4.7 5.3 6.1 7.2 8.7 10.6
Paper-White Bond Rag - 1% Ash 2.4 3.7 4.7 5.5 6.5 7.5 8.8 10.8 13.2
Paper-Writing - 3% Ash 3.0 4.2 5.2 6.2 7.2 8.3 9.9 11.9 14.2
Textile: Cotton - Absorbent 4.8 9.0 12.5 15.7 18.5 20.8 22.8 24.3 25.8
Cotton - American-cloth 2.6 3.7 4.4 5.2 5.9 6.8 8.1 10.0 14.3
Cotton - Sea Isle-roving 2.5 3.7 4.6 5.5 6.6 7.9 9.5 11.5 14.1
Hemp - Manila & Sisal 2.7 4.7 6.0 7.2 8.5 9.9 11.6 13.6 15.7
Jute - Average grade 3.1 5.2 6.9 8.5 10.2 12.2 14.4 17.1 20.2
Linen - Dry Spun - yarn 3.6 5.4 6.5 7.3 8.1 8.9 9.8 11.2 13.8
Rayon - Cellulose - Acetate-ber 0.8 1.1 1.4 1.9 2.4 3.0 3.6 4.3 5.3
Rayon - Cupromonium - Average Skein 4.0 5.7 6.8 7.9 9.2 10.8 12.4 14.2 16.0
Rayon - Vicose Nitrocel 4.0 5.7 6.8 7.9 9.2 10.8 12.4 14.2 16.0
Silk - Raw Cheyennes - Skein 3.2 5.5 6.9 8.0 8.9 10.2 11.9 14.3 18.8
Wool - Australian - Marino - Skein 4.7 7.0 8.9 10.8 12.8 14.9 17.2 19.9 23.4
Cigarette 5.4 8.6 11.0 13.3 16.0 19.5 25.0 33.5 50.0
Wood: Timber - Average 3.0 404 5.9 7.6 9.3 11.3 14.0 17.5 22.0
Glue - Hide 3.4 4.8 5.8 6.6 7.6 9.0 10.7 11.8 12.5
Misc.: Charcoal - Steam Activated 7.1 14.3 22.8 26.2 28.3 29.2 30.0 31.1 32.7
Gelatin 0.7 1.6 2.8 3.8 4.9 6.1 7.6 9.3 11.4
Silica Gel 5.7 9.8 12.7 15.2 17.2 18.8 20.2 21.5 22.6
Soap 1.9 3.8 5.7 7.6 10.0 12.9 16.1 19.8 23.8
Starch 2.2 3.8 5.2 6.4 7.4 8.3 9.2 10.6 12.7
L o a d C al c u l a t io n G u i de
w w w. h e r r mi di f i e r- h v a c . co m
7
Page 8
L o a d C a l c u l a t i o n G u i d e
Woodworking And Humidication
In the woodworking industry controlled humidication can often mean the difference between a protable operation and
bankruptcy. A company, manufacturing wood products, that
must reject one (1) out of ten units due to cracking, warping, splitting or checking suffers losses due to wasted raw
materials, wasted labor and wasted energy in the production
of nonsaleable items. These losses can be profound- particularly the energy loss, as this goes all the way back to the
cutting of the tree and transporting of the lumber. If the damaged unit can be reworked there is still the added cost of doing so. These losses and added costs must be added to the
costs of producing the other nine out of ten saleable units. It
is not hard to see why controlled humidication can result in
substantial savings for the woodworking industry.
WHY DOES WOOD CRACK OR WARP?
As wood loses moisture it shrinks. However, the tangential
shrinkage is much greater than the radial shrinkage. This
causes dimensional changes and instability in the wood and
the wood pulls apart, along the grain causing cracks. If the
wood is strong enough not to crack it will warp as the uneven shrinkage occurs. This is why it is important to condition wood to the proper Regain for best workability and then
stabilize it at the corresponding EMC by maintaining proper
humidity control.
WHAT IS THE BEST R.H. FOR WOOD?
The Regain should be between 5%-9% depending on the
species of wood and its use. This regain corresponds to the
EMC with 35%--45% R.H. air at 75°F. If you are able to
maintain the proper EMC Regain in the wood by maintaining the proper R.H. in the air surrounding it, rejects will be
sharply reduced, production efciency increased and prots
increased!
WHAT ABOUT GLUING AND FINISHING?
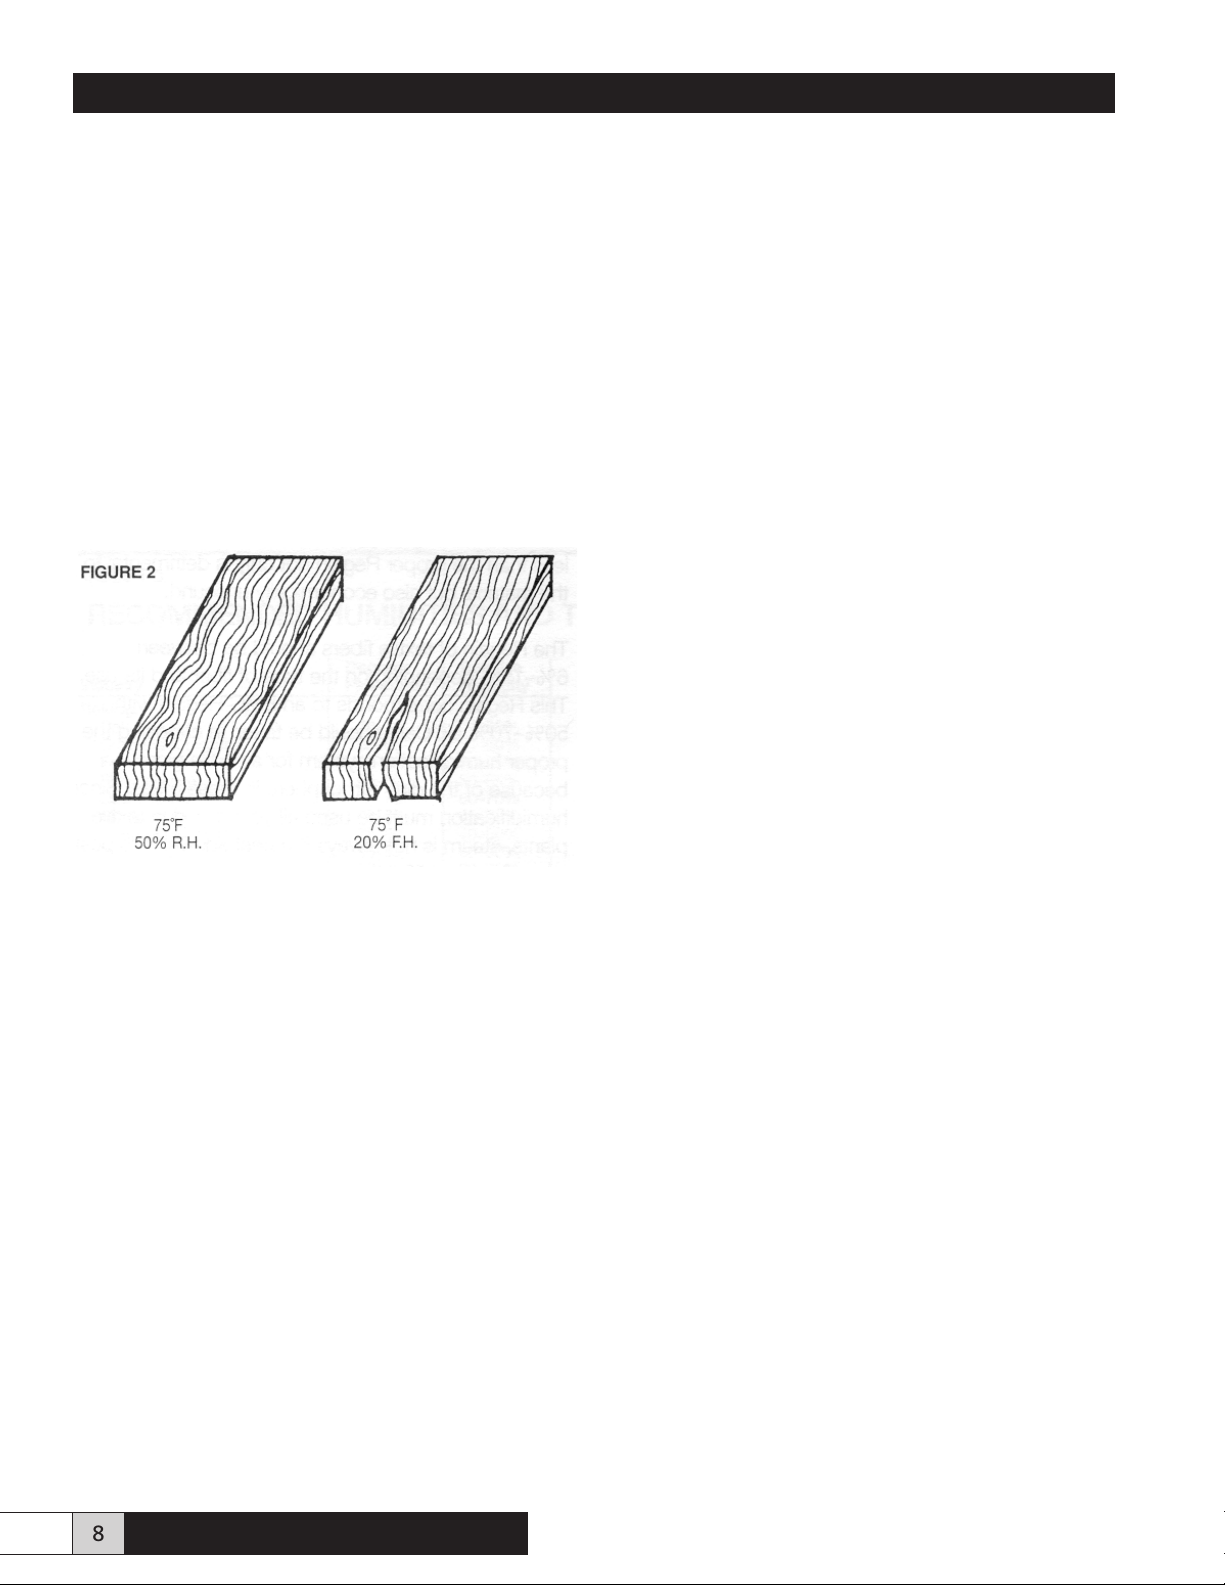
HOW IS WOOD AFFECTED BY HUMIDITY?
Wood is a hygroscopic material, able to take on or give up
moisture to the surrounding air. As wood takes on moisture
it swells. As it gives up moisture it shrinks. It does so in response to the changing atmospheric conditions of temperature and humidity, humidity having the greater effect. The
amount of moisture in the wood, expressed as a percentage
of its dry weight, is referred to as its REGAIN. This Regain
varies with temperature, relative humidity and type of material. When the Regain of a piece of wood reaches a balance,
where it is no longer taking on or giving up moisture, it is said
to have reached its EQUILIBRIUM MOISTURE CONTENT
(EMC) for that particular temperature and R.H. At this state
the wood is stable and will not change dimensionally. The
EMC changes with temperature and R.H. For example, a
piece of wood with an EMC regain of 9.3% at 75F 50% R.H.
will have an EMC regain of only 4.4% at 75°F 20% R.H. (See
Table 1-C.)
When dry thirsty air pulls moisture from it, the wood also becomes thirsty, so that when a varnish or other coating is applied the dry wood will act like a sponge and quickly absorb
the liquid. This leads to a dull nish or excessive use of coating to produce a bright nish. Glue will not cure properly or
quickly if the air and wood that it is in contact with are too dry.
WHAT R.H. DO I NEED FOR GLUING AND FINISHING?
Generally, 40%-50% R.H. is recommended for gluing and a
minimum of 60% R.H. recommended for nishing areas. You
must remember that if wood has not been conditioned previously and enters the humidied gluing and nishing areas
dry and thirsty, it will still produce the problems experienced
before. It is important to maintain the stability of your wood,
from start to nish, by proper humidity control. The economic gains from proper humidity control, can often pay for the
equipment in less than one year.
Paper Products And Humidication
The common problems experienced in every paper industry,
whether it involves manufacture of cardboard boxes, sheet
paper, etc. are: curling of stock, cracking on folds of paper
or boxes, failure to feed properly into machines and glue
that won’t hold. Generally these problems are experienced
in the winter heating season when the R.H. indoors is low.
Once again, the cause of these problems is moisture loss
from materials. Paper and paper products are made up of
brils. When these brils lose moisture they shrink and become brittle.
8 w w w. h e r r mi di f i e r- h v a c . co m
L o a d C al c u l a t io n G u i de
Page 9

L o a d C a l c u l a t i o n G u i d e
This brittleness contributes to cracking when the paper or
cardboard is folded, stretched or deformed. Weight and
strength are also reduced by this loss of moisture. Glues
sometimes will not hold, (for the same reasons as discussed
in woodworking) and printing of cardboard boxes dulls or
misregisters.
The recommended Regain of cardboard is 5% to 7%. This
corresponds to the EMC with air in the range of 40%-50%
R.H., depending on the composition of the paper. (Refer to
Table I -C.) Maintaining a proper level of R.H. will result in
less scrap, less rejects and increased production efciency
Printing And Humidication
The problems suffered in the printing industry are basically
the same as those found in the paper products industries.
The specic problems of the printing industry would include:
brittle paper, curling edges, smeared ink and electrostatic attraction between papers and rolls. These problems are, once
again, caused by dry air pulling moisture from the bers in
the paper.
Paper curling is caused because, as in paper products, moisture loss causes uneven shrinkage of the paper and causes
it to curl with the grain. This leads to difcult handling and
web breakage as paper is fed through the press.
An additional problem encountered in the printing industry
is that of electrostatic charge accumulation. As paper is unwound off a roll, or papers are shufed against each other,
they build up electrostatic charges which cause attraction
between sheets and rolls. The result is to cause the paper unwinding off a roll to pull taut. This also occurs as the
charged paper is attracted to the rollers in the press. These
attractions put undue stress on the paper and, since paper
under these conditions would be dry and brittle, web breakage, misregistration of colors, smeared ink and folding-jogging problems result. These problems are best eliminated by
maintaining a R.H. above 45%.
Huge electrostatic charges can be built up as textiles are
spun and wound. These charges also slow down equipment.
Losses from production problems caused, by dry air can
amount to more than $7,000 per week!
There are also economic reasons to humidify in the textile
industry. The bers used in textiles are hygroscopic and as
such can increase or decrease in weight as they take on or
give up moisture. For example, a cotton yarn shipment of
1,000 pounds that is a 2% Regain will contain 20 pounds of
water. Another shipment at 8% Regain contains 80 pounds
of water. Both shipments weigh 1,000 pounds, including the
water, but the one with 2% Regain has 60 more pounds of
cotton. If the selling price of this cotton is $.40 per pound
it costs the manufacturer of the 2% Regain yarn 60 x $.40
= $24.00 to provide cotton in place of water to match the
weight of his competitor’s shipment. You can see where selling a hygroscopic material by weight at less than the proper
Regain not only is detrimental to the material but also economically unsound.
The Regain of textile bers should be between 6%-15% depending on the type of ber and its use. This Regain corresponds to an EMC Regain with 50%-70% air. Care should
be taken in choosing the proper humidication system for a
textile plant, because of the dirty atmosphere in these areas.
Since humidication must be used all year round in textile
plants, steam is not always the best answer. It is best to consult a humidication expert.
Food Storage, Processing And Humidication
Almost all foods are hygroscopic and will be affected by humidity, or lack of it, with regards to quality, texture, freshness
and taste. Potatoes stored in special humidied and cooled
areas stay meatier and resist sprouting and spoiling for longer periods of time. Apples stored in a proper humidity controlled environment will last longer in a fresh saleable state.
Meats processed in controlled humidity retain their quality
and bright moist color.
The recommended level of R.H. needed in the printing industry is roughly the same as that needed for paper products,
again depending on the composition of the paper. Newsprint,
which is generally about 24% Ash, would require 50%-65%
R.H. Writing paper, generally about 3% Ash, requires 40%50% R.H. (Refer to Table 1 -C.)
Textiles And Humidication
Humidication is vital to the textile industry, both for material value and operation efciency. When the R.H. is too low,
the bers become brittle and will break causing shutdown of
machinery and excessive “y” in the air.
L o a d C al c u l a t io n G u i de
Many ripening fruits and vegetables can be enhanced by
proper humidity control. The level of R.H. in food storage and
processing areas is often high-as high as 95% R.H. while
temperature must be kept low. Because of this low temperature and high humidity the best humidication equipment for
this application is usually atomizing equipment, since it will
add some evaporative cooling. (As we shall see later
on.) For the proper humidication level of R.H. needed for a
particular food, consult Table 1 -D.
w w w. h e r r mi di f i e r- h v a c . co m
9
Page 10
L o a d C a l c u l a t i o n G u i d e
Leather Processing And Humidication
Proper levels of controlled humidity (40%-60% R.H.) will
keep leather soft and pliable, helping it to resist cracking
when handled and worked. Leather should be stored in a
humidity controlled environment before working it to ensure
that it is soft, pliable and at the proper regain. Different tanning processes will require different levels of R.H. (See Table
1 -D.)
A Humidication Synopsis
There is not a single industry that cannot use humidication
in some are of production, either for material or personnel
benet.
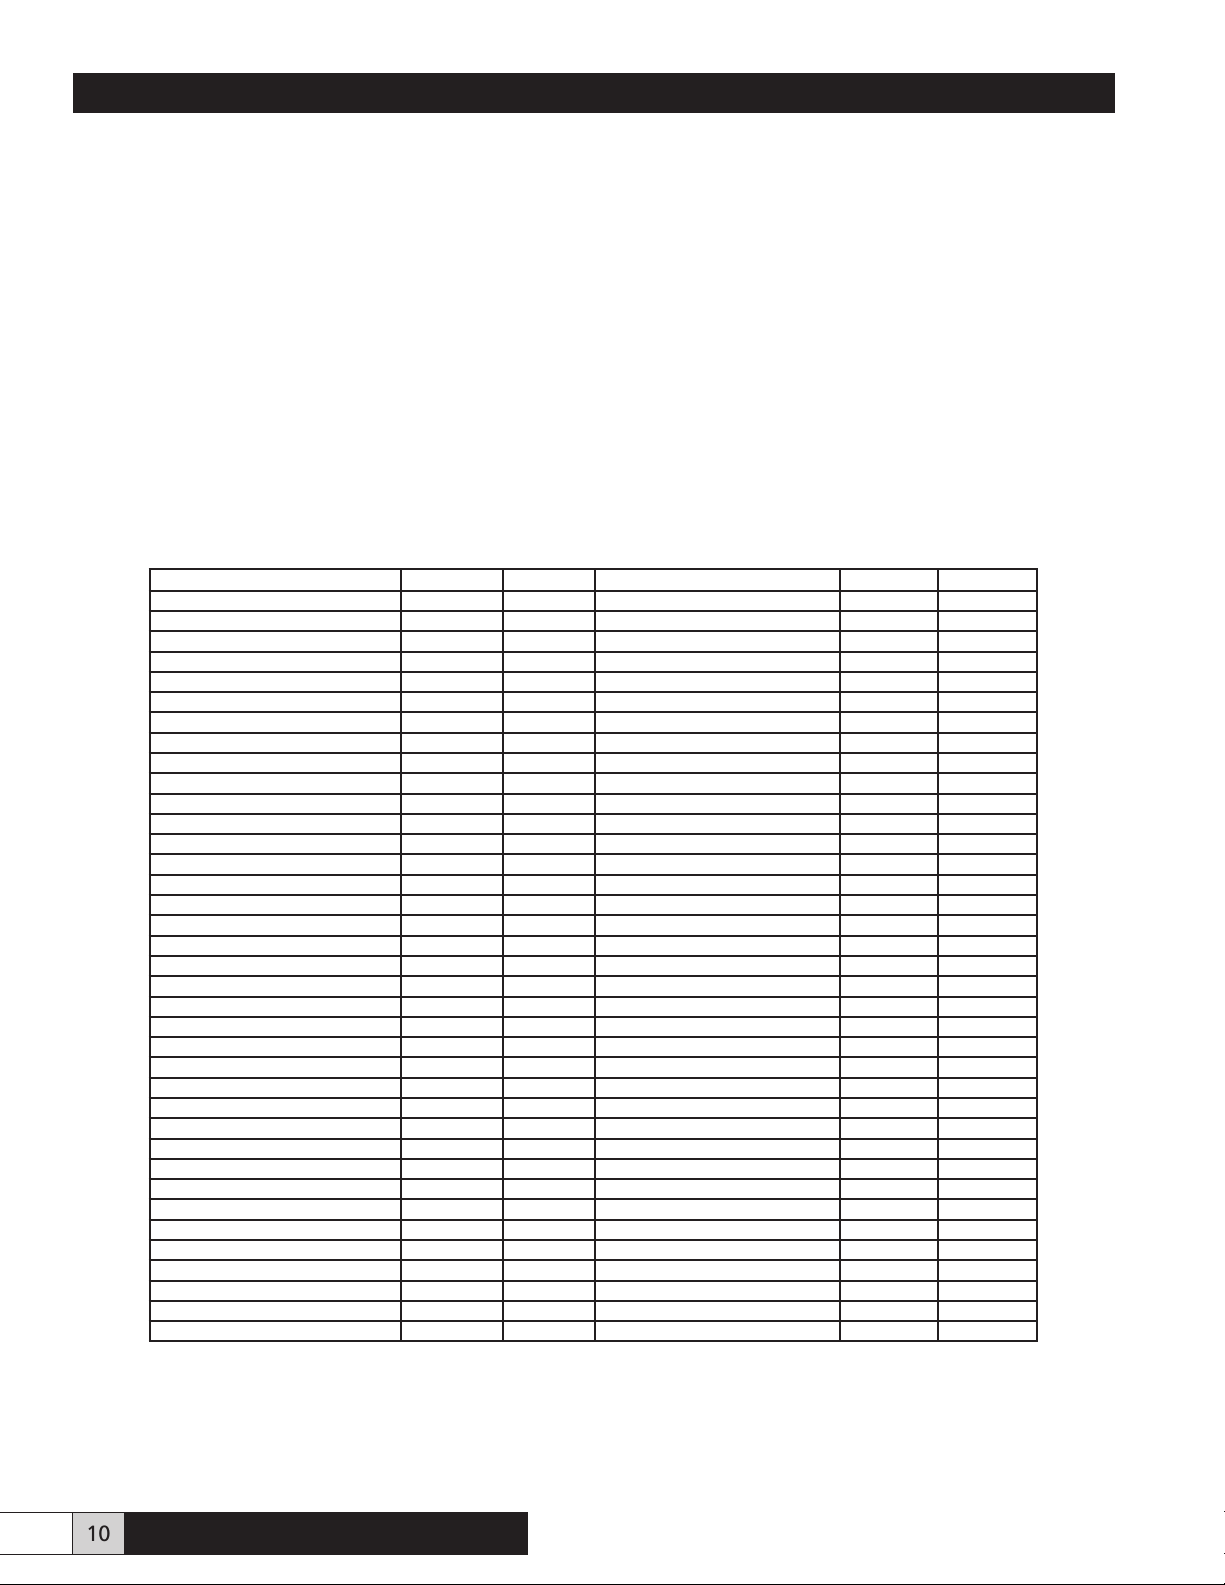
Table 1D
RECOMMENDED HUMIDITIES AND TEMPERATURES FOR VARIOUS INDUSTRIES
Industry °F % RH Industry °F % RH
Baking Hospitals:
Cake mixing 70-75 65% Nurseries 75 50-65%
Crackers & biscuits 60-65 50% Operating room 75 55%
Fermenting 75-80 70-75% Patients’ rooms 75 40-50%
Flour storage 65-80 50-65% Laboratories As required
Loaf cooling 70 60-70% Leather
Make-up room 75-80 65-70% Chrome tanned (dying) 120 45%
Mixer-bread dough 75-80 65-70% Vegetable tanned (drying) 70 75%
Proof box 90-95 80-90% Storage 50-60 40-60%
Yeast storage 32-45 60-75% Libraries & Museums 70-80 40-50%
Bowling Centers 70 35-45% Paint Application:
Cereal: packaging 75-80 45-50% Air drying lacquers 70-90 60%
Confectionary: Air drying oil paint 60-90 60%
Chocolate covering 62-65 50-65% Paper Products:
Centers for coating 80-85 40-50% Binding 70 50-65%
Hard candy 70-80 30-50% Printing & Folding 75-80 45-55%
Storage 60-68 50-65% Storage 75-80 40-60%
Cork Processing 80 45% Schools 72 35-50%
Computers: Textiles:
Data Processing 70-75 45-55% Cotton – carding 75-80 50-55%
Computer Mfg & Assembly 70-75 45-55% Cotton – spinning 60-80 50-70%
Electrical: Cotton – weaving 68-75 85%
Mfg. Cotton covered wire 60-80 60-70% Rayon – spinning 80 50-60%
Storage – general 60-80 35-50% Rayon – throwing 70 85%
Food: Silk Processing 75-80 65-70%
Apple storage 30-32 75-85% Woolens – carding 80-85 65-70%
Banana – ripening 68 90-95% Woolens – spinning 80-85 50-60%
Banana – storage 60 85-90% Woolens – weaving 80-85 60%
Citrus fruit – storage 60 85% Tobacco:
Egg storage 35-55 75-80% Cigar & cigarette 70-75 55-65%
Grain storage 60 30-45% Other processing & storage 75 70-75%
Meat – beef aging 40 80% Casing room 90 88-95%
Mushroom – storage 32-35 80-85% Woodworking:
Potato storage 40-60 85-90% Finished products 65-70 35-40%
Tomato –storage 34 85% Gluing 70-75 40-50%
Tomato – ripening 70 85% Manufacture 65-75 35-40%
Greenhouses 80 70-80% Painting – lacquer (static control) 70-90 60%
Ofces, hospitals, nursing homes, libraries, museums, furniture stores, bowling alleys, etc., all contain hygroscopic
materials (wood, carpets, etc.) which can be damaged by
dry air. Proper humication protects these materials and also
safeguard the comfort of personnel in these areas.
For an overview of some industries and their humidity requirements see Table I -D following. If your particular industry is not listed, contact Herrmidier Co., Inc. and we will
supply you with a humidication fact sheet for your industry
telling you why proper humidication is needed and how it
can be accomplished.
10 w w w. h e r r mi d i f i e r- h v a c. co m
L o a d C al c u l a t io n G u i de
Page 11

L o a d C a l c u l a t i o n G u i d e
SECTION III LOAD CALCULATIONS
Knowing that controlled humidication is needed is the rst
step toward increasing productivity and cutting losses. The
second, and most important step, is to accurately determine the amount of moisture required to be added to the air
to reach the target R.H. level. A humidication project that
starts out with good intentions can fall at because the demand load was not calculated accurately and too little or too
much humidication equipment was installed. Following is a
simple, accurate guideline for determining your MAXIMUM
HUMIDIFICATION DEMAND LOAD. Help with calculating
this can be obtained by returning form I/C DI-5 to Herrmidier.
The Psychrometric Chart
All humidication calculations involve knowing the maximum amount of moisture a given quantity of air can hold at
saturation (100% R.H.), and being able, by calculations, to
compare this with the amount of moisture present and that
which is desired in that air. The amount of moisture in the air
is measured in grains per cubic foot. This gure is used in
calculations to eventually arrive at a demand load, in pounds
per hour, for the area to be humidied. The following Table
2-A shows the grains of moisture per cubic foot of air at specic temperature.
Table 2-A
°Fahrenheit Grains °Fahrenheit Grains
-10 .29 52 4.41
-5 .37 53 4.56
0 .48 54 4.72
5 .61 55 4.89
10 .78 56 5.06
15 .99 57 5.23
20 1.24 58 5.41
25 1.56 59 5.60
30 1.95 60 5.80
31 2.04 61 6.00
32 2.13 62 6.20
33 2.21 63 6.41
34 2.29 64 6.62
35 2.38 65 6.85
36 2.47 66 7.07
37 2.56 67 7.31
38 2.66 68 7.57
39 2.76 69 7.80
40 2.86 70 8.10
41 2.97 71 8.32
42 3.08 72 8.59
43 3.20 73 8.87
44 3.32 74 9.15
45 3.44 75 9.45
46 3.56 76 9.75
47 3.69 77 10.06
48 3.83 78 10.40
49 3.97 79 10.80
50 4.11 80 11.04
51 4.26 81 11.40
82 11.75 107 24.26
83 12.11 108 24.93
84 12.49 109 25.62
85 12.87 110 26.34
86 13.27 111 27.07
87 13.67 112 27.81
88 14.08 113 28.57
89 14.51 114 29.34
90 14.94 115 30.13
91 15.39 120 34.38
92 15.84 125 39.13
93 16.31 130 44.41
94 16.79 135 50.30
95 17.28 140 56.81
96 17.80 145 64.04
97 18.31 150 72.00
98 18.85 155 80.77
99 19.39 160 90.43
100 19.95 165 101.00
101 20.52 170 112.60
102 21.11 175 125.40
103 21.71 180 139.20
104 22.32 185 154.30
105 22.95 190 170.70
106 23.60 195 188.60
There are basically three (3) humidication load factors and
two (2) humidication reduction factors:
HEATING LOAD: For desired R.H. at maximum indoor temperature maintained when outdoor temperature is at minimum heating design level.
COOLING LOAD: To replace moisture removed by condensation from cooling process -- air conditioning and/or refrigeration.
PRODUCT LOAD: To condition product to nal desired Regain when received under other conditions. This load could
be plus or minus.
PROCESS REDUCTION: Moisture vapors emitted by processes decrease humidication load.
PEOPLE REDUCTION: People give off 0.2 lbs. per hour
when seated; 0.9 lbs. per hour when active, thereby decreasing humidication load. We shall take a more, in depth,
look at these factors in this section.
L o a d C al c u l a t io n G u i de
w w w. h e r r mi di f i e r- h v a c . co m
11
Page 12
L o a d C a l c u l a t i o n G u i d e
Heating Load
To determine the maximum demand load due to heating observe the following steps.
Step 1. Determine the amount of moisture which must be
added per cubic foot of air to be humidied. As you know,
heating air lowers its R.H., but does not obliterate it, so the
moisture already in the cool air before heating must be determined and subtracted since this moisture is already available in the heated air. Using Table 2-A, rst determine the
maximum design indoor temperature and record the grains
of moisture listed to the right of that temperature, then multiply the grains (at 100% R.H.) times the desired level of R.H.
(a percentage) to arrive at the grains of moisture per cubic
foot of air necessary to maintain the desired R.H.
ALWAYS CONSULT AN
EXPERT AT THE START
Step 2. Determine the maximum volume of air per hour that
will need to have moisture added to it. Natural ventilation,
exhaust and makeup air must be considered. You should use
the largest of these, but not all three.
Example: A large woodworking plant.
1. The area of the plant is 100’ x 200’ x 15’H = 300,000
cu. ft. - If it is tight construction, you would use one air
change per hour. If it is loose or old construction - 1-1/2
air changes per hour. Three or four exposed walls and
shipping doors - 2 air changes per hour. Never use less
than one air change per hour unless sealed off with no
trafc in or out. In this example, the building has four exposed walls and two shipping doors. Volume of air to be
humidied is 300,000 cu. ft. x 2 = 600,000 CFH.
2. The plant contains exhaust equipment exhausting 20,000
CFM to the outside. This volume would be 20,000 CFM
x 60 min./hr. = 1,200,000 CFH. (Note that this volume is
greater than the volume calculated by plant area.)
3. The plant has a makeup air system that supplies 15,000
CFM of outside air to the plant. This volume is 15,000
CFM x 60 min./hr. = 900,000 CFH.
Now take the minimum design outdoor temperature (you are
essentially heating inltrated outdoor air) and its grains of
moisture (at 100% R.H.) times the minimum expected R.H.
to arrive at the moisture content already available before
heating.
Next simply subtract the outdoor design moisture from the
indoor design moisture and arrive at the grains of moisture
per cubic foot of air needed to be added to the heated air to
reach design conditions of R. H.
Example: (From Table 2-A)
Indoor Design Moisture @ 70°F 65% R.H.
8.10 gr. x .65(%) = 5.2 gr./cu. ft.
Outdoor Design Moisture @ 0°F 50% R.H.
.48gr.x.50(%) = .24 gr./cu. Ft.
The greatest volume of air is due to the exhaust - 1,200,000
CFH. This is the maximum volume of air that must be humidied in any given hour. You will note that we are exhausting 1,200,000 CFH but making up only 900,000 CFH. The
balance of 300,000 CFH is brought in by forced inltration
through cracks around doors, windows, etc. It is not this exhaust that we wish to humidify but rather, the air replacing it.
Step 3. THE MAXIMUM HEATING DEMAND LOAD is now
calculated using the following formula:
(step 1) (step 2)
gr. Moisture needed/cu. ft. x CFH air =
7,000 gr./lbs.
lbs. of water per hour required.
or, from the example:
5.02 gr./cu. ft. x 1,200,000 CFH = 860 lbs./hr.water
7,000 gr./lbs.
Indoor Design Moisture = 5.26 gr./cu. ft.
-Outdoor Design Moisture = .24 gr./cu. ft.
Moisture to be added = 5.02 gr./cu. ft
12 w w w. h e r r mi d i f i e r- h v a c. co m
L o a d C al c u l a t io n G u i de
Page 13
L o a d C a l c u l a t i o n G u i d e
So, the MAXIMUM HEATING DEMAND LOAD for the woodworking plant in the example would be 860 lbs. of water
needed to be added per hour when the outside air is at O°F.
Weather Data and Design Conditions (from the ASHRAE
Handbook) do NOT give sufcient information to determine
the moisture content of outside air at various temperatures.
It is necessary to seek assistance from the U.S. Weather
Traditional heating systems are rather easy to calculate humidication demand loads for, however, with the advent of
economizer cycle heating and cooling systems this calculation gets a bit more complicated as we shall see.
Bureau, Aviation Weather or the like in the area in which the
plant is located. You will need to know the MINIMUM level
of relative humidity experienced at the outside design temperature in the area and for 1O°F increments up to the temperature at which I00% outside air is admitted. With this data
Heating Load: Economizer Cycle
and the characteristics of the system, you can then calculate
the demand load for each outside temperature. The highest
In air handling systems using the economizer cycle, outside
air is added to return air in varying quantities to provide a set
mixed air temperature reaching the heating/cooling section
of the system. The amount of outside air added is based on
the outside air temperature and the desired mixed air temperature to be maintained. This volume of outside air is add-
load calculated becomes the maximum demand load for humidication. This maximum demand load will occur at some
outside air temperature OTHER THAN design temperature
when the Economizer Cycle is used. Following, in Tables 2-B
and 2-C, are typical characteristics of two economizer cycle
systems.
ed automatically in varying amounts as the outside air temperature changes. THE MAXIMUM DEMAND LOAD FOR
HUMIDIFICATION is based on the desired indoor conditions
the moisture content of the outside air added and the volume
of outside air being introduced.
TABLE 2-B: ECONOMIZER WITH 70 F RETURN AIR
Mixed Air Temp. °F % OUTSIDE AIR REQUIRED AT TEMP. SHOWN °F
-10° 0° +10° +20° +30° +40° +50° +55° +60° +65°
50° 25 29 33 40 50 67 100
55° 19 21 25 30 38 50 75 100
60° 12 14 17 20 25 33 50 67 100
65° 6 7 8 10 13 16 25 33 50 100
TABLE 2-C: ECONOMIZER WITH 75 F RETURN AIR
Mixed Air Temp. °F % OUTSIDE AIR REQUIRED AT TEMP. SHOWN °F
-10° 0° +10° +20° +30° +40° +50° +55° +60° +65°
50° 30 33 38 45 56 71 100
55° 23 26 31 36 44 57 80 100
60° 18 20 23 27 33 43 60 75 100
65° 12 13 15 18 22 29 40 50 67 100
The above information must be provided for the system being used. Tables 2-B and 2-C are typical only. Therefore the HUMIDIFICATION DEMAND LOAD for an economizer system such as that shown in Table 2-B could be calculated as follows:
EXAMPLE:
Indoor Design Conditions: 70°F 40% R.H. (8.10x.40=3.24 gr/CF) Mixed Fair Temperature: 55°F
Outside Design Temperature: -10°F System CFM: 30,000
Outside Temp. °F % R.H. Minimum (1) Outside gr/CF (2) % Air(3) (Outside) CFM Air (Outside) gr to Add* Load lb/hr
-10 70 .203 19 5,700 3.037 148
0 65 .312 21 6,300 2.928 158
+10 60 .468 25 7,500 2.772 178
+20 55 .682 30 9,000 2.558 197
+30 50 .975 38 11,400 2.265 221
+40 45 1.260 50 15,000 1.980 254
+50 40 1.644 75 22,500 1.596 308
+55 35 1.712 100 30,000 1.528 393
(1)From Weather Bureau; (2)From Table 2-A; (3)From Table 2-B above; *7,000 gr/lb.
Information in (1) above is the key to the solution. The maximum demand load for Humidication for systems using the Economizer Cycle is almost always at some outside temperature other than
the design temperature for the heating system.
L o a d C al c u l a t io n G u i de
w w w. h e r r mi di f i e r- h v a c . co m
13
Page 14

L o a d C a l c u l a t i o n G u i d e
Notice that the MAXIMUM HEATING DEMAND LOAD in this
example is 393 lbs./hr. which occurs at 55°F, not at design
outdoor temperature as with traditional heating systems.
Therefore, any humidication system installed to handle this
load will have to have a maximum capacity of 393 lbs./hr.
water output.
Cooling Load
As we have seen, moisture is removed by condensation during the cooling process as the air is cooled below its dew
point and then reheats to room temperature. This condensed
moisture must be replaced when its loss causes the R.H. to
fall too low. To determine the maximum demand load due to
cooling observe the following steps:
Step 1. Determine the amount of moisture per cubic foot of
air that will be removed by condensation during the cooling
process as this will have to be replaced. This is done by using Table 2-A to determine the grains of moisture per cubic
foot of air at indoor design temperature and R.H., then determining the grains of moisture per cubic foot of air after it has
been cooled and subtracting this gure from that obtained for
the design temperature and R.H.
In determining the amount of moisture in the air after it has
been cooled, it is necessary to know the air temperature
drop across the cooling coils. This is usually a 15°F drop
with standard air conditioning equipment, but can vary from
manufacturer to manufacturer. It is best to check. Further,
the R.H. of the air after cooling will be about 85% rather than
100% because, only that portion of the air in contact with
the cooling coils will be cooled to coil temperature with condensation resulting. The coil temperature will be less than
the exit air temperature. The following example will illustrate
Step 1.
Step 2. Determine the volume of air passing over the cooling coils per hour. This is usually about 400 CFM per ton of
rated capacity for standard air conditioning equipment, but
this may vary with the make of equipment. It is always best
to check. Computer room air conditioning equipment is often
designed for 500-800 CFM per ton of rated capacity.
Example:
60 ton air conditioning
60 x 400 CFM = 24,000 x 60 min./hr. = 1,440,000 CFH
Step 3. Since almost all standard air conditioning equipment
is usually slightly overrated to allow it to shut down periodically and defrost, it is necessary to determine the maximum
“ON” time during any given hour, since this is when moisture is being removed from the air. This is usually 80%, but
should be checked, as special equipment may be designed
to cool rapidly and use less “ON” time.
Step 4. The MAXIMUM COOLING DEMAND LOAD for humidication can now be calculated using the following formula:
gr./CF needed x CFH x “ON” time
7,000 gr/lb. = lbs./water req.
Using the preceding examples in Steps 1-3:
1.11 gr./CF x 1,440,000 CFH x.80 “ON” = 183 lbs.
7,000 gr./lb. water/hr.
In this example, the MAXIMUM COOLING DEMAND LOAD
is 183 lbs. water/hr. Therefore, any humidication system
installed to handle this load will have to have a maximum
capacity of 183 lbs./hr. water output.
Example:
60 tons air conditioning (standard) maintaining 70°F at 65%
R.H.
Moisture content of air at design
70°F, 65% R.H. = 8.10 gr./CF x .65(%) = 5.26 gr./CF
-Moisture-content after cooling
55°F, 85% R.H. = 4.89 gr./CF x .85(%) = 4.15 gr./CF
Moisture removed during cooling= 1.11 gr./CF
Therefore we must replace 1.11 grains of moisture per cubic
foot of air to return the air to the desired condition of 70°F,
65% R.H. after cooling in this example.
14 w w w. h e r r mi d i f i e r- h v a c. co m
Cooling Load- Low Temperature (32°F-47°F)
In special applications, such as cold storage, the cooling
equipment (refrigeration) is usually designed to have an air
temperature drop across the coils of less than 15°F, to move
a greater volume of air across the coils than the 400 CFM per
ton experienced with standard air conditioning equipment
and to have a denite “OFF” cycle for defrosting.
L o a d C al c u l a t io n G u i de
Page 15

L o a d C a l c u l a t i o n G u i d e
Air temperature drop across the coils can be considerably
less than 15°F and must be known to accurately calculate
the humidication demand load for cooling. Also, the CFM
air ow across the coils is high and combined with the small
temperature drop, across the coils, will result in less moisture being condensed out of the air onto the coils. Generally,
its safe to gure the exit R.H. at about 90%-95% R.H. The
“OFF” cycle for defrosting is a denite and planned period
during each 24 hours and is usually expressed as “Runs 16
hours out of 24.” You should NOT correct for the “OFF” cycle
in this case since the equipment runs continuously for 16
hours and will remove moisture that must be replaced, continuously.
Example:
Design Conditions: 34°F 95% R.H.
Cooling Capacity: 30 Tons
24,000 CFM across coils
10°F Air temperature drop
Room Air:
34°F 95% R.H. = 2.29x.95(%) = 2.18 gr./CF
-Exit Air:
24°F 90% R.H. = 1.50x.90(%) = 1.35 gr./CF
Moisture removed by Cooling = .83 gr./CF
Using humidication demand load formula:
24,000 CFM x 60 min./hr.x.83 gr./CF = 170 lbs/hr. water
7,000 gr./lb.
Product Load
Many products made of or containing hygroscopic materials
will absorb or give up moisture and as such will need to be
conditioned to the proper Regain for shipment. This load only
occurs as a viable factor in the overall MAXIMUM HUMIDIFICATION DEMAND LOAD when large amounts of products
are being conditioned rapidly, such as textiles. The procedure for determining the product load is relatively simple if
you observe the following steps.
Step 1. Determine the MAXIMUM change in Regain of the
material during processing, using Table I-C to determine the
Regain of the material before and after conditioning and nd
their difference.
Example:
A plant processing 40 tons/hour of product received at 4%
Regain and shipped at 5% Regain will need to add 1% gain
as follows:
Shipping Regain = 5.0%
-Regain when received = 4.0%
Gain = 1.0%
Step 2. Determine the MAXIMUM amount of product, in
pounds, to be processed in any one hour.
Example:
40 tons/hr. x 2,000 lbs/ton = 80,000 lbs. hr.
Therefore, a humidication system designed to handle this
demand must be able to supply a maximum of 170 lbs. water
per hour. The above factors are for illustration. The individual
factors must be determined for each special application. It is
helpful to consult a humidication expert who, no doubt, has
had prior experience with these special applications.
Herrmidier has had extensive experience in all elds of low
temperature humidication, including cold storage as low as
34°F. For a list of previous installations or sizing and recommendations for your own application consult your Herrmidier Representative.
The Herrmidier dual-pneumatic atomizing system is particularly adaptable to cold storage humidication applications.
It has been used successfully to maintain levels as high as
95% R.H. at temperatures as low as 34°F without wetting of
oors.
Step 3. Calculate the MAXIMUM PRODUCT LOAD by taking the maximum amount of product processed per hour
times the gain needed.
Example:
80,000 lbs./hr.x.01 (% gain) = 800 lbs. water/hour
Therefore, any humidication system designed for this application will have to have a maximum capacity of 800 lbs.
water per hr. IN ADDITION to any heating or cooling load.
L o a d C al c u l a t io n G u i de
w w w. h e r r mi di f i e r- h v a c . co m
15
Page 16

L o a d C a l c u l a t i o n G u i d e
Process Reduction
From measurement or design data, determine the amount of
moisture vapor being given off by any sources in the plant,
such as hot water washes, steam curing, etc. This will decrease the maximum demand load for humidication whenever the process is in operation. Be sure it is effective at all
times that the maximum demand load for humidication is
being experienced.
People Reduction
People present in an area will give off moisture and, if enough
people are present, can affect the maximum humidication
load. People give off moisture at a rate of approximately .2
pounds per hour per person if seated and .9 pounds per hour
per person if active. This moisture can be deducted from
the maximum humidication demand load. Be sure these
people are present at all times when the maximum humidication demand load exists, because when they leave, the
maximum humidication demand load will increase by that
amount and if the humidication system was designed for
the load with people present, it will be undersized and unable to maintain the desired level of R.H. which could result
in product damage.
Maximum Demand Load For Humidication
4. Consider the dew point of the humidied atmosphere and
be aware of condensation problems that can occur on cold
surfaces such as: steel roof deck, single glazed windows,
aluminum window and door frames, etc. Dew point is the
temperature at which condensation will begin to occur when
the humidied air is cooled to that level.
5. Check the psychometrics and be sure the volume of air
can absorb the amount of water vapor you will be adding.
(DO NOT EXCEED 100% R.H.)
6. Cold air is difcult to humidity as it does not give up heat
as readily. Special equipment must sometimes be used.
7. Cold fresh air make-up can cause condensation problems
in ducts. Be careful where humidity is introduced.
8. “Free Cooling” using cold outside air can be costly by adding greatly to the maximum demand load for humidication.
It is usually more economical to recirculate the humidied air
and cool it, as required, using air conditioning or refrigeration
equipment.
9. Be sure adequate services are available, or can be obtained; i.e., water, water pressure, electrical, compressed air,
steam, etc.
THE MAXIMUM DEMAND LOAD FOR HUMIDIFICATION
for a plant or building consist of: the Heating or Cooling load,
whichever is greater, plus or minus the Product load (if any),
minus the Process reduction (if any) and the people reduction (if any). There are several other factors and pitfalls to be
aware of. These will be discussed next.
HELPFUL GUIDE LINES
1. Area to be humidied must be isolated from non- humidied areas as moisture travels to dry area by Dalton’s Law of
Partial Pressures. Open doors, elevator shafts, etc. will allow
moisture to escape.
2. WHen a common air handling system is in use and the
area to be humidied is served by a part of the system, you
must consider the air and moisture lost to non-humidied areas in guring demand load, or you must humidify all the air
delivered to the humidied areas by the system; also, this
moisture loss to other areas can cause problems in those
areas if not properly controlled.
3. Be sure the structure will handle the level of relative humidity desired without damage due to condensation, etc.
Moisture migration into wails with no vapor barrier can create problems. Vapor barriers must be installed properly to
be effective in preventing moisture migration from humidied
areas. All barrier joints must be air tight.
10. It is critical to understand your water prior to selecting a
humidication system. Forward a complete water analysis or
water sample to Herrmidier and we can help you optimize
your equipment selection or suggest water pretreatment to
minimize maintenance and maximize performance.
11. For ducted applications, atomization systems require
special application considerations to insure complete evaporation and no duct wetting. Proper selection of controls,
modulation technique and installation location is critical to
satisfactory performance. Please contact Herrmidier for a
copy of our “Herrmidicool Technical Manual” prior to designing your system.
12. Consider rst cost, operating cost, installation cost and
the equipment’s ability to maintain your design conditions
under your system psychrometric limitations. Water quality is
vitally important as well. Simply using DI or RO water with a
system does not eliminate potential water problems!
13. Any humidication system must be accessible for maintenance, especially periodic cleanings.
Energy consumed in humidifying is of great importance.
Be sure to consider the efciency of the equipment you
select.
16 w w w. h e r r mi d i f i e r- h v a c. co m
L o a d C al c u l a t io n G u i de
Page 17

L o a d C a l c u l a t i o n G u i d e
SECTION IV TYPES OF EQUIPMENT
There are basically three types of humidication equipment: Atomizing, Evaporative and Steam. The type of humidication equipment used for any application is extremely
important and should be carefully selected with regards to
the level of R.H. desired to be maintained, the amount of
moisture needed to be added, services available, use of the
area being humidied, feed water equality and energy efciency. Following is an overview of each type of humidication equipment.
Atomization
This type of humidication equipment uses either CENTRIFUGAL or PNEUMATIC forces to break water up into a
ne mist which is discharged into the atmosphere where it
evaporates to the vapor state. This process is endothermic
and takes latent heat from the air to evaporate the mist. (1
000 BTUs are required to evaporate one pound of water.)
Because atomization takes only enough heat from the air
as is needed to evaporate the water, it is usually a very efcient process. Atomizing equipment must be able to deliver
tiny droplets of a consistent size over a relatively narrow size
range. No large droplets should fall before turning to the vapor state as this may cause damaged goods, wet oors, etc.
This puts physical limitations on capacities that can be realized and/or successfully applied in given situations under
known conditions.
to form tiny droplets. Some type of air moving method, usually air vanes, is needed to pick up the mist and convey it into
the air space to be humidied. This type of equipment works
well in the lower capacity ranges (a few pounds of water per
hour) both as free standing or installed in an air handling
system. Larger capacities run into droplet size problems. If
this type of equipment is used in a dirty atmosphere serious
clogging problems result and considerable maintenance is
required to keep its efciency at a satisfactory level. Also,
since there is usually a reservoir and air movement through
the equipment, algae formation and drying minerals can
result in clogging and the need for frequent maintenance.
Water spray nozzles that do not use air are considered to
be centrifugal atomizers and are NOT suited for humidifying
since their droplet size is seldom small enough to prevent
wetting of oors and materials.
Every droplet in the ne mist has the same chemical makeup
as the water supplied to the equipment. When the droplets
evaporate to the vapor state, minerals are left behind in the
form of a white powder-referred to as Mineral Fallout. Use of
softened water does NOT alleviate this problem because in
softening one mineral is simply being substituted for another.
Demineralizers and use of the Reverse Osmosis Process
will remove the minerals and prevent Mineral Fallout. This
Mineral Fallout is usually not a problem except that it is undesirable in certain applications such as computer rooms and
hospitals. There are basically two types of atomizing equipment: Centrifual and Pneumatic.
CENTRIFUGAL ATOMIZERS pump water from a reservoir
onto a rotating disc impeller. The centrifugal force created
throws the water against a breaker screen
PNEUMATIC ATOMIZERS use air pressure to break up water into a ne mist. A much smaller droplet size in the mist is
more readily attained with pneumatic atomizers
L o a d C al c u l a t io n G u i de
w w w. h e r r mi di f i e r- h v a c . co m
17
Page 18

L o a d C a l c u l a t i o n G u i d e
than with centrifugal atomizers. Pneumatic atomizers are
usually manufactured as heads which can be installed on a
ceiling or in a duct. Some pneumatic atomizers use only air
under pressure, and others use air and water under pressure.
A Pneumatic Atomizing System that uses only air under
pressure and draws water from open, nonpressurized tanks
is called a GRAVITY SYSTEM. This type of system uses
about 25 CFM of air per 100 lbs. of water atomized per hour,
or more. It is highly susceptible to algae and bacteria growth
in the tanks and clogging is a constant problem. Atomizing
heads of this type often drip at the end of an “ON” cycle and
therefore should not be placed over valuable equipment or
material.
Pneumatic atomizing heads that use air and water under pressure are called DUAL-PNEUMATIC ATOMIZING
HEADS. This is generally a closed system that works well
in unclean atmospheres. Air consumption is much less than
that for the gravity system, and there are no tanks to collect
algae and bacteria. Most of these systems however, will drip
on “start up” because the air and water line are pressurized
at the same time and water will split out of the head before
sufcient atomization pressure has built up in the air lines.
On “shut down” dripping may also occur because of residual
pressure in the water lines. Although most dual-pneumatic
atomizing heads contain a cleaning pin which effectively
cleans the water orice, droplets of water left in the atomizing
section of the head will evaporate and leave minerals behind
which can eventually clog the head. A frequent maintenance
schedule must be followed to insure that the heads will continue to operate satisfactorily.
HERRMIDIFIER’S DUAL-PNEUMATIC ATOMIZING SYSTEM uses a dual-pneumatic head which is activated by water
pressure so that no water can ow without being pressurized.
The design of the head allows the use of only 12 CFM of air
per 100 lbs. of water atomized, not the 25 CFM required by
some others! A special control system prevents water from
owing until sufcient air pressure has been reached to atomize every drop of water allowing not one drop to fall to the
oor! A stainless steel cleaning pin cleans the water orice
at the end of each “ON” cycle and the special control system blows the atomizing section of each head dry to prevent
dripping and clogging. The no-drip feature of this ingenious
system permits it to be installed right over production areas
with no fear of water dripping on equipment or materials. The
self- cleaning mechanisms of the system is so effective that
YEARLY MAINTENANCE is all that is required. The low air
and energy consumption of this system make it especially
attractive with today’s energy shortage.
Applications would include: woodworking, leather working,
textiles, bakeries, cold storage, printing, paper and investment casting. (See Bulletin I/C DP.)
HERRMIDIFIER’S HERRMIDIGOOL IN-DUCT AIR/WATER
ATOMIZING SYSTEM incorporates Herrmidier’s patented
Dual-Pneumatic atomizing heads and utilizing a system of
either pneumatic, electric or electronic control provides for
the installation with an air-handling ducted system. This
system automatically adjusts its output to exactly match demand. The adjustment is accomplished by either modulating
the ow rate of the water to the heads or by individually modulating each head. Multiple systems installed within one air
handier can be staged to insure maximum energy efciency.
Humidity receivers and transmitters installed within the air
handler and monitored through the Herrmidicool controls
cabinet insures the maintenance of precise levels of relative
humidity and provide that saturation and condensation will
not occur.
The need and the preference for an induct atomization humidication system is evident for both the benets of controlled humidication, as well as evaporative cooling. The
evaporative cooling benet is derived from the energy required to evaporate a pound of water. With a Herrmidicool
system, this energy is drawn directly from the ambient air
and is properly referred to as a conversion of sensible heat
to latent heat. As this energy is drawn from the air, a corresponding depression of the dry bulb temperature occurs and
thus “free cooling” is
provided. This can be directly translated to savings in mechanical cooling. The use of either de-ionized or reverse osmosis processed water allows for the use of this system in
clean room environments. Applications would include: Ofce
Buildings, Clean Rooms, Computer Rooms, and Manufacturing Areas. (See Bulletin I/C-HC.)
18 w w w. h e r r mi d i f i e r- h v a c. co m
L o a d C al c u l a t io n G u i de
Page 19

L o a d C a l c u l a t i o n G u i d e
Evaporation
This process actually evaporates the water to the vapor state
before it is discharged into the air. No droplets of water enter
the humidied air. Minerals contained in the water are left behind in the humidication equipment and must be removed
by periodic cleaning. No mineral fallout is experienced with
this type of equipment. Generally a bleedoff or blowdown
mechanism is built in to ush away concentrated minerals
and lengthen maintenance periods. Evaporative equipment
will work well on any quality of water.
Evaporation will occur off the surface on an open pan of water or off a saturated sponge. Since it requires 1000 BTU’s to
evaporate one (1) pound of water, heat is often added to the
water or air to enhance evaporation. There are four types of
evaporative humidiers: heated water and media, pan-coil,
heated air and media and air washers.
HEATED WATER AND MEDIA humidiers use a wetted
media through which heated water is poured and air blown
through to pick up the moisture. Although effective, large
amounts of heated water and energy are poured down the
drain in the necessary constant blowdown process. These
units are usually placed on a supply duct and therefore add
to the static pressure and blower costs. Overall energy efciency of this type of evaporative humidier is very poor.
AIR WASHERS use the evaporative process by passing
air over a continuous lm of water owing over deectors
which present a large surface of water in contact with the air.
The resulting surface evaporation raises the R.H. of the air.
Because of the evaporative cooling and their large size and
cost, air washers are usually used as evaporative coolers,
puriers AND humidiers. It is necessary that efcient “demistors” be placed in the air stream after the washer section
to remove and drain any water droplets that may have become entrained in the air stream. This often results in high
static loss across the washer. High levels of R.H. usually
cannot be attained by this method of humidication. (Upper
limit is about 55% R.H.)
Steam
This process injects live steam into the air to be humidied
either via manifold in a ducted air system, or direct discharge
into the area. Where good quality steam is available in sufcient quantities, a central steam humidication system will
have a very low “rst cost.” Where a steam boiler must be
installed for humidication, its rst cost is comparable to other forms of humidication. A steam boiler for humidication
must be able to supply good quality steam with very little
droplet entrainment. Any droplet entrainment will result in
mineral clogging of the humidication equipment since these
droplets contain the same chemical makeup as the water in
the boiler.
A central steam humidier consists of a condensate separator (to remove slugs of condensate) and a distribution
manifold (for insertion in ducts) or outlet (for area dispersion). Generally the steam ows through the control value
into the separator manifold. This is where any solid water
particles fall out of the steam providing a good quality steam
for humidication. The Herrmidier Herricane CS Series is
designed for low steam velocities in the distribution tubes
resulting in very low noise levels. The distribution tubes are
also engineered to return any condensate to the header. The
stainless steel nozzles receive their steam from the middle
of the distribution tube where the driest steam is available.
Care must be taken to ensure that any spitting, caused by
heavy slugs of condensate, will not damage duct work or
materials positioned beneath an area steam humidier.
L o a d C al c u l a t io n G u i de
w w w. h e r r mi di f i e r- h v a c . co m
19
Page 20

L o a d C a l c u l a t i o n G u i d e
HERRMIDIFIER’S HERRICANE CS SERIES provides the
ultimate in performance and cost effectiveness in four distinct product families. Each Herricane CS series humidier
offers energy efciency with its standard non- jacketed design, noise minimization compliments of an exclusive nozzle
design and “Guaranteed Evaporative Distance” (G.E.D.) as
a result of its total system design. For complete details of the
Herricane product family, ask for the “Herricane CS Series
Application Guide.”
As we have seen, there are various types of humidication
equipment, each with various advantages and disadvantages according to application.
ATOMIZING equipment is the most energy efcient. It is
ideal for industrial plants, printing plants, bakeries, woodworking, etc. Also, since it adds evaporative cooling, it will
reduce cooling loads and is excellent for use in cold storage
or textile where humidication is needed year round. This
type equipment is also installed in the duct, as Herrmidicool.
HERRMIDIFIER’S HERRTRONIC electronic steam humidiers provide the features required for a variety of needs. The
Herrtronic AD adjusts to incoming water conditions, has diagnostics to aid troubleshooting, indicator lights to show operating conditions and is controlled by an on-off device. The
Herrtronic MD is microprocessor based. It has a user friendly
key pad and features diagnostics, networking up to 29 units,
P & I control and can proportion off a control or a limit input!
Both units are backed by a limited 2-year warranty and are
ETL and CSA listed. (See AD/Bro or MD/Bro.)
EVAPORATIVE equipment is both energy efcient and dust
free, but cannot attain high levels (over 65% R.H.) of R.H. as
needed in cold storage or baking. It is best suited for computer rooms, ofces, schools, libraries etc. Dusty industrial
atmospheres can easily cause clogging of medias - this application should be avoided. Air washers because of their
size and cost, are almost always used for evaporative cooling and ltering as well as humidication.
STEAM equipment is the least energy efcient due to low
boiler efciency, transmission losses, condensate losses and
heat addition, but is the most sterile thereby lending itself
useful for hospitals, nursing homes, laboratories, etc. The
use of the new self-contained steam humidiers increases
the energy efciency of this type of equipment.
The type of humidication equipment used is often as important as the amount of equipment needed. It is best to consult
the experts at Herrmidier Company, Inc. and let them determine both the amount and type of humidication equipment
best suited to your needs.
20 w w w. h e r r mi d i f i e r- h v a c. co m
L o a d C al c u l a t io n G u i de
Page 21

L o a d C a l c u l a t i o n G u i d e
HERRMIDIFIER SALES REPRESENTATIVE:
101 McNeill Road ________________________________
Sanford, NC 27330 ________________________________
FAX : 919-777-6300 ________________________________
PHONE: 919-775-2201
www.herrmidier-hvac.com
cs@herrmidier-hvac.com
DESIGN INFORMATION FOR INDUSTRIAL / COMMERCIAL HUMIDIFICATION
IMPORTANT: Please supply all information requested. Accurate data needed to calculate the maximum demand load and select
proper type of equipment.
DATE:_____________________
NAME OF END USER______________________________________________________________________________________
ADDRESS________________________________________________________________________________________________
PHONE NO._______________________________PERSON TO CONTACT____________________________________________
NAME OF AREA TO HUMIDIFY_______________________________________________________________________________
DESCRIBE PROCESSING TO BE DONE IN THIS AREA___________________________________________________________
CONDITIONS: Desired Level of R.H. ___________% ACCURACY ±_____________%
Maximum Temperature in Area: During Heating Season _________°
During Cooling Season _________°
What is the Minimum Outside Design Temperature in Your Area__________°
Is Explosion Proof System Required?_______________________________.
AIR VOLUME: Size of Area to be Humidied: L_________ W__________ H__________
How is Area Isolated From Non-Humidied Areas In The Building? __________________________________________
Total CFM Air Exhausted from area: Winter____________________ Summer_______________________
Is Exhaust Continuous or Intermittent? ____________________ If Intermittent, Longest Period of Operation in any one hour of
time_______.
(Note: Vacuum Equipment Exhausting Outside the Area is same as exhaust)
Total CFM of Make-Up Air Units supplying the area: Winter_______________ Summer________________
Is Make-up Continuous or Intermittent? __________________
If Intermittent, Longest Period of Operation in any One Hour of Time ____
Are these systems shut down when the plant is not in operation?
Exhaust:______________________________________ Make-Up Air:______________________________________
Any Open Doorways? __________ Stairways? __________ Elevator Shafts? __________
Total Areas of Each: __________ __________ __________
CONSTRUCTION DETAILS: Loose or Tight? _________ Insulation? Walls________ Roof_________
Materials? Brick_____ Block_____ Frame _____ Steel _____
Vapor Barriers? Roof _____ Walls _____ Floor ______
Total Window Area ________________ Sq. Ft. Single or Dbl. Glased?
HEATING SYSTEM: Type: Warm Air ______ Hydronic ______ Steam ______ Elec. ______
Fuel: Oil ______ Gas _______ Coal _______ Elec. _______
Unit Heaters? _________ Ducted Distribution? ________
If Ducted: Total Fan Capacity ________________CFM Outside Air Added _______________CFM
Warm Air Supply Temp. _________°
Does Air Mix with Air from other Non-Humidied Areas? _________________________________________
If so, total CFM Air delivered to area to be humidied: ___________________________________________
L o a d C al c u l a t io n G u i de
w w w. h e r r mi di f i e r- h v a c . co m
21
Page 22
Engineered Humidification Systems
Herrmidifier
®
101 McNeill Rd. | Sanford, NC 27330
P: 800.884.0002 | F: 800.458.2379 | www.herrmidifier-hvac.com | cs@herrmidifier-hvac.com
Form No. ©Herrmidier 2010. All Rights Reserved.
 Loading...