


Printed in Germany
IMAGING-PAM
M-series
Chlorophyll Fluorometer
Instrument Description
and
Information for Users
2.152 / 07.06
5. revised Edition: March 2014
imag-m-series0e_3.doc
Heinz Walz GmbH, 2014
Heinz Walz GmbH Eichenring 6 91090 Effeltrich Germany
Phone +49-(0)9133/7765-0 Telefax +49-(0)9133/5395
E-mail info@walz.com Internet www.walz.com


CONTENTS
I
1 Safety instructions ........................................................................ 1
1.1 General safety instructions ....................................................... 1
1.2 Special safety instructions ........................................................ 2
2 Introduction .................................................................................. 3
3 Components of the IMAGING-PAM MAXI-version .................. 7
3.1 Control Unit IMAG-CG ........................................................... 9
3.2 LED-Array Illumination Unit IMAG-MAX/L and IMAG-
MAX/LR ................................................................................ 11
3.3 CCD Camera IMAG-K6 and objective K6-MAX .................. 15
3.4 CCD Camera IMAG-K7 and objectives K7-MAX/Z and K7-
MAX/S ................................................................................... 17
3.5 Mounting Stand with Eye Protection IMAG-MAX/GS ......... 19
3.6 Leaf Distance Holder IMAG-MAX/B ................................... 24
3.7 Notebook PC IMAG-PC ........................................................ 25
3.8 Adapter IMAG-MAX/GWK .................................................. 26
4 Components of the IMAGING-PAM MINI-version .................. 27
4.1 Multi Control Unit IMAG-CG ............................................... 27
4.2 MINI-Head LED-Array IMAG-MIN/B and IMAG-MIN/R .. 28
4.3 CCD Camera IMAG-K6 or IMAG-K7 .................................. 30
4.4 IMAG-MIN/GFP with IMAG-K6 .......................................... 32
4.5 Leaf Holder IMAG-MIN/BK with Grip Holder ..................... 38
4.6 Adapter for GFS-3000 (IMAG-MIN/GFS) ............................ 42
4.7 ImagingWin software versions for various types of MINI-
Version ................................................................................... 44
5 Components of the IMAGING-PAM MICROSCOPY-version . 46
5.1 Multi Control Unit IMAG-CG ............................................... 47
5.2 CCD Camera IMAG-K6 ........................................................ 47
5.3
Axio ScopeA.1 Epifluorescence Microscope ......................... 49
5.3.1 Reflector Modules .............................................................. 51

CONTENTS
II
5.3.2 Assembling of beam splitter and filters .............................. 52
5.3.3 Mounting of the reflector module ...................................... 54
5.4 LED Modules ......................................................................... 56
5.4.1 Adjustment of brightness by grey filters ............................ 56
5.4.2 Integration of LED modules into Axio Scope.A1 .............. 58
5.4.3 Connecting LED modules with IMAG-CG ....................... 60
5.4.4 Switching LED modules for measurements ....................... 60
5.4.5 IMAG-RGB ....................................................................... 60
6 How to get started ...................................................................... 63
6.1 Connecting the cables ............................................................ 63
6.2 Software installation ............................................................... 64
6.2.1 Installation and Starting of ImagingWin ............................ 64
6.2.2 Installation of camera driver .............................................. 66
6.3 First steps and examples of routine measurements ................ 66
7 ImagingWin ................................................................................ 81
8 IMAGINGWIN - System Operation .......................................... 83
8.1 Definition of New Record ...................................................... 83
8.1.1 Fo, Fm ................................................................................ 83
8.1.2 New Record ........................................................................ 84
8.1.3 Measure .............................................................................. 84
8.2 Functions applying to the View-mode ................................... 85
8.3 Light controls ......................................................................... 87
9 IMAGINGWIN - Register Cards ............................................... 90
9.1 Image-window ........................................................................ 90
9.1.1 Different types of images ................................................... 90
9.1.1.1
Current fluorescence yield, Ft ........................................ 91
9.1.1.2 Dark fluorescence yield, Fo ........................................... 91
9.1.1.3 Fluorescence yield, F ..................................................... 92

CONTENTS
III
9.1.1.4 Maximal fluorescence yield, Fm .................................... 92
9.1.1.5 Maximum fluorescence yield, Fm' ................................. 93
9.1.1.6 Maximal PS II quantum yield, Fv/Fm ........................... 93
9.1.1.7 Effective PS II quantum yield, Y(II) .............................. 94
9.1.1.8 Quantum yield of regulated energy dissipation, Y(NPQ)95
9.1.1.9 Quantum yield of nonregulated energy dissipation,
Y(NO) ............................................................................ 96
9.1.1.10Absorptivity, Abs. .......................................................... 97
9.1.1.11Apparent rate of photosynthesis, PS/50 ......................... 99
9.1.1.12NIR light remission, NIR ............................................. 100
9.1.1.13Nonphotochemical quenching, NPQ/4 ........................ 101
9.1.1.14Red light remission, R .................................................. 102
9.1.1.15Coefficient of nonphotochemical quenching, qN ........ 103
9.1.1.16Coefficient of photochemical quenching, qP ............... 104
9.1.1.17Coefficient of photochemical quenching, qL ............... 105
9.1.1.18Inhibition, Inh. ............................................................. 106
9.1.2 Image capture and analysis .............................................. 107
9.1.2.1 Measure Abs. ............................................................... 107
9.1.2.2 Area of Interest, AOI ................................................... 108
9.1.2.3 Select: Fluorescence or Live Video ............................. 110
9.1.2.4 Zoom ............................................................................ 112
9.1.2.5 Cursor ........................................................................... 113
9.1.2.6 Analysis ....................................................................... 113
9.2 Kinetics window ................................................................... 116
9.3 Light Curve window ............................................................ 122
9.4 Report window ..................................................................... 128
9.5 Settings window ................................................................... 132
9.5.1 Light parameters .............................................................. 133

CONTENTS
IV
9.5.2 Gain and Damping ........................................................... 136
9.5.3 Absorptivity ..................................................................... 137
9.5.4 Slow Induction parameters ............................................... 138
9.5.5 Image Correction .............................................................. 138
9.5.6 Image Transformation ...................................................... 141
9.5.7 Battery .............................................................................. 141
9.5.8 Display parameters ........................................................... 142
9.5.9 Go Speed .......................................................................... 144
9.5.10 PS Limit ........................................................................... 144
9.5.11 Inh. Ref. AOI ................................................................... 145
9.5.12 Yield Filter ....................................................................... 145
9.5.13 Fm Factor ......................................................................... 146
9.5.14 F Factor ............................................................................ 149
9.5.15 Reset Default Settings, Open or Save User Settings ........ 152
9.6 High Sens. window .............................................................. 153
9.6.1 Special SP-Routine .......................................................... 154
9.6.2 Fo Averaging.................................................................... 156
9.6.3 Fv/Fm Contrast Enhancement by Background Suppression156
9.7 RGB-Fit window .................................................................. 157
9.7.1 RGB Gain ......................................................................... 160
9.7.2 Fit Correction ................................................................... 160
10 IMAGINGWIN - Menu Bar ..................................................... 163
10.1 File ....................................................................................... 163
10.1.1 Transfer FoFm .................................................................. 163
10.1.2 Using Skript files - Load Script/Run Script ..................... 163
10.1.3
Exit ................................................................................... 171
10.2 Options ................................................................................. 172
10.2.1 Ruler ................................................................................. 172

CONTENTS
V
10.2.2 Scale ................................................................................. 172
10.2.3 Info Icons ......................................................................... 173
10.2.4 Mean over AOI ................................................................ 173
10.2.5 Define AOI-array geometry ............................................. 175
10.2.6 Create AOI array: ............................................................. 176
10.3 Al-List .................................................................................. 178
10.3.1 LED currents / PAR values .............................................. 178
10.3.2 Light Calibration .............................................................. 180
10.4 Recalc ................................................................................... 181
10.5 Transect ................................................................................ 182
11 List of key commands .............................................................. 185
12 Technical specifications ........................................................... 186
12.1 Components used in all Versions ......................................... 186
12.1.1 Control Unit IMAG-CG ................................................... 186
12.1.2 IMAG-K7 ......................................................................... 187
12.1.3 IMAG-K6 ......................................................................... 187
12.1.4 Windows Software ImagingWin ...................................... 187
12.1.5 Battery Charger 2120-N ................................................... 188
12.2 Components specifically relating to Maxi-version .............. 189
12.2.1 LED-Array Illumination Unit IMAG-MAX/L ................. 189
12.2.2 LED-Array Illumination Unit IMAG-MAX/LR .............. 190
12.2.3 Optional filter plate IMAG-MAX/F (only for IMAG-
MAX/L!) .......................................................................... 191
12.2.4 External 300 W Power Supply ......................................... 191
12.2.5 K7-MAX/Z ....................................................................... 191
12.2.6 K7-MAX/S ....................................................................... 192
12.2.7 K6-MAX .......................................................................... 192
12.2.8 K6-MAX/M and K7-MAX/M .......................................... 193

CONTENTS
VI
12.2.9 Mounting Stand with Eye Protection IMAG-MAX/GS ... 193
12.2.10 IMAG-MAX/B.............................................................. 194
12.2.11 ST-101........................................................................... 194
12.2.12 Transport Box IMAG-MAX/T ...................................... 194
12.2.13 IMAG-MAX/GWK1 ..................................................... 195
12.3 Components specifically relating to MINI-version .............. 195
12.3.1 IMAG-MIN/B .................................................................. 195
12.3.2 IMAG-MIN/R .................................................................. 196
12.3.3 IMAG-MIN/GFP ............................................................. 196
12.3.4 K7-MIN ............................................................................ 197
12.3.5 K6-MIN ............................................................................ 197
12.3.6 K6-MIN/FS ...................................................................... 197
12.3.7 K7-MIN/M and K6-MIN/M ............................................. 198
12.3.8 IMAG-S ........................................................................... 198
12.3.9 IMAG-MIN/ST ................................................................ 198
12.3.10 ST-1010......................................................................... 199
12.3.11 IMAG-MIN/BK ............................................................ 199
12.3.12 IMAG-MIN/GFS .......................................................... 199
12.4 Components specifically relating to MICROSCOPY-versions199
12.4.1 IMAG-AXIOSCOPE ....................................................... 199
12.4.2 IMAG-L470M .................................................................. 200
12.4.3 IMAG-L625M .................................................................. 200
12.4.4 IMAG-RGB ..................................................................... 200
12.4.5 IMAG-AX-REF ............................................................... 201
13 Warranty ................................................................................... 202
13.1
Conditions ............................................................................ 202
13.2 Instructions to obtain Warranty Service, .............................. 203

CHAPTER 1 SAFETY INSTRUCTIONS
1
1 Safety instructions
1.1 General safety instructions
1. Read the safety instructions and the operating instructions first.
2. Pay attention to all the safety warnings.
3. Keep the device away from water or high moisture areas.
4. Keep the device away from dust, sand and dirt.
5. Always ensure there is sufficient ventilation.
6. Do not put the device anywhere near sources of heat.
7. Connect the device only to the power source indicated in the
operating instructions or on the device.
8. Clean the device only according to the manufacturer’s
recommendations.
9. If the device is not in use, remove the mains plug from the
socket.
10. Ensure that no liquids or other foreign bodies can find their way
inside the device.
11. The device should only be repaired by qualified personnel.

CHAPTER 1 SAFETY INSTRUCTIONS
2
1.2 Special safety instructions
The IMAGING-PAM is a highly sensitive research instrument
which should be used only for research purposes, as specified in this
manual. Please follow the instructions of this manual in order to
avoid potential harm to the user and damage to the instrument.
Never use the Multi Control Unit IMAG-CG with more than one
Measuring Head plugged in at the same time.
The IMAGING-PAM employs strong blue light for excitation of
chlorophyll fluorescence, for driving photosynthetic electron
transport and for transient saturation of photosynthetic energy
conversion (Saturation Pulse method). In order to avoid harm to your
eyes, please avoid looking directly into this light, particularly during
Saturation Pulses.

CHAPTER 2 INTRODUCTION
3
2 Introduction
The IMAGING-PAM Chloroph
yll Fluorometer is specialized for the
study of two-dimensional heterogeneities of photosynthetic activity.
The Imaging-PAM M-series covers a wide range of applications.
Large scale samples with areas exceeding multiwell plate format can
be imaged as well as microscopically small samples at the level of
single cells. MAXI-, MINI- and MICROSCOPY-versions have been
issued that are operated with the same Multi Control Unit IMAG-
CG. Like all PAM fluorometers, the Imaging-PAM applies pulse-
amplitude-modulated measuring light for assessment of chlorophyll
fluorescence yield. The same LEDs not only serve for generation of
the pulse-modulated measuring light, but also for actinic illumination
driving photosynthesis and for Saturation Pulses transiently
saturating energy conversion at Photosystem II (PS II) reaction
centers. The Saturation Pulse method provides a non-destructive
means of analyzing the photosynthetic performance of plants. It
allows to assess the quantum yield of energy conversion at PS II
reaction centers, which is affected by numerous intrinsic and
environmental parameters, like the physiological health, light
conditions and various stress factors. Since the introduction of PAM
fluorometry in 1985, a large amount of literature has been published
on the practical use of this method in many fields of plant science. In
principle, with all IMAGING-PAM Fluorometers the same kind of
measurements are possible as with Standard-PAM Fluorometers (e.g.
Dual-PAM, PAM-2500 or MINI-PAMII), most users already may be
accustomed to. Hence, also with all versions of the IMAGING-PAM
M-series the characteristic fluorescence levels Fo, Fm and Fm' can
be assessed and quenching coefficients derived. Also the PS II
quantum yield Fv/Fm (or F/Fm') can be determined and Induction
Curves as well as Light Saturation Curves with quenching analysis
can be measured.

CHAPTER 2 INTRODUCTION
4
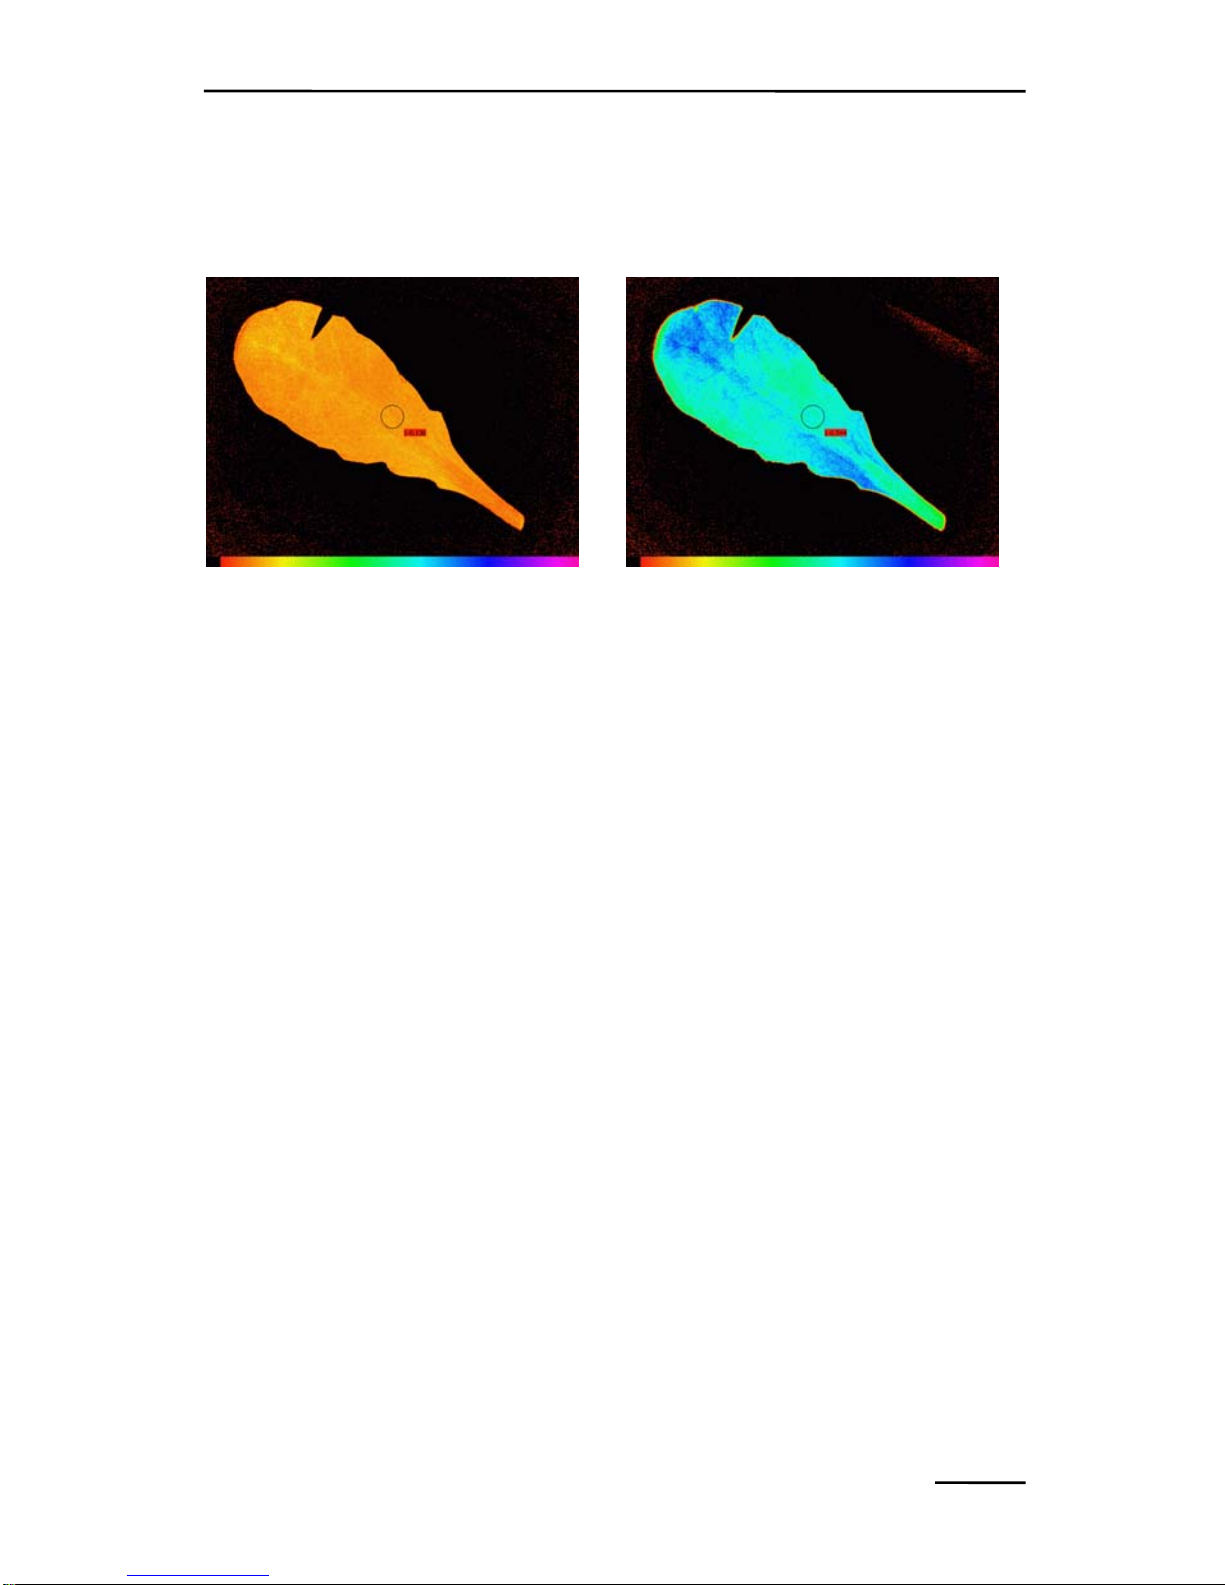
The most essen
tial new information provided by chlorophyll
fluorescence imaging relates to the detection of lateral
heterogeneities of fluorescence parameters which reflect
physiological heterogeneities. It has been known for some time, that
even physiologically healthy leaves are "patchy" with respect to
stomatal opening. Furthermore, stress induced limitations, which
eventually will lead to damage, are not evenly distributed over the
whole leaf area. Fluorescence imaging may serve as a convenient
tool for early detection of such stress induced damage. Hence,
favorite fields of application of fluorescence imaging are plant stress
physiology and plant pathology. An outstanding feature of the
Imaging-PAM distinguishing it from standard PAM fluorometers is
the possibility of parallel assessment of several samples under
identical conditions. For this applications the MAXI-version is
particularly well suited, e.g. for the screening of mutants in plant
molecular biology and for the assessment of samples in multi-well
plates, e.g. 96-well plates in ecotoxicological studies. The MINIversion is particularly compact and easy to handle and therefore best
suited for field applications. MINI- and MAXI-versions can also be
readily adapted for simultaneous measurements with the GFS-3000
Gas Exchange Measuring System. The MICROSCOPY-versions
provide the opportunity of imaging heterogeneities at the level of
single cells (e.g. guard-cells or algae cells). Using the RGB-Head it
is even possible to differentiate between different pigment types, like
diatoms, chlorophytes and cyanobacteria.
The MAXI- and MINI-versions not only measure fluorescence,
but also provides an estimate of incident light absorptivity. This
aspect is particularly important when dealing with lateral
heterogeneities of chlorophyll content often accompanying stress- or
pathogen-induced damage. For assessment of absorptivity of the
incident photosynthetically active radiation (PAR), the same sample
is irradiated with diffuse near-infrared (NIR) and red light, the

CHAPTER 2 INTRODUCTION
5
remitted parts of which are imaged with the same CCD-camera
which serves for fluorescence imaging.
As the different versions of the Imaging-PAM M-series are
optimized for largely different sample sizes, they apply quite
different LED sources. While the same methodology applies for all
versions, there are very different power requirements for appropriate
intensities of measuring, actinic and saturation pulse light. The
MAXI-IMAGING-PAM is equipped with an extremely powerful
array of 44 high power (3 W) Luxeon LEDs, each of which is driven
with currents up to 1.6 A. The same type of LEDs is also used in the
MINI-IMAGING-PAM (featuring 12 LEDs illuminating 24 x 32 mm
area) and various versions of the MICROSCOPY-IMAGING-PAM
(with a single LED coupled in various ways to the excitation port of
various types of Epifluorescence Microscopes). Therefore, the same
Power-and-Control Unit (IMAG-CG) can be used for these different
measuring heads.. The new IMAG-CG also features an output for
controlling a special RGB-LED-Lamp that is equipped with its own
LED drivers.
As the various versions of the Imaging-PAM M-series put
different demands on the sensitivity, different CCD-cameras are
employed. Two different CCD-cameras are available for the MAXIand MINI-version. For high sensitivity applications (e.g.
phytotoxicity bioassay using multiwell plate with algae suspensions)
a 2/3" CCD camera (1392x1040 pixel with 4-pixel-binning) is
recommended, which is also generally used with the
MICROSCOPY-versions. For standard applications an economical
1/2" CCD camera (640x480 pixel) is available, which is particularly
useful in conjunction with a powerful zoom objective.
This manual provides some essential information on the
components of the different versions of the Imaging-PAM M-series

CHAPTER 2 INTRODUCTION
6
and on the ImagingWin software. While the latter in principle applies
to all versions, it also offers some special features that can be used
with particular versions only (e.g. RGB-Fit images using the
MICROSCOPY/RGB-version). As it is most frequently used and
also featuring the widest range of applications/configurations, there
is some emphasis on the MAXI-version in this manual.

CHAPTER 3 COMPONENTS OF THE MAXI-VERSION
7
3 Components of the IMAGING-PAM MAXI-
version
In the following chapters the three different versions: th
e MAXI-,
MINI- and Microscopy-version of the Imaging-PAM M-series are
described. As the MAXI-version is most frequently used, those
components that are common to all versions are dealt with in this
chapter on the MAXI-version.
The basic measuring system of the MAXI-IMAGING-PAM consists
of:
1) Control Unit IMAG-CG with Battery Charger 2120-N and
External 300 W Power Supply
2) LED-Array Illumination Units IMAG-MAX/L (blue) or IMAGMAX/LR (red). A useful accessory for measurements with IMAGMAX/L investigating mirroring samples (like multiwell plates filled
with algae suspensions) is the Filter Plate IMAG-MAX/F, which
absorbs the small fraction of red light contained in the blue LED
light.
3) CCD Cameras IMAG-K7 or IMAG-K6 with accessories and
mounting sets
4) Mounting Stand with Eye Protection IMAG-MAX/GS,
laboratory stand ST-101 or Leaf Distance Holder IMAG-MAX/B
5) PC with ImagingWin-software
Combining imaging and gas exchange measurements, the adapter
IMAG-MAX/GWK for gas exchange chamber GWK1 is available.

CHAPTER 3 COMPONENTS OF THE MAXI-VERSION
8
Fig. 1: Transport Box IMAG MAX/T provided with each of the basic
Imaging systems offers enough space for all essential components
(except PC)
For transport of components 1 - 4, as well as of all essential
cables, the Transport Box IMAG-MAX/T is provided.
Note:
In the LED-Array Illumination Unit an
Adapter Ring may be inserted (not
screwed). To avoid damag
e to the
instrument, please do not take it out of the
box by using this hole as a handle.

CHAPTER 3 COMPONENTS OF THE MAXI-VERSION
9
3.1 Control Unit IMAG-CG
The Control Unit IMAG-CG contains a rechargeable Li-ion
battery (14.4 V/6 Ah). The main printed circuit board of the IMAGCG contains a RISC processor microcontroller, the power supply for
the CCD camera and the LED drivers for the Maxi-LED-Arrays. The
same LED drivers also serve for the alternative MINI- or
MICROSCOPY-Heads (MINI- and RGB-sockets at the backside of
the instrument). The Control Unit provides the power for driving the
LED-Arrays of all members of the M-Series systems except the
MAXI-IMAGING-PAM, which is driven by an external 300 W
Power Supply.
Note: Never switch on the Control Unit IMAG-CG with more
than one Measuring Head connected at the same time.
The functional elements at the front side of the instrument are:
POWER Power on/off switch; when switched on, the green
status LED at the right hand side of the switch
lights up.
Fig. 2: Front and rear side views of the Control Unit IMAG-CG

CHAPTER 3 COMPONENTS OF THE MAXI-VERSION
10
CHARGE-LED Ch
arge LED lights up red while battery is charging
with the help of the Battery Charger 2120-N. When
the battery is fully charged, the LED lights up
green.
CHARGE Socket for connecting Battery Charger 2120-N. An
external 12 V battery cannot recharge the internal
14.4 V Li-ion battery.
Note: Please avoid charging the internal Li-ion battery while the
IMAGING-PAM is switched on.
MAXI-HEAD Socket for connecting LED-Array Illumination Unit
IMAG-MAX/L (MAXI-Head).
CAMERA Socket for camera cable via which trigger signals
and power is transferred to the CCD-camera of the
MAXI-Head or MICROSCOPY-IMAGING-PAM.
At the rear side of the housing, the Control Unit features three
sockets, which apply for use of alternative Measuring-Heads:
MINI-HEAD Socket for connecting MINI- Heads as well as the
IMAG-L470M or IMAG-L625M LED lamps of
the MICROSCOPY-version
RGB-HEAD Socket for connecting the optional Red/Green/
Blue-Head of the MICROS-COPY-version
Ext. out Socket for connecting an optional external light
source
When using MINI-Head, the camera can directly be mounted on
the top of the Control Unit housing. For this purpose a wing-screw is
provided.

CHAPTER 3 COMPONENTS OF THE MAXI-VERSION
11
3.2 LED-Array Illumination Unit IMAG-MAX/L and IMAGMAX/LR
Fig. 3: Front view of IMAG MAX/L with objective lens of CCD-camera
protruding through central opening
The LED-Array Illumination Unit IMAG-MAX/L features 44
high-power royal-blue (450 nm) LED-lamps equipped with
collimating optics, which are arranged for maximal intensity and
homogeneity at 17 - 20 cm distance to the object plane. These LEDlamps provide the pulse-modulated blue excitation light and at the
same time serve for actinic illumination and Saturation Pulses. In
addition, there are 4 groups of 8 LEDs providing the pulse
modulated light for assessment of PAR-Absorptivity (see 9.1.1.10).
These LEDs are arranged in pairs, with each pair featuring a red
(660 nm) and a near-infrared (780 nm) LED. The lenses of these
LEDs are removed in order to obtain homogenous illumination of the
sample. While only a relatively small amount of this light is remitted
from the sample to the CCD-camera, this is sufficient to give good
signals, as both wavelengths can pass the red long-pass filter in front
of the CCD-chip, in contrast to the blue excitation light.

CHAPTER 3 COMPONENTS OF THE MAXI-VERSION
12
A useful accessory for measurements with mirroring samples
(like multiwell plates filled with algae suspensions) is the Filter Plate
IMAG-MAX/F that absorbs the small fraction of red light contained
in the blue LED light. This plate can be mounted with 4 screws at the
front side of the Illumination Unit. Unavoidably, the effective PARvalues are lowered by about 15% by the filtering.
Fig.
4: Mounting of IMAG-MAX/F. Four screws are provided with the
filter plate
The LED-Array Illumination Unit IMAG-MAX/LR has a
similar organization as IMAG-MAX/L but features 44 red (650 nm)
high-power LED-lamps and the four groups of red (660 nm) and a
near-infrared (780 nm) LEDs. The IMAG-MAX/LR includes the
filterplate IMAG-MAX/FR .
Both Illumination Units feature two cables, which connect to the
MAXI-HEAD socket at the front side of the Control Unit IMAG-CG
and to the external 300 W power supply.

CHAPTER 3 COMPONENTS OF THE MAXI-VERSION
13
Fi
g. 5: IMAG MAX/L in conjunction with IMAG MAX/GS and mounted
CCD camera IMAG MAX/K6
On the top side of the Illumination Units a fan is located that
serves for cooling the aluminum plate on which the slugs of the highpower LEDs are mounted. The adapter, on which the CCD-camera is
mounted, at the rear side features an adapter hole for installation of a
15 mm metal bar, which may serve for mounting the Measuring
Head independently of the Mounting Stand with Eye Protection
(IMAG-MAX/GS) (see Fig. 6). This bar is fixed with a hex-nut
screw, for which a corresponding key is provided. Please note that
the nut should press against the flattened side of the bar.
Fi
g. 6: Measuring Head consisting of LED-Array Illumination Unit and
CCD-camera mounted via 15 mm Ø metal bar on optional st
and
(St
and with Base Plat
e ST 101)

CHAPTER 3 COMPONENTS OF THE MAXI-VERSION
14
Warning:
When used without Mounting Stand and Eye protection,
the user should avoid looking directly into the LED-Array
Illumination unit.
The user is urgently advised to ensure an alternative eye
protection, which is effective in applications where the
standard IMAG-MAX/GS cannot be applied.
When mounted independently from the Mounting Stand with Eye
Protection (IMAG-MAX/GS, see 3.5), the working distance of the
LED-Array can be adjusted between 14.5 and 22.5 cm, resulting in
imaged areas between 7.5 x 10 and 11 x 15 cm. Optimal light field
homogeneity is obtained at the standard distance of 18.5 cm (imaged
area 9 x 12 cm), with +/- 7% maximal deviation of intensity from the
mean value.
A fixed standard distance of 18.5 cm is provided when the
IMAG-MAX/L is mounted on the IMAG-MAX/GS (see 3.5). As the
LED-intensity is defined by the ImagingWin software, the photon
flux density (PAR) at this standard distance is well defined. Small
variations in the PAR-distribution as well as the unavoidable
vignetting effect of the camera objective lens can be measured and
corrected for by software (see Image Correction in section 9.5.5).
Three different Image Corrections are supported by the ImagingWin
software for three different distances: Type 1, Type 2 and MAXI
(chapter 9.5.5).

CHAPTER 3 COMPONENTS OF THE MAXI-VERSION
15
Note:
In the LED-Array Illumination Unit
an Adapter Ring may be inserted,
(not screwed). To avoid damage to
the
instrument, please do not pull
the Imag-MAX/L out of the box
by using this hole as a handle.
3.3 CCD Camera IMAG-K6 and objective K6-MAX
Fig. 7: CCD Camera IMAG-K6
The CCD Camera IMAG-K6 (Allied Vision Technologies)
features a 2
/3" chip with 1392 x 1040 pixels. The data are
digitized within the camera and transferred via ethernet
interface (GigE-Vision®) to the PC. The sockets for connecting
the GigE-cable as well as the camera-control-cable (roundshaped connector) are located at the rear side of the camera.
As the CCD-chip features 1392 x 1040 pixels in contrast to the
resulting 640 x 480 pixels of the ImagingWin fluorescence
images, the signals of 4 pixels are combined (2x2 pixel binning)

CHAPTER 3 COMPONENTS OF THE MAXI-VERSION
16
thus p
roviding outstanding sensitivity. This feature is particularly
useful for reliable assessment of the "dark fluorescence" parameters
Fo, Fm and Fv/Fm.
Note:
The aperture of the IMAG-K6 standard lens can be closed. This
increases the depth of focus, but decreases the signal intensity. For
plane objects, the setting of the aperture should always completely
open.
The camera is equipped with a metal angle bar (black anodized),
which serves for mounting it on the corresponding adapter on the
IMAG-MAX/L Illumination Unit. Mounting the IMAG-K6 camera
for use in conjunction with MINI- or MICROSCOPY- Version are
described in the corresponding chapters. If the camera is shared
between different M-series instruments and setups, it might be
necessary to adapt camera objective and the distance ring between
objective and the CCD chip.
A Cosmicar-Pentax objective with 12.5 mm focal length (F=1.4)
is used in conjunction with the LED-Array Illumination Unit IMAGMAX/L or IMAG-MAX/LR (Fig. 8). A 3 mm RG 665 (Schott)
color glass filter serves as long-pass filter for protecting the CCDchip from blue excitation light, while passing the red fluorescence as
well as the 660 and 780 nm measuring beams for PAR-Absorptivity
(see 9.1.1.10 - 9.1.1.14). A short-pass filter ( < 790 nm), mounted in
a threaded metal ring, protects the CCD-detector against excess nearinfrared radiation contained in ambient daylight. For the optical
properties of the camera it is essential that this filter as well as the
RG 665 are placed between CCD-chip and objective lens (increase of

CHAPTER 3 COMPONENTS OF THE MAXI-VERSION
17
effective focal length by plane-parallel glass plates). For other Mseries instruments like the MICROSCOPY-Version and the GFP
MINI-Version this filter has to be removed before mounting the
camera.
3.4 CCD Camera IMAG-K7 and objectives K7-MAX/Z and K7-
MAX/S
Also the CCD Camera IMAG-K7
(Allied Vision Technologies) can be
used, which features a 1/2" chip with
640 x 480 pixel resolution. The data are
digitized within the camera and
transferred via ethernet interface (GigEVision
®
) to the PC. Analog to the IMAG-
K6 camera the sockets for connecting the
ethernet cable and the camera-power-supply cable (round-shaped
connector) are located at the rear side of the camera.
The camera can be equipped either with a standard objective
lens featuring 12 mm focal length (F=1.2 / f=12mm - K7-MAX/S) or
Fig. 8: Cosmicar-Pentax objective 12.5 mm focal length, short pass filter and
mounting device (left), distance ring (middle)

CHAPTER 3 COMPONENTS OF THE MAXI-VERSION
18
a Zoom objective lens with 8 – 48 mm focal length (F=1.0 -
K7-MAX/Z Fig. 10). Different mounting angles The adapter ring in
the LED-Array Illumination Unit (IMAG-MAX/L) has to be
detached for using the Zoom objective.
Fig. 9: Adapter Ring of the LED-Array Illumination Unit
A
3 mm RG 645 (Schott) color glass filter serves as long-pass filter
for protecting the CCD-chip from blue excitation light, while passing
the red fluorescence as well as the 660 and 780 nm measuring beams
for PAR-Absorptivity (see 9.1.1.10). A short-pass filter ( < 770 nm),
mounted in a threaded metal ring, protects the CCD-detector against
excess near-infrared radiation contained in ambient daylight. For the
optical properties of the camera it is essential that this filter as well as
the RG 645 is placed between CCD-chip and objective lens (increase
of effective focal length by plane-parallel glass plates).
Using the IMAG-K7 camera fluorescence image intensity is
about 50 % of that obtained with the IMAG-K6 camera. While on
one hand it does not allow 4-pixel binning, on the other hand the
applied objective lenses display a higher aperture. Please note that
with the Zoom objective the aperture and consequently image
intensity drop at focal lengths exceeding 30 mm. When properly
adjusted (by provided distance ring and close-up lens) the image

CHAPTER 3 COMPONENTS OF THE MAXI-VERSION
19
remains focused when changing focal length (magnification). Minor
adjustment by the focusing ring may be required.
Fig. 10: CCD Camera with Zoom objective
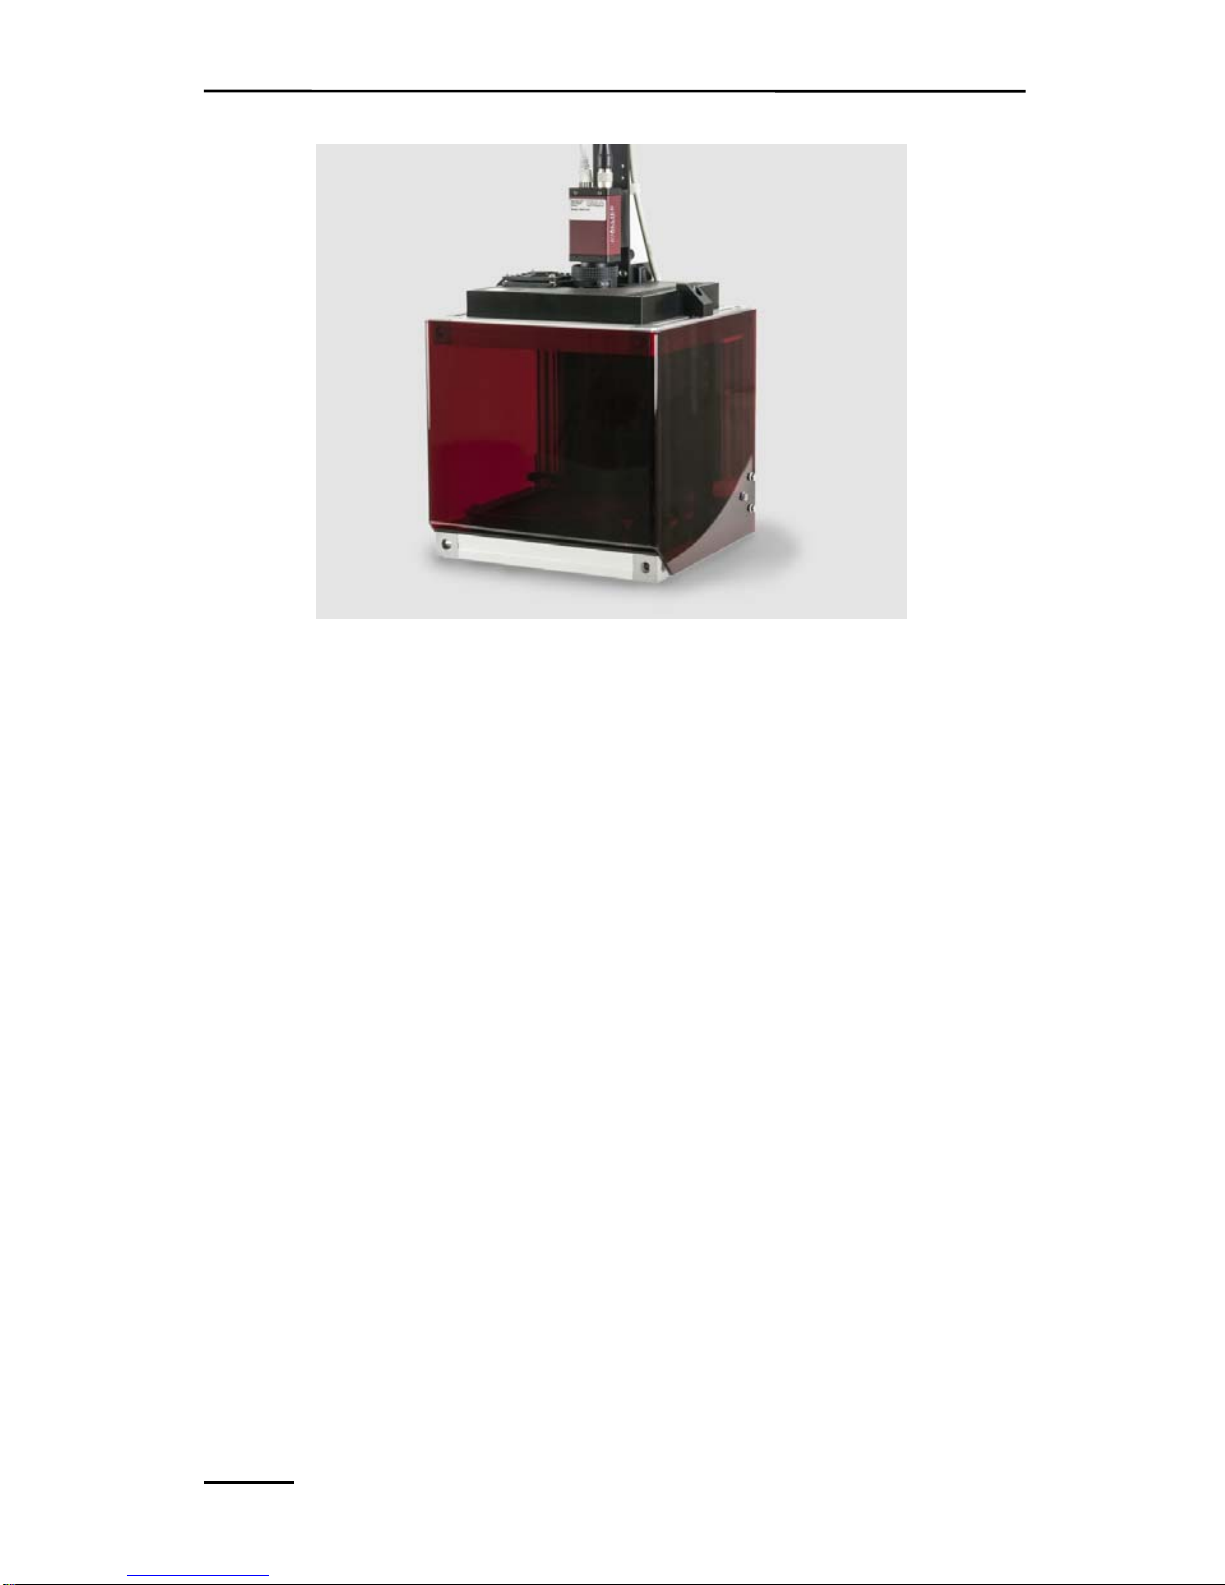
3.5 Mounting Stand with Eye Protection IMAG-MAX/GS
The Mounting Stand IMAG-MAX/GS provides the standard
means for mounting the powerful LED-Array Illumination Unit at
defined distance to the object, assuring full eye protection of the user.
It features a red perspex hood that absorbs the strong blue light
emitted from the LED-array and at the same time allows to view the
red chlorophyll fluorescence of the sample with bare eyes. The
Measuring Head, consisting of the LED-Array Illumination Unit and
the CCD-camera, is mounted with the help of two clamps on the top
of the Mounting Stand IMAG-MAX/GS.
CHAPTER 3 COMPONENTS OF THE MAXI-VERSION
20
Fi
g. 11 IMAG-MAX/GS with mounted LED-Array Illumination Unit
IMAG-MAX/L and CCD-Camera
Using this Mounting Stand, the Illumination Unit and the CCDcamera are coupled with each other at a fixed working distance of
18.5 cm between LED-Array and object plane, resulting in
homogenous illumination of an imaged area of 10 x 13 cm. A defined
working distance is important for proper Image Correction (see
9.5.5), which corrects for unavoidable inhomogeneities in measuring
light intensity and camera sensitivity over the imaged area. In
principal, it is also possible to vary the working distance, when the
LED-Array Illumination Unit is mounted independently from the
IMAG-MAX/GS (see Fig. 6). In this case, however, the homogeneity
of the light field may be suboptimal and the user has to take care
about protecting the eyes against excessive light, particularly during
saturation pulses.

CHAPTER 3 COMPONENTS OF THE MAXI-VERSION
21
Fi
g. 12: IMAG MAX/GS with lifted red-perspex hood showing leaf sample
resting on x-y stage
In standard applications, the sample is resting on an x-y stage
covered with non-fluorescent and non-reflecting black foam-rubber.
The sample compartment becomes accessible after sliding the red
perspex hood upwards, using two flat hands gently pressing against
the two sides. In its fully lifted position the hood is held by two
magnets.
The x-y stage allows to move the sample by maximally 25 and
19 mm in x- and y-directions, respectively. The force stabilizing its
position on the bottom of the Mounting Stand is increased by
magnets mounted at its reverse side.
Note: During transportation or shipping the x-y stage plate has
to be removed from the sample compartment of the
IMAG-MAX/GS and packed separately within the
Transport Box IMAG-MAX/T to avoid damages.

CHAPTER 3 COMPONENTS OF THE MAXI-VERSION
22
Fig. 13: Bottom part of IMAG MAX/GS with black 96-well microtiter plate
in defined centered sample position
After removing the x-y stage plate, alternatively a multiwell plate
can be placed into the sample plane. A correctly centered position is
defined by two positioning elements (horizontal perspex bar and
metal screw defining right limit). It is recommended to use black
non-fluorescent multiwell plates (e.g. Sigma-Aldrich article no.
M9685). At high sensitivity measurements (high ML intensity, high
Gain), in this application a mirror image of the LED-lamps may be
superimposed on the fluorescence image of the samples contained in
the wells. This phenomenon is due to the fact the blue LEDs emit
some red light, which can be mirrored from the multiwell plate
and/or the water surface of suspension samples via the camera
objective lens onto the CCD chip. If this causes a problem, the red
emission can be removed with the help of the optional Filter Plate
IMAG-MAX/F, which can be mounted in front of the LED-Array
Illumination Unit. Now also clear multiwell plates can be used.
Fluorescence imaging of algae suspensions in 96-well plates can
serve as a powerful tool in ecotoxicology and plant molecular
biology (e.g. screening for mutants).

CHAPTER 3 COMPONENTS OF THE MAXI-VERSION
23
Fi
g. 14: IMAG MAX/GS, with bottom part being removed, resting on two
spacers to give room for potted plant
Alternatively, it is also possible to remove the bottom part of the
IMAG-MAX/GS for fluorescence imaging of larger samples, like
potted plants. The Mounting Stand can be readily jacked up with the
help of four profile-metal legs with mounting-angles, which can be
screwed to the bottom corners of the Mounting Stand (see Fig. 14).
For this purpose, with the Mounting Stand being turned upside
down, the four nuts first have to be put into the grooves at the bottom
corners. Standard legs with 20 cm length (including mounting screws
and nuts) are delivered with the instrument. With the thus increased
distance to the bottom, the use of a Screw Jack is advantageous,
which allows to move a sample (e.g. potted plant) up/down for
focusing the image at the standard working distance of 18.5 cm. In
this case, the focus of the objective lens should be set for 18.5 cm
working distance (between front of LED-Array and sample) and then
remain unchanged.

CHAPTER 3 COMPONENTS OF THE MAXI-VERSION
24
3.6 Leaf Distance Holder IMAG-MAX/B
Fig. 15: Leaf Distance Holder IMAG-MAX/B with IMAG-MAX/L and
IMAG-K6
Using the Leaf Distance Holder IMAG-MAX/B the illumination unit
with CCD-camera are mounted at standard working distance of 18.5,
resulting in homogenous illumination of an imaged area of
10 x 13 cm of the x-y stage plate.
The assembly of this light weight device is simple. The four black
legs are screwed to the provided screw holes in the bottom corner of
the LED array as well as to the base containing the x-y stage plate.
For convenient sample preparation the x-y stage plate can be taken
off the base by unscrewing the knurled head screws.

CHAPTER 3 COMPONENTS OF THE MAXI-VERSION
25
Warning:
IMAG-MAX/B does not provide eye protection! The user
should avoid looking directly into the LED-Array
Illumination unit.
3.7 Notebook PC IMAG-PC
Operation of the IMAGING-PAM requires a PC with the
following minimum requirements:
• Processor: 1
.7 GHz
• RAM: 4 GB
• built-in USB interface
• built-in ethernet interface for GigE-Vision
®
• built-in DVD/CD-RW drive
• operating system: Vista, Windows 7 32- or 64-Bit, Windows 8
As operation in conjun
ction with the IMAGINGPAM requires significant CPU usage, an effective ventilating
system is required for cooling the CPU.
The Notebook PC IMAG-PC is delivered with fully installed
software. Depending on the market situation, best value brand-name
devices are chosen which have proven well suited for use in
conjunction with the IMAGING-PAM.
If the instrument has been purchased without PC, the user first
has to install the software (see chapter 6.2)

CHAPTER 3 COMPONENTS OF THE MAXI-VERSION
26
3.8 Adapter IMAG-MAX/GWK
The combined application of IMAGING-PAM and gas exchange
measurements by GFS-3000 provides comprehensive analysis
options. For examples physiological heterongeneities or differences
in genotypes can be visualized in fluorescence images under
changing CO
2
, O2 or temperature conditions applied by the gas
exchange system. The adapter IMAG-MAX/GWK positions the
MAXI-IMAGING PAM on top of the GWK1 providing eye
protection during the merge of imaging and gas exchange analysis
over a measuring area of 10 x 13 cm.

CHAPTER 4 COMPONENTS OF THE MINI-VERSION
27
4 Components of the IMAGING-PAM MINI-
version
The MINI-version of the IMAGING-PAM consists of:
1)
Control Unit IMAG-CG with Battery Char
ger 2120-N
2) MINI-Head (blue) IMAG-MIN/B or
MINI-Head (red) IMAG-MIN/R or
MINI-Head (GFP) IMAG-MIN/GFP
3)
CCD Cameras IMAG-K7 or IMAG-K6 with cam
era objectives
K7- or K6-MIN and mounting sets K7- or K6-MIN/M and K6MIN/FS for use with IMAG-MIN/GFP
4)
PC with ImagingW
in-software
A
useful accessory for leaf measurements is the Leaf Holder IMAGMIN/BK. For simultaneous measurements of gas exchange with the
GFS-3000 the Adapter IMAG-MIN/GFS is available. Also available
for convenient use is a laboratory stands as well as a tripod and a fine
drive tripod adapter for outdoor applications.
4.1 Multi Control Unit IMAG-CG
The same Multi Control Unit IMAG-CG is used for all versions of
the IMAGING-PAM M-series. It was already described in section
3.1.1. in conjunction with the MAXI-version. The LED-Array of the
MINI-Head is plugged into to the MINI-Head connector on the rear
side of the IMAG-CG unit. The Camera cable connector is located
on the front side of IMAG-CG.
The MINI-Head with mounted camera can directly be attached on
top of the Control Unit housing IMAG-CG. For this purpose a wing-

CHAPTER 4 COMPONENTS OF THE MINI-VERSION
28
screw is provided. Alternatively it can be also mounted on a tripod or
be held by hand using a special grip (see 4.5).
4.2 MINI-Head LED-Array IMAG-MIN/B and IMAG-MIN/R
Fig. 4.1 Top view of MINI-Head IMAG-MIN/B LED-array without
alumin
ium rods holding the sample-platform
The blue and red versions of the MINI-Head (IMAG-MIN/B and
IMAG-MIN/R) are identical except for the color of the LEDs and the
LED-filters. As blue and red LEDs display different intensity-current
relationships, different PAR-lists apply, that are incorporated in two
different versions of the ImagingWin program (see chapter 10).
The LED-array of the MINI-Head features 12 high-power LED-
lamps each equipped with collimating optics, which are arranged in 4
groups of 3 LEDs. Each group is equipped with a short-pass filter
eliminating red light that otherwise would pass the long-pass filter in
front of the CCD-camera and overlap with chlorophyll fluorescence.
In the blue version (IMAG-MIN/B emission peak 460 nm) a bluegreen glass filter (Schott BG39) is used. In the red version (IMAG-

CHAPTER 4 COMPONENTS OF THE MINI-VERSION
29
MIN/R emission peak 620 nm) a special short-pass interference filter
(< 645 nm) is used. The LEDs are mounted at an angle that is
optimized for obtaining a homogenous light field at the given
working distance. These LEDs provide the pulse-modulated
excitation light and at the same time serve for actinic illumination
and Saturation Pulses. In addition, there are four groups of LEDs
(2x6 and 2x4) providing the pulse modulated light for assessment of
PAR-Absorptivity (see 5.4.1.10 - 9.1.1.14). These LEDs are arranged
in pairs, with each pair featuring a red (660 nm) and a near-infrared
(780 nm) LED. The lenses of these LEDs are removed in order to
obtain homogenous illumination of the sample. While only a
relatively small amount of this light is remitted from the sample to
the CCD-camera, this is sufficient to give good signals, as both
wavelengths can pass the red long-pass filter in front of the CCDchip, in contrast to the filtered excitation light.
The LED-array cable connects to the MINI-HEAD socket at the
rear side of the IMAG-CG Control Unit.
Warning: Please avoid looking directly into the LED-
Array Illumination unit to prevent
Eye-damage!
The MINI-Head is designed for a fixed working distance
between camera and sample (7 cm), which is defined by
four aluminium rods with a sample-platform on top of the LEDArray. At the standard working distance, using the 16 mm lens, a
24 x 32 mm area is imaged.
All MINI-Head LED-Arrays can be extended with a Leaf Clip
and a Grip Holder (see chapter 4.5).
The MINI-Head LED-Array IMAG-MIN/GFP is described in
chapter 4.4.

CHAPTER 4 COMPONENTS OF THE MINI-VERSION
30
4.
3 CCD Camera IMAG-K6 or IMAG-K7
The CCD Cameras IMAG-K6 or IMAG-K7 are described in
chapter 3.4 for the imaging MAXI-version. Both can also be used in
the imaging MINI-version in combination with IMAG-MIN/B and
IMAG-MIN/R. In combination with IMAG-MIN/GFP only IMAGK6 can be used (see chapter 4.4)
For usage in the Imaging MINI-version these CCD cameras need to
be equipped with the objective K6-MIN for IMAG-K6 (F1.4/f = 25
mm) and an 7.2 mm distance ring or K7-MIN for IMAG-K7 (F1.4/f
= 16 mm) with an 4.2 mm distance ring. For both configurations a
3 mm RG 645 (Schott) color glass filter serves as long-pass filter for
protecting the CCD-chip from blue excitation light, while passing the
red fluorescence as well as the 660 and 780 nm measuring beams for
PAR-Absorptivity (see 9.1.1.10). A short-pass filter (λ < 770 nm),
mounted in a threaded metal ring, protects the CCD-detector against
excess near-infrared radiation contained in ambient daylight. For the
optical properties of the camera it is essential that this filter as well as
the RG 645 is placed between CCD-chip and objective lens (increase
of effective focal length by plane-parallel glass plates).
Please adjust the objective aperture! Closing the aperture
increases focal depth and decreases light delivery to the
camera (to avoid signal saturation).
The cameras are mounted to the metal holder preinstalled on top
of the MINI-Head LED-Array. The camera side with four screw
holes and the label points to the same direction as the label of the
LED-Array, the camera side with seven screw holes points to the
same direction as the backside of the LED-Array, where the cables
are located and the metal angle bar of the mounting set is mounted.
Fig. 17 displays the mounting positions and required screws for
mounting the camera and the metal angle bar.

CHAPTER 4 COMPONENTS OF THE MINI-VERSION
31
Fig. 16: Camera side with 4 screw holes and label (left) - facing the labelled
LED-Array side, camera side with 7 screw holes (right) facing the
LED-Array backside and the metal angle bar (Fig. 17 A)
Fig. 17: Screw indication and camera mounting positions, metal angle bar
i
ncluding grip of Leaf Holder IMAG-MIN/BK, screw annotation
The metal angle bar of the mounting set K6 and K7-MIN/M (Fig.
17 A) serves for mounting the MINI-Head with camera onto the
IMAG-CG Control Unit, to the grip of the Leaf Holder IMAGMIN/BK or to a tripod. Furthermore the mounting set K6 and K7-
IMAG-K7 with K7-MIN
1 2 3 4 5
1+3
1+2+A
5
5
4+A
IMAG-K6 with K6-MIN
IMAG-K6 GFP/PS II
5
4+A
A
IMAG-K7 with K7-MIN
1 2 3 4 5
1+3
1+2+A
5
5
4+A
IMAG-K6 with K6-MIN
IMAG-K6 GFP/PS II
5
4+A
AA
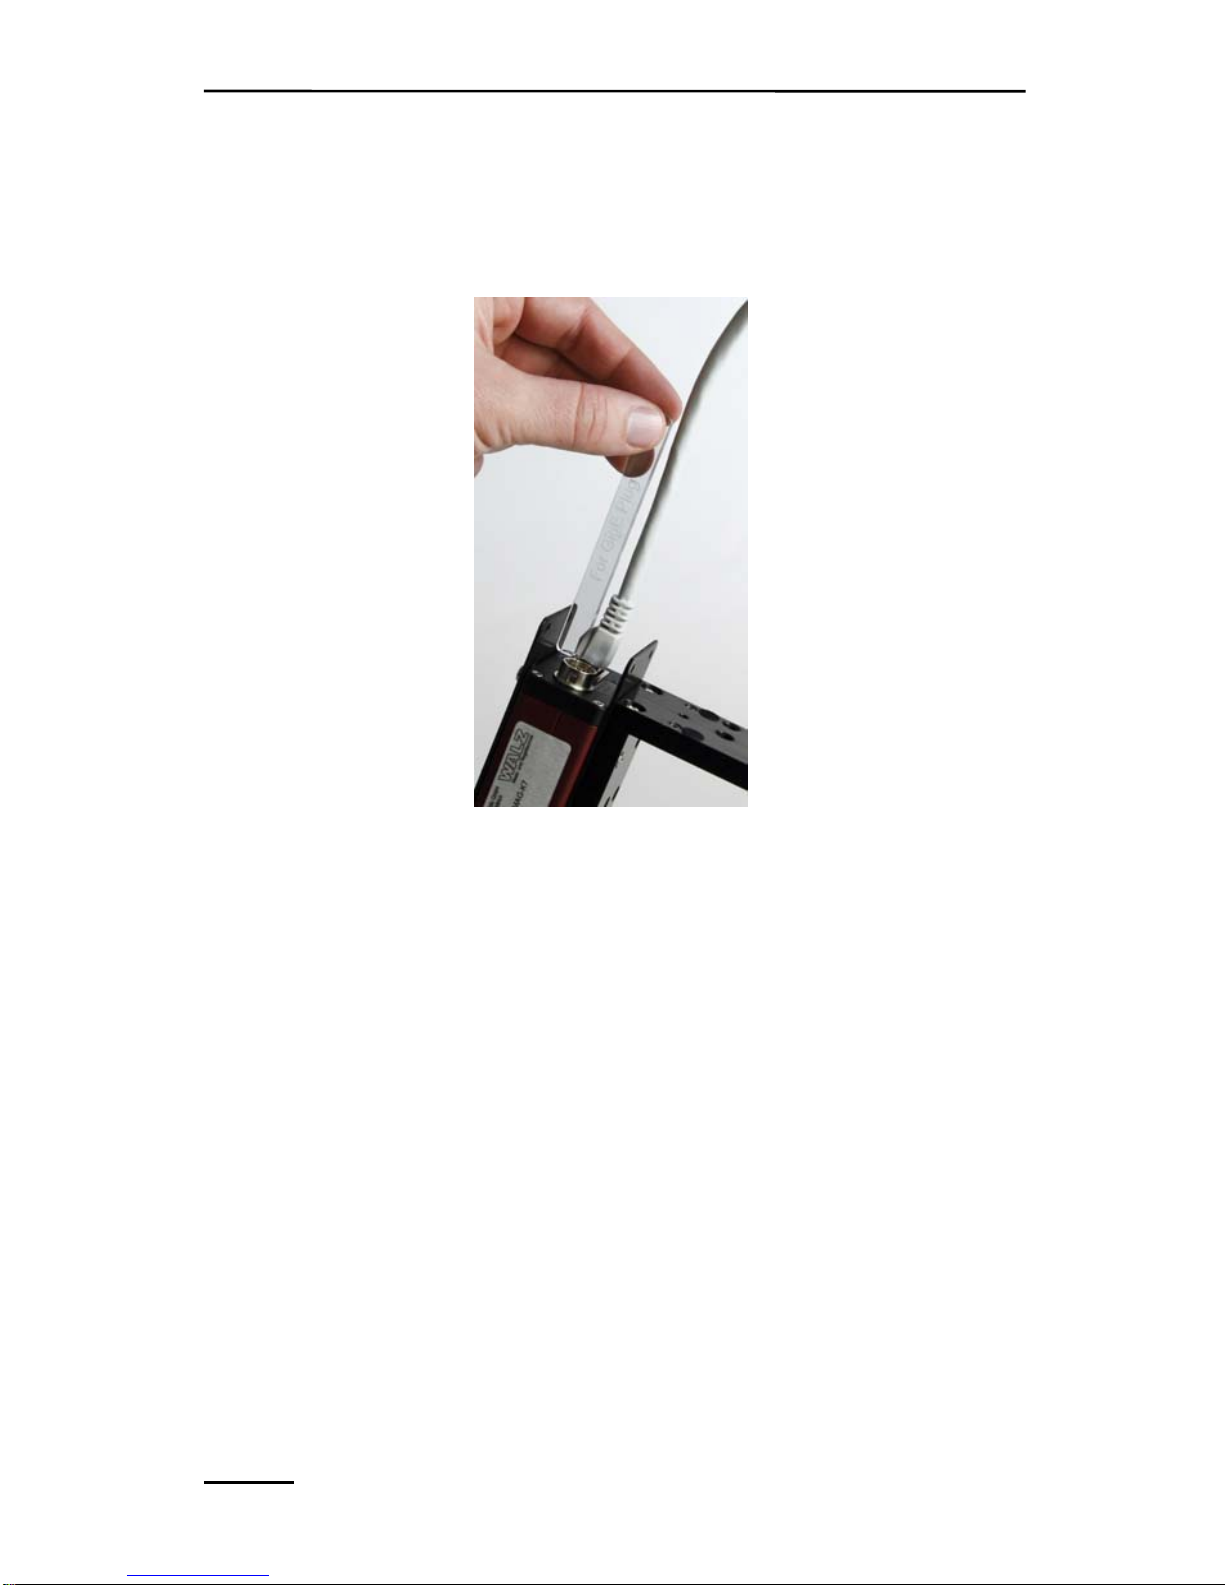
CHAPTER 4 COMPONENTS OF THE MINI-VERSION
32
MIN/M contains a perspex device to unplug the GigE cable from a
mounted CCD camera (see Fig. 18)
Fig. 18: Perspex device to unplug GigE cable from a mounted camera
4.4 IMAG-MIN/GFP with IMAG-K6
For GFP measurements using the MINI-version the IMAGMIN/GFP LED array is needed in combination with the filter slide
IMAG-K6/FS, the 2/3" CCD camera IMAG-K6, the K6-MIN
objective and the K6-MIN/M montage set.
As the LED-array of the other MINI-Heads IMAG-MIN/GFP
features 12 high-power LEDs (emission peak 470 nm) arranged in 4
groups of 3 LEDs and equipped with a short-pass filter (< 500 nm).
These LEDs provide the pulse-modulated GFP excitation light and at
the same time serve for actinic illumination and Saturation Pulses. In
addition, there are four groups of LEDs featuring red (660 nm) and a

CHAPTER 4 COMPONENTS OF THE MINI-VERSION
33
near-infrared (780 nm) LED pairs providing the pulse modulated
light for assessment of PAR-Absorptivity (see 5.4.1.10 - 9.1.1.14).
The LED-array cable connects to the MINI-HEAD socket at the
rear side of the IMAG-CG Control Unit.
The detector filter slide K6-MIN/FS is mounted in front of the 25
mm camera objective K6-MIN as shown in Fig. 19 .
Fig. 19: Standard lens for IMAG-MIN/GFP (focus ring = f, aperture = a),
filter slider in GFP position
Before mounting the objective with filter slide to the IMAG-K6 CCD
camera a 5 mm distance ring needs to be mounted and if IMAG-K6
has been used in another IMAGING-PAM configuration additional
short pass filters (e.g. Fig. 8 left) between camera and objective as
well as other distance rings need to be removed. Afterwards the
IMAG-K6 CCD camera with distance ring, objective and filter slide
is attached to the IMAG-MIN/GFP head using the topmost position
of the metal holder (see Fig. 17).
For special applications it is also possible to use a lens with a wider
angle (16 mm). In this case the camera has to be mounted in one of
the two lower positions (not shown) with the filter slider mounted on
the camera lens subsequently.
With the help of this filter slider the detection filter in front of the
25 mm lens can be exchanged from PSII measurement to GFP
measurement and vice versa.
f
a
CHAPTER 4 COMPONENTS OF THE MINI-VERSION
34
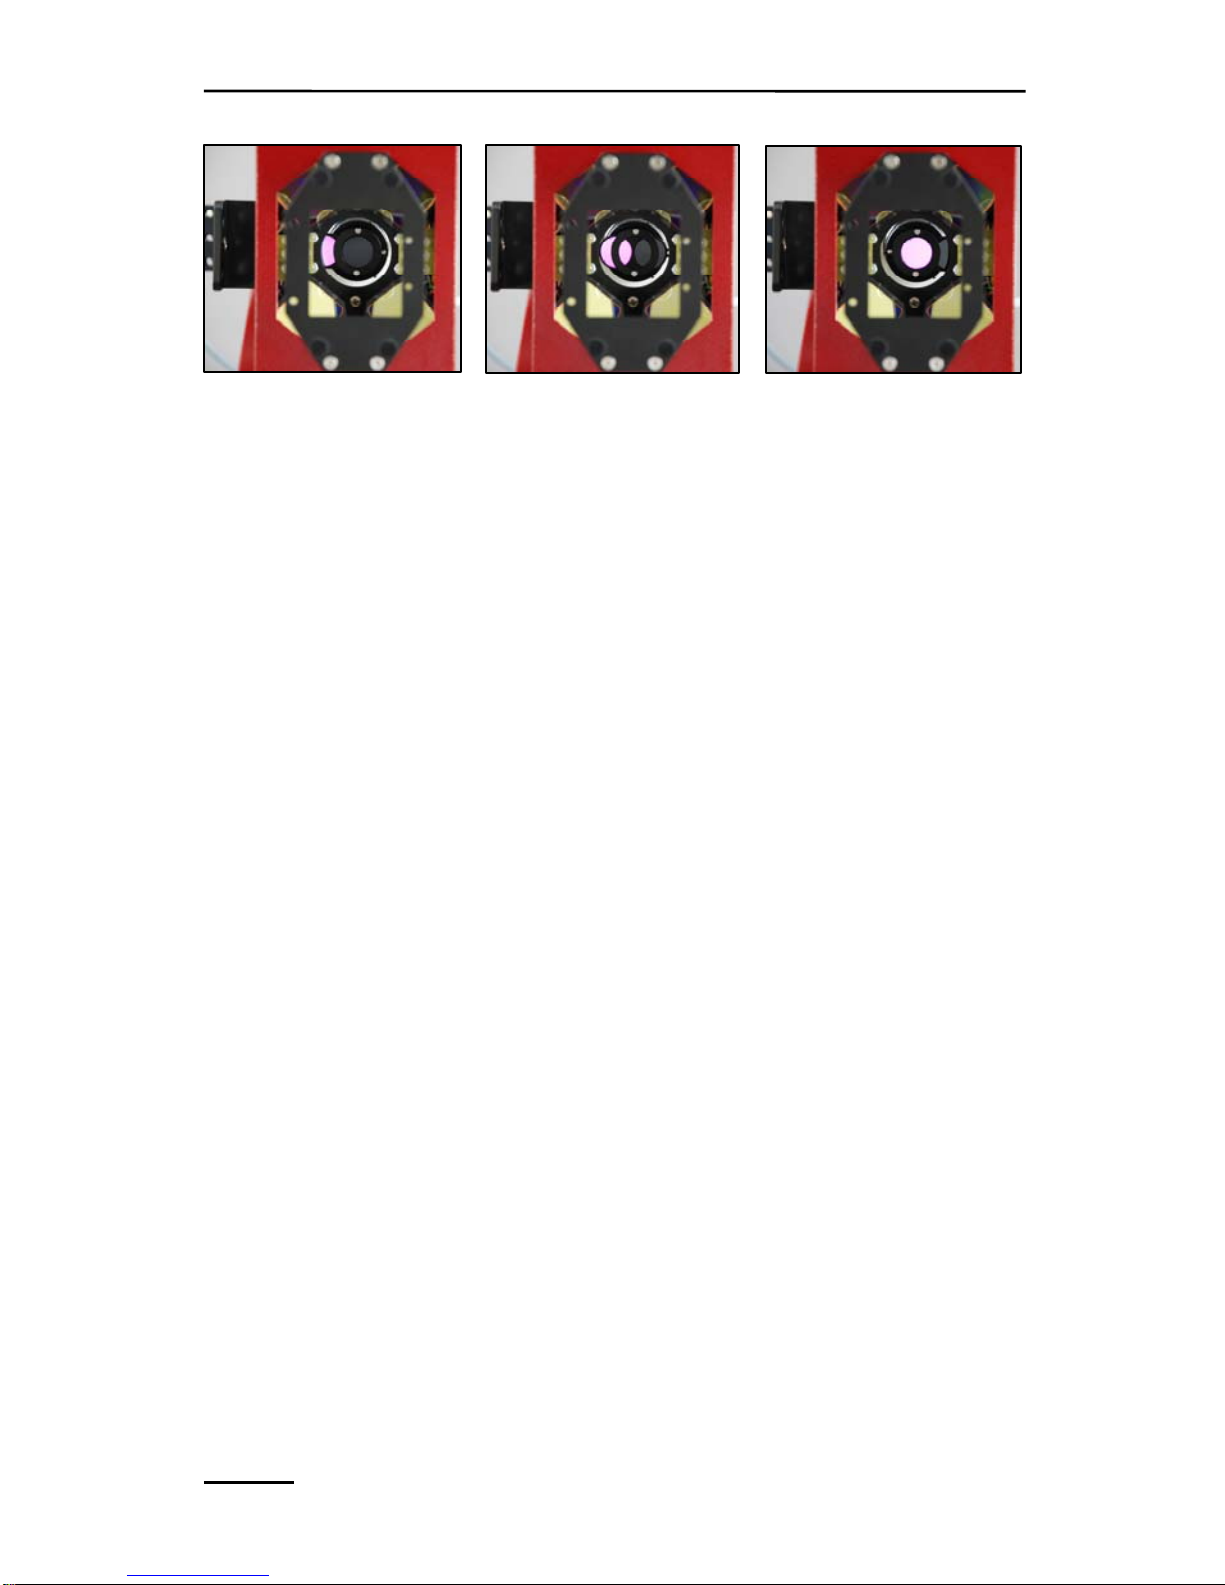
Fig. 20: switching of the filter slider between two positions (A – PSII, C-
GFP position)
The view into the GFP Mini-Head from the sample side (Fig. 20)
explains the two positions of the filter slider.
The filter slider carries two detection filters. The dark red one
(RG665) enables the camera to detect PSII-fluorescence and a
special interference filter for the detection of wavelengths between
500 and 600 nm is used for GFP detection.
A B C

CHAPTER 4 COMPONENTS OF THE MINI-VERSION
35
The filter slider can be pushed from left to right (Fig. 20 A to C), to
change the detection filter from PSII-fluorescence to GFP. For
lowering background effects, the GFP Head is shipped with a sample
of a low fluorescent black adhesive film which can be used as a
background layer.
A
B
Fig. 21: possible color modes for the GFP images
CHAPTER 4 COMPONENTS OF THE MINI-VERSION
36
There are different color modes reasonable for the GFP
measurements. Fig. 21 A shows an image in the false color scale
mode of the “Analysis” function (see also chapter 9.1.2.6). Another
option is the black and white mode as in Fig. 21 B. The Description
of the Display Parameters can be found under chapter 9.5.8 (display
parameters) of the manual. Pictures can be exported via the export
function described in chapter 8.2.
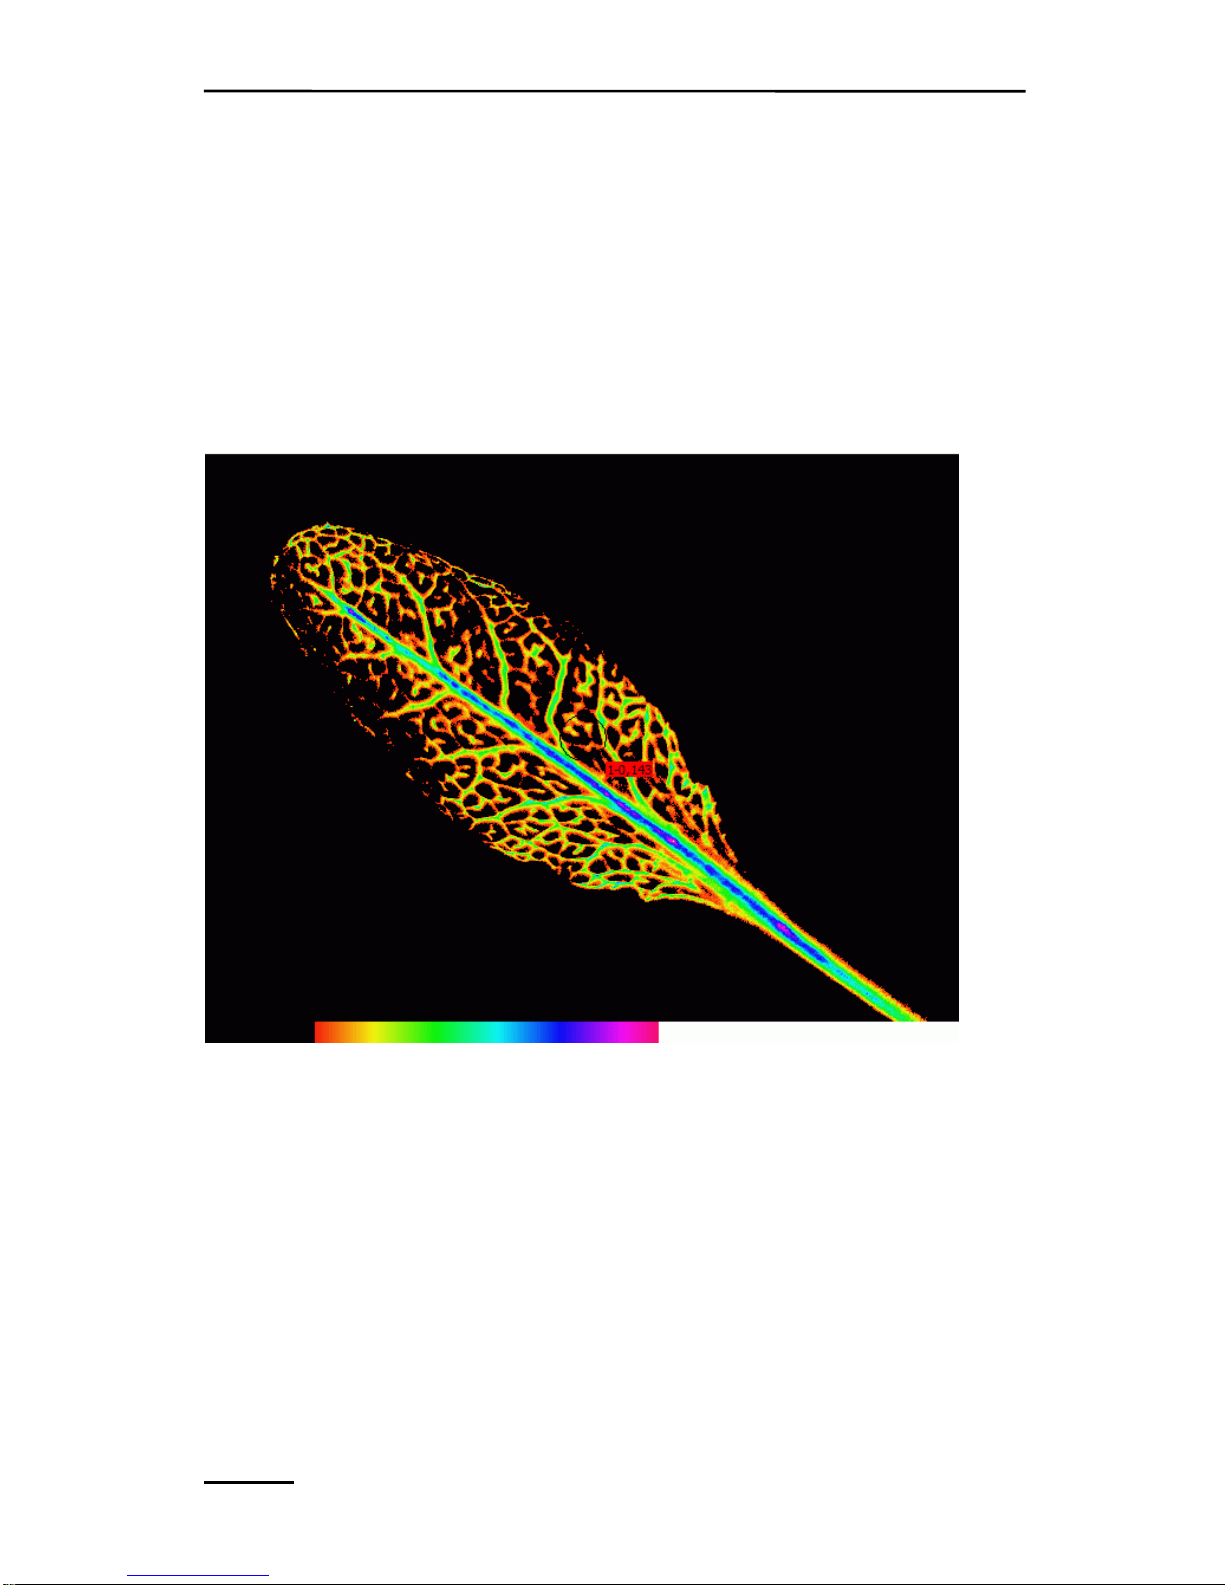
Fig. 22: Expanded Color for enhancing GFP images
This example picture (Arabidopsis thaliana with promSUC2 GFP)
has been measured with the following settings:
-
Filter slider in the GFP position
- MF 8, ML
max, Damp
ing 4, Gain on 8
In contrast to the PSII fluorescence, for GFP
measurement some
settings must be very high. For this reason long exposure to these
CHAPTER 4 COMPONENTS OF THE MINI-VERSION
37
settings may lead to the bleaching of the sample. Using the
„Analysis“ sliders, the inevitable background can be suppressed.
Since the camera used for the combined GFP-Head is highly sensitive, settings have to be changed between GFP and PSII measurement:
- PSII fluorescence – ML=1, Gain=2, Damp
=1
The basic im
age fluorescence now should have a value of nearly
0.15, to prevent overflow during the saturating flash. If still overflow
appears, please also use the aperture of the camera lens to lower the
fluorescence signal. (The benefit of doing this is that the depth of
focus is increased which may help to get also bent leaves in focus
without cutting.)
For Absorptivity measurements in the PSII mode no starting values
for red and NIR can be given because these values depend on the
aperture of the used lens. For details read more under chapter 5.8.3
and 5.4.2.1 of this manual.
As for the other MINI-head LED arrays the metal angle bar of
the mounting set K6-MIN/M serves for mounting the MINI-Head
with camera onto the IMAG-CG Control Unit, to the Leaf Holder
IMAG-MIN/BK or to a tripod and can be extended with a Leaf Clip
and a Grip Holder.
A
B
Fig. 23: Fo image in the PSII mode (A) vs. Fm image (B)
CHAPTER 4 COMPONENTS OF THE MINI-VERSION
38
4.5 Leaf Holder IMAG-MIN/BK with Grip Holder
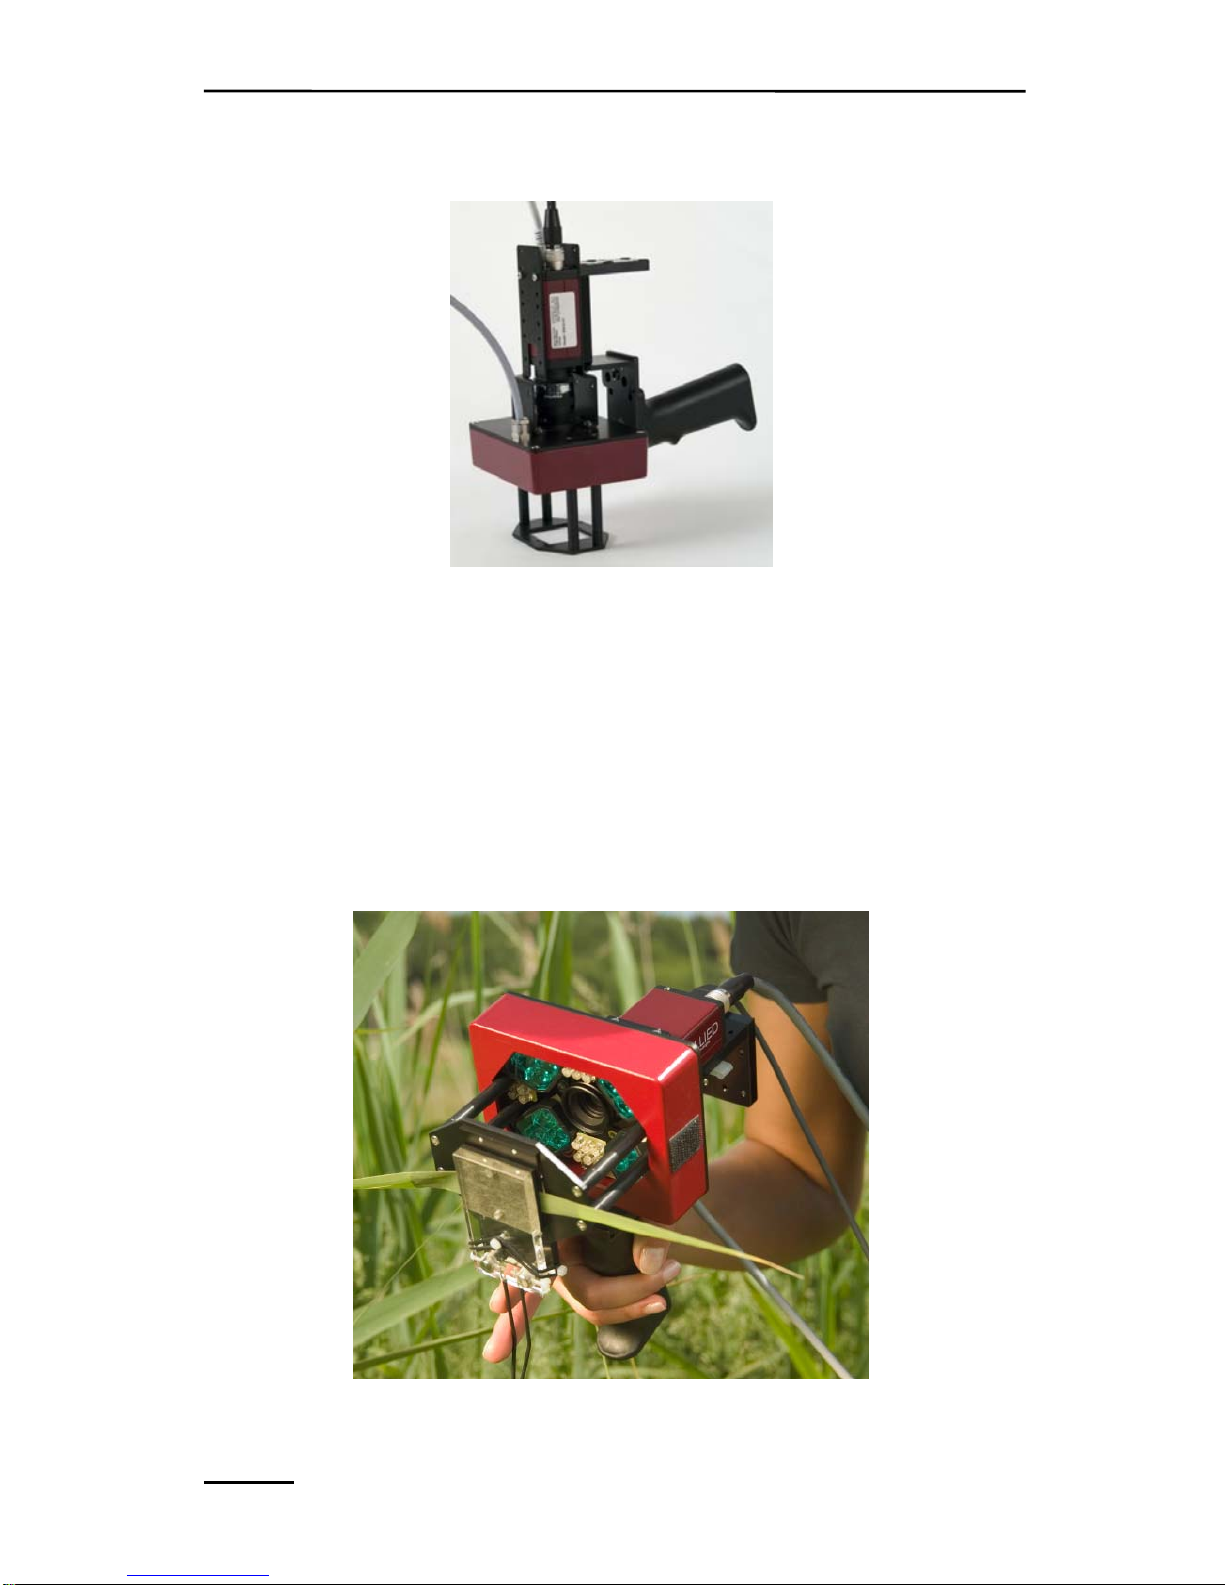
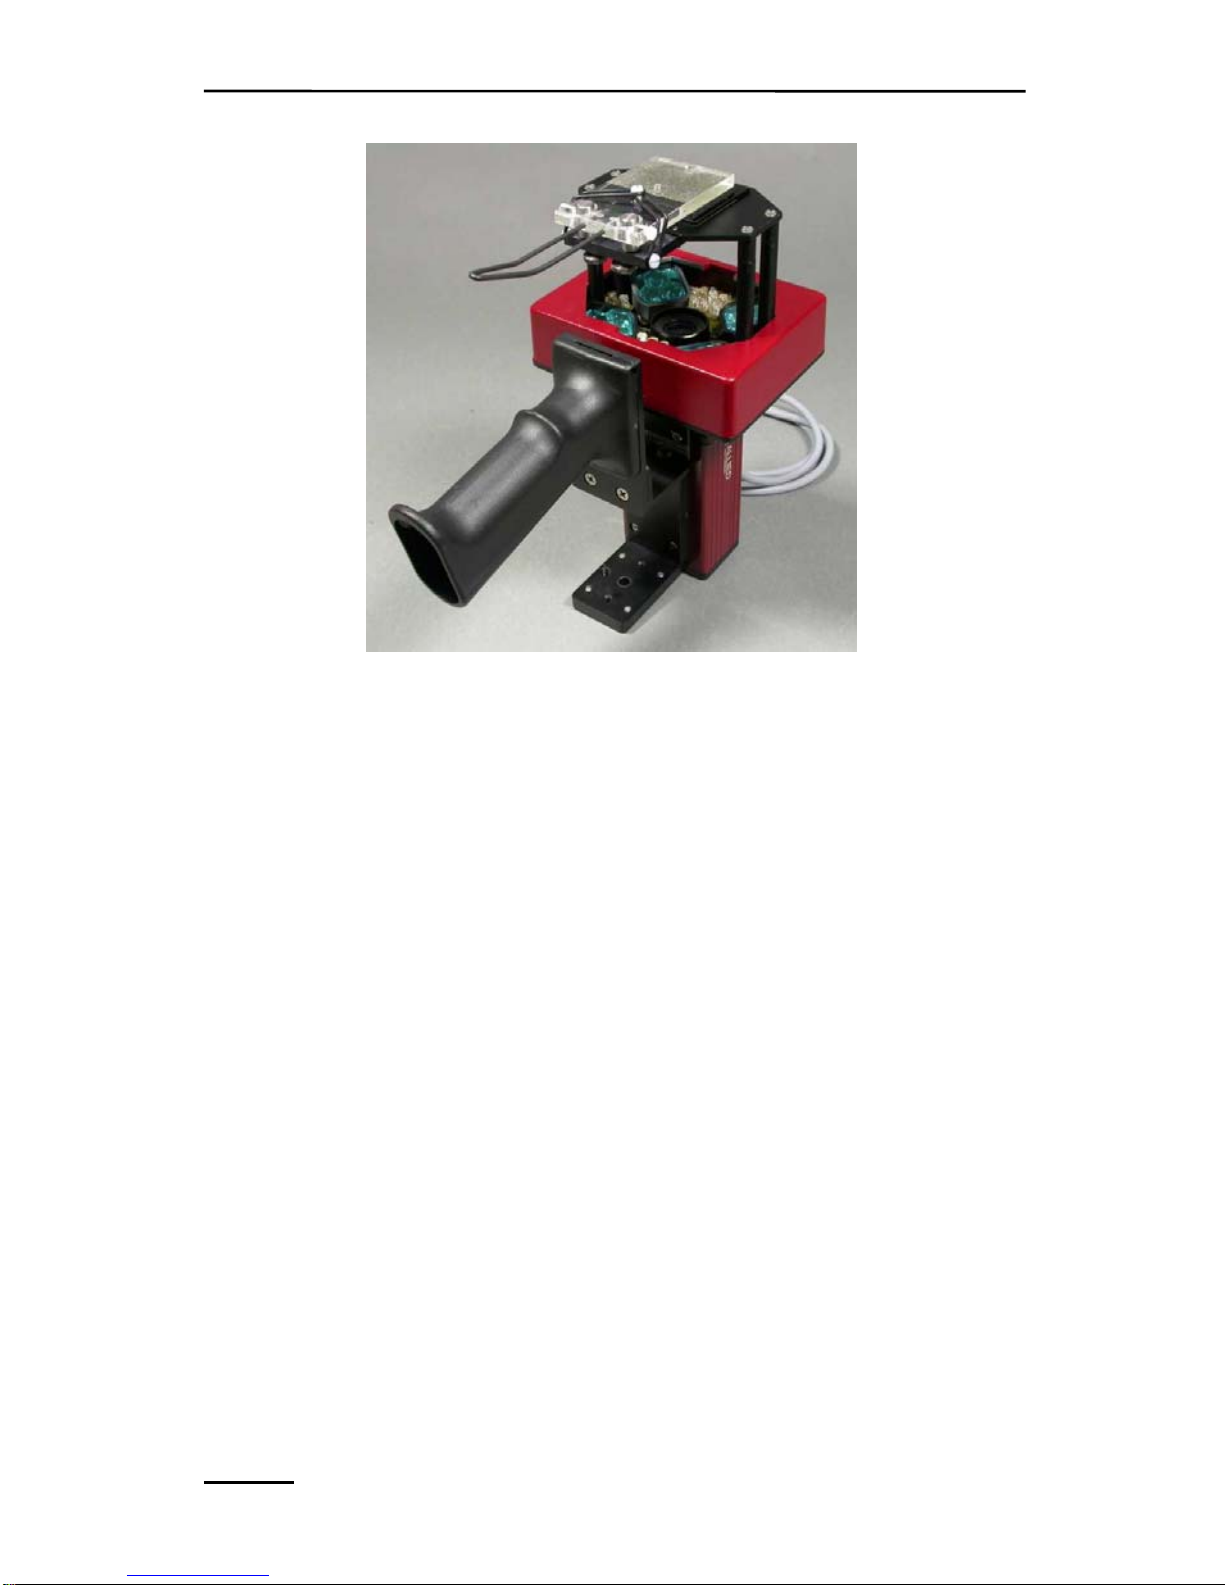
Fig. 24:
MINI-Head with CCD camera and grip holder
When the Leaf Holder is delivered together with the MINIversion of the Imaging-PAM, it is already mounted on the MINIHead. A grip holder is provided, which can be fixed to the metal
angle on the camera. Using this grip the MINI-Head can be carried
with one hand and the lever of the leaf clip can be moved up with the
same hand (see Fig. 25).
Fig. 25: Mini-Head with grip holder used in field
CHAPTER 4 COMPONENTS OF THE MINI-VERSION
39
This is particularly useful in field applications. The MINI-Head
may either be carried separately or together with the IMAG-CG, on
which it may be mounted with the help of a wing screw.
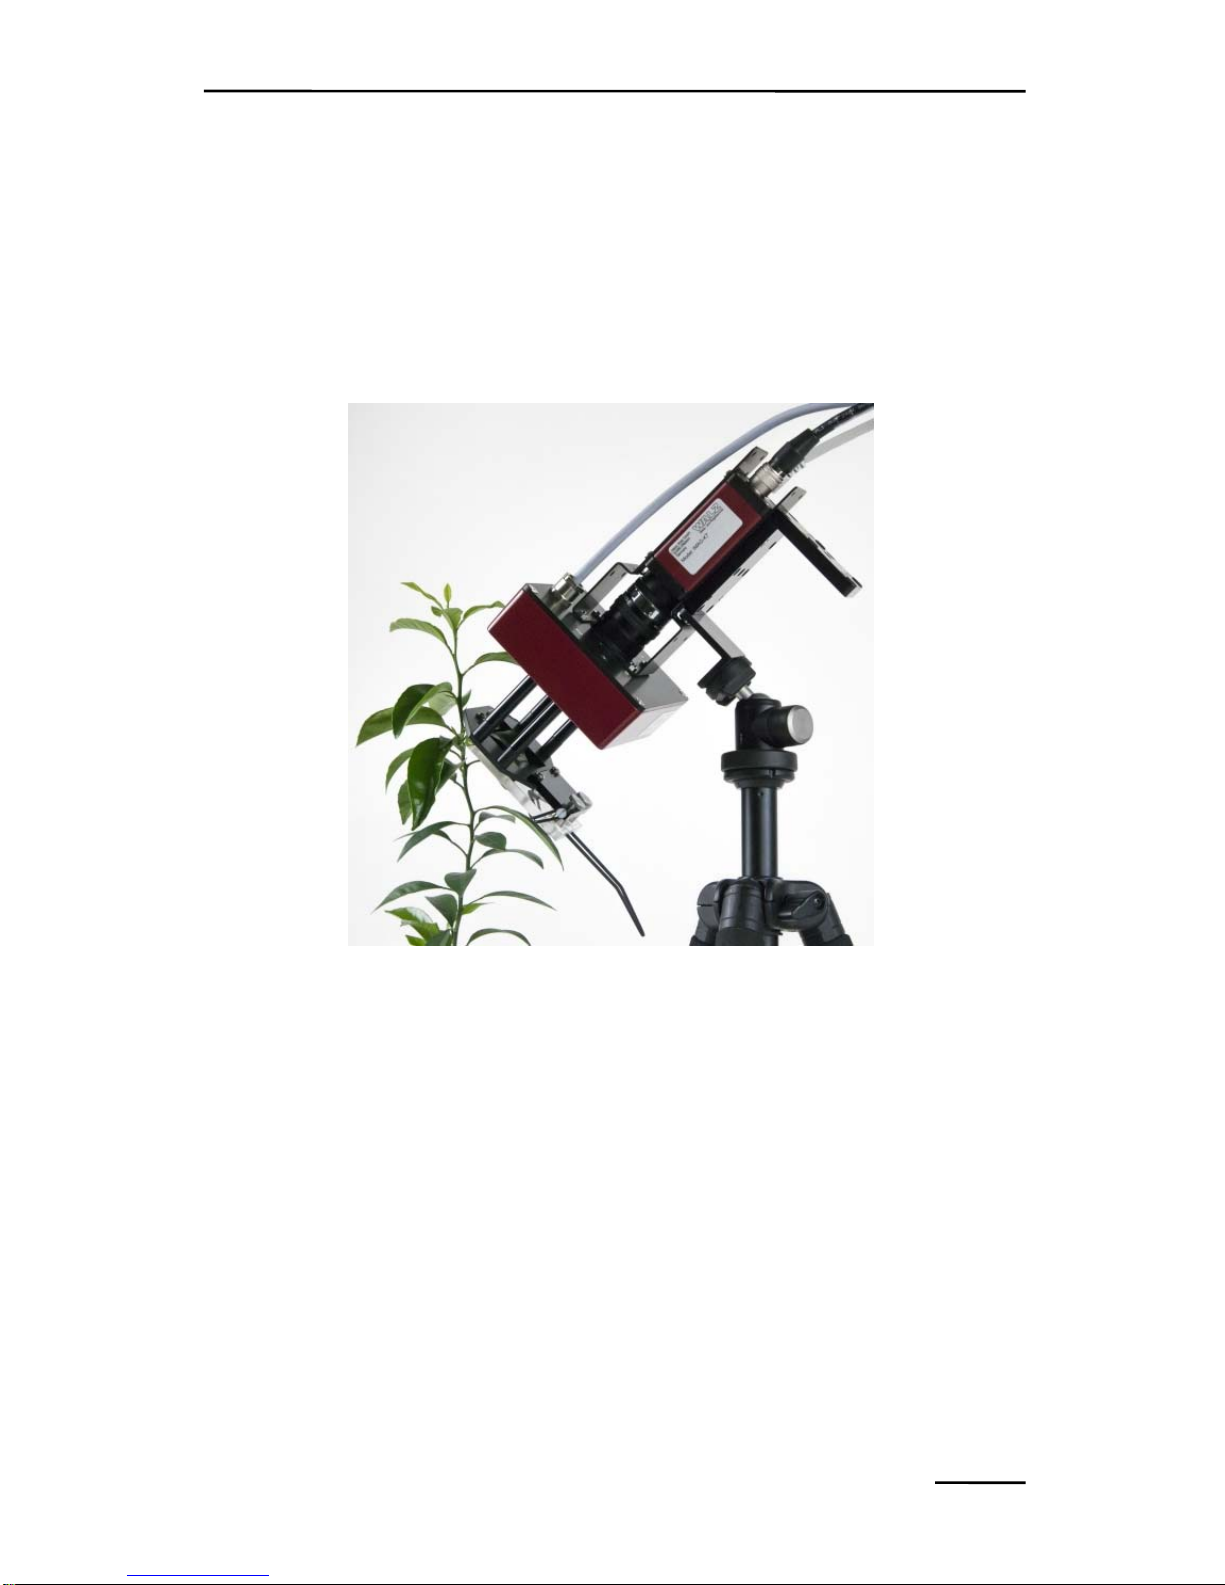
Alternatively the Mini-Head may also be mounted on a tripod using
the same metal angle to which the carrying grip can be connected
(see Fig. 26).
Fig. 26: Mini-Head with Leaf Holder mounted on a tripod
When the Leaf Holder is ordered separately from the MINIHead, it has to be assembled by the user. Fig. 27 shows the
components of the Leaf Holder. The following figures (Fig. 28 - Fig.
30) m
ay help to put the various parts together
.

CHAPTER 4 COMPONENTS OF THE MINI-VERSION
40
Fig. 27: Components of the Leaf Holder
First the frame (1) is mounted with two screws (2) on the sample
platform of the MINI-Head. Then the clip (3) is fixed with two
screws (4) to the sample platform. While Fig. 28 shows the mounted
clip from the bottom (camera) side, Fig. 29 shows it from the top
side. On the perspex top side of clip the nylon screw (5) is fixed
which holds the two O-rings (6) which function as a spring forcing
together the two parts of the clip (see Fig. 28 and Fig. 29). The Orings may age and then have to be replaced. For this purpose the
spare O-rings (7) are provided. The grip (8) is fixed with the two
screws (9) via a metal angle to the camera, as shown inFig. 30.

CHAPTER 4 COMPONENTS OF THE MINI-VERSION
41
Fig. 28: Leaf clip mounted on sample platform of MINI-Head viewed from
camera side
Fig. 29: Leaf clip mounted on sample platform of MINI-Head viewed from
top side
CHAPTER 4 COMPONENTS OF THE MINI-VERSION
42
Fig. 30: Leaf clip and grip holder mounted on MINI-Head
4.6 Adapter for GFS-3000 (IMAG-MIN/GFS)
The MINI-version of the IMAGING-PAM M-series can be
applied for simultaneous measurements of CO
2
gas exchange and
chlorophyll fluorescence. For this purpose the adapter IMAGMIN/GFS is available which replaces the sample-platform of the
standard version. The adapter features a frame with two ball-pins that
allow to click the MINI-Head onto the Measuring Head of the GFS-
3000. The distance rods carrying this frame are 11 mm shorter than
in the standard version in order to assure identical working distance
from the camera to the leaf sample within the gas exchange cuvette.

CHAPTER 4 COMPONENTS OF THE MINI-VERSION
43
Fig. 31: MINI-Head mounted on Standard Measuring Head of the GFS-
3000 Gas Exchange Fluorescence System
When the MINI-Head is used in combination with the gas exchange
measuring system, it is controlled by the combined ImagingWin and
GFSWin programs running synchronously on the same PC. The
synchronous operation allows an accurate time assignment of gas
exchange and fluorescence data in a common Report file. While the
actinic illumination for driving photosynthetic electron transport is
provided by the LED-array of the MINI-Head, the switching on/off
of actinic light is controlled via the GFSWin software. Further
peculiarities that are important for the combined operation of MINIHead and GFS-3000 under GFWin and ImagingWin are described in
a separate brochure.

CHAPTER 4 COMPONENTS OF THE MINI-VERSION
44
4.7 ImagingWin software versions for various types of MINI-
Version
Upon start of the ImagingWin program the user may choose between
different software versions for the various types of MINI-Heads.
While these versions are practically identical, they feature different
PAR-Lists (found under „Options“ in the software or chapter 10 in
the manual).
Particular Image Corrections (found under „Settings“ or 9.5.5)
apply to different MINI-Heads.
Note:
When the program is started for the first time after installation of the
software, it comes up with a warning that the file for Image
Correction is not found. It is recommended that the user determines
the Image Correction for his particular MINI-Head before starting
serious measurements (see chapter 9.5.5).
With every Measuring Head of the three different correction images
can be stored: Type 1, Type 2 and Maxi or Mini or IMAG L450
and RGB.
For measuring Image Correction please proceed as follows:
• set the optical conditions under which the actual measurements
are going to be done (working distance, focusing position, see above)
• select Type 1, Type 2 or Maxi/Mini/Micro/IMAG L450/RGB
(under Settings/Image Correction)
• in the case of MAXI- and MINI- versions place at least two
layers of white paper (e.g. folded DIN-A4) into sample plane; in the
case of the MICROSCOPY-version the plastic fluorescence standard
• put the image somewhat out of focus to avoid imaging fine
structures of the white paper tissue or dust etc. on the surface of the
fluorescence standard
• press the measure button (under Settings/Image Correction)

CHAPTER 4 COMPONENTS OF THE MINI-VERSION
45
The measured correction image will be saved until it is
overwritten by a new measurement. The correction images will
remain valid as long as the same optical parameters apply (LED
Illumination Unit, working distance, focusing position, camera
objective lens, microscope objective lens).

CHAPTER 5 COMPONENTS OF THE MICROSCOPY-VERSION
46
5 Components of the IMAGING-PAM
MICROSCOPY-version
The MICROSCOPY-version of the IMAGING-PAM consists of:
1)
Control Unit IMAG-CG with Battery Char
ger 2120-N
2)
CCD Came
ra IMAG-K6 (2/3")
3)
Modified Zeiss
Axio ScopeA.1
4) LED Modules as:
Microscopy LED Lamp
(blue) IMAG-L470M or
Microscopy LED Lamp
(red-orange) IMAG-L625M or
Microscopy LED Lamp (UV-
A) IMAG-L365M or
Red-Green-Blue Microscopy LED Lamp
IMAG-RGB
5)
PC with ImagingW
in-software
Operation of the MICROSCOPY-IMAGING-PA
M requires an
epifluorescence m
icroscope. For this purpose relatively simple
microscopes with short excitation pathways are suited. Most
essential components for optimal image qualities are high aperture
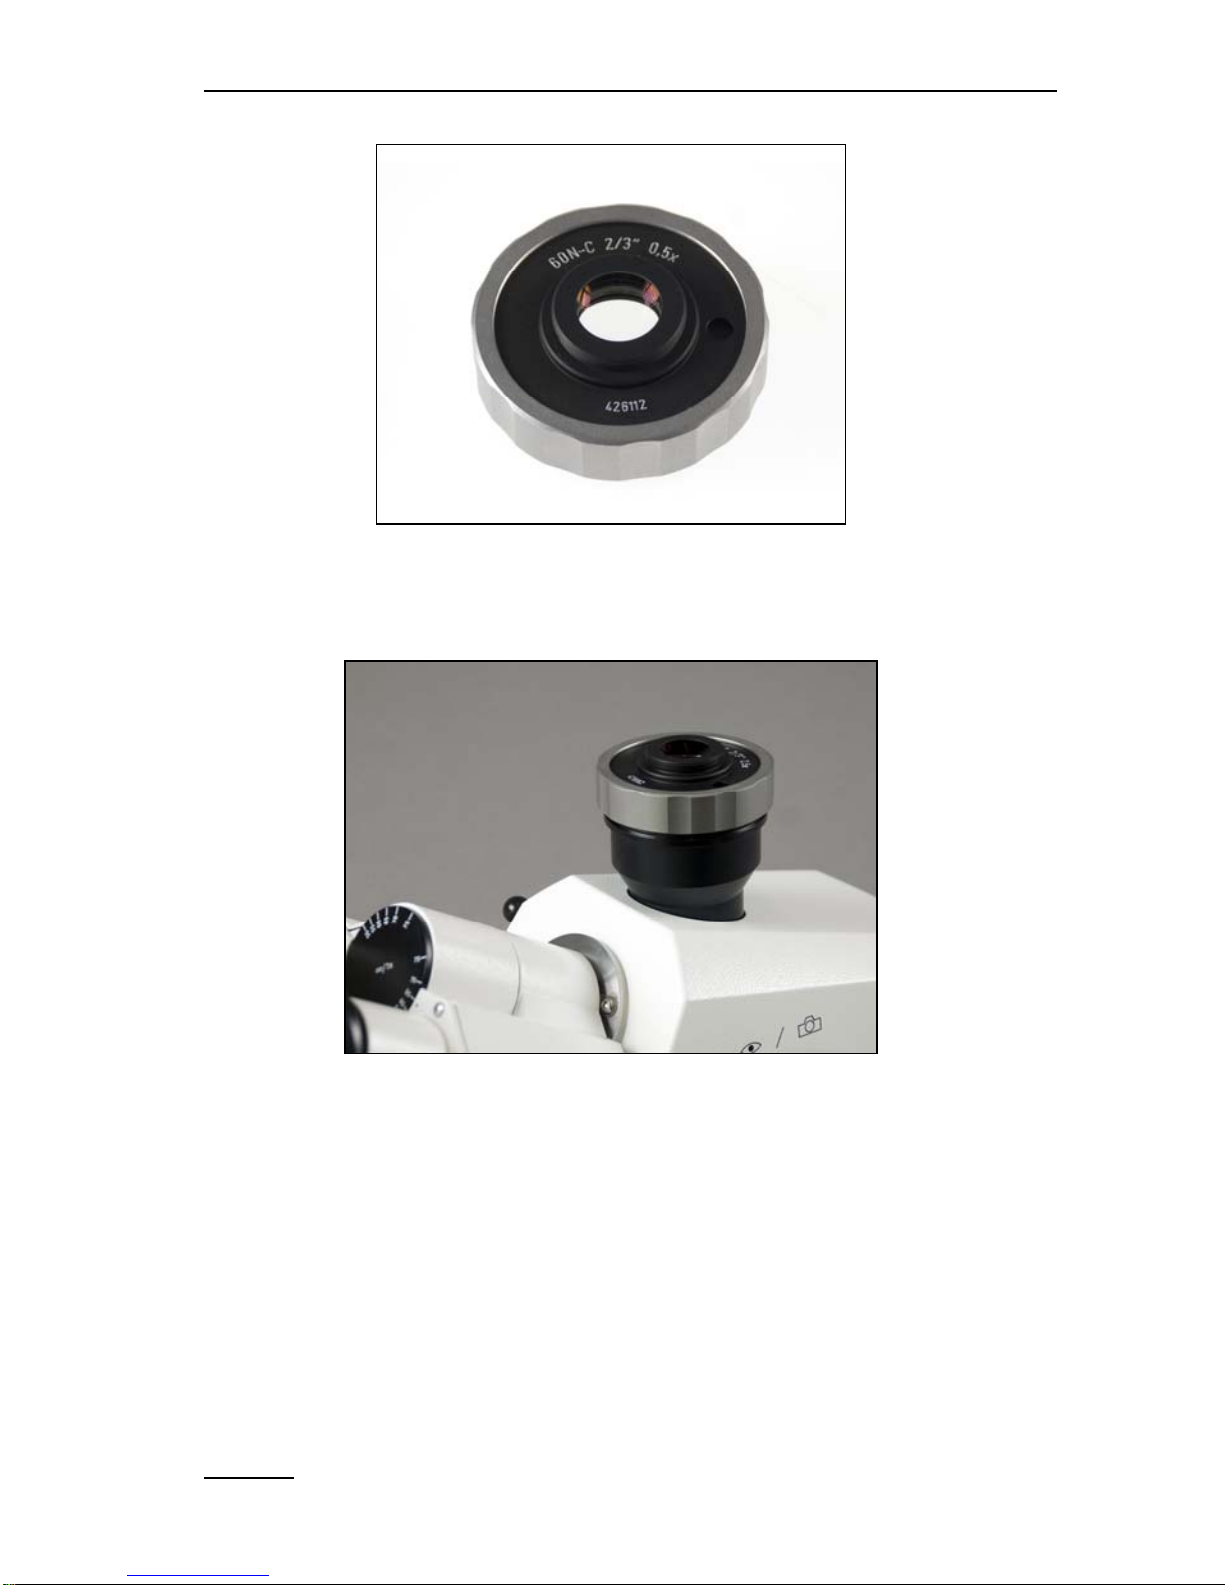
objectives and a suitable video adapter. While the IMAG-K6 camera
features a 2/3" CCD chip, it is recommended to use a 0.5x video
adapter for 1/2" chips, in order to obtain a more intense fluorescence
image.
The Zeiss Axio Scope.A1 microscope may be particularly
recommended for use in conjunction with the MICROSCOPYversion.
The features of these components will be described briefly in the
following subsections.

CHAPTER 5 COMPONENTS OF THE MICROSCOPY-VERSION
47
5.1 Multi Control Unit IMAG-CG
The same Multi Control Unit IMAG-CG is used for all versions
of the IMAGING-PAM M-series. It was already described in section
3.1 in conjunction with the MAXI-version. The cable of the
MICROSCOPY LED Lamps IMAG-L470M or IMAG-L625M is
connected to the MINI-Head socket at the rear side of the control
unit. The cable of the Red-Green-Blue Microscopy LED Lamp
IMAG-RGB is connected to the RGB-Head socket at the rear side of
the control unit. The rear side also features a CAMERA-socket to
which the Camera cable has to be connected. This cable is used to for
trigger signal and to power the IMAG-K6 camera.
5.2 CCD Camera IMAG-K6
The CCD Camera IMAG-K6 as described in chapter 3.3 features
a 2/3" chip with 1392 x 1040 pixels and 4-pixel-binning, resulting in
fourfold image intensity for the 640 x 480 pixel displayed on the
monitor screen.
If the IMAG-K6 has been used in another IMAGING-M
application. Please take off the objective, filters and the distance
ring. The IMAG-K6 camera can now be connected on top of the
phototube of the Axio Scope.A1 via video adapter. 0.5x adapter for
1/2" CCD cameras (Zeiss; 416112-0000-000, Fig. 32).
CHAPTER 5 COMPONENTS OF THE MICROSCOPY-VERSION
48
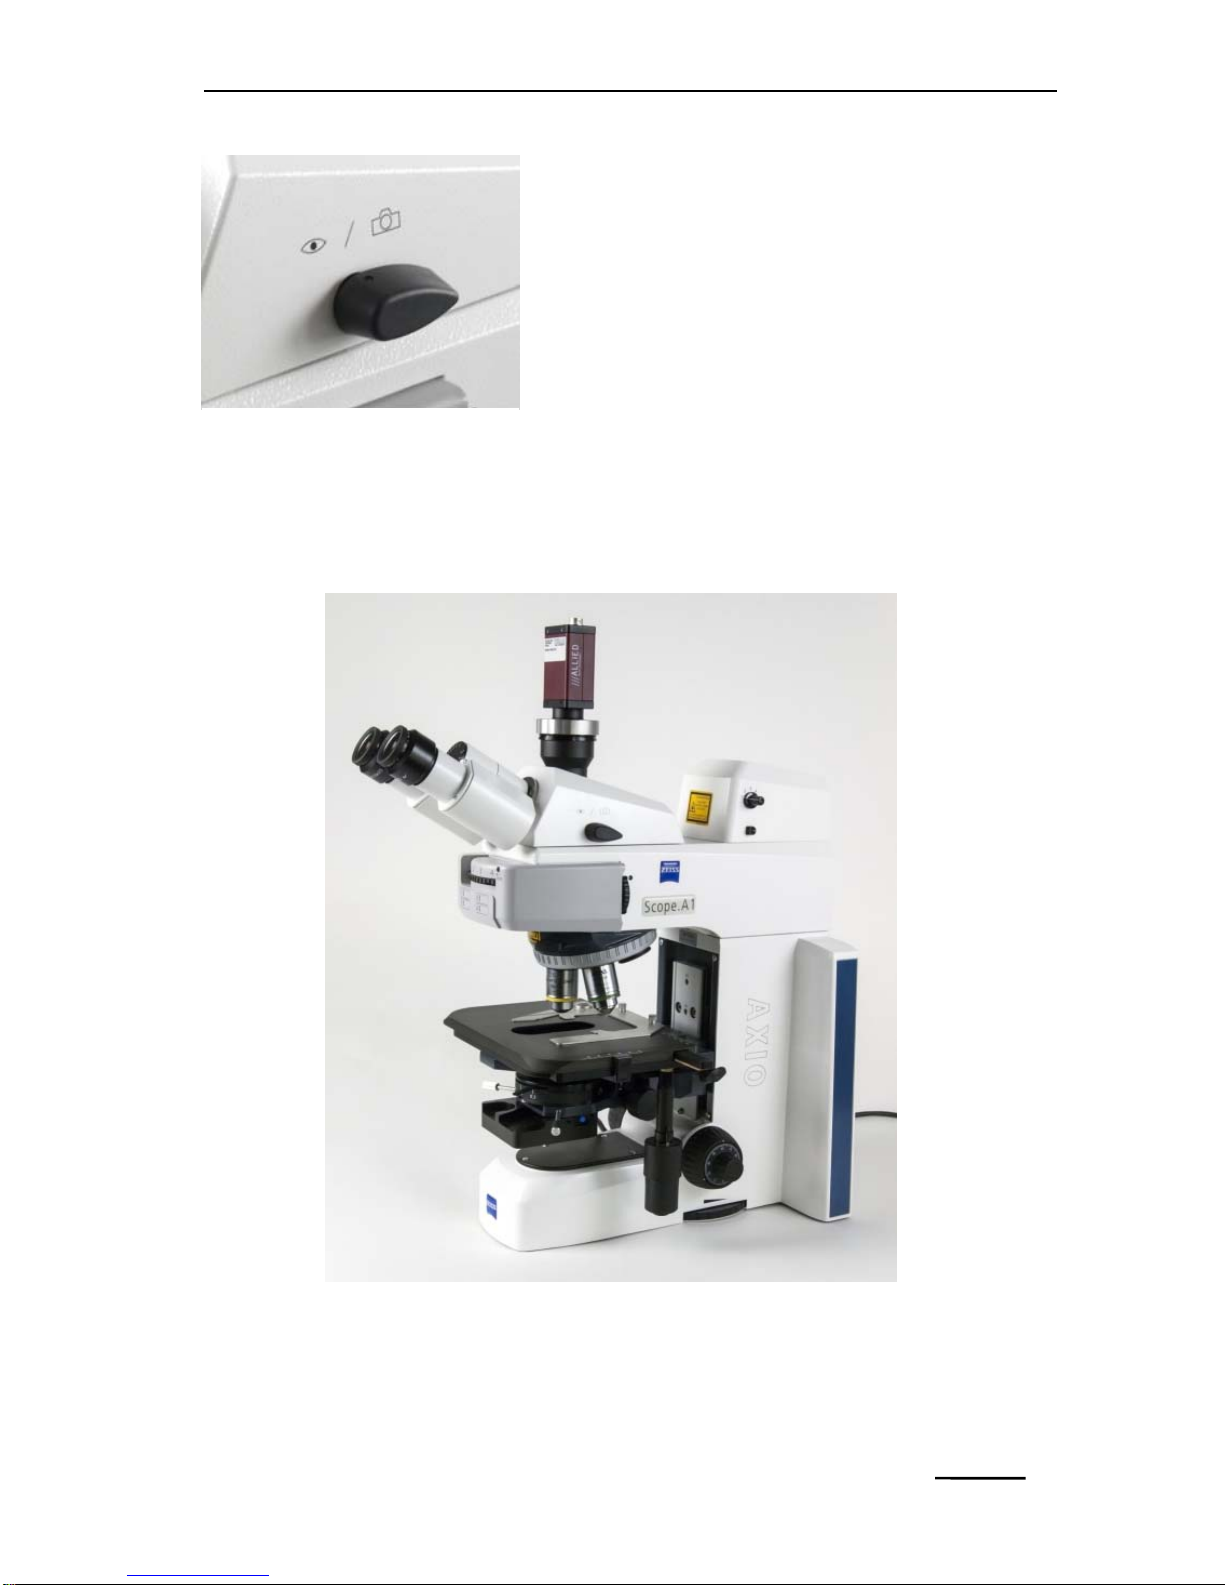
Fig. 33: Zeiss camera adapter mounted on Axio Scope.A1
The camera IMAG-K6 (not shown) can be screwed onto the Cmount adapter shown in Fig. 33. Afterwards the camera needs to be
connected to the camera port of the IMAG-CG multi control unit as
well as to the computer via Gigabit Ethernet.
Fig. 32: Camera adapter for connecting Axio Scope.A1 with IMAG K6
CHAPTER 5 COMPONENTS OF THE MICROSCOPY-VERSION
49
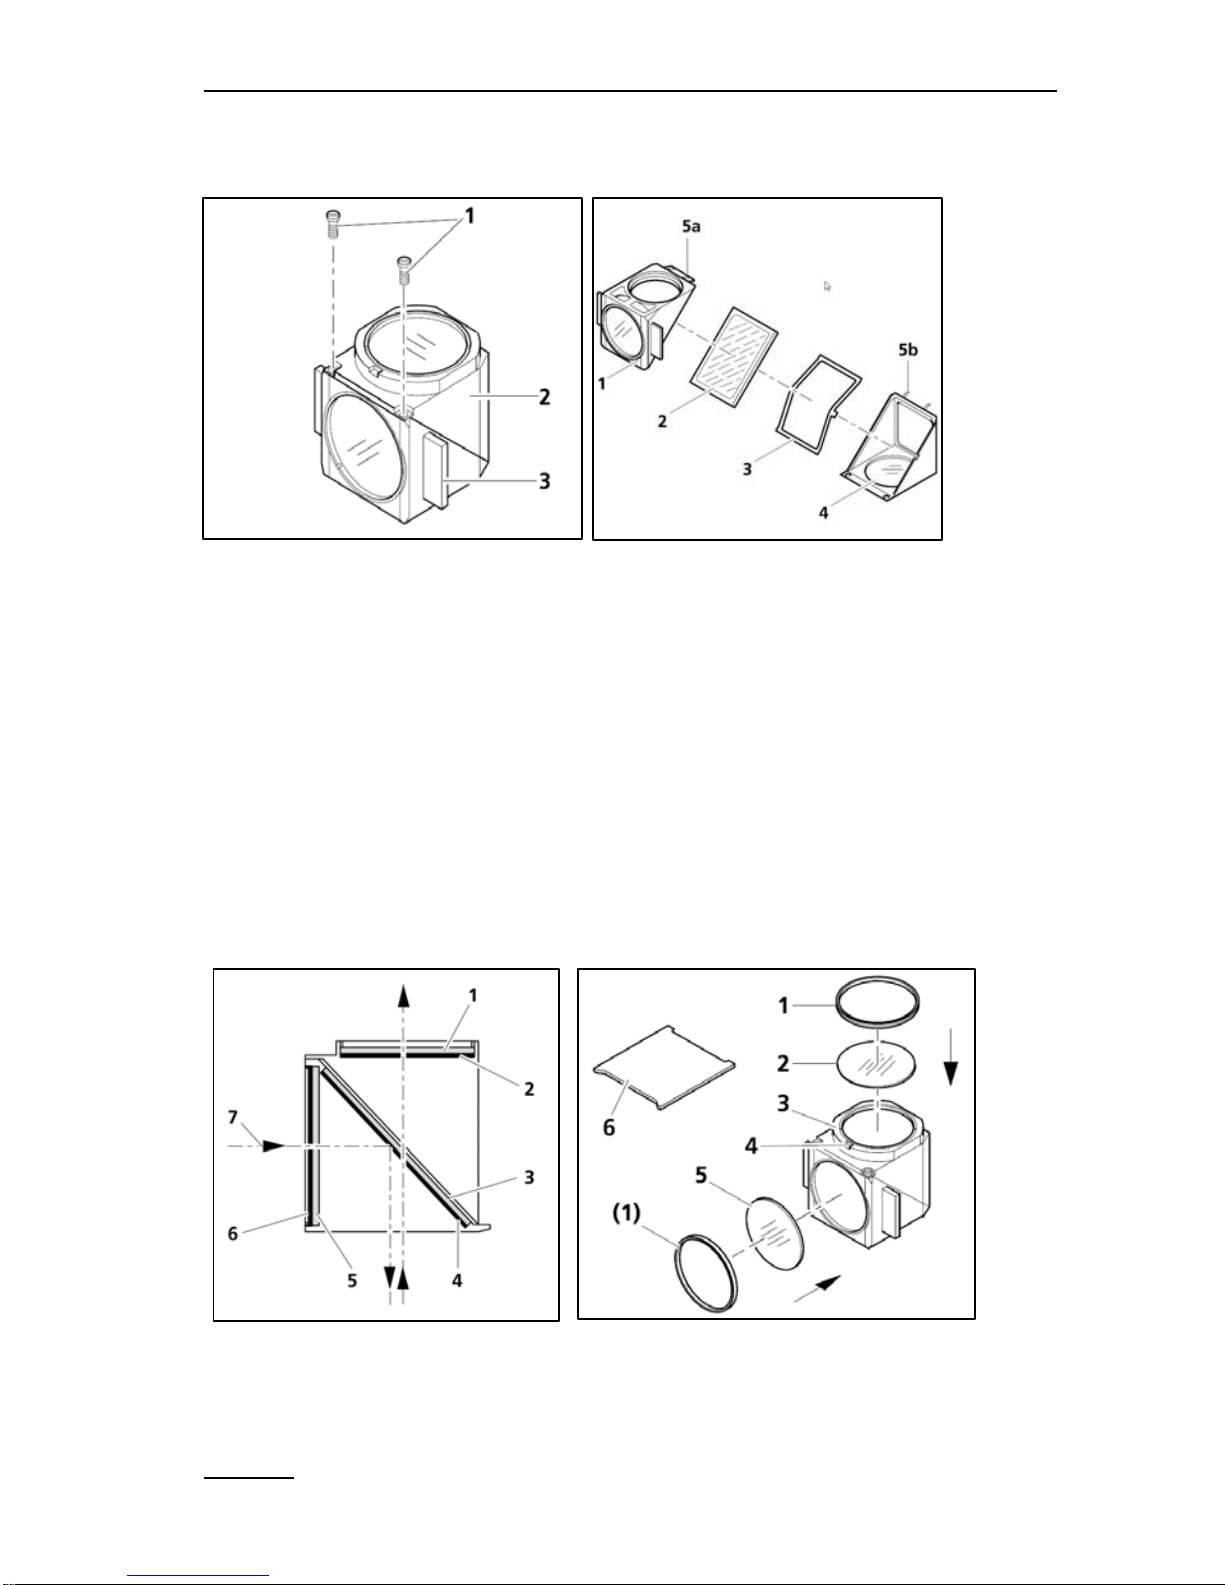
The user should get familiar with the
switch which allows switching between
binocular or phototube / photomultiplier pathways (see Fig. 34).
Furthermore the halogen transmitted
light lamp should be switched off
during epifluorescence measurements to
avoid actinic illumination of the sample.
5.3 Axio ScopeA.1 Epifluorescence Microscope
Fig. 35: MICROSCOPY-IMAGING-PAM based on Zeiss ScopeA.1
Epifluorescence Microscope
Fig. 34: Pathway switch

CHAPTER 5 COMPONENTS OF THE MICROSCOPY-VERSION
50
The MICROSCOPY-IMAGING-PAM is readily adapted to the
Zeiss Axio ScopeA.1 microscope giving excellent fluorescence
images. If a complete IMAGING-PAM MICROSCOPY Version has
been purchased, some parts are already mounted to make the first
setup a bit easier. For safe shipping purposes some components had
to be detached.
Existing Zeiss Axio ScopeA.1 microscopes can be adjusted to the
MICROSCOPY-IMAGING-PAM on request.
Please note that openings in the microscope parts are sealed by
stickers or caps that have to be removed before mounting the parts
The Axio Scope.A1 has a special port that can carry up to four
LED modules which are available in ten different wavelengths
starting with 380 nm up to 625 nm. For the standard PAM
application we are recommending the 625 nm red LED module or the
470 nm blue light version (not suitable for the measurement of
cyanobacteria). More Information on the Zeiss LED modules can be
found in chapter 3.4.9 of the Axio Scope.A1 manual or in the internet
on www.Zeiss.de. The LED modules offer very homogeneous
illumination of the measured area and are modified for PAM
applications with additional filters by Walz.
When other wavelengths, than the recommended ones, shall be
applied for special measurements, please contact Walz for
recommendations on appropriate filter combinations.
Important parts required for optimal performance are the microscope
objective lenses. High aperture lenses like the Zeiss Fluar 10x/0.5,
Fluar 20x/0.75 and Fluar 40x/1.30 Oil are recommended. In this
context, it has to be considered that a high aperture enhances image

CHAPTER 5 COMPONENTS OF THE MICROSCOPY-VERSION
51
intensity two-fold by increasing excitation intensity as well as
fluorescence collection. The image intensity with a Zeiss Fluar
20x/0.75, for example, is 6.6 times higher than with a Zeiss Apoplan
20x/0.45. In view of the fact that image intensity is the limiting
factor in MICROSCOPY-PAM applications, an investment in high
aperture lenses should have high priority.
5.3.1 Reflector Modules
In complete IMAGING-PAM MICROSCOPY instruments
necessary filters of the reflector modules are already mounted.
In case the reflector module is purchased as a separate part, please
follow the instructions below. The correct orientation of the beam
splitter filter is essential for the correct functioning of the
IMAGING-PAM system.
It is required to mount the reflector modules into the turret of the
Zeiss Axio Scope.A1 as described in chapter 5.3.3. When using more
than one LED module, please note that each LED module needs its
own reflector module (chapter 3.1.6 Fig 3-9 and 3.4.6 Zeiss manual).
CHAPTER 5 COMPONENTS OF THE MICROSCOPY-VERSION
52
5.3.2 Assembling of beam splitter and filters
B
Zeiss Zeiss
Fig. 36: The reflector module – mounting the beam splitter
A) For opening the reflector module, loosen two screws (A/1). The
em
ission part (A/2) can now be detached from
the excitation part
(A/3) by
a turn around the lower angle. B) Tilt the excitation part
on
top
and lift the emission part out of the holding fixtures. A
spring box
(B/3)
holds the beam splitter filter. Take care that the mi
rrored side of
the beam splitter is pointing upwards.
B
LED Zeiss Zeiss
Fig. 37: Reflector module with filter configuration
CHAPTER 5 COMPONENTS OF THE MICROSCOPY-VERSION
53
A) The arrows in Fig. 37/A1 mark the path of the illumination beam
or the imaging beam seen from the side. B) lists the different
filters
and
parts that may be needed.
The detector filter B /2 (RG665), a
filter for the excitation light source (B /5
- normally not needed).
B
/6 is the m
ounting tool for the adapter rings (B /1). The beam
splitter
filter (A /3) is already mounted in this figure (see Fig. 37/B).
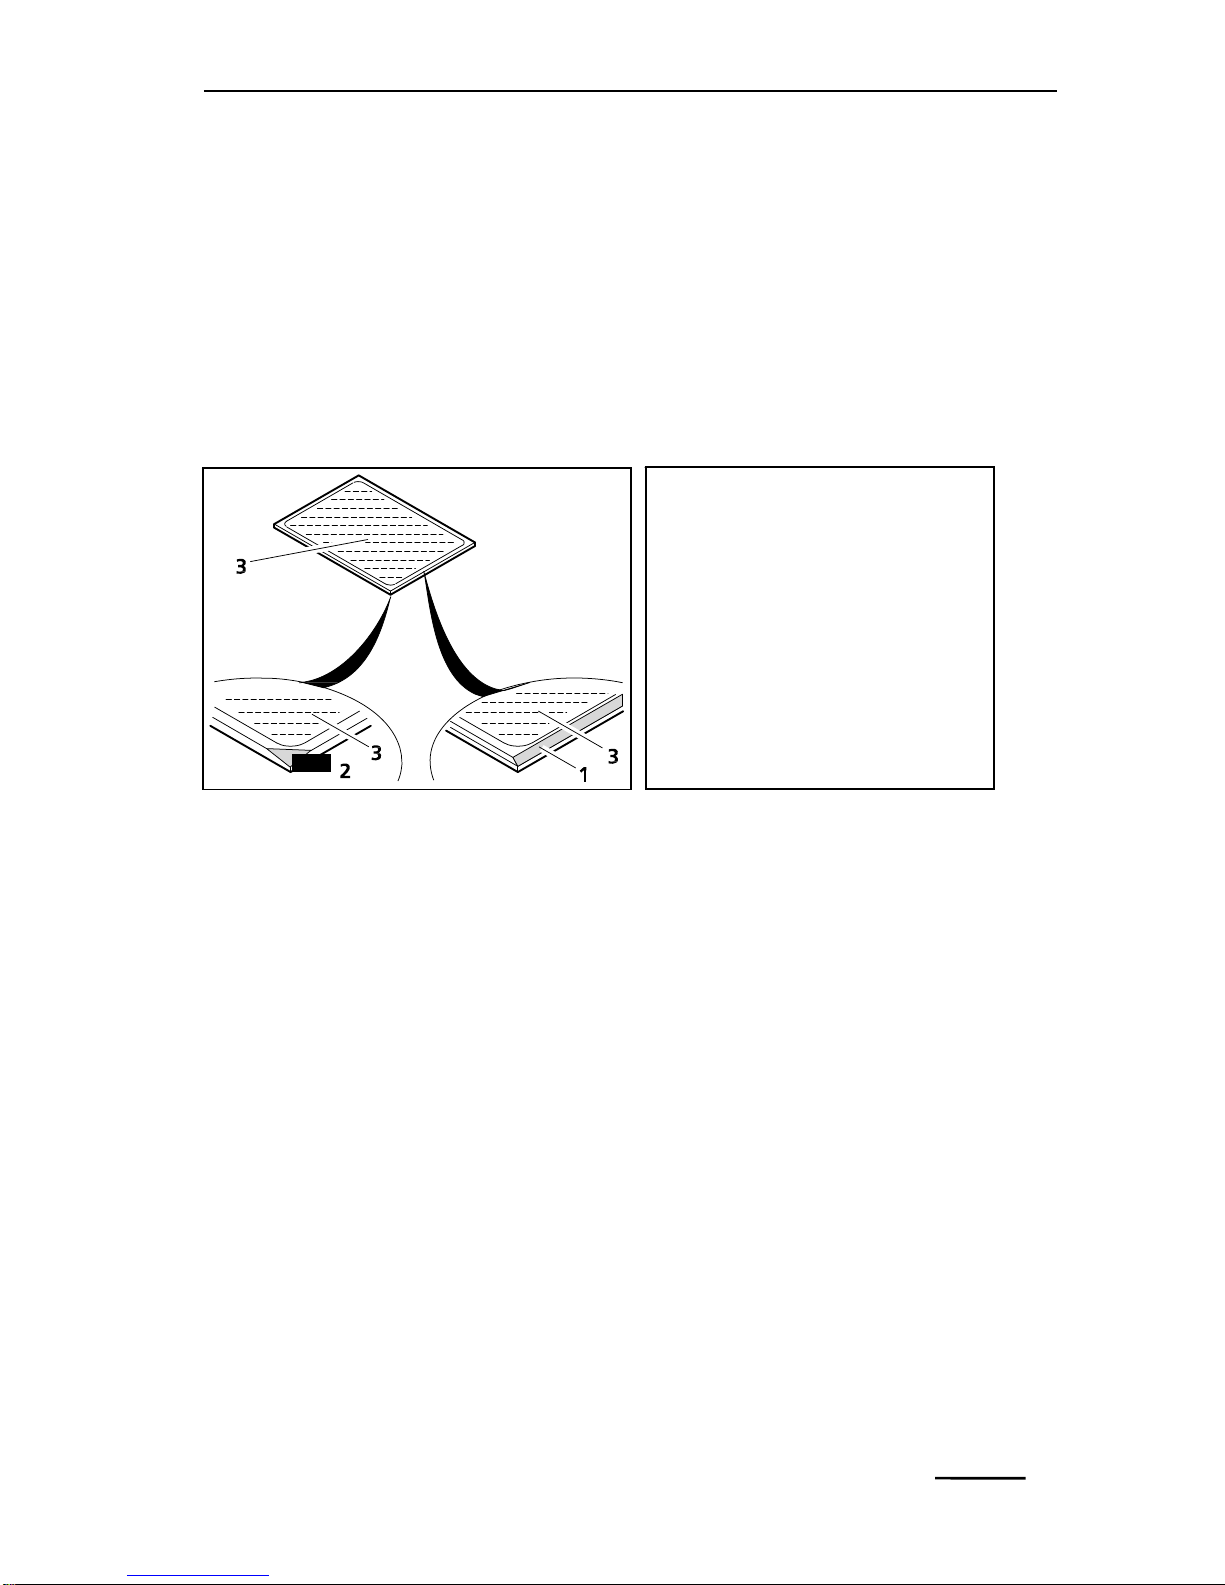
Fig. 38: Labeling the color splitter
When purchasing the filters separately, independently of the
original Zeiss reflector module frame (424931-0000-000), they have
to be mounted into the reflector module FL according to the
description in this chapter. The red filter RG665 (25 mm in diameter)
is inserted on top of the reflector module and held by the adapter ring
1 (Fig. 37/B), so that the filter will show towards the camera of the
IMAGING version.
The rectangular beam splitter filter is mounted in a 45° angle (Fig.
37/A3). The mirrored side has to show towards the LED light source.
The coating faces outward (in relation to the reflector module) in the
direction of the excitation filter (Fig. 37/B5 – not used in the
standard setup).
Note:
the reflecting (coated)
side of the color splitter
has a tapered edge or
corner.
Zeiss

CHAPTER 5 COMPONENTS OF THE MICROSCOPY-VERSION
54
5.3.3 Mounting of the reflector module
The mounting of the reflector module into the Zeiss Axio Scope.A1
is described in Fig. 39.
Fig. 39: Changing the reflector module in the upper stand FL-LED
In the front of the microscope a grey plastic cover, behind which the
turret for the reflector modules can be found, can be pulled off in
forward direction for mounting the reflector modules in the reflector
turret. It is just held in place by magnets.
Remove the cover cap (indicated with 1 in Fig. 39) in front of the
filter turret to get access to the reflector module ports.
Zeiss

CHAPTER 5 COMPONENTS OF THE MICROSCOPY-VERSION
55
Fig. 40: Mounting the reflector module
The reflector module is inserted after turning it by 180° around its
vertical axis (the reflector module is mounted with its excitation filter
side Fig. 37/A7 facing to the front). It shall be inserted carefully into
the upper spring elements. Then engage it firmly by gently pressing
it down into the turret.
When switching to another LED light source, also the reflector
module is switched. Please make sure that the numbers of the LED
module positions correspond with the numbers of the reflector
modules in the turret of the Axio Scope.A1.
A grey circle (a) in Fig. 40 marks the switch that normally regulates
the LED modules. Since the LED modules for PAM use will be
connected via the top cover of the microscope with the central
control unit of the imaging system (IMAG-CG), this switch is not
active anymore (see chapter 5.4.3).

CHAPTER 5 COMPONENTS OF THE MICROSCOPY-VERSION
56
5.4 LED Modules
There is a wide choice of wavelengths available for the Zeiss LED
modules so that experienced users can easily modify their
epifluorescence system by additional light sources with various
wavelengths. LED modules might need to be adapted as described in
this chapter. Also the filters used in the reflector module might be
necessary to adapt (see chapter 5.3.3)
5.4.1 Adjustment of brightness by grey filters
Since the original LED modules from Zeiss are far too bright for
PAM purposes (especially for the measuring light) neutral grey filters
have to be used.
A set of these filters are provided with each LED module purchased
from Walz (Y = 6,6; 13,7; 23,5 and 51,2). The darkest ones are
already used for dimming the LED. Two more neutral grey filters are
provided for fine adjustment
when other magnifications like
the standard 20 x Fluar lens
(Zeiss) are used. The higher the
magnification used, the smaller
the illuminated spot of the
imaged field, which means that
there is a good chance to increase
measuring light intensity on the
sample plane too much. In this case it might be necessary to change
the filter composition in front of the LED module by using the
provided tool shown in Fig. 41. The side pointing upwards is used
for mounting the filters of the LED modules.
Zeiss LED modules are shipped together with a set of filters:
Fig. 41: LED-module filter tool

CHAPTER 5 COMPONENTS OF THE MICROSCOPY-VERSION
57
The red LED module IMAG-L625M
comes with a set of grey neutral
density filters that can be used to adapt
the emitted light to different
magnifications. The additional
KPF647,5 filter cuts off unwanted
wavelengths and shall be mounted as
last filter in front of the ND filters.
With the blue LED module
IMAG-L470M also four ND filters are
shipped. With this unit no additional
KPF filter is necessary.
The
365 nm module comes also with light grey Lee filters. These
have a transmission of 40% each in the range of 365 nm so that these
filters can also be used to adapt the intense ultraviolet irradiance. The
ND filters shall be mounted between the lamp and the BG39 filter
which is always recommended to be used as last optical filter

CHAPTER 5 COMPONENTS OF THE MICROSCOPY-VERSION
58
This lamp
also needs a special reflector module (Beam-splitter 395
nm Zeiss 446431-0011-000). Make sure not to intermix this part
with other colorsplitter modules.
Since this is not a standard part, please inquire at Walz.
5.4.2 Integration of LED modules into Axio Scope.A1
The integration of LED modules in the Axio Scope.A1 is shown in
Fig. 42.
Fig. 42: Changing the LED module in the upper stand part FL-LED
- Lift the covering cap (Fig. 41 indicated with number 1) off
the upper stand part.
- Remove the connection plug of the LED module to be
changed number 2 and 3 (Fig. 41) from the corresponding
slot and pull the LED module out of its socket.
Zeiss modified

CHAPTER 5 COMPONENTS OF THE MICROSCOPY-VERSION
59
- Insert the new LED module into the socket and plug the
cable into the corresponding slot. No further adjustment is
necessary
.
- As the LED circuit is mechanically
coupled to the reflector
turret, it is necessary
to make sure that LED m
odule and
fluorescence filters on the corresponding reflector turret
position are compatible.
- For better operation, the positions of the LED module and
those in the reflector turret are numbered.
In the case that the Axio Scope.A1 shall also be used for further
epifluorescence applications beside PAM measurements, the
electrical connections shown in Fig. 42 (cables a and b connecting
the LED modules with the IMAG-CG unit via rotary switch
indicated with number 5) have to be modified depending on the
number of LED modules used for each application. Please ask for
technical assistance at the Heinz Walz GmbH if a combined
application is intended.
Please Note: If cables a and b in Fig. 42 are connected the switch for
the epifluorescence lamps on the right side of the microscope is not
active (Fig. 40 grey circled a).
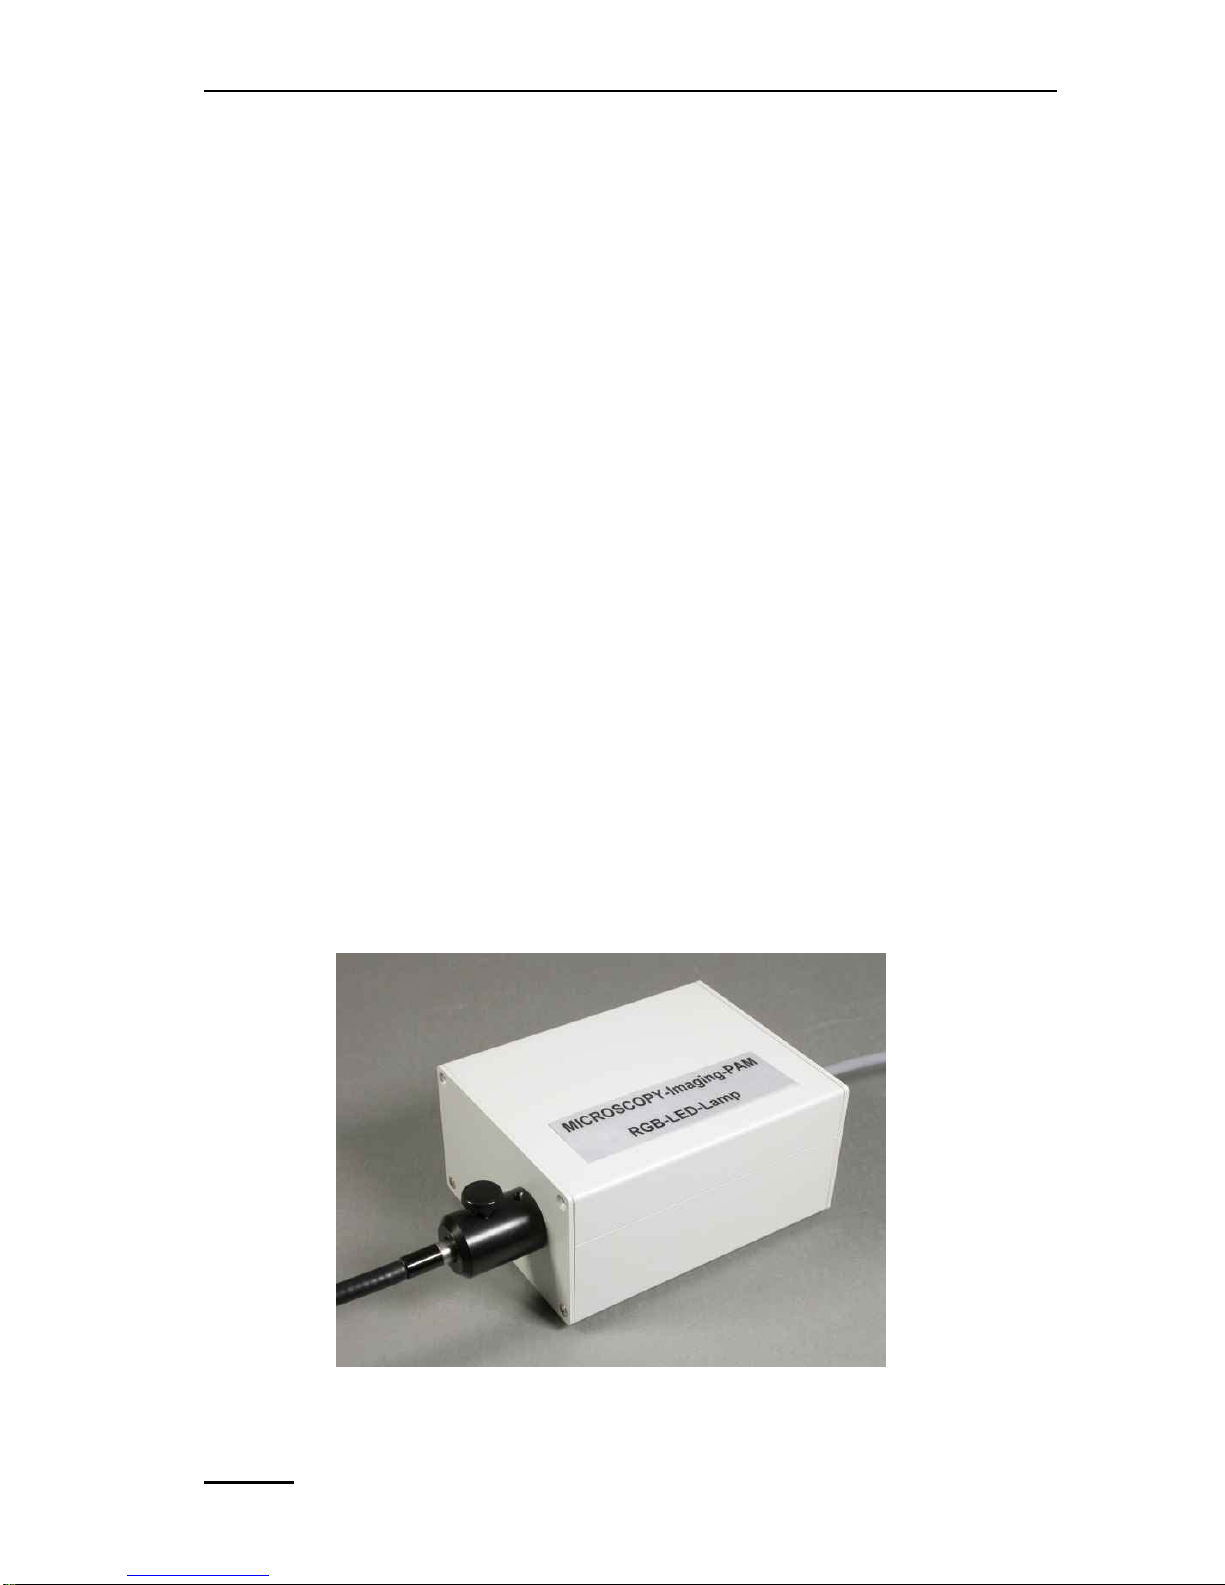
CHAPTER 5 COMPONENTS OF THE MICROSCOPY-VERSION
60
5.4.3 Connecting LED modules with IMAG-CG
For the use together with IMAGING-PAM MICROSCOPY version
the LED modules have to be connected with the central control unit
IMAG-CG. The provided connection cable for the LED modules has
to be connected with the 3-pin connector (Fig. 42 number 6) on the
cover cap of the Zeiss Axio Scope.A1 and with the 6-pin “MINIHead” connector on the IMAG-CG control unit.
5.4.4 Switching LED modules for measurements
Switching from one LED module to another is done by turning the
filter wheel on the front of the reflector turret. Additionally the rotary
switch on the right side of the covering cap (Fig. 41 indicated with
number 5) has to be set to the corresponding number of the reflector
module chosen, so that the LED module is engaged for the
measurement.
5.4.5 IMAG-RGB
Fig. 43: IMAG-RGB Microscopy LED Lamp

CHAPTER 5 COMPONENTS OF THE MICROSCOPY-VERSION
61
The Red-Green-Blue Microscopy LED Lamp (in contrast to the
IMAG-L470M or IMAG-L625M) features its own LED drivers. It is
connected to the RGB-Head socket at the rear side of the IMAG-CG
control unit. Optically it is connected with the epifluorescence
microscope via a fluid light guide (100 cm length, 3 mm ). The
IMAG-CG control unit provides the power and the trigger signals for
driving the 3 types of LEDs. Special pigtail-LEDs exclusively
developed for PAM fluorometry are used. These LEDs give
exceptionally high light intensities at the exit of 1 mm plastic
optical fibers. The fibers of 7 LEDs (2x Red, 3x Green, 2x Blue) are
put together resulting in a 3 mm bundle, to which the 3 mm
fluid light guide connects. The latter serves for thorough mixing of
the three colors and for carrying the light to the epifluorescence
microscope excitation entrance port.
Fig. 44: Fluid Light Guide with Adapter Endpiece for connecting to
excitation entrance port of Epifluorescence Microscope
The microscope side of the fluid light guide features a metal tube
adapter with an aspherical lens that fits to the LED module socket of
the Axio Scope.A1
a b
insert
fine

CHAPTER 5 COMPONENTS OF THE MICROSCOPY-VERSION
62
- Lift the covering cap (Fig. 41 indicated with number 1) off
the upper stand part.
- Rem
ove the connection plug of the LED m
odule to be
changed num
ber 2 and 3 (Fig. 41) from
the corresponding
slot and pull the LED module out of its socket.
- Insert the fluid light guide metal tube into the socket.
- Close the covering cap.
- Insert the fluid light guide through the whole in the covering
cap into the fluid light guide metal tube.
As the LED circuit is m
echanically coupled to the reflector
turret, it is necessary to make sure that LED module and
fluorescence filters on the corresponding reflector turret position
are compatible.
Fig. 45: Schematic presentation IMAGING-PAM MICROSCOPY-version
with IMAG-RGB

CHAPTER 6 HOW TO GET STARTED
63
6 How to get started
While some parts of this section specifically refer to the MAXIImaging-PAM, most information applies to all versions of the
Imaging-PAM M-series. Specific information on MINI-, and
MICROSCOPY-versions is presented in sections 4 - 1.1.
The IMAGING-PAM is readily set up and its basic operation is
quite simple. The following sub-sections explain how to put the
system together and how to install the software on the PC. Also some
simple measurements will be described, which may help the user to
become acquainted with the instrument.
6.1 Connecting the cables
There is a total of 3 (in case of MAXI-version 4) cables to be
connected:
1) Camera cable between the CCD Came
ra and the Control Unit
IMAG-CG (front side)
2) GigE ethernet cable between Camera and PC
3) LED-Array cable connecting to the Control Unit IMAG-CG
MAXI-version: IMAG-MAX/L
or IMAG-MAX/LR cable
to
MAXI-HEAD
socket (front side), and the second LEDArray cable connecting to the separate POWER-SUPPLY
with
the red plug to the red (+) socket and the black plug to
the black (-) socket
MINI-version: IMAG-MIN/B, IMAG-MIN/R
or IMAG-
MIN/GFP
cable to MINI-HEAD socket (rear side)
MICROSCOPY-version: IMAG-L625M and IMAG-L470M
is
connected via MINI-Head cable from
the 3-pin connector
(Fig. 42 num
ber 6) on the cover cap of the Zeiss
Axio

CHAPTER 6 HOW TO GET STARTED
64
Scope.A1 to the 6-pin “MINI-Head” connector (IMAG-CG
rear side), the IMAG-RGB is connected via IMAG-RBG
cable to RBG-HEAD socket (IMAG-CG rear side)
Notes: All cables should be connected prior to switching on the
Control Unit, the separate POWER-SUPPLY and the
PC is started.
Generally, always first switch off the external POWERSUPPLY before exchanging LED-Array cable.
Never have more than one Measuring Head (MAXI-,
MINI- or RGB-) connected at the time.
6.2 Software installation
All software required for operating the IMAGING-PAM already
is installed, when the Notebook PC IMAG-PC was purchased
together with the instrument. Otherwise the user can install the
required software as outlined in the following sub-sections.
6.2.1 Installation and Starting of ImagingWin
The ImagingWinGigE software is delivered together with the
instrument in form of a CD-ROM. For installation of ImagingWin
this CD-ROM is put into the CD-drive of the PC which is going to
be used in conjunction with the IMAGING-PAM. Installation occurs
automatically (Autostart). If the Autostart function is not active under
Windows, the Set-up file has to be started manually from the CD. A
program icon (ImagingWinGigE) and a link to the ImagingWinGigE
Folder are automatically installed on the Desktop.

CHAPTER 6 HOW TO GET STARTED
65
The ImagingWinGigE folder contains all files required for
operation of the IMAGING-PAM and also the Data-directories for
the various types of measuring heads.
For updates of the ImagingWinGigE software update setup files
can be downloaded from the Walz website (www.walz.com). Please
note that the Data directories and all system settings are not affected
by the Update. After clicking "Install" the Windows "Hardware
Installation" may give a warning which, however, can be ignored by
clicking "Continue Anyway". The installer will automatically setup
necessary camera drivers. After installation the software can be
started by clicking on the desktop icon.

CHAPTER 6 HOW TO GET STARTED
66
6.2.2 Installation of camera driver
If, for some reason, the previously installed Camera driver got lost,
the re-installation can manually be done by opening the
Allied_Vision_Technologies_GigE_Viewer located in the
ImagingWinGigE folder.
6.3 First steps and examples of routine measurements
After the IMAGING-PAM is set up, all
cables are connected and all software is installed
(see 6.2), first measurements can be carried out
in order to become acquainted with the
instrument. In the following description, use of
the MAXI Measuring Head with the LED-
Array Illumination Unit IMAG-MAX/L in
conjunction with the Mounting-Stand IMAGMAX/GS is assumed. Before starting the
program, power should be switched on at the
Control Unit IMAG-CG (via POWER-switch on the front), as well
as at the External 300 W Power Supply (via switch at the rear side).
When the program is started by clicking the ImagingWinGigE.exe
start icon, a selection window appears.
If one of the other Imaging systems (MICROSCOPY- or MINIversion) is used you will be asked to make choice for, for example,
the light color. It is important to chose the right color and head,
because the LEDs may be damaged otherwise.
After selection of the Measuring Head and confirmation by OK,
the Maxi button should be checked and confirmed by O.K. Then the
pulse-modulated fluorescence measuring light is automatically
switched on. Fluorescence is measured with relatively weak
measuring light pulses at low repetition rate (ca. 1 Hz). This weak

CHAPTER 6 HOW TO GET STARTED
67
measuring light does not cause significant changes in the given state
of a leaf sample. The PC monitor screen shows the Image window
on which after program start the image of the fluorescence
parameter Ft is displayed. The Ft-image is black as long as no leaf
sample is present. When a leaf sample is placed on the x-y stage
plate, at the given slow rate of measuring light pulses the Ft-image
slowly appears on the screen. In order to arrange a defined position
of the sample within the field of view and to focus the image, it often
is advantageous to switch from Fluorescence-imaging to near-
infrared (NIR)-imaging by selecting Live Video (at the right hand
side of the Image window). Now NIR-measuring light pulses with
which image changes can be followed. The NIR light pulse
frequency is adjustable in the Live Video window.
The image can be focused by turning the adjustment ring of the
objective lens. After having focused the image using NIR-light, the
Live Video window must be quit by clicking "Close" or the exit box
in the upper right corner. Then the system returns to the
Fluorescence measuring mode, displaying the focused Ft-image.
Fig. 46 shows a PC screen shot of a typical fluorescence image of a
leaf under the described conditions.
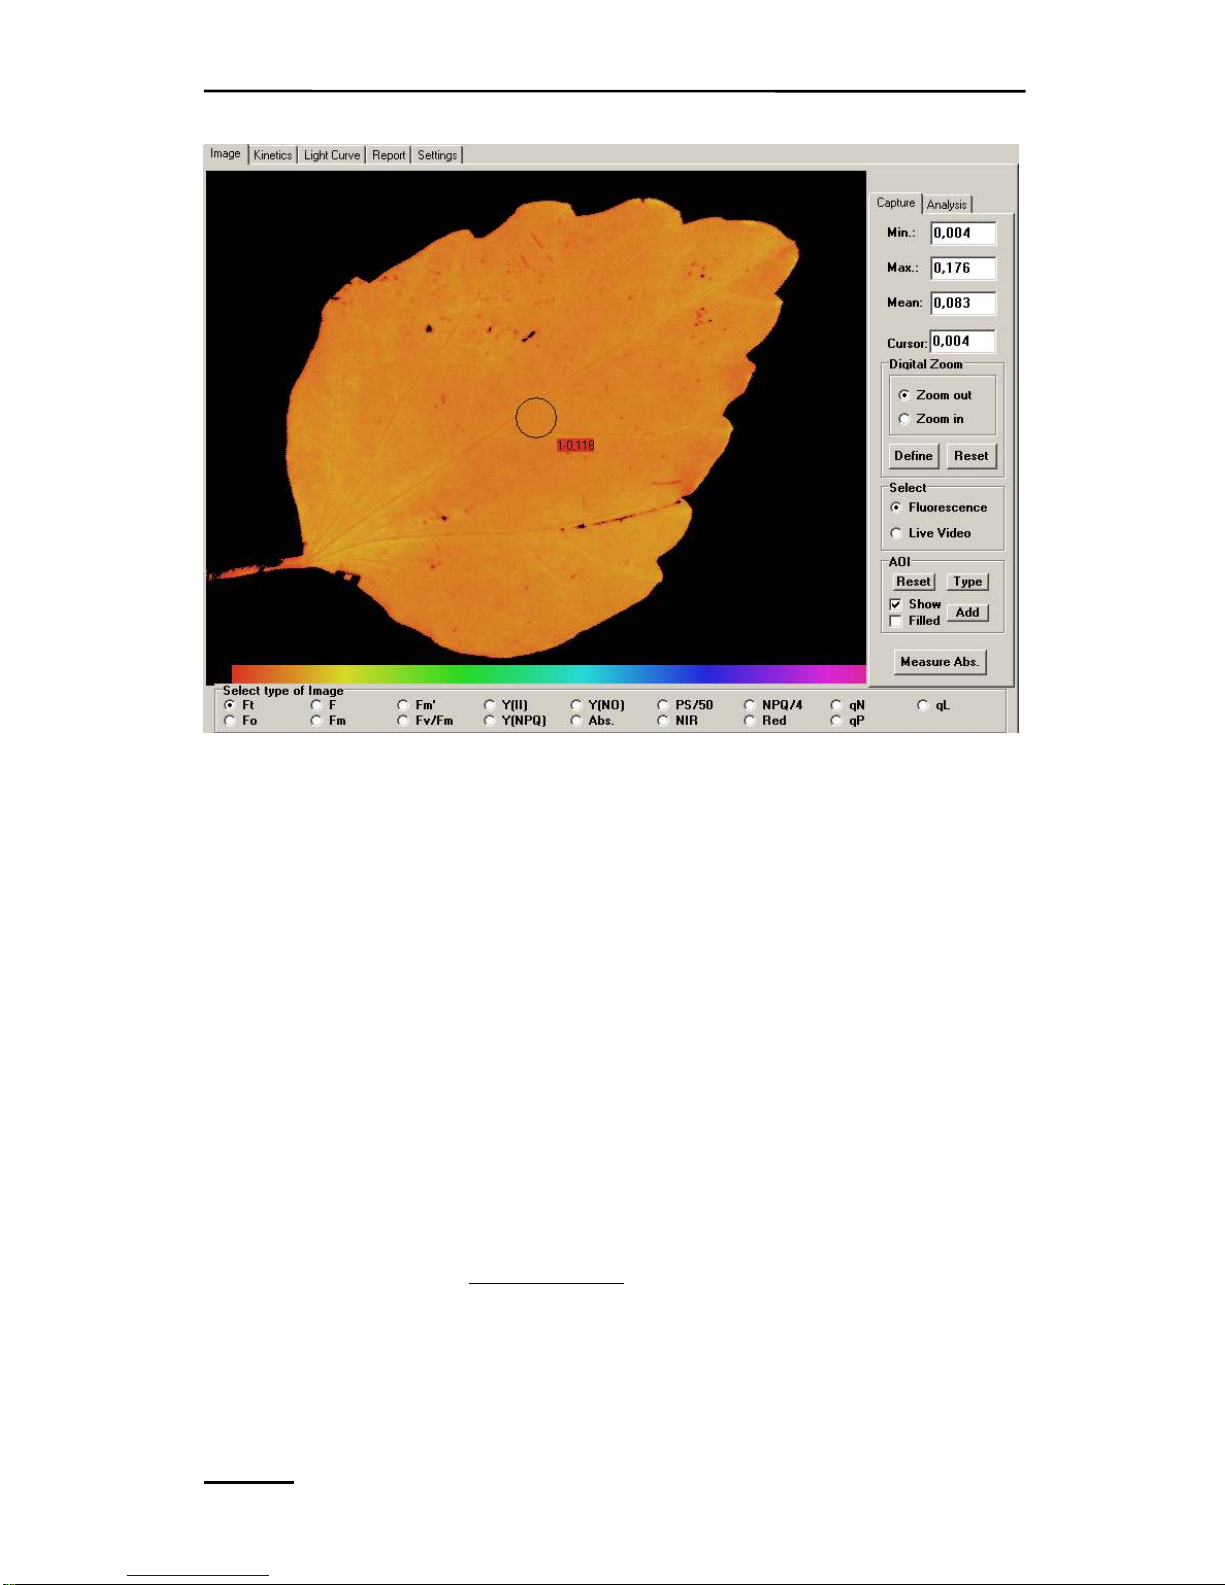
CHAPTER 6 HOW TO GET STARTED
68
Fi
g. 46: PC screen shot of Ft-image of leaf
In the center of the screen by default a circular area is defined as
so-called Area of Interest (AOI). The Ft values of all pixels within
this area are averaged and the averaged value is shown in the little
red box close to the AOI. Additional AOIs can be defined by the user,
with various shapes and sizes (via the AOI box at the right hand side
of the screen). At the bottom of the image area the false color code
bar is displayed, with the colors encoding for numerical values
between 0 (corresponding to black at the left edge) and 1
(corresponding to purple at the right edge).
So far the IMAGING-PAM has been monitoring fluorescence
yield, but no actual measurement was carried out yet. With the
IMAGING-PAM, just as with most other PAM fluorometers, a
"measurement" means the assessment of photosynthetic parameters
by fluorescence quenching analysis with the help of a saturating light
flash (Saturation Pulse). For determination of so-called quenching

CHAPTER 6 HOW TO GET STARTED
69
coefficients, measurement of the minimal and maximal fluorescence
yield of a dark-adapted sample is important. Dark-adaptation does
not have to be strict. Actually, in most cases a few minutes adaptation
to low light conditions are sufficient for serving this purpose.
Warning:
It is recommended that the eye protecting red perspex hood
is slid down before a saturation pulse is given.
The fluorescence intensity excited by the Saturation Pulse is so
high that it can be readily seen by the bare eyes through the red
perspex hood, which absorbs the much stronger blue light, which
would be harmful for the eyes. The "dark fluorescence
parameters" can be assessed by an Fo, Fm measurement.
The corresponding push button is at the bottom of the screen,
together with various other elements for system operation.

CHAPTER 6 HOW TO GET STARTED
70
Fig. 47: PC screen shot of Image window following Fo, Fm determination
with the Fv/Fm image being selected and various types of AOI
being defined
In Fig. 47 the Image window following Fo, Fm determination is
shown, when the Fv/Fm-image is selected. Fv/Fm reflects the
maximal PS II quantum yield of a dark-adapted sample. With the
given leaf sample, Fv/Fm is distributed quite homogenously over the
whole leaf. It may be noted that after Fo, Fm determination the Fo,
Fm button is not accessible anymore and that instead the New
Record button has become accessible. The Fo, Fm determination
will remain valid until a New Record is started. All F and Fm' values
measured in conjunction with the help of Saturation Pulses (triggered
via the SAT-Pulse button) are compared with Fo and Fm and
consequently the quenching parameters are calculated. The user may
apply some Saturation Pulses and experience how the images of the
various parameters (e.g. F, Fm', Yield, qP and qN) change with
preillumination.

CHAPTER 6 HOW TO GET STARTED
71
When the sample is illuminated, the effective quantum yield is
decreased, as PS II reaction centers partially close (decrease of
photochemical quenching) and energy dissipation into heat increases
(increase of non-photochemical quenching). Actinic illumination can
be started by checking the AL box. Then the PAR box shows the
PAR-value of the incident light. For assessment of fluorescence
parameters during actinic illumination, a Saturation Pulse can be
applied using the SAT-Pulse button. Fig. 48 shows an image of
effective PS II quantum yield, Y(II), measured with the help of a
Saturation Pulse applied after 2 min illumination at 81 µmol quanta
m
-2s-1
.
Fig. 48: Y(II) im
age assessed after 2 min illumination at 81 µmol quanta
m
-2s -1
This measurement reveals some heterogeneity in the lowering of
quantum yield by illumination in different parts of the leaf. It is

CHAPTER 6 HOW TO GET STARTED
72
generally observed that differences in photosynthetic efficiency can
be distinguished best when actinic light is applied, which puts some
pressure on the limiting steps of the overall process, such that
electrons accumulate at the acceptor side of PS II.
Considerable heterogeneity is also displayed by nonphotochemical quenching (expressed by the fluorescence parameters qN,
see also 9.1.1.15) as illustrated in Fig. 49
Fi
g. 49: Image of the coefficient of nonphotochemical quenching qN
measured 2 min after onset of illumination at 81 µmol quanta m
-2–1
The light induced changes in fluorescence parameters are highly
dynamic. When a dark-adapted sample is illuminated, fluorescence
yield first rises and then drops again (dark-light induction curves,

CHAPTER 6 HOW TO GET STARTED
73
Kautsky effect). Saturation Pulse quenching analysis reveals that
characteristic changes in quantum yield (YII) and nonphotochemical
quenching (qN) accompany the changes in fluorescence yield. The
Kinetics-window serves for the study of such dark-light induction
phenomena. It is opened by clicking the Kinetics register card at the
top of the screen. For the recording of induction kinetics at least one
AOI has to be defined. Then the recording of an Induction Curve
(Ind.Curv.) can be started (click “Start”).
Fi
g. 50: Kinetics window showing Induction Curve. Two AOIs are
selected, for which the averaged pixel values of Fm', Y(II), qN and
Ft are displayed.
Under ImagingWin the recording of an Induction Curve
constitutes a New Record, which is first stored in a buffer memory.
It later can be permanently saved on hard disk. An Induction Curve
recording normally starts with an Fo, Fm measurement, on the basis
of which the quenching coefficients are calculated. When the

CHAPTER 6 HOW TO GET STARTED
74
recording of the Induction Curve is terminated, ImagingWin quits the
Measure-mode (green check box inactive) and enters the Viewmode, which allows to look at the recorded data. During the course
of an Induction Curve a vast amount of information was stored,
which can be analyzed at any time after the recording. Analysis is
also possible in the Off-line mode, i.e. without the IMAGING-PAM
being connected to the PC. For each Saturation Pulse the images of
the various fluorescence parameters were captured. These images can
be viewed by returning to the Image-window, where the desired
parameter can be selected. When Go is activated, the consecutive
images are shown like in a movie, starting with the data set
corresponding to the Fo, Fm determination. The Go Speed can be
modified under Settings (click the corresponding register card).
Images can also be selected manually after deactivating Go and
clicking with the cursor into the box to the left where each mark
corresponds to a data set associated with a Saturation Pulse. The
current number is also shown in a separate box. In the View-mode
the data can be stored in form of a so-called PAM Imaging (pim)
file on hard disk. Individual images can be also exported in form of
TIFF or JPEG files.
Dark-light Induction Curves give important information on
various steps of the complex photosynthetic process and allow to
identify the site of a possible limitation, e.g. induced by a stress
parameter. The IMAGING-PAM allows to apply this tool with high
reproducibilty using pre-programmed Standard Induction
Curves. The Induction Curve parameters, like Actinic Light
Intensity, time interval between Saturation Pulses and duration of
illumination can be defined by the user under Settings.
Another standard tool for assessment of photosynthetic
parameters by Saturation Pulse quenching analysis are recordings of
Rapid Light Curves (more briefly also called Light Curves). For
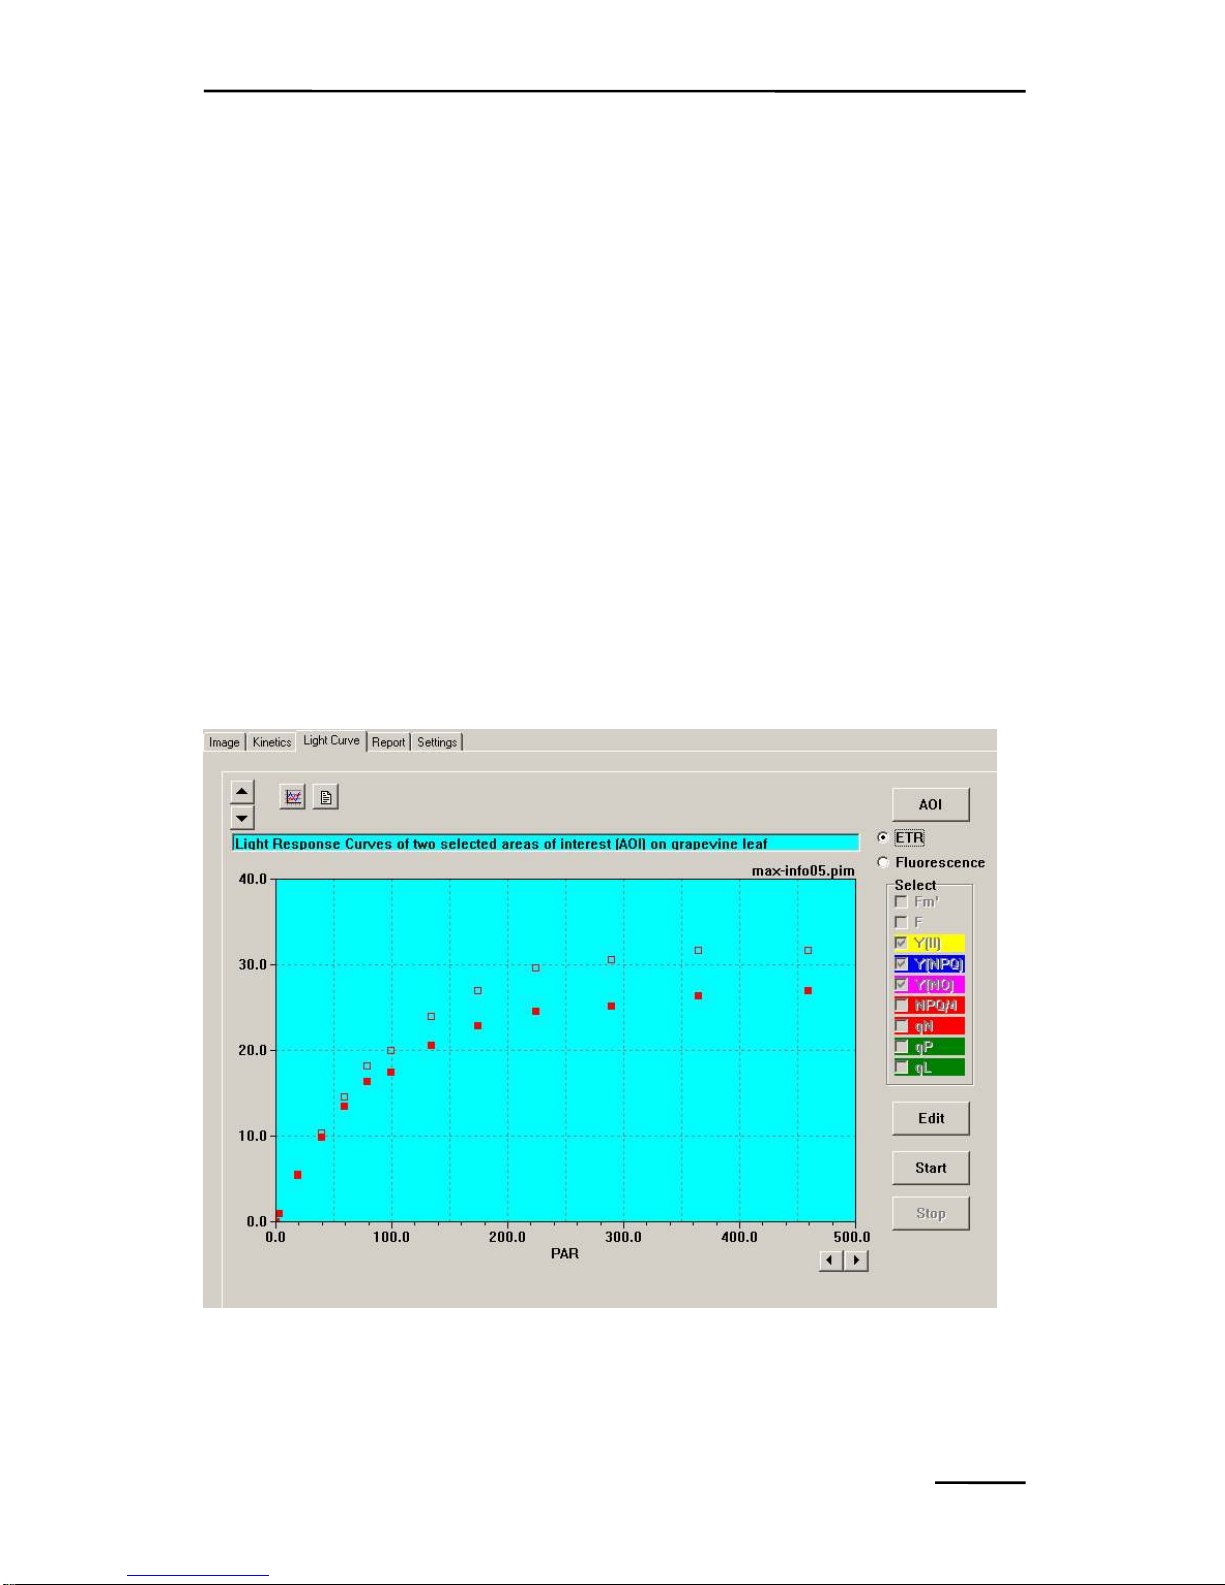
CHAPTER 6 HOW TO GET STARTED
75
measurement of a Light Curve the user has to return to the Measure
Mode and click the Light Curve register card. While the recording
of a pronounced Induction Curve is favored by previous dark
adaptation, the opposite is true for the recording of a Light Curve,
which should not be dominated by induction effects. Therefore, a
Light Curves can be measured best shortly after an Induction Curve
with the same sample. While the Light Curve is running, one can
either follow the development of the curve on the Light Curve
window or look at the changing images of e.g. Y(II) or qN. The
Light Curve starts with an Fo, Fm determination which, however,
formally is correct only, if the sample was dark-adapted. If a Light
Curve is recorded after an Induction Curve using the same sample,
the previously measured Fo, Fm values may be retained, provided
there was no change in the position of the sample.
Fi
g. 51: Light Curve window showing the Light Curves of two AOIs, for
which the averaged values of the ETR parameter (relative apparent
electron transport rate) are displayed.

CHAPTER 6 HOW TO GET STARTED
76
In Fig. 51 a Light Curve recording of the ETR-parameter is
shown. ETR is a relative measure of the apparent electron transport
rate. It initially shows an almost constant slope and saturates at high
light intensities, in analogy to conventional light response (PI)
curves. It has to be kept in mind, however, that PI-curves are
measured with much longer adaptation times at each intensity step.
The original definition of the ETR-parameter assumes a uniform
absorption of incident light over the whole sample area:
ETR = Yield x PAR x 0.5 x Absorptivity
The Absorptivity parameter describes the fraction of incident
light which is absorbed. The factor 0.5 takes into account that only
half of the absorbed quanta is distributed to PS II (under steady state
conditions). In most studies carried out with standard PAM
fluorometers, like the PAM-2100 or MINI-PAM, it has been assumed
that Absorptivity amounts to 0.84, which is the mean value for a
large number of normal, healthy green leaves determined with the
help of an Ulbricht Sphere.
The IMAGING-PAM offers a special routine for measuring
PAR-Absorptivity images by comparing the remission images of
diffuse red and NIR radiation, which is emitted by the same LEDRing-Array as the blue fluorescence measuring light. Despite of its
simplicity, this routine functions surprisingly well, provided the
intensity of the red light was appropriately adjusted with respect to
the NIR light. A PAR-Absorptivity measurement is started by
clicking the Measure Abs. button. First an NIR-remission image
and then a R-remission image is measured, the Absorptivityparameter is automatically calculated pixel by pixel according to the
equation Abs. = 1 - R/NIR and the Abs.-parameter is displayed on
the Image-window, as illustrated in Fig. 52

CHAPTER 6 HOW TO GET STARTED
77
In case
an Absorptivity measurement has been made prior the
measurement, the actual measured Abs values will be taken for
the calculation of the photosynthesis parameters like ETR.
Any pigment that absorbs Red more than NIR light, i.e. generally all
photosynthetically active pigments, will decrease R with respect to
NIR, thus decreasing R/NIR and increasing the derived Abs.-value.
On the other hand, pigments that absorb Red and NIR light similarly,
as e.g. necrotic spots, will not cause R/NIR to deviate substantially
from unity and thus Abs. will remain close to zero. Notably, a white
and a black piece of paper give similar Abs.-images with pixel-values
close to zero. This illustrates that the Abs. parameter does not assess
general Absorptivity of a sample for visible light, as sensed by the
human eye, but rather specifically the Absorptivity of
photosynthetically active light. Therefore, the Abs. parameter as
determined by the IMAGING-PAM may be considered a close
estimate of PAR-Absorptivity. This approach is based on the
empirical fact that pigments that contribute to the absorption of PAR
do not show significant absorption bands in the near-infrared (NIR)
spectral region. On the other hands, pigments that absorb NIR are
likely to also absorb Red light.
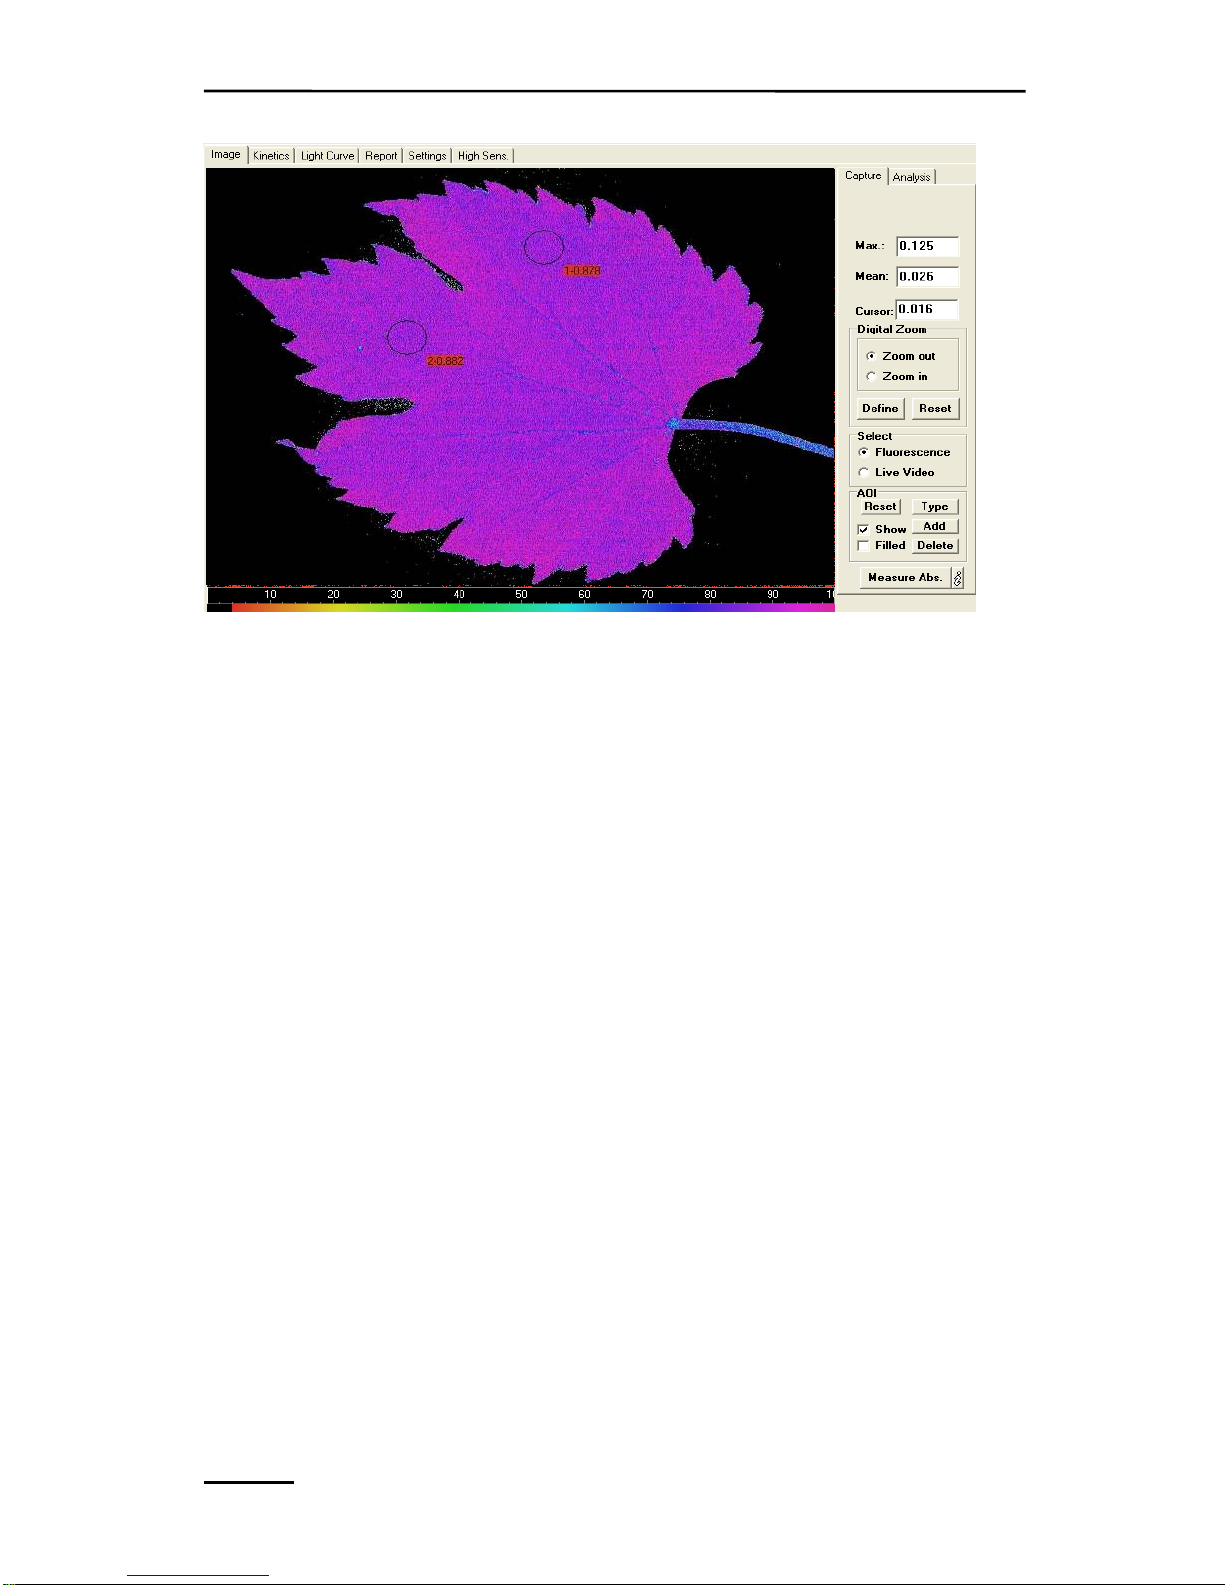
CHAPTER 6 HOW TO GET STARTED
78
Fi
g. 52: Image of PAR-Absorptivity determined by the Measure Abs.
routine
In the example of Fig. 52 Absorptivity is distributed quite
homogenously (pixel values around 0.9) over the whole leaf area. In
other cases substantial heterogeneities can be observed, e.g. induced
by viral or fungal infections and stress induced damage which leads
to formation of necrotic spots.
With information on PAR-Absorptivity, it is possible to calculate
a relative apparent rate of photosynthetic electron transport:
PS = Yield x PAR x 0.5 x Abs.
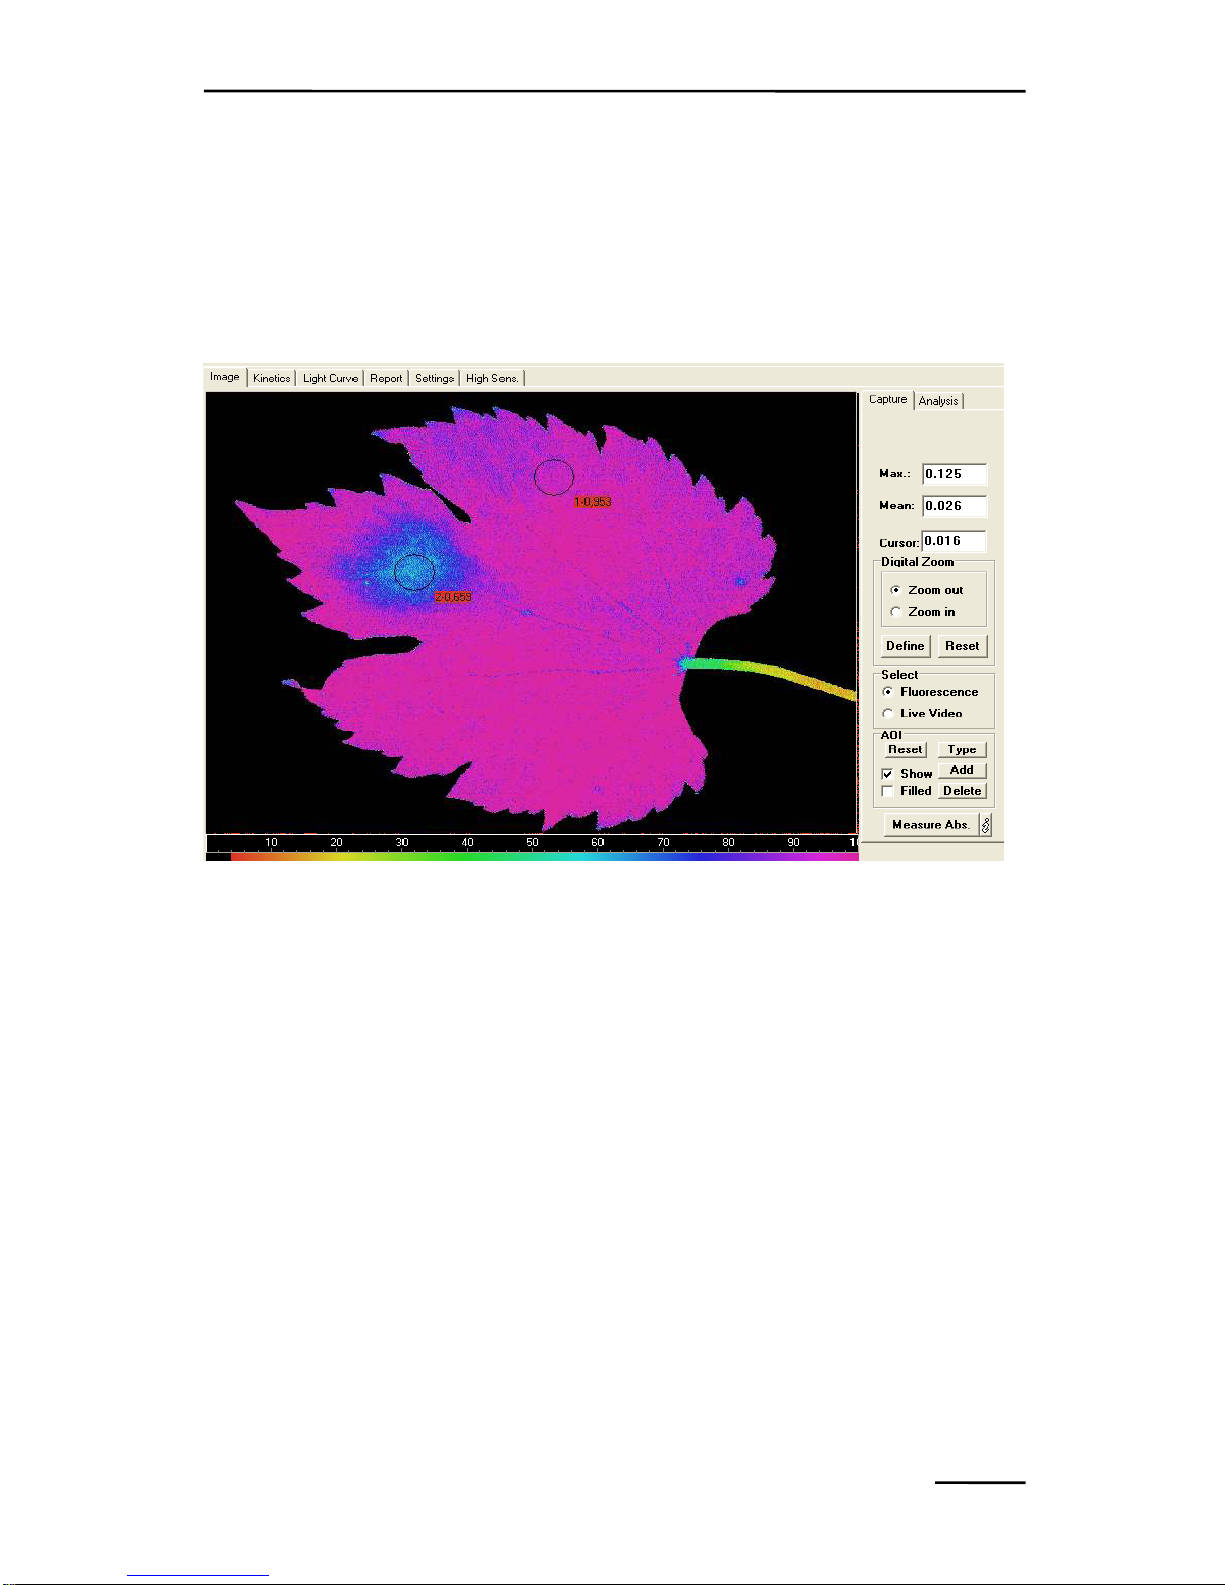
CHAPTER 6 HOW TO GET STARTED
79
This parameter is calculated by ImagingWin and can be selected
on the Image-window. As all imaged parameters have to be
normalized to values between 0 and 1 (for the sake of a uniform false
color scale), the calculated PS-values are divided by the expected
maximal rate, the preset value of which is 50.
Fi
g. 53: Image of the relative apparent rate of photosynthetic electron
transport as measured by the PS/50 parameter
The PS/50 image displayed in Fig. 53 reveals that a
homogeneously green looking leaf may show distinct heterogeneities
in photosynthesis.
These first measurements on one hand demonstrate the simplicity
of measurements with the IMAGING-PAM and on the other hand
give a first impression of the vast potential of this tool for assessment
of photosynthetic parameters. This introduction should enable the
user to get acquainted with the instrument and to start carrying out
own experiments. For quantitative work some more information may
be required. In the following Chapter 7 the numerous functions and
features of the ImagingWin software are described systematically in

CHAPTER 6 HOW TO GET STARTED
80
more detail. Unavoidably there will be some overlapping with the
information given in this Chapter 6.

CHAPTER 7 IMAGINGWIN
81
7 ImagingWin
Except fo
r the POWER on/off switch on the Control Unit and the
External 300 W Power Supply, the MAXI-IMAGING-PAM is fully
operated via PC using the ImagingWinGigE software. Fig. 54 shows
the user surface of ImagingWinGigE after start of the program,
as seen on the PC screen.
Fig. 54: User interface of ImagingWin
GigE after start of the program
The screen is divided into three parts. A topmost part, containing
the menu bar (see chapter 10). A major upper part, the content of
which changes depending on the particular window selected by the
various register cards 9 (Image, Kinetics, Light Curve, Report,

CHAPTER 7 IMAGINGWIN
82
Settings and High Sens, chapter 9) and a b
ottom part, which relates
to system operation (like saving data, starting measurements etc.)
remains unchanged when different windows are selected (chapter 8).
1) After start of the
program, the upper part of the screen shows the
Image-window by default. The other windows can be installed
by clicking the corresponding register cards. The various
windows will be explained in detail in separate sections below.
2) At the bottom of the screen different types of functional elements
essential for operation of the IMAGING-PAM are located:
• the elements at the left side relate to the recorded data
(viewing, saving, opening and export of data)
• in the middle the functional elements are located which serve
for defining a new recording (New Record; Fo, Fm;
Measure)
• the elements to the right relate to the various types of light
sources (PAR, ML, AL, Ext, SAT-Pulse, AL+Y, Clock)
• the remaining elements on the right side are for operating the
ImagingPam using script files (Load, Run)
3) The top of the screen locates the menu File, Edit, Options, AlList, Recalc and Transect.

CHAPTER 8 IMAGINGWIN - SYSTEM OPERATION
83
8 IMAGINGWIN - System Operation
8.1 Definition of New Record
8.1.1 Fo, Fm
The Fo, Fm-determination is of central importance
for recordings with the IMAGING-PAM. Only
after appropriate determination of Fo and Fm with
a more or less dark-adapted sample, the
con
sequently measured values of the fluorescence parameters qP, qN
and NPQ will be meaningful. All data recorded after an Fo, Fm-
determination are stored as one "Record" in a current buffer memory
(see below) and eventually may be saved as a PAM Image (PIM)-
file. Please note that upon Fo, Fm determination all data previously
stored in buffer memory will be erased. Therefore, the user is asked:
"Save previous Record?" If this question is answered with
"No", the previously recorded data are lost. Upon start of a
Kinetics recording (see 9.2) or Light Curve recording (see 9.3) the
user is asked : "Do you want to keep the previously recorded
Fo, Fm?" During a running Record no Fo,Fm-determination is
possible. Fo- and Fm-images, which can be selected on the Image-
window, are prerequisite for calculation of images of Fv/Fm and of
the quenching coefficients qP, qN and NPQ. The Fv/Fm image not
only defines the maximal PS II quantum yield, but also serves for
definition of the sample limits. This definition is applied for noise
suppression outside the sample limits in Y(II) images.

CHAPTER 8 IMAGINGWIN - SYSTEM OPERATION
84
8.1.2 New Record
Upon start of a New Record previously recorded
data stored in the buffer memory are erased in
order to make room for the new data. Therefore,
the user is asked: "Save previous Record?" If
this qu
estion is answered with "No", the previously recorded data
are lost. While normally, a New Record is started by an Fo,Fm
determination, it is also possible to keep the previously
determined Fo, Fm values (see above). It is also possible to carry out
measurements by application of Saturation Pulses without previous
Fo, Fm determination. In this case, however, no quenching
coefficients can be calculated and also the noise suppression based
on the Fv/Fm image (see above) does not work. A later Fo, Fm-
determination within a running Record is not possible. As soon as a
new Fo, Fm determination is carried out, a New Record is started.
The start of an Induction Curve (under Kinetics, see 9.2) or a Light
Curve (see 9.3) is equivalent to the start of a New Record.
Previously defined areas of interest (AOI, see 9.1.2.2) are not erased
upon start of a New Record, such that several Records (e.g. Light
Curves and Induction Curves) can be measured for the same AOIs.
AOIs can be reset and newly defined at any time, in the Measure- as
well as in the View-mode.
8.1.3 Measure
With the help of the Measure-checkbox it is
possible to switch between the Measure- and the
View-modes. In the Measure-mode only the images recorded during
the last measurement (last Saturation Pulse) are displayed, whereas
in the View-mode all previously recorded data of a record can be
viewed. In the View-mode the functions located in the box at the left
apply. While actual measurements are possible in the Measure-mode

CHAPTER 8 IMAGINGWIN - SYSTEM OPERATION
85
o
nly, the various types of illumination are not affected by switching
to the View-mode. In this way, it is possible to keep a sample in
a defined light state while viewing previously recorded data. If
the user wants to stop illumination (e.g. in order to save battery
power), the various types of illumination (ML, AL and Clock)
have to be switched off manually. The Save-icon (see 8.2) is also
accessible in Measure-mode. When it is clicked, Measure-
mode is temporarily quit and View-mode opened (see 8.2) for
data storage. After the data are saved, Measure-mode is
automatically re-opened, such that the running Record can be
continued. Hence, data can be saved successively in the course of a
Record.
8.2 Functions applying to the View-mode
The View-mode is automatically opened when Measure-mode
is quit (Measure checkbox). Data previously stored in the
Buffer-Memory can be viewed on the Image-, Kinetics-,
Light Curve- and Report-windows. For Kinetics and Light Curve
at least one Area Of Interest (AOI) must be defined (see 9.1.2.2).
Previously defined AOIs can be erased and new AOIs can be
defined at any time. The data in the Buffer-Memory are numbered
according to the time of measurement. A measurement is defined
by application of a Saturation Pulse. In the upper display
line the number of measurement with date and time is
shown. Using the arrow bar below, a particular measurement
can be manually selected. To the right of the display line the
current number of measurement is displayed in a separate box
(also active in Measuring-mode).

CHAPTER 8 IMAGINGWIN - SYSTEM OPERATION
86
Go When Go is started, the images stored in Buffer-
Memory are automatically displayed one after the
other at a rate determined by the Go Speed (under
Settings). After showing the last measurement, Go
automatically starts again with the first
measurement. Please note that the Yield-filter (see
9.5.12) slows down the image build-up of all
calculated parameters and, therefore, should be
switched off when high Go Speeds are chosen.
Save The data transiently stored in Buffer-Memory can
be permanently saved on hard disk in form of a
PAM Image (PIM) file. Data saving is also
possible in the Measure-mode during the course of
a Record (see 8). Data are saved in the Datadirectory of the corresponding Imaging-PAM
version. Additionally to the Data file a commend
(.txt) file for experimental descriptions can be
edited and saved.
Open Data stored in form of a PAM Image (PIM) file on
hard disk can be opened by loading into the BufferMemory. Then, if desired, also new AOIs may be
defined.
Show commend Opens up the text file of the current PAM Image
Export
file.
Data stored in the Buffer-Memory can be exported
in the form of JPEG- or TIFF-files. A JPEG-
file serves for exportin
g one particular image,
which was selected for display on the Image-
window and is relatively small (c. 100 KB). On
the other hand, TIFF-files are rather large (c.
10 MB), as they essentially contain the same

CHAPTER 8 IMAGINGWIN - SYSTEM OPERATION
87
information
as the original PIM-files. Each
TIFF file consists of a series of images of the
following parameters: Fo, Fm, NIR, Red, F1,
Fm'1, F2, Fm'2, F3, Fm'3 etc. In principle, on the
basis of these images, images of all other
fluorescence parameters as well as of PAR
Absorptivity can be derived (for formulas see
section 9.1.1). TIFF-images are monochrome
without false color coding. They are suited for
being used in conjunction with other image analysis
programs, like “ImageJ”.
8.3 Light controls
The Imaging-PAM employs the same LEDs for pulse-modulated
Measuring Light (ML), Actinic Light (AL), (Ext) and Saturation
Pulses.
ML Checkbox for switching Measuring Light on/off at
a pulse frequency
defined under Settings.
AL Checkbox for switching Actinic Light on/off or to
start a period of actinic illumination, the duration of
which is defined under Settings. When AL is
switched on, ML frequency automatically is
switched to maximal setting 8.
Ext Checkbox for switching an External Light Source
on/off intensity and width is defined under Settings.

CHAPTER 8 IMAGINGWIN - SYSTEM OPERATION
88
PAR Display of light intensity (Photosynthetically
Active Radiation) in µmol quanta m
-2 s-1
, which is
corresponds to the intensity of Actinic Light as well
as (although to a much lesser extent) also by the
intensity and frequency of the Measuring Light, as
defined by the intrinsic PAR-List (under Options).
In the case of MAXI- and MINI-versions the
displayed values are calculated on the basis of
PAR-values measured at the given fixed distance
between LED-lamp and sample plane with the help
of a micro quantum sensor. With the
MICROSCOPY-version it also depends on the
choice of objective lens. With each measurement
(defined by a Saturation Pulse) the momentary
PAR-value is stored. It is also displayed in the
View-mode. The PAR-values for the 20 ALintensity settings, as well as for ML-frequency 8
(equivalent to AL0), are stored as default.par file in
the Data folder of each ImagingPam-version. It can
be viewed and/or modified under AL-List (LED
currents/PAR values see chapter 10.3). A
modification of the original values can e.g. become
necessary, when the optional Filter Plate
IMAG-MAX/F is used (see 3.2).
SAT-Pulse Key for starting a single Saturation Pulse, which
defines a Measurement (i.e. determination of F and
Fm' as well as on-line calculation of the derived
fluorescence parameters), with the obtained data
being stored in the Buffer-Memory.
AL + Y Key for starting a period of actinic illumination,
the length of which is defined under Settings (Act.

CHAPTER 8 IMAGINGWIN - SYSTEM OPERATION
89
Light Width) and at the end of which a Saturation
Pulse is applied. The AL + Y key is not active
when Act. Light Width is set to zero (indefinite).
Clock When the Clock is switched on, the selected Clock
item is repeated with the set interval until manually
switched off again. The Clock interval can be set
between 5 s and 3600 s (1 hour). There is the choice
between four different Clock items: SAT. Pulse,
AL, AL + Y and Ft only. While the "SAT. Pulse"
and "AL + Y" Clocks involve the repetitive
application of Saturation Pulses and, hence,
correspond to the measurement of fluorescence
parameters, this is not the case for the "AL" Clock.
A particular case is the "Ft only" Clock, which
allows repetitive measurement of Ft without
application of a Saturation Pulse. In the absence of
actinic illumination, this allows to follow changes
in Fo or Fo'-images. In the case of the "AL" and
"AL + Y" Clocks, it should be made sure that the
Clock interval is longer than the Act. Light Width.
Using the SAT-Pulse clock not only single
Saturation Pulses but also sequences of defined
numbers of Saturation Pulses can be applied (see
9.5.1).

CHAPTER 9 IMAGINGWIN - REGISTER CARDS
90
9 IMAGINGWIN - Register Cards
9.1 Image-window
The major part of the Image-window is occupied by the actual
Image, at the bottom of which the false color code bar is located.
The standard false color code ranges from black via red, orange,
yellow, green, blue and violet to purple. These colors code for
numbers between 0 and 1. Hence, all measured or calculated
parameters are normalized to values between 0 and 1. The
correspondence between color and numerical value can be evaluated
with the help of a "Ruler" which can be installed above the false
color bar via Options in the menu. Instead of a false color bar also
the corresponding black-and-white bar (grey scale) can be installed
(via the B/W check box under Settings/Display). In the middle of the
Image, by default an area of interest (AOI) is defined in form of a
standard circle which is accompanied by a little red box displaying
the averaged value of the selected fluorescence parameter within this
AOI.
Below the Image-area the various parameters are listed, images
of which can be selected by clicking the corresponding radio buttons
(Select type of Image) (see 9.1.1). At the right hand side of the
Image-area a number of functional elements are located which serve
for image capture and analysis (see 9.1.2).
9.1.1 Different types of images

CHAPTER 9 IMAGINGWIN - REGISTER CARDS
91
Under Select type of Image one out of 18 different parameters
can be selected, the image of which is displayed on the Imagewindow. The meaning of the various parameters will be briefly
described in the following subsections.
9.1.1.1 Current fluorescence yield, Ft
The current fluorescence yield, Ft, is continuously monitored in
the Measure-mode (see 8), when the Measuring Light (ML) is
switched on. While images of Ft are not continuously stored in the
Buffer-Memory, at any time the current Ft image can be stored by
applying a Saturation Pulse. Then the current Ft-image is stored in
form of an F- or Fo-image. The latter applies, if the Saturation Pulse
is given in conjunction with an Fo, Fm-determination (see 8). It is
also possible to measure Ft-images without application of a
Saturation Pulse with the help of the "Ft only Clock" (see 8.3).
Kinetic changes of Ft can be recorded on the Kinetics-window in
conjunction with measurements of dark-light induction curves or
light response curves for selected areas of interest (AOI). In this case,
Ft-values are stored continuously, i.e. also between Saturation Pulses.
9.1.1.2 Dark fluorescence yield, Fo
The dark fluorescence yield, Fo, can be assessed after dark
adaptation using the Fo, Fm-key. After dark adaptation normally all
PS II reaction centers are open and maximal photochemical
quenching is observed. This does not necessarily mean that Fo is the
minimal fluorescence yield. Fluorescence yield can drop below the
Fo-level by strong non-photochemical quenching induced during
illumination. When an Fo measurement is triggered, the current Ft is
averaged for 3 s and the averaged value is denoted Fo. In
Microscopy-applications, when dealing with low signal levels, Fo-

CHAPTER 9 IMAGINGWIN - REGISTER CARDS
92
averaging can be applied, which allows assessment of Fo at
substantially enhanced sensitivity (see 9.6.1). Fo determination is
essential for correct calculation of the quenching coefficient qP (see
9.1.1.16).
9.1.1.3 Fluorescence yield, F
The fluorescence yield, F, is assessed like all fluorescence
parameters (except for Ft) in conjunction with the application of a
Saturation Pulse. When a Saturation Pulse is triggered, the current Ft
is averaged for 3 s and the averaged value is denoted F. Like all
fluorescence parameters measured in conjunction with a Saturation
Pulse, F images are stored in the Buffer Memory.
9.1.1.4 Maximal fluorescence yield, Fm
Maximal fluorescence yield, Fm, can be assessed after dark
adaptation using the Fo, Fm-key. The Fm-value is assessed at the
plateau level reached during application of a Saturation Pulse.
During the Saturation Pulse the Measuring Light frequency
automatically is switched to the maximal setting. Assessment of Fm
involves averaging of 3 image recordings. In special applications,
when dealing with low signal levels (e.g. MAXI-version with algae
suspensions in multiwell plates or MICROSCOPY-version), a
"Special SP-Routine" can be applied, which allows assessment of Fm
at substantially enhanced sensitivity (see 9.6.1).
After dark adaptation normally the extent of energy-dependent
nonphotochemical quenching is minimal. Fo, Fm-determination at
the start of a New Record (see 8) is essential for correct calculation
of the quenching parameters qP, qN and NPQ. The Fm-image
measured at the start of a Record remains unchanged until a New
Record is started by a new Fo, Fm- determination. In this respect Fm
 Loading...