

Page 1
User Manual
English
FS42
Portable BraggMETER
Page 2

Hottinger Baldwin Messtechnik GmbH
Im Tiefen See 45
D-64239 Darmstadt
Tel. +49 6151 803-0
Fax +49 6151 803-9100
info@hbm.com
www.hbm.com
HBM FiberSensing, S.A.
Optical Business
Rua Vasconcelos Costa, 277
4470-640 Maia
Portugal
Tel. +351 229 613 010
Fax +351 229 613 020
fibersensing@hbm.com
www.hbm.com/fs
Mat.: 7-2002.4250
DVS: A4250-5.0 HBM: public
07.2017
Interrogator version: v3.2
SW version: v5.5
E Hottinger Baldwin Messtechnik GmbH.
Subject to modifications.
All product descriptions are for general information only.
They are not to be understood as a guarantee of quality or
durability.
Page 3

English
1 General Details 5...........................................
1.1 General Information 5........................................
1.2 System Components 5.......................................
1.3 Technical Data 6............................................
2 Hard Disk Image Recovery 9.................................
2.1 System Recovery 9..........................................
3 Regulatory and Certification Considerations 13................
3.1 Environment Considerations 13.................................
3.1.1 Disposal of your old Appliance 13...............................
3.2 Laser Safety 14..............................................
3.2.1 Symbols 14..................................................
3.2.2 Class 1 Laser 14..............................................
3.2.3 General Precautions Considerations 15..........................
3.2.4 Certification 16...............................................
4 Operation 17................................................
4.1 Connectors 17................................................
4.2 Status Indicators 18...........................................
4.3 Protection and Carrying Bag (optional) 19........................
4.4 Power Supply 19.............................................
4.5 Battery Pack 20..............................................
4.5.1 Removing the Battery Pack 21..................................
4.5.2 Connecting the Battery Pack 25................................
4.6 Switching ON 26..............................................
4.7 Switching OFF 26.............................................
4.8 Touch Screen Calibration 28...................................
5 Measuring Examples 32......................................
5.1 Measuring in 5 Steps 32.......................................
5.2 Typical Configuration 32.......................................
FS42 A4250-5.0 HBM: public 3
Page 4

5.2.1 HBM FS Wavelengths 34......................................
5.3 Definitions and Operation Methods 35...........................
5.3.1 Wavelength 35...............................................
5.3.2 Power 36....................................................
5.3.3 Threshold 37.................................................
5.4 Common Measuring Difficulties 39..............................
5.4.1 Dirty Connector 39............................................
5.4.2 Broken Connector 41..........................................
5.4.3 Reflective Fiber Ending 42.....................................
5.4.4 Cut Fiber 43.................................................
6 iLog Software 45............................................
6.1 General Details 45............................................
6.1.1 Software Version 45...........................................
6.1.2 Software Update 45...........................................
6.2 Graphical User Interface 46....................................
6.2.1 General and Management Controls 46...........................
6.2.2 Graphical View 47............................................
6.2.3 Data View 52.................................................
6.2.4 Configuration 53..............................................
6.2.5 Spectral View 66..............................................
6.2.6 Alarms 71...................................................
4 A4250-5.0 HBM: public FS42
Page 5

1 General Details
1.1 General Information
The HBM FiberSensing Portable BraggMETER is a con
tinuous swept laser scanning interrogator designed to
interrogate Fiber Bragg Grating (FBG) sensors.
The interrogator includes a NIST traceable wavelength
reference that provides continuous calibration to ensure
system accuracy over long term operation. The high
dynamic range and high output power allows high resolu
tion to be attained even for long fiber leads and lossy
connections.
Its high dynamic range and broadband tuning range com
bined with the available 4 optical channels makes this
interrogator particularly suitable for large scale sensing
networks, acquiring a large number of sensors, providing
an acquisition rate of 1S/s with 1 pm resolution.
General Details
This Manual applies to the following equipment:
K-FS42-01-010-420 FS42 - Portable BraggMETER Quad channel
K-FS42-03-010-420 FS42 - Portable BraggMETER Quad channel
1.2 System Components
The Portable BraggMETER set includes:
S Interrogator
S Support CD
S AC/DC Adapter
S Power cord
FS42 A4250-5.0 HBM: public 5
Page 6

General Details
S Power adapter
S Protection and carrying bag (optional)
S Battery pack (2 batteries)
S Connector protection caps
S Touch screen pen
S User manual
S Calibration certificate
1.3 Technical Data
Wavelength Measurement
Range 100 nm (1500 to 1600 nm)
Resolution
Absolute accuracy
Sensors per channel 25 (maximum recommended)
Optical channels
Sample rate 1 S/s
Optical detection Logarithmic
Dynamic range
Laser Source
Optical output power
Line width < 500 MHz
Connectors
Optical FC/APC or SC/APC
Electrical 2.5 x 5.5 DC Socket panel mount
Communication RJ45 Ethernet; USB
1)
2)
4)
5)
6)
1.0 pm
±2.0 pm
4 (in parallel)
> 50 dB
-3 dBm
supplied with 100-230 V power adapter and Type F
plug cable
7)
3)
6 A4250-5.0 HBM: public FS42
Page 7

General Details
Control
Interface 12" touchscreen GUI, Ethernet (TCP/IP), USB
Features
8)
OSA trace Continuous
Functions Sampling; archiving
Data format MySQL database; Excel™ compatible files
Environmental
Operation temperature 10 to 40 ºC
Operation humidity < 90% at 40 ºC
Storage temperature -20 to 70 ºC
Storage humidity <95% (non-condensing)
Shock resistance Class 2 (EN 60068-2-27)
Vibration resistance9) Class 2 (EN 60068-2-6)
Mechanical
Dimensions (w x h x d) 360 x 280 x 105.5 mm
Mounting Available with handle and transportation bag
Enclosure Aluminum (IP20)
Weight 7.3 kg
Power
Voltage 18-20 VDC
Nominal consumption10)
Charging, not running 45 W
Charging, running 90 W
Not charging, running 45 W
Battery pack
Number of batteries 2
Battery model pcga-bp2nx
Battery capacity 4400 mAh
Battery voltage 14.8 V
(wavelength, absolute power)
FS42 A4250-5.0 HBM: public 7
Page 8

General Details
Battery technology Li-ion
Autonomy
1)
σ value from an error histogram with +0.25M samples
2)
± (|xc|+2σ) value from an error histogram with +8.4M samples obtained over full temperature
range
3)
Considering sensor wavelengths equally spaced over the operating range and maximum
measurement range of ±2 nm per sensor
4)
With simultaneous acquisition
5)
Considered as the ratio between the optical power emitted at an optical channel and the minimum
detectable optical power reflected by a fiber Bragg grating
6)
Typical values
7)
Different plug format can be added upon request
8)
Full spectrum trace with 20001 points acquired over the 100 nm range (sampled every 5 pm)
9)
Sinusoidal vibration
10)
Peak consumption may reach 90 W
6)
3 hours
8 A4250-5.0 HBM: public FS42
Page 9

2 Hard Disk Image Recovery
The Portable BraggMETER has a functionality to recover
all hard disk factory contents, restoring the default set
tings and original configurations of the interrogator.
Important
System recovery will erase all the data stored in the hard
disk.
2.1 System Recovery
To apply the recovery process, follow the instructions as
explained:
1. Turn off the device
2. Connect the keyboard and mouse to the device
Hard Disk Image Recovery
3. Turn on the device
4. When the splash screen (Fig. 2.1) appears press F10
Fig. 2.1
FS42 A4250-5.0 HBM: public 9
Page 10
Hard Disk Image Recovery
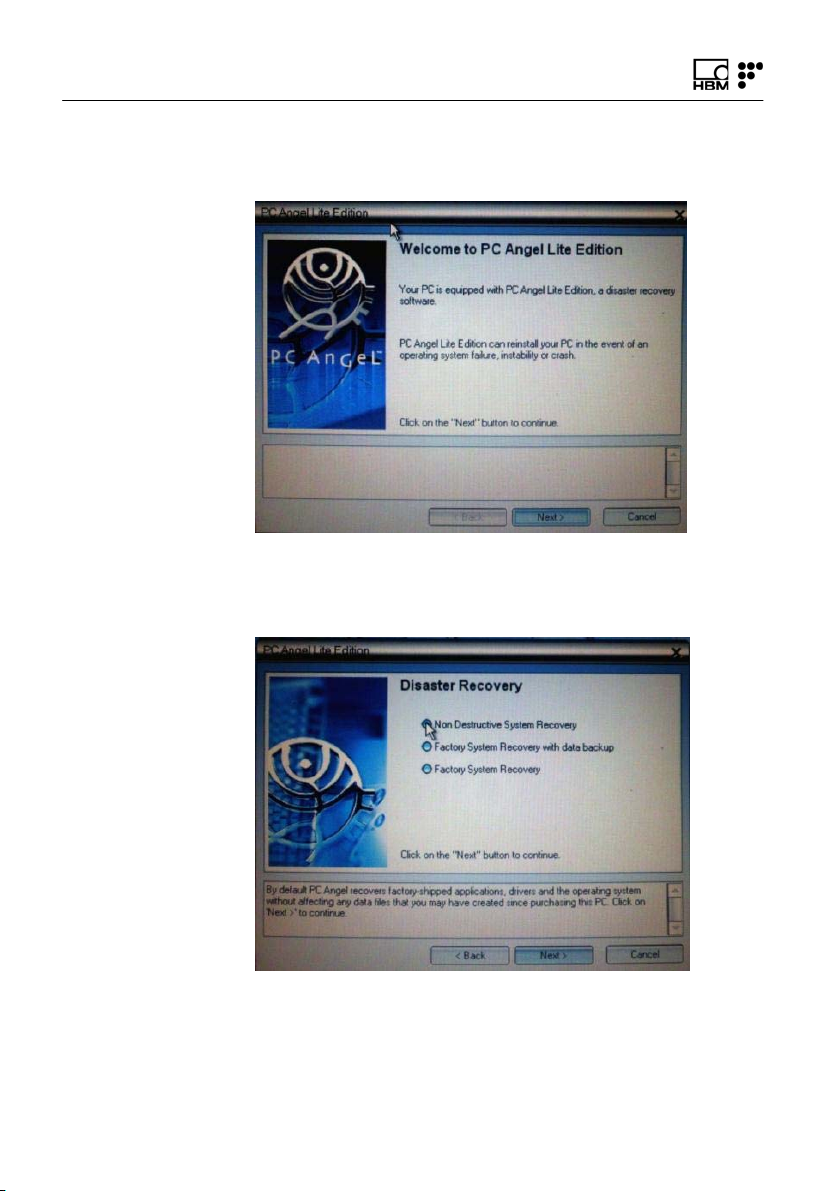
5. Press Next button (Fig. 2.2)
Fig. 2.2
6. Select Non Destructive System Recovery (Fig. 2.3)
Fig. 2.3
10 A4250-5.0 HBM: public FS42
Page 11
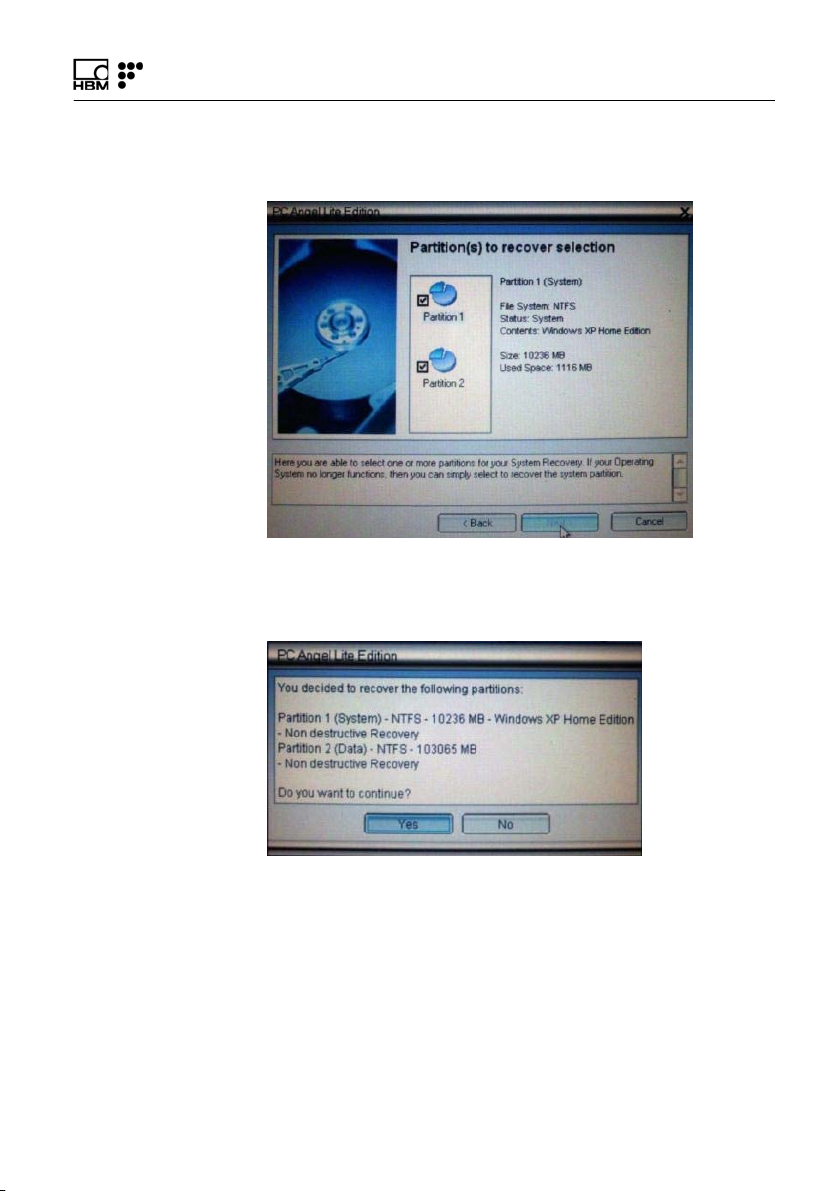
7. Press Next (Fig. 2.4)
Fig. 2.4
8. Press Yes (Fig. 2.5)
Hard Disk Image Recovery
Fig. 2.5
FS42 A4250-5.0 HBM: public 11
Page 12
Hard Disk Image Recovery
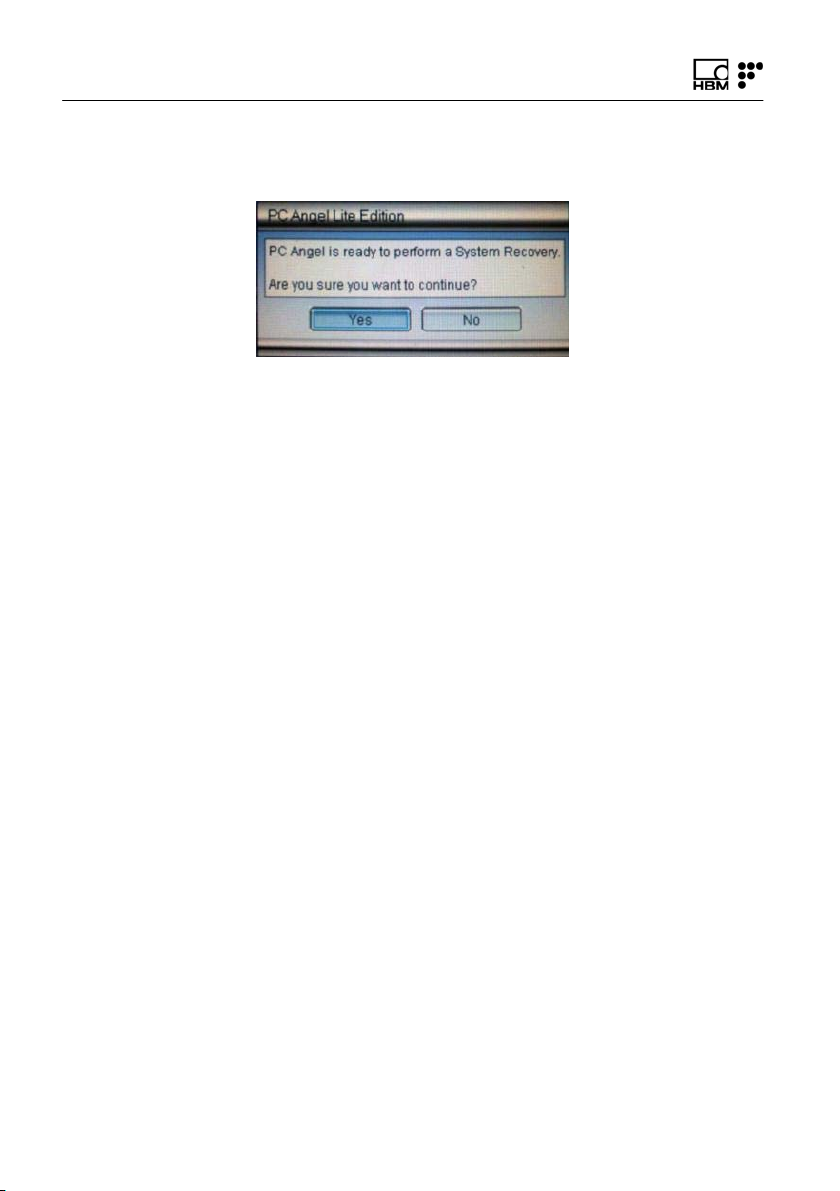
9. Press Yes (Fig. 2.6)
Fig. 2.6
10.Allow approximately 10 minutes for the recovery
process to complete. Reboot the PC into Windows
Embedded™.
12 A4250-5.0 HBM: public FS42
Page 13
Regulatory and Certification Considerations
3 Regulatory and Certification Considerations
3.1 Environment Considerations
3.1.1 Disposal of your old Appliance
When the attached symbol combination - crossed-out
wheeled bin and solid bar symbol is attached to a product
it means the product is covered by the European Direc
tive 2002/96/EC and is applicable in the European Union
and other countries with separate collection systems.
All electrical and electronic products should be disposed
of separately from the municipal waste stream or house
hold via designated collection facilities appointed by the
government or the local authorities. The correct disposal
of your old appliance will help prevent potential negative
consequences for the environment and human health.
For more detailed information about disposal of your old
appliance, please contact your city office, waste disposal
service or distributor that purchased the product.
HBM FiberSensing, S.A. is a manufacturer registered in
the ANREEE - "Associação Nacional para o Registo de
Equipamentos Eléctricos e Electrónicos" under number
PT001434. HBM FiberSensing celebrated a "Utente"
type contract with Amb3E - "Associação Portuguesa de
Gestão de Resíduos de Equipamentos Eléctricos e Elec
trónicos", which ensures the transfer of Electrical and
Electronic appliance waste management, i.e. placing
Electronic and Electrical appliances in the Portuguese
market, from the manufacturer HBM FiberSensing to
Amb3E.
FS42 A4250-5.0 HBM: public 13
Page 14
Regulatory and Certification Considerations
3.2 Laser Safety
The FS42 - Portable BraggMETER interrogator contains
a laser in its core. A laser is a light source that can be
dangerous to people exposed to it. Even low power
lasers can be hazardous to a person's eyesight. The
coherence and low divergence of laser light means that it
can be focused by the eye into an extremely small spot
on the retina, resulting in localized burning and perma
nent damage.
The lasers are classified by wavelength and maximum
output power into the several safety classes: Class 1,
Class 1M, Class 2, Class 2M, Class 3R and Class 4.
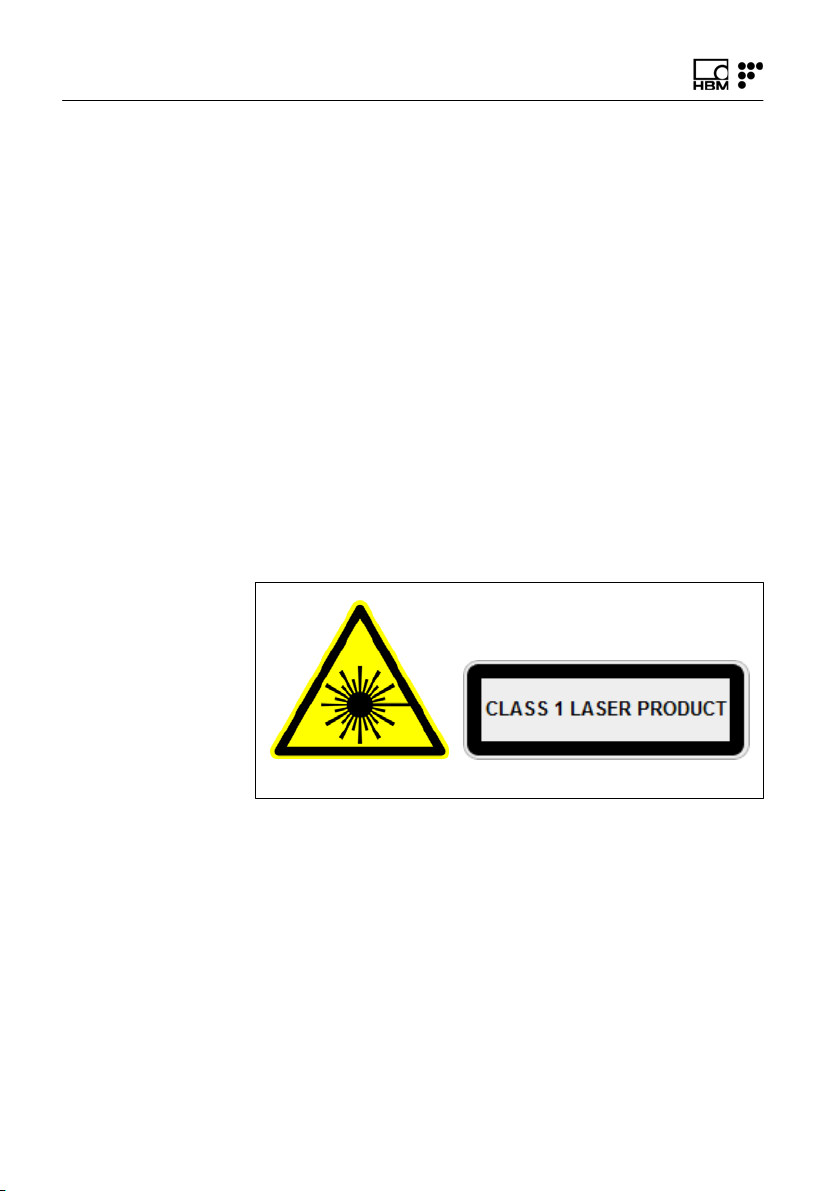
3.2.1 Symbols
Warning symbol Class 1 Laser symbol
3.2.2 Class 1 Laser
The FS22 - Portable BraggMETER is a class 1 laser
product:
«Any laser or laser system containing a laser that cannot
emit laser radiation at levels that are known to cause eye
or skin injury during normal operation.»
14 A4250-5.0 HBM: public FS42
Page 15

Regulatory and Certification Considerations
It is safe under all conditions of normal use. No safety
requirements are needed to use Class 1 laser devices.
This product contains a laser within an enclosure that
prevents exposure to the radiation and that cannot be
opened without shutting down the laser.
3.2.3 General Precautions Considerations
Everyone who uses a laser equipment should be aware
of the risks.
The laser radiation is not visible to the human eye but it
can damage user's eyesight.
The laser is enabled when the interrogator is turned on.
Users should never put their eyes at the level of the hori
zontal plane of the optical adapters of the interrogator or
uncovered optical connectors.
Adequate eye protection should always be required if
there is a significant risk for eye injury.
When an optical channel is not in use (no optical connec
tor plugged to the interrogator), a proper connector cap
must be used.
The optical connectors are subjected to maintenance
and/or inspection.
Do not attempt to open or repair a malfunction interroga
tor. It must be returned to HBM FiberSensing for repair
and calibration.
FS42 A4250-5.0 HBM: public 15
Page 16

Regulatory and Certification Considerations
3.2.4 Certification
This product carries the CE marking and complies with
the applicable international requirements for product
safety and electromagnetic compatibility, according to the
following Directives:
S Low Voltage Directive (LVD) 2014/35/EU - Electrical
Safety
S Electromagnetic Compatibility (EMC) Directive
2014/30/EU
It is in compliance with the EN61326/EN55011 Emission
Radiated Test Class A, under the Electromagnetic Com
patibility Standard.
The corresponding Declaration of Conformity is available
upon request.
16 A4250-5.0 HBM: public FS42
Page 17
4 Operation
Operation
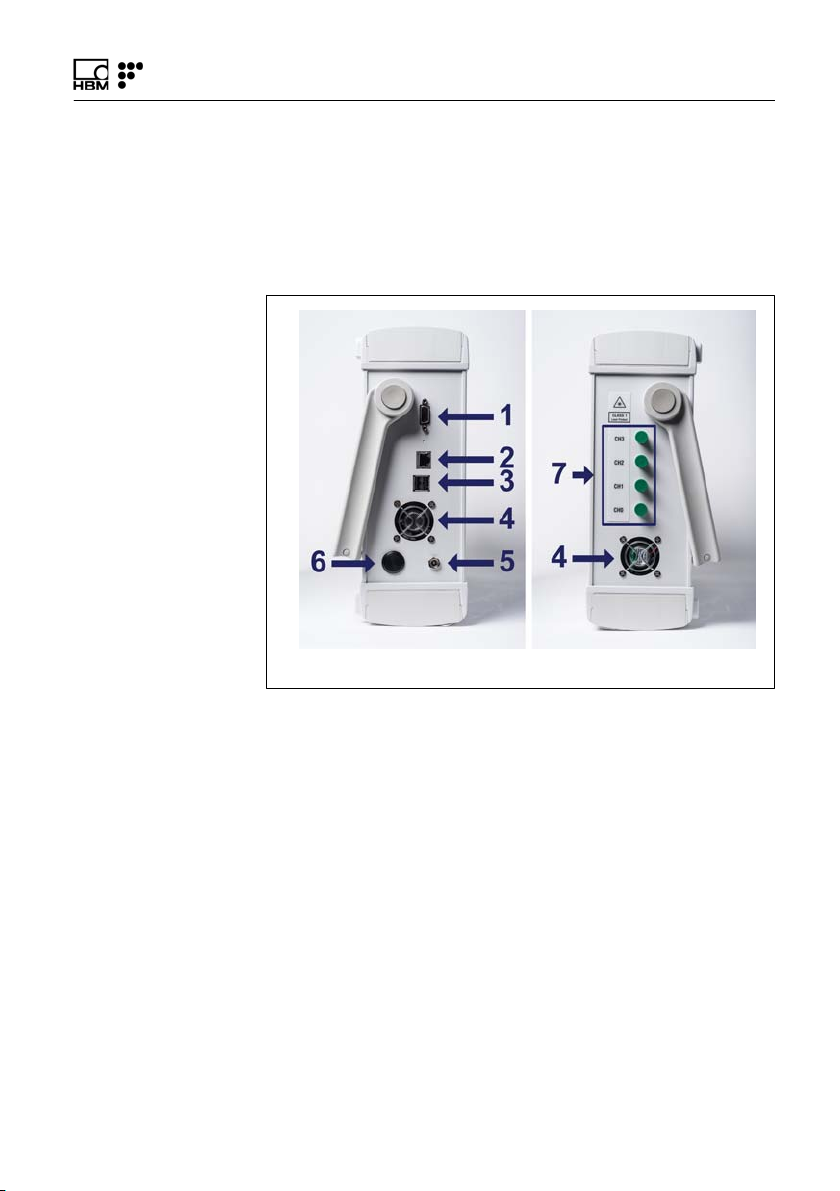
4.1 Connectors
Left view Right view
Fig. 4.1
The connectors and buttons in Fig. 4.1 are:
1 VGA Connector
2 LAN Connector
3 USB Connector (2x)
4 Fan
5 Power Connector
6 ON/OFF button
7 Optical Channel Connectors (FC/APC or SC/APC)
FS42 A4250-5.0 HBM: public 17
Page 18
Operation
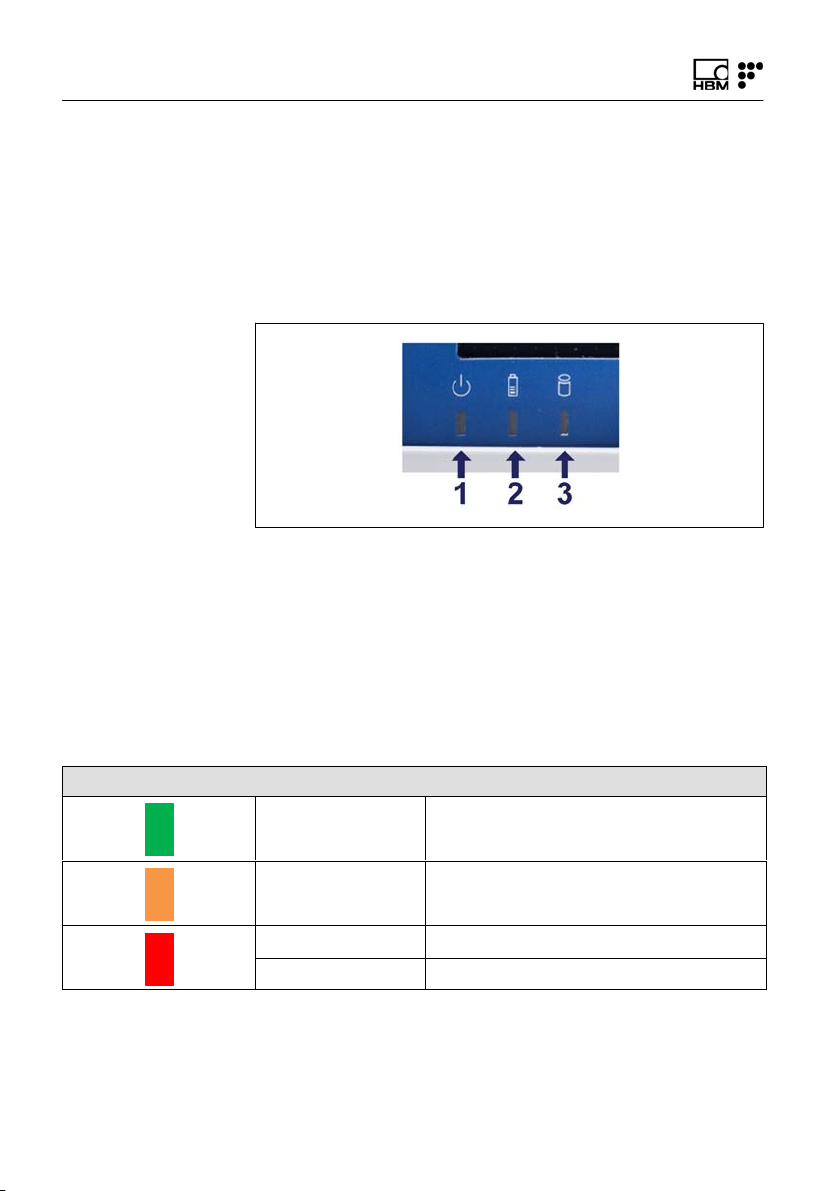
4.2 Status Indicators
On the bottom of the screen panel the user can find three
indicators. Number 1 on Fig. 4.2 refers to the power sta
tus of the equipment, number 2 refers to the battery sta
tus and number 3 refers to disk writing.
Fig. 4.2
Number 1 and number 3 in Fig. 4.2 can only assume one
color. When led 1 is green the interrogator is powered on
and when led 3 is yellow the hard disk is being written.
The battery status (Led number 2 in Fig. 4.2) assumes
different colors depending on charge level, according to
the following table.
Battery LED
Steady green Charge level > 60%
Steady orange 60% > Charge level > 35%
Steady red 35% > Charge level > 20%
Blinking red Charge level < 20%
18 A4250-5.0 HBM: public FS42
Page 19

Operation
Important
Battery with less than 20% of maximum charge will com
promise the correct startup of the interrogator.
4.3 Protection and Carrying Bag (optional)
To place or remove the protection and carrying bag, pro
ceed as follows:
S Remove the handle fixation protection cover;
S With a Torx screw driver 20 unscrew the handle;
S Remove the handle;
S Place/Remove the bag from the interrogator;
S Put back the handle on its place respecting its orienta
tion;
S Screw the handle.
S Place back the handle fixation protection cover
4.4 Power Supply
The interrogator must be used with a dedicated power
supply source and not shared with other equipment,
when powering with a direct source and not with the
power adapter.
FS42 A4250-5.0 HBM: public 19
Page 20
Operation
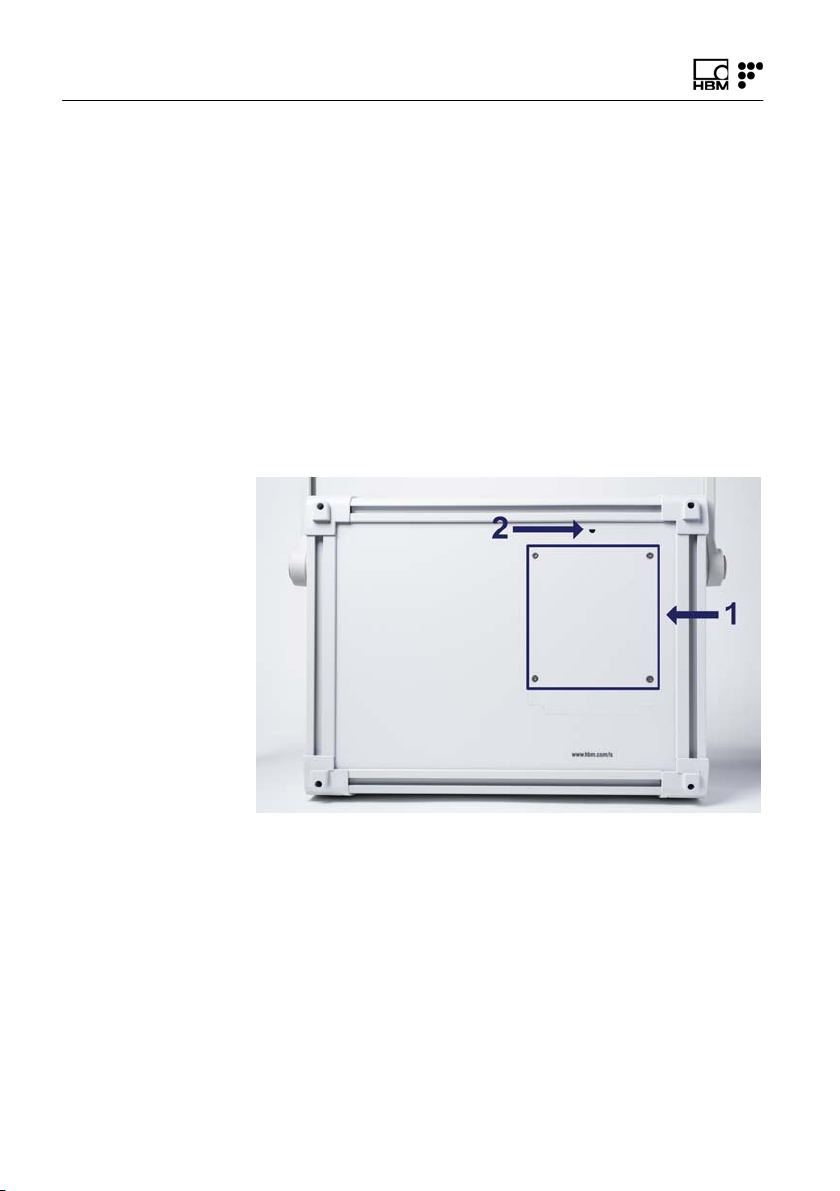
4.5 Battery Pack
Portable BraggMETER is supplied with a replaceable
battery pack located in the back panel of the equipment,
identified with a blue rectangle in Fig. 4.3. The battery
pack is a pair of two commercially available battery mod
ules (model: pcga-bp2nx), see chapter 1.3
“Technical Data”, on page 6 for battery details.
The numbers in Fig. 4.3 refer to:
1 4 Hexalobular Csk screws M3x6
2 Hole for opening
Fig. 4.3
Before turning on the Portable BraggMETER for the first
time, the batteries should be fully charged. Connect the
Portable BraggMETER directly to 100~240 V power line
using the provided 20 V AC adapter. Once the interroga
tor starts charging, the left sided fan (see Fig. 4.1) will
start working.
20 A4250-5.0 HBM: public FS42
Page 21

Operation
The replaceable battery pack has two independent bat
teries. To avoid lifetime reduction of the batteries this
device manages charge-discharge cycles, as result of
this process some charge cycles will not reach the maxi
mum charge level of 100%. The estimated time to fully
charge the battery pack is about 4 hours.
Important
It is advisable to fully recharge and remove the battery
pack before periods of inactivity longer than 4 weeks, see
chapter 4.5.1 “Removing the Battery Pack”.
4.5.1 Removing the Battery Pack
Changing batteries is a simple process that must be per
formed following the procedure here described, since
irreversible damage can be caused due to incorrect use.
Important
Take the necessary precautions to avoid Electro Static
Discharge (ESD).
To change the batteries proceed as follows:
1. Shut down the interrogator and wait until the power
LED is off.
2. Unplug the power supply cable if connected to the
interrogator.
3. Unscrew Csk M4x8 screws, number 1 in Fig. 4.3.
FS42 A4250-5.0 HBM: public 21
Page 22
Operation
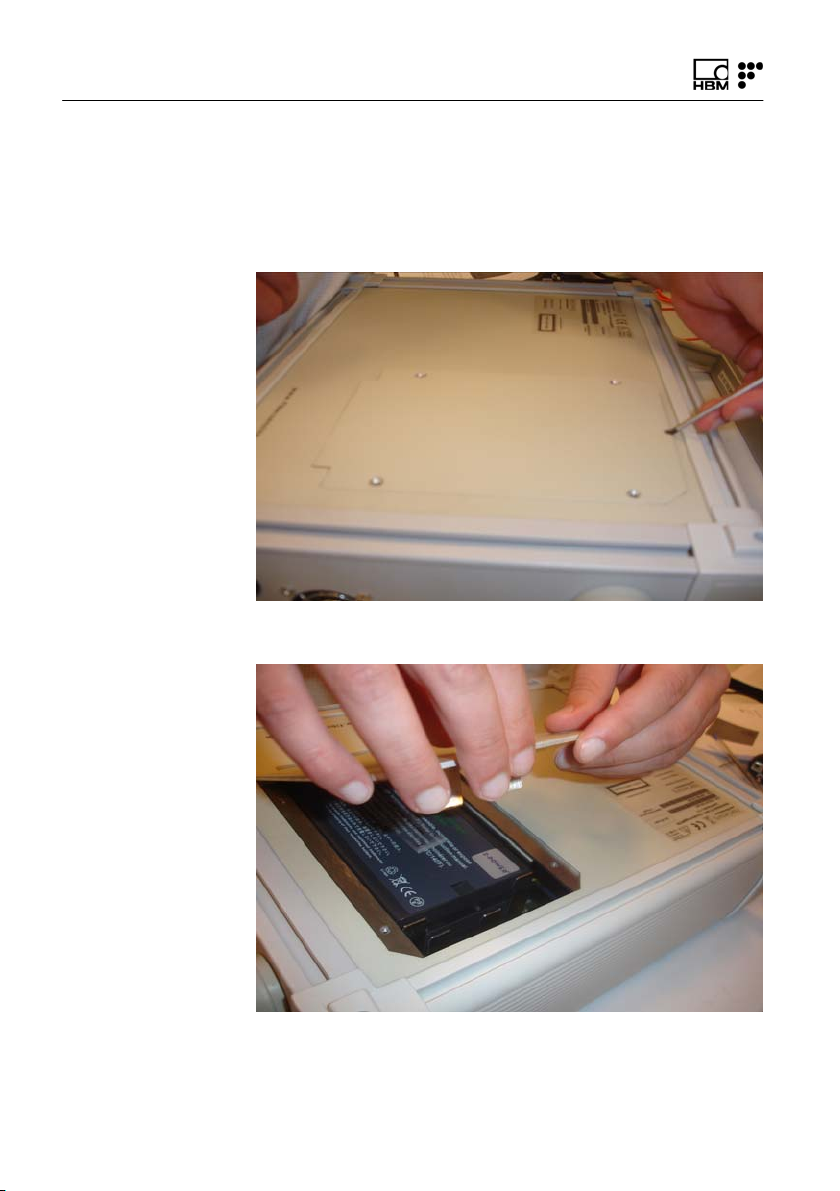
4. Pull the battery cover rotating on the bottom edge and
then remove it. To lift-up the pack, use a screwdriver
as shown in Fig. 4.4. Do not insert the screw driver
more than few millimeters.
Fig. 4.4
Fig. 4.5
22 A4250-5.0 HBM: public FS42
Page 23
Operation
5. Pull the edge of the battery vertically, number 1
in Fig. 4.6.
6. Remove the battery by sliding it horizontally,
number 2 in Fig. 4.6.
7. Repeat the process for the second battery, see
Fig. 4.7.
Fig. 4.6
FS42 A4250-5.0 HBM: public 23
Page 24

Operation
Fig. 4.7
24 A4250-5.0 HBM: public FS42
Page 25

Operation
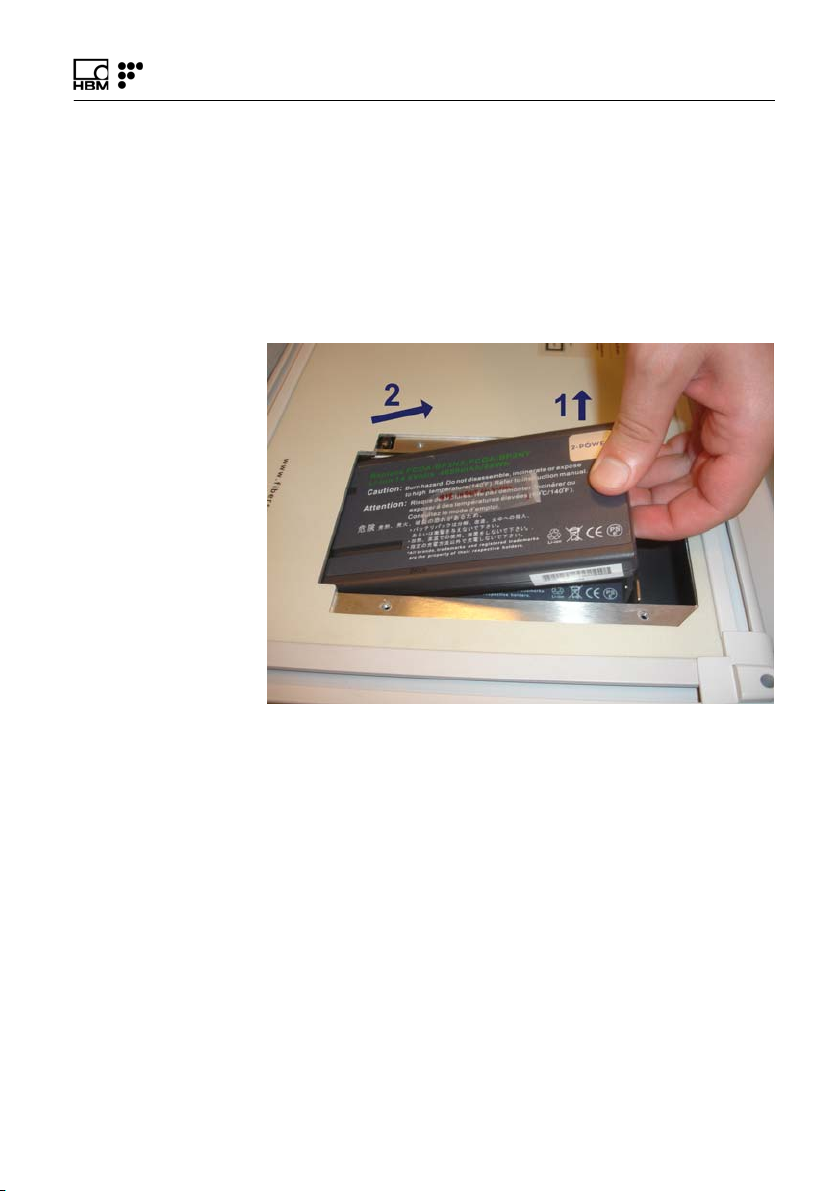
4.5.2 Connecting the Battery Pack
Important
Make sure the interrogator is switched off before placing
the batteries.
To connect a battery pack, proceed as follows:
1. Align the Battery Pack in the Back Panel slot, as in
Fig. 4.8. Take particular attention not to damage the
pins of the connection, blue rectangle in Fig. 4.8.
Fig. 4.8
2. Slide the battery horizontally, number 1 in Fig. 4.8,
until the battery is connected on the blue rectangle
(blue rectangle in Fig. 4.8).
3. Lower the edge of the Battery down, number 2 in
Fig. 4.8.
4. Repeat the process for the second battery and screw
the cover.
FS42 A4250-5.0 HBM: public 25
Page 26

Operation
4.6 Switching ON
Pressing the “ON/OFF" button (see in Fig. 4.1 on
page 17) will start the engine. The interrogator software
will be automatically launched.
Once the interrogator is turned on both fans (see in
Fig. 4.1 on page 17) will start working.
To connect fiber Bragg grating based sensors to the Por
table BraggMETER FC/APC or SC/APC connectors must
be used (see in Fig. 4.1 on page 17). Attention should be
paid to the cleaning of the connector. A dirty connector
can compromise the measurement and will degrade the
interrogator. It is advisable to frequently clean the con
nectors using appropriate tools.
4.7 Switching OFF
To switch off the interrogator proceed in one of the fol
lowing ways:
1. While running the iLog software:
- Press the Exit button (see Fig. 4.9). If for the active
configuration the settings are set to “shut down on
exit", the interrogator will shut down directly. If not,
the software is active and steps described in 2
should be performed. Refer to section 6
“iLog Software”, on page 45, for further details.
26 A4250-5.0 HBM: public FS42
Page 27

Fig. 4.9
- Press and release the ON/OFF button (see
Fig. 4.10) for ~250 milliseconds. A pop-up will
appear to confirm the action.
Operation
Fig. 4.10
2. While at Windows™ environment:
- Select the start button and press shutdown.
- Press and release the ON/OFF button for
~250 milliseconds. A pop-up will appear to confirm
the action.
FS42 A4250-5.0 HBM: public 27
Page 28

Operation
4.8 Touch Screen Calibration
If a cover is applied on the touch screen for protection, it
might be necessary to repeat the screen configuration.
To perform the screen configuration proceed as follows:
1. Go to Start and press My Computer.
2. Open the file C:\Program Files\UPDD\TBCALIB
(Fig. 4.11).
3. The screen will become white and a cross will appear
on the top left corner. Use the screen pen to click on
the center of this and on the following crosses
(Fig. 4.12).
4. Press the Confirm button (Fig. 4.13).
28 A4250-5.0 HBM: public FS42
Page 29

Operation
Fig. 4.11
FS42 A4250-5.0 HBM: public 29
Page 30

Operation
Fig. 4.12
30 A4250-5.0 HBM: public FS42
Page 31

Operation
Fig. 4.13
FS42 A4250-5.0 HBM: public 31
Page 32

Measuring Examples
5 Measuring Examples
5.1 Measuring in 5 Steps
To start making an acquisition it takes no more than five
easy steps.
1. Charge the batteries;
2. Turn on the Portable BraggMETER interrogator;
3. Connect one sensor to an Optical Channel;
4. Click Auto Scan Button on the Configuration tab;
5. Hit the Run Button on the Graphical View or Spectral
View tabs.
5.2 Typical Configuration
Typically, a fiber Bragg grating sensing network is divided
into branches of sensors connected in series. In Fig. 5.1
there is a scheme of a usual FBG sensing branch.
FS62 Strain
FS63 Temperature
Fig. 5.1
FS64 Tilt
32 A4250-5.0 HBM: public FS42
Page 33

Measuring Examples
A branch can accommodate sensors with wavelengths
corresponding to all standard HBM FS wavelengths. The
number of sensors in a channel can vary if there is previ
ous knowledge about the spectral range the sensors will
cover. The major concern is the overlap of adjacent sen
sors. The available optical channels have simultaneous
acquisition, meaning that the sensing network can have a
large number of fiber Bragg grating sensors interrogated
at the same time.
The employed technology allows a multi-functionality
meaning that on the same branch it is possible to mea
sure Strain, Temperature, Displacement, Pressure,
Acceleration, etc…
The sensing network can be up to 10 km away from the
interrogator for there are no EM/RF interferences or sig
nificant losses of light in the optical fiber.
Each FBG sensor has a characteristic central wavelength
(λ0) that depends only on the measurand. This means
that with this technology there is no need for recalibra
tions every time the system is shut down.
The Portable BraggMETER is a portable interrogator
designed to be autonomous (uses battery) and easy to
carry (small size and reduced weight) to be plainly used
in different projects.
FS42 A4250-5.0 HBM: public 33
Page 34

Measuring Examples
5.2.1 HBM FS Wavelengths
The HBM FiberSensing standard wavelengths are:
FS Line
Central wavelength (nm)
N - 1503.3 1520
O - 1509.7 1525
K - 1516.1 1530
L - 1522.5 1535
A - 1528.9 1540
B - 1535.1 1545
C - 1541.5 1550
D - 1547.9 1555
E - 1554.3 1560
F - 1560.8 1565
G - 1567.2 1570
H - 1573.8 1575
I - 1580.2
J - 1586.6
OP Line
Central wavelength (nm)
34 A4250-5.0 HBM: public FS42
Page 35

Measuring Examples
5.3 Definitions and Operation Methods
The following definitions are applicable to this equipment
only.
5.3.1 Wavelength
The wavelength value corresponds to the wavelength at
the peak of the fiber Bragg grating reflection spectrum,
commonly referred as Bragg wavelength (Fig. 5.2).
Fig. 5.2
FS42 A4250-5.0 HBM: public 35
Page 36

Measuring Examples
5.3.2 Power
The Power value corresponds to the optical power
reflected by the fiber Bragg grating at the peak wave
length (Fig. 5.3). It is a relative value from 0 to 4095.
Fig. 5.3
36 A4250-5.0 HBM: public FS42
Page 37

Measuring Examples
5.3.3 Threshold
The threshold value corresponds to the considered
power level for the FBG peak computation and can be
used to disregard side lobes and ground noise.
In its linear representation, it is measured bottom-up from
the 0 (zero) power value.
Fig. 5.4
In its logarithm representation, it is a value in dB from the
maximum peak power of the channel.
FS42 A4250-5.0 HBM: public 37
Page 38

Measuring Examples
Fig. 5.5
Threshold is a value between:
-minimum: 23dB (corresponding to 0.005 in linear scale)
-maximum: 0.1 dB (corresponding to 0.95 in linear scale)
38 A4250-5.0 HBM: public FS42
Page 39

Measuring Examples
5.4 Common Measuring Difficulties
There may be the possibility of having measuring mal
functions due to several problems in the sensing network
or optical connections. A list of some of the usual prob
lems is described below with the explanation for its
occurrence and correction.
5.4.1 Dirty Connector
When an interrogator is repeatedly being plugged in and
out with optical connectors, it is very important that the
connectors are cleaned prior to any connection. Other
wise, dust and moister can be deposited in the interroga
tor adaptor and this will compromise measurements. In
Fig. 5.6 a picture of a magnified connector is presented.
The dark gray circle corresponds to the fiber cladding
and the small light gray circle is the core of the fiber. One
picture for a clean connector and one picture for a dirty
connector are presented.
Clean connector Dirty connector
Fig. 5.6
The most common effect of dirt on the connections is a
large amount of broad band light being reflected at the
connection, in both directions, meaning that the dynamic
range for measurements becomes smaller.
FS42 A4250-5.0 HBM: public 39
Page 40

Measuring Examples
Fig. 5.7
To clean an optical interrogator adapter, use an appropri
ate cotton swab (there are several cleaning swabs in the
market frequently used for telecom) embedded in iso
propyl alcohol. Insert it in the optical adapter, as in
Fig. 5.8, and rotate the swab always in the same direc
tion.
40 A4250-5.0 HBM: public FS42
Page 41

Measuring Examples
Fig. 5.8
5.4.2 Broken Connector
It may also occur that the interrogator adapter ferrule
breaks. In this case, when an optical connector is
inserted it does not get proper alignment and measure
ments are compromised. A broken ferrule will look as
shown in Fig. 5.9.
Fig. 5.9
To solve this problem you should contact HBM
FiberSensing.
FS42 A4250-5.0 HBM: public 41
Page 42

Measuring Examples
Tip
A connector is more prone to degradation in applications
where you are constantly connecting and disconnecting
sensors. To avoid early degradation and protect the inter
rogator connector use a small patch cable and an
adapter.
5.4.3 Reflective Fiber Ending
Even when all connections have been performed cor
rectly, it may occur that the interrogator does not find any
sensor on the array. One of the reasons may be the
excess of reflected light saturating the detectors.
When a fiber is perfectly cut (Fig. 5.10 on the left) a large
amount of light is reflected right back to the fiber core in
the right direction, heading to the interrogator detectors.
When this occurs, an index matching gel or an angled
termination must be used. If these are unavailable, the tip
of the fiber can be smashed with a metallic tool. This will
destroy the perfect geometry (Fig. 5.10 on the right) and
the light that is reflected will take random directions end
ing up outside of the core.
42 A4250-5.0 HBM: public FS42
Page 43

Measuring Examples
Reflective Fiber Ending
Fig. 5.10
5.4.4 Cut Fiber
When the fiber, for any reason, is broken between sen
sors in a series, the sensors that are after the fault may
disappear from the optical spectrum and will not be
detected.
There may also be the case that the fiber is cut, but not
completely spread apart (e.g. the fiber is damaged in an
area covered with glue). This will cause a Fabry-Pérot
effect – the light will suffer multiple reflections inside the
cavity creating sinusoidal background reflection. Fig. 5.11
shows a schematic representation of the reflected spec
trum for these three presented cases.
Refractive Fiber Ending
FS42 A4250-5.0 HBM: public 43
Page 44

Measuring Examples
Fig. 5.11
44 A4250-5.0 HBM: public FS42
Page 45

6 iLog Software
6.1 General Details
6.1.1 Software Version
This document refers to HBM FiberSensing interrogator
software version v5.4.
6.1.2 Software Update
The interrogator software can be updated. Whenever the
software is updated, changes will also be performed in
the internal Database.
iLog Software
Information
To ensure no configuration losses, please make sure you
have properly backed up your sensor configurations.
To see the current software version use "info" (number 7
in Fig. 6.2) functionality.
FS42 A4250-5.0 HBM: public 45
Page 46

Graphical User Interface
6.2 Graphical User Interface
The Front Panel of the iLog software is divided in two
functional areas. The bottom toolbar contains the con
trols that are always available. The upper main area has
several menus separated with tabs.
6.2.1 General and Management Controls
The controls that are always available are the following:
Fig. 6.1
1 General Information Bar – Displays information on the
current status or instructions.
2 Alarm Led – If blinking red or yellow, this led indicates
that an alarm has been reported (see section 6.2.6,
page 71). It will turn green again, once the alarm is
acknowledged.
3 Battery Status – For interrogators where there is a
battery, this icon has three different states regarding
the actual power situation: Charging, Battery OK or
Battery Low. For interrogators plugged in, this icon will
be on with a figure of a plug.
4 Battery Charge – Displays percentage of remaining
battery charge.
46 A4250-5.0 HBM: public FS42
Page 47

Graphical User Interface
Information
S When the battery level reaches 10%, a popup
appears informing the user of that situation.
S When the battery level reaches 7%, the interrogator
shuts down.
S When the battery level reaches 5%, it is not possible
to power up the interrogator.
5 Eject External devices – Using this button USB flash
drive or other external devices can be safely removed.
6 Run/Stop – Starts and stops data acquisition.
7 Exit – Shuts down the interrogator or exits the appli
cation (see number 2 in Fig. 6.10, on page 56).
8 Current date and time.
6.2.2 Graphical View
Within the Graphical View tab, real time measurements
can be monitored.
FS42 A4250-5.0 HBM: public 47
Page 48

Graphical User Interface
Fig. 6.2
Data is both displayed in values format (number 1 in
Fig. 6.2) and graphs format (number 2 in Fig. 6.2).
Graph and Plot
The two vertical scales of the graph can be changed. To
change one side of the scales, click on the label near the
edge. A popup window will appear where the new maxi
mum or minimum value can be written (Fig. 6.3). The
Zoom Fit button (number 4 in Fig. 6.2) can be used to
change the vertical scales limits in order to visualize the
full data range.
48 A4250-5.0 HBM: public FS42
Page 49

Graphical User Interface
Fig. 6.3
The time scale can also be altered by pressing on the
horizontal axis. The time scale window will pop up
(Fig. 6.4).
Fig. 6.4
The Collapse button (number 5 in Fig. 6.2) zeros graphi
cal values. While this function is ON the button is pre
sented in dark gray. Once it is pressed again, the graphi
cal zero function is turned off and actual values are
displayed.
Important
The saved values on the recorded data will be the origi
nal ones despite the graphical representation.
FS42 A4250-5.0 HBM: public 49
Page 50

Graphical User Interface
The maximum number of sensors that can be plotted
is 16. Sensor order of appearance and plot color is
defined on the Configuration tab (see section “Sensor",
page 59).
Saving Data
The first action to perform before starting an acquisition
is defining sensors. This procedure is explained on sec
tion 6.2.4 “Configuration”, page 53.
The Run/Stop button (see Fig. 6.1 on section 6.2.1
“General and Management Controls”, page 46) will start
the acquisition process.
While the acquisition is running, the Run/Stop button
changes into its stop status (Fig. 6.5).
Fig. 6.5
Data can be saved by pressing the Save button (num
ber 3 in Fig. 6.2). A popup window will ask for the dataset
name. Saved data consists on a table containing the
timestamp for each measurement and corresponding
values for the active sensors. Other relevant information
relative to active sensors and interrogator configuration is
also saved.
Important
Saving data is impossible when the available database
space is lower than 5%.
50 A4250-5.0 HBM: public FS42
Page 51

Graphical User Interface
To stop recording, acquisition must be stopped and then
the save button should be pressed. This data can be
consulted and transferred under the tab Data View (fur
ther details are presented on section 6.2.3 “Data View”,
page 52).
Info and Help button
Pressing the Information button (number 7 in Fig. 6.2) an
information box on the software version will appear.
On the Help button (number 6 in Fig. 6.2), the .pdf of this
document can be found.
FS42 A4250-5.0 HBM: public 51
Page 52

Graphical User Interface
6.2.3 Data View
With several functionalities, this tab is suitable for viewing
datasets that have previously been saved, getting addi
tional information on the available database space and
transferring data.
Fig. 6.6
Displaying Saved Datasets
Select the dataset on the datasets dropdown box (num
ber 1 in Fig. 6.6).
To display data, select the View Data button (number 2 in
Fig. 6.6). While data is being loaded into the Data Graph
(number 3 in Fig. 6.6) the View Data button is replaced
by a Stop button that can be used to stop data loading.
52 A4250-5.0 HBM: public FS42
Page 53

Graphical User Interface
Fig. 6.7
The displayed data can be zoomed in using the Zoom In
button (number 4 in Fig. 6.6). While the button is active,
the area to zoom in can be selected. When pressed
back, the displayed data will be zoomed out.
Copying Saved Datasets
Data can be readily saved as a .txt file to an external
USB flash drive by pressing the Export button (number 5
in Fig. 6.6). The saved data corresponds to the data that
is displayed on the Data Graph.
Deleting Saved Datasets
The Available Database Space is displayed on a specific
box (number 6 in Fig. 6.6). Pressing the Delete button
(number 7 in Fig. 6.6) will remove the selected dataset.
Note that saving new data is impossible when Available
Data Base Space is lower than 5%.
6.2.4 Configuration
Under the Configuration tab it is possible to configure the
sensors and branches to be measured by the device.
Sensors in iLog Software are organized in a tree. Its ele
ments are Configurations, Branches and Sensors. The
configuration is the parent tree node and has one branch
FS42 A4250-5.0 HBM: public 53
Page 54

Graphical User Interface
per each available optical channel. In its turn, branches
group up sensors.
Fig. 6.8
The Configuration is divided in four major sections: The
Tree Configuration layout (number 1 in Fig. 6.8); a tool
bar with buttons that perform actions to the tree elements
(number 2 in Fig. 6.8); element properties box (number 3
in Fig. 6.8); and an area that changes accordingly to the
tree level that is selected (number 4 in Fig. 6.8). If the
selected element is Configuration or Branch, clicking on
the area will prompt a Windows Explorer window in order
to choose any picture or drawing to associate to that spe
cific Configuration or Branch. If the selected element is a
54 A4250-5.0 HBM: public FS42
Page 55

Graphical User Interface
Sensor, then a testing graph will appear (see section
“Sensor", page 59).
Creating Tree Elements
There are two distinct ways to create sensors:
1. The Autoscan button (number 10 in Fig. 6.10) auto
matically searches for Fiber Bragg Sensors creating a
configuration with branches that correspond to the
optical channels. Using the auto scan action the main
sensor characteristics will be filled. A popup window
will appear for the channel selection (Fig. 6.9) when
the Autoscan button is pressed.
Fig. 6.9
2. The New Configuration button (number 1 in Fig. 6.10)
creates a new configuration from scratch. This means
that there is the need to define a new branch selecting
New Branch button (number 9 in Fig. 6.10) and then
creating a new sensor using the New Sensor button
FS42 A4250-5.0 HBM: public 55
Page 56

Graphical User Interface
Configuring Tree Elements
Most of the operations that can be performed to the con
figuration elements are similar. The user can create new,
delete, rename, zero and set active any element of the
configuration simply by selecting it on the tree menu and
pressing the respective button.
Configuration
Fig. 6.10
and filling in the sensor characteristics (see section
“Sensor", page 59).
1 Create New configuration.
2 Edit configuration – The iLog supports multiple config
urations and each configuration can have its own
properties.
3 Delete configuration.
4 Rename configuration.
5 Zero configuration – Introduces an offset on all the
sensors in the configuration.
6 Set configuration Active – Sets active every element
of the selected configuration.
7 Save configuration – Saves the configuration selected
on the tree menu to a .srs file.
56 A4250-5.0 HBM: public FS42
Page 57

Graphical User Interface
8 Open configuration – Loads a configuration from a
.srs file.
9 Create New branch (see section “Branch", page 58)
10 AutoScan – Searches for connected sensors creating
an automatic configuration.
The editable characteristics of the configuration are:
Fig. 6.11
1 Acquisition (number 1 in Fig. 6.11) – When “ON” upon
start-up, the interrogator immediately starts to acquire
data.
2 Logging (number 2 in Fig. 6.11) – When “ON” upon
start-up, the interrogator immediately starts to acquire
and save data.
3 Shutdown on Exit (number 3 in Fig. 6.11) – When the
user selects the exit button, the interrogator checks
this setting on the active configuration to determine
whether to shutdown the interrogator or just the iLog
application.
FS42 A4250-5.0 HBM: public 57
Page 58

Graphical User Interface
Branch
Fig. 6.12
1 Edit branch.
2 Delete branch.
3 Rename branch.
4 Zero branch.
5 Set branch Active.
6 Create New sensor - Selecting the new sensor, the
sensor window for defining its characteristics is called.
The menu is the same as the Edit sensor (see num
ber 6 from section “Sensor”, page 59).
The branch characteristic that can be edited for every
sensor of a branch at once is the Threshold (number 2
in Fig. 6.13) to the selected Optical Channel (number 1
in Fig. 6.13).
Information
For more information on Threshold see section 5.3.3 on
page 37.
58 A4250-5.0 HBM: public FS42
Page 59

Fig. 6.13
Sensor
Graphical User Interface
Fig. 6.14
1 Edit sensor.
2 Delete sensor.
3 Rename sensor.
4 Zero sensor.
5 Set sensor Active.
6 Test sensor – Pressing the Test sensor button, the
sensor value will be displayed on the graph area.
Sensor characteristics can be edited (Fig. 6.15).
FS42 A4250-5.0 HBM: public 59
Page 60

Graphical User Interface
Fig. 6.15
1 Sensor Category defines whether the sensor is an
Optical Sensor or a Virtual Sensor.
2 For all sensors the Name is a compulsory field.
3 CWL Central Wavelength (λ0) is the wavelength value
to which wavelength shift (Δλ) is calculated. In some
sensors, for absolute values, this should be the stated
wavelength on the calibration sheet. For zeroed mea
surements, this should be the sensors wavelength on
the zero instant.
4 The Ranges are defined as safety bands to avoid
crosstalk between sensors meaning that each sensor
60 A4250-5.0 HBM: public FS42
Page 61

Graphical User Interface
has its own operation range. It is not possible to con
figure sensors with overlapping operation ranges.
Nevertheless, since these ranges are dynamic, they
will follow the measured wavelength (λ). If a range
from a neighbor sensor overlaps the sensor's range,
measurement errors will occur.
Important
Dynamic ranges should be carefully selected in order to
avoid overlap during measurement. If this happens, read
ing errors will occur.
5 The Formula box allows the definition of the calcula
tions to be performed on the measured value of wave
length shift (x=Δλ=λ-λ0) (x=Measured WL-CWL). Here
it is possible to set a formula manually. To do so, click
on the formula box and a formula window will appear
(Fig. 6.16).
Fig. 6.16
Formulas can be inserted using Excel syntax on the for
mula area (number 1 in Fig. 6.16).
FS42 A4250-5.0 HBM: public 61
Page 62

Graphical User Interface
It is possible to copy and paste formulas from other loca
tions.
Additionally, it is possible to save formulas and use them
as a pre-set formula (Fig. 6.17) by pressing the button
Create Formula (number 2 in Fig. 6.16).
To select previously saved formulas use the box num
ber 3 in Fig. 6.16. Selected Formulas can be deleted
(number 4 in Fig. 6.16).
Information
Fig. 6.17
Name the formula (number 1 in Fig. 6.17), write its
expression (number 2 in Fig. 6.17) and select the unit
type (number 3 in Fig. 6.17) for that formula.
6 On the Offset box an offset to the wavelength (in nm)
can be defined.
7 Type dropdown box can be changed according to the
sensors type.
62 A4250-5.0 HBM: public FS42
Page 63

Graphical User Interface
8 Unit can be changed according to the sensor's output
unit.
9 The Active dropdown box defines whether the sensor
is active, hence plotted and saved. A sensor that is
not active will not be plotted nor saved on the dataset.
10 The Plot dropdown box activates the plotting of the
sensor and prompts the user to choose a color for the
sensor (number 11 in Fig. 6.15).
11 Changes the plot color.
12 The Scale option defines if the graphical representa
tion is to be referred to the left or to the right scales.
13 Temperature compensation - activates or deactivates
the computation of temperature compensation. Sen
sors can be automatically compensated for tempera
ture effects. Clicking on the edit button that appears
when temperature compensation is checked, the for
mula window will be displayed (Fig. 6.18).
Fig. 6.18
FS42 A4250-5.0 HBM: public 63
Page 64

Graphical User Interface
The correction can be performed using a preset tempera
ture gradient (number 1 in Fig. 6.18) or by collecting tem
perature data from a sensor in runtime (number 2 in
Fig. 6.18).
The sensor from which data will be collected for tempera
ture compensation must be defined as a Temperature
Sensor Type (number 8 in Fig. 6.15).
The Temperature Compensated Value will be calculated
using the Sensor measurement, minus the influence of a
temperature change in the sensor's output:
Important
FMLAS1[lS1* offsetS1* l
] * TCS [FMLAS1(lS2* offsetS2* l
0 S1
0 S2
) * T
REF
]
Where:
S S1 is the sensor to be compensated;
S S2 is the temperature sensor to be used as a refer
ence;
S FMLASk is the formula defined for the sensor Sk
(see Fig. 6.16);
S λSk is the measured wavelength for sensor Sk;
S offsetSk is the defined offset for sensor Sk (see num
ber 7 in Fig. 6.15);
S λ
is the central wavelength defined for sensor Sk;
0 Sk
S TCS is the sensor's Temperature Cross Sensitivity
(see number 4 in Fig. 6.18);
S T
is the user defined temperature (number 3 in
REF
Fig. 6.18) that should correspond to the temperature
64 A4250-5.0 HBM: public FS42
Page 65

Graphical User Interface
sensor measurement on the instant the user wishes
to define as “zero".
Tip
Start acquisition of the temperature sensor to define
T
.
REF
Important
The temperature compensation does not consider the
effect of the temperature gradient on the structure.
Sensor Categories
Optical Sensor
An Optical Sensor is a real Fiber Bragg Grating to which
a certain central wavelength corresponds.
Virtual Sensor
The Virtual Sensor is a sensor that is defined as a func
tion of one or more Optical Sensors.
To set the Virtual Sensor formula select the sensor cate
gory as virtual (number 1 in Fig. 6.15) and click in the
Formula button (number 5 in Fig. 6.15, page 60).
FS42 A4250-5.0 HBM: public 65
Page 66

Graphical User Interface
Fig. 6.19
The formula can be entered on the Formula box (num
ber 1 in Fig. 6.19) using the Sensor List dropdown (num
ber 2 in Fig. 6.19) and the Virtual Keyboard (number 3 in
Fig. 6.19).
6.2.5 Spectral View
The main purpose of the Spectral View tab is to provide
graphical information on some characteristics of the Fiber
Bragg Grating Sensors Spectrum from each Optical
Channel.
66 A4250-5.0 HBM: public FS42
Page 67

Fig. 6.20
Graphical User Interface
On the Spectral View graph (number 1 in Fig. 6.20) the
normalized power spectral distribution of each Optical
Channel is displayed. The Optical Channel that is repre
sented can be chosen using the Optical Channel Drop
down Box (number 2 in Fig. 6.20). Information on peak
wavelength values as well as on their normalized ampli
tudes (number 3 in Fig. 6.20) can also be found on the
Spectral View tab.
Information
The amplitudes are normalized to the highest reflection
peak.
FS42 A4250-5.0 HBM: public 67
Page 68

Graphical User Interface
The normalized threshold value for each Optical Channel
can be inserted on the Threshold box (number 4 in
Fig. 6.20) and can be shown graphically in the OSA
graph (number 5 in Fig. 6.20). This is an important
parameter, and must be set so that all FBG spectrum
peaks are above the line and that only one peak per FBG
sensor appears over the line. For definition please refer
to section 5.3.3, on page 37.
Graphic Tools
Tools to manage the graphical representation are avail
able on the buttons above the graph (number 6 in
Fig. 6.20).
Fig. 6.21
1 Zoom out - The Spectrum graph can be zoomed in or
out. The Zoom In tool is ready every time the cursor is
on the graph area. Zooming In is only possible on the
horizontal axis. By pressing the Zoom Out button
(number 1 in Fig. 6.21) the graph will zoom out to dis
play the entire optical spectrum range.
2 Linear/log - the vertical scale can be changed from
linear to logarithmic by pressing the Scale button.
With this selection the spectrum is represented in log
arithmic scale (number 1 in Fig. 6.22) and the normal
ized threshold value is converted to match Optical
Power units regarding maximum peak acquired value.
68 A4250-5.0 HBM: public FS42
Page 69

Graphical User Interface
The label will change to match the scale option that is
selected, linear or logarithmic."
Fig. 6.22
If the user chooses Logarithmic peak detection mode in
Configuration tab (see number 2 in Fig. 6.21, page 68)
the OSA graph will be showed in logarithmic mode after
starting acquisition.
Information on peak wavelength values as well as on
their amplitudes (number 2 in Fig. 6.22) can also be
found on the Spectral View tab.
FS42 A4250-5.0 HBM: public 69
Page 70

Graphical User Interface
The connector output optical power reference is specified
on the interrogator User Manual.
3 Add reference - the tracing tools allow the displaying
4 Manage - to display or rename a previously saved
Information
of an additional trace on the Spectrum Graph. These
can be previously saved wavelength graphs or user
defined traces.
Pressing the Add button, the software will save the
wavelength graph naming the file with the instant date
and time (DD.MM.YYYY_hh:mm:ss.dat).
OSA trace, the Manage OSA Trace button should be
pressed (number 4 in Fig. 6.21). A selection window
will appear (Fig. 6.23) and the OSA Reference file can
be chosen (number 1 in Fig. 6.23).
Fig. 6.23
To rename the reference file, press the button num
ber 2 in Fig. 6.23.
To turn off an active OSA Reference choose “----“ on
OSA references drop list, (number 1 in Fig. 6.23).
70 A4250-5.0 HBM: public FS42
Page 71

Graphical User Interface
5 Save as Table - the Spectrum can be saved as a
table to a USB flash drive. Naming is automatic: OSADD-MM-YYY-hh-mm-ss.xls.
6 Save as Picture - the Spectrum can be saved as a
bitmap file to a USB flash drive. Naming is automatic:
OSA-DD-MM-YYY-hh-mm-ss.bmp.
6.2.6 Alarms
This tab is mainly used for gathering information on the
generated alarms and events. Alarms are system created
events. Events correspond to every action that the user
performs.
Fig. 6.24
FS42 A4250-5.0 HBM: public 71
Page 72

Graphical User Interface
All alarm and events messages are displayed in a table
(number 1 in Fig. 6.24).
Every time the iLog software starts up, events and
alarms with more than 30 days are deleted.
The only actions that can be performed under this tab
are:
1. Cleaning tables by pressing the Clear button (num
2. Displaying the last 30 day events and alarms that
The Alarm LED on the general management controls
(number 2 in Fig. 6.1) can be in three different colors:
Information
ber 2 in Fig. 6.24)
have occurred during handling and usage of the inter
rogator (number 4 in Fig. 6.24) and export them (num
ber 3 in Fig. 6.24)
System Alarms
Blinking red
Blinking yellow
Steady green No alarm.
NaN measurement or communication error/failure at a
rate of more than 10 events per minute.
NaN measurement or communication error/failure at a
rate of less than 10 events per minute.
72 A4250-5.0 HBM: public FS42
Page 73

Sensor Alarms
Graphical User Interface
Blinking yellow
Steady green
More than 10 “sensor out of range" notification per
minute.
No alarm or less than 10 “sensor out of range" notifi
cation per minute
FS42 A4250-5.0 HBM: public 73
Page 74

Graphical User Interface
74 A4250-5.0 HBM: public FS42
Page 75

Graphical User Interface
FS42 A4250-5.0 HBM: public 75
Page 76

HBM Test and Measurement
Tel. +49 6151 803-0
Fax +49 6151 803-9100
info@hbm.com
measure and predict with confidence
www.hbm.com
A4250-5.0 7-2002.4250 HBM: public
 Loading...