

Page 1

HI 3896
HANNA Soiltest
Soil Test Handbook
Soil Science
and Management
www.hannainst.com
MAN3896R3 07/04
Page 2

Index
SOIL AND PLANT LIFE ............................................................................................ 3
PHYSICAL STRUCTURE........................................................................................... 4
Allow the tube to stand for at least 5 minutes. The clearer the extract becomes the
better. However, some cloudiness will not affect the accuracy of the test.
CHEMICAL COMPOSITION ....................................................................................... 5
pH .................................................................................................................... 5
Management of the soil in relationship to pH values ............................................. 7
Nutrients ........................................................................................................... 9
Fertilization ....................................................................................................... 9
SOIL ANALYSIS .................................................................................................... 13
Sampling ......................................................................................................... 13
Test procedure.................................................................................................. 14
Health & Safety ............................................................................................... 15
• Nitrogen (NO3) test
Use the pipette to transfer 2.5 ml of the clear general soil extract to a clean test
tube. [Pay attention not to transfer any soil. To avoid agitation of the soil, squeeze
the bulb of the pipette before inserting it into the soil extract solution.] Add the
content of one packet of HI3896-N reagent. Replace the cap and shake vigorously
for 30 seconds to dissolve the reagent. Allow the tube to stand for 30 seconds.
Match the pink color with the NO3 color-card, and note the NO3.
• Phosphorus (P2O5) test
Use the pipette to transfer 2.5 ml of the clear general soil extract to a clean test
tube. [Pay attention not to transfer any soil. To avoid agitation of the soil, squeeze
the bulb of the pipette before inserting it into the soil extract solution.] Add the
content of one packet of HI3896-P reagent. Replace the cap and shake vigorously
for 30 seconds to dissolve the reagent. Match the blue color with the P2O5 colorcard, and note the P2O5.
• Potassium (K2O) test
Use the pipette to add 0.5 ml of the clear general soil extract to a clean reaction
tube. [Pay attention not to transfer any soil. To avoid agitation of the soil, squeeze
the bulb of the pipette before inserting it into the soil extract solution.] Fill the tube
to the lower graduation mark (2.5 ml) with the HI3896 Extraction solution. Add
the content of one packet of HI3896-K reagent. Replace the cap and shake
vigorously for 30 seconds to dissolve the reagent. A blue color develops. Read the
TURBIDITY formed on the K2O reading-card as explained in the “Test Procedure”,
and note the K2O.
Note:Note:
Note: prolonged exposure to light may damage the colors of the comparing cards and
Note:Note:
cause them to shift or fade. Please store them out of light when not in use.
Health
& Safety
Contents
2
The chemicals contained in this test kit may be hazardous if improperly handled. Read carefully Health & Safety
Data Sheets before performing the tests. Keep your kit out of reach of children. Store it indoors in a clean, dry location.
Keep away from food, drink and animal feed. Always wash your hands thoroughly after making your tests.
Health and safety data sheets are available on line: www.hannainst.com
240 ml of HI 3896 Extraction solution; 100 ml of HI 3896 pH indicator reagent; 75 powder packets (25 each for N,
P and K); 3 pipettes (1 ml); 5 test tubes; 1 tube-stand; 1 spoon; 1 brush; 4 color cards; 1 graduated card; 1
handbook.
15
Page 3
Test Procedure
4) Depth of extraction:
General: dig and discard the 5 cm (2") of topsoil
For lawns: take the sample at a depth of 5 to 15 cm (from 2" to 6").
For other plants (flowers, vegetables, shrubs): from 20 to 40 cm of depth (8" to 16")
For trees: Samples from 20 to 60 cm of depth (8" to 24'’).
5) Mix all the samples together to obtain a homogeneous mixture of soil.
6) From this mixture, take the quantity of dried soil that you need for the analysis,
discarding stones and vegetable residues.
1) Reading the color-card
– The pH, phosphorus (P2O5), and nitrogen (NO3) tests are colorimetric tests. During
the test a color is developed which corresponds with the fertility of the soil for e.g.
P2O5. To read the fertility, the color developed has to be compared with a colorcard.
To match the color, hold the tube with the test solution approximately 2 cm away
from the color-card. Stand with the light source behind the card and read: Trace,
Low, Medium or High. If the color of the test tube falls between two standard
colors, e.g. between Medium and High Report the test result as Medium-High.
Eight different readings are possible, Trace, Trace-Low, Low, Low-Medium, Medium,
Medium-High, High, and very-High.
– The potassium (K2O) test is a turbidimetric test. If potassium is present, turbidity
is formed. A blue color will also develop to help reading the test result.
To read the test result, hold the tube against the reading-card over the reading
area. Stand with the light source behind your back. Start at Trace, looking through
the tube, and go to Low, Medium or High until you just can see the white line in
the middle of the reading area. Report the reading only in Trace, Low, Medium or
High.
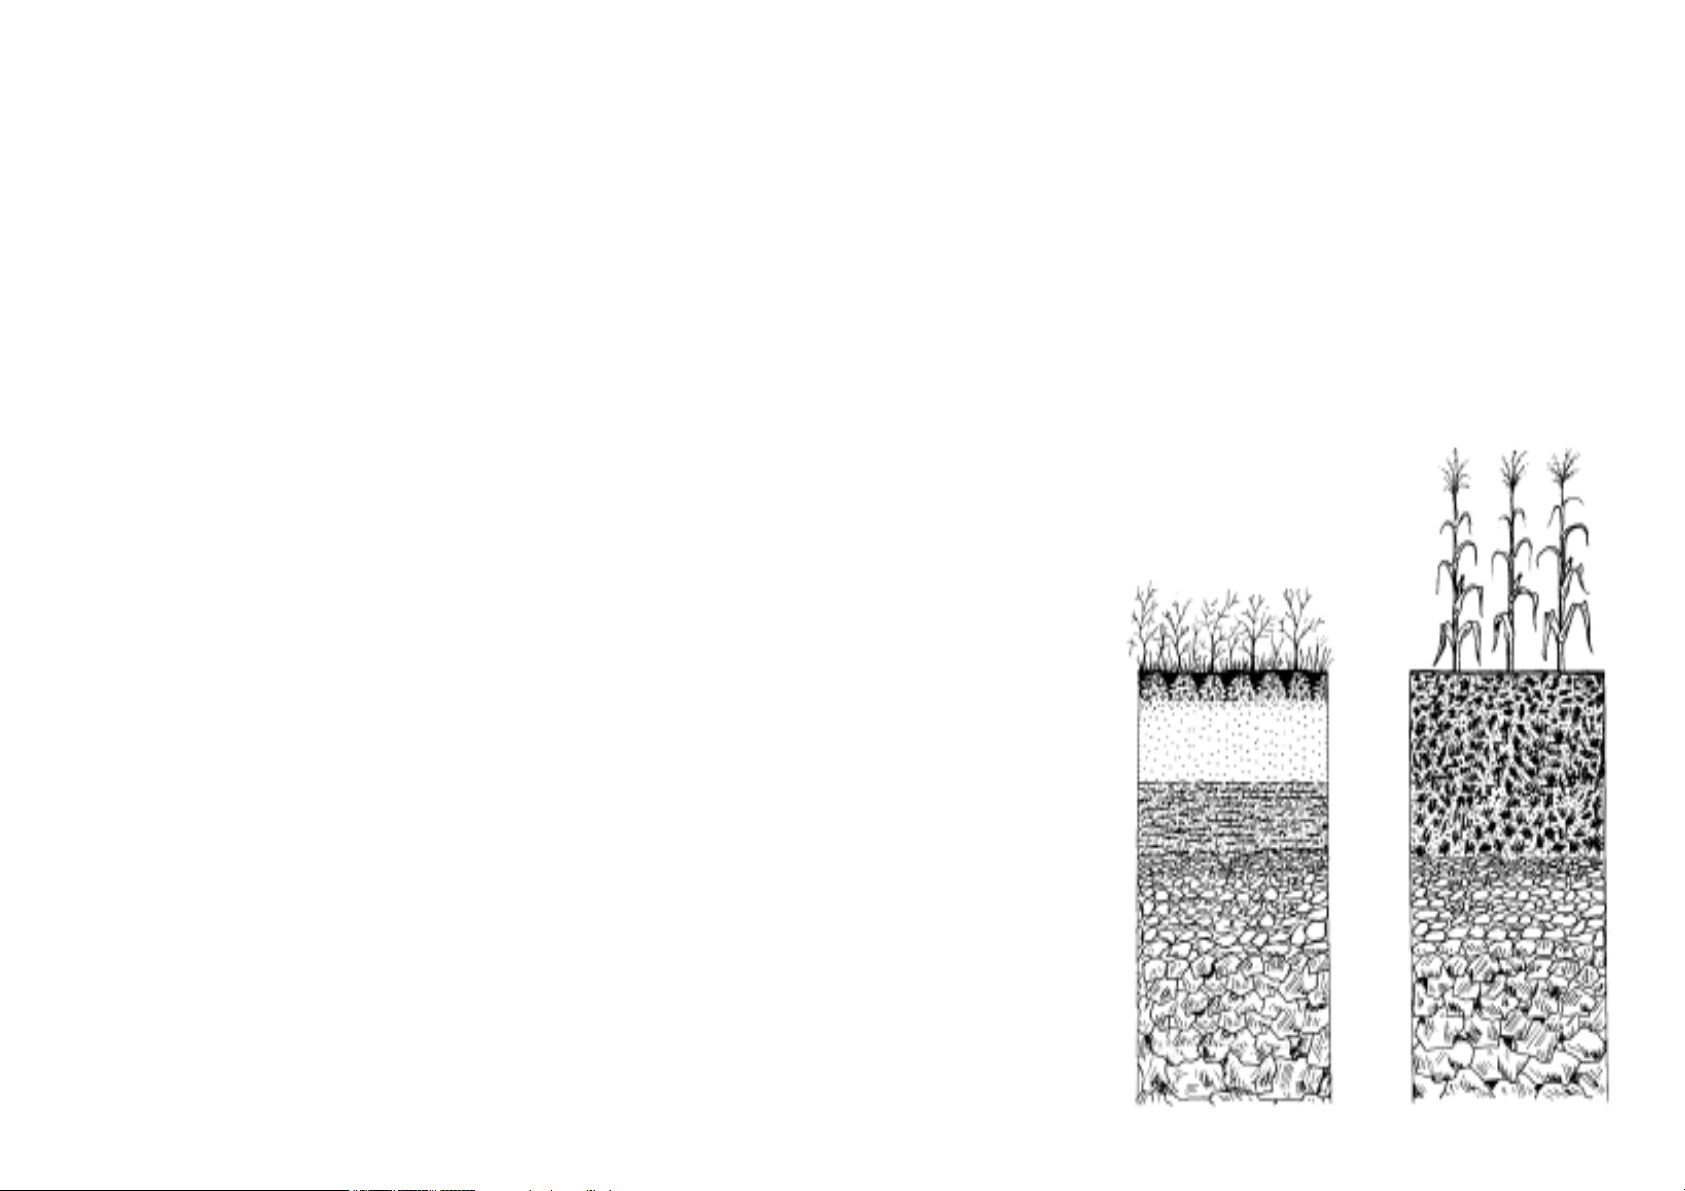
SOIL AND PLANT LIFE
Fig. 1. Fig. 1.
Fig. 1. Stratography of a
Fig. 1. Fig. 1.
natural soil (left) and of a
cultivated soil (right)
(L.Giardini)
Soil is very important for the plants. It is not merely a support system, but a complex world
from which the roots obtain water and other required elements. In addition, soil is
inhabited by small animals, insects, microorganisms (e.g. fungi and bacteria) which all
influence the plant life in one way or another.
One can talk about a soil evolution, that is, change in its characteristics based upon
climate, presence of animals and plants as well as man’s action. Therefore, a natural soil,
in which evolution is slow, is very different from a cultivated one.
Soil is composed of solids (minerals and organic matters), liquids (water and dissolved
substances), gases (mostly oxygen and carbon dioxide) and contains living organisms. All
these elements provide its physical and chemical properties.
Managing the soil properly is necessary in order to preserve its fertility, obtain better yield
and respect the environment. Testing the soil on the other hand is a must in order to
manage it properly.
14
2) Performing the tests
– pH test
Fill a reaction tube up to the lower graduation mark (2.5 ml) with the HI 3896 pH
indicator reagent (use the graduated card for the measure). Use the small spoon to
add six measures of soil sample. Replace the cap and shake gently for one minute.
Allow the tube to stand for 5 minutes (use the tube-stand). Match the color with
the pH color-card, and note the pH value.
– Nitrogen (N), Phosphorus (P), Potassium (K)
• General Extraction procedure [for the P, N, and K tests]
Fill a reaction tube to the third graduation mark (7.5 ml) with the HI3896
Extraction solution. Use the small spoon to add the following: nine measures of soil
sample, in case of field soil testing; six measures of soil sample, in case of garden
soil testing.
Replace the cap and shake gently for one minute.
3
Page 4

PHYSICAL STRUCTURE
Tab. 1. Particles
classification according to
“International Society of
Soil Science” (ISSS)
Fig. 2. Types of soil in
relation to the texture
The physical structure of the soil depends on the dimension of the particles of its make up
(Tab. 1). In addition, the particles also differ based on their shape and volumic mass (mass
per unit of volume)
DIAMETER OF THE PARTICLES (mm) CLASSIFICATION
> 2 stony texture
2 - 0.2 coarse sand
0.2 - 0.02 fine sand
0.02 - 0.002 silt
< 0.002 clay
Soil is divided into many classes of texture, according to the percentage of the basic
particles (clay, sand and silt). If, for example, we have a soil with 37% clay, 38% sand
and 25% silt, the soil is classified as “clay loam” (Fig. 2).
Tab. 7.
CROP SOIL CONTENT ADVISED DOSES (kg/ha)
N P2O
Apple very low 150 120 230
low 130 90 150
medium 110 70 120
medium-high 90 50 90
high 80 40 60
very high 70 20 40
Grape very low 150 90 230
low 120 70 180
medium 100 60 150
medium-high 90 40 120
high 80 30 90
very high 70 20 60
Peach very low 200 120 230
low 160 90 150
medium 140 70 120
medium-high 120 50 90
high 100 40 60
very high 80 20 40
Pear very low 150 120 230
low 130 90 150
medium 110 70 120
medium-high 90 50 90
high 80 40 60
very high 70 20 40
5
K2O
(data ESAV)
SOIL ANALYSIS
The soil analysis is very useful, in order to plan fertilization and to know the residues of
fertilizers in relation to the crop, tillage and climate. An analysis can highlight shortages
and help the understanding of the causes of an abnormal growth.
Testing the soil during the crop cycle and comparing the results with the plant growth can
be an useful experiment for the next cultivation.
Sampling
1) Extracting Soil Sample
– With a large field, take 1 or 2 samples per 1000 m2 (0.25 acre) of homogeneous
areas.
– Even for smaller areas, 2 samples are recommended (the more the samples, the
better the end-results, because the sample is more representative)
– For a small garden or plot, 1 sample is sufficient
Among different types of soil, the loam soil is considered as being suitable for crop
growth. However, other types of soil, with a rational management, can also provide
positive results.
The soil texture is the cause of important aspects such as porosity, tenacity, adhesivity
2) Avoid extracting samples from soil presenting obvious anomalies
3) Sample quantity:
Take the same quantity of soil for each sample. For example, use bags with similar
dimensions (1 bag per sample)
and plasticity.
4
13
Page 5

Tab. 7.
CROP SOIL CONTENT ADVISED DOSES (kg/ha)
N P2O
Asparagus very low 160 120 180
low 120 100 150
medium 100 70 130
medium-high 90 50 110
high 80 40 90
very high 70 20 80
Barley very low 140 130 170
low 110 90 120
medium 90 70 80
medium-high 80 50 60
high 70 40 50
very high 60 30 40
Corn silage very low 340 200 230
low 300 150 150
medium 280 120 120
medium-high 260 90 90
high 240 60 60
very high 220 40 46
Maize very low 300 200 230
low 270 150 150
medium 240 120 120
medium-high 230 90 90
high 210 60 60
very high 200 40 40
Soybean very low 0 150 220
low 0 130 170
medium 0 100 130
medium-high 0 80 100
high 0 60 80
very high 0 40 60
Sugar beet very low 160 150 230
low 120 130 180
medium 100 100 150
medium-high 90 80 120
high 80 60 90
very high 70 40 60
Tomato very low 150 250 250
low 130 180 200
medium 110 150 150
medium-high 90 120 120
high 80 90 90
very high 70 60 60
Wheat very low 180 150 170
low 160 100 120
medium 150 80 80
medium-high 140 60 60
high 130 50 50
very high 120 40 40
5
K2O
CHEMICAL
COMPOSITION
pH
Fig. 3. Types of soil
according to the pH value
Porosity is important for the exchange of gases and liquids. Micro-porosity (porous < 2 10 µm) permits water to be retained while macro-porosity (porous > 10 µm) contributes to a fast circulation of air and water.
Plants therefore are in need of a correct relationship between micro and macro porosity.
Clay soils have a greater micro-porosity than sandy soils and hence hold more water and
remain wet for a longer period.
Because of the greater tenacity and adhesivity of clay soils, they are called heavy while
sandy soils are referred to as light.
Organic matter, caused by animal and vegetable residues, is another important constituent
of the solid part of the soil. Organic matter has a positive effect on the soil fertility by
adding nutrients, stabilizing the pH reaction and permitting a good retainment of water.
Organic matter is also important for the activity of microorganisms and, in general,
contributes towards prevention of soil erosion.
The colloidal portion, composed of micro-particles (1-100 µm), is important for holding
nutrients. Since most of these particles have a negative charge, the colloidal portion has a
particularly large capacity to retain cations (NH
+
, K+, Na+, Ca++, Mg++, etc.). The CEC
4
(Cation Exchange Capacity) is higher in soils rich with clay and organic matter than in
sandy soils.
The chemical composition of soil includes pH and chemical elements. Their analysis is
necessary for better management of fertilization, tillage and in order to choose the most
suitable plants for best results.
By using the HANNA Soiltest, it is possible to measure pH and the most important
elements for plant growth, that is, nitrogen (N), phosphorus (P) and potassium (K).
pH is the measure of the hydrogen ion concentration [H+]. A soil can be acid, neutral or
alkaline, according to its pH value.
Fig. 3 shows the relationship between the scale of pH and kind of soil. The pH range from
5.5 to 7.5 include the most of plants; but some species prefer acid or alkaline soils.
Nevertheless, every plant need a particular range of pH, in which can better express its
potentiality of growth.
pH strongly influences the availability of nutrients and the presence of microorganisms
and plants in the soil.
12
5
Page 6

Fig. 4. Solubility of the
elements according to
varying pH values
For example, fungi prefer acidic conditions whereas most bacteria, especially those putting nutrients at the plants’ disposition, have a preference for moderately acidic or slightly
alkaline soils. In fact, in strongly acidic conditions, nitrogen fixing and the mineralization
of vegetable residual is reduced.
Plants absorb the nutrients dissolved in the soil water and the nutrient solubility depends
largely on the pH value. Hence, the availability of elements is different at different pH
levels (Fig. 4).
Each plant needs elements in different quantities and this is the reason why each plant
requires a particular range of pH to optimize its growth.
For example, iron, copper and manganese are not soluble in an alkaline environment. This
means that plants needing these elements should theoretically be in an acidic type of soil.
Nitrogen, phosphorus, potassium and sulfur, on the other hand, are readily available in a
pH range close to neutrality.
Tab.6.
CROP YIELD Nitrogen Phosphorus Potassium
(q/ha) N (kg/ha) P2O5 (kg/ha) K2O (kg/ha)
Garlic 100 80 30 60
Lettuce 200 60 35 100
Maize (grain) 120 160 65 80
Melon 350 180 65 260
Onion 350 150 60 160
Pea 50 190 55 170
Pepper 250 100 35 130
Potato 350 140 55 220
Rice (whole plant) 60 100 45 95
Soybean 40 300 70 35
Spinach 250 120 40 130
Strawberry 150 165 60 265
Sunflower 30 130 45 145
Sugar beet 600 170 75 250
Tobacco (leaves) 24 85 55 230
Tomato 500 150 60 290
Watermelon 600 110 45 190
Soft Wheat (whole plant) 60 170 25 100
Hard Wheat (whole plant) 45 130 20 80
Apple 350 90 33 130
Apricot 150 110 35 125
Cherry 75 50 20 75
Grapevine 150 70 35 115
Grapefruit 300 130 45 180
Lemon 200 45 20 70
Olive 50 50 20 65
Orange 250 70 25 100
Peach 200 130 30 130
Pear 250 70 15 80
Plum 180 100 20 90
The relationship between dosages of fertilizer elements and their presence in the soil is
shown in Tab. 7. As above, the quantities reported are only indicative. Chemical
analysis can be used as a basis for the evaluation, however other factors connected with
the production also need to be considered.
Tab. 7. Relation between
dosages of fertilizer
Furthermore, abnormal pH values, increase the concentration of toxic elements for plants.
For example, in acid conditions, there can be an excess of aluminum ions in such quantities
elements and their presence
in the soil
that the plant can not tolerate. Negative effects on chemical and physical structure are
also present when pH values are too far from neutral conditions (break up of aggregates,
a less permeable and more compact soil).
6
CROP SOIL CONTENT ADVISED DOSES (kg/ha)
N P2O
Alfalfa very low 0 150 230
low 0 130 150
medium 0 100 120
medium-high 0 80 90
high 0 60 60
very high 0 40 40
5
K2O
11
Page 7

Tab.5. Composition of
manure
Top dressing
Tab.6. Experimental
average quantity of
elements absorbed based on
crop yield
It is important to note that whereas an insufficient dose of nutrients decreases the potential
crop production, an excess can have a negative effect on the physiology of the plants and
the crop quality. In addition, too much fertilization can be unnecessarily costly as well as
being harmful to the environment.
Before sowing or transferring plants, use a slow-acting fertilizer to enrich the soil for long
term. This is particularly important for Nitrogen which unlike Phosphorus and Potassium
tends to become less present over time. Compound fertilizers which contain nitrogen
(preferred in ammonium form), phosphorus and potassium can also be used.
Adding organic substances (such as manure and compost) help to increase the soil fertility
(Tab. 5).
ELEMENT QUANTITY (%)
N 0.4-0.6
P2O
5
0.2-0.3
K2O 0.6-0.8
CaO 0.5-0.6
MgO 0.15-0.25
SO
3
0.1-0.2
If possible, add the fertilizer more than once. In case of lack of Nitrogen, use fertilizers
containing Nitrate due to their faster absorption by the plants. It is important to add the
necessary elements at particular phases in the plant’s life cycle (for example, before
sprouting or wheat raising).
Do not give nitrate to crops such as lettuce (in which the product is the vegetable part) at
the end of the plant cycle, in order to avoid their accumulation in the leaves (nitrate is
carcinogenic).
Tab. 6 below shows average quantity of element absorbed by the principal crops based on
their yield (note that the relationship between absorption and fertilization is not exact).
CROP YIELD Nitrogen Phosphorus Potassium
(q/ha) N (kg/ha) P2O5 (kg/ha) K2O (kg/ha)
Alfalfa 120 280 75 300
Asparagus 50 125 40 110
Barley (whole plant) 60 110 25 95
Bean 100 130 40 100
Cabbage 200 110 60 150
Carrot 300 130 55 200
Colza 30 175 70 140
Management of the
Soil in Relation with
the pH Value
Tab.2. Quantity (q/ha) of
pure compound necessary to
increase 1 unit of pH
Tab.3. Quantities provide
the same result as 100 Kg
of gypsum
Once the pH value is known, it is advisable to choose crops that are indicated for this range
(e.g. in an acid soil, cultivate rice, potato, strawberry).
Add fertilizers that at the same time do not increase acidity (for example urea, calcium
nitrate, ammonium nitrate and superphosphate) or lower alkalinity (e.g. ammonium
sulfate).
It is recommended that a cost evaluation is made prior to commencement of the modification of the soil pH. Corrective substances can be added in order to modify the soil pH,
however, the effects are generally slow and not persistent. For example, by adding lime,
the effects in clay soil can last for as long as 10 years, but only 2-3 years in a sandy soil.
For an acid soil, we can use substances such as lime, dolomitic, limestone and marl,
according to the nature of the soil (Tab. 2).
SOIL AMELIORANTS CLAY SOIL SILTY SOIL SANDY SOIL
CaO 30-50 20-30 10-20
Ca(OH)
2
CaMg(CO3)
Ca CO
3
2
39-66 26-39 13-26
49-82 33-49 16-33
54-90 36-54 18-36
High pH levels can depend on different elements, hence, there are different methods
for its correction.
– Soils rich with limestone:
Add organic matter (this is due to the fact that non-organic ameliorants such as
sulfur and sulfuric acid might not make economic sense due to the large quantities
needed).
– Alkaline-saline soils:
Alkalinity is due to the presence of salts (in particular a high concentration of
sodium can be harmful).
Irrigation washes away salts hence an appropriate use of irrigation can provide positive
results (drop-irrigation being the most recommended).
If alkalinity is caused by sodium, it is recommended to add substances such as gypsum
(calcium sulfate), sulfur or other sulfuric compounds (Tab. 3). Also in this case, a cost
evaluation is necessary.
Soil ameliorants (pure compounds) Quantity (Kg)
Calcium chloride: CaCl2 · 2H2O 85
Sulfuric acid: H2SO
4
57
Sulfur: S 19
Iron sulfate: Fe2(SO4)3 · 7H2O 162
Aluminum sulfate: Al2(SO4)
3
129
10
7
Page 8

Tab.4. Range of preferred
pH
PLANTS pH
ORCHARD
Apple 5-6.5
Apricot 6-7
Cherry 6-7.5
Grapefruit 6-7.5
Grapevine 6-7
Lemon 6-7
Nectarine 6-7.5
Orange 5-7
Peach 6-7.5
Pear 6-7.5
Plum 6-7.5
Pomegranate 5.5-6.5
Walnut 6-8
VEGETABLES AND HERBACEOUS
CULTIVATIONS
Artichoke 6.5-7.5
Asparagus 6-8
Barley 6-7
Bean 6-7.5
Brussels Sprout 6-7.5
Early carrot 5.5-7
Late carrot 5.5-7
Cucumber 5.5-7.5
Egg Plant 5.5-7
Lettuce 6-7
Maize 6-7.5
Melon 5.5-6.5
Oat 6-7
Onion 6-7
Pea 6-7.5
Pepper 6-7
Early Potato 4.5-6
Late Potato 4.5-6
Sweet Potato 5.5-6
Pumpkin 5.5-7.5
Rice 5-6.5
Soybean 5.5-6.5
Spinach 6-7.5
Strawberry 5-7.5
String 6-7.5
Sugar beet 6-7
Sunflower 6-7.5
Tomato 5.5-6.5
Watermelon 5.5-6.5
Wheat 6-7
LAWN
Lawn 6-7.5
PLANTS pH
GARDEN PLANTS AND FLOWERS
Acacia 6-8
Acanthus 6-7
Amaranth 6-6.5
Bougainvillea 5.5-7.5
Dahlia 6-7.5
Erica 4.5-6
Euphorbia 6-7
Fuchsia 5.5-7.5
Gentian 5-7.5
Gladiolus 6-7
Hellebore 6-7.5
Hyacinth 6.5-7.5
Iris 5-6.5
Juniper 5-6.5
Ligustrum 5-7.5
Magnolia 5-6
Narcissus 6-8,5
Oleander 6-7.5
Peony 6-7.5
Paulownia 6-8
Portulaca 5.5-7.5
Primula 6-7.5
Rhododendron 4.5-6
Roses 5.5-7
Sedum 6-7.5
Sunflower 6-7.5
Tulip 6-7
Viola 5.5-6.5
HOUSEPLANTS
Abutilon 5.5-6.5
African violet 6-7
Anthurium 5-6
Araucaria 5-6
Azalea 4.5-6
Begonia 5.5-7.5
Camellia 4.5-5.5
Croton 5-6
Cyclamen 6-7
Dieffenbachia 5-6
Dracaena 5-6
Freesia 6-7.5
Gardenia 5-6
Geranium 6-8
Hibiscus 6-8
Jasmine 5.5-7
Kalanchoe 6-7.5
Mimosa 5-7
Orchid 4.5-5.5
Palms 6-7.5
Peperomia 5-6
Philodendron 5-6
Yucca 6-7.5
Nutrients
Nitrogen
Phosphorus
Potassium
Fertilization
The three elements that are most needed by plants are nitrogen (N), phosphorus (P) and
potassium (K). This is the reason why they are called macronutrients and should be given
to the plants. Other elements, the so-called microelements are generally present in
sufficient quantities in the soil and the plants need them in smaller doses.
Nitrogen is an indispensable element for the plant’s life and is a key factor in fertilization.
It is present in proteins, vitamins, hormones, chlorophyll, etc. Nitrogen allows the development of the vegetative activity of the plant, in particular, causes a lengthening of trunks
and sprouts and increases the production of foliage and fruits (even though the quality
depends by other elements). An excess of Nitrogen weakens the plants’ structure creating
an unbalanced relationship between the green parts and the wooden parts. In addition, the
plant becomes less resistant to diseases.
The nitrogen adsorbed by the plants derives from the mineralization of organic matter and
the application of fertilizers, but legumes (soybean, pea, clover, alfalfa, etc.) are able to
take nitrogen by a symbiotic association with Rhizobium bacteria.
The fact that nitrate (the nitrogen chemical compound that the plants absorb mostly) is not
durable in the soil and the large amount required for crop production, make it necessary to
add this element, avoiding excesses.
Phosphorus is an important element in the composition of DNA and RNA, the regulators
of the energetic exchange (ATP, ADP), as well as the reserve substances in seeds and bulbs.
It contributes to the formation of buds, roots and blooming as well as lignification. A lack
of phosphorus results in: stifling of plant, slow growth, a reduction of production, smaller
fruits and a lower expansion of the roots.
Most of the Phosphorus present in the soil is not available for plants and its release in the
soil solution from which it is taken, is very slow.
Therefore, in order to avoid an impoverishment of the soil, and to give to the plants the
appropriate quantity, a rational fertilization is needed.
Even if potassium is not a constituent of important compounds, it plays a remarkable role
in many physiological activities like the control of the cellular turgor and the accumulation
of carbohydrates. In addition, it increases the size of fruits, their flavor as well as yielding
a positive effect on the color and fragrance of flowers. Potassium also makes plants more
resistant to diseases.
Generally speaking, potassium is normally retained by the soil and the losses are caused
by plant absorption or erosion. In sandy soils however the level may be inadequate.
The quantity of substances to add to the soil, depends not only on the chemical state of the
soil but also on factors such as local climate, the physical structure, previous and present
cultivation, microbiological activities etc. Hence, only after a technical and economical
evaluation, it is possible choose the proper quantity of fertilizer to add.
8
9
 Loading...