

HAMAMATSU R3788, R4332 Datasheet
High Sensitivity, Bialkali Photocathode
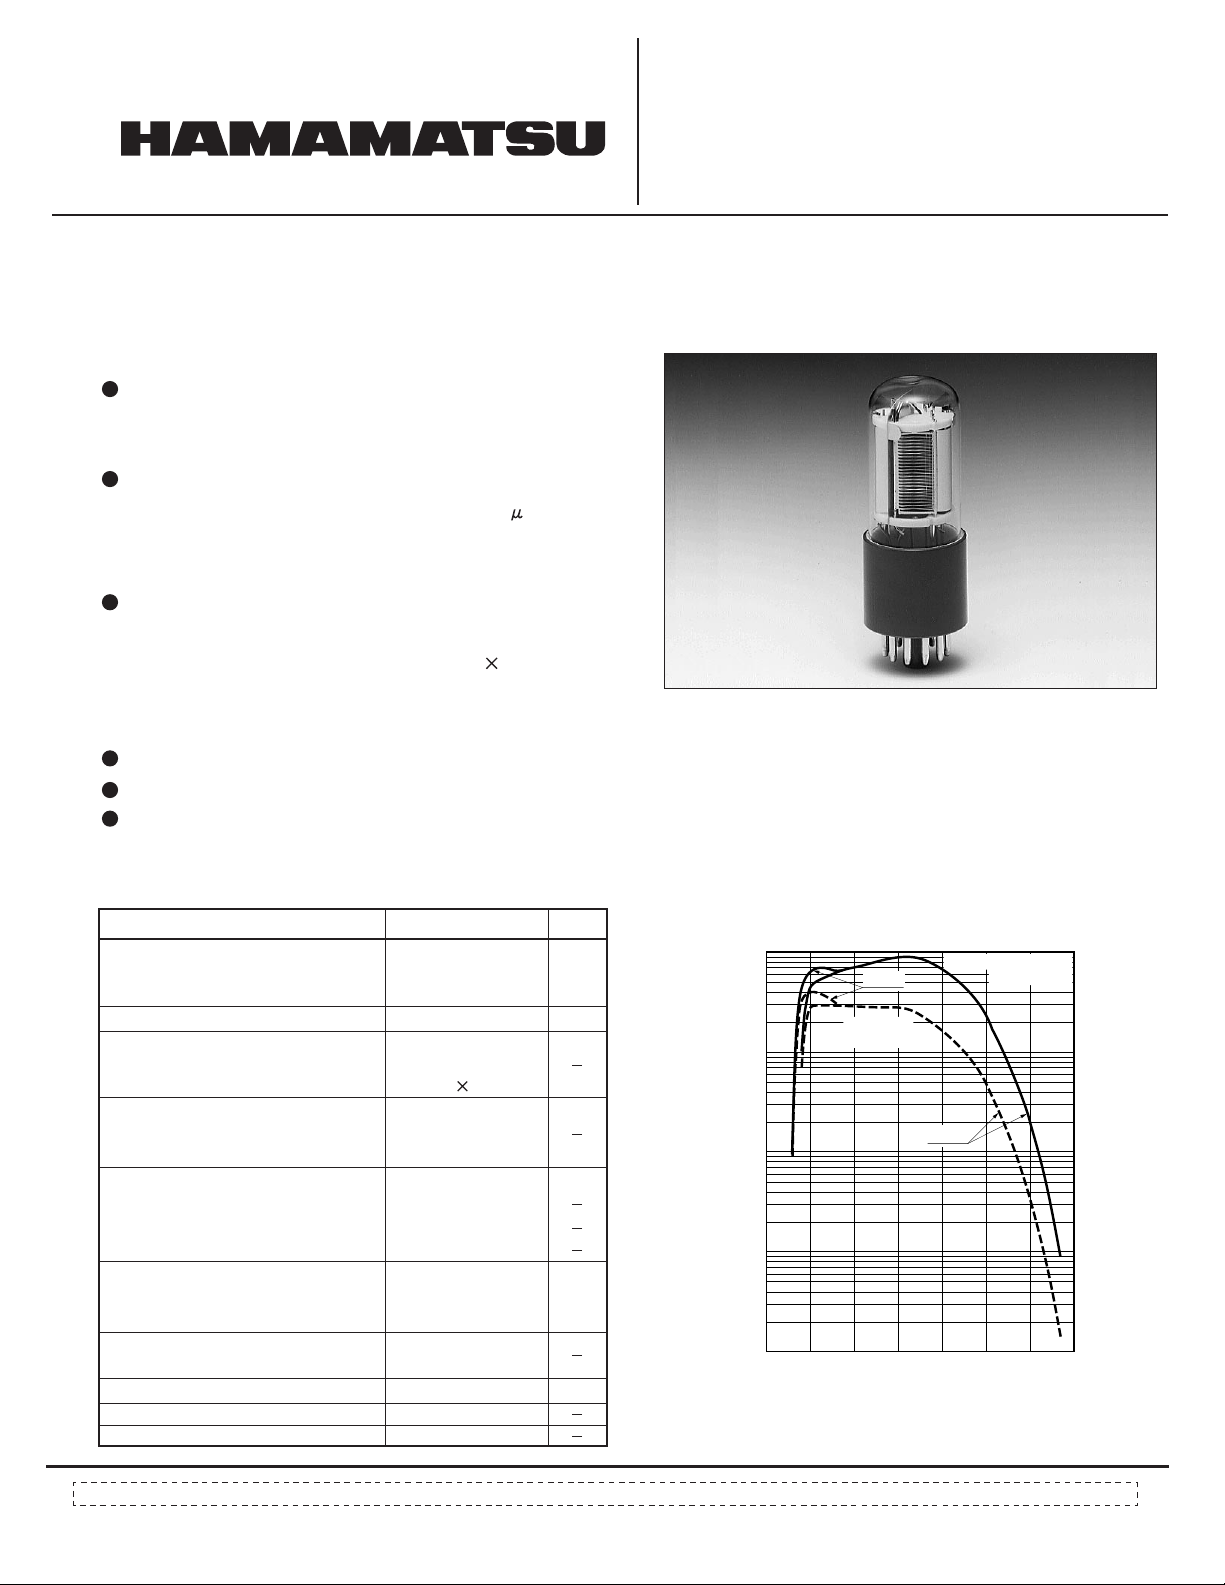
28mm (1-1/8 Inch) Diameter, 9-Stage, Side-On Type
FEATURES
Spectral Response
R3788 ....................................................
R4332 .....................................................
High Cathode Sensitivity
Luminous ...........................................
Radiant at 420nm ..................................
Quantum Efficiency at 210nm .........
High Anode Sensitivity (at 1000V)
Luminous ...............................................
Radiant at 420nm ............................
185 to 750 nm
160 to 750 nm
120 A/lm Typ.
90mA/W Typ.
40% Typ. (R4332)
1200A/lm Typ.
5
9.0 10
A/W Typ.
PHOTOMULTlPLlER TUBES
R3788, R4332
APPLICATIONS
Fluorescence Spectrophotometers
Emission Spectrophotometers
Atomic Absorption Spectrophotometers
GENERAL
Parameter Description Unit
Spectral Response
R3788
R4332
Wavelength of Maximum Response
Photocathode
MateriaI
Minimum Effective Area
Window Material
R3788
R4332
Dynode
Secondary Emitting Surface
Structure
Number of Stages
Direct Interelectrode Capacitances
Anode to Last Dynode
Anode to All Other Electrodes
Base
Weight
SuitabIe Socket
SuitabIe Socket Assembly
JEDEC No. B11-88
E678–11A (option)
E717–21(option)
185 to 750 nm
160 to 750 nm
420
Bialkali
8 24
UV glass
Fused silica
Bialkali
Circular-cage
9
4pF
6pF
11-pin base
45
nm
mm
g
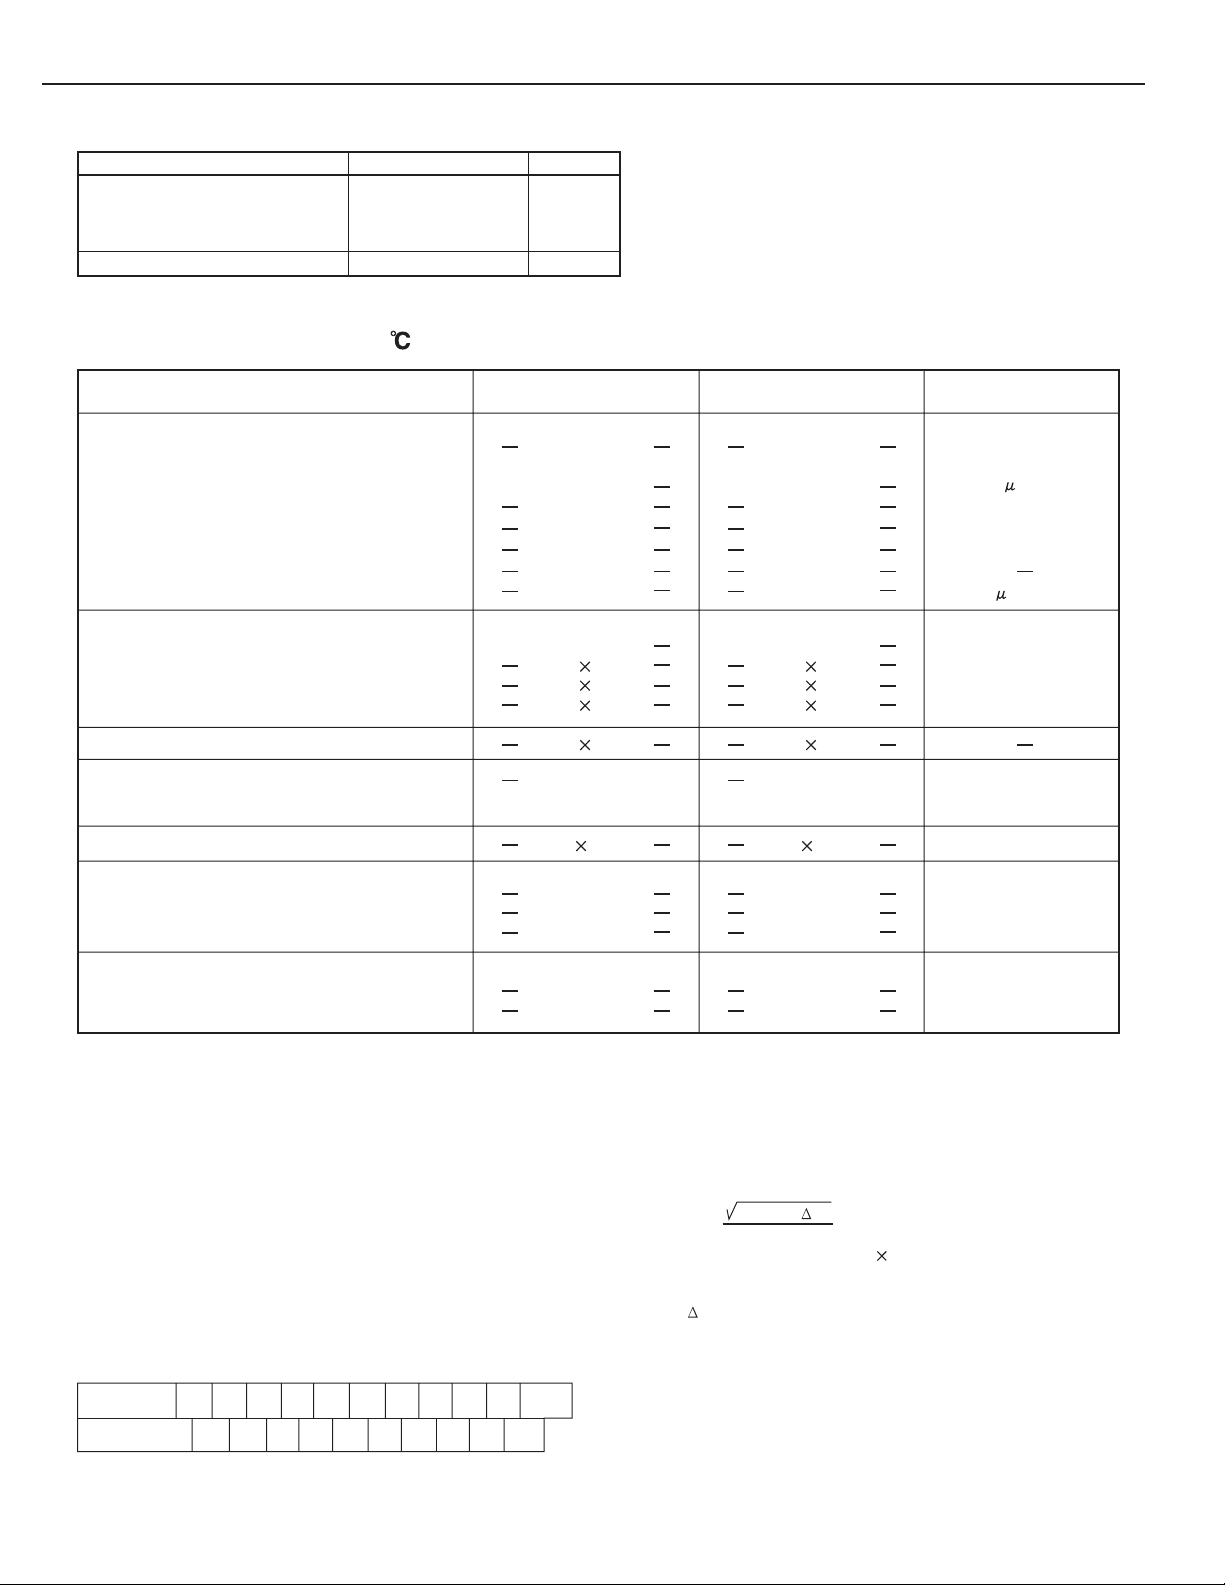
Figure 1: Typical Spectral Response
TPMSB0081EA
100
R4332
QUANTUM
10
1
QUANTUM EFFICIENCY (%)
0.1
PHOTOCATHODE RADIANT SENSITIVITY (mA/W)
0.01
100 200 300 400 500 600 700 800
EFFICIENCY
WAVELENGTH (nm)
CATHODE RADIANT
R3788
SENSITIVITY
Subject to local technical requirements and regulations, availability of products included in this promotional material may vary. Please consult with our sales office.
Information furnished by HAMAMATSU is believed to be reliable. However, no responsibility is assumed for possible inaccuracies or omissions. Specifications are
subject to change without notice. No patent rights are granted to any of the circuits described herein. © 1994 Hamamatsu Photonics K.K.
PHOTOMULTlPLlER TUBES R3788, R4332
MAXIMUM RATINGS (Absolute Maximum Values)
Parameter Value
Supply Voltage
Between Anode and Cathode
Between Anode and Last Dynode
Average Anode Current
A
CHARACTERISTlCS (at 25 )
1250
250
0.1
Unit
Vdc
Vdc
mA
Parameter
Min. Max.
Cathode Sensitivity
Quantum Efficiency at Peak Wavelength
(at 250nm)
Luminous
B
100 120
Radiant at 194nm 31
210nm 50
420nm 90
Red/White Ratio
D
Blue
Anode Sensitivity
Luminous
C
E
Radiant at 194nm
210nm
420nm
E
Gain
Anode Dark Current
F
(After 30minutes Storage in the darkness)
ENI(Equivalent Noise Input)
Time Response
E
Anode Pulse Rise Time
Electron Transit Time
Transit Time Spread (TTS)
Anode Current Stability
G
H
I
J
K
1.4 10
Light Hysteresis
Voltage Hysteresis
R3788
Typ.
30
0.01
10
1200500
5
3.1 10
5
5.0 10
5
9.0 10
7
1.0 10
550
-16
2.2
22
1.2
0.1
1.0
R4332
Min. Max.
Typ.
40
Unit
%
(at 210nm)
100 120 A/lm
60 mA/W
68 mA/W
90 mA/W
0.01
10 A/lm-b
1200 A/lm500
5
6.0 10
6.8 10
9.0 10
1.0 10
5
5
7
A/W
A/W
A/W
550 nA
-16
1.4 10
2.2
22
1.2
0.1
1.0
W
ns
ns
ns
%
%
NOTES
Averaged over any interval of 30 seconds maximum.
A:
The light source is a tungsten filament lamp operated at a distribution tem-
B:
perature of 2856K. Supply voltage is 100 volts between the cathode and
all other electrodes connected together as anode.
Red/White ratio is the quotient of the cathode current measured using a
C:
red filter(Toshiba R-68) interposed between the light source and the tube
by the cathode current measured with the filter removed under the same
conditions as Note B.
The value is cathode output current when a blue filter(Corning CS-5-58
D:
polished to 1/2 stock thickness) is interposed between the light source and
the tube under the same condition as Note B.
Measured with the same light source as Note B and with the voltage distri-
E:
bution ratio shown in Table 1 below.
Table 1:Voltage Distribution Ratio
Electrodes K Dy1 Dy2 Dy3 Dy4 Dy5 Dy6 Dy7 Dy8 Dy9 P
Distribution
Ratio
SuppIy Voltage : 1000Vdc
K : Cathode, Dy : Dynode, P : Anode
1111111111
F:
Measured with the same supply voltage and voltage distribution ratio as
Note E after removal of light.
ENI is an indication of the photon-limited signal-to-noise ratio. It refers to
G:
the amount of light in watts to produce a signal-to-noise ratio of unity in the
output of a photomultiplier tube.
ENI =
where q = Electronic charge (1.60 10
ldb = Anode dark current(after 30 minutes storage) in amperes.
G = Gain.
f = Bandwidth of the system in hertz. 1 hertz is used.
S = Anode radiant sensitivity in amperes per watt at the wave length of peak response.
H:
The rise time is the time for the output pulse to rise from 10% to 90% of the
peak amplitude when the entire photocathode is illuminated by a delta
function light pulse.
2q.ldb.G
S
.
f
-19
coulomb).
 Loading...