

Page 1

Network Management and Monitoring
Hangzhou H3C Technologies Co., Ltd.
http://www.h3c.com
Software version: SR8800-CMW520-R3347
Document version: 6W103-20120224
H3C SR8800 10G Core Routers
Configuration Guide
Page 2

Copyright © 2011-2012, Hangzhou H3C Technologies Co., Ltd. and its licensors
All rights reserved
No part of this manual may be reproduced or transmitted in any form or by any means without prior
written consent of Hangzhou H3C Technologies Co., Ltd.
Trademarks
3
H3C, , Aolynk, , H
Care, , TOP G, , IRF, NetPilot, Neocean, NeoVTL,
SecPro, SecPoint, SecEngine, SecPath, Comware, Secware, Storware, NQA, VVG, V
XGbus, N-Bus, TiGem, InnoVision and HUASAN are trademarks of Hangzhou H3C Technologies Co.,
Ltd.
All other trademarks that may be mentioned in this manual are the property of their respective owners
Notice
The information in this document is subject to change without notice. Every effort has been made in the
preparation of this document to ensure accuracy of the contents, but all statements, information, and
recommendations in this document do not constitute the warranty of any kind, express or implied.
2
G, VnG, PSPT,
Page 3

Preface
The H3C SR8800 documentation set includes 13 configuration guides, which describe the software
features for the H3C SR8800 10G Core Routers and guide you through the software configuration
procedures. These configuration guides also provide configuration examples to help you apply software
features to different network scenarios.
The Network Management and Monitoring Configuration Guide describes how to manage the network,
view system information, collect traffic statistics, sample packets, analyze network quality, and use the
ping, tracert, and debugging commands to examine and debug network connectivity.
This preface includes:
• Audience
• Conventions
• About the H3C SR8800 documentation set
• Obtaining documentation
• Technical support
• Documentation feedback
Audience
This documentation is intended for:
• Network planners
• Field technical support and servicing engineers
• Network administrators working with the SR8800 series
Conventions
This section describes the conventions used in this documentation set.
Command conventions
Convention Description
Boldface Bold text represents commands and keywords that you enter literally as shown.
Italic Italic text represents arguments that you replace with actual values.
[ ] Square brackets enclose syntax choices (keywords or arguments) that are optional.
{ x | y | ... }
[ x | y | ... ]
Braces enclose a set of required syntax choices separated by vertical bars, from which
you select one.
Square brackets enclose a set of optional syntax choices separated by vertical bars, from
which you select one or none.
{ x | y | ... } *
[ x | y | ... ] *
Asterisk marked braces enclose a set of required syntax choices separated by vertical
bars, from which you select at least one.
Asterisk marked square brackets enclose optional syntax choices separated by vertical
Page 4

Convention Description
gory
bars, from which you select one choice, multiple choices, or none.
&<1-n>
# A line that starts with a pound (#) sign is comments.
GUI conventions
Convention Description
Boldface
> Multi-level menus are separated by angle brackets. For example, File > Create > Folder.
Symbols
Convention Description
WARNING
CAUTION
IMPORTANT
NOTE
The argument or keyword and argument combination before the ampersand (&) sign can
be entered 1 to n times.
Window names, button names, field names, and menu items are in Boldface. For
example, the New User window appears; click OK.
An alert that calls attention to important information that if not understood or followed can
result in personal injury.
An alert that calls attention to important information that if not understood or followed can
result in data loss, data corruption, or damage to hardware or software.
An alert that calls attention to essential information.
An alert that contains additional or supplementary information.
TIP
An alert that provides helpful information.
Network topology icons
Represents a generic network device, such as a router, switch, or firewall.
Represents a routing-capable device, such as a router or Layer 3 switch.
Represents a generic switch, such as a Layer 2 or Layer 3 switch, or a router that supports
Layer 2 forwarding and other Layer 2 features.
Port numbering in examples
The port numbers in this document are for illustration only and might be unavailable on your router.
About the H3C SR8800 documentation set
The H3C SR8800 documentation set includes:
Cate
Product description and
specifications
Documents
Marketing brochures
Technology white papers
Purposes
Describe product specifications and benefits.
Provide an in-depth description of software features
and technologies.
Page 5

Category Documents
Card datasheets Describe card specifications, features, and standards.
Purposes
Hardware specifications
and installation
Software configuration
Operations and
maintenance
Compliance and safety
manual
Installation guide
H3C N68 Cabinet
Installation and Remodel
Introduction
H3C Pluggable SFP
[SFP+][XFP] Transceiver
Modules Installation
Guide
H3C High-End Network
Products Hot-Swappable
Module Manual
Configuration guides
Command references Provide a quick reference to all available commands.
Release notes
Provides regulatory information and the safety
instructions that must be followed during installation.
Provides a complete guide to hardware installation
and hardware specifications.
Guides you through installing and remodeling H3C
N68 cabinets.
Guides you through installing SFP/SFP+/XFP
transceiver modules.
Describes the hot-swappable modules available for
the H3C high-end network products, their external
views, and specifications.
Describe software features and configuration
procedures.
Provide information about the product release,
including the version history, hardware and software
compatibility matrix, version upgrade information,
technical support information, and software
upgrading.
Obtaining documentation
You can access the most up-to-date H3C product documentation on the World Wide Web
at http://www.h3c.com
.
Click the links on the top navigation bar to obtain different categories of product documentation:
[Technical Support & Documents > Technical Documents]
upgrading, and software feature configuration and maintenance documentation.
[Products & Solutions]
– Provides information about products and technologies, as well as solutions.
[Technical Support & Documents > Software Download]
software version.
Technical support
service@h3c.com
http://www.h3c.com
Documentation feedback
You can e-mail your comments about product documentation to info@h3c.com.
– Provides hardware installation, software
– Provides the documentation released with the
Page 6

We appreciate your comments.
Page 7

Contents
Using ping, tracert, and system debugging ··············································································································· 1
Ping ····················································································································································································· 1
Introduction ······························································································································································· 1
Configuring ping ······················································································································································ 1
Ping configuration example ···································································································································· 2
Tracert ················································································································································································ 3
Introduction ······························································································································································· 3
Configuring tracert ··················································································································································· 4
System debugging ···························································································································································· 5
Introduction to system debugging ··························································································································· 5
Configuring system debugging ······························································································································· 6
Ping and tracert configuration example ························································································································· 6
Configuring NQA ························································································································································ 8
NQA overview ·································································································································································· 8
NQA features ··························································································································································· 8
NQA concepts ······················································································································································· 10
NQA probe operation procedure ······················································································································· 11
NQA configuration task list ·········································································································································· 11
Configuring the NQA server ········································································································································ 12
Enabling the NQA client ··············································································································································· 12
Creating an NQA test group ········································································································································ 13
Configuring an NQA test group ·································································································································· 13
Configuring ICMP echo tests ································································································································ 13
Configuring DHCP tests ········································································································································ 15
Configuring DNS tests ·········································································································································· 15
Configuring FTP tests ············································································································································· 16
Configuring HTTP tests ·········································································································································· 17
Configuring UDP jitter tests ··································································································································· 18
Configuring SNMP tests ······································································································································· 20
Configuring TCP tests ············································································································································ 21
Configuring UDP echo tests ·································································································································· 22
Configuring voice tests ········································································································································· 23
Configuring DLSw tests ········································································································································· 25
Configuring the collaboration function ························································································································ 26
Configuring threshold monitoring ································································································································· 26
Configuring the NQA statistics collection function ····································································································· 28
Configuring the history records saving function ········································································································· 29
Configuring optional parameters for an NQA test group ························································································· 29
Scheduling an NQA test group ···································································································································· 30
Displaying and maintaining NQA ······························································································································· 31
NQA configuration examples ······································································································································ 32
ICMP echo test configuration example ··············································································································· 32
DHCP test configuration example ························································································································ 34
DNS test configuration example ·························································································································· 35
FTP test configuration example ···························································································································· 36
HTTP test configuration example ·························································································································· 37
UDP jitter test configuration example ·················································································································· 39
SNMP test configuration example ······················································································································· 41
i
Page 8

TCP test configuration example ··························································································································· 43
UDP echo test configuration example ················································································································· 44
Voice test configuration example ························································································································ 45
DLSw test configuration example ························································································································· 48
NQA collaboration configuration example········································································································ 49
Configuring NTP ························································································································································ 52
NTP overview ································································································································································· 52
NTP applications ··················································································································································· 52
How NTP works ····················································································································································· 52
NTP message format ············································································································································· 53
Operation modes of NTP ····································································································································· 55
NTP-supported MPLS L3VPN ································································································································ 57
NTP configuration task list ············································································································································· 57
Configuring the operation modes of NTP ··················································································································· 57
Configuring NTP client/server mode ·················································································································· 58
Configuring the NTP symmetric mode ················································································································ 59
Configuring NTP broadcast mode ······················································································································· 59
Configuring NTP multicast mode ························································································································· 60
Configuring the local clock as a reference source ····································································································· 61
Configuring optional parameters of NTP ···················································································································· 61
Specifying the source interface for NTP messages ···························································································· 61
Disabling an interface from receiving NTP messages ······················································································· 62
Configuring the maximum number of dynamic sessions allowed ···································································· 62
Configuring access-control rights ································································································································· 62
Configuration prerequisites ·································································································································· 63
Configuration procedure ······································································································································ 63
Configuring NTP authentication ··································································································································· 63
Configuring NTP authentication in client/server mode ····················································································· 64
Configuring NTP authentication in symmetric peers mode ··············································································· 65
Configuring NTP authentication in broadcast mode ························································································· 66
Configuring NTP authentication in multicast mode ··························································································· 67
Displaying and maintaining NTP ································································································································· 68
NTP configuration examples ········································································································································· 69
Configuring NTP client/server mode ·················································································································· 69
Configuring the NTP symmetric mode ················································································································ 70
Configuring NTP broadcast mode ······················································································································· 72
Configuring NTP multicast mode ························································································································· 73
Configuring NTP client/server mode with authentication ················································································· 76
Configuring NTP broadcast mode with authentication ····················································································· 77
Configuring MPLS VPN time synchronization in client/server mode ······························································ 79
Configuring MPLS VPN time synchronization in symmetric peers mode ························································ 81
Configuring Clock monitoring ··································································································································· 83
Clock monitoring module overview ······························································································································ 83
Reference source level ·········································································································································· 83
Working mode of the clock monitoring module ································································································ 84
Working mode of the port clock ·························································································································· 84
Clock monitoring module configuration task list ········································································································· 85
Configuring working mode of the clock monitoring module of the SRPU ································································ 85
Configuring reference source priority ·························································································································· 86
Configuring SSM for reference sources ······················································································································· 86
Setting the ways of deriving SSM level ··············································································································· 86
Setting the bit position for transmitting bits clock source information ······························································ 86
Configuring SSM levels for the reference sources ····························································································· 87
ii
Page 9

Activating/deactivating SSM ······························································································································· 87
Setting the input port of the line clock (LPU port) ········································································································ 87
Displaying and maintaining the clock monitoring module ························································································ 88
Clock monitoring module configuration example ······································································································· 89
Configuring IPC ·························································································································································· 91
IPC overview ··································································································································································· 91
Node ······································································································································································· 91
Link ·········································································································································································· 91
Channel ·································································································································································· 91
Packet sending modes ·········································································································································· 92
Enabling IPC performance statistics ····························································································································· 92
Displaying and maintaining IPC ··································································································································· 93
Configuring SNMP ····················································································································································· 94
SNMP overview······························································································································································ 94
SNMP framework ·················································································································································· 94
SNMP operations ·················································································································································· 94
SNMP protocol versions ······································································································································· 94
MIB and view-based MIB access control ············································································································ 95
Configuring SNMP basic parameters ·························································································································· 95
Configuring SNMPv3 basic parameters ············································································································· 95
Configuring SNMPv1 or SNMPv2c basic parameters ······················································································ 96
Configuring SNMP logging ·········································································································································· 98
Introduction to SNMP logging ····························································································································· 98
Enabling SNMP logging ······································································································································· 98
Configuring SNMP traps ··············································································································································· 98
Enabling SNMP traps ··········································································································································· 99
Configuring the SNMP agent to send traps to a host ······················································································· 99
Displaying and maintaining SNMP ··························································································································· 100
SNMP configuration examples ··································································································································· 101
SNMPv1/SNMPv2c configuration example ···································································································· 101
SNMPv3 configuration example························································································································ 102
SNMP logging configuration example ············································································································· 103
Configuring MIB style ············································································································································· 106
Overview ······································································································································································· 106
Setting the MIB style ····················································································································································· 106
Displaying and maintaining MIB style ······················································································································· 106
Configuring RMON ················································································································································ 107
RMON overview ·························································································································································· 107
Introduction ·························································································································································· 107
Working mechanism ··········································································································································· 107
RMON groups ····················································································································································· 108
Configuring the RMON statistics function ················································································································· 109
Configuring the RMON Ethernet statistics function ·························································································· 109
Configuring the RMON history statistics function ···························································································· 110
Configuring the RMON alarm function ····················································································································· 110
Configuration prerequisites ································································································································ 110
Configuration procedure ···································································································································· 111
Displaying and maintaining RMON ·························································································································· 111
RMON configuration examples ·································································································································· 112
Ethernet statistics group configuration example ······························································································· 112
History group configuration example ················································································································ 113
Alarm group configuration example ················································································································· 115
iii
Page 10

Configuring a sampler ············································································································································ 117
Sampler overview ························································································································································ 117
Creating a sampler ······················································································································································ 117
Displaying and maintaining sampler ························································································································· 118
Sampler configuration examples ································································································································ 118
Using the sampler for NetStream ······················································································································ 118
Configuring port mirroring ····································································································································· 120
Introduction ··································································································································································· 120
Terminologies of port mirroring ························································································································· 120
Port mirroring classification and implementation ····························································································· 121
Configuring local port mirroring ································································································································ 122
Configuring remote port mirroring ····························································································································· 123
Configuration prerequisites ································································································································ 123
Configuring a remote source mirroring group ································································································· 124
Configuring a remote destination mirroring group ·························································································· 125
Displaying and maintaining port mirroring ··············································································································· 125
Port mirroring configuration examples ······················································································································· 126
Local port mirroring configuration example (in source port mode) ······························································· 126
Layer 2 remote port mirroring configuration example (reflector port configurable) ···································· 127
Configuring traffic mirroring ·································································································································· 130
Traffic mirroring overview ··········································································································································· 130
Configuring traffic mirroring ······································································································································· 130
Displaying and maintaining traffic mirroring ············································································································ 131
Traffic mirroring configuration example ···················································································································· 131
Configuring NetStream ··········································································································································· 133
NetStream overview ···················································································································································· 133
NetStream basic concepts ·········································································································································· 133
Flow ······································································································································································ 133
NetStream operation ··········································································································································· 134
NetStream key technologies ······································································································································· 134
Flow aging ··························································································································································· 134
NetStream data export ······································································································································· 135
NetStream export formats ·································································································································· 137
NetStream sampling ···················································································································································· 138
NetStream configuration task list ································································································································ 138
Configuring NetStream ··············································································································································· 139
Configuring QoS-based NetStream ·················································································································· 139
Configuring NetStream on an SPC card ·········································································································· 140
Configuring NetStream sampling ······························································································································· 141
Configuring NetStream sampling ······················································································································ 141
Configuring attributes of NetStream export data ····································································································· 142
Configuring NetStream export format··············································································································· 142
Configuring refresh rate for NetStream version 9 templates ·········································································· 143
Configuring MPLS-aware NetStream ················································································································ 144
Configuring NetStream flow aging ···························································································································· 144
Configuring NetStream data export ·························································································································· 145
Configuring NetStream common data export ·································································································· 145
Configuring NetStream aggregation data export ··························································································· 146
Displaying and maintaining NetStream ···················································································································· 147
NetStream configuration examples ···························································································································· 147
QoS-based NetStream configuration example ································································································ 147
NetStream aggregation data export configuration example ········································································· 148
NetStream aggregation data export on an SPC card configuration example ············································· 150
iv
Page 11

Configuring IPv6 NetStream ·································································································································· 153
IPv6 NetStream overview ············································································································································ 153
IPv6 NetStream basic concepts ·································································································································· 153
IPv6 flow ······························································································································································· 153
IPv6 NetStream operation ·································································································································· 154
IPv6 NetStream key technologies ······························································································································· 154
Flow aging ··························································································································································· 154
IPv6 NetStream data export ······························································································································· 155
IPv6 NetStream export format ···························································································································· 156
IPv6 NetStream configuration task list ······················································································································· 156
Configuring IPv6 NetStream ······································································································································· 157
Configuring QoS-based IPv6 NetStream ·········································································································· 157
Configuring IPv6 NetStream on an SPC card ·································································································· 157
Configuring attributes of IPv6 NetStream data export ····························································································· 158
Configuring IPv6 NetStream export format ······································································································ 158
Configuring refresh rate for IPv6 NetStream version 9 templates ································································· 159
Configuring MPLS-aware NetStream ················································································································ 159
Configuring IPv6 NetStream flow aging ··················································································································· 160
Flow aging approaches ······································································································································ 160
Configuring IPv6 NetStream flow aging ··········································································································· 161
Configuring IPv6 NetStream data export ·················································································································· 161
Configuring IPv6 NetStream traditional data export ······················································································· 161
Configuring IPv6 NetStream aggregation data export ··················································································· 162
Displaying and maintaining IPv6 NetStream ············································································································ 163
IPv6 NetStream configuration examples ··················································································································· 163
IPv6 NetStream traditional data export configuration example ····································································· 163
IPv6 NetStream aggregation data export configuration example ································································· 165
Configuration example for IPv6 NetStream aggregation data export on an SPC card ······························ 167
Configuring protocol packet statistics ···················································································································· 170
Protocol packet statistics overview ····························································································································· 170
Displaying and maintaining protocol packet statistics ····························································································· 170
Configuring the information center ························································································································ 171
Information center overview ········································································································································ 171
Introduction to information center ······················································································································ 171
Classification of system information ·················································································································· 172
Eight levels of system information ······················································································································ 172
Eight output destinations and ten channels of system information ································································· 172
Outputting system information by source module ···························································································· 173
Default output rules of system information ········································································································ 173
System information format ·································································································································· 174
Configuring information center ··································································································································· 177
Information center configuration task list ·········································································································· 177
Outputting system information to the console ·································································································· 178
Outputting system information to a monitor terminal ······················································································ 179
Outputting system information to a log host ····································································································· 180
Outputting system information to the trap buffer······························································································ 180
Outputting system information to the log buffer ······························································································· 181
Outputting system information to the SNMP module ······················································································· 182
Outputting system information to the web interface ························································································ 183
Saving system information to a log file ············································································································· 184
Configuring synchronous information output ··································································································· 185
Disabling a port from generating link up/down logging information ··························································· 185
Displaying and maintaining information center ······································································································· 186
v
Page 12

Information center configuration examples ··············································································································· 186
Outputting log information to a Unix log host·································································································· 186
Outputting log information to a Linux log host ································································································· 188
Outputting log information to the console ········································································································ 190
Flow logging configuration ···································································································································· 191
Flow logging overview ················································································································································ 191
Introduction to flow logging ······························································································································· 191
Flow logging versions ········································································································································· 191
Flow logging configuration task list ··························································································································· 192
Configuring flow logging version ······························································································································· 192
Configuring the source address for flow logging packets ······················································································· 193
Exporting flow logs ······················································································································································ 193
Exporting flow logs to log server ······················································································································· 193
Exporting flow logs to information center ········································································································· 194
Displaying and maintaining flow logging ················································································································· 194
Flow logging configuration example ························································································································· 195
Troubleshooting flow logging ····································································································································· 196
Index ········································································································································································ 197
vi
Page 13

Using ping, tracert, and system debugging
g
You can use the ping command to check the connectivity to a destination, use the tracert command to
trace the path to a destination, and use the debug command to diagnose system faults based on the
debugging information.
Ping
Introduction
Use the ping utility to check the reachability to a specific address.
Ping sends ICMP echo requests (ECHO-REQUEST) to the destination device. Upon receiving the requests,
the destination device responds with ICMP echo replies (ECHO-REPLY) to the source device. The source
device outputs statistics about the ping operation, including the number of packets sent, number of echo
replies received, and the round-trip time. You can measure the network performance by analyzing these
statistics.
Configuring ping
To configure the ping function:
Task Command
Check whether a specified
address in an IP network is
reachable.
NOTE:
• For a low-speed network, H3C recommends that you set a larger value for the timeout timer (indicated
by the -t parameter in the command) when configuring the ping command.
• Only the directly connected se
the -i argument.
Remarks
• For an IPv4 network:
ping [ ip ] [ -a source-ip | -c count | -f |
-h ttl | -i interface-type interface-number
| -m interval | -n | -p pad | -q | -r | -s
packet-size | -t timeout | -tos tos | -v |
-vpn-instance vpn-instance-name ] *
host
• For an IPv6 network:
ping ipv6 [ -a source-ipv6 | -c count |
-m interval | -s packet-size | -t timeout |
-vpn-instance vpn-instance-name ] *
host [ -i interface-type
interface-number ]
ment address can be pinged if the outgoing interface is specified with
Use either approach.
Available in any view.
• For more information about the ping lsp command, see
1
MPLS Command Reference
.
Page 14
Ping configuration example
Network requirements
As shown in Figure 1, check whether Device A and Device C can reach each other. If the two devices can
reach each other, get the detailed information about routes from Device A to Device C.
Figure 1 Network diagram
Configuration procedure
# Use the ping command to display whether Device A and Device C can reach each other.
<DeviceA> ping 1.1.2.2
PING 1.1.2.2: 56 data bytes, press CTRL_C to break
Reply from 1.1.2.2: bytes=56 Sequence=1 ttl=254 time=205 ms
Reply from 1.1.2.2: bytes=56 Sequence=2 ttl=254 time=1 ms
Reply from 1.1.2.2: bytes=56 Sequence=3 ttl=254 time=1 ms
Reply from 1.1.2.2: bytes=56 Sequence=4 ttl=254 time=1 ms
Reply from 1.1.2.2: bytes=56 Sequence=5 ttl=254 time=1 ms
--- 1.1.2.2 ping statistics -- 5 packet(s) transmitted
5 packet(s) received
0.00% packet loss
round-trip min/avg/max = 1/41/205 ms
# Get detailed information about routes from Device A to Device C.
<DeviceA> ping -r 1.1.2.2
PING 1.1.2.2: 56 data bytes, press CTRL_C to break
Reply from 1.1.2.2: bytes=56 Sequence=1 ttl=254 time=53 ms
Record Route:
1.1.2.1
1.1.2.2
1.1.1.2
1.1.1.1
Reply from 1.1.2.2: bytes=56 Sequence=2 ttl=254 time=1 ms
Record Route:
1.1.2.1
1.1.2.2
1.1.1.2
2
Page 15

1.1.1.1
Reply from 1.1.2.2: bytes=56 Sequence=3 ttl=254 time=1 ms
Record Route:
1.1.2.1
1.1.2.2
1.1.1.2
1.1.1.1
Reply from 1.1.2.2: bytes=56 Sequence=4 ttl=254 time=1 ms
Record Route:
1.1.2.1
1.1.2.2
1.1.1.2
1.1.1.1
Reply from 1.1.2.2: bytes=56 Sequence=5 ttl=254 time=1 ms
Record Route:
1.1.2.1
1.1.2.2
1.1.1.2
1.1.1.1
--- 1.1.2.2 ping statistics -- 5 packet(s) transmitted
5 packet(s) received
0.00% packet loss
round-trip min/avg/max = 1/11/53 ms
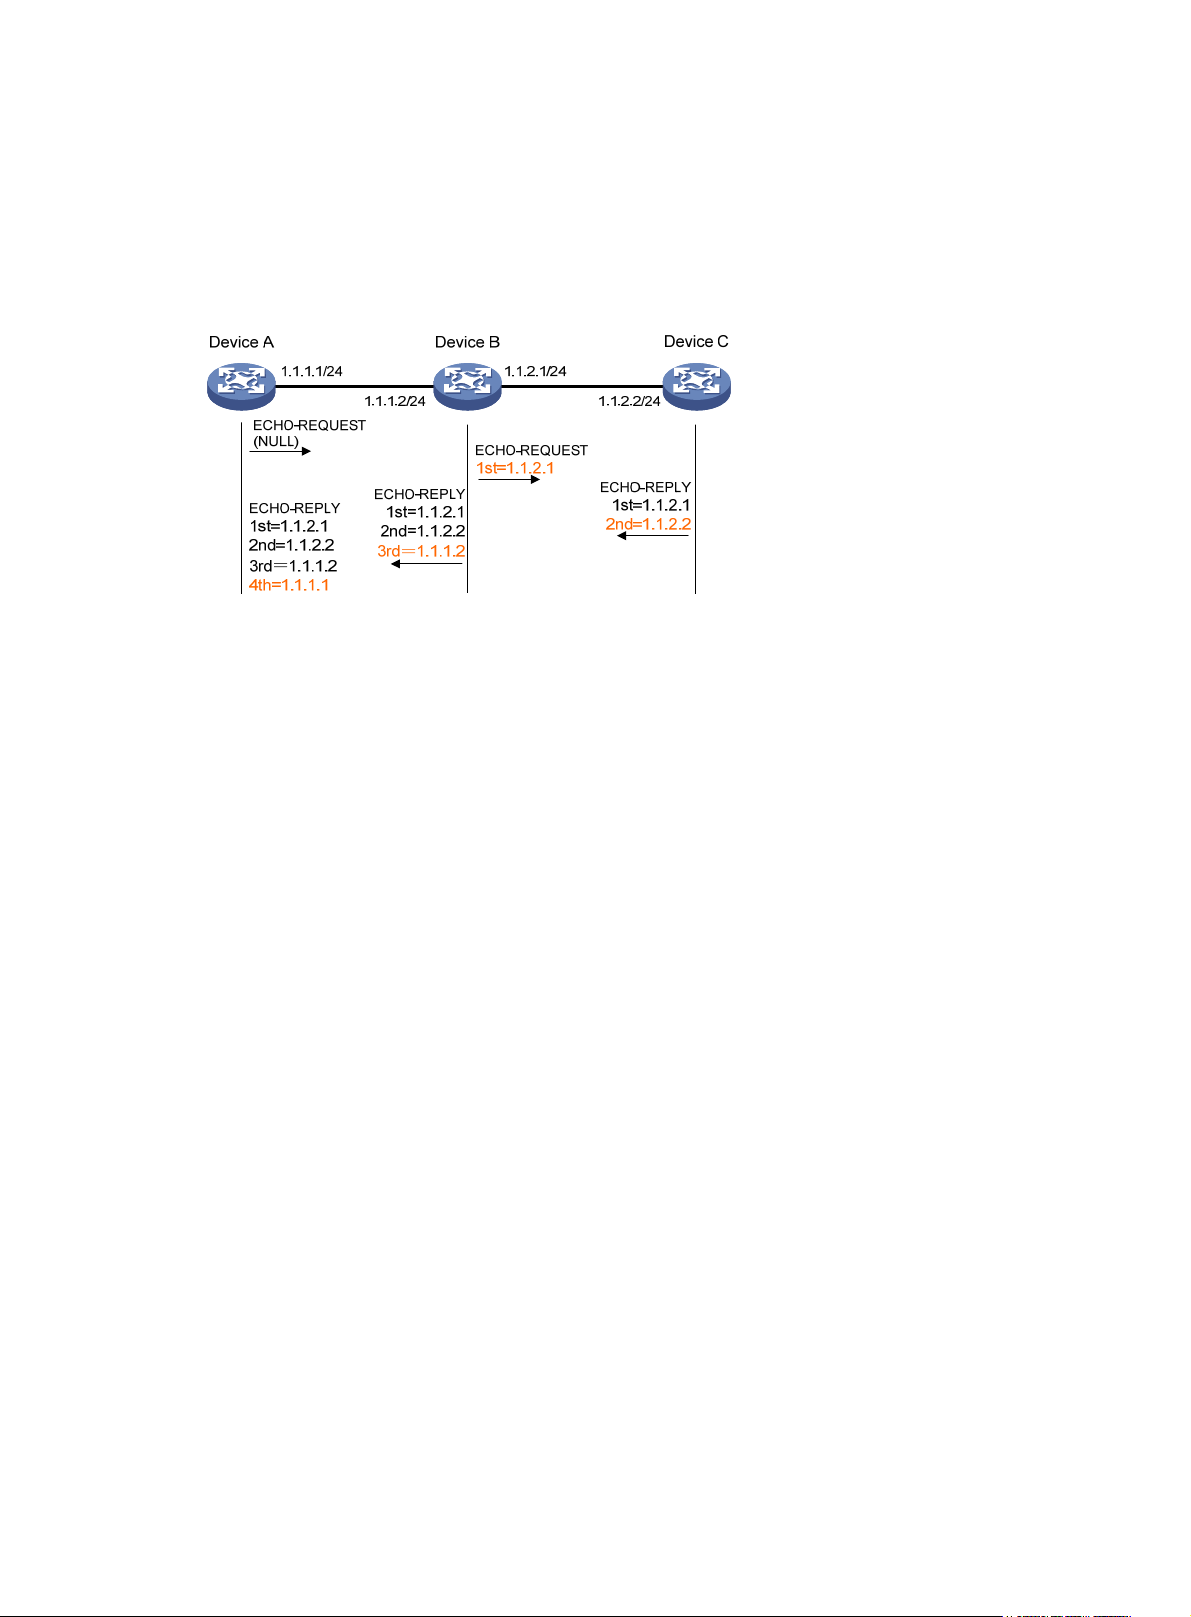
The principle of ping –r is as shown in Figure 1.
1. The source device (Device A) sends an ICMP echo request with the RR option being empty to the
destination device (Device C).
2. The intermediate device (Device B) adds the IP address (1.1.2.1) of its outbound interface to the RR
option of the ICMP echo request, and forwards the packet.
3. Upon receiving the request, the destination device copies the RR option in the request and adds the
IP address (1.1.2.2) of its outbound interface to the RR option. Then the destination device sends
an ICMP echo reply.
4. The intermediate device adds the IP address (1.1.1.2) of its outbound interface to the RR option in
the ICMP echo reply, and then forwards the reply.
5. Upon receiving the reply, the source device adds the IP address (1.1.1.1) of its inbound interface
to the RR option. Finally, you can get detailed information about routes from Device A to Device C:
1.1.1.1 <-> {1.1.1.2; 1.1.2.1} <-> 1.1.2.2.
Tracert
Introduction
Traceroute enables you to get the IP addresses of Layer 3 devices in the path to a specific destination. You
can use traceroute to check network connectivity and identify the failed nodes in the event of network
failure.
3
Page 16
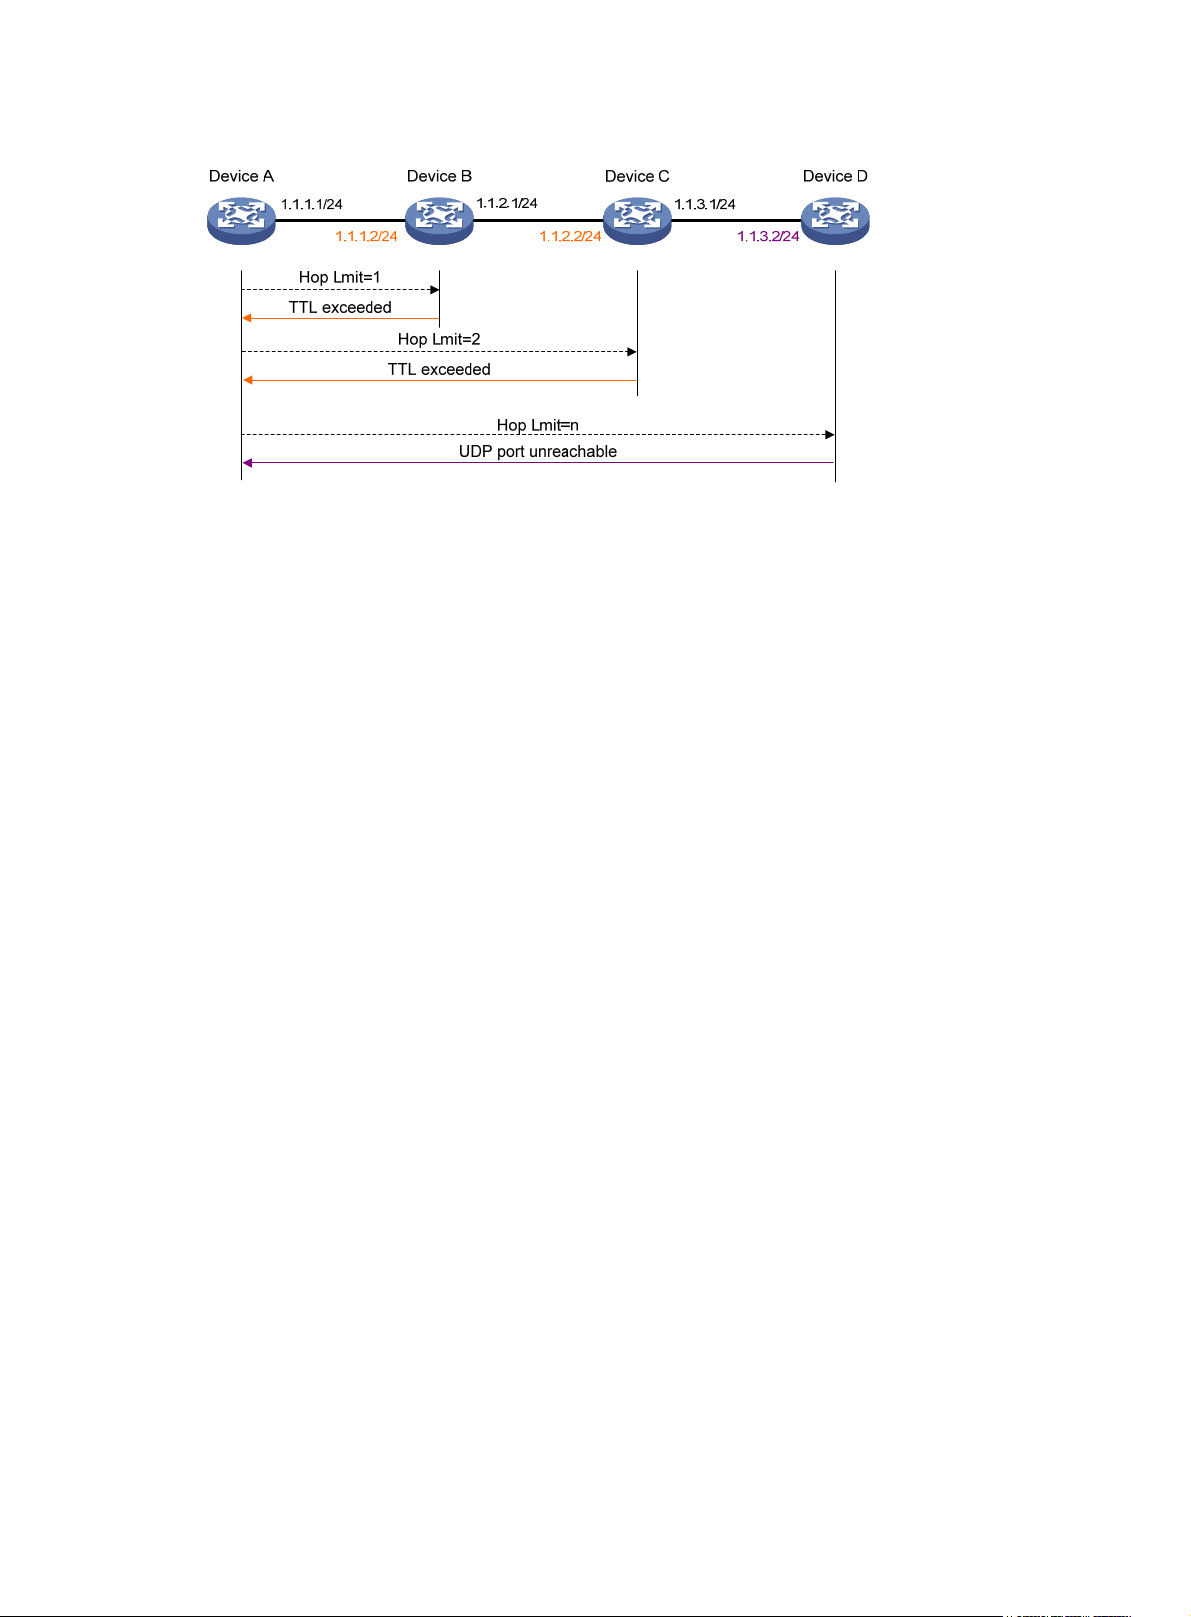
Figure 2 Tracert operation
Traceroute uses received ICMP error messages to get the IP addresses of devices. As shown in Figure 2,
traceroute works as follows:
1. The source device (Device A) sends a UDP packet with a TTL value of 1 to the destination device
(Device D). The destination UDP port is not used by any application on the destination device.
2. The first hop (Device B, the first Layer 3 device that receives the packet) responds by sending a
TTL-expired ICMP error message to the source device, with its IP address encapsulated. In this way,
the source device can get the address of the first Layer 3 device (1.1.1.2).
3. The source device sends a packet with a TTL value of 2 to the destination device.
4. The second hop (Device C) responds with a TTL-expired ICMP error message, which gives the
source device the address of the second Layer 3 device (1.1.2.2).
5. The above process continues until the packet sent by the source device reaches the ultimate
destination device. Since no application uses the destination port specified in the packet, the
destination device responds with a port-unreachable ICMP message to the source device, with its
IP address encapsulated. In this way, the source device gets the IP address of the destination
device (1.1.3.2).
6. The source device thinks that the packet has reached the destination device after receiving the
port-unreachable ICMP message, and the path to the destination device is 1.1.1.2 to 1.1.2.2 to
1.1.3.2.
Configuring tracert
Configuration prerequisites
Enable sending of ICMP timeout packets on the intermediate device (the device between the source and
destination devices). If the intermediate device is an H3C device, execute the ip ttl-expires enable
command on the device. For more information about this command, see Layer 3—IP Services Command
Reference.
Enable sending of ICMP destination unreachable packets on the destination device. If the destination
device is an H3C device, execute the ip unreachables enable command. For more information about this
command, see Layer 3—IP Services Command Reference.
Tracert configuration
To configure tracert:
4
Page 17
Step Command
1. Enter system view. system-view N/A
• For an IPv4 network:
tracert [ -a source-ip | -f first-ttl | -m
max-ttl | -p port | -q packet-number
| -vpn-instance vpn-instance-name |
2. Display the routes from
source to destination.
-w timeout ] * host
• For an IPv6 network:
tracert ipv6 [ -f first-ttl | -m max-ttl |
-p port | -q packet-number |
-vpn-instance vpn-instance-name |
-w timeout ] * host
NOTE:
For more information about the tracert lsp command, see
System debugging
Introduction to system debugging
Remarks
Use either approach.
Available in any view.
MPLS Command Reference
.
The router provides various debugging functions. For the majority of protocols and features supported,
the system provides corresponding debugging information to help users diagnose errors.
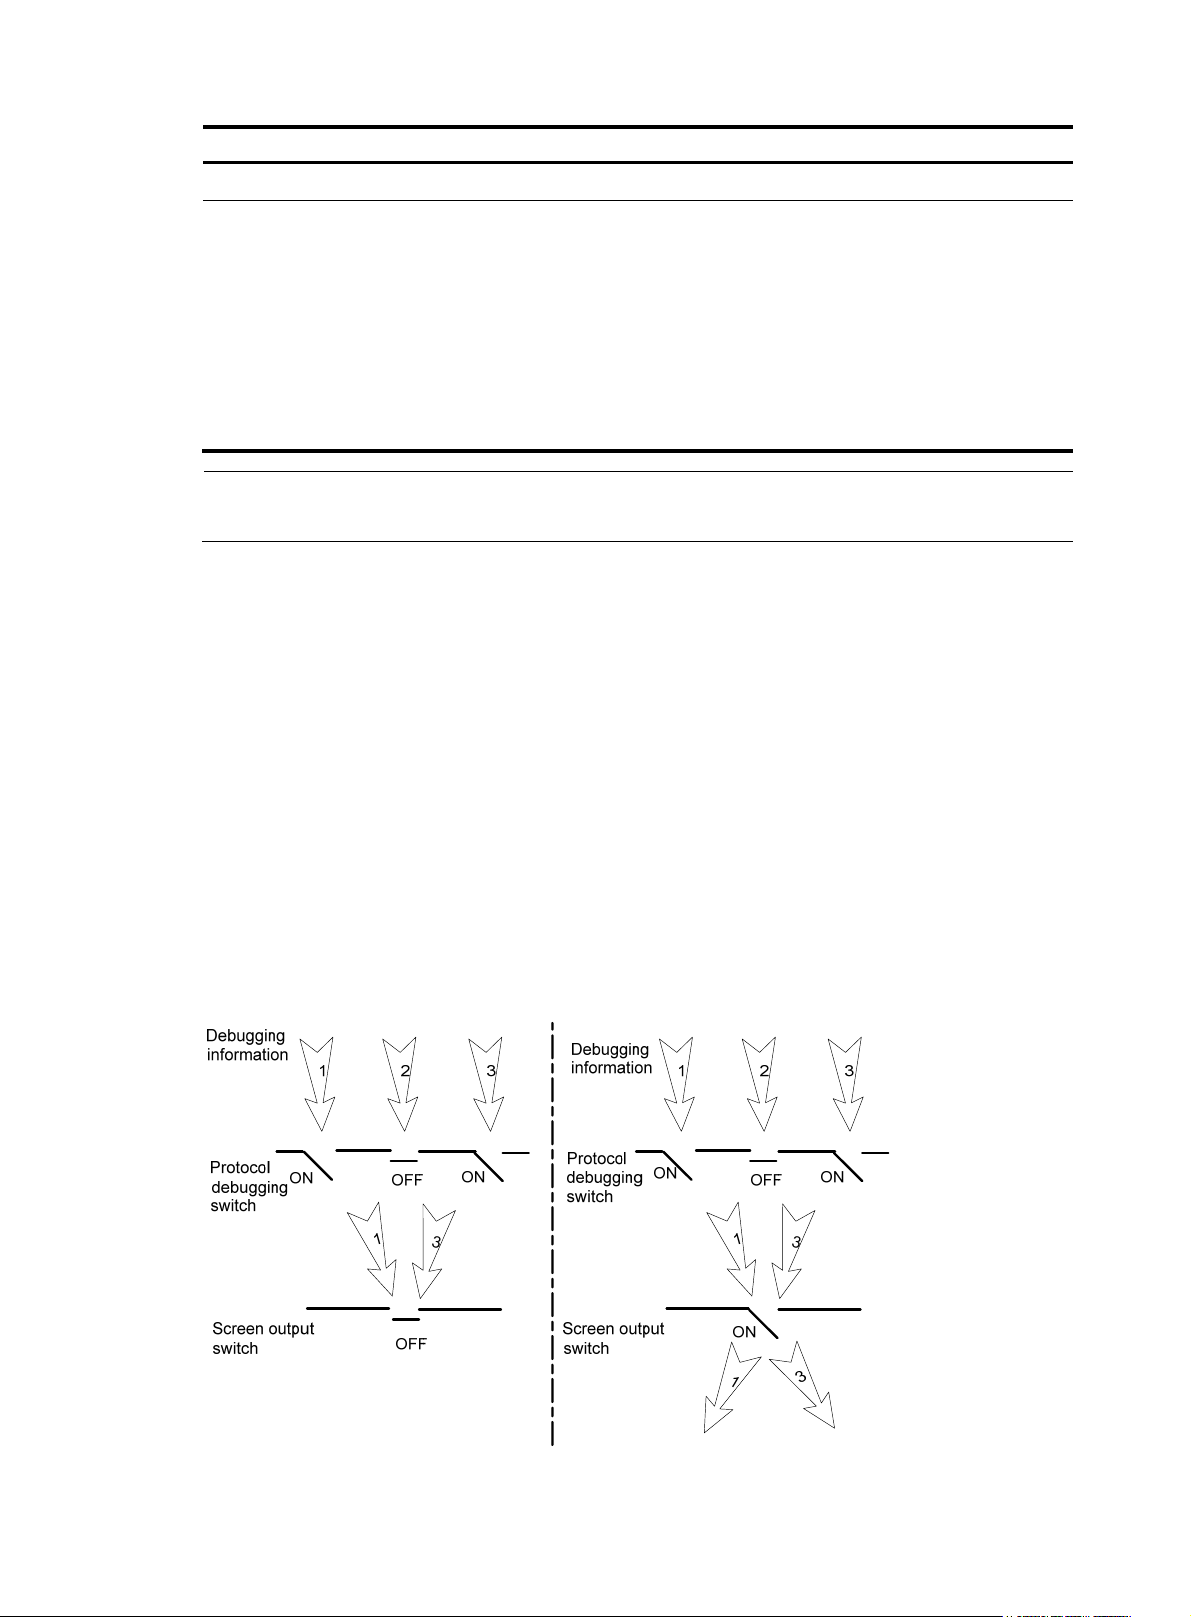
The following two switches control the display of debugging information:
• Protocol debugging switch—Controls protocol-specific debugging information.
• Screen output switch—Controls whether to display the debugging information on a certain screen.
As Figure 3 i
llustrates, assume the router can provide debugging for the three modules 1, 2, and 3. The
debugging information is output on a terminal only when both the protocol debugging switch and the
screen output switch are turned on.
Figure 3 The relationship between the protocol and screen output switch
5
Page 18

Configuring system debugging
y
g
Output of the debugging information may reduce system efficiency. Administrators usually use the
debugging commands to diagnose network failure. After completing the debugging, disable the
corresponding debugging function, or use the undo debugging all command to disable all the
debugging functions.
Output of debugging information depends on the configurations of the information center and the
debugging commands of each protocol and functional module. Displaying the debugging information
on a terminal (including console or VTY) is a common way to output debugging information. You can
also output debugging information to other destinations. For more information, see the chapter
“Configuring the information center.”
To enable the output of debugging information to a terminal:
Step Command
1. Enable the terminal
monitoring of system
information.
2. Enable the terminal
display of debugging
information.
3. Enable debugging for a
specified module.
4. Display the enabled
debugging functions.
terminal monitor
terminal debugging
debugging { all [ timeout time ] |
module-name [ option ] }
display debugging [ interface
interface-type interface-number ]
[ module-name ] [ | { begin | exclude
| include } regular-expression ]
Remarks
Optional.
By default, the terminal monitoring
on the console is enabled and that
on the monitoring terminal is
disabled.
Available in user view.
By default, terminal display of
debugging information is
disabled.
Available in user view.
By default, debugging for a
specified module is disabled.
Available in user view
Optional.
Available in any view.
NOTE:
You must configure the debugging, terminal debugging and terminal monitor commands first to displa
the detailed debugging information on the terminal. For more information about the terminal debuggin
and terminal monitor commands, see
Network Management and Monitoring Command Reference
.
Ping and tracert configuration example
Network requirements
As shown in Figure 4, Device A failed to telnet Device C. Check whether Device A and Device C can
reach each other. If they cannot reach each other, locate the failed nodes in the network.
6
Page 19

Figure 4 Network diagram
Configuration procedure
# Use the ping command to display whether Device A and Device C can reach each other.
<DeviceA> ping 1.1.2.2
PING 1.1.2.2: 56 data bytes, press CTRL_C to break
Request time out
Request time out
Request time out
Request time out
Request time out
--- 1.1.2.2 ping statistics -- 5 packet(s) transmitted
0 packet(s) received
100.00% packet loss
# Device A and Device C cannot reach each other. Use the tracert command to determine failed nodes.
<DeviceA> system-view
[DeviceA] ip ttl-expires enable
[DeviceA] ip unreachables enable
[DeviceA] tracert 1.1.2.2
traceroute to 1.1.2.2(1.1.2.2) 30 hops max,40 bytes packet, press CTRL_C to bre
ak
1 1.1.1.2 14 ms 10 ms 20 ms
2 * * *
3 * * *
4 * * *
5
<DeviceA>
The output shows that Device A and Device C cannot reach other, Device A and Device B can reach each
other, and an error occurred on the connection between Device B and Device C. In this case, use the
debugging ip icmp command to enable ICMP debugging on Device A and Device C to check whether
the devices send or receive the specified ICMP packets, or use the display ip routing-table command to
display whether Device A and Device C can reach each other.
7
Page 20
Configuring NQA
NQA overview
Network Quality Analyzer (NQA) can perform various types of tests and collect network performance
and service quality parameters such as delay jitter, time for establishing a TCP connection, time for
establishing an FTP connection, and file transfer rate.
With the NQA test results, you can diagnose and locate network faults, know network performance in
time and take proper actions.
NQA features
Supporting multiple test types
Ping can use only the Internet Control Message Protocol (ICMP) to test the reachability of the destination
host and the round-trip time. As an enhancement to Ping, NQA provides more test types and functions.
NQA supports 11 test types: ICMP echo, DHCP, DNS, FTP, HTTP, UDP jitter, SNMP, TCP, UDP echo, voice
and DLSw.
NQA enables the client to send probe packets of different test types to detect the protocol availability
and response time of the peer. The test result helps you understand network performance.
Supporting the collaboration function
Collaboration is implemented by establishing reaction entries to monitor the detection results of NQA
probes. If the number of consecutive probe failures reaches a limit, NQA informs the track module of the
detection result, and the track module triggers other application modules to take predefined.
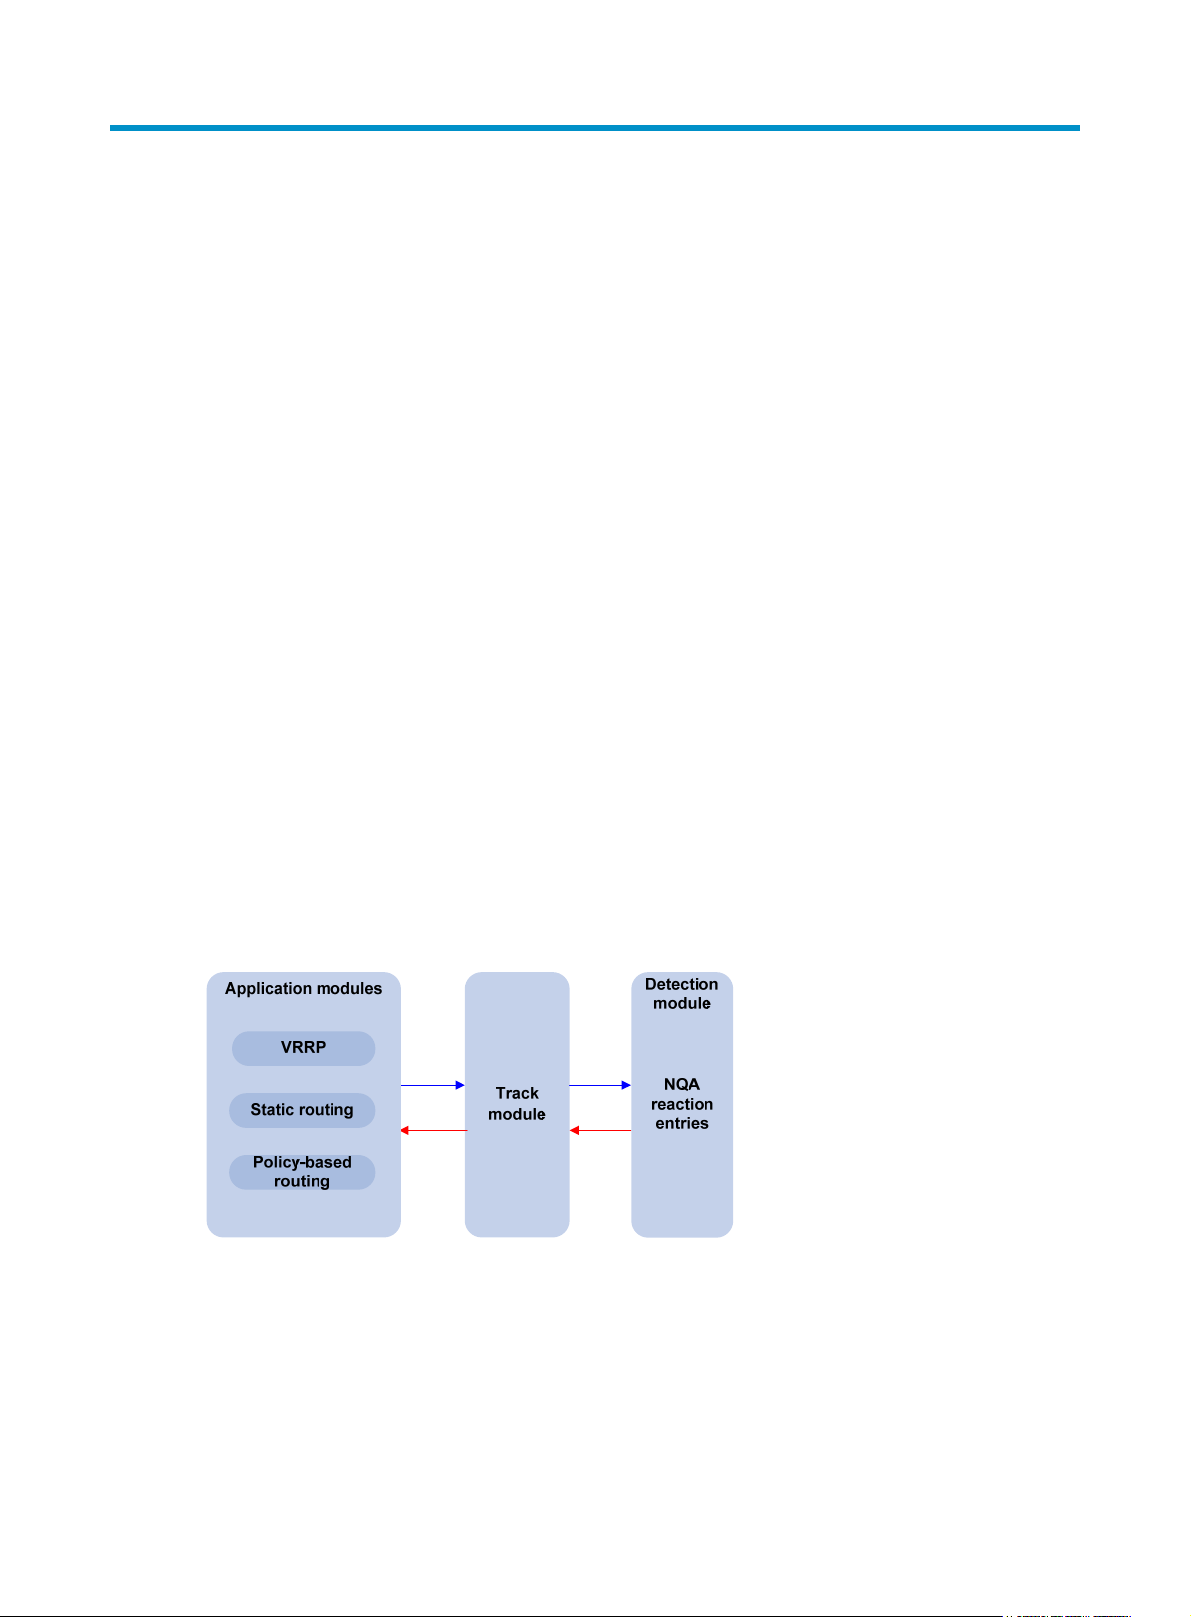
Figure 5 Implementing collaboration
The collaboration comprises the following parts: the application modules, the track module, and the
detection modules.
• A detection module monitors specific objects, such as the link status, and network performance,
and informs the track module of detection results.
• Upon the detection results, the track module changes the status of the track entry and informs the
associated application module. The track module works between the application modules and the
detection modules. It hides the differences among detection modules from application modules.
8
Page 21

n
yp
NOTE:
• The application module takes actions when the tracked object changes its state.
The following describes how a static route is monitored through collaboration:
1. NQA monitors the reachability to 192.168.0.88.
2. When 192.168.0.88 becomes unreachable, NQA notifies it to the track module.
3. The track module notifies the state change to the static routing module
4. The static routing module sets the static route as invalid.
For more information about the collaboration and the track module, see
Guide
.
Supporting threshold monitoring
NQA supports threshold monitoring for performance parameters such as average delay jitter and packet
round-trip time. The performance parameters to be monitored are monitored elements. NQA monitors
threshold violations for a monitored element, and reacts to certain measurement conditions, for example,
sending trap messages to the network management server. This helps network administrators understand
the network service quality and network performance.
1. Monitored elements
Table 1 desc
monitored.
Table 1 Monitored elements and NQA test types
Monitored elements Test t
Probe duration Tests excluding UDP jitter test and voice test
Count of probe failures Tests excluding UDP jitter test and voice test
Packet round-trip time UDP jitter test and voice test
Count of discarded packets UDP jitter test and voice test
ribes the monitored elements and the NQA test types in which the elements can be
High Availability Configuratio
e supported
One-way delay jitter (source-to-destination and
destination-to-source)
One-way delay (source-to-destination and destination-to-source) UDP jitter test and voice test
Calculated Planning Impairment Factor (ICPIF) (see “Configuring
voice tests
Mean Opinion Scores (MOS) (see “Configuring voice tests”)
2. Threshold types
”
)
UDP jitter test and voice test
Voice test
Voice test
The following threshold types are supported:
{ average—Monitors the average value of monitored data in a test. If the average value in a test
exceeds the upper threshold or goes below the lower threshold, a threshold violation occurs.
For example, you can monitor the average probe duration in a test.
{ accumulate—Monitors total number of times the monitored data violates the threshold in a test.
If the total number of times reaches or exceeds a specific value, a threshold violation occurs.
{ consecutive—Monitors the number of consecutive times the monitored data violates the
threshold since the test group starts. If the monitored data violates the threshold consecutively
for a specific number of times, a threshold violation occurs.
9
Page 22

NOTE:
NOTE:
The counting for the average or accumulate threshold type is performed per test, but that for the
consecutive type is performed since the test group is started.
3. Triggered actions
The following actions may be triggered:
{ none—NQA only records events for terminal display; it does not send trap information to the
network management server.
{ trap-only—NQA records events and sends trap messages to the network management server.
NQA DNS tests do not support the action of sending trap messages. The action to be triggered in DNS
tests can only be the default one, none.
4. Reaction entry
In a reaction entry, a monitored element, a threshold type, and the action to be triggered are
configured to implement threshold monitoring.
The state of a reaction entry can be invalid, over-threshold, or below-threshold. Before an NQA
test group starts, the reaction entry is in the state of invalid. After each test or probe, threshold
violations are counted according to the threshold type and range configured in the entry. If the
threshold is violated consecutively or accumulatively for a specific number of times, the state of the
entry is set to over-threshold; otherwise, the state of the entry is set to below-threshold.
If the action to be triggered is configured as trap-only for a reaction entry, when the state of the
entry changes, a trap message is generated and sent to the network management server.
NQA concepts
Test group
An NQA test group specifies test parameters including the test type, destination address, and destination
port. Each test group is uniquely identified by an administrator name and operation tag. You can
configure and schedule multiple NQA test groups to test different objects.
Test and probe
After the NQA test group starts, tests are performed at a specific interval. During each test, a specific
number of probe operations are performed. Both the test interval and the number of probe operations
per test are configurable. But only one probe operation is performed during one voice test.
Probe operations vary with NQA test types.
• During a TCP or DLSw test, one probe operation means setting up one connection.
• During a UDP jitter or a voice test, one probe operation means continuously sending a specific
number of probe packets. The number of probe packets is configurable.
• During an FTP, HTTP, DHCP or DNS test, one probe operation means uploading or downloading a
file, obtaining a web page, obtaining an IP address through DHCP, or translating a domain name
to an IP address.
• During an I CMP echo or U DP echo test, one pro be operation means sending an ICMP echo request
or a UDP packet.
10
Page 23

• During an SNMP test, one probe operation means sending one SNMPv1 packet, one SNMPv2C
packet, and one SNMPv3 packet.
NQA client and server
A device with NQA test groups configured is an NQA client and the NQA client initiates NQA tests. An
NQA server makes responses to probe packets destined to the specified destination address and port
number.
Figure 6 Relationship between the NQA client and NQA server
Not all test types require the NQA server. Only the TCP, UDP echo, UDP jitter, or voice test requires both
the NQA client and server, as shown in Figure 6.
Y
ou can create multiple TCP or UDP listening services on the NQA server. Each listens to a specific
destination address and port number. Make sure the destination IP address and port number for a
listening service on the server are the same as those configured for the test group on the NQA client.
Each listening service must be unique on the NQA server.
NQA probe operation procedure
An NQA probe operation involves the following steps:
1. The NQA client constructs probe packets for the specified type of NQA test, and sends them to the
peer device.
2. Upon receiving the probe packets, the peer sends back responses with timestamps.
3. The NQA client computes the network performance and service quality parameters, such as the
packet loss rate and round-trip time based on the received responses.
NQA configuration task list
Complete the following task to enable the NQA server:
Task Remarks
Configuring the NQA server Required for TCP, UDP echo, UDP jitter and voice tests
To perform NQA tests successfully, make the following configurations on the NQA client:
1. Enable the NQA client.
2. Create a test group and configure test parameters. The test parameters may vary with test types.
3. Schedule the NQA test group.
Complete these tasks to configure NQA client:
Task Remarks
Enabling the NQA client Required
Creating an NQA test group Required
11
Page 24

Task Remarks
Configuring ICMP echo tests
Configuring DHCP tests
Configuring DNS tests
Configuring FTP tests
Configuring HTTP tests
Configuring an NQA test group
Configuring the collaboration function Optional
Configuring threshold monitoring Optional
Configuring the NQA statistics collection function Optional
Configuring the history records saving function Optional
Configuring optional parameters for an NQA test group Optional
Scheduling an NQA test group Required
Configuring UDP jitter tests
Configuring SNMP tests
Configuring TCP tests
Configuring UDP echo tests
Configuring voice tests
Configuring DLSw tests
Configuring the NQA server
Required
Use any of the approac
hes
To perform TCP, UDP echo, UDP jitter, or voice tests, configure the NQA server on the peer device. The
NQA server responses to the probe packets sent from the NQA client by listening to the specified
destination address and port number.
To configure the NQA server:
Step Command
1. Enter system view.
2. Enable the NQA server.
3. Configure the listening
service.
system-view N/A
nqa server enable Disabled by default.
nqa server { tcp-connect |
udp-echo } ip-address
port-number
Enabling the NQA client
Configurations on the NQA client take effect only when the NQA client is enabled.
Remarks
The destination IP address and port
number must be the same as those
configured on the NQA client. A
listening service must be unique on
the NQA server.
12
Page 25

To enable the NQA client:
Step Command
1. Enter system view.
2. Enable the NQA client.
system-view N/A
nqa agent enable
Creating an NQA test group
Create an NQA test group before you configure NQA tests.
To create an NQA test group:
Step Command
1. Enter system view.
2. Create an NQA test group
and enter the NQA test group
view.
system-view N/A
nqa entry admin-name
operation-tag
Remarks
Optional
Enabled by default
Remarks
In the NQA test group view, you
can specify the test type.
You can use the nqa entry
command to enter the test type
view of an NQA test group with
test type configured.
Configuring an NQA test group
Configuring ICMP echo tests
ICMP echo tests of an NQA test group are used to test reachability of a destination host according to the
ICMP echo response information. An ICMP echo test has the same function as the ping command but
provides more output information. In addition, you can specify the next hop for ICMP echo tests. ICMP
echo tests are used to locate connectivity problems in a network.
To configure ICMP echo tests:
Step Command Remarks
1. Enter system view.
2. Enter NQA test group view.
3. Configure the test type as
ICMP echo and enter test type
view.
4. Configure the destination
address of ICMP echo
requests.
5. Configure the size of the data
field in each ICMP echo
request.
system-view N/A
nqa entry admin-name
operation-tag
type icmp-echo N/A
destination ip ip-address
data-size size
N/A
By default, no destination IP
address is configured.
Optional.
100 bytes by default.
13
Page 26

Step Command Remarks
6. Configure the string to be
filled in the data field of each
ICMP echo request.
7. Apply ICMP echo tests to the
specified VPN.
8. Configure the source interface
for ICMP echo requests.
9. Configure the source IP
address of ICMP echo
requests.
data-fill string
vpn-instance vpn-instance-name
source interface interface-type
interface-number
source ip ip-address
Optional.
By default, the string is the
hexadecimal number
00010203040506070809.
Optional.
By default, ICMP echo tests apply
to the public network.
Optional.
By default, no source interface is
configured for probe packets.
The requests take the IP address of
the source interface as their source
IP address when no source IP
address is specified.
The specified source interface must
be a Layer 2 Ethernet interface or a
VLAN interface and the interface
must be up; otherwise, no ICMP
echo requests can be sent out.
Optional.
By default, no source IP address is
configured.
If you configure both the source ip
command and the source interface
command, the source ip command
takes effect.
The source IP address must be the
IP address of a local interface. The
local interface must be up;
otherwise, no ICMP echo requests
can be sent out.
10. Configure the next hop IP
address of ICMP echo
requests.
11. Configure optional
parameters.
next-hop ip-address
See “Configuring optional
parameters for an NQA test
”
group
Optional.
By default, no next hop IP address
is configured.
Optional.
NOTE:
NQA ICMP echo tests are not supported in IPv6 networks. To test the reachability of an IPv6 address, use
the ping ipv6 command. For more information about the command, see
Monitoring Command Reference.
14
Network Management and
Page 27

Configuring DHCP tests
DHCP tests of an NQA test group are used to test if a DHCP server is on the network, and how long it
takes for the DHCP server to respond to a client request and assign an IP address to the client.
Configuration prerequisites
Before you start DHCP tests, configure the DHCP server. If the NQA (DHCP client) and the DHCP server
are not in the same network segment, configure a DHCP relay. For the configuration of DHCP server and
DHCP relay, see Layer 3
Configuring DHCP tests
To configure DHCP tests:
Step Command Remarks
—
IP Services Configuration Guide.
1. Enter system view.
2. Enter NQA test group view.
3. Configure the test type as
DHCP and enter test type
view.
4. Specify an interface to
perform DHCP tests.
5. Configure optional
parameters.
system-view N/A
nqa entry admin-name
operation-tag
type dhcp N/A
operation interface interface-type
interface-number
See “Configuring optional
parameters for an NQA test
”
group
N/A
By default, no interface is
configured to perform DHCP tests.
The specified interface must be up;
otherwise, no probe packets can
be sent out.
Optional.
NOTE:
• The interface that performs DHCP tests does not change its IP address. A DHCP test only simulates
address allocation in DHCP.
• When a DHCP test completes, the NQA client sends a DHCP-RELEASE packet to release the obtained IP
address.
Configuring DNS tests
DNS tests of an NQA test group are used to test whether the NQA client can translate a domain name
into an IP address through a DNS server and test the time required for resolution.
Configuration prerequisites
Before you start DNS tests, configure the mapping between a domain name and an IP address on a DNS
server.
Configuring DNS tests
To configure DNS tests:
15
Page 28

A
Step Command
1. Enter system view.
2. Enter NQA test group view.
3. Configure the test type as
DNS and enter test type view.
4. Specify the IP address of the
DNS server as the
destination address of DNS
packets.
5. Configure the domain name
that needs to be translated.
6. Configure optional
parameters.
NOTE:
DNS test simulates the domain name resolution. It does not save the mapping between the domain name
and the IP address.
Configuring FTP tests
Remarks
system-view N/A
nqa entry admin-name operation-tag
type dns N/A
destination ip ip-address
resolve-target domain-name
See “Configuring optional
parameters for an NQA test gr
oup
N/A
By default, no destination IP
address is configured.
By default, no domain name is
configured.
Optional.
”
FTP tests of an NQA test group are used to test the connection between the NQA client and an FTP server
and the time necessary for the FTP client to transfer a file to or download a file from the FTP server.
Configuration prerequisites
Before you start FTP tests, configure the FTP server. For example, configure the username and password
that are used to log in to the FTP server. For more information about FTP server configuration, see
Fundamentals Configuration Guide.
Configuring FTP tests
To configure FTP tests:
Step Command Remarks
1. Enter system view.
2. Enter NQA test group view.
3. Configure the test type as FTP
and enter test type view.
4. Specify the IP address of the
FTP server as the destination
address of FTP request
packets.
system-view N/A
nqa entry admin-name
operation-tag
type ftp N/A
destination ip ip-address
N/A
By default, no destination IP
address is configured.
16
Page 29

g
Step Command Remarks
By default, no source IP address is
specified.
5. Configure the source IP
address of FTP request
packets.
6. Configure the operation type.
source ip ip-address
operation { get | put }
The source IP address must be the
IP address of a local interface. The
local interface must be up;
otherwise, no FTP requests can be
sent out.
Optional.
By default, the operation type for
the FTP is get, which means
obtaining files from the FTP server.
7. Configure a login username.
8. Configure a login password.
9. Specify a file to be transferred
between the FTP server and
the FTP client.
10. Set the data transmission
mode for FTP tests.
11. Configure optional
parameters.
username name
password password
filename file-name By default, no file is specified.
mode { active | passive }
See “Configuring optional
parameters for an NQA test
”
group
NOTE:
• When you execute the put command, a file
file-name
with fixed size and content is created on the FTP
server. When you execute the get command, the device does not save the files obtained from the FTP
server.
• When you download a file that does not exist on the FTP server, FTP tests fail.
• When you execute the get command, use a file with a small size. A bi
to timeout, or may affect other services for occupying too much network bandwidth.
By default, no login username is
configured.
By default, no login password is
configured.
Optional.
active by default.
Optional.
file may result in test failure due
Configuring HTTP tests
HTTP tests of an NQA test group are used to test the connection between the NQA client and an HTTP
server and the time required to obtain data from the HTTP server. HTTP tests enable you to detect the
connectivity and performance of the HTTP server.
Configuration prerequisites
Before you start HTTP tests, configure the HTTP server.
Configuring HTTP tests
To configure HTTP tests:
17
Page 30

Step Command Remarks
1. Enter system view.
2. Enter NQA test group view.
3. Configure the test type as
HTTP and enter test type view.
4. Configure the IP address of
the HTTP server as the
destination address of HTTP
request packets.
5. Configure the source IP
address of request packets.
6. Configure the operation type.
7. Configure the website that an
HTTP test visits.
system-view N/A
nqa entry admin-name
operation-tag
type http N/A
destination ip ip-address
source ip ip-address
operation { get | post }
url url N/A
N/A
By default, no destination IP
address is configured.
Optional.
By default, no source IP address is
specified.
The source IP address must be the
IP address of a local interface. The
local interface must be up;
otherwise, no probe packets can
be sent out.
Optional.
By default, the operation type for
the HTTP is get, which means
obtaining data from the HTTP
server.
8. Configure the HTTP version
used in HTTP tests.
9. Configure optional
parameters.
http-version v1.0
See “Configuring optional
parameters for an NQA test
group
NOTE:
The TCP port must be port 80 on the HTTP server for NQA HTTP tests.
Configuring UDP jitter tests
NOTE:
Do not perform NQA UDP jitter tests on known ports, ports from 1 to 1023. Otherwise, UDP jitter tests
might fail or the corresponding services of this port might be unavailable.
Real-time services such as voice and video have high requirements on delay jitters. UDP jitter tests of an
NQA test group obtain uni/bi-directional delay jitters. The test results help you verify whether a network
can carry real-time services.
A UDP jitter test takes the following procedure:
Optional.
By default, HTTP 1.0 is used.
Optional.
”
1. The source sends packets at regular intervals to the destination port.
18
Page 31

2.
The destination affixes a time stamp to each packet that it receives, and then sends it back to the
source.
3. Upon receiving the response, the source calculates the delay jitter, which reflects network
performance. Delay refers to the amount of time it takes a packet to be transmitted from source to
destination or from destination to source. Delay jitter is the delay variation over time.
Configuration prerequisites
UDP jitter tests require cooperation between the NQA server and the NQA client. Before you start UDP
jitter tests, configure UDP listening services on the NQA server. For more information about UDP listening
service configuration, see “Configuring the NQA server.”
Configuring UDP jitter tests
To configure UDP jitter tests:
Step Command
1. Enter system view.
2. Enter NQA test group view.
3. Configure the test type as UDP
jitter and enter test type view.
4. Configure the destination
address of UDP packets.
5. Configure the destination port
of UDP packets.
6. Specify the source port
number of UDP packets.
7. Configure the size of the data
field in each UDP packet.
system-view N/A
nqa entry admin-name
operation-tag
type udp-jitter N/A
destination ip ip-address
destination port port-number
source port port-number
data-size size
Remarks
N/A
By default, no destination IP
address is configured.
The destination IP address must be
the same as that of the listening
service on the NQA server.
By default, no destination port
number is configured.
The destination port must be the
same as that of the listening service
on the NQA server.
Optional.
By default, no source port number
is specified.
Optional.
100 bytes by default.
8. Configure the string to be
filled in the data field of each
probe packet.
9. Configure the number of
probe packets to be sent
during each UDP jitter probe
operation.
10. Configure the interval for
sending probe packets during
each UDP jitter probe
operation.
data-fill string
probe packet-number
packet-number
probe packet-interval
packet-interval
19
Optional.
By default, the string is the
hexadecimal number
00010203040506070809.
Optional.
10 by default.
Optional.
20 milliseconds by default.
Page 32

Step Command
11. Configure the interval the
NQA client must wait for a
response from the server
before it regards the response
is timed out.
12. Configure the source IP
address for UDP jitter packets.
13. Configure optional
parameters.
probe packet-timeout
packet-timeout
source ip ip-address
See “Configuring optional
parameters for an NQA test
group
”
Remarks
Optional.
3000 milliseconds by default.
Optional.
By default, no source IP address is
specified.
The source IP address must be the
IP address of a local interface. The
local interface must be up;
otherwise, no probe packets can
be sent out.
Optional.
NOTE:
The probe count command specifies the number of probe operations during one UDP jitter test. The probe
packet-number command specifies the number of probe packets sent in each UDP jitter probe operation.
Configuring SNMP tests
SNMP tests of an NQA test group are used to test the time the NQA client takes to send an SNMP packet
to the SNMP agent and receive a response.
Configuration prerequisites
Before you start SNMP tests, enable the SNMP agent function on the device that serves as an SNMP
agent. For more information abut SNMP agent configuration, see the chapter “SNMP configuration.”
Configuring SNMP tests
To configure SNMP tests:
Step Command
1. Enter system view.
2. Enter NQA test group view.
3. Configure the test type as
SNMP and enter test type
view.
4. Configure the destination
address of SNMP packets.
Remarks
system-view N/A
nqa entry admin-name
operation-tag
type snmp N/A
destination ip ip-address
N/A
By default, no destination IP
address is configured.
5. Specify the source port of
SNMP packets.
source port port-number
20
Optional.
By default, no source port number
is specified.
Page 33

Step Command
6. Configure the source IP
address of SNMP packets.
7. Configure optional
parameters.
Configuring TCP tests
TCP tests of an NQA test group are used to test the TCP connection between the NQA client and a port
on the NQA server and the time for setting up a connection. The test result helps you understand the
availability and performance of the services provided by the port on the server.
Configuration prerequisites
TCP tests require cooperation between the NQA server and the NQA client. Before you start TCP tests,
configure a TCP listening service on the NQA server. For more information about the TCP listening
service configuration, see “Configuring the NQA server.”
source ip ip-address
See “Configuring optional
parameters for an NQA test
”
group
Remarks
Optional.
By default, no source IP address is
specified.
The source IP address must be the
IP address of a local interface. The
local interface must be up;
otherwise, no probe packets can
be sent out.
Optional.
Configuring TCP tests
To configure TCP tests:
Step Command
1. Enter system view.
2. Enter NQA test group view.
3. Configure the test type as TCP
and enter test type view.
4. Configure the destination
address of TCP probe packets.
5. Configure the destination port
of TCP probe packets.
Remarks
system-view
nqa entry admin-name
operation-tag
type tcp N/A
destination ip ip-address
destination port port-number
N/A
N/A
By default, no destination IP
address is configured.
The destination address must be
the same as the IP address of the
listening service configured on the
NQA server.
By default, no destination port
number is configured.
The destination port number must
be the same as that of the listening
service on the NQA server.
21
Page 34

Step Command
6. Configure the source IP
address of TCP probe packets.
7. Configure optional
parameters.
source ip ip-address
See “Configuring optional
parameters for an NQA test
group
Configuring UDP echo tests
UDP echo tests of an NQA test group are used to test the connectivity and round-trip time of a UDP packet
from the client to the specified UDP port on the NQA server.
Configuration prerequisites
UDP echo tests require cooperation between the NQA server and the NQA client. Before you start UDP
echo tests, configure a UDP listening service on the NQA server. For more information about the UDP
listening service configuration, see “Configuring the NQA server.”
Remarks
Optional.
By default, no source IP address is
specified.
The source IP address must be the
IP address of a local interface. The
local interface must be up;
otherwise, no probe packets can
be sent out.
Optional.
”
Configuring UDP echo tests
To configure UDP echo tests:
Step Command
1. Enter system view.
2. Enter NQA test group view.
3. Configure the test type as UDP
echo and enter test type view.
4. Configure the destination
address of UDP packets.
5. Configure the destination port
of UDP packets.
Remarks
system-view N/A
nqa entry admin-name
operation-tag
type udp-echo N/A
destination ip ip-address
destination port port-number
N/A
By default, no destination IP
address is configured.
The destination address must be
the same as the IP address of the
listening service configured on the
NQA server.
By default, no destination port
number is configured.
The destination port number must
be the same as that of the listening
service on the NQA server.
6. Configure the size of the data
field in each UDP packet.
data-size size
22
Optional.
100 bytes by default.
Page 35

Step Command
7. Configure the string to be
filled in the data field of each
UDP packet.
8. Specify the source port of UDP
packets.
9. Configure the source IP
address of UDP packets.
10. Configure optional
parameters.
data-fill string
source port port-number
source ip ip-address
See “Configuring optional
parameters for an NQA test
group
Remarks
Optional.
”
By default, the string is the
hexadecimal number
00010203040506070809.
Optional.
By default, no source port number
is specified.
Optional.
By default, no source IP address is
specified.
The source IP address must be that
of an interface on the device and
the interface must be up;
otherwise, no probe packets can
be sent out.
Optional.
Configuring voice tests
NOTE:
Do not perform voice tests on known ports, ports from 1 to 1023. Otherwise, the NQA test might fail or the
corresponding services of these ports might be unavailable.
Voice tests of an NQA test group are used to test voice over IP (VoIP) network status, and collect VoIP
network parameters so that users can adjust the network.
A voice test takes the following procedure:
1. The source (NQA client) sends voice packets of G.711 A-law, G.711 μ-law or G.729 A-law
codec type at regular intervals to the destination (NQA server).
2. The destination affixes a time stamp to each voice packet that it receives and then sends it back to
the source.
3. Upon receiving the packet, the source calculates results, such as the delay jitter and one-way delay
based on the packet time stamps. The statistics reflect network performance.
Voice test result also includes the following parameters that reflect VoIP network performance:
• Calculated Planning Impairment Factor (ICPIF)—Measures impairment to voice quality in a VoIP
network. It is decided by packet loss and delay. A higher value represents a lower service quality.
• Mean Opinion Scores (MOS)—A MOS value can be evaluated by using the ICPIF value, in the
range 1 to 5. A higher value represents a higher quality of a VoIP network.
The evaluation of voice quality depends on users’ tolerance for voice quality, which should be taken into
consideration. For users with higher tolerance for voice quality, use the advantage-factor command to
configure the advantage factor. When the system calculates the ICPIF value, this advantage factor is
subtracted to modify ICPIF and MOS values and both the objective and subjective factors are considered
when you evaluate the voice quality.
23
Page 36

Configuration prerequisites
Voice tests require cooperation between the NQA server and the NQA client. Before you start voice tests,
configure a UDP listening service on the NQA server. For more information about UDP listening service
configuration, see “Configuring the NQA server.”
Configuring voice tests
To configure voice tests:
Step Command
1. Enter system view.
2. Enter NQA test group view.
3. Configure the test type as
voice and enter test type view.
4. Configure the destination
address of voice probe
packets.
5. Configure the destination port
of voice probe packets.
6. Configure the codec type.
system-view N/A
nqa entry admin-name
operation-tag
type voice N/A
destination ip ip-address
destination port port-number
codec-type { g711a | g711u |
g729a }
Remarks
N/A
By default, no destination IP
address is configured for a test
operation.
The destination IP address must be
the same as that of the listening
service on the NQA server.
By default, no destination port
number is configured.
The destination port must be the
same as that of the listening service
on the NQA server.
Optional.
By default, the codec type is
G.711 A-law.
7. Configure the advantage
factor for calculating MOS
and ICPIF values.
8. Specify the source IP address
of probe packets.
9. Specify the source port
number of probe packets.
advantage-factor factor
source ip ip-address
source port port-number
24
Optional.
By default, the advantage factor is
0.
Optional.
By default, no source IP address is
specified.
The source IP address must be the
IP address of a local interface. The
local interface must be up;
otherwise, no probe packets can
be sent out.
Optional.
By default, no source port number
is specified.
Page 37

Step Command
10. Configure the size of the data
field in each probe packet.
11. Configure the string to be
filled in the data field of each
probe packet.
12. Configure the number of
probe packets to be sent
during each voice probe
operation.
13. Configure the interval for
sending probe packets during
each voice probe operation.
14. Configure the interval the
NQA client must wait for a
response from the server
before it regards the response
times out.
data-size size
data-fill string
probe packet-number
packet-number
probe packet-interval
packet-interval
probe packet-timeout
packet-timeout
Remarks
Optional.
By default, the probe packet size
depends on the codec type. The
default packet size is 172 bytes for
G.711A-law and G.711 μ-law
codec type, and is 32 bytes for
G.729 A-law codec type.
Optional.
By default, the string is the
hexadecimal number
00010203040506070809.
Optional.
1000 by default.
Optional.
20 milliseconds by default.
Optional.
5000 milliseconds by default.
15. Configure optional
parameters.
NOTE:
Only one probe operation is performed in one voice test.
Configuring DLSw tests
DLSw tests of an NQA test group are used to test the response time of a DLSw device.
Configuration prerequisites
Before you start DLSw tests, enable the DLSw function on the peer device.
Configuring a DLSw test
To configure DLSw tests:
Step Command
1. Enter system view.
2. Enter NQA test group view.
3. Configure the test type as
DLSw and enter test type view.
See “Configuring optional
parameters for an NQA test
”
group
Optional.
Remarks
system-view N/A
nqa entry admin-name
operation-tag
type dlsw N/A
N/A
25
Page 38

Step Command
4. Configure the destination
address of probe packets.
5. Configure the source IP
address of probe packets.
6. Configure optional
parameters.
destination ip ip-address
source ip ip-address
“
See
Configuring optional
parameters for an NQA test
group
”
Remarks
By default, no destination IP
address is configured.
Optional.
By default, no source IP address is
specified.
The source IP address must be the
IP address of a local interface. The
local interface must be up;
otherwise, no probe packets can
be sent out.
Optional.
Configuring the collaboration function
Collaboration is implemented by establishing reaction entries to monitor the detection results of a test
group. If the number of consecutive probe failures reaches the threshold, the configured action is
triggered.
To configure the collaboration function:
Step Command
1. Enter system view.
2. Enter NQA test group view.
3. Enter test type view of the test
group.
4. Configure a reaction entry.
5. Exit to system view.
6. Configure a track entry and
associate it with the reaction
entry of the NQA test group.
system-view N/A
nqa entry admin-name
operation-tag
type { dhcp | dlsw | dns | ftp |
http | icmp-echo | snmp | tcp |
udp-echo }
reaction item-number
checked-element probe-fail
threshold-type consecutive
consecutive-occurrences
action-type trigger-only
quit N/A
track entry-number nqa entry
admin-name operation-tag
reaction item-number
Remarks
N/A
The collaboration function is not
supported in UDP jitter and voice
tests.
Not created by default.
You cannot modify the content of
an existing reaction entry.
Not created by default.
Configuring threshold monitoring
Configuration prerequisites
Before you configure threshold monitoring, complete the following tasks:
26
Page 39

• Configure the destination address of the trap message by using the snmp-agent target-host
command. For more information about the snmp-agent target-host command, see Network
Management and Monitoring Command Reference.
• Create an NQA test group and configure related parameters.
Configuring threshold monitoring
To configure threshold monitoring:
Step Command
1. Enter system view.
2. Enter NQA test group view.
3. Enter test type view of the test
group.
4. Configure to send traps to the
network management server
under specified conditions.
5. Configure a reaction entry for
monitoring the probe duration
of a test (not supported in UDP
jitter and voice tests).
6. Configure a reaction entry for
monitoring the probe failure
times (not supported in UDP
jitter and voice tests).
7. Configure a reaction entry for
monitoring packet round-trip
time (only supported in UDP
jitter and voice tests)
8. Configure a reaction entry for
monitoring the packet loss in
each test (only supported in
UDP jitter and voice tests).
system-view N/A
nqa entry admin-name operation-tag N/A
type { dhcp | dlsw | dns | ftp | http | icmp-echo
| snmp | tcp | udp-echo | udp-jitter | voice }
reaction trap { probe-failure
consecutive-probe-failures | test-complete |
test-failure cumulate-probe-failures }
reaction item-number checked-element
probe-duration threshold-type { accumulate
accumulate-occurrences | average | consecutive
consecutive-occurrences } threshold-value
upper-threshold lower-threshold [ action-type
{ none | trap-only } ]
reaction item-number checked-element probe-fail
threshold-type { accumulate
accumulate-occurrences | consecutive
consecutive-occurrences } [ action-type { none |
trap-only } ]
reaction item-number checked-element rtt
threshold-type { accumulate
accumulate-occurrences | average }
threshold-value upper-threshold lower-threshold
[ action-type { none | trap-only } ]
reaction item-number checked-element
packet-loss threshold-type accumulate
accumulate-occurrences [ action-type { none |
trap-only } ]
Remarks
N/A
Configure to send
traps.
No traps are sent to
the network
management server
by default.
9. Configure a reaction entry for
monitoring one-way delay
jitter (only supported in UDP
jitter and voice tests).
10. Configure a reaction entry for
monitoring the one-way delay
(only supported in UDP jitter
and voice tests).
11. Configure a reaction entry for
monitoring the ICPIF value
(only supported in voice tests).
reaction item-number checked-element { jitter-ds
| jitter-sd } threshold-type { accumulate
accumulate-occurrences | average }
threshold-value upper-threshold lower-threshold
[ action-type { none | trap-only } ]
reaction item-number checked-element { owd-ds
| owd-sd } threshold-value upper-threshold
lower-threshold
reaction item-number checked-element icpif
threshold-value upper-threshold lower-threshold
[ action-type { none | trap-only } ]
27
Page 40

g
Step Command
12. Configure a reaction entry for
monitoring the MOS value
(only supported in voice tests).
reaction item-number checked-element mos
threshold-value upper-threshold lower-threshold
[ action-type { none | trap-only } ]
Remarks
NOTE:
• NQA DNS tests do not support the action of sendin
trap messages. The action to be triggered in DNS
tests can only be the default one, none.
• Only the test-complete keyword is supported for the reaction trap command in a voice test.
Configuring the NQA statistics collection function
NQA groups tests completed in a time period for a test group, and calculates the test result statistics. The
statistics form a statistics group. To view information about the statistics groups, use the display nqa
statistics command. To set the interval for collecting statistics, use the statistics interval command.
When the number of statistics groups kept reaches the upper limit and a new statistics group is to be
saved, the earliest statistics group is deleted. To set the maximum number of statistics groups that can be
kept, use the statistics max-group command.
A statistics group is formed after the last test is completed within the specified interval. When its hold time
expires, the statistics group is deleted. To set the hold time of statistics groups for a test group, use the
statistics hold-time command.
To configure the NQA statistics collection function:
Step Command
1. Enter system view.
2. Enter NQA test group view.
3. Enter test type view of the test
group.
4. Configure the interval for
collecting the statistics of test
results.
5. Configure the maximum
number of statistics groups
that can be kept.
6. Configure the hold time of
statistics groups.
system-view N/A
nqa entry admin-name
operation-tag
type { dlsw | dns | ftp | http |
icmp-echo | snmp | tcp |
udp-echo | udp-jitter | voice }
statistics interval interval
statistics max-group number
statistics hold-time hold-time
Remarks
N/A
N/A
Optional.
60 minutes by default.
Optional.
2 by default.
To disable collecting NQA
statistics, set the maximum number
to 0.
Optional.
120 minutes by default.
28
Page 41

t
NOTE:
• The NQA statistics collection function is not supported in DHCP tests.
• If you use the frequency command to set the frequency between two consecutive tests to 0, only one tes
is performed, and no statistics group information is collected.
Configuring the history records saving function
The history records saving function enables the system to save the history records of NQA tests. To view
the history records of a test group, use the display nqa history command.
In addition, you can configure the following elements:
• Lifetime of the history records—The records are removed when the lifetime is reached.
• The maximum number of history records that can be saved in a test group—If the number of history
records in a test group exceeds the maximum number, the earliest history records are removed.
To configure the history records saving function of an NQA test group:
Step Command
1. Enter system view.
2. Enter NQA test group
view.
3. Enter NQA test type
view.
4. Enable the saving of the
history records of the
NQA test group.
5. Set the lifetime of the
history records in an
NQA test group.
6. Configure the maximum
number of history
records that can be
saved for a test group.
system-view N/A
nqa entry admin-name operation-tag N/A
type { dhcp | dlsw | dns | ftp | http |
icmp-echo | snmp | tcp | udp-echo |
udp-jitter | voice }
history-record enable
history-record keep-time keep-time
history-record number number
Remarks
N/A
By default, history records of the
NQA test group are not saved.
Optional.
By default, the history records in
the NQA test group are kept for
120 minutes.
Optional.
By default, the maximum
number of records that can be
saved for a test group is 50
Configuring optional parameters for an NQA test group
Optional parameters for an NQA test group are valid only for tests in this test group.
Unless otherwise specified, the following optional parameters are applicable to all test types.
To configure optional parameters for an NQA test group:
29
Page 42

Step Command
1. Enter system view.
2. Enter NQA test group view.
3. Enter test type view of a test
group.
4. Configure the description for
a test group.
5. Configure the interval
between two consecutive tests
for a test group.
6. Configure the number of
probe operations to be
performed in one test.
system-view N/A
nqa entry admin-name
operation-tag
type { dhcp | dlsw | dns | ftp |
http | icmp-echo | snmp | tcp |
udp-echo | udp-jitter | voice }
description text
frequency interval
probe count times
Remarks
N/A
N/A
Optional.
By default, no description is
available for a test group.
Optional.
By default, the interval between
two consecutive tests for a test
group is 0 milliseconds. Only one
test is performed.
If the last test is not completed
when the interval specified by the
frequency command is reached, a
new test does not start.
Optional.
By default, one probe operation is
performed in one test.
Not available for voice tests, Only
one probe operation can be
performed in one voice test.
7. Configure the NQA probe
timeout time.
8. Configure the maximum
number of hops a probe
packet traverses in the
network.
9. Configure the ToS field in an
IP packet header in an NQA
probe packet.
10. Enable the routing table
bypass function.
probe timeout timeout
ttl value
tos value
route-option bypass-route
Scheduling an NQA test group
You can schedule an NQA test group by setting the start time and test duration for a test group.
A test group performs tests between the scheduled start time and the end time (the start time plus test
duration). If the scheduled start time is ahead of the system time, the test group starts testing immediately.
Optional.
By default, the timeout time is 3000
milliseconds.
Not available for UDP jitter tests.
Optional.
20 by default.
Not available for DHCP tests.
Optional.
0 by default.
Not available for DHCP tests.
Optional.
Disabled by default.
Not available for DHCP tests.
30
Page 43

If both the scheduled start and end time are behind the system time, no test will start. To view the current
system time, use the display clock command.
Configuration prerequisites
Before you schedule an NQA test group, complete the following tasks:
• Configure test parameters required for the test type.
• Configure the NQA server for tests that require cooperation with the NQA server.
Scheduling an NQA test group
To schedule an NQA test group:
Step Command
1. Enter system view.
2. Schedule an NQA test group.
3. Configure the maximum
number of tests that the NQA
client can simultaneously
perform.
system-view N/A
nqa schedule admin-name
operation-tag start-time { hh:mm:ss
[ yyyy/mm/dd ] | now } lifetime
{ lifetime | forever }
nqa agent max-concurrent number
NOTE:
• After an NQA test group is scheduled, you cannot enter the test group view or test type view.
• System adjustment does not affect started or completed test groups. It only affects test groups that have
not started.
Displaying and maintaining NQA
Remarks
now specifies the test group starts
testing immediately.
forever specifies that the tests do
not stop unless you use the undo
nqa schedule command.
Optional.
By default, a maximum of 10 tests
can be simultaneously performed.
Task Command Remarks
Display history records of NQA
test groups.
Display the current monitoring
results of reaction entries.
Display the results of the last NQA
test.
Display statistics of test results for
the specified or all test groups.
Display NQA server status.
display nqa history [ admin-name
operation-tag ] [ | { begin | exclude | include }
regular-expression ]
display nqa reaction counters [ admin-name
operation-tag [ item-number ] ] [ | { begin |
exclude | include } regular-expression ]
display nqa result [ admin-name
operation-tag ] [ | { begin | exclude | include }
regular-expression ]
display nqa statistics [ admin-name
operation-tag ] [ | { begin | exclude | include }
regular-expression ]
display nqa server status [ | { begin | exclude
| include } regular-expression ]
31
Available in any view
Page 44

NQA configuration examples
ICMP echo test configuration example
Network requirements
As shown in Figure 7, configure NQA ICMP echo tests to test whether the NQA client (Device A) can
send packets through a specific next hop to the specified destination (Device B) and test the round-trip
time of the packets.
Figure 7 Network diagram
Device C
10.1.1.2/24
NQA client
10.1.1.1/24 10.2.2.2/24
10.3.1.1/24
10.2.2.1/24
10.4.1.2/24
Device BDevice A
Configuration procedure
NOTE:
Before you make the configuration, make sure the devices can reach each other.
# Create an ICMP echo test group and specify 10.2.2.2 as the destination IP address for ICMP echo
requests to be sent.
<DeviceA> system-view
[DeviceA] nqa entry admin test
[DeviceA-nqa-admin-test] type icmp-echo
[DeviceA-nqa-admin-test-icmp-echo] destination ip 10.2.2.2
# Configure 10.1.1.2 as the next hop IP address for ICMP echo requests. The ICMP echo requests are sent
to Device C to Device B (the destination).
[DeviceA-nqa-admin-test-icmp-echo] next-hop 10.1.1.2
# Configure the device to perform 10 probe operations per test, perform tests at an interval of 5000
milliseconds. Set the NQA probe timeout time as 500 milliseconds.
[DeviceA-nqa-admin-test-icmp-echo] probe count 10
[DeviceA-nqa-admin-test-icmp-echo] probe timeout 500
10.3.1.2/24
Device D
10.4.1.1/24
32
Page 45

[DeviceA-nqa-admin-test-icmp-echo] frequency 5000
# Enable the saving of history records and configure the maximum number of history records that can be
saved for a test group.
[DeviceA-nqa-admin-test-icmp-echo] history-record enable
[DeviceA-nqa-admin-test-icmp-echo] history-record number 10
[DeviceA-nqa-admin-test-icmp-echo] quit
# Start ICMP echo tests.
[DeviceA] nqa schedule admin test start-time now lifetime forever
# Stop the ICMP echo tests after a period of time.
[DeviceA] undo nqa schedule admin test
# Display the results of the last ICMP echo test.
[DeviceA] display nqa result admin test
NQA entry (admin admin, tag test) test results:
Destination IP address: 10.2.2.2
Send operation times: 10 Receive response times: 10
Min/Max/Average round trip time: 2/5/3
Square-Sum of round trip time: 96
Last succeeded probe time: 2007-08-23 15:00:01.2
Extended results:
Packet loss in test: 0%
Failures due to timeout: 0
Failures due to disconnect: 0
Failures due to no connection: 0
Failures due to sequence error: 0
Failures due to internal error: 0
Failures due to other errors: 0
Packet(s) arrived late: 0
# Display the history of ICMP echo tests.
[DeviceA] display nqa history admin test
NQA entry (admin admin, tag test) history record(s):
Index Response Status Time
370 3 Succeeded 2007-08-23 15:00:01.2
369 3 Succeeded 2007-08-23 15:00:01.2
368 3 Succeeded 2007-08-23 15:00:01.2
367 5 Succeeded 2007-08-23 15:00:01.2
366 3 Succeeded 2007-08-23 15:00:01.2
365 3 Succeeded 2007-08-23 15:00:01.2
364 3 Succeeded 2007-08-23 15:00:01.1
363 2 Succeeded 2007-08-23 15:00:01.1
362 3 Succeeded 2007-08-23 15:00:01.1
361 2 Succeeded 2007-08-23 15:00:01.1
33
Page 46

DHCP test configuration example
Network requirements
As shown in Figure 8, configure NQA DHCP tests to test the time required for Router A to obtain an IP
address from the DHCP server (Router B).
Figure 8 Network diagram
Configuration procedure
# Create a DHCP test group and specify interface GigabitEthernet 3/1/1 to perform NQA DHCP tests.
<RouterA> system-view
[RouterA] nqa entry admin test
[RouterA-nqa-admin-test] type dhcp
[RouterA-nqa-admin-test-dhcp] operation interface GigabitEthernet 3/1/1
# Enable the saving of history records.
[RouterA-nqa-admin-test-dhcp] history-record enable
[RouterA-nqa-admin-test-dhcp] quit
# Start DHCP tests.
[RouterA] nqa schedule admin test start-time now lifetime forever
# Stop DHCP tests after a period of time.
[RouterA] undo nqa schedule admin test
# Display the results of the last DHCP test.
[RouterA] display nqa result admin test
NQA entry (admin admin, tag test) test results:
Send operation times: 1 Receive response times: 1
Min/Max/Average round trip time: 512/512/512
Square-Sum of round trip time: 262144
Last succeeded probe time: 2007-11-22 09:54:03.8
Extended results:
Packet loss in test: 0%
Failures due to timeout: 0
Failures due to disconnect: 0
Failures due to no connection: 0
Failures due to sequence error: 0
Failures due to internal error: 0
Failures due to other errors: 0
Packet(s) arrived late: 0
# Display the history of DHCP tests.
[RouterA] display nqa history admin test
NQA entry (admin admin, tag test) history record(s):
Index Response Status Time
34
Page 47

1 512 Succeeded 2007-11-22 09:54:03.8
DNS test configuration example
Network requirements
As shown in Figure 9, configure NQA DNS tests to test whether Device A can translate the domain name
host.com into an IP address through the DNS server and test the time required for resolution.
Figure 9 Network diagram
Configuration procedure
NOTE:
Before you make the configuration, make sure the devices can reach each other.
# Create a DNS test group.
<DeviceA> system-view
[DeviceA] nqa entry admin test
[DeviceA-nqa-admin-test] type dns
# Specify the IP address of the DNS server 10.2.2.2 as the destination address for DNS tests, and specify
the domain name that needs to be translated as host.com.
[DeviceA-nqa-admin-test-dns] destination ip 10.2.2.2
[DeviceA-nqa-admin-test-dns] resolve-target host.com
# Enable the saving of history records.
[DeviceA-nqa-admin-test-dns] history-record enable
[DeviceA-nqa-admin-test-dns] quit
# Start DNS tests.
[DeviceA] nqa schedule admin test start-time now lifetime forever
# Stop the DNS tests after a period of time.
[DeviceA] undo nqa schedule admin test
# Display the results of the last DNS test.
[DeviceA] display nqa result admin test
NQA entry (admin admin, tag test) test results:
Destination IP address: 10.2.2.2
Send operation times: 1 Receive response times: 1
Min/Max/Average round trip time: 62/62/62
Square-Sum of round trip time: 3844
Last succeeded probe time: 2008-11-10 10:49:37.3
Extended results:
Packet loss in test: 0%
Failures due to timeout: 0
Failures due to disconnect: 0
35
Page 48
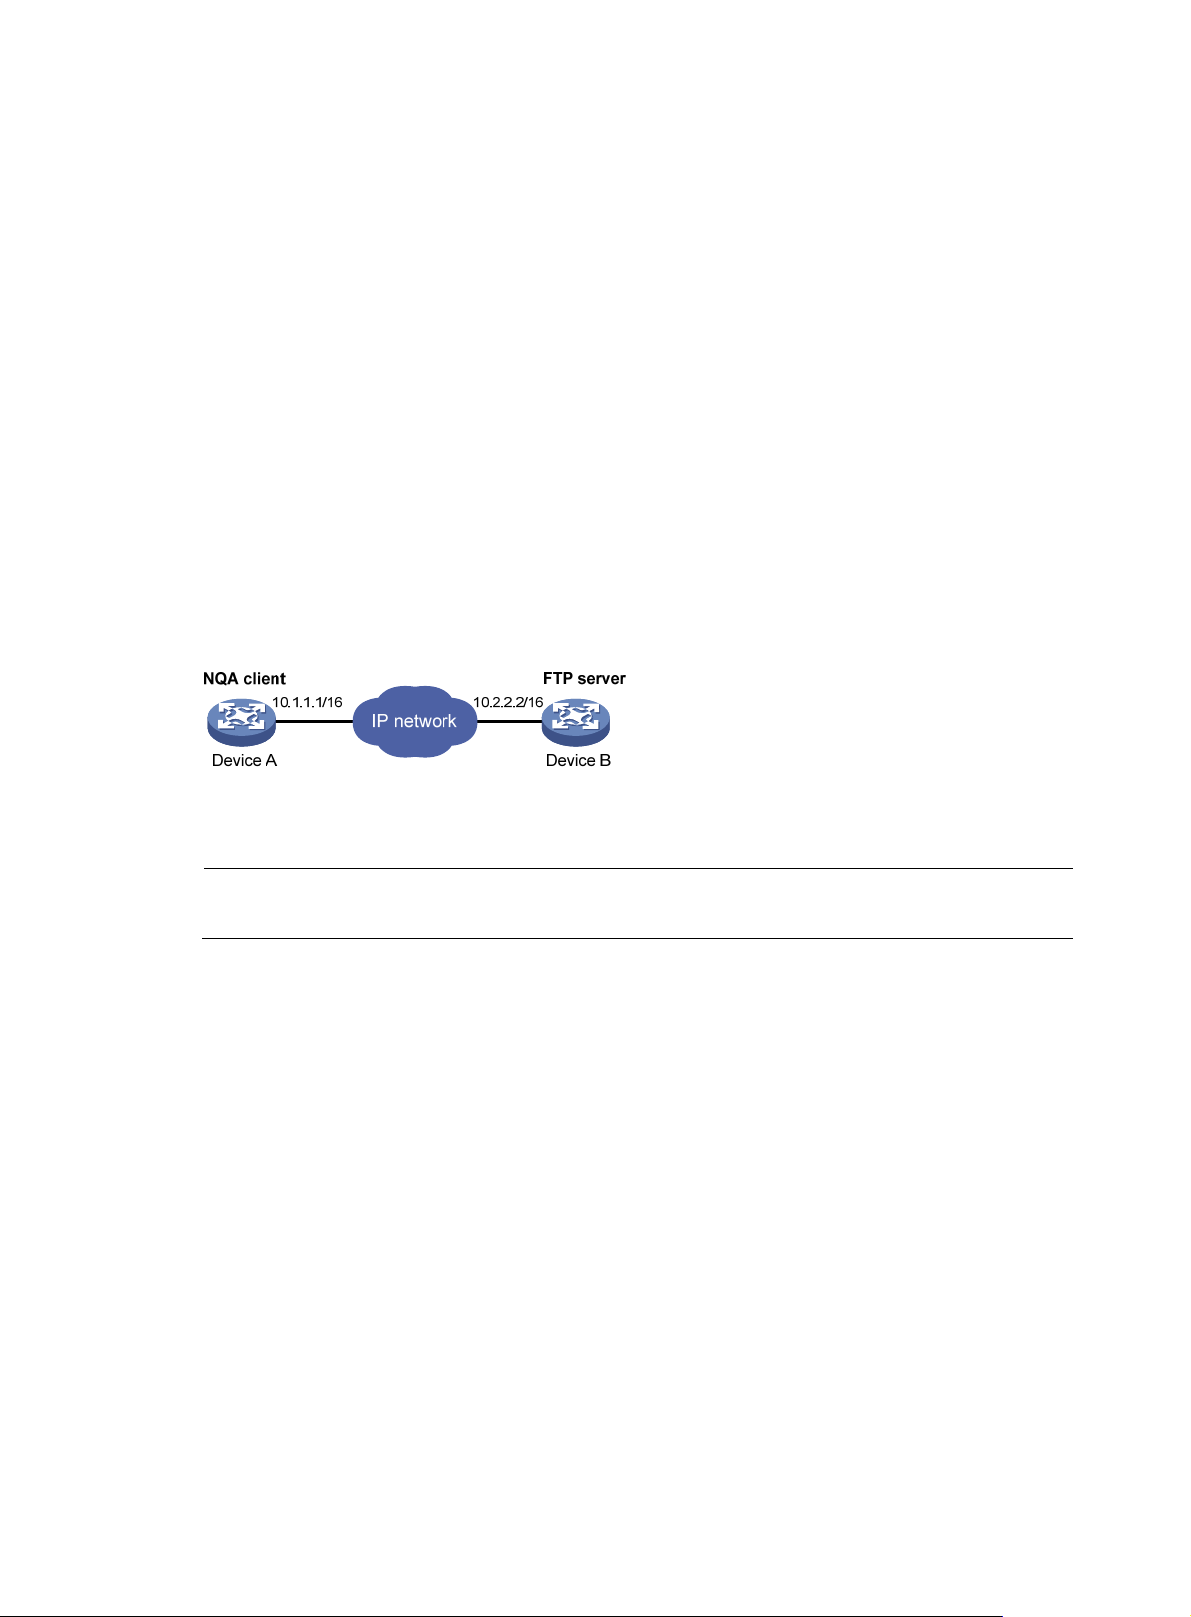
Failures due to no connection: 0
Failures due to sequence error: 0
Failures due to internal error: 0
Failures due to other errors: 0
Packet(s) arrived late: 0
# Display the history of DNS tests.
[DeviceA] display nqa history admin test
NQA entry (admin admin, tag test) history record(s):
Index Response Status Time
1 62 Succeeded 2008-11-10 10:49:37.3
FTP test configuration example
Network requirements
As shown in Figure 10, configure NQA FTP tests to test the connection with a specific FTP server and the
time required for Device A to upload a file to the FTP server. The login username is admin, the login
password is systemtest, and the file to be transferred to the FTP server is config.txt.
Figure 10 Network diagram
Configuration procedure
NOTE:
Before you make the configuration, make sure the devices can reach each other.
# Create an FTP test group.
<DeviceA> system-view
[DeviceA] nqa entry admin test
[DeviceA-nqa-admin-test] type ftp
# Specify the IP address of the FTP server 10.2.2.2 as the destination IP address for FTP tests.
[DeviceA-nqa-admin-test-ftp] destination ip 10.2.2.2
# Specify 10.1.1.1 as the source IP address for probe packets.
[DeviceA-nqa-admin-test-ftp] source ip 10.1.1.1
# Set the FTP username to admin, and password to systemtest.
[DeviceA-nqa-admin-test-ftp] username admin
[DeviceA-nqa-admin-test-ftp] password systemtest
# Configure the device to upload file config.txt to the FTP server for each probe operation.
[DeviceA-nqa-admin-test-ftp] operation put
[DeviceA-nqa-admin-test-ftp] filename config.txt
# Enable the saving of history records.
[DeviceA-nqa-admin-test-ftp] history-record enable
[DeviceA-nqa-admin-test-ftp] quit
36
Page 49
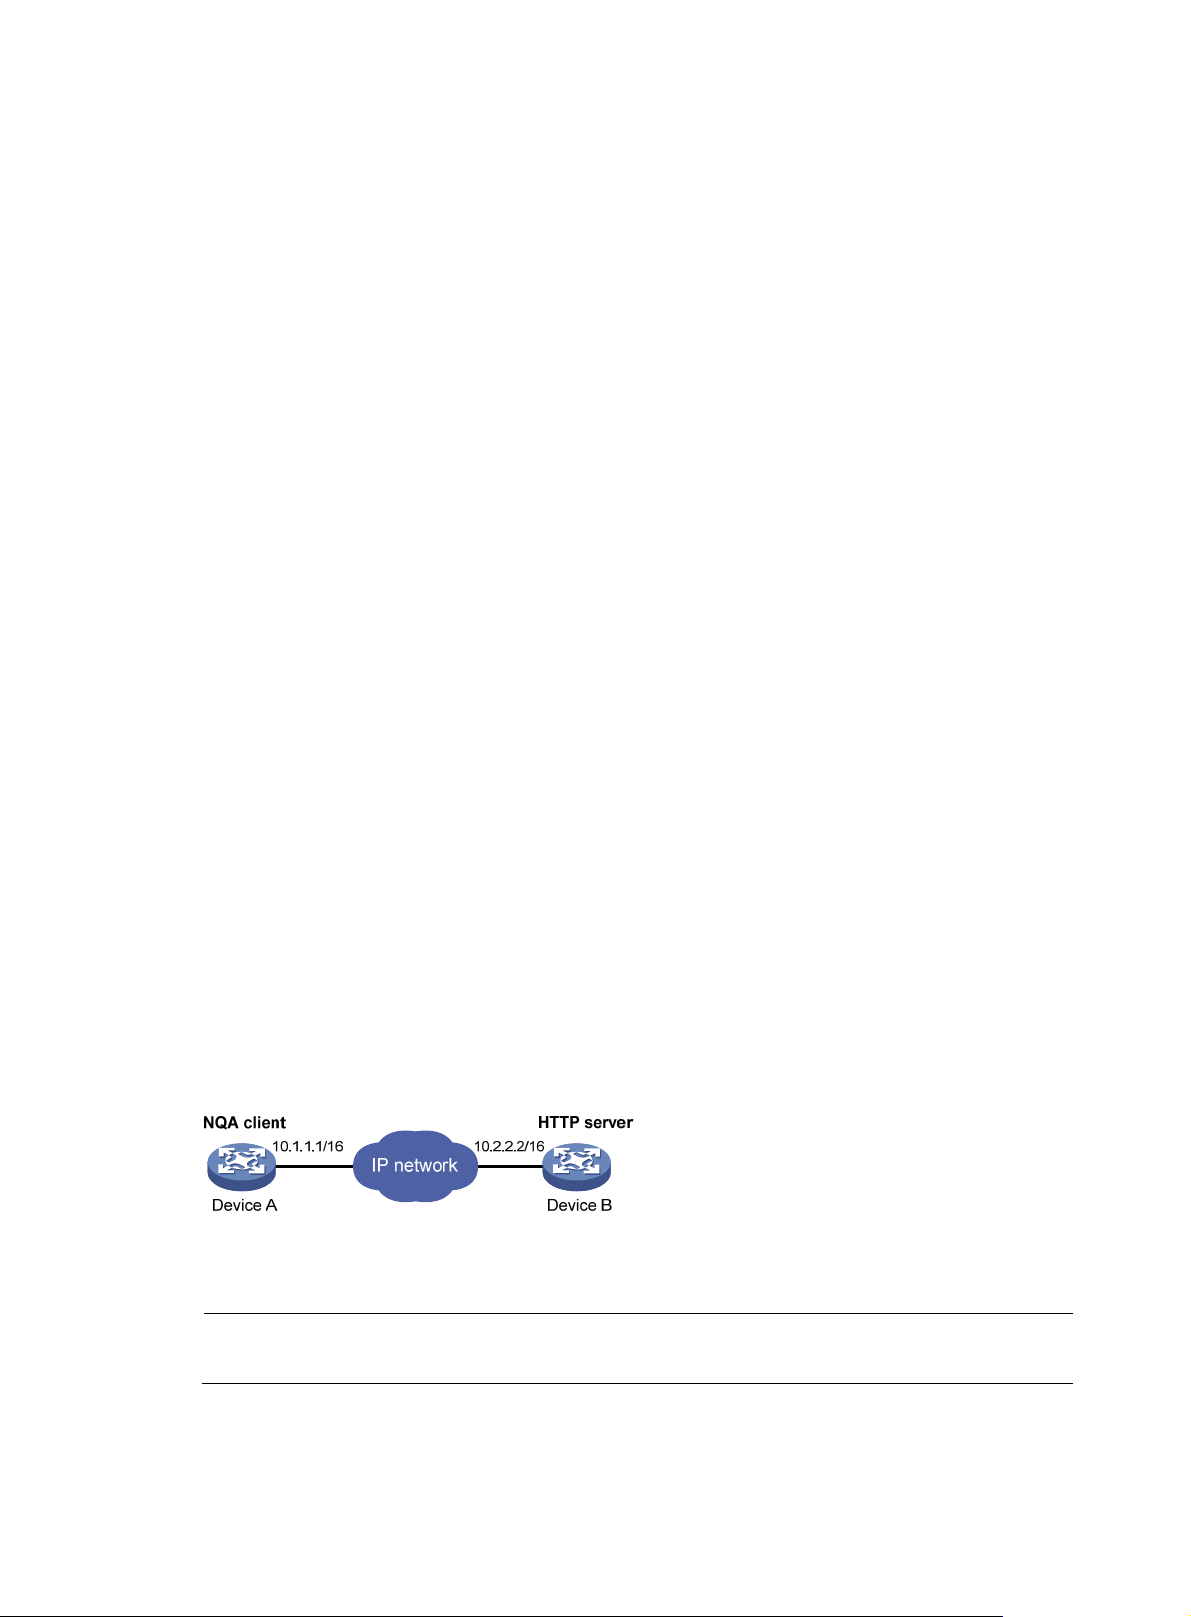
# Start FTP tests.
[DeviceA] nqa schedule admin test start-time now lifetime forever
# Stop the FTP tests after a period of time.
[DeviceA] undo nqa schedule admin test
# Display the results of the last FTP test.
[DeviceA] display nqa result admin test
NQA entry (admin admin, tag test) test results:
Destination IP address: 10.2.2.2
Send operation times: 1 Receive response times: 1
Min/Max/Average round trip time: 173/173/173
Square-Sum of round trip time: 29929
Last succeeded probe time: 2007-11-22 10:07:28.6
Extended results:
Packet loss in test: 0%
Failures due to timeout: 0
Failures due to disconnect: 0
Failures due to no connection: 0
Failures due to sequence error: 0
Failures due to internal error: 0
Failures due to other errors: 0
Packet(s) arrived late: 0
# Display the history of FTP tests.
[DeviceA] display nqa history admin test
NQA entry (admin admin, tag test) history record(s):
Index Response Status Time
1 173 Succeeded 2007-11-22 10:07:28.6
HTTP test configuration example
Network requirements
As shown in Figure 11, configure NQA HTTP tests to test the connection with a specific HTTP server and
the time required to obtain data from the HTTP server.
Figure 11 Network diagram
Configuration procedure
NOTE:
Before you make the configuration, make sure the devices can reach each other.
# Create an HTTP test group.
<DeviceA> system-view
[DeviceA] nqa entry admin test
37
Page 50

[DeviceA-nqa-admin-test] type http
# Specify the IP address of the HTTP server 10.2.2.2 as the destination IP address for HTTP tests.
[DeviceA-nqa-admin-test-http] destination ip 10.2.2.2
# Configure the device to get data from the HTTP server for each HTTP probe operation. (get is the default
HTTP operation type, and this step can be omitted.)
[DeviceA-nqa-admin-test-http] operation get
# Configure HTTP tests to visit website /index.htm.
[DeviceA-nqa-admin-test-http] url /index.htm
# configu re the HT TP version 1.0 to be used in HTTP tests. (Vers ion 1.0 is the default version, and this step
can be omitted.)
[DeviceA-nqa-admin-test-http] http-version v1.0
# Enable the saving of history records.
[DeviceA-nqa-admin-test-http] history-record enable
[DeviceA-nqa-admin-test-http] quit
# Start HTTP tests.
[DeviceA] nqa schedule admin test start-time now lifetime forever
# Stop HTTP tests after a period of time.
[DeviceA] undo nqa schedule admin test
# Display results of the last HTTP test.
[DeviceA] display nqa result admin test
NQA entry (admin admin, tag test) test results:
Destination IP address: 10.2.2.2
Send operation times: 1 Receive response times: 1
Min/Max/Average round trip time: 64/64/64
Square-Sum of round trip time: 4096
Last succeeded probe time: 2007-11-22 10:12:47.9
Extended results:
Packet loss in test: 0%
Failures due to timeout: 0
Failures due to disconnect: 0
Failures due to no connection: 0
Failures due to sequence error: 0
Failures due to internal error: 0
Failures due to other errors:
Packet(s) arrived late: 0
# Display the history of HTTP tests.
[DeviceA] display nqa history admin test
NQA entry (admin admin, tag test) history record(s):
Index Response Status Time
1 64 Succeeded 2007-11-22 10:12:47.9
38
Page 51

UDP jitter test configuration example
Network requirements
As shown in Figure 12, configure NQA UDP jitter tests to test the delay jitter of packet transmission
between Device A and Device B.
Figure 12 Network diagram
Configuration procedure
NOTE:
Before you make the configuration, make sure the devices can reach each other.
1. Configure Device B:
# Enable the NQA server and configure a listening service to listen to IP address 10.2.2.2 and
UDP port 9000.
<DeviceB> system-view
[DeviceB] nqa server enable
[DeviceB] nqa server udp-echo 10.2.2.2 9000
2. Configure Device A:
# Create a UDP jitter test group.
<DeviceA> system-view
[DeviceA] nqa entry admin test
[DeviceA-nqa-admin-test] type udp-jitter
# Configure UDP jitter packets to use 10.2.2.2 as the destination IP address and port 9000 as the
destination port.
[DeviceA-nqa-admin-test-udp-jitter] destination ip 10.2.2.2
[DeviceA-nqa-admin-test-udp-jitter] destination port 9000
# Configure the device to perform UDP jitter tests at an interval of 1000 milliseconds.
[DeviceA-nqa-admin-test-udp-jitter] frequency 1000
[DeviceA-nqa-admin-test-udp-jitter] quit
# Start UDP jitter tests.
[DeviceA] nqa schedule admin test start-time now lifetime forever
# Stop UDP jitter tests after a period of time.
[DeviceA] undo nqa schedule admin test
# Display the result of the last UDP jitter test.
[DeviceA] display nqa result admin test
NQA entry (admin admin, tag test) test results:
Destination IP address: 10.2.2.2
Send operation times: 10 Receive response times: 10
Min/Max/Average round trip time: 15/32/17
Square-Sum of round trip time: 3235
39
Page 52

Last succeeded probe time: 2008-05-29 13:56:17.6
Extended results:
Packet loss in test: 0%
Failures due to timeout: 0
Failures due to disconnect: 0
Failures due to no connection: 0
Failures due to sequence error: 0
Failures due to internal error: 0
Failures due to other errors: 0
Packet(s) arrived late: 0
UDP-jitter results:
RTT number: 10
Min positive SD: 4 Min positive DS: 1
Max positive SD: 21 Max positive DS: 28
Positive SD number: 5 Positive DS number: 4
Positive SD sum: 52 Positive DS sum: 38
Positive SD average: 10 Positive DS average: 10
Positive SD square sum: 754 Positive DS square sum: 460
Min negative SD: 1 Min negative DS: 6
Max negative SD: 13 Max negative DS: 22
Negative SD number: 4 Negative DS number: 5
Negative SD sum: 38 Negative DS sum: 52
Negative SD average: 10 Negative DS average: 10
Negative SD square sum: 460 Negative DS square sum: 754
One way results:
Max SD delay: 15 Max DS delay: 16
Min SD delay: 7 Min DS delay: 7
Number of SD delay: 10 Number of DS delay: 10
Sum of SD delay: 78 Sum of DS delay: 85
Square sum of SD delay: 666 Square sum of DS delay: 787
SD lost packet(s): 0 DS lost packet(s): 0
Lost packet(s) for unknown reason: 0
# Display the statistics of UDP jitter tests.
[DeviceA] display nqa statistics admin test
NQA entry (admin admin, tag test) test statistics:
NO. : 1
Destination IP address: 10.2.2.2
Start time: 2008-05-29 13:56:14.0
Life time: 47 seconds
Send operation times: 410 Receive response times: 410
Min/Max/Average round trip time: 1/93/19
Square-Sum of round trip time: 206176
Extended results:
Packet loss in test: 0%
Failures due to timeout: 0
Failures due to disconnect: 0
Failures due to no connection: 0
Failures due to sequence error: 0
40
Page 53

Failures due to internal error: 0
Failures due to other errors: 0
Packet(s) arrived late: 0
UDP-jitter results:
RTT number: 410
Min positive SD: 3 Min positive DS: 1
Max positive SD: 30 Max positive DS: 79
Positive SD number: 186 Positive DS number: 158
Positive SD sum: 2602 Positive DS sum: 1928
Positive SD average: 13 Positive DS average: 12
Positive SD square sum: 45304 Positive DS square sum: 31682
Min negative SD: 1 Min negative DS: 1
Max negative SD: 30 Max negative DS: 78
Negative SD number: 181 Negative DS number: 209
Negative SD sum: 181 Negative DS sum: 209
Negative SD average: 13 Negative DS average: 14
Negative SD square sum: 46994 Negative DS square sum: 3030
One way results:
Max SD delay: 46 Max DS delay: 46
Min SD delay: 7 Min DS delay: 7
Number of SD delay: 410 Number of DS delay: 410
Sum of SD delay: 3705 Sum of DS delay: 3891
Square sum of SD delay: 45987 Square sum of DS delay: 49393
SD lost packet(s): 0 DS lost packet(s): 0
Lost packet(s) for unknown reason: 0
NOTE:
The display nqa history command does not show the results of UDP jitter tests. To know the result of a UDP
jitter test, use the display nqa result command to view the probe results of the latest NQA test, or use the
display nqa statistics command to view the statistics of NQA tests.
SNMP test configuration example
Network requirements
As shown in Figure 13, configure NQA SNM P tests to test the time it takes for Device A to send an SNMP
query packet to the SNMP agent and receive a response packet.
Figure 13 Network diagram
Configuration procedure
NOTE:
Before you make the configuration, make sure the devices can reach each other.
41
Page 54

1. Configurations on SNMP agent (Device B):
# Enable the SNMP agent service and set the SNMP version to all, the read community to public,
and the write community to private.
<DeviceB> system-view
[DeviceB] snmp-agent sys-info version all
[DeviceB] snmp-agent community read public
[DeviceB] snmp-agent community write private
2. Configurations on Device A:
# Create an SNMP test group and configure SNMP packets to use 10.2.2.2 as their destination
IP address.
<DeviceA> system-view
[DeviceA] nqa entry admin test
[DeviceA-nqa-admin-test] type snmp
[DeviceA-nqa-admin-test-snmp] destination ip 10.2.2.2
# Enable the saving of history records.
[DeviceA-nqa-admin-test-snmp] history-record enable
[DeviceA-nqa-admin-test-snmp] quit
# Start SNMP tests.
[DeviceA] nqa schedule admin test start-time now lifetime forever
# Stop the SNMP tests after a period of time.
[DeviceA] undo nqa schedule admin test
# Display the results of the last SNMP test.
[DeviceA] display nqa result admin test
NQA entry (admin admin, tag test) test results:
Destination IP address: 10.2.2.2
Send operation times: 1 Receive response times: 1
Min/Max/Average round trip time: 50/50/50
Square-Sum of round trip time: 2500
Last succeeded probe time: 2007-11-22 10:24:41.1
Extended results:
Packet loss in test: 0%
Failures due to timeout: 0
Failures due to disconnect: 0
Failures due to no connection: 0
Failures due to sequence error: 0
Failures due to internal error: 0
Failures due to other errors: 0
Packet(s) arrived late: 0
# Display the history of SNMP tests.
[DeviceA] display nqa history admin test
NQA entry (admin admin, tag test) history record(s):
Index Response Status Time
1 50 Timeout 2007-11-22 10:24:41.1
42
Page 55
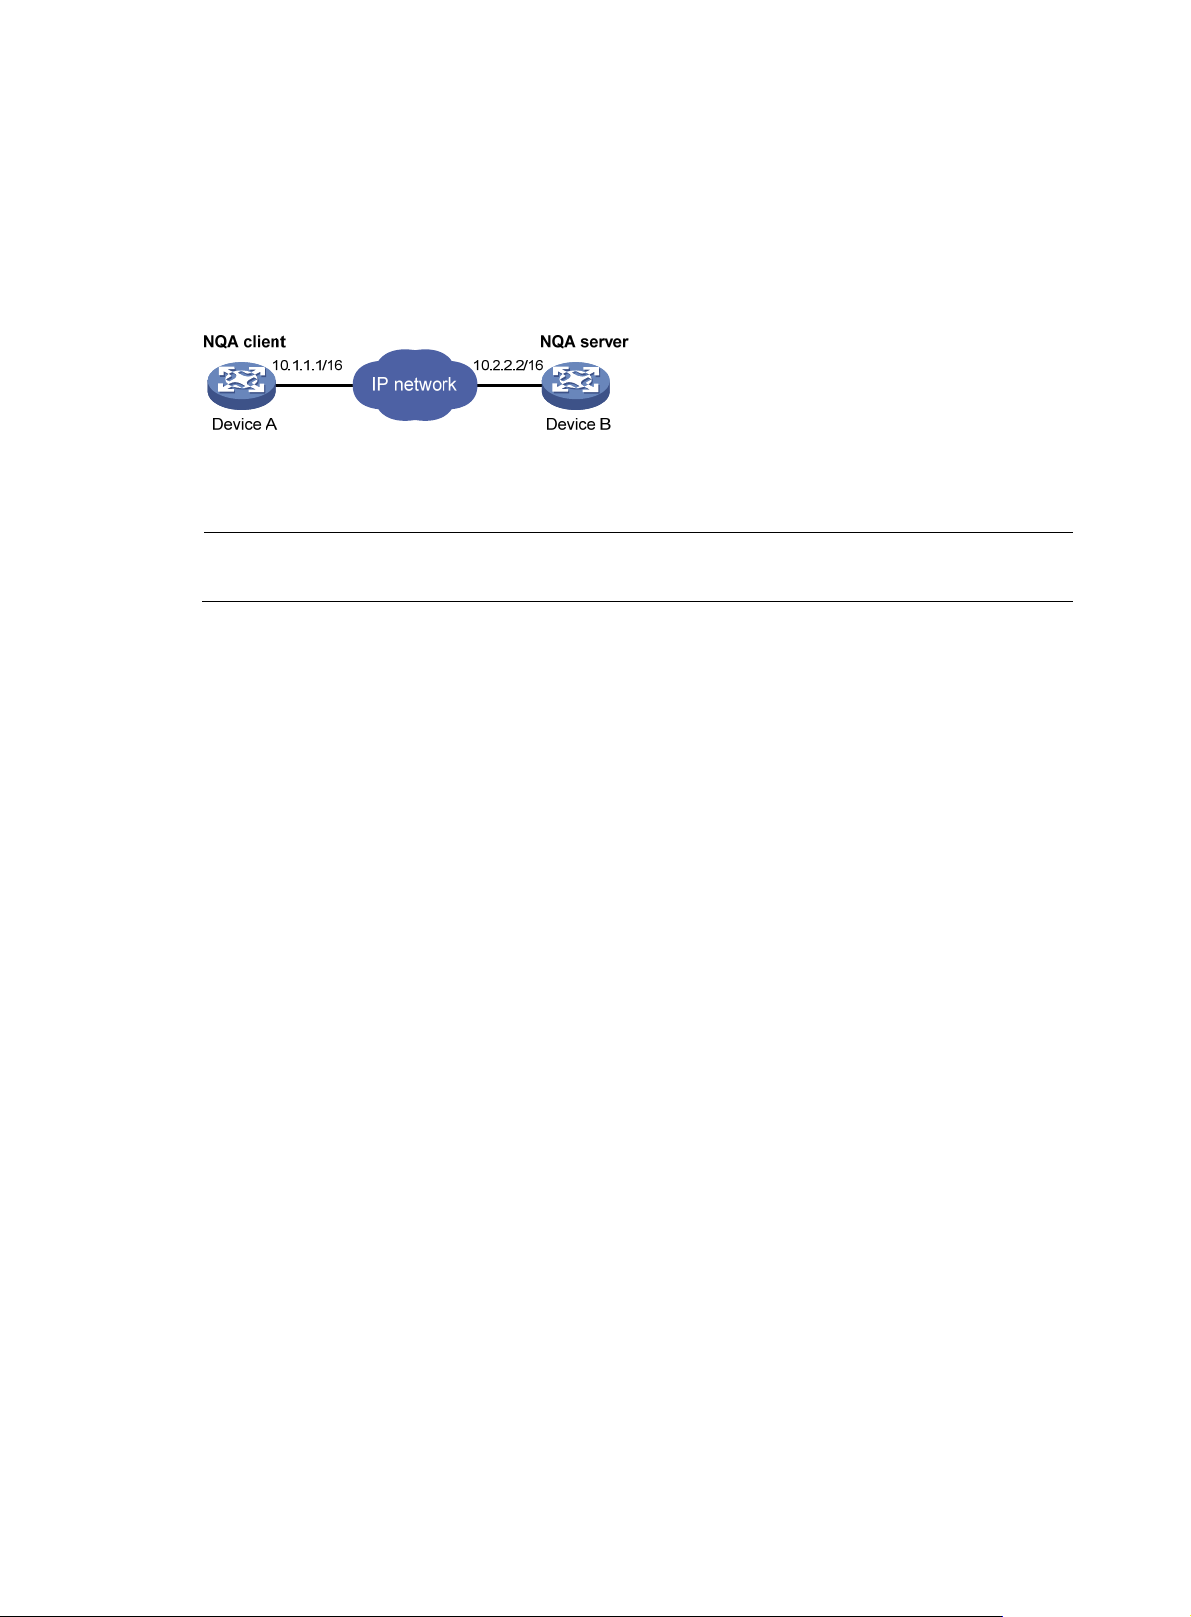
TCP test configuration example
Network requirements
As shown in Figure 14, configure NQA TCP tests to test the time for establishing a TCP connection
between Device A and Device B.
Figure 14 Network diagram
Configuration procedure
NOTE:
Before you make the configuration, make sure the devices can reach each other.
1. Configure Device B:
# Enable the NQA server and configure a listening service to listen to IP address 10.2.2.2 and
TCP port 9000.
<DeviceB> system-view
[DeviceB] nqa server enable
[DeviceB] nqa server tcp-connect 10.2.2.2 9000
2. Configure Device A:
# Create a TCP test group.
<DeviceA> system-view
[DeviceA] nqa entry admin test
[DeviceA-nqa-admin-test] type tcp
# Configure TCP probe packets to use 10.2.2.2 as the destination IP address and port 9000 as
the destination port.
[DeviceA-nqa-admin-test-tcp] destination ip 10.2.2.2
[DeviceA-nqa-admin-test-tcp] destination port 9000
# Enable the saving of history records.
[DeviceA-nqa-admin-test-tcp] history-record enable
[DeviceA-nqa-admin-test-tcp] quit
# Start TCP tests.
[DeviceA] nqa schedule admin test start-time now lifetime forever
# Stop the TCP tests after a period of time.
[DeviceA] undo nqa schedule admin test
# Display the results of the last TCP test.
[DeviceA] display nqa result admin test
NQA entry (admin admin, tag test) test results:
Destination IP address: 10.2.2.2
Send operation times: 1 Receive response times: 1
Min/Max/Average round trip time: 13/13/13
Square-Sum of round trip time: 169
43
Page 56
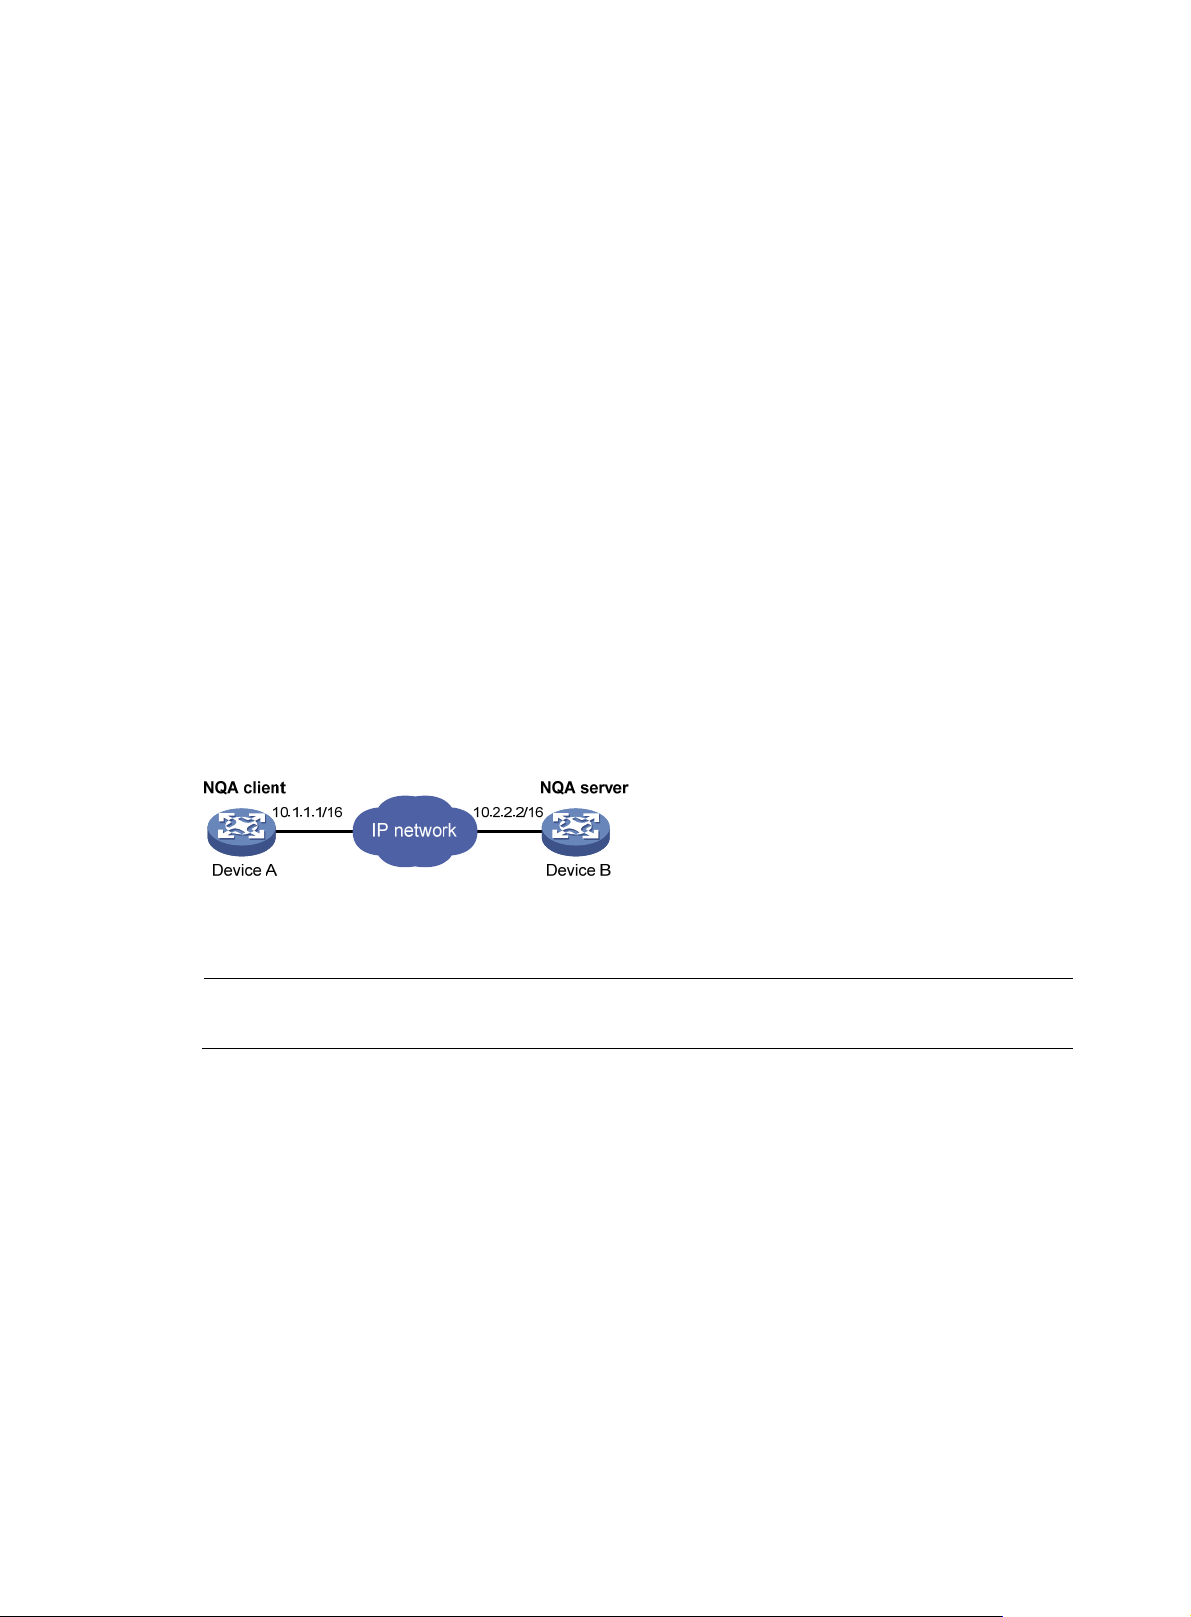
Last succeeded probe time: 2007-11-22 10:27:25.1
Extended results:
Packet loss in test: 0%
Failures due to timeout: 0
Failures due to disconnect: 0
Failures due to no connection: 0
Failures due to sequence error: 0
Failures due to internal error: 0
Failures due to other errors: 0
Packet(s) arrived late: 0
# Display the history of TCP tests.
[DeviceA] display nqa history admin test
NQA entry (admin admin, tag test) history record(s):
Index Response Status Time
1 13 Succeeded 2007-11-22 10:27:25.1
UDP echo test configuration example
Network requirements
As shown in Figure 15, configure NQA UDP echo tests to test the round-trip time between Device A and
Device B. The destination port number is 8000.
Figure 15 Network diagram
Configuration procedure
NOTE:
Before you make the configuration, make sure the devices can reach each other.
1. Configure Device B:
# Enable the NQA server and configure a listening service to listen to IP address 10.2.2.2 and
UDP port 8000.
<DeviceB> system-view
[DeviceB] nqa server enable
[DeviceB] nqa server udp-echo 10.2.2.2 8000
2. Configure Device A:
# Create a UDP echo test group.
<DeviceA> system-view
[DeviceA] nqa entry admin test
[DeviceA-nqa-admin-test] type udp-echo
# Configure UDP packets to use 10.2.2.2 as the destination IP address and port 8000 as the
destination port.
[DeviceA-nqa-admin-test-udp-echo] destination ip 10.2.2.2
44
Page 57

[DeviceA-nqa-admin-test-udp-echo] destination port 8000
# Enable the saving of history records.
[DeviceA-nqa-admin-test-udp-echo] history-record enable
[DeviceA-nqa-admin-test-udp-echo] quit
# Start UDP echo tests.
[DeviceA] nqa schedule admin test start-time now lifetime forever
# Stop UDP echo tests after a period of time.
[DeviceA] undo nqa schedule admin test
# Display the results of the last UDP echo test.
[DeviceA] display nqa result admin test
NQA entry (admin admin, tag test) test results:
Destination IP address: 10.2.2.2
Send operation times: 1 Receive response times: 1
Min/Max/Average round trip time: 25/25/25
Square-Sum of round trip time: 625
Last succeeded probe time: 2007-11-22 10:36:17.9
Extended results:
Packet loss in test: 0%
Failures due to timeout: 0
Failures due to disconnect: 0
Failures due to no connection: 0
Failures due to sequence error: 0
Failures due to internal error: 0
Failures due to other errors: 0
Packet(s) arrived late: 0
# Display the history of UDP echo tests.
[DeviceA] display nqa history admin test
NQA entry (admin admin, tag test) history record(s):
Index Response Status Time
1 25 Succeeded 2007-11-22 10:36:17.9
Voice test configuration example
Network requirements
As shown in Figure 16, configure NQA voice tests to test the delay jitter of voice packet transmission and
voice quality between Device A and Device B.
Figure 16 Network diagram
Configuration procedure
45
Page 58

NOTE:
Before you make the configuration, make sure the devices can reach each other.
1. Configure Device B:
# Enable the NQA server and configure a listening service to listen to IP address 10.2.2.2 and
UDP port 9000.
<DeviceB> system-view
[DeviceB] nqa server enable
[DeviceB] nqa server udp-echo 10.2.2.2 9000
2. Configure Device A:
# Create a voice test group.
<DeviceA> system-view
[DeviceA] nqa entry admin test
[DeviceA-nqa-admin-test] type voice
# Configure voice probe packets to use 10.2.2.2 as the destination IP address and port 9000 as
the destination port.
[DeviceA-nqa-admin-test-voice] destination ip 10.2.2.2
[DeviceA-nqa-admin-test-voice] destination port 9000
[DeviceA-nqa-admin-test-voice] quit
# Start voice tests.
[DeviceA] nqa schedule admin test start-time now lifetime forever
# Stop the voice tests after a period of time.
[DeviceA] undo nqa schedule admin test
# Display the result of the last voice test.
[DeviceA] display nqa result admin test
NQA entry (admin admin, tag test) test results:
Destination IP address: 10.2.2.2
Send operation times: 1000 Receive response times: 1000
Min/Max/Average round trip time: 31/1328/33
Square-Sum of round trip time: 2844813
Last succeeded probe time: 2008-06-13 09:49:31.1
Extended results:
Packet loss in test: 0%
Failures due to timeout: 0
Failures due to disconnect: 0
Failures due to no connection: 0
Failures due to sequence error: 0
Failures due to internal error: 0
Failures due to other errors: 0
Packet(s) arrived late: 0
Voice results:
RTT number: 1000
Min positive SD: 1 Min positive DS: 1
Max positive SD: 204 Max positive DS: 1297
Positive SD number: 257 Positive DS number: 259
Positive SD sum: 759 Positive DS sum: 1797
Positive SD average: 2 Positive DS average: 6
46
Page 59

Positive SD square sum: 54127 Positive DS square sum: 1691967
Min negative SD: 1 Min negative DS: 1
Max negative SD: 203 Max negative DS: 1297
Negative SD number: 255 Negative DS number: 259
Negative SD sum: 759 Negative DS sum: 1796
Negative SD average: 2 Negative DS average: 6
Negative SD square sum: 53655 Negative DS square sum: 1691776
One way results:
Max SD delay: 343 Max DS delay: 985
Min SD delay: 343 Min DS delay: 985
Number of SD delay: 1 Number of DS delay: 1
Sum of SD delay: 343 Sum of DS delay: 985
Square sum of SD delay: 117649 Square sum of DS delay: 970225
SD lost packet(s): 0 DS lost packet(s): 0
Lost packet(s) for unknown reason: 0
Voice scores:
MOS value: 4.38 ICPIF value: 0
# Display the statistics of voice tests.
[DeviceA] display nqa statistics admin test
NQA entry (admin admin, tag test) test statistics:
NO. : 1
Destination IP address: 10.2.2.2
Start time: 2008-06-13 09:45:37.8
Life time: 331 seconds
Send operation times: 4000 Receive response times: 4000
Min/Max/Average round trip time: 15/1328/32
Square-Sum of round trip time: 7160528
Extended results:
Packet loss in test: 0%
Failures due to timeout: 0
Failures due to disconnect: 0
Failures due to no connection: 0
Failures due to sequence error: 0
Failures due to internal error: 0
Failures due to other errors: 0
Packet(s) arrived late: 0
Voice results:
RTT number: 4000
Min positive SD: 1 Min positive DS: 1
Max positive SD: 360 Max positive DS: 1297
Positive SD number: 1030 Positive DS number: 1024
Positive SD sum: 4363 Positive DS sum: 5423
Positive SD average: 4 Positive DS average: 5
Positive SD square sum: 497725 Positive DS square sum: 2254957
Min negative SD: 1 Min negative DS: 1
Max negative SD: 360 Max negative DS: 1297
Negative SD number: 1028 Negative DS number: 1022
Negative SD sum: 1028 Negative DS sum: 1022
47
Page 60

NOTE:
Negative SD average: 4 Negative DS average: 5
Negative SD square sum: 495901 Negative DS square sum: 5419
One way results:
Max SD delay: 359 Max DS delay: 985
Min SD delay: 0 Min DS delay: 0
Number of SD delay: 4 Number of DS delay: 4
Sum of SD delay: 1390 Sum of DS delay: 1079
Square sum of SD delay: 483202 Square sum of DS delay: 973651
SD lost packet(s): 0 DS lost packet(s): 0
Lost packet(s) for unknown reason: 0
Voice scores:
Max MOS value: 4.38 Min MOS value: 4.38
Max ICPIF value: 0 Min ICPIF value: 0
The display nqa history command cannot show you the results of voice tests. To know the result of a voice
test, use the display nqa result command to view the probe results of the latest NQA test, or use the
display nqa statistics command to view the statistics of NQA tests.
DLSw test configuration example
Network requirements
As shown in Figure 17, configure NQA DLSw tests to test the response time of the DLSw device.
Figure 17 Network diagram
Configuration procedure
NOTE:
Before you make the configuration, make sure the devices can reach each other.
# Create a DLSw test group and configure DLSw probe packets to use 10.2.2.2 as the destination IP
address.
<DeviceA> system-view
[DeviceA] nqa entry admin test
[DeviceA-nqa-admin-test] type dlsw
[DeviceA-nqa-admin-test-dlsw] destination ip 10.2.2.2
# Enable the saving of history records.
[DeviceA-nqa-admin-test-dlsw] history-record enable
[DeviceA-nqa-admin-test-dlsw] quit
# Start DLSw tests.
[DeviceA] nqa schedule admin test start-time now lifetime forever
48
Page 61

# Stop the DLSw tests after a period of time.
[DeviceA] undo nqa schedule admin test
# Display the result of the last DLSw test.
[DeviceA] display nqa result admin test
NQA entry (admin admin, tag test) test results:
Destination IP address: 10.2.2.2
Send operation times: 1 Receive response times: 1
Min/Max/Average round trip time: 19/19/19
Square-Sum of round trip time: 361
Last succeeded probe time: 2007-11-22 10:40:27.7
Extended results:
Packet loss in test: 0%
Failures due to timeout: 0
Failures due to disconnect: 0
Failures due to no connection: 0
Failures due to sequence error: 0
Failures due to internal error: 0
Failures due to other errors: 0
Packet(s) arrived late: 0
# Display the history of DLSw tests.
[DeviceA] display nqa history admin test
NQA entry (admin admin, tag test) history record(s):
Index Response Status Time
1 19 Succeeded 2007-11-22 10:40:27.7
NQA collaboration configuration example
Network requirements
As shown in Figure 18, configure a static route to Router C on Router A, with Router B as the next hop.
Associate the static route, track entry, and NQA test group to verify whether the static route is active in
real time.
Figure 18 Network diagram
Router B
GE3/1//1
10.2.1.1/24
GE3/1//1
10.2.1.2/24
GE3/1//2
10.1.1.1/24
GE3/1//1
10.1.1.2/24
Router A
Configuration procedure
1. Assign each interface an IP address. (Details not shown)
2. On Router A, configure a unicast static route and associate the static route with a track entry.
Router C
49
Page 62

# Configure a static route, whose destination address is 10.2.1.1, and associate the static route
with track entry 1.
<RouterA> system-view
[RouterA] ip route-static 10.1.1.2 24 10.2.1.1 track 1
3. On Router A, create an NQA test group:
# Create an NQA test group with the administrator name being admin and operation tag being
test.
[RouterA] nqa entry admin test
# Configure the test type of the NQA test group as ICMP echo.
[RouterA-nqa-admin-test] type icmp-echo
# Configure ICMP echo requests to use 10.2.2.1 as the destination IP address.
[RouterA-nqa-admin-test-icmp-echo] destination ip 10.2.1.1
# Configure the device to perform tests at an interval of 100 milliseconds.
[RouterA-nqa-admin-test-icmp-echo] frequency 100
# Create reaction entry 1. If the number of consecutive probe failures reaches 5, collaboration
with other modules is triggered.
[RouterA-nqa-admin-test-icmp-echo] reaction 1 checked-element probe-fail
threshold-type consecutive 5 action-type trigger-only
[RouterA-nqa-admin-test-icmp-echo] quit
# Configure the test start time and test duration for the test group.
[RouterA] nqa schedule admin test start-time now lifetime forever
4. On Router A, create the track entry:
# Create track entry 1 to associate it with Reaction entry 1 of the NQA test group (admin-test).
[RouterA] track 1 nqa entry admin test reaction 1
Verifying the configuration
# On Router A, display information about all the track entries.
[RouterA] display track all
Track ID: 1
Status: Positive
Notification delay: Positive 0, Negative 0 (in seconds)
Reference object:
NQA entry: admin test
Reaction: 1
# Display brief information about active routes in the routing table on Router A.
[RouterA] display ip routing-table
Routing Tables: Public
Destinations : 5 Routes : 5
Destination/Mask Proto Pre Cost NextHop Interface
10.1.1.0/24 Static 60 0 10.2.1.1 GE3/1/1
10.2.1.0/24 Direct 0 0 10.2.1.2 GE3/1/1
10.2.1.2/32 Direct 0 0 127.0.0.1 InLoop0
127.0.0.0/8 Direct 0 0 127.0.0.1 InLoop0
127.0.0.1/32 Direct 0 0 127.0.0.1 InLoop0
50
Page 63

The output shows that the static route with the next hop 10.2.1.1 is active, and the status of the track entry
is positive. The static route configuration works.
# Remove the IP address of GigabitEthernet 3/1/1 on Router B.
<RouterB> system-view
[RouterB] interface GigabitEthernet 3/1/1
[RouterB- GigabitEthernet3/1/1] undo ip address
# On Router A, display information about all the track entries.
[RouterA] display track all
Track ID: 1
Status: Negative
Notification delay: Positive 0, Negative 0 (in seconds)
Reference object:
NQA entry: admin test
Reaction: 1
# Display brief information about active routes in the routing table on Router A.
[RouterA] display ip routing-table
Routing Tables: Public
Destinations : 4 Routes : 4
Destination/Mask Proto Pre Cost NextHop Interface
10.2.1.0/24 Direct 0 0 10.2.1.2 GE3/1/1
10.2.1.2/32 Direct 0 0 127.0.0.1 InLoop0
127.0.0.0/8 Direct 0 0 127.0.0.1 InLoop0
127.0.0.1/32 Direct 0 0 127.0.0.1 InLoop0
The output shows that the next hop 10.2.1.1 of the static route is not reachable, and the status of the track
entry is negative. The static route does not work.
51
Page 64

Configuring NTP
NTP overview
Defined in RFC 1305, the Network Time Protocol (NTP) synchronizes timekeeping among distributed
time servers and clients. NTP runs over the User Datagram Protocol (UDP), using UDP port 123.
The purpose of using NTP is to keep consistent timekeeping among all clock-dependent devices within
the network so that the devices can provide diverse applications based on the consistent time.
For a local system running NTP, its time can be synchronized by other reference sources and can be used
as a reference source to synchronize other clocks.
NTP applications
An administrator can by no means keep synchronized time among all the devices within a network by
changing the system clock on each station, because this is a huge amount of workload and cannot
guarantee the clock precision. NTP, however, allows quick clock synchronization within the entire
network while it ensures a high clock precision.
NTP is used when all devices within the network must be consistent in timekeeping, for example:
• In analysis of the log information and debugging information collected from different devices in
network management, time must be used as reference basis.
• All devices must use the same reference clock in a charging system.
• To implement certain functions, such as scheduled restart of all devices within the network, all
devices must be consistent in timekeeping.
• When multiple systems process a complex event in cooperation, these systems must use that same
reference clock to ensure the correct execution sequence.
• For increment backup between a backup server and clients, timekeeping must be synchronized
between the backup server and all the clients.
Advantages of NTP:
• NTP uses a stratum to describe the clock precision, and is able to synchronize time among all
devices within the network.
• NTP supports access control and MD5 authentication.
• NTP can unicast, multicast or broadcast protocol messages.
How NTP works
Figure 19 shows the basic work flow of NTP. Device A and Device B are interconnected over a network.
They have their own independent system clocks, which need to be automatically synchronized through
NTP. For an easy understanding, we assume that:
• Prior to system clock synchronization between Device A and Device B, the clock of Device A is set
to 10:00:00 am while that of Device B is set to 11:00:00 am.
• Device B is used as the NTP time server, namely Device A synchronizes its clock to that of Device B.
• It takes 1 second for an NTP message to travel from one device to the other.
52
Page 65

A
Figure 19 Basic work flow of NTP
The process of system clock synchronization is as follows:
• Device A sends Device B an NTP message, which is timestamped when it leaves Device A. The time
stamp is 10:00:00 am (T1).
• When this NTP message arrives at Device B, it is timestamped by Device B. The timestamp is
11:00:01 am (T2).
• When the NTP message leaves Device B, Device B timestamps it. The timestamp is 11:00:02 am
(T3).
• When Device A receives the NTP message, the local time of Device A is 10:00:03 am (T4).
Up to now, Device A has sufficient information to calculate the following two important parameters:
• The roundtrip delay of NTP message: Delay = (T4–T1) – (T3-T2) = 2 seconds.
• Time difference between Device A and Device B: Offset = ((T2-T1) + (T3-T4))/2 = 1 hour.
Based on these parameters, Device A can synchronize its own clock to the clock of Device B.
This is only a rough description of the work mechanism of NTP. For details, refer to RFC 1305.
NTP message format
NTP uses two types of messages, clock synchronization message and NTP control message. An NTP
control message is used in environments where network management is needed. As it is not a must for
clock synchronization, it will not be discussed in this document.
NOTE:
ll NTP messages mentioned in this document refer to NTP clock synchronization messages.
53
Page 66

A clock synchronization message is encapsulated in a UDP message, in the format shown in Figure 20.
Figure 20 Clock synchronization message format
14
0 7 15 23 31
LI VN Mode Stratum Poll Precision
Root delay (32 bits)
Root dispersion (32 bits)
Reference identifier (32 bits)
Reference timestamp (64 bits)
Originate timestamp (64 bits)
Receive timestamp (64 bits)
Transmit timestamp (64 bits)
Authenticator (optional 96 bits)
Main fields are described as follows:
• LI—A 2-bit leap indicator. When set to 11, it warns of an alarm condition (clock unsynchronized);
when set to any other value, it is not to be processed by NTP.
• VN—A 3-bit version number, indicating the version of NTP. The latest version is version 3.
• Mode—A 3-bit code indicating the work mode of NTP. This field can be set to these values: 0 –
reserved; 1 – symmetric active; 2 – symmetric passive; 3 – client; 4 – server; 5 – broadcast or
multicast; 6 – NTP control message; 7 – reserved for private use.
• Stratum—An 8-bit integer indicating the stratum level of the local clock, with the value ranging from
1 to 16. The clock precision decreases from stratum 1 through stratum 16. A stratum 1 clock has the
highest precision, and a stratum 16 clock is not synchronized and cannot be used as a reference
clock.
• Poll—An 8-bit signed integer indicating the poll interval, namely the maximum interval between
successive messages.
• Precision—An 8-bit signed integer indicating the precision of the local clock.
• Root Delay—Roundtrip delay to the primary reference source.
• Root Dispersion—The maximum error of the local clock relative to the primary reference source.
• Reference Identifier—Identifier of the particular reference source.
• Reference Timestamp—The local time at which the local clock was last set or corrected.
• Originate Timestamp—The local time at which the request departed the client for the service host.
• Receive Timestamp—The local time at which the request arrived at the service host.
• Transmit Timestamp—The local time at which the reply departed the service host for the client.
• Authenticator—Authentication information.
54
Page 67
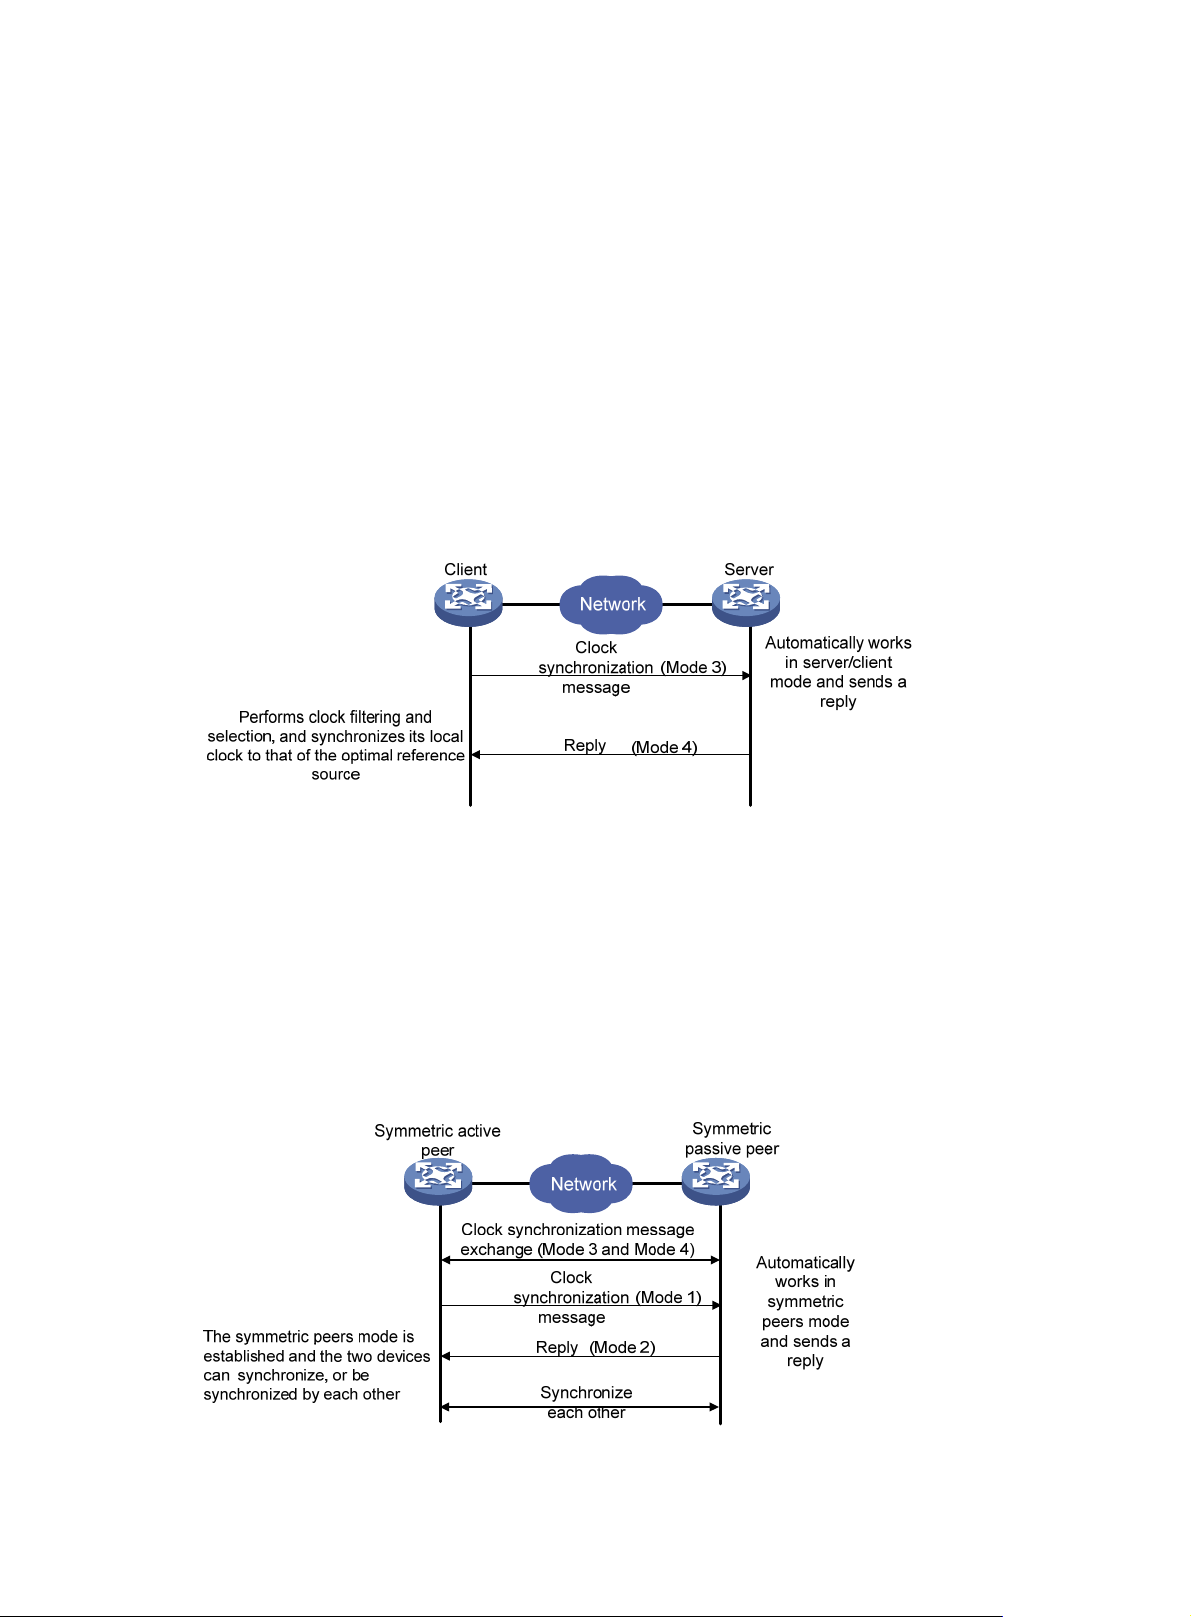
Operation modes of NTP
Devices running NTP can implement clock synchronization in one of the following modes:
• Client/server mode
• Symmetric peers mode
• Broadcast mode
• Multicast mode
You can select operation modes of NTP as needed. In case that the IP address of the NTP server or peer
is unknown and many devices in the network need to be synchronized, you can adopt the broadcast or
multicast mode; while in the client/server and symmetric peers modes, a device is synchronized from the
specified server or peer, and thus clock reliability is enhanced.
Client/server mode
Figure 21 Client/server mode
When working in the client/server mode, a client sends a clock synchronization message to servers, with
the Mode field in the message set to 3 (client mode). Upon receiving the message, the servers
automatically work in the server mode and send a reply, with the Mode field in the messages set to 4
(server mode). Upon receiving the replies from the servers, the client performs clock filtering and selection,
and synchronizes its local clock to that of the optimal reference source.
In this mode, a client can be synchronized to a server, but not vice versa.
Symmetric peers mode
Figure 22 Symmetric peers mode
55
Page 68
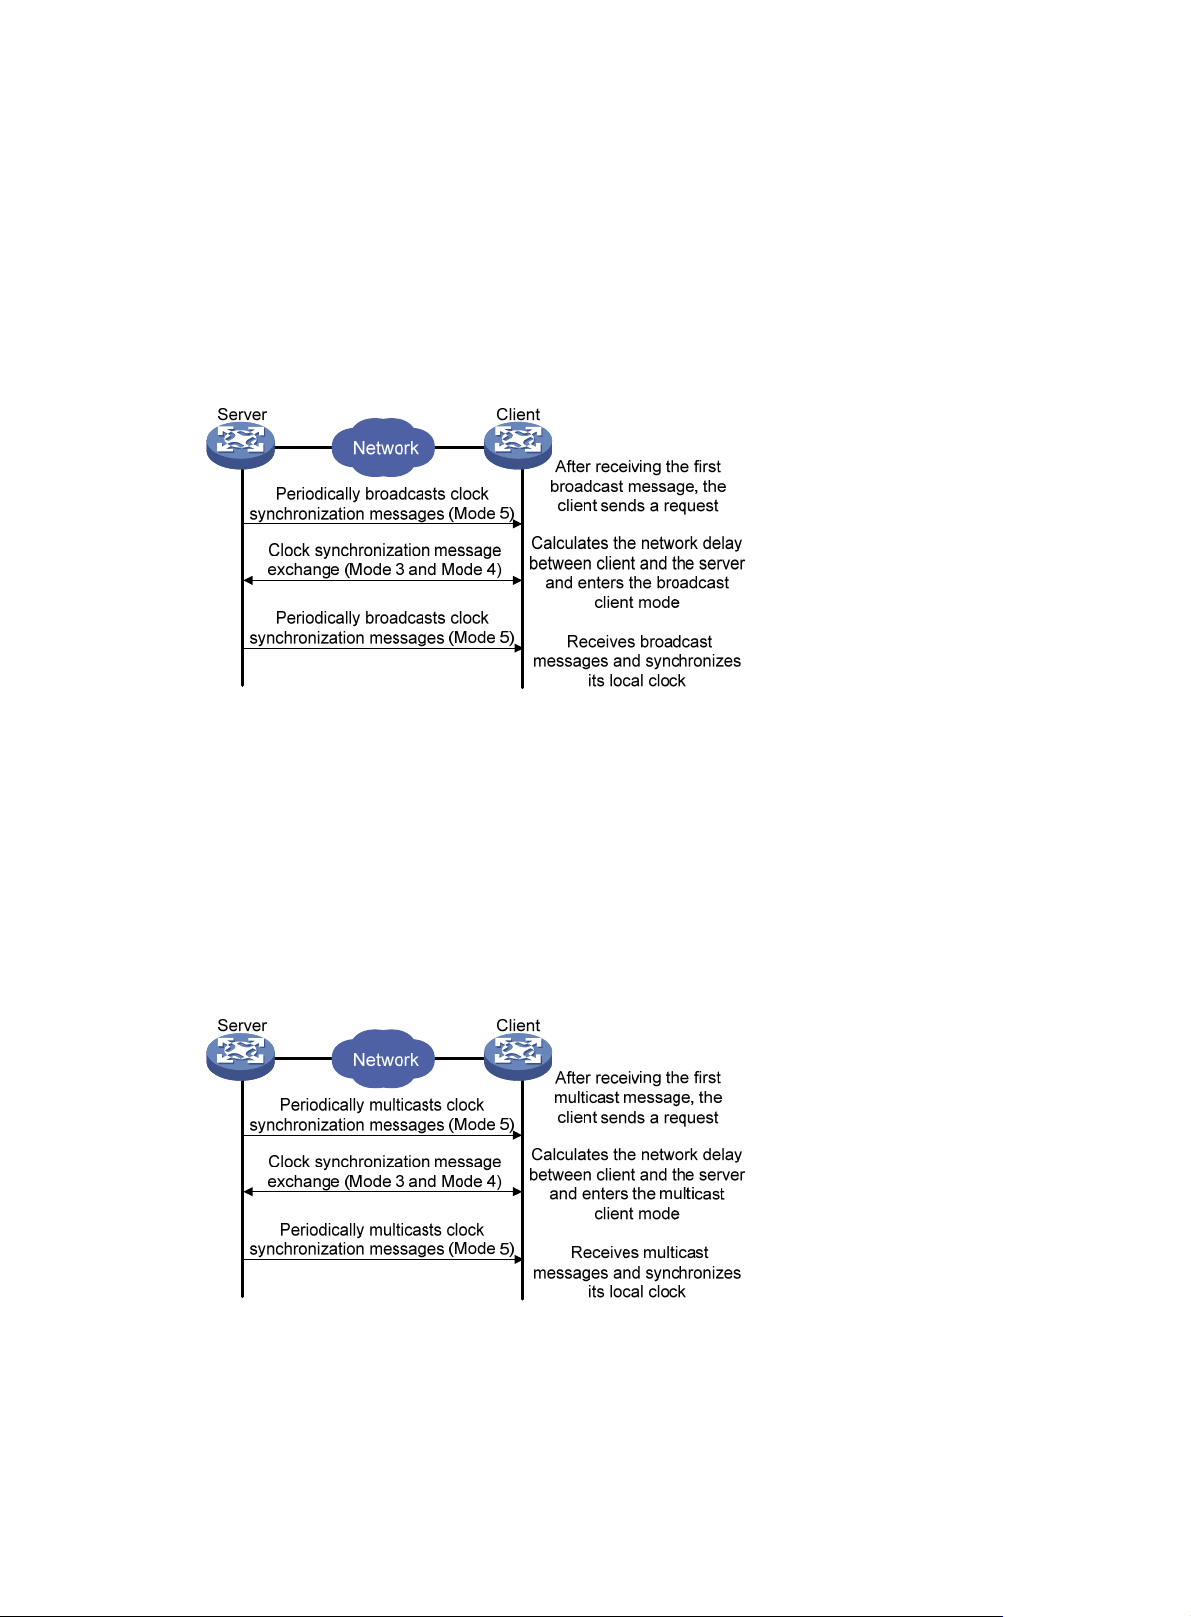
A device working in the symmetric active mode periodically sends clock synchronization messages, with
the Mode field in the message set to 1 (symmetric active); the device that receives this message
automatically enters the symmetric passive mode and sends a reply, with the Mode field in the message
set to 2 (symmetric passive). By exchanging messages, the symmetric peers mode is established between
the two devices. Then, the two devices can synchronize, or be synchronized by, each other. If the clocks
of both devices have been already synchronized, the device whose local clock has a lower stratum level
will synchronize the clock of the other device.
Broadcast mode
Figure 23 Broadcast mode
In the broadcast mode, a server periodically sends clock synchronization messages to the broadcast
address 255.255.255.255, with the Mode field in the messages set to 5 (broadcast mode). Clients listen
to the broadcast messages from servers. After a client receives the first broadcast message, the client and
the server start to exchange messages, with the Mode field set to 3 (client mode) and 4 (server mode) to
calculate the network delay between client and the server. Then, the client enters the broadcast client
mode and continues listening to broadcast messages, and synchronizes its local clock based on the
received broadcast messages.
Multicast mode
Figure 24 Multicast mode
In the multicast mode, a server periodically sends clock synchronization messages to the user-configured
multicast address, or, if no multicast address is configured, to the default NTP multicast address 224.0.1.1,
with the Mode field in the messages set to 5 (multicast mode). Clients listen to the multicast messages
from servers. After a client receives the first multicast message, the client and the server start to exchange
messages, with the Mode field set to 3 (client mode) and 4 (server mode) to calculate the network delay
56
Page 69

g
y
between client and the server. Then, the client enters the multicast client mode and continues listening to
multicast messages, and synchronizes its local clock based on the received multicast messages.
NOTE:
In symmetric peers mode, broadcast mode and multicast mode, the client (or the symmetric active peer)
and the server (the symmetric passive peer) can work in the specified NTP workin
exchange NTP messages with the Mode field being 3 (client mode) and the Mode field being 4 (server
mode). During this message exchange process, NTP clock synchronization can be implemented.
NTP-supported MPLS L3VPN
When operating in client/server mode or symmetric mode, NTP supports MPLS L3VPN, and thus realizes
clock synchronization within an MPLS VPN network. In other words, network devices (CEs and PEs) at
different physical location can get their clocks synchronized through NTP, as long as they are in the same
VPN. The specific functions are as follows:
• The NTP client on a customer edge device (CE) can be synchronized to the NTP server on another
CE.
• The NTP client on a CE can be synchronized to the NTP server on a provider edge device (PE).
• The NTP client on a PE can be synchronized to the NTP server on a CE through a designated VPN.
mode only after the
• The NTP client on a PE can be synchronized to the NTP server on another PE through a designated
VPN.
• The NTP server on a PE can synchronize the NTP clients on multiple CEs in different VPNs.
NOTE:
• A CE is a device that has an interface directly connecting to the ser vice provider (SP). A CE is not “aware
of” the presence of the VPN.
• A PE is a device that directly connecting to CEs. In an MPLS network, all events related to VPN
processing occur on the PE.
NTP configuration task list
Complete these tasks to configure NTP:
Task Remarks
Configuring the operation modes of NTP Required
Configuring the local clock as a reference source Optional
Configuring optional parameters of NTP Optional
Configuring access-control rights Optional
Configuring NTP authentication Optional
Configuring the operation modes of NTP
Routers can implement clock synchronization in one of the following modes:
• Client/server mode
57
Page 70

A
g
g
• Symmetric mode
• Broadcast mode
• Multicast mode
For the client/server mode or symmetric mode, you need to configure only clients or symmetric-active
peers; for the broadcast or multicast mode, you need to configure both servers and clients.
NOTE:
single router can have a maximum of 128 associations at the same time, including static associations
and dynamic associations. A static association refers to an association that a user has manually created
by using an NTP command, while a dynamic association is a temporary association created by the system
during operation. A dynamic association will be removed if the system fails to receive messages from it
over a specific long time. In the client/server mode, for example, when you carry out a command to
synchronize the time to a server, the system will create a static association, and the server will just respond
passively upon the receipt of a message, rather than creating an association (static or dynamic). In the
symmetric mode, static associations will be created at the symmetric-active peer side, and dynamic
associations will be created at the symmetric-passive peer side; in the broadcast or multicast mode, static
associations will be created at the server side, and dynamic associations will be created at the client side.
Configuring NTP client/server mode
For routers working in the client/server mode, make the following configurations on the clients.
To configure an NTP client:
Step Command
1. Enter system view.
2. Specify an NTP server for the
router.
system-view
ntp-service unicast-server
[ vpn-instance vpn-instance-name ]
{ ip-address | server-name }
[ authentication-keyid keyid |
priority | source-interface
interface-type interface-number |
version number ] *
Remarks
N/A
No NTP server is specified by
default.
NOTE:
• In the ntp-service unicast-server command, ip-address must be a unicast address, rather than a
broadcast address, a multicast address or the IP address of the local clock.
• When the source interface for NTP messages is specified by the source-interface ar
ument, the source
IP address of the NTP messages is configured as the primary IP address of the specified interface.
• A router can act as a server to synchronize the clock of other routers only after its clock has been
synchronized. If the clock of a server has a stratum level hi
her than or equal to that of a client’s clock,
the client will not synchronize its clock to the server’s.
• You can configure multiple servers by repeating the ntp-service unicast-server command. The clients
will choose the optimal reference source.
58
Page 71

g
Configuring the NTP symmetric mode
For routers working in the symmetric mode, you need to specify a symmetric-passive on a symmetric-active
peer.
To configure a symmetric-active router:
Step Command
1. Enter system view.
2. Specify a symmetric-passive
peer for the router.
system-view N/A
ntp-service unicast-peer
[ vpn-instance vpn-instance-name ]
{ ip-address | peer-name }
[ authentication-keyid keyid |
priority | source-interface
interface-type interface-number |
version number ] *
Remarks
No symmetric-passive peer is
specified by default.
NOTE:
• In symmetric peers mode, you should use the ntp-service refclock-master command or any NTP
configuration command in Configuring the operation modes of NTP t
o enable NTP; otherwise, a
symmetric-passive peer will not process NTP messages from a symmetric-active peer.
• In the ntp-service unicast-peer command,
ip-address
must be a unicast address, rather than a
broadcast address, a multicast address or the IP address of the local clock.
• When the source interface for NTP messages is specified by the source-interface ar
ument, the source
IP address of the NTP message is configured as the primary IP address of the specified interface.
• Typically, at least one of the symmetric-active and symmetric-passive peers has been synchronized;
otherwise the clock synchronization will not proceed.
• You can configure multiple symmetric-passive peers by repeating the ntp-service unicast-peer
command.
Configuring NTP broadcast mode
The broadcast server periodically sends NTP broadcast messages to the broadcast address
255.255.255.255. After receiving the messages, the router working in NTP broadcast mode sends a
reply and synchronizes its local clock.
For routers working in the broadcast mode, you need to configure both the server and clients. Because
an interface need to be specified on the broadcast server for sending NTP broadcast messages and an
interface also needs to be specified on each broadcast client for receiving broadcast messages, the NTP
broadcast mode can be configured only in the specific interface view.
Configuring a broadcast client
Step Command
1. Enter system view.
2. Enter interface view.
system-view N/A
interface interface-type
interface-number
59
Remarks
Enter the interface used to receive
NTP broadcast messages
Page 72

A
Step Command
3. Configure the router to work in
the NTP broadcast client
mode.
ntp-service broadcast-client N/A
Configuring the broadcast server
Step Command
1. Enter system view.
2. Enter interface view.
3. Configure the router to work in
the NTP broadcast server
mode.
system-view N/A
interface interface-type
interface-number
ntp-service broadcast-server
[ authentication-keyid keyid |
version number ]*
NOTE:
broadcast server can synchronize broadcast clients only after its clock has been synchronized.
Configuring NTP multicast mode
Remarks
Remarks
Enter the interface used to send
NTP broadcast messages
N/A
The multicast server periodically sends NTP multicast messages to multicast clients, which send replies
after receiving the messages and synchronize their local clocks.
For routers working in multicast mode, configure both the server and clients. The NTP multicast mode
must be configured in the specific interface view.
Configuring a multicast client
Step Command
1. Enter system view.
2. Enter interface view.
3. Configure the router to work in
the NTP multicast client mode.
Configuring the multicast server
Step Command
1. Enter system view.
2. Enter interface view.
Remarks
system-view N/A
interface interface-type
interface-number
ntp-service multicast-client
[ ip-address ]
Enter the interface used to receive
NTP multicast messages
N/A
Remarks
system-view N/A
interface interface-type
interface-number
Enter the interface used to send
NTP multicast message
3. Configure the router to work in
the NTP multicast server
mode.
ntp-service multicast-server
[ ip-address ]
[ authentication-keyid keyid | ttl
ttl-number | version number ] *
60
N/A
Page 73

g
NOTE:
• A multicast server can synchronize broadcast clients only after its clock has been synchronized.
• You can configure up to 1024 multicast clients, among which 128 can take effect at the same time.
Configuring the local clock as a reference source
A network router can get its clock synchronized in one of the following two ways:
• Synchronized to the local clock, which as the reference source.
• Synchronized to another router on the network in any of the four NTP operation modes previously
described.
If you configure two synchronization modes, the router will choose the optimal clock as the reference
source.
To configure the local clock as a reference source:
Step Command
1. Enter system view.
system-view
2. Configure the local clock as a reference source.
NOTE:
• In this command,
process ID.
• Typically, the stratum level of the NTP server which is synchronized from an authoritative clock (such as
an atomic clock) is set to 1. This NTP server operates as the primary reference source on the network;
and other routers synchronize themselves to it. The synchronization distances between the primary
reference source and other routers on the network, namely, the number of NTP servers on the NTP
synchronization paths, determine the clock stratum levels of the routers.
• After you have configured the local clock as a reference clock, the local router can act as a reference
clock to synchronize other routers in the network. Therefore, perform this confi
avoid clock errors of the routers in the network.
ip-address
mu s t b e 12 7.127.1. u, wh e r e u ranges from 0 to 3, representing the NTP
ntp-service refclock-master [ ip-address ] [ stratum ]
Configuring optional parameters of NTP
Specifying the source interface for NTP messages
If you specify the source interface for NTP messages, the router sets the source IP address of the NTP
messages as the primary IP address of the specified interface when sending the NTP messages.
uration with caution to
When the router responds to an NTP request received, the source IP address of the NTP response is
always the IP address of the interface that received the NTP request.
To specify the source interface for NTP messages:
Step Command
1. Enter system view.
system-view N/A
61
Remarks
Page 74

g
Step Command
2. Specify the source interface
for NTP message.
CAUTION:
ntp-service source-interface
interface-type interface-number
Remarks
By default, no source interface is
specified for NTP messages, and
the system uses the IP address of
the interface determined by the
matching route as the source IP
address of NTP messages.
• If you have specified the source interface for NTP messages in the ntp-service unicast-server or
ntp-service unicast-peer command, the interface specified in the ntp-service unicast-server or
ntp-service unicast-peer command serves as the source interface of NTP messages.
• If you have configured the ntp-service broadcast-server or ntp-service multicast-server command, the
source interface of the broadcast or multicast NTP messages is the interface configured with the
respective command.
• If the specified source interface for NTP messa
es is down, the source IP address for an NTP message
that is sent out is the primary IP address of the outgoing interface of the NTP message.
Disabling an interface from receiving NTP messages
When NTP is enabled, NTP messages can be received from all the interfaces by default, and you can
disable an interface from receiving NTP messages through the following configuration.
Step Command
1. Enter system view.
2. Enter interface view.
3. Disable the interface from
receiving NTP messages.
system-view N/A
interface interface-type
interface-number
ntp-service in-interface disable
Remarks
N/A
An interface is enabled to receive
NTP messages by default
Configuring the maximum number of dynamic sessions allowed
Step Command
1. Enter system view.
2. Configure the maximum
number of dynamic sessions
allowed to be established
locally.
system-view N/A
ntp-service max-dynamic-sessions
number
Remarks
100 by default
Configuring access-control rights
With the following command, you can configure the NTP service access-control right to the local router.
There are four access-control rights, as follows:
62
Page 75

g
• query—Control query permitted. This level of right permits the peer router to perform control query
to the NTP service on the local router but does not permit the peer router to synchronize its clock to
the local router. The so-called “control query” refers to query of some states of the NTP service,
including alarm information, authentication status, clock source information, and so on.
• synchronization—Server access only. This level of right permits the peer router to synchronize its
clock to the local router but does not permit the peer router to perform control query.
• server—Server access and query permitted. This level of right permits the peer router to perform
synchronization and control query to the local router but does not permit the local router to
synchronize its clock to the peer router.
• peer—Full access. This level of right permits the peer router to perform synchronization and control
query to the local router and also permits the local router to synchronize its clock to the peer router.
From the highest NTP service access-control right to the lowest one are peer, server, synchronization,
and query. When a router receives an NTP request, it performs an access-control right match and uses
the first matched right. If no matched right is found, the router discards the NTP request.
Configuration prerequisites
Prior to configuring the NTP service access-control right to the local router, you need to create and
configure an ACL associated with the access-control right. For more information about ACLs, see ACL
and QoS Configuration Guide.
Configuration procedure
To configure the NTP service access-control right to the local router:
Step Command
1. Enter system view.
2. Configure the NTP service
access-control right for a peer
router to access the local
router.
NOTE:
The access-control ri
running NTP. A more secure method is identity authentication.
ht mechanism provides only a minimum degree of security protection for the system
system-view N/A
ntp-service access { peer | query |
server | synchronization }
acl-number
Configuring NTP authentication
The NTP authentication feature should be enabled for a system running NTP in a network where there is
a high security demand. This feature enhances the network security by means of client-server key
authentication, which prohibits a client from synchronizing with a router that has failed authentication.
Remarks
peer by default
NTP authentication configuration includes the following tasks:
• Enable NTP authentication
• Configure an authentication key
• Configure the key as a trusted key
• Associate the specified key with an NTP server or a symmetric peer
63
Page 76

A
t
The above tasks are required. If any task is missed, the NTP authentication cannot function.
Configuring NTP authentication in client/server mode
When configuring NTP authentication in client/server mode, you need to configure the required tasks on
both the client and server, and associate the key with the NTP server on the client.
• If NTP authentication is not enabled or no key is associated with the NTP server on the client, no
NTP authentication is performed when the client synchronizes its clock to the server. No matter NTP
authentication is enabled on the server or not, the clock synchronization between the server and
client can be performed.
• If NTP authentication is enabled and a key is associated with the NTP server on the client, but the
key is a trusted key, no matter NTP authentication is enabled on the server or not, the client does not
synchronize its clock to the server.
Configuring NTP authentication for a client
To configure NTP authentication for a client:
Step Command
1. Enter system view.
2. Enable NTP authentication.
3. Configure an NTP
authentication key.
4. Configure the key as a trusted
key.
5. Associate the specified key
with an NTP server.
system-view N/A
ntp-service authentication enable Disabled by default
ntp-service authentication-keyid
keyid authentication-mode md5
value
ntp-service reliable
authentication-keyid keyid
ntp-service unicast-server
{ ip-address | server-name }
authentication-keyid keyid
Remarks
No NTP authentication key by
default
No authentication key is
configured to be trusted by default
You can associate a non-existing
key with an NTP server. To enable
NTP authentication, you must
configure the key and specify it as
a trusted key after associating the
key with the NTP server.
NOTE:
fter you enable the NTP authentication feature for the client, make sure that you configure for the clien
an authentication key that is the same as on the server and specify that the authentication key is trusted.
Configuring NTP authentication for a server
To configure NTP authentication for a server:
Step Command
1. Enter system view.
2. Enable NTP authentication.
system-view N/A
ntp-service authentication enable Disabled by default
64
Remarks
Page 77

Step Command
3. Configure an NTP
authentication key.
4. Configure the key as a trusted
key.
ntp-service authentication-keyid
keyid authentication-mode md5
value
ntp-service reliable
authentication-keyid keyid
Remarks
No NTP authentication key by
default
No authentication key is
configured to be trusted by default
NOTE:
The same authentication key must be configured on both the server and client sides.
Configuring NTP authentication in symmetric peers mode
When configuring NTP authentication in symmetric peers mode, configure the required tasks on both the
active and passive peers, and on the active peer associate the key with the passive peer.
1. When the active peer has a greater stratum level than the passive peer:
{ If NTP authentication is not enabled or no key is associated with the passive peer on the active
peer, the active peer synchronizes its clock to the passive peer as long as NTP authentication
is disabled on the passive peer.
{ If NTP authentication is enabled and a key is associated with the passive peer on the active
peer, but the key is not a trusted key, no matter the NTP authentication is enabled on the passive
peer or not, the active peer does not synchronize its clock to the passive peer.
2. When the active peer has a smaller stratum level than the passive peer:
If NTP authentication is not enabled, no key is associated with the passive peer on the active peer,
or the key is not a trusted key, the clock of the active peer can be synchronized to the passive peer
as long as NTP authentication is disabled on the passive peer.
Configuring NTP authentication for an active peer
To configure NTP authentication for an active peer:
Step Command
1. Enter system view.
2. Enable NTP authentication.
3. Configure an NTP
authentication key.
4. Configure the key as a trusted
key.
5. Associate the specified key
with the passive peer.
system-view N/A
ntp-service authentication enable
ntp-service authentication-keyid
keyid authentication-mode md5
value
ntp-service reliable
authentication-keyid keyid
ntp-service unicast-peer
{ ip-address | peer-name }
authentication-keyid keyid
Remarks
Disabled by default
No NTP authentication key is
configured by default.
No authentication key is
configured to be trusted by default
You can associate a non-existing
key with a passive peer. To enable
NTP authentication, you must
configure the key and specify it as
a trusted key after associating the
key with the passive peer.
65
Page 78

A
NOTE:
fter you enable the NTP authentication feature for the active peer, make sure that you configure for the
active peer an authentication key that is the same as on the passive peer and specify that the
authentication key is trusted.
Configuring NTP authentication for a passive peer
To configure NTP authentication for a passive peer:
Step Command
1. Enter system view.
2. Enable NTP authentication.
3. Configure an NTP
authentication key.
4. Configure the key as a trusted
key.
system-view N/A
ntp-service authentication enable Disabled by default
ntp-service authentication-keyid
keyid authentication-mode md5
value
ntp-service reliable
authentication-keyid keyid
Remarks
No NTP authentication key is
configured by default.
No authentication key is
configured to be trusted by default
NOTE:
The same authentication key must be configured on both the active and passive peers.
Configuring NTP authentication in broadcast mode
When configuring NTP authentication in broadcast mode, configure the required tasks on both the
broadcast client and broadcast server, and associate the key with the broadcast server on the server.
• If NTP authentication is not enabled, no key is associated with the broadcast server, or the key is not
a trusted key, the clock of the broadcast server can be synchronized to the broadcast client as long
as NTP authentication is disabled on the client.
• If NTP authentication is enabled and a key is associated with the broadcast server, and the key is
a trusted key, the clock of the broadcast server can be synchronized to the broadcast client as long
as NTP authentication is enabled on the client.
Configuring NTP authentication for a broadcast client
To configure NTP authentication for a broadcast client:
Step Command
1. Enter system view.
2. Enable NTP authentication.
3. Configure an NTP
authentication key.
4. Configure the key as a trusted
key.
system-view N/A
ntp-service authentication enable Disabled by default
ntp-service authentication-keyid
keyid authentication-mode md5
value
ntp-service reliable
authentication-keyid keyid
66
Remarks
No NTP authentication key is
configured by default.
No authentication key is
configured to be trusted by default.
Page 79

A
r
NOTE:
fter you enable the NTP authentication feature for the broadcast client, make sure that you configure fo
the client an authentication key that is the same as on the broadcast server and specify that the
authentication key is trusted.
Configuring NTP authentication for a broadcast server
To configure NTP authentication for a broadcast server:
Step Command
1. Enter system view.
2. Enable NTP authentication.
3. Configure an NTP
authentication key.
4. Configure the key as a trusted
key.
5. Enter interface view.
6. Associate the specified key
with the broadcast server.
system-view N/A
ntp-service authentication enable Disabled by default
ntp-service authentication-keyid
keyid authentication-mode md5
value
ntp-service reliable
authentication-keyid keyid
interface interface-type
interface-number
ntp-service broadcast-server
authentication-keyid keyid
Remarks
No NTP authentication key is
configured by default.
No authentication key is
configured to be trusted by default
N/A
You can associate a non-existing
key with the broadcast server. To
enable NTP authentication, you
must configure the key and specify
it as a trusted key after associating
the key with the broadcast server.
NOTE:
The same authentication key must be configured on both the broadcast server and broadcast client sides.
Configuring NTP authentication in multicast mode
When configuring NTP authentication in multicast mode, configure the required tasks on both the
multicast client and multicast server, and associate the key with the multicast server on the server.
• If the NTP authentication is not enabled, no key is associated with the multicast server on the
multicast server, or the key is not a trusted key, the clock of the multicast server can be synchronized
to the multicast client as long as NTP authentication is disabled on the client.
• If the NTP authentication is enabled, a key is associated with the multicast server on the multicast
server, and the key is a trusted key, the clock of the multicast server can be synchronized to the
multicast client as long as NTP authentication is enabled on the client.
Configuring NTP authentication for a multicast client
To configure NTP authentication for a multicast client:
Step Command
1. Enter system view.
2. Enable NTP authentication.
system-view N/A
ntp-service authentication enable Disabled by default
67
Remarks
Page 80

A
Step Command
3. Configure an NTP
authentication key.
4. Configure the key as a trusted
key.
ntp-service authentication-keyid
keyid authentication-mode md5
value
ntp-service reliable
authentication-keyid keyid
NOTE:
fter you enable the NTP authentication feature for the multicast client, make sure that you configure for
the client an authentication key that is the same as on the multicast server and specify that the
authentication key is trusted.
Configuring NTP authentication for a multicast server
To configure NTP authentication for a multicast server:
Step Command
1. Enter system view.
2. Enable NTP authentication.
3. Configure an NTP
authentication key.
system-view N/A
ntp-service authentication enable Disabled by default
ntp-service authentication-keyid
keyid authentication-mode md5
value
Remarks
No NTP authentication key is
configured by default.
No authentication key is
configured to be trusted by default.
Remarks
No NTP authentication key is
configured by default.
4. Configure the key as a trusted
key.
5. Enter interface view.
6. Associate the specified key
with the multicast server.
ntp-service reliable
authentication-keyid keyid
interface interface-type
interface-number
ntp-service multicast-server
authentication-keyid keyid
NOTE:
The same authentication key must be configured on both the multicast server and multicast client sides.
Displaying and maintaining NTP
Task Command
1. View the information of NTP
service status.
display ntp-service status [ |
{ begin | exclude | include }
regular-expression ]
No authentication key is
configured to be trusted by default.
N/A
You can associate a non-existing
key with the multicast server. To
enable NTP authentication, you
must configure the key and specify
it as a trusted key after associating
the key with the multicast server.
Remarks
Available in any view
2. View the information of NTP
sessions.
display ntp-service sessions
[ verbose ] [ | { begin | exclude |
include } regular-expression ]
68
Available in any view
Page 81

g
t
Task Command
3. View the brief information of
the NTP servers from the local
router back to the primary
reference source.
display ntp-service trace [ | { begin
| exclude | include }
regular-expression ]
NTP configuration examples
NOTE:
Unless otherwise specified, the examples
NTP.
Configuring NTP client/server mode
Network requirements
Perform the following configurations to synchronize the time between Device B and Device A:
• As shown in Figure 25,
stratum level of 2.
• Device B works in the client/server mode and Device A is to be used as the NTP server of Device
B.
the local clock of Device A is to be used as a reference source, with the
iven in this section apply to all switches and routers that suppor
Remarks
Available in any view
Figure 25 Network diagram
Configuration procedure
1. Set the IP address for each interface as shown in Figure 25. (Details not shown)
2. Configure Device A:
# Specify the local clock as the reference source, with the stratum level of 2.
<DeviceA> system-view
[DeviceA] ntp-service refclock-master 2
3. Configure Device B:
# View the NTP status of Device B before clock synchronization.
<DeviceB> display ntp-service status
Clock status: unsynchronized
Clock stratum: 16
Reference clock ID: none
Nominal frequency: 64.0000 Hz
Actual frequency: 64.0000 Hz
Clock precision: 2^7
Clock offset: 0.0000 ms
Root delay: 0.00 ms
Root dispersion: 0.00 ms
69
Page 82

Peer dispersion: 0.00 ms
Reference time: 00:00:00.000 UTC Jan 1 1900 (00000000.00000000)
# Specify Device A as the NTP server of Device B so that Device B is synchronized to Device A.
<DeviceB> system-view
[DeviceB] ntp-service unicast-server 1.0.1.11
# View the NTP status of Device B after clock synchronization.
[DeviceB] display ntp-service status
Clock status: synchronized
Clock stratum: 3
Reference clock ID: 1.0.1.11
Nominal frequency: 64.0000 Hz
Actual frequency: 64.0000 Hz
Clock precision: 2^7
Clock offset: 0.0000 ms
Root delay: 31.00 ms
Root dispersion: 1.05 ms
Peer dispersion: 7.81 ms
Reference time: 14:53:27.371 UTC Sep 19 2005 (C6D94F67.5EF9DB22)
As shown above, Device B has been synchronized to Device A, and the clock stratum level of
Device B is 3, while that of Device A is 2.
# View the NTP session information of Device B, which shows that an association has been set up
between Device B and Device A.
[DeviceB] display ntp-service sessions
source reference stra reach poll now offset delay disper
**************************************************************************
[12345] 1.0.1.11 127.127.1.0 2 63 64 3 -75.5 31.0 16.5
note: 1 source(master),2 source(peer),3 selected,4 candidate,5 configured
Total associations : 1
Configuring the NTP symmetric mode
Network requirements
Perform the following configurations to synchronize time among routers:
• As shown in Figure 26,
the stratum level of 2.
• Device B works in the client mode and Device A is to be used as the NTP server of Device B.
• Device C works in the symmetric-active mode and Device B will act as peer of Device C. Device C
is the symmetric-active peer while Device B is the symmetric-passive peer.
the local clock of Device A is to be configured as a reference source, with
70
Page 83
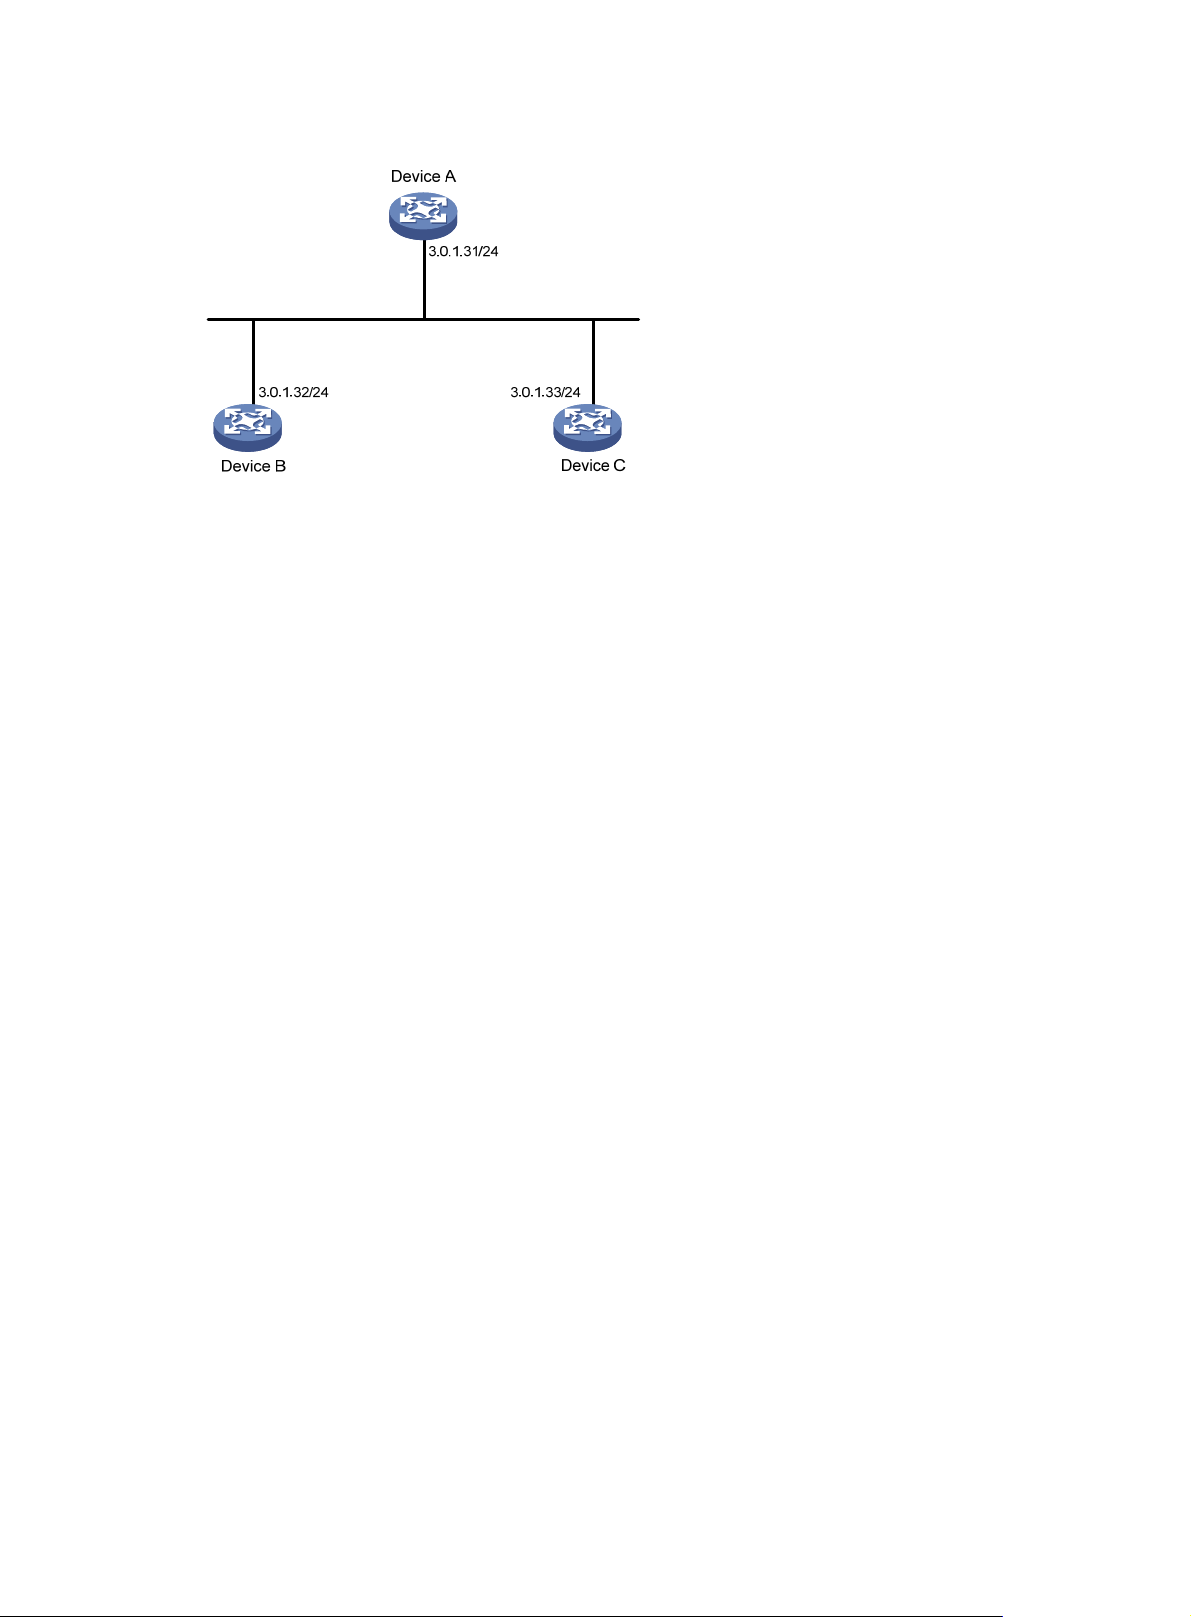
Figure 26 Network diagram
Configuration procedure
1. Set the IP address for each interface as shown in Figure 26. (Details not shown)
2. Configure Device A:
# Specify the local clock as the reference source, with the stratum level of 2.
<DeviceA> system-view
[DeviceA] ntp-service refclock-master 2
3. Configure Device B:
# Specify Device A as the NTP server of Device B.
<DeviceB> system-view
[DeviceB] ntp-service unicast-server 3.0.1.31
4. Configure Device C (after Device B is synchronized to Device A):
# Specify the local clock as the reference source, with the stratum level of 1.
<DeviceC> system-view
[DeviceC] ntp-service refclock-master 1
# Configure Device B as a symmetric peer after local synchronization.
[DeviceC] ntp-service unicast-peer 3.0.1.32
In the step above, Device B and Device C are configured as symmetric peers, with Device C in the
symmetric-active mode and Device B in the symmetric-passive mode. Because the stratus level of
Device C is 1 while that of Device B is 3, Device B is synchronized to Device C.
# View the NTP status of Device B after clock synchronization.
[DeviceB] display ntp-service status
Clock status: synchronized
Clock stratum: 2
Reference clock ID: 3.0.1.33
Nominal frequency: 64.0000 Hz
Actual frequency: 64.0000 Hz
Clock precision: 2^7
Clock offset: -21.1982 ms
Root delay: 15.00 ms
Root dispersion: 775.15 ms
Peer dispersion: 34.29 ms
Reference time: 15:22:47.083 UTC Sep 19 2005 (C6D95647.153F7CED)
71
Page 84
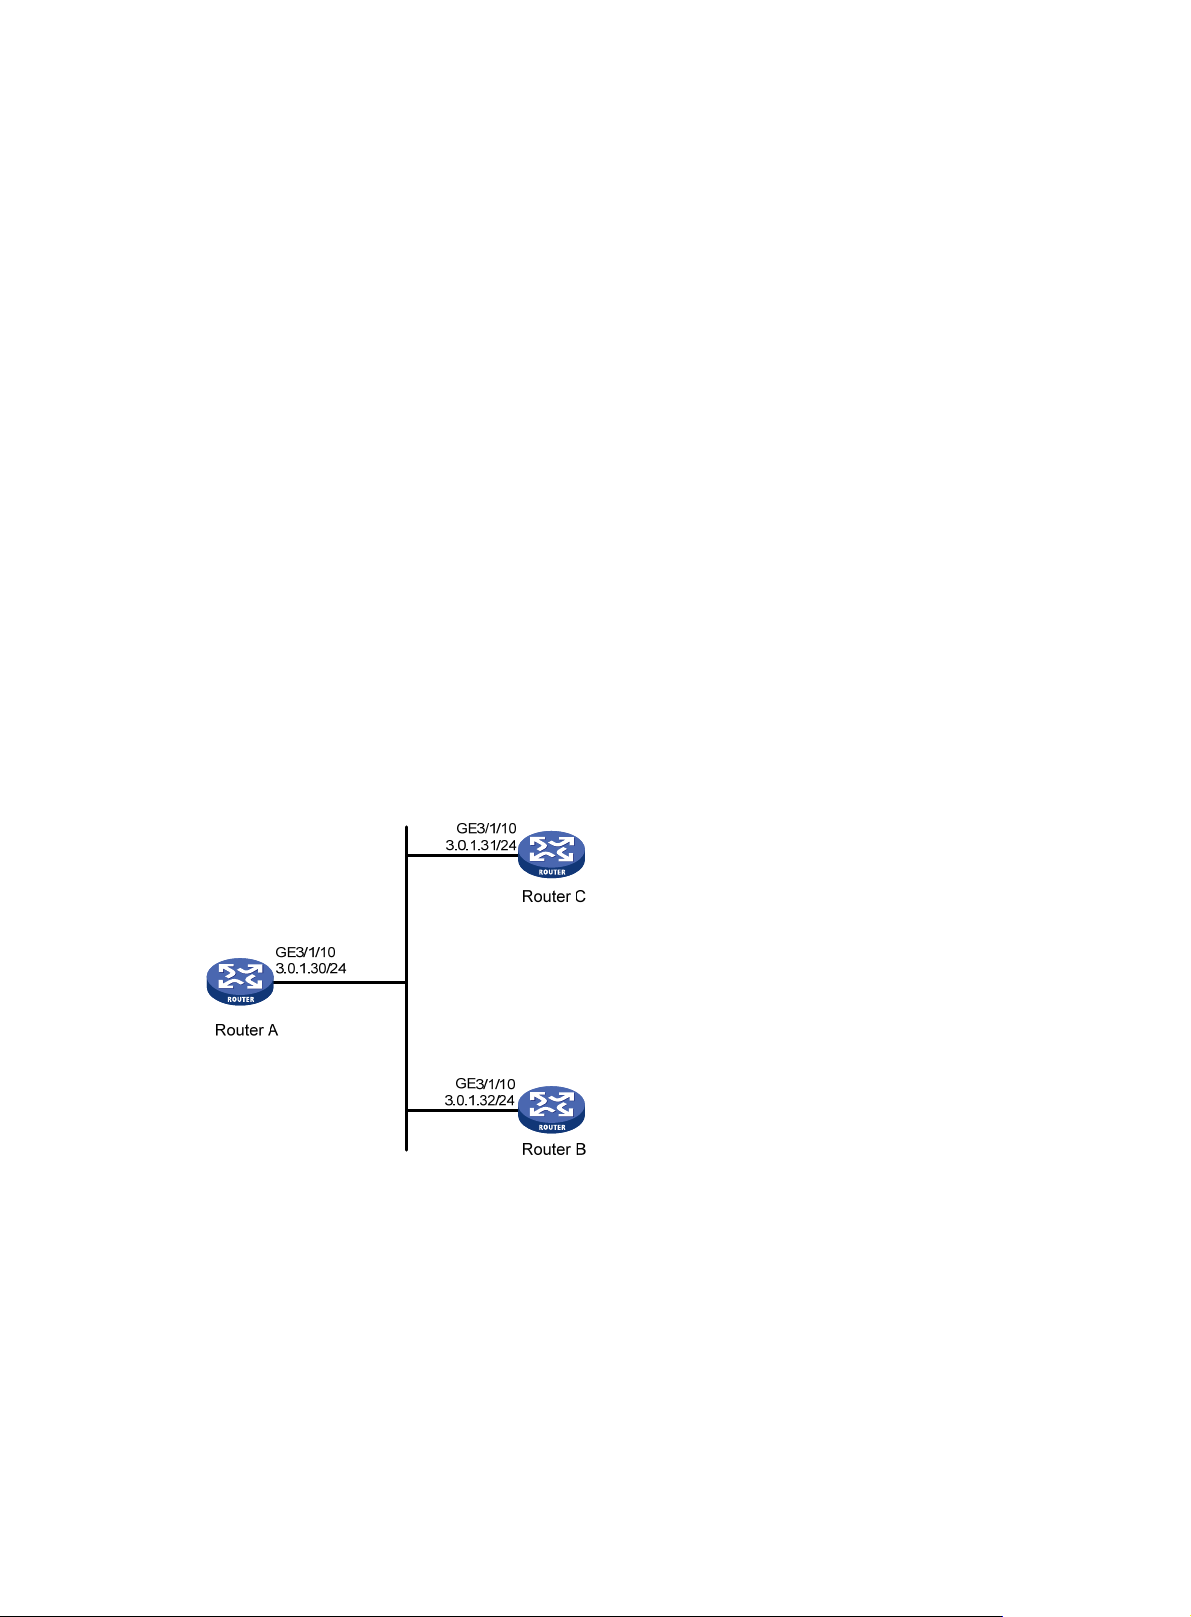
As shown above, Device B has been synchronized to Device C, and the clock stratum level of
Device B is 2, while that of Device C is 1.
# View the NTP session information of Device B, which shows that an association has been set up
between Device B and Device C.
[DeviceB] display ntp-service sessions
source reference stra reach poll now offset delay disper
**************************************************************************
[245] 3.0.1.31 127.127.1.0 2 15 64 24 10535.0 19.6 14.5
[1234] 3.0.1.33 LOCL 1 14 64 27 -77.0 16.0 14.8
note: 1 source(master),2 source(peer),3 selected,4 candidate,5 configured
Total associations : 2
Configuring NTP broadcast mode
Network requirements
As shown in Figure 27, Router C functions as the NTP server for multiple routers on a network segment
and synchronizes the time among multiple routers. More specifically:
• Router C’s local clock is to be used as a reference source, with the stratum level of 2.
• Router C works in the broadcast server mode and sends out broadcast messages from
GigabitEthernet 3/1/10.
• Router D and Router A work in the broadcast client mode and receive broadcast messages through
their respective GigabitEthernet 3/1/10.
Figure 27 Network diagram
Configuration procedure
1. Set the IP address for each interface as shown in Figure 27. (Details not shown)
2. Configure Router C:
# Specify the local clock as the reference source, with the stratum level of 2.
<RouterC> system-view
[RouterC] ntp-service refclock-master 2
# Configure Router C to work in the broadcast server mode and send broadcast messages through
GigabitEthernet 3/1/10.
[RouterC] interface GigabitEthernet 3/1/10
72
Page 85

[RouterC-GigabitEthernet3/1/10] ntp-service broadcast-server
3. Configure Router A:
# Configure Router A to work in the broadcast client mode and receive broadcast messages on
GigabitEthernet 3/1/10.
<RouterA> system-view
[RouterA] interface GigabitEthernet 3/1/10
[RouterA-GigabitEthernet3/1/10] ntp-service broadcast-client
4. Configure Router B:
# Configure Router B to work in broadcast client mode and receive broadcast messages on
GigabitEthernet 3/1/10.
<RouterB> system-view
[RouterB] interface GigabitEthernet 3/1/10
[RouterB-GigabitEthernet3/1/10] ntp-service broadcast-client
Router A and Router B get synchronized upon receiving a broadcast message from Router C.
# Take Router A as an example. View the NTP status of Router A after clock synchronization.
[RouterA] display ntp-service status
Clock status: synchronized
Clock stratum: 3
Reference clock ID: 3.0.1.31
Nominal frequency: 64.0000 Hz
Actual frequency: 64.0000 Hz
Clock precision: 2^7
Clock offset: 0.0000 ms
Root delay: 31.00 ms
Root dispersion: 8.31 ms
Peer dispersion: 34.30 ms
Reference time: 16:01:51.713 UTC Sep 19 2005 (C6D95F6F.B6872B02)
As shown above, Router A has been synchronized to Router C and the clock stratum level of Router
A is 3, while that of Router C is 2.
# View the NTP session information of Router A, which shows that an association has been set up
between Router A and Router C.
[RouterA-GigabitEthernet3/1/10] display ntp-service sessions
source reference stra reach poll now offset delay disper
**************************************************************************
[1234] 3.0.1.31 127.127.1.0 2 254 64 62 -16.0 32.0 16.6
note: 1 source(master),2 source(peer),3 selected,4 candidate,5 configured
Total associations : 1
Configuring NTP multicast mode
Network requirements
As shown in Figure 28, Router C functions as the NTP server for multiple routers on different network
segments and synchronizes the time among multiple routers. More specifically:
• Router C’s local clock is to be used as a reference source, with the stratum level of 2.
• Router C works in the multicast serve mode and sends out multicast messages from GigabitEthernet
3/1/10.
73
Page 86
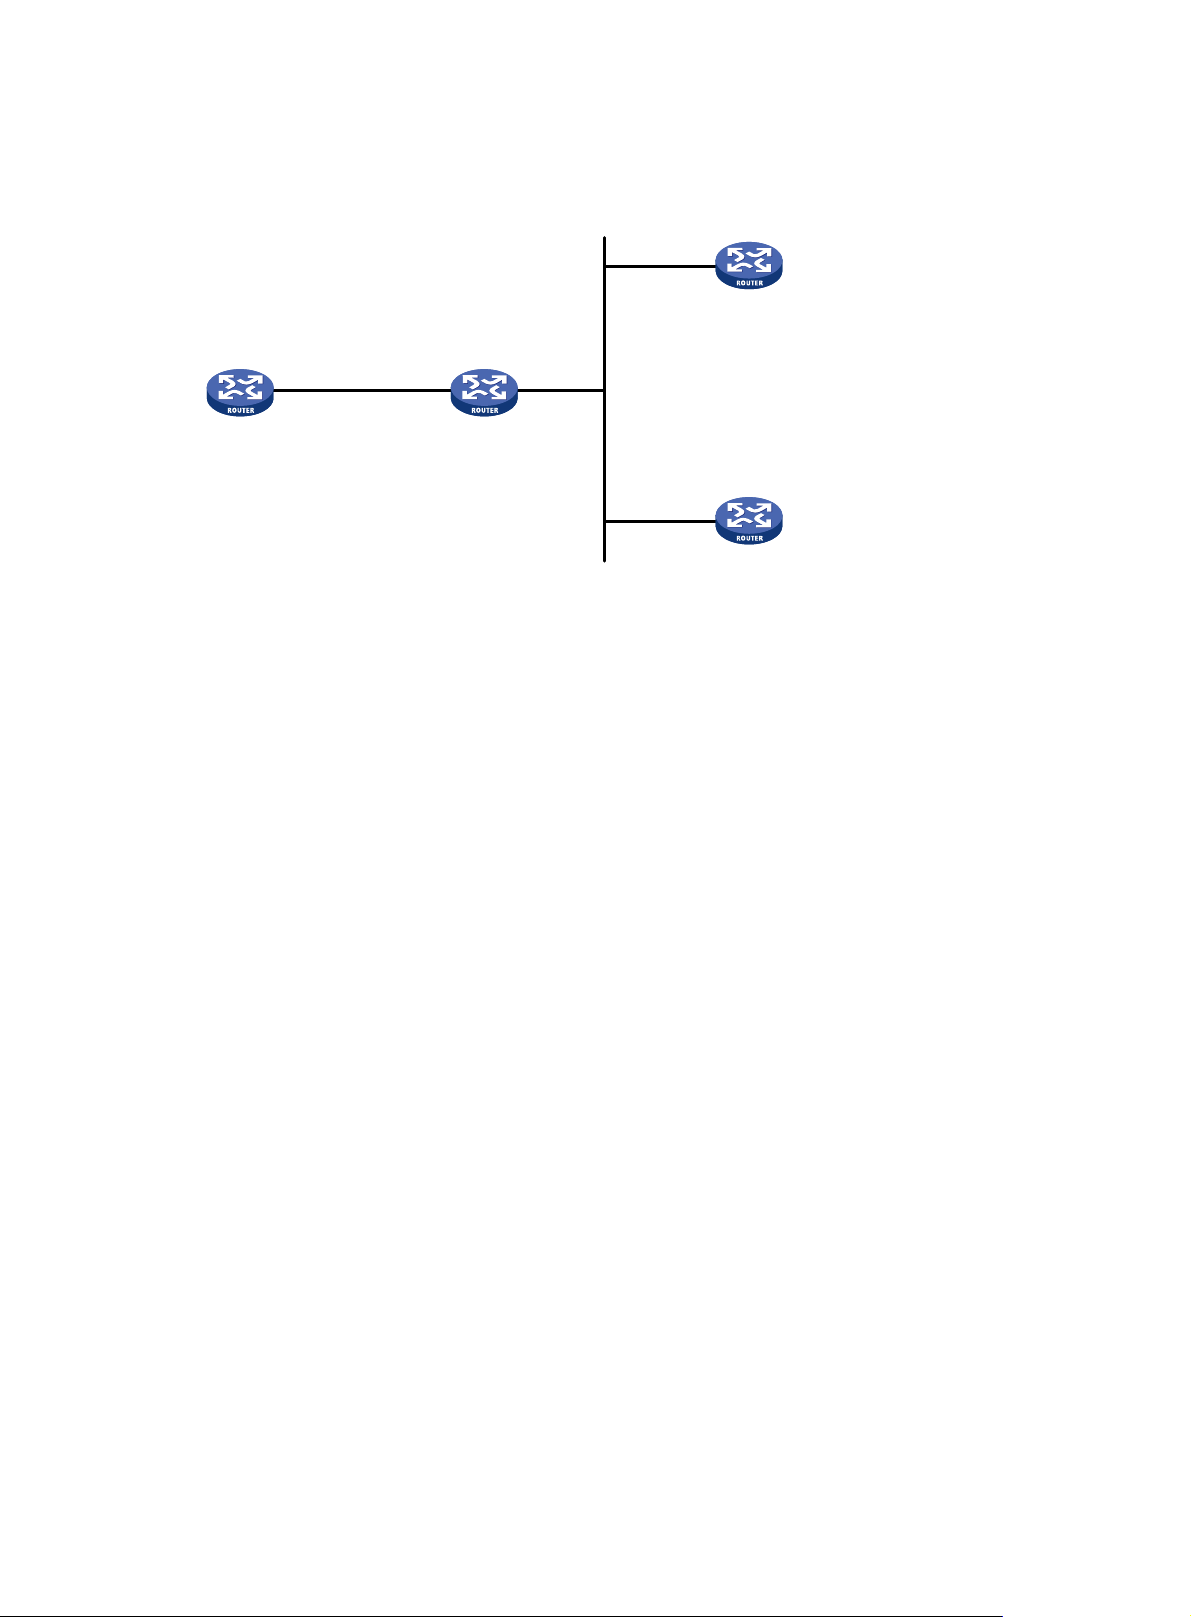
• Router D and Router A work in the multicast client mode and receive multicast messages through
their respective GigabitEthernet 3/1/10.
Figure 28 Network diagram
GE3/1/10
3.0.1.31/24
Router C
GE3/1/10
1.0.1.11/24
Router A
Configuration procedure
1. Set the IP address for each interface as shown in Figure 28. (Details not shown)
2. Configure Router C:
# Specify the local clock as the reference source, with the stratum level of 2.
<RouterC> system-view
[RouterC] ntp-service refclock-master 2
# Configure Router C to work in the multicast server mode and send multicast messages through
GigabitEthernet 3/1/10.
[RouterC] interface GigabitEthernet 3/1/10
[RouterC-GigabitEthernet3/1/10] ntp-service multicast-server
3. Configure Router D:
GE3/1/1
1.0.1.10/24
Router B
GE3/1/10
3.0.1.30/24
GE3/1/10
3.0.1.32/24
Router D
# Configure Router D to work in the multicast client mode and receive multicast messages on
GigabitEthernet 3/1/10.
<RouterD> system-view
[RouterD] interface GigabitEthernet 3/1/10
[RouterD-GigabitEthernet3/1/10] ntp-service multicast-client
Because Router D and Router C are on the same subnet, Router D can receive the multicast
messages from Router C without being IGMP-enabled and can be synchronized to Router C.
# View the NTP status of Router D after clock synchronization.
[RouterD] display ntp-service status
Clock status: synchronized
Clock stratum: 3
Reference clock ID: 3.0.1.31
Nominal frequency: 64.0000 Hz
Actual frequency: 64.0000 Hz
Clock precision: 2^7
Clock offset: 0.0000 ms
Root delay: 31.00 ms
Root dispersion: 8.31 ms
74
Page 87

Peer dispersion: 34.30 ms
Reference time: 16:01:51.713 UTC Sep 19 2005 (C6D95F6F.B6872B02)
As shown above, Router D has been synchronized to Router C and the clock stratum level of Router
D is 3, while that of Router C is 2.
# View the NTP session information of Router D, which shows that an association has been set up
between Router D and Router C.
[RouterD-GigabitEthernet 3/1/10] display ntp-service sessions
source reference stra reach poll now offset delay disper
**************************************************************************
[1234] 3.0.1.31 127.127.1.0 2 254 64 62 -16.0 31.0 16.6
note: 1 source(master),2 source(peer),3 selected,4 candidate,5 configured
Total associations : 1
4. Configure Router B:
Because Router A and Router C are on different subnets, you must enable the multicast functions on
Router B before Router A can receive multicast messages from Router C.
# Enable the IP multicast function.
<RouterB> system-view
[RouterB] multicast routing-enable
[RouterB] interface GigabitEthernet 3/1/1
[RouterB-GigabitEthernet3/1/1] igmp enable
[RouterB-GigabitEthernet3/1/1] igmp static-group 224.0.1.1
[RouterB-GigabitEthernet3/1/1] quit
[RouterB] interface GigabitEthernet 3/1/2
[RouterB-GigabitEthernet3/1/2] pim dm
5. Configure Router A:
<RouterA> system-view
[RouterA] interface GigabitEthernet 3/1/1
# Configure Router A to work in multicast client mode and receive multicast messages on
GigabitEthernet 3/1/1.
[RouterA-GigabitEthernet3/1/1] ntp-service multicast-client
# View the NTP status of Router A after clock synchronization.
[RouterA-GigabitEthernet3/1/1] display ntp-service status
Clock status: synchronized
Clock stratum: 3
Reference clock ID: 3.0.1.31
Nominal frequency: 64.0000 Hz
Actual frequency: 64.0000 Hz
Clock precision: 2^7
Clock offset: 0.0000 ms
Root delay: 40.00 ms
Root dispersion: 10.83 ms
Peer dispersion: 34.30 ms
Reference time: 16:02:49.713 UTC Sep 19 2005 (C6D95F6F.B6872B02)
As shown above, Router A has been synchronized to Router C and the clock stratum level of Router
A is 3, while that of Router C is 2.
# View the NTP session information of Router A, which shows that an association has been set up
between Router A and Router C.
75
Page 88

NOTE:
[RouterA-GigabitEthernet3/1/1] display ntp-service sessions
source reference stra reach poll now offset delay disper
**************************************************************************
[1234] 3.0.1.31 127.127.1.0 2 255 64 26 -16.0 40.0 16.6
note: 1 source(master),2 source(peer),3 selected,4 candidate,5 configured
Total associations : 1
For more information about how to configuration IGMP and PIM, see
IP Multicast Configuration Guide
Configuring NTP client/server mode with authentication
Network requirements
As shown in Figure 29, perform the following configurations to synchronize the time between Device B
and Device A and ensure network security. More specifically:
• The local clock of Device A is to be configured as a reference source, with the stratum level of 2.
• Device B works in the client mode and Device A is to be used as the NTP server of Device B, with
Device B as the client.
• NTP authentication is to be enabled for Device A and Device B at the same time.
Figure 29 Network diagram
Configuration procedure
1. Set the IP address for each interface as shown in Figure 29. (Details not shown)
.
2. Configure Device A
# Specify the local clock as the reference source, with the stratum level of 2.
<DeviceA> system-view
[DeviceA] ntp-service refclock-master 2
3. Configure Device B:
<DeviceB> system-view
# Enable NTP authentication on Device B.
[DeviceB] ntp-service authentication enable
# Set an authentication key.
[DeviceB] ntp-service authentication-keyid 42 authentication-mode md5 aNiceKey
# Specify the key as key as a trusted key.
[DeviceB] ntp-service reliable authentication-keyid 42
# Specify Device A as the NTP server of Device B.
[DeviceB] ntp-service unicast-server 1.0.1.11 authentication-keyid 42
Before Device B can synchronize its clock to that of Device A, you need to enable NTP
authentication for Device A.
Perform the following configuration on Device A:
76
Page 89

# Enable NTP authentication.
[DeviceA] ntp-service authentication enable
# Set an authentication key.
[DeviceA] ntp-service authentication-keyid 42 authentication-mode md5 aNiceKey
# Specify the key as a trusted key.
[DeviceA] ntp-service reliable authentication-keyid 42
# View the NTP status of Device B after clock synchronization.
[DeviceB] display ntp-service status
Clock status: synchronized
Clock stratum: 3
Reference clock ID: 1.0.1.11
Nominal frequency: 64.0000 Hz
Actual frequency: 64.0000 Hz
Clock precision: 2^7
Clock offset: 0.0000 ms
Root delay: 31.00 ms
Root dispersion: 1.05 ms
Peer dispersion: 7.81 ms
Reference time: 14:53:27.371 UTC Sep 19 2005 (C6D94F67.5EF9DB22)
As shown above, Device B has been synchronized to Device A, and the clock stratum level of
Device B is 3, while that of Device A is 2.
# View the NTP session information of Device B, which shows that an association has been set up
Device B and Device A.
[DeviceB] display ntp-service sessions
source reference stra reach poll now offset delay disper
**************************************************************************
[12345] 1.0.1.11 127.127.1.0 2 63 64 3 -75.5 31.0 16.5
note: 1 source(master),2 source(peer),3 selected,4 candidate,5 configured
Total associations : 1
Configuring NTP broadcast mode with authentication
Network requirements
As shown in Figure 30, Router C functions as the NTP server for multiple routers on different network
segments and synchronizes the time among multiple routers. More specifically:
• Router C’s local clock is to be used as a reference source, with the stratum level of 3.
• Router C works in the broadcast server mode and sends out broadcast messages from
GigabitEthernet 3/1/10.
• Router D works in the broadcast client mode and receives broadcast client through GigabitEthernet
3/1/10.
• NTP authentication is enabled on both Router C and Router D.
77
Page 90

Figure 30 Network diagram
GE3/1/10
3.0.1.31/24
Router C
GE3/1/10
1.0.1.11/24
Router A
Configuration procedure
1. Set the IP address for each interface as shown in Figure 30. (Details not shown)
2. Configure Router C:
# Specify the local clock as the reference source, with the stratum level of 3.
<RouterC> system-view
[RouterC] ntp-service refclock-master 3
# Configure NTP authentication
[RouterC] ntp-service authentication enable
[RouterC] ntp-service authentication-keyid 88 authentication-mode md5 123456
[RouterC] ntp-service reliable authentication-keyid 88
# Specify Router C as an NTP broadcast server, and specify an authentication key.
[RouterC] interface GigabitEthernet 3/1/10
[RouterC-GigabitEthernet3/1/10] ntp-service broadcast-server authentication-keyid
88
3. Configure Router D:
GE3/1/1
1.0.1.10/24
Router B
GE3/1/10
3.0.1.30/24
GE3/1/10
3.0.1.32/24
Router D
# Configure NTP authentication
<RouterD> system-view
[RouterD] ntp-service authentication enable
[RouterD] ntp-service authentication-keyid 88 authentication-mode md5 123456
[RouterD] ntp-service reliable authentication-keyid 88
# Configure Router D to work in the NTP broadcast client mode
[RouterD] interface GigabitEthernet 3/1/10
[RouterD-GigabitEthernet3/1/10] ntp-service broadcast-client
Now, Router D can receive broadcast messages through GigabitEthernet 3/1/10, and Router C
can send broadcast messages through GigabitEthernet 3/1/10. Upon receiving a broadcast
message from Router C, Router D synchronizes its clock with that of Router C.
# View the NTP status of Router D after clock synchronization.
[RouterD-GigabitEthernet3/1/10] display ntp-service status
Clock status: synchronized
Clock stratum: 4
Reference clock ID: 3.0.1.31
78
Page 91

A
Nominal frequency: 64.0000 Hz
Actual frequency: 64.0000 Hz
Clock precision: 2^7
Clock offset: 0.0000 ms
Root delay: 31.00 ms
Root dispersion: 8.31 ms
Peer dispersion: 34.30 ms
Reference time: 16:01:51.713 UTC Sep 19 2005 (C6D95F6F.B6872B02)
As shown above, Router D has been synchronized to Router C and the clock stratum level of Router
D is 4, while that of Router C is 3.
# View the NTP session information of Router D, which shows that an association has been set up
between Router D and Router C.
[RouterD-GigabitEthernet3/1/10] display ntp-service sessions
source reference stra reach poll now offset delay disper
**************************************************************************
[1234] 3.0.1.31 127.127.1.0 3 254 64 62 -16.0 32.0 16.6
note: 1 source(master),2 source(peer),3 selected,4 candidate,5 configured
Total associations : 1
Configuring MPLS VPN time synchronization in client/server mode
Network requirements
As shown in Figure 31, two VPNs are present on PE 1 and PE 2: VPN 1 and VPN 2. CE 1 and CE 3 are
routers in VPN 1. To synchronize the time between CE 1 and CE 3 in VPN 1, perform the following
configurations:
• CE 1’s local clock is to be used as a reference source, with the stratum level of 1.
• CE 3 is synchronized to CE 1 in the client/server mode.
NOTE:
t present, MPLS L3VPN time synchronization can be implemented only in the unicast mode (client/server
mode or symmetric peers mode), but not in the multicast or broadcast mode.
79
Page 92

Figure 31 Network diagram
Device Interface IP address Device Interface IP address
CE 1 GE4/1/1 10.1.1.1/24 PE 1
CE 2 GE4/1/1 10.2.1.1/24
CE 3 GE4/1/1 10.3.1.1/24 GE4/1/3 10.2.1.2/24
CE 4 GE4/1/1 10.4.1.1/24 PE 2
P GE4/1/1 172.1.1.2/24
GE4/1/2 172.2.1.1/24 GE4/1/3 10.4.1.2/24
GE4/1/1 10.1.1.2/24
GE4/1/2 172.1.1.1/24
GE4/1/1 10.3.1.2/24
GE4/1/2 172.2.1.2/24
Configuration procedure
NOTE:
Prior to performing the following configuration, be sure you have completed MPLS VPN-related
configurations and make sure of the reachability between CE 1 and PE 1, between PE 1 and PE 2, and
between PE 2 and CE 3. For more information about MPLS VPN, see
1. Set the IP address for each interface as shown in Figure 31. (Details not shown)
2. Configure CE 1:
# Specify the local clock as the reference source, with the stratum level of 1.
<CE1> system-view
[CE1] ntp-service refclock-master 1
3. Configure CE 3:
# Specify CE 1 in VPN 1 as the NTP server of CE 3.
<CE3> system-view
[CE3] ntp-service unicast-server 10.1.1.1
# View the NTP session information and status information on CE 3 a certain period of time later.
The information should show that CE 3 has been synchronized to CE 1, with the clock stratum level
of 2.
[CE3] display ntp-service status
Clock status: synchronized
Clock stratum: 2
MPLS Configuration Guide
.
80
Page 93

Reference clock ID: 10.1.1.1
Nominal frequency: 63.9100 Hz
Actual frequency: 63.9100 Hz
Clock precision: 2^7
Clock offset: 0.0000 ms
Root delay: 47.00 ms
Root dispersion: 0.18 ms
Peer dispersion: 34.29 ms
Reference time: 02:36:23.119 UTC Jan 1 2001(BDFA6BA7.1E76C8B4)
[CE2] display ntp-service sessions
source reference stra reach poll now offset delay disper
**************************************************************************
[12345]10.1.1.1 LOCL 1 7 64 15 0.0 47.0 7.8
note: 1 source(master),2 source(peer),3 selected,4 candidate,5 configured
Total associations : 1
[CE3] display ntp-service trace
server 127.0.0.1,stratum 2, offset -0.013500, synch distance 0.03154
server 10.1.1.1,stratum 1, offset -0.506500, synch distance 0.03429
refid 127.127.1.0
Configuring MPLS VPN time synchronization in symmetric peers mode
Network requirements
As shown in Figure 31, two VPNs are present on PE 1 and PE 2: VPN 1 and VPN 2. To synchronize the
time between PE 1 and PE 2 in VPN 1, perform the following configurations:
• PE 1’s local clock is to be used as a reference source, with the stratum level of 1.
• PE 2 is synchronized to PE 1 in the symmetric peers mode, and specify that the VPN is VPN 1.
Configuration procedure
1. Set the IP address for each interface as shown in Figure 31. (Details not shown)
2. Configure PE 1:
# Specify the local clock as the reference source, with the stratum level of 1.
<PE1> system-view
[PE1] ntp-service refclock-master 1
3. Configure PE 2:
# Specify PE 1 in VPN 1 as the symmetric-passive peer of PE 2.
<PE2> system-view
[PE2] ntp-service unicast-peer vpn-instance vpn1 10.1.1.2
# View the NTP session information and status information on PE 2 a certain period of time later.
The information should show that PE 2 has been synchronized to PE 1, with the clock stratum level
of 2.
[PE2] display ntp-service status
Clock status: synchronized
Clock stratum: 2
Reference clock ID: 10.1.1.2
81
Page 94

Nominal frequency: 63.9100 Hz
Actual frequency: 63.9100 Hz
Clock precision: 2^7
Clock offset: 0.0000 ms
Root delay: 32.00 ms
Root dispersion: 0.60 ms
Peer dispersion: 7.81 ms
Reference time: 02:44:01.200 UTC Jan 1 2001(BDFA6D71.33333333)
[PE2] display ntp-service sessions
source reference stra reach poll now offset delay disper
**************************************************************************
[12345]10.1.1.2 LOCL 1 1 64 29 -12.0 32.0 15.6
note: 1 source(master),2 source(peer),3 selected,4 candidate,5 configured
Total associations : 1
[PE2] display ntp-service trace
server 127.0.0.1,stratum 2, offset -0.012000, synch distance 0.02448
server 10.1.1.2,stratum 1, offset 0.003500, synch distance 0.00781
refid 127.127.1.0
82
Page 95

Configuring Clock monitoring
Clock monitoring module overview
Clock monitoring module provides highly-precise, highly-reliable synchronous digital hierarchy (SDH)
line interface 38.88 MHz clock signals for different line processing units (LPUs). It implements such
functions as input clock source automatic selection, software phase-lock, and real-time monitoring of the
clock status of the interface card. The clock monitoring module supports hardware reset of the clock card.
The clock monitoring module supports 14 reference clock sources (referred to as reference source
hereinafter), among which the first and the second are Bits clock sources and the others are line clock
sources. The first and the second reference sources respectively correspond to external interfaces 1 and
2 for receiving clock signals on the active switching and routing processing unit (SRPU). Figure 32 sh
the reference-slot relationship: On the SR8802, the clock in slot 2 corresponds to the fifth reference
source, and the clock in slot 3 corresponds to the sixth reference source.
Figure 32 Relationship between reference source and slot
ows
Classification of clock sources
Clock sources can be classified into three categories according to different sources of the clock source:
• Local clock source—38.88 MHz clock signals generated by a crystal oscillator inside the clock
monitoring module.
• Bits clock source—Clock signals generated by a specific Bits clock device. The signals are sent to
the clock monitoring module through a specific interface on the SRPU (switch and router processing
unit) and then sent to all cards by the clock monitoring module.
• Line clock source—Provided by the upper level device, whose precision is lower than that of the Bits
clock source. The signals are derived from the specified WAN interface and sent to the clock
monitoring module, which then sends the signals to all cards.
Reference source level
The reference source level is determined by the priority and the synchronization status marker (SSM) level
of the reference source.
Priority of the reference source
You can set a high priority for the reference source with high-precision and high-reliability to make it be
first selected as the clock source.
83
Page 96

SSM level of the reference source
SSM, also known as synchronization quality marker, indicates the synchronization timing signal level on
a synchronization timing transmission link.
The priority of SSM level of the reference source, ranging from high to low, includes:
• PRC—G.811 clock signal.
• TNC—G.812 transit node clock signal.
• LNC—G.812 local node clock signal.
• SETS—SDH device clock source signal.
• unknown—Unknown synchronization quality.
• DNU—Cannot be used as a clock source.
NOTE:
The reference source whose SSM level is DNU cannot be used as a clock source.
Working mode of the clock monitoring module
The clock monitoring module can be configured to work in either of the following two modes:
Manual mode
In this mode, the clock source is configured manually. The clock monitoring module does not
automatically switch the clock source, but just tracks the primary reference source. If the primary
reference source is lost, the clock monitoring module enters a holdover state.
Auto mode
In auto mode, the clock source is automatically selected by the system. When the primary clock source
is lost or not available, the clock monitoring module selects another clock source based on the following
rules:
• If SSM level is not activated, the clock source is determined by reference source priority. If two
• If SSM is activated, the clock source is decided by the SSM level. If two reference sources have the
NOTE:
The following clock sources are excluded in clock selection (when SSM is activated):
• Clock sources whose signals are lost.
• Clock sources whose priority is 255.
reference sources have the same priority, the clock source is selected according to the reference
source number (1 to 18). When the reference source with the highest priority is lost, the next
available reference source with the highest priority is selected. When the former clock source
becomes available, the system switches to that clock again.
same SSM level, the reference source priority takes effect, in the way described above.
• Clock sources whose SSM level is DNU (DoNotUse).
Working mode of the port clock
Depending on the source of the port clock, a port supports two modes of clocks:
84
Page 97

W
A
Master mode
In this mode, the system uses the clock signals provided by the clock monitoring module. The signals
include local clock signals and clock signals derived from LPU Port. If you have configured on the device
to derive clock signals from LPU Port, these derived signals are adopted; otherwise, local clock signals
are adopted.
Slave mode
In this mode, the system uses line clock signals. Only when you specify LPU Port of the device as the
current port can the system derive the clock source from the line signals received on the current port and
then send the clock source information to the clock monitoring module, which then sends the information
to all cards.
IMPORTANT:
hen connected to SONET/SDH devices, a device should be set to work in slave clock mode, because the
SONET/SDH clock is more precise than that of the device.
Clock monitoring module configuration task list
Complete these tasks to configure clock monitoring module:
Task Remarks
Configuring working mode of the clock monitoring module of the SRPU Optional
Configuring reference source priority Optional
Setting the ways of deriving SSM level Optional
Configuring SSM
for reference
sources
Setting the input port of the line clock (LPU port) Optional
Setting the bit position for transmitting bits clock source information Optional
Configuring SSM levels for the reference sources Optional
Activating/deactivating SSM Optional
Configuring working mode of the clock monitoring module of the SRPU
Step Command
1. Enter system view. system-view N/A
2. Set the working mode of the
clock monitoring module.
clock { auto | manual source
source-number }
Remarks
Optional.
auto by default.
NOTE:
fter you set the working mode of the clock monitoring module, it takes a period of time for device
response. You can check whether your configuration takes effect through the display clock device
command and the logging information.
85
Page 98

Configuring reference source priority
In auto mode, the clock monitoring module selects and switches to a reference source with a higher
priority based on SSM level and reference source priority. The smaller the value, the higher the priority.
To configure reference source priority:
Step Command
1. Enter system view. system-view N/A
2. Configure the reference
source priority.
clock priority value source
source-number
Remarks
255 by default.
Configuring SSM for reference sources
Setting the ways of deriving SSM level
You can use the following two ways to derive SSM level:
• For bits clock source, SSM level can be derived from the interface card and reported to the SRPU,
which then sends the SSM level to the clock monitoring module.
• Or you can configure SSM level as needed, as shown in the following table:
To set the ways of deriving SSM level:
Step Command
1. Enter system view.
2. Set the ways to derive SSM
level.
system-view N/A
clock forcessm { on | off } source
source-number
Remarks
Optional.
By default, no SSM level is derived
from any clock source, which
means the SSM level is set by
users.
Setting the bit position for transmitting bits clock source information
The bit position for transmitting Bits clock source information can be configured as sa4, sa5, sa6, sa7
and sa8. They are 5 bits in timeslot 0 of the even frame in a multi-frame as specified by ITU-TG.704 CRC4.
You can choose one from the five bits to carry SSM information.
To set the bit for transmitting Bits clock source information:
Step Command
1. Enter system view.
2. Set the bit for transmitting the
Bits clock source information.
system-view N/A
clock sa-bit { sa4 | sa5 | sa6 | sa7
| sa8 } source source-number
86
Remarks
Optional.
sa4 by default.
Page 99

Configuring SSM levels for the reference sources
Follow these rules to manually set the SSM level for the clock source:
• For the line clock source, the SSM level configured is that of the clock source.
• For Bits clock source, if the input signal is a 2048 kbps (E1) signal and the clock forcessm off source
source-number command is executed, the clock source adopts the SSM level derived from the input
signals and the SSM configured is omitted.
• For Bits clock source, if the input signal is a 2048 kHz signal or a 2048 kbps signal and the clock
forcesssm on source source-number command is executed, the clock source adopts the SSM level
configured.
To set the SSM levels:
Step Command
1. Enter system view.
2. Set the SSM levels of the
reference source.
system-view N/A
clock ssm { dnu | lnc | prc | sets |
tnc | unknown } source
source-number
NOTE:
• The reference source with the SSM level DNU cannot be used as a clock source. Therefore, it does not
participate in clock source switch when the clock monitoring module works in auto mode.
• After you set the SSM levels of the reference source, it takes a period of time for device response. In this
case, you can check whether your configuration takes effect through the display clock ssm-level
command and the logging information.
Activating/deactivating SSM
Whether the SSM levels are obtained through clock signals or configured manually, you have to activate
or deactivate them before they can take effect.
• When SSM is activated, the reference source level is decided by the SMM level first and then the
priority of the reference source in automatic clock source selection.
• When SSM is not activated, you can still set and view the SSM levels, but they are ignored and the
reference source level is decided by the priority of the reference source in automatic clock source
selection.
Remarks
unknown by default.
To activate or deactivate SSM:
Step Command
1. Enter system view.
2. Activate/deactivate SSM. clock ssmcontrol { on | off }
system-view N/A
Remarks
Optional.
By default, SSM is deactivated.
Setting the input port of the line clock (LPU port)
To set the input port of the line clock (LPU port):
87
Page 100

Step Command
1. Enter system view. system-view N/A
2. Set the input port of the line
clock.
3. Enter interface view (ATM
interface/POS
interface/CPOS interface/E1
interface/T1 interface).
4. Set the input interface to work
in Slave mode.
clock lpuport interface-type
interface-number
interface interface-type
interface-number
clock slave
Remarks
Optional.
By default, the clock input port is
the first configurable port by port
name in alphabetical order of the
interface card.
N/A
Optional.
By default, the input interface
works in Slave mode.
NOTE:
• For a POS interface card, if you set the port clock to work in Slave mode, you must use the clock lpuport
command to set the input port of the card clock source.
• For more information about the clock slave command, see
Interface Command Reference
.
Displaying and maintaining the clock monitoring module
Task Command Remarks
Display the current configuration of
the clock monitoring module.
Display the detailed information of
the clock monitoring module.
Display the input clock source port
of the line card.
Display the lock state of the clock
monitoring module.
Display the priority of all reference
sources.
Display the self-test result of the
clock monitoring module.
display clock config [ | { begin |
exclude | include }
regular-expression ]
display clock device [ | { begin |
exclude | include }
regular-expression ]
display clock lpuport [ | { begin |
exclude | include }
regular-expression ]
display clock phase-lock-state [ |
{ begin | exclude | include }
regular-expression ]
display clock priority [ | { begin |
exclude | include }
regular-expression ]
display clock self-test-result [ |
{ begin | exclude | include }
regular-expression ]
Available in any view
Available in any view
Available in any view
Available in any view
Available in any view
Available in any view
88
 Loading...