

Page 1

Hangzhou H3C Technologies Co., Ltd.
http://www.h3c.com
Document version: 5PW104-20110413
H3C SecCenter UTM Manager
Configuration Guide
Page 2

Copyright © 2009-2011, Hangzhou H3C Technologies Co., Ltd. and its licensors
All rights reserved
No part of this manual may be reproduced or transmitted in any form or by any means without prior
written consent of Hangzhou H3C Technologies Co., Ltd.
Trademarks
Notice
H3C,
, Aolynk, , H3Care,
SecPro, SecPoint, SecEngine, SecPath, Comware, Secware, Storware, NQA, VVG, V
, TOP G, , IRF, NetPilot, Neocean, NeoVTL,
2
G, VnG, PSPT,
XGbus, N-Bus, TiGem, InnoVision and HUASAN are trademarks of Hangzhou H3C Technologies Co.,
Ltd.
All other trademarks that may be mentioned in this manual are the property of their respective owners
The information in this document is subject to change without notice. Every effort has been made in the
preparation of this document to ensure accuracy of the contents, but all statements, information, and
recommendations in this document do not constitute the warranty of any kind, express or implied.
Page 3

Preface
The H3C SecCenter UTM Manager Configuration Guide describes Installation and uninstallation,
Integration with iMC, System management, Bandwidth management, Behavior auditing, IPS
management, Firewall management and Configuration example, and so on.
This preface includes:
•
Audience
Conventions
•
Obtaining documentation
•
Technical support
•
Documentation feedback
•
Audience
This documentation is intended for:
• Network planners
• Field technical support and servicing engineers
• Network administrators working with the SecCenter UTM Manager
Conventions
This section describes the conventions used in this documentation set.
GUI conventions
Convention Description
Boldface
> Multi-level menus are separated by angle brackets. For example, File > Create > Folder.
Symbols
Convention Description
WARNING
CAUTION
IMPORTANT
NOTE
Window names, button names, field names, and menu items are in Boldface. For
example, the New User window appears; click OK.
An alert that calls attention to important information that if not understood or followed can
result in personal injury.
An alert that calls attention to important information that if not understood or followed can
result in data loss, data corruption, or damage to hardware or software.
An alert that calls attention to essential information.
An alert that contains additional or supplementary information.
TIP
An alert that provides helpful information.
Page 4
Network topology icons
Represents a generic network device, such as a router, switch, or firewall.
Represents a routing-capable device, such as a router or Layer 3 switch.
Represents a generic switch, such as a Layer 2 or Layer 3 switch, or a router that supports
Layer 2 forwarding and other Layer 2 features.
Obtaining documentation
You can access the most up-to-date H3C product documentation on the World Wide Web at
http://www.h3c.com.
Click the links on the top navigation bar to obtain different categories of product documentation:
[Technical Support & Documents > Technical Documents] – Provides hardware installation, software
upgrading, and software feature configuration and maintenance documentation.
[Products & Solutions] – Provides information about products and technologies, as well as solutions.
[Technical Support & Documents > Software Download] – Provides the documentation released with the
software version.
Technical support
customer_service@h3c.com
http://www.h3c.com
Documentation feedback
You can e-mail your comments about product documentation to info@h3c.com.
We appreciate your comments.
Page 5

Contents
Overview ······································································································································································ 1
Introduction to H3C SecCenter UTM Manager ·············································································································1
What H3C SecCenter UTM Manager can do···············································································································1
Installation and uninstallation······································································································································ 2
Installing H3C SecCenter ·················································································································································2
Registering the UTM Manager·········································································································································4
Uninstalling the UTM Manager ·······································································································································5
Integration with iMC···················································································································································· 7
Using SCMTOOL to integrate SecCenter into iMC ·······································································································7
Removing SCMTOOL ·······················································································································································9
System management··················································································································································10
Device management ······················································································································································ 10
Managing device groups ····································································································································· 10
Managing device access templates ···················································································································· 12
Managing devices················································································································································· 15
Managing device software ·································································································································· 20
Managing the device configuration ···················································································································· 24
Managing the device software database··········································································································· 30
Managing deployment tasks ································································································································ 32
Managing events··················································································································································· 33
Configuring device interface alarming ··············································································································· 35
Operator management·················································································································································· 35
Managing Operators············································································································································ 35
Managing operation logs····································································································································· 38
Changing your password····································································································································· 39
System configuration······················································································································································ 40
Configuring service parameters··························································································································· 40
Configuring system parameters ··························································································································· 41
Configuring management ports ··························································································································· 41
Configuring the mail server·································································································································· 43
Configuring SMS alarming ··································································································································44
Managing filters ···················································································································································· 45
Managing LDAP servers ······································································································································· 47
Configuring SMS alarming ··································································································································49
Configuring segments ··········································································································································· 50
Monitoring the disk space ···································································································································· 51
Managing subsystems··········································································································································· 53
Bandwidth management············································································································································56
Traffic snapshot ······························································································································································ 56
Traffic snapshot······················································································································································ 56
Segment traffic comparison·································································································································· 58
Traffic anomaly alarm··········································································································································· 59
Service traffic analysis by device group······················································································································ 61
Service traffic trend ··············································································································································· 61
Service traffic distribution ····································································································································· 65
Generic service analysis······································································································································· 68
Service traffic analysis by user ····································································································································· 69
i
Page 6

Top users' traffic statistics ····································································································································· 69
Realtime traffic monitoring of a single user ········································································································ 71
Service traffic trend of a single user···················································································································· 72
Service traffic distribution of a single user·········································································································· 75
Detailed session statistics······································································································································ 77
Service traffic analysis by IP group······························································································································ 78
Managing IP groups ············································································································································· 78
Realtime traffic snapshots of an IP group············································································································ 81
Service traffic trend of an IP group······················································································································ 82
Service traffic distribution of an IP group ··········································································································· 85
Traffic statistics of top users in an IP group ········································································································ 87
Behavior auditing·······················································································································································89
User behavior analysis ·················································································································································· 89
Website analysis ··················································································································································· 89
Email application analysis···································································································································· 91
User behavior auditing·················································································································································· 92
Web application auditing ···································································································································· 92
FTP application auditing ······································································································································· 93
Email application auditing ···································································································································94
Instant message application auditing·················································································································· 95
Telnet application auditing··································································································································· 96
SQL application auditing······································································································································ 97
NAT logs auditing ················································································································································· 98
Quick auditing ······················································································································································· 99
User details ··························································································································································100
User behavior alarm ···········································································································································101
Database auditing and analysis·································································································································103
Viewing database access snapshot ··················································································································103
Viewing database access trend analysis··········································································································105
Viewing database access details ······················································································································109
Managing SQL statement filtering conditions ··································································································111
Managing database access alarms ··················································································································113
URL analysis··································································································································································118
Event snapshot ·····················································································································································118
Aggregate analysis ·············································································································································119
User action analysis ············································································································································120
Category auditing ···············································································································································121
Audit logs backup ························································································································································122
Backing up manually ··········································································································································122
Scheduling auto backup ·····································································································································124
Importing backed up logs···································································································································125
IPS management······················································································································································ 128
Device management ····················································································································································128
Managing UTM devices ·····································································································································128
Managing signature files····································································································································131
Rule list··································································································································································133
Displaying device statistics·································································································································134
Realtime monitoring ·····················································································································································135
Displaying event snapshots ································································································································135
Displaying attack/virus/DDoS snapshot list·····································································································139
Monitoring devices··············································································································································141
Event analysis ·······························································································································································142
Displaying attack/virus/DDoS attack event analysis reports ·········································································142
ii
Page 7

Attack event details ·············································································································································146
Displaying virus event details·····························································································································149
Displaying DDoS event details···························································································································151
Configuring the alarming function·····················································································································152
Managing report export tasks····························································································································155
Policy management······················································································································································157
Configuring attack protection policies ··············································································································158
Configuring anti-virus policies····························································································································162
Configuring policy applications ························································································································165
Displaying attack signatures ······························································································································168
Displaying virus category list ·····························································································································170
Configuring custom events ·································································································································171
Importing and exporting policies·······················································································································179
Firewall management ············································································································································· 182
Firewall device management ······································································································································182
Managing firewall devices·································································································································182
Viewing device statistics ·····································································································································184
Managing the device configuration database·································································································184
Managing deployment tasks ······························································································································191
Attack events monitoring ·············································································································································192
Snapshot of events ··············································································································································192
Recent events list··················································································································································194
Device monitoring ···············································································································································195
Event analysis ·······························································································································································195
Event overview·····················································································································································195
Viewing event details··········································································································································197
Managing report export tasks····························································································································199
Event auditing·······························································································································································201
Auditing traffic anomaly logs·····························································································································201
Auditing operation logs ······································································································································202
Auditing blacklist logs·········································································································································203
Auditing NAT logs···············································································································································204
Auditing interzone access logs ··························································································································204
Auditing MPLS logs ·············································································································································205
Auditing other logs··············································································································································205
Security policy management·······································································································································206
Managing security zones ···································································································································206
Managing time ranges ·······································································································································208
Managing services··············································································································································210
Managing IP addresses ······································································································································215
Managing interzone rules ··································································································································222
Managing interzone policies ·····························································································································226
Managing interzone policy applications··········································································································229
Configuration example 1 ······································································································································· 233
Network requirements ·················································································································································233
Configuring the UTM devices ·····································································································································233
Adding the UTM devices to the UTM Manager········································································································233
Configuration example 2 ······································································································································· 235
Network requirements ·················································································································································235
Configuration procedures ···········································································································································235
Configuring the UTM device ······························································································································235
Configuring the SecCenter ·································································································································238
Configuring intrusion detection on the UTM and specifying sending logs to the SecCenter······················238
iii
Page 8

Configuring the advanced detection policies and specifying sending logs to the SecCenter····················241
Verification····································································································································································247
Firewall logs and SecCenter analysis ···············································································································247
Index ········································································································································································ 254
iv
Page 9

Overview
Introduction to H3C SecCenter UTM Manager
H3C SecCenter Unified Threat Management (UTM) Manager is a powerful system for comprehensive
analysis and centralized management of UTM devices. It is an important component of the H3C Security
Management Center (SecCenter).
The UTM Manager allows you to manage and control all UTM devices in your network. It features great
scalability, visual realtime event monitoring, comprehensive security event analysis such as attack, virus,
worm, and DDoS event analysis, and rich reports, enabling you to learn the network security status at any
time. Together with UTM devices, the UTM Manager provides you with visual, all-around, powerful
network security protection.
Meanwhile, the UTM Manager supports control and auditing based on Layer 7 applications. It provides
traffic analysis and management based on service, user, and IP group, enables peer to peer (P2P)
service monitoring and management, and allows for user behavior auditing and service control policies,
satisfying the requirements of service providers for granular data support and traffic/service control, and
virtually implementing visual control and management of network applications.
What H3C SecCenter UTM Manager can do
As a powerful, efficient UTM device management system, the UTM Manager allows for centralized
management of UTM devices, unified traffic and service monitoring, centralized collection and analysis
of security events, exact analysis of network traffic, and rich network resource usage reports. From the
all-around reports, you can learn the history security status as well as the security trends of the network
easily.
The UTM Manager presents the following key features:
• Exact application traffic analysis, allowing you to know the network resources usage thoroughly.
• Realtime traffic abnormality and service abnormality detection, helping you prevent overuse of
bandwidth.
• All-around attack/virus event monitoring, helping you discover security problems in time.
• Automatic, periodic report exporting, releasing you from manual export of reports.
• Visual realtime monitoring, helping you detect network attacks in time.
• Perfect comprehensive analysis and rich statistics reports, reducing your analysis time.
• Fine log and behavior auditing, allowing you to track events easily.
• Centralized upgrade of signature files, ensuring identification of new attack behaviors.
• Friendly and easy-to-use interface, allowing easy deployment.
1
Page 10
Installation and uninstallation
Installing H3C SecCenter
Installing H3C SecCenter installs all H3C SecCenter components at the same time.
H3C SecCenter runs on Windows. The detailed software and hardware requirements are as follows:
• Hardware: P4 2.0 CPU or above, 1.5G memory or more, 80G disk or more.
• Operating system: Windows 2003 Server (recommended) or Windows XP, installed with the
up-to-date patches.
• Browser: IE 6.0 or above
To install H3C SecCenter, run the executable file install.exe, which is under the installation directory, and
proceed as prompted. During installation, pay attention to the following steps:
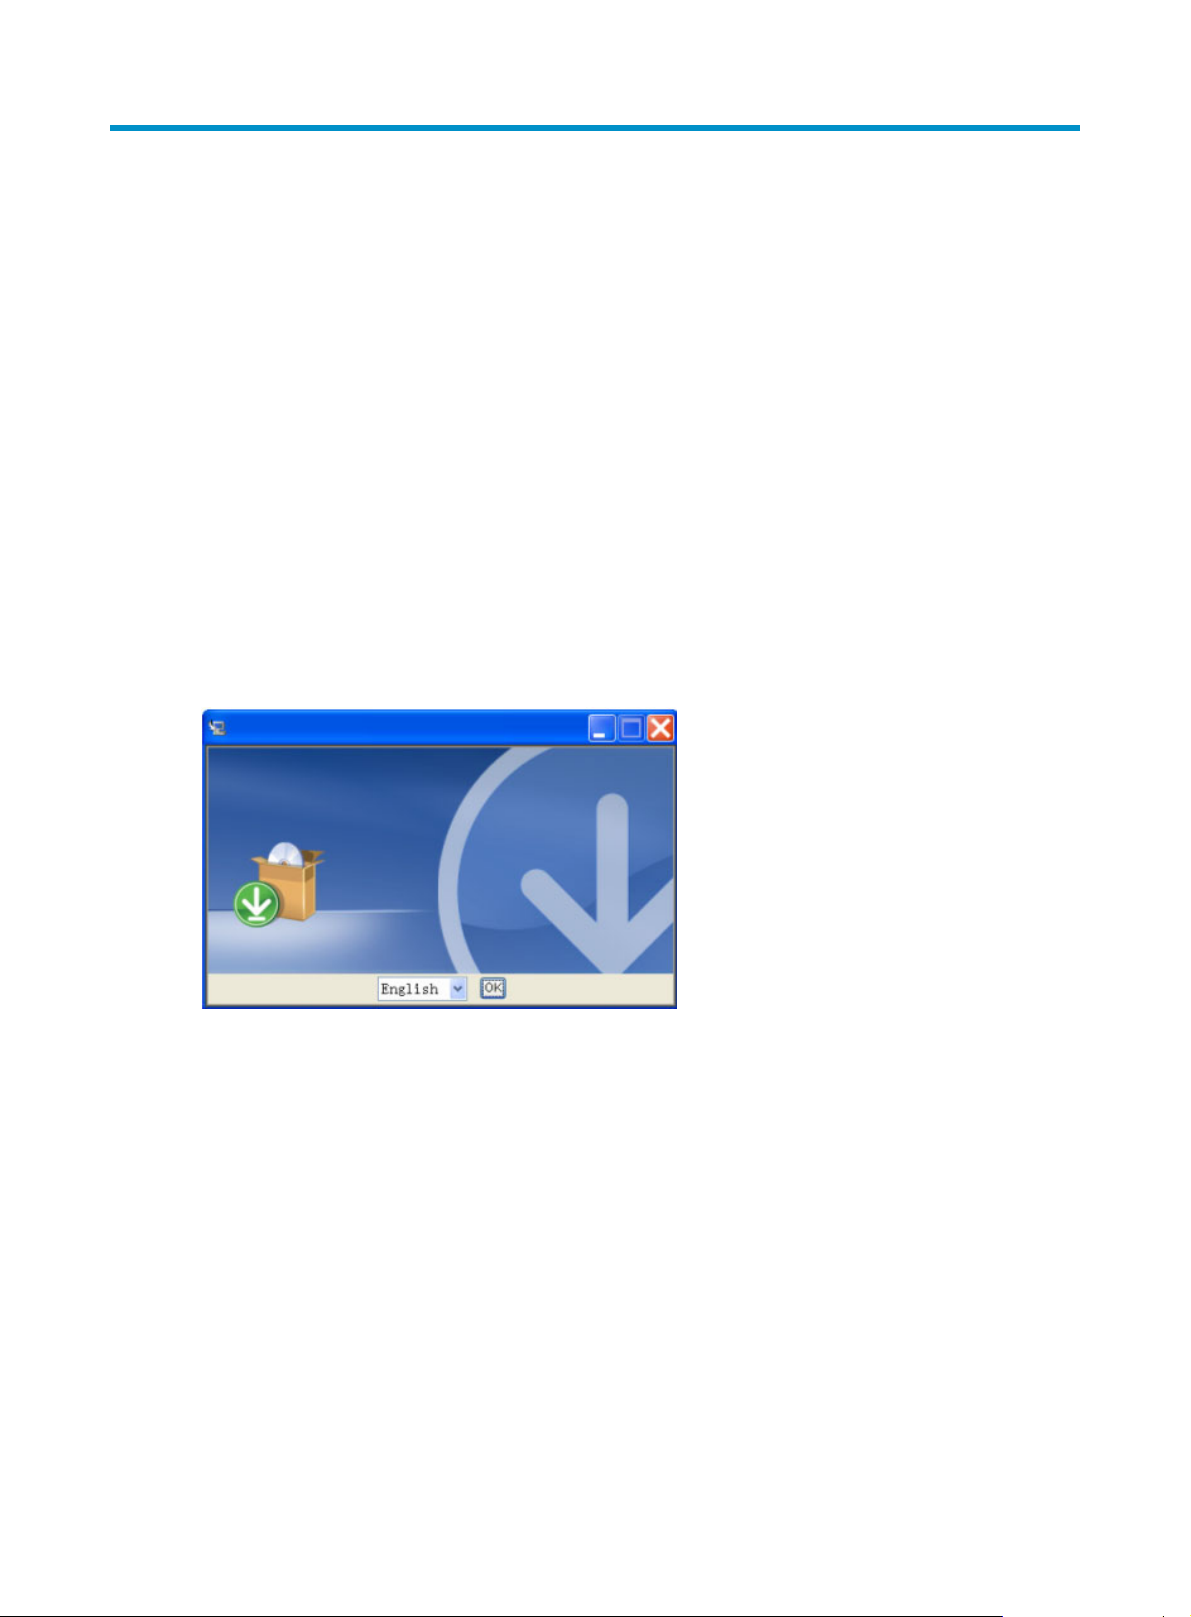
1. On the language selection page, select English from the language dropdown list as shown in
Figure 1, and click OK to continue.
Figure 1 Select the language for SecCenter
2. On the SecCenter server port page, type a port number or leave the default port number 80
unchanged and click Next to continue, as shown in
Figure 2.
2
Page 11
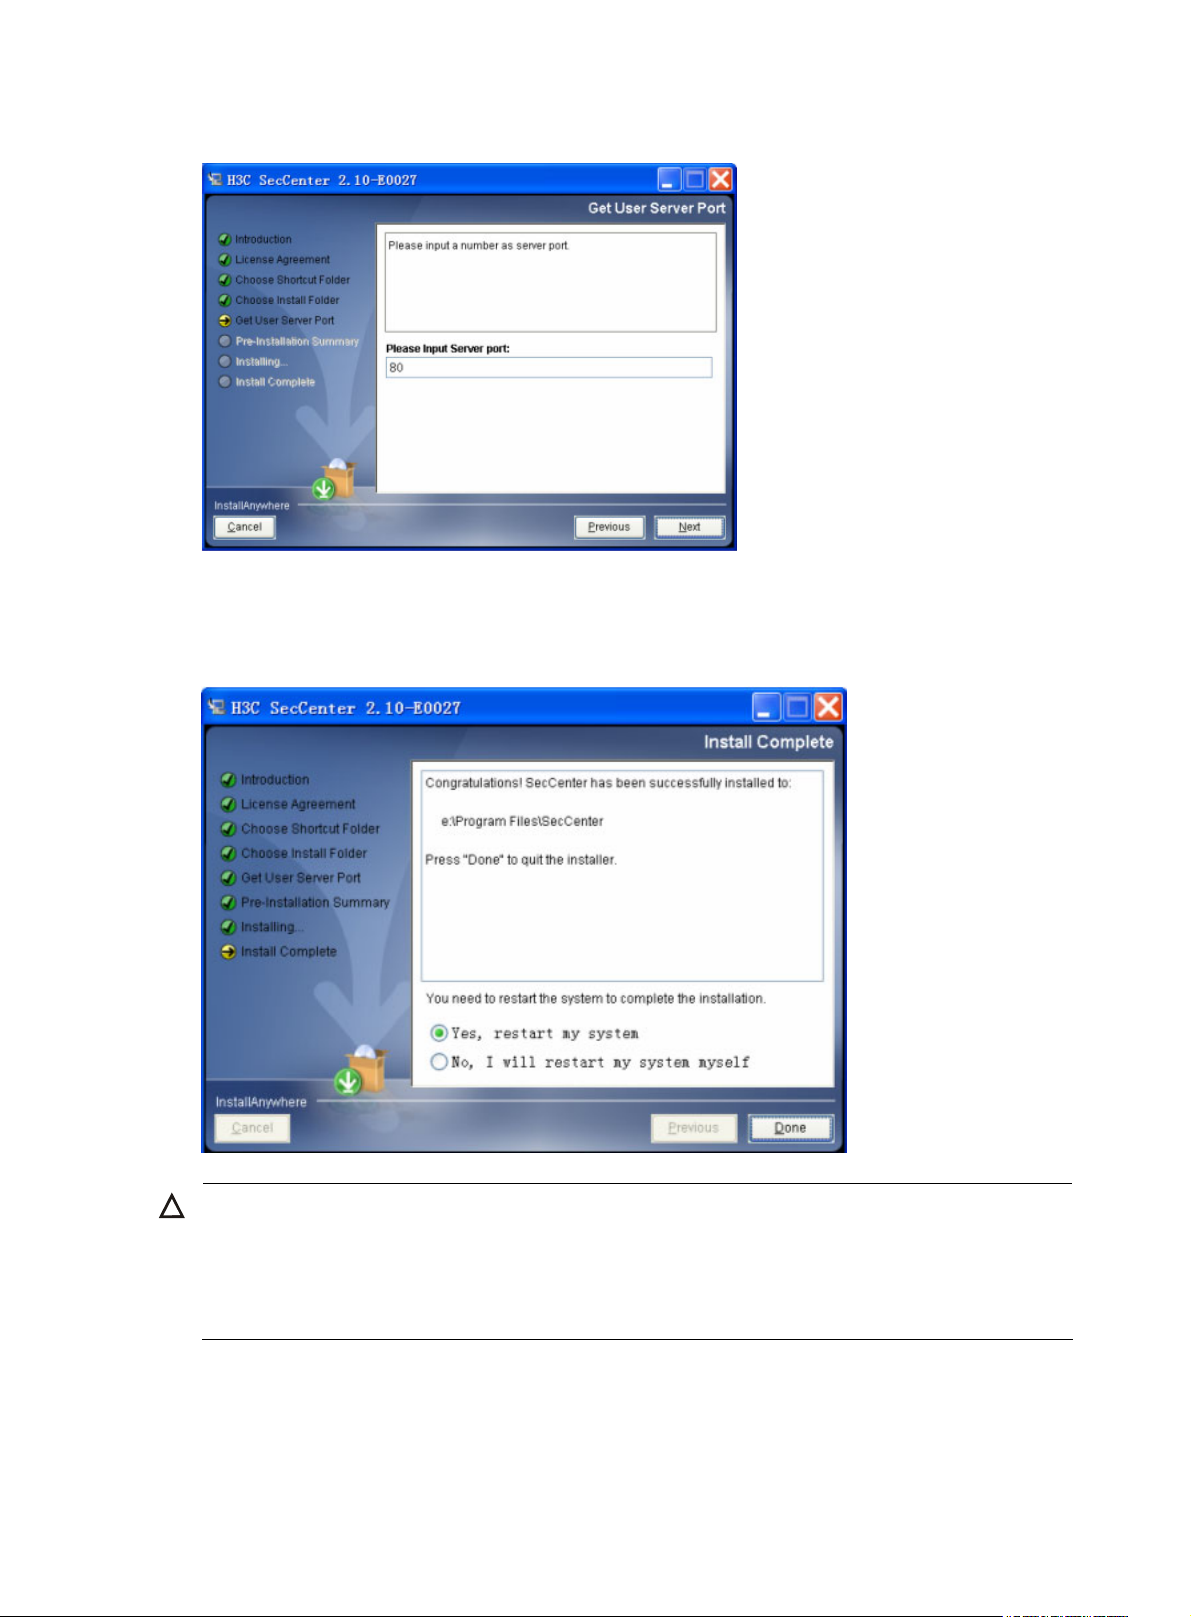
Figure 2 Specify the SecCenter server port
3. At the end of the installation, select Yes, restart my system and click Done to restart your system
and complete the installation, as shown in
Figure 3.
Figure 3 Restart the system to complete the installation
CAUTION:
• At the end of the installation, you must restart the operating system to complete the installation.
• Installing H3C SecCenter installs all H3C SecCenter components at the same time. However, to use a
component, you must individually register the component by using a license for the component. For
more information about registration, see “
Registering the UTM Manager.”
3
Page 12
Registering the UTM Manager
Open the login page by entering http://localhost/ or http://localhost:port number/ (if you modified
the server port number during installation) In the address bar of the browser. The default login username
and password are admin and admin1 respectively.
CAUTION:
The last character of the password is digit 1.
When you log in to the UTM Manager for the first time, you will see the license information page and the
message “You haven’t registered. Please register to use the system normally.“ To register the UTM
Manager, follow these steps:
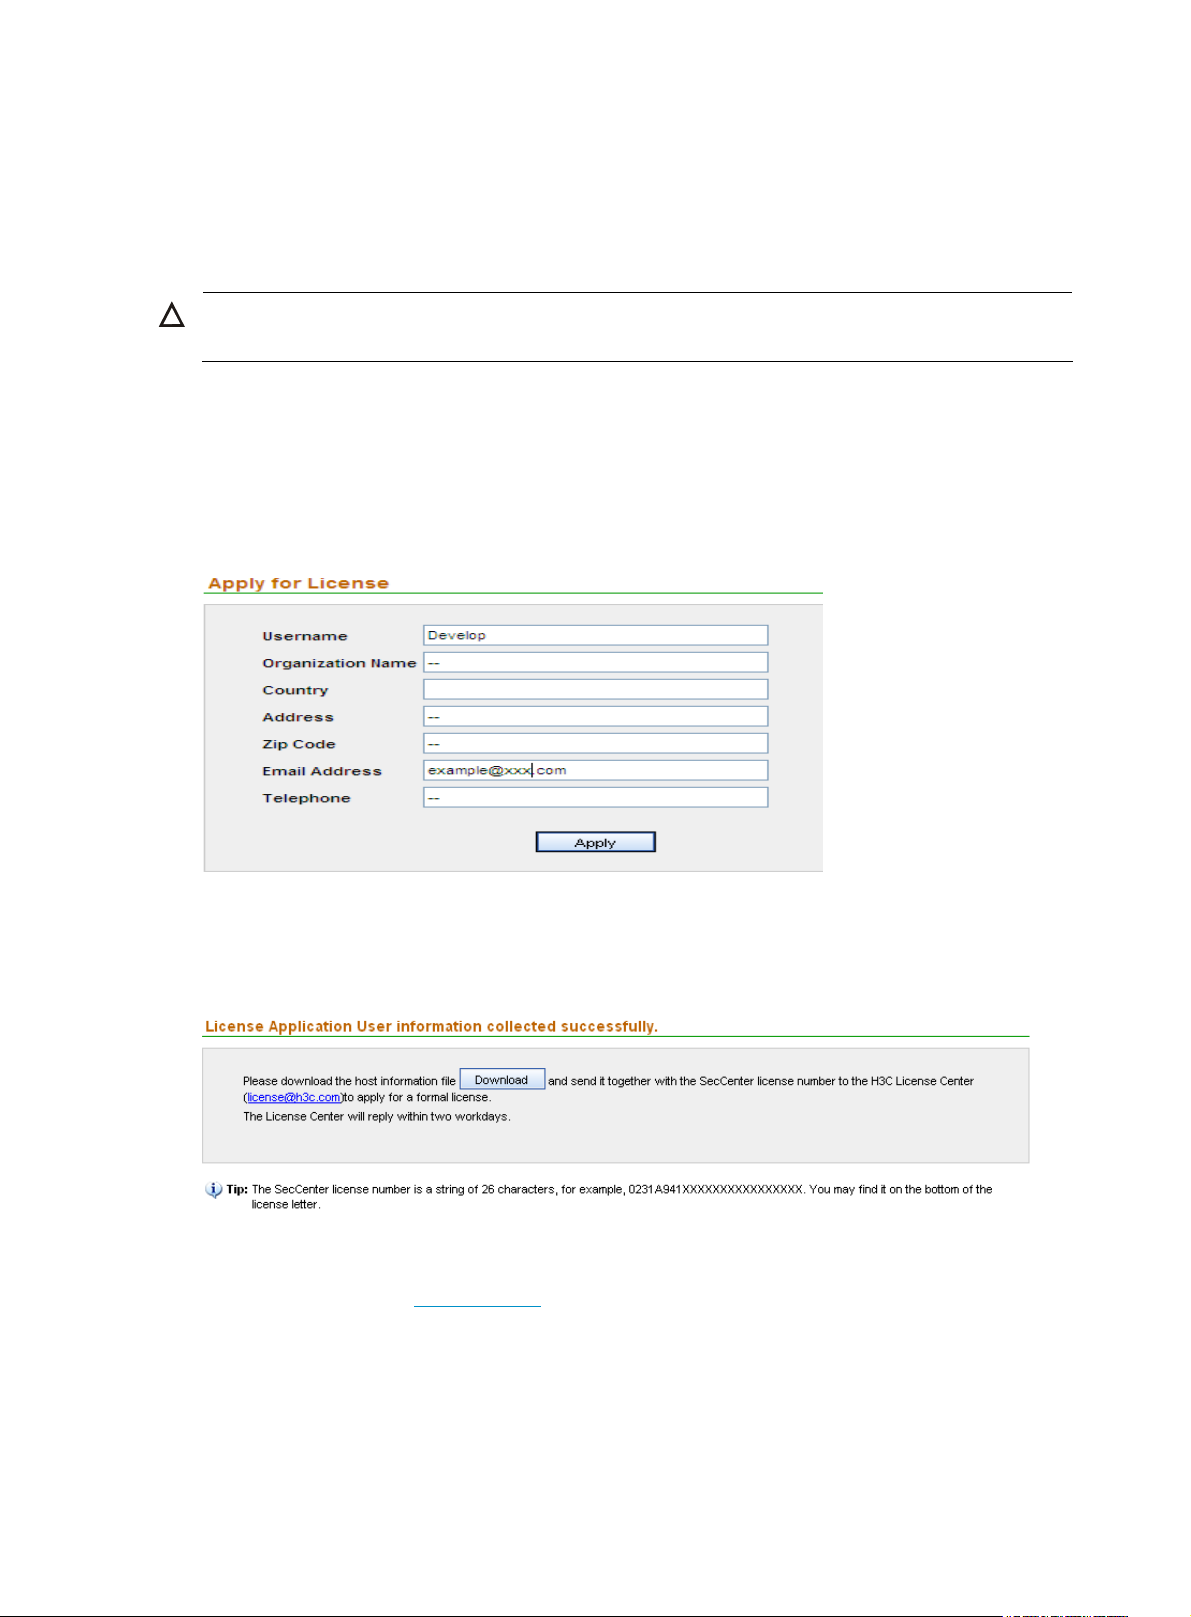
1. From the navigation tree, select License Application under License Management to enter the user
information page, as shown in
Figure 4 Input user information
Figure 4.
2. Type your information as required and click Apply. The acknowledgement page appears, as
shown in
Figure 5.
Figure 5 Download the host information to apply for a license
3. Click Download to download the host information and save it to a file.
4. Visit the website at www.h3c.com, choose Technical Support & Documents > Product Licensing.
Register your product, and obtain an activation file (also called license file) with the suffix lic.
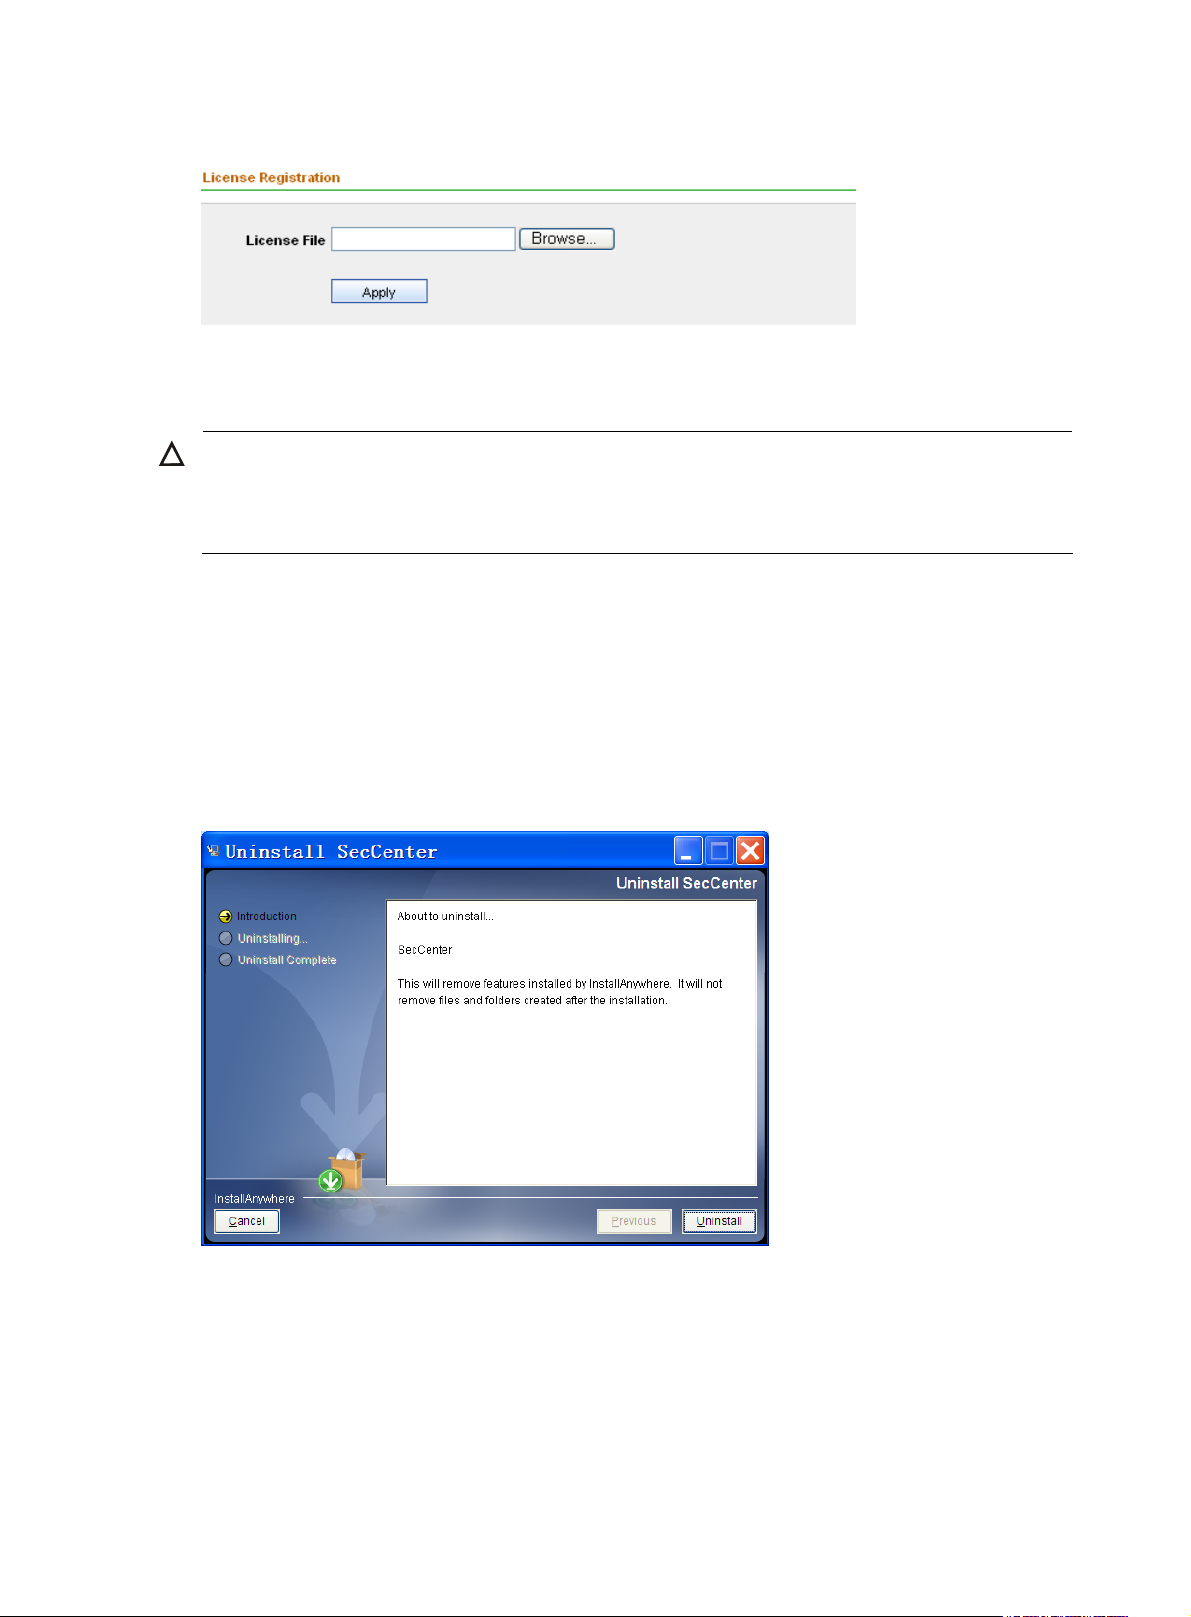
5. From the navigation tree, select License Registration under License Management to enter the
license registration page, as shown in
Figure 6. Select the license file and then click Apply.
4
Page 13
g
Figure 6 Register your license
After the acknowledgement page appears, you can use the UTM Manager to configure devices and
perform other operations.
CAUTION:
H3C SecCenter UTM Manager is shipped with a trial license file named SecCenter UTM Manager
Evaluation License.lic. The license is effective within one month. Before you
use the trial license to register.
Uninstalling the UTM Manager
To uninstall H3C SecCenter UTM Manager, follow these steps:
et a formal license, you can
1. On the Windows desktop, click Start and then select All Programs > SecCenter > Uninstall
SecCenter to enter the page shown in
2. Click Uninstall, and proceed as prompted. After the uninstallation completes, click Done.
Figure 7.
Figure 7 Uninstall the UTM Manager
3. Restart the operating system.
4. Remove all files and subdirectories under the SecCenter installation directory (C:\Program
Files\SecCenter, for example) and the installation directory itself, if any.
5
Page 14

CAUTION:
During the uninstallation process, no system data backup operation is performed and all data will also be
removed. If you need the system data, please backup the data before uninstalling the UTM Manager.
6
Page 15

Integration with iMC
H3C SecCenter can be integrated into H3C Intelligent Management Center (iMC). After being
integrated into iMC, SecCenter becomes a component of iMC and appears as a menu of iMC. You can
access all SecCenter functions from the menu. This means that you can manage all devices in your
network, including security devices, from a single place.
To integrate H3C SecCenter into H3C iMC, use the integration tool called SCMTOOL. You may obtain
the tool from your iMC supplier.
When installing H3C SecCenter on the same host as iMC, note the following:
• By default, iMC uses 8080 and 8443 as the HTTP and HTTPS port numbers and SecCenter uses 80
and 443. If you changed these settings during installation, ensure that there are no port conflicts.
• The iMC Alarm Manager and SecCenter both use port 162 to receive traps. To deploy them on the
same host, disable SecCenter from receiving SNMP traps.
• To access SecCenter integrated in iMC, you must use HTTP. HTTPS is not supported in this case.
Using SCMTOOL to integrate SecCenter into iMC
You can install SCMTOOL on iMC PLAT 3.20-R2606H10. Follow these steps to install SCMTOOL and
use it to integrate SecCenter into iMC:
1. In Intelligent Deployment Monitoring Agent, select the Monitor tab and click the Stop iMC button to
stop all iMC processes.
2. Click the Install button to open the component installation page.
7
Page 16
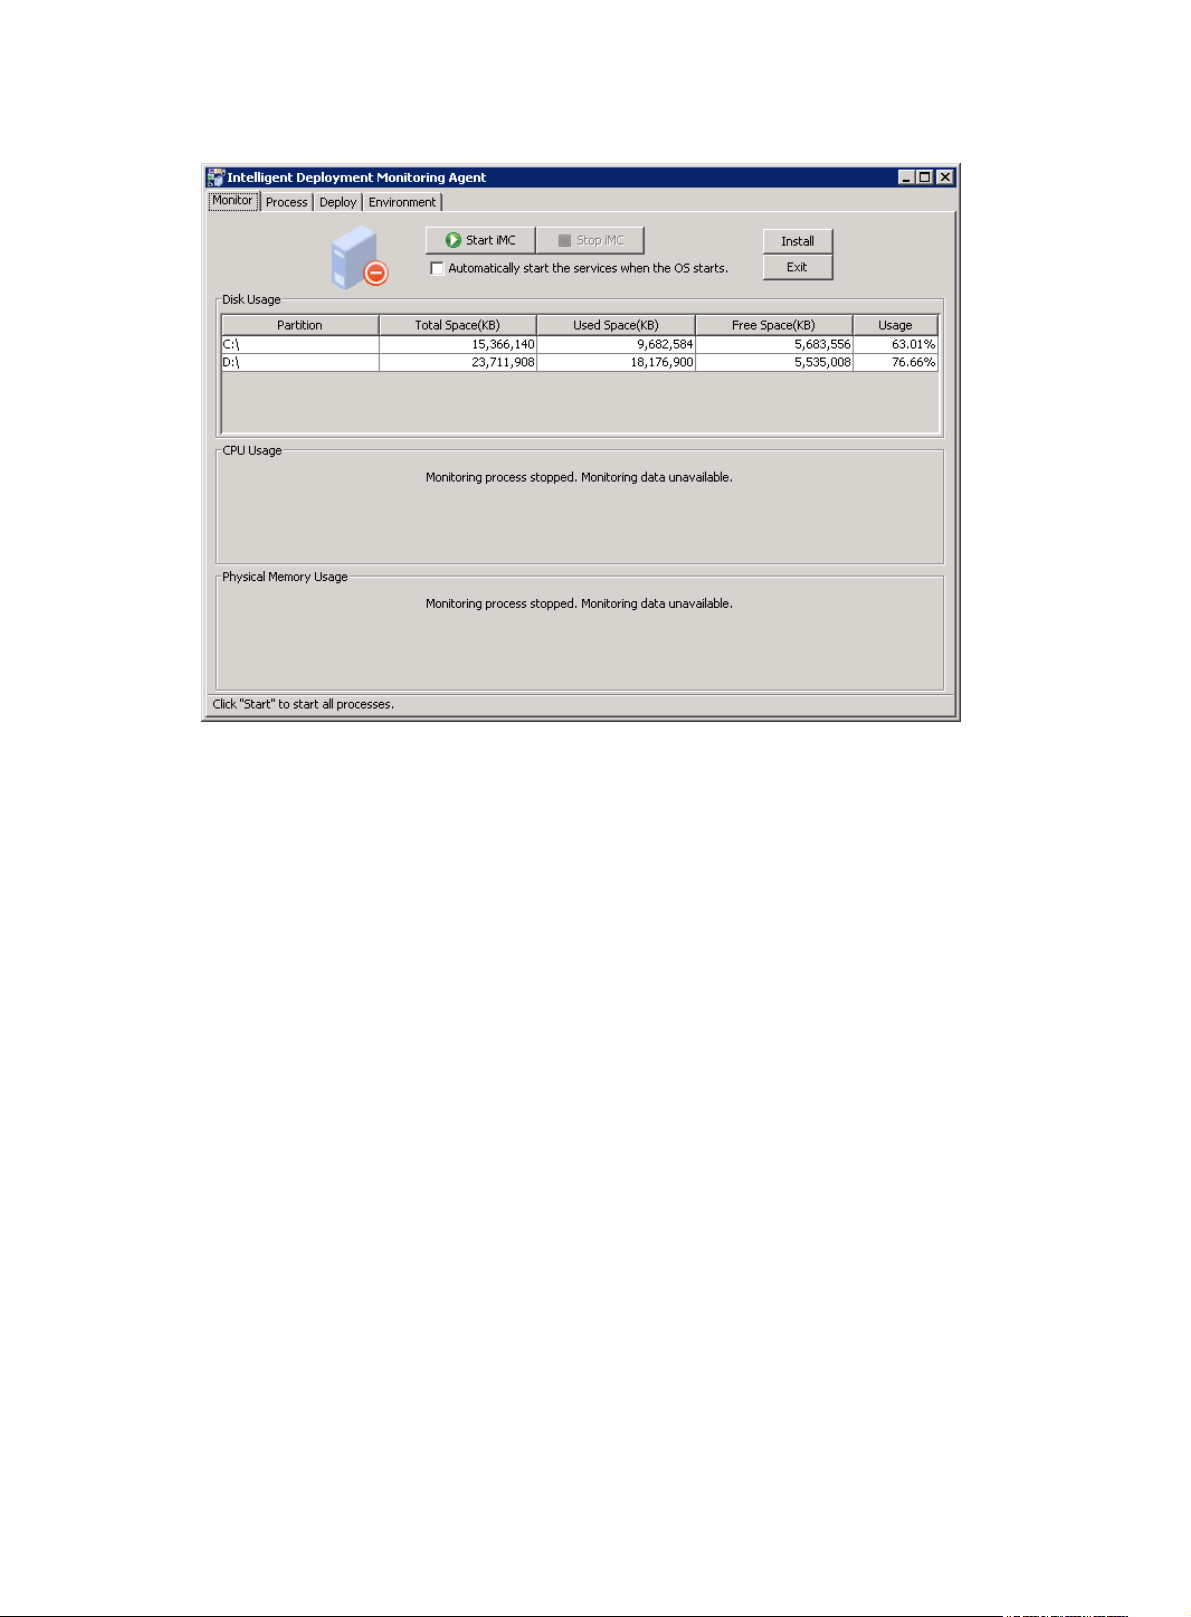
Figure 8 Install a new component
3. Click Browse, locate the components directory in the SCMTOOL installation path, and click OK.
The SCMTOOL installation starts.
4. After SCMTOOL is installed, select the Deploy tab, right-click SecCenter Management, and select
Deploy the Component from the shortcut menu.
5. Set SecCenter parameters. Be sure to type the actual IP address or full name of the server in Server
Address, and never use 127.0.0.1.
8
Page 17
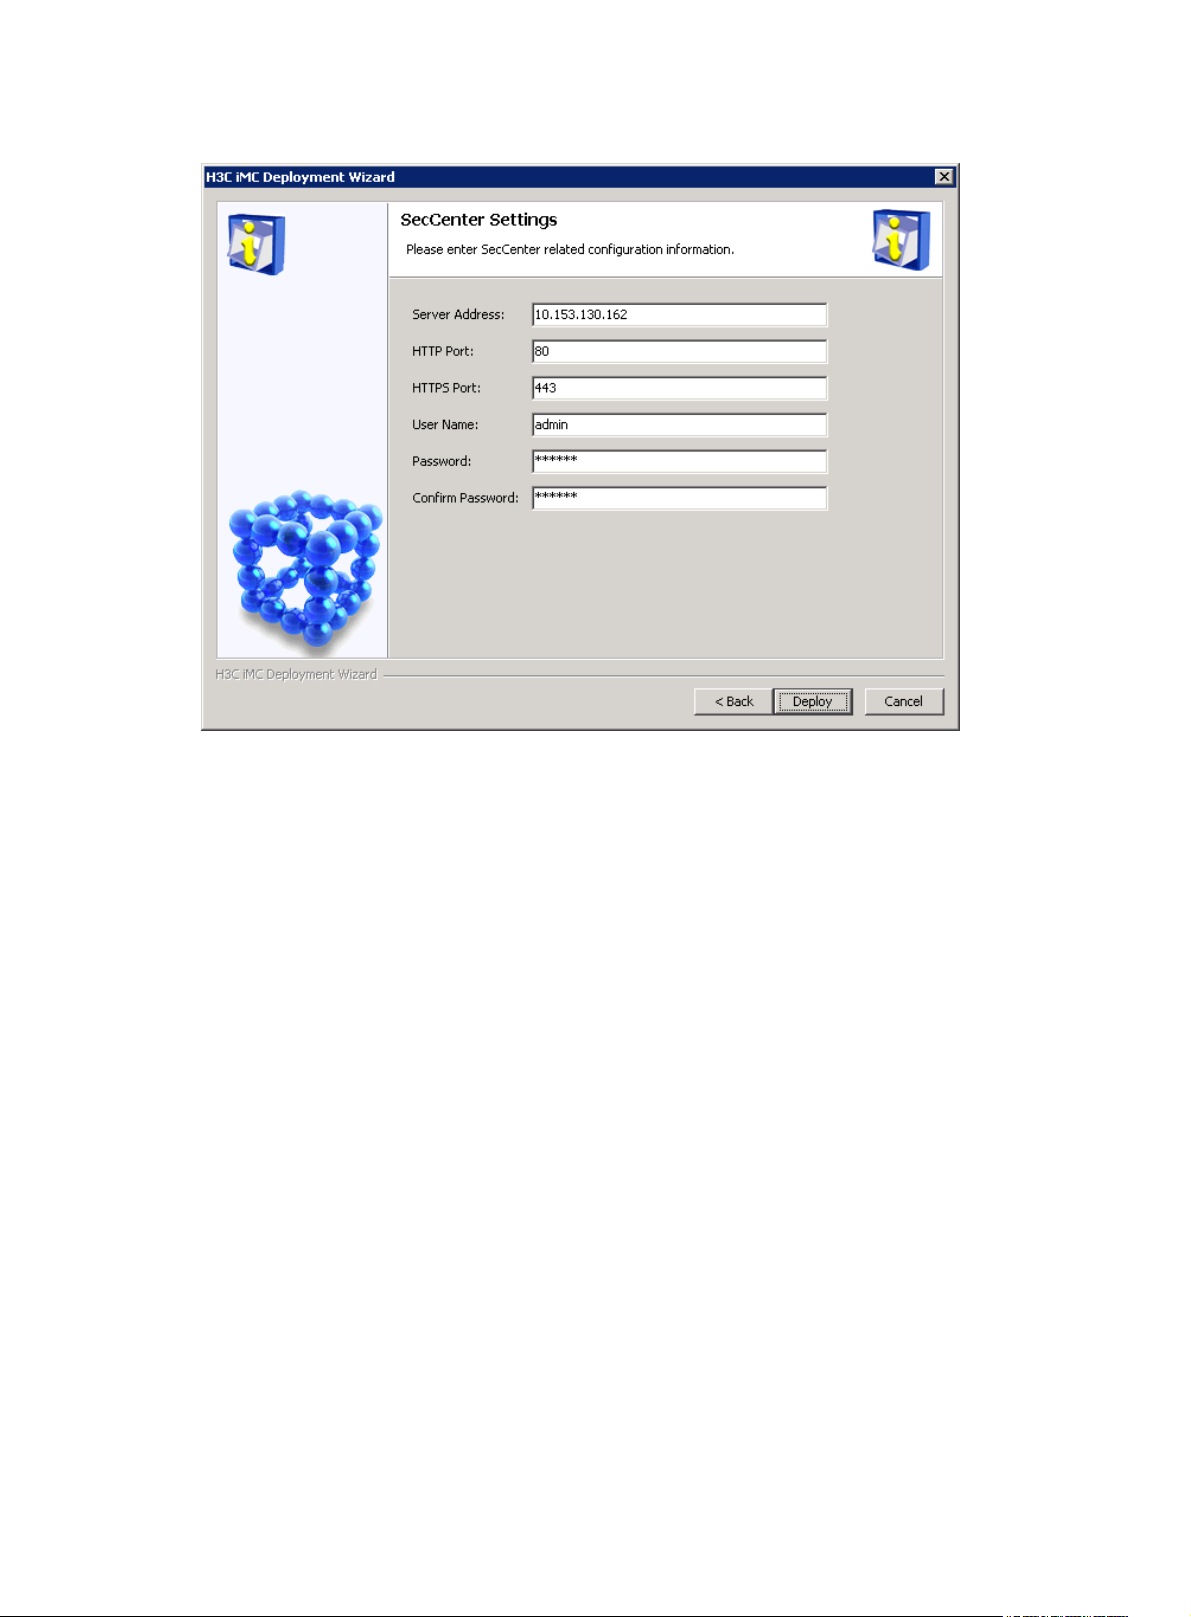
Figure 9 Set SecCenter parameters
6. After the deployment completes, select the Monitor tab and click Start iMC. All iMC processes start.
Note that SCMTOOL can be deployed on primary servers only.
Removing SCMTOOL
Launch the Intelligent Deployment Monitoring Agent and remove SCMTOOL on the Deploy tab.
9
Page 18

System management
The system management component of the UTM Manager comprises four modules: “Device
management”, “
management is covered in “
modules.
The device management module allows you to add devices to be managed, assign devices to device
groups, configure the IP addresses, SNMP parameters, and other necessary management information,
and manage devices based on device groups. It also enables you to track and monitor the operation of
managed devices. To manage a device through SecCenter, you must add the device to SecCenter first.
The operator management module allows you to add operators, specify passwords, assign different
rights to different operators, authorize different operators to manage different devices, monitor operators’
operations by viewing operation logs.
The system configuration module allows you to configure SecCenter management parameters, such as
the ports for receiving various logs from managed devices, centralized policy deployment, signature
synchronization configuration, and alarm configuration.
Operator management”, “System configuration”, and license management. License
Registering the UTM Manager.” This chapter discusses the other three
Device management
The device management module allows you to perform the following tasks:
Managing device groups
•
Managing device access templates
•
Managing devices
•
Managing device software
•
Managing the device configuration
•
Managing the device software database
•
Managing deployment tasks
•
Managing events
•
Configuring device interface alarming
•
Managing device groups
A device group represents a group of devices. You can group devices into device groups to manage
devices easily. For example, you can configure device groups based on the architecture of your
organization and name them Headquarters, Branch 1, Branch 2, and so on. Later, when adding an
operator, you can specify the device groups that the operator can manage and the operations the
operator can perform, so as to allow different operators to manage different devices and perform
different operations.
The device group management function allows you to add, modify, and delete device groups. When you
add devices later, you can assign devices to device groups so that you can manage and collect statistics
on users, devices, and IP addresses by device group.
10
Page 19
Configuration guide
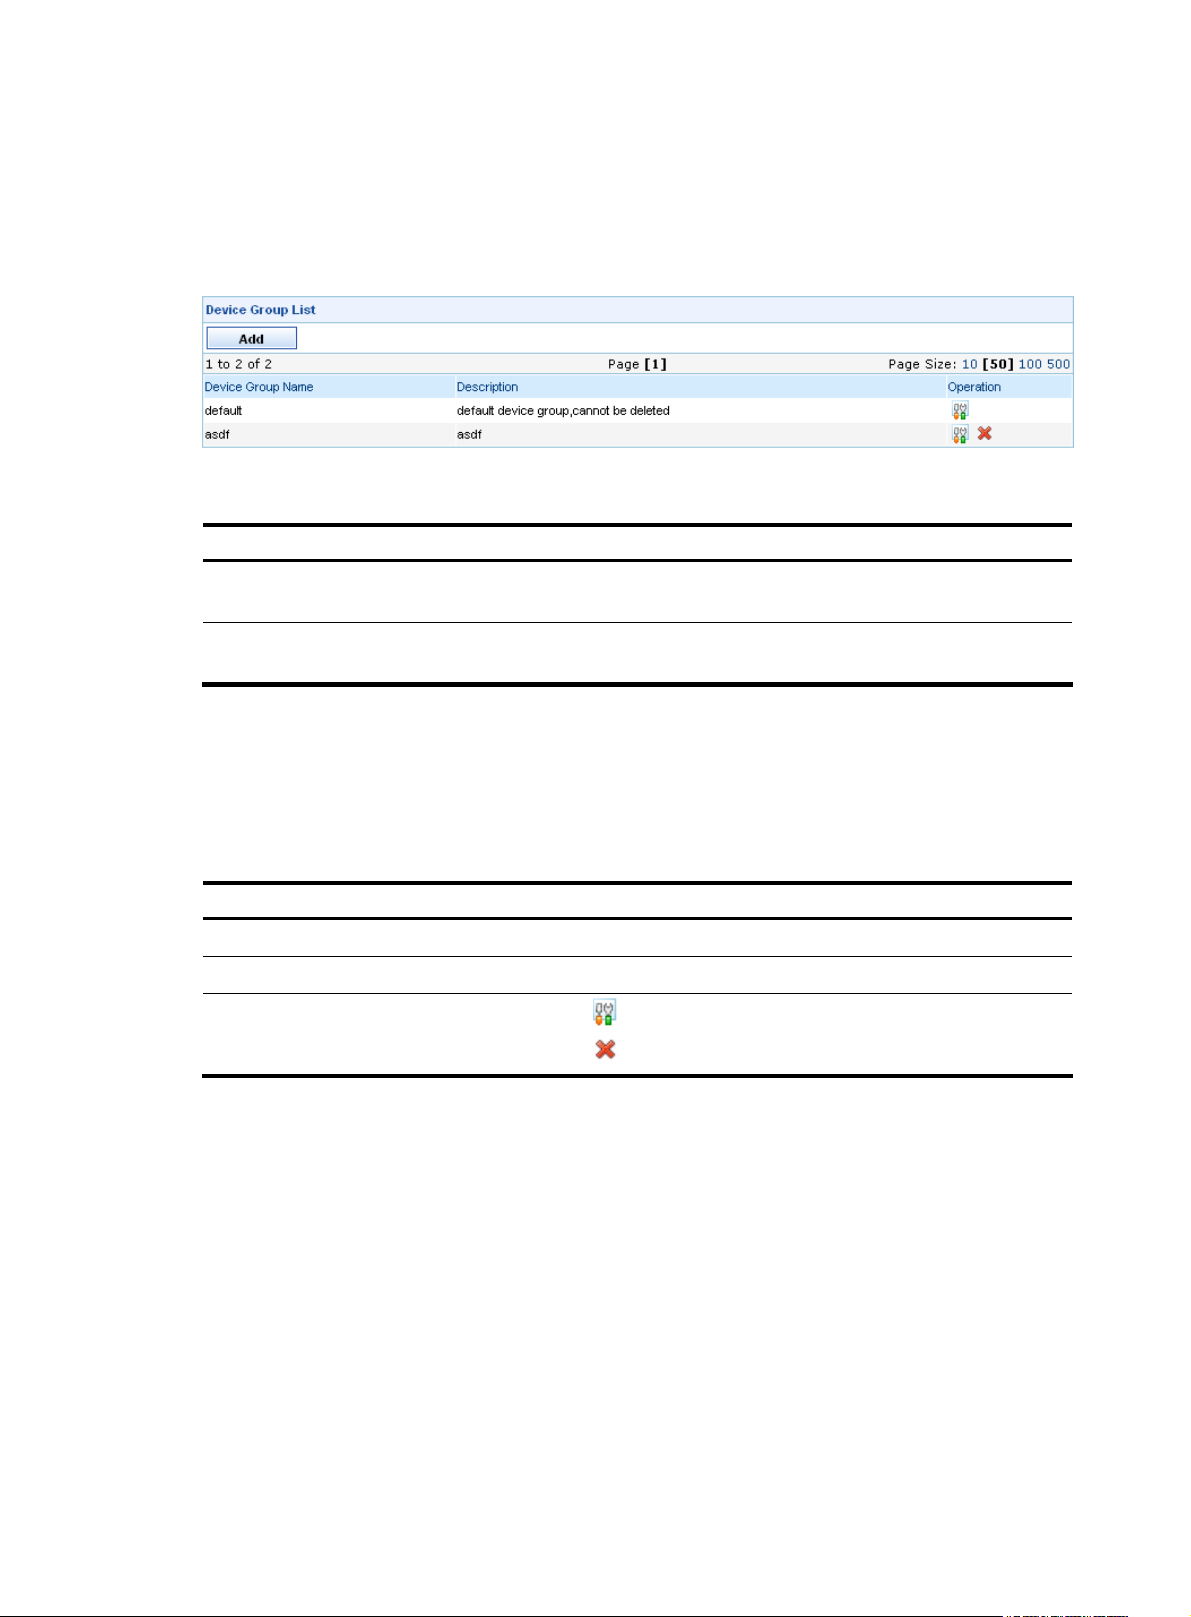
From the navigation tree of the system management component, select Device Group List under Device
Management. The device group management page appears, as shown in
the device group management functions.
Figure 10 Device group management page
Table 1 Device Group management functions
Function Description
Figure 10. Table 1 describes
Device group list
Adding a device group
Device group list
From the navigation tree of the system management component, select Device Group List under Device
Management. The device group management page appears, as shown in
groups are displayed on the page.
Table 2 Fields of the Device Group List
Field Description
Device Group Name
Description
Operation
Return to Device Group management functions.
Adding a device group
Allows you to view details about device groups and modify and delete device
groups.
Allows you to add a device group and configure the device group name and
description.
Figure 10. Details of all device
Table 2 describes the fields of the device group list.
Name for the device group
Description of the device group
• Click the icon of a device group to modify the device group.
• Click the icon of a device group to delete the device group.
Follow these steps:
1. From the navigation tree of the system management component, select Device Group List under
Device Management.
2. Click Add to enter the device group configuration page.
3. Configure the device group, as shown in Figure 11. Table 3 describes the device group
configuration items.
4. Click Apply.
11
Page 20
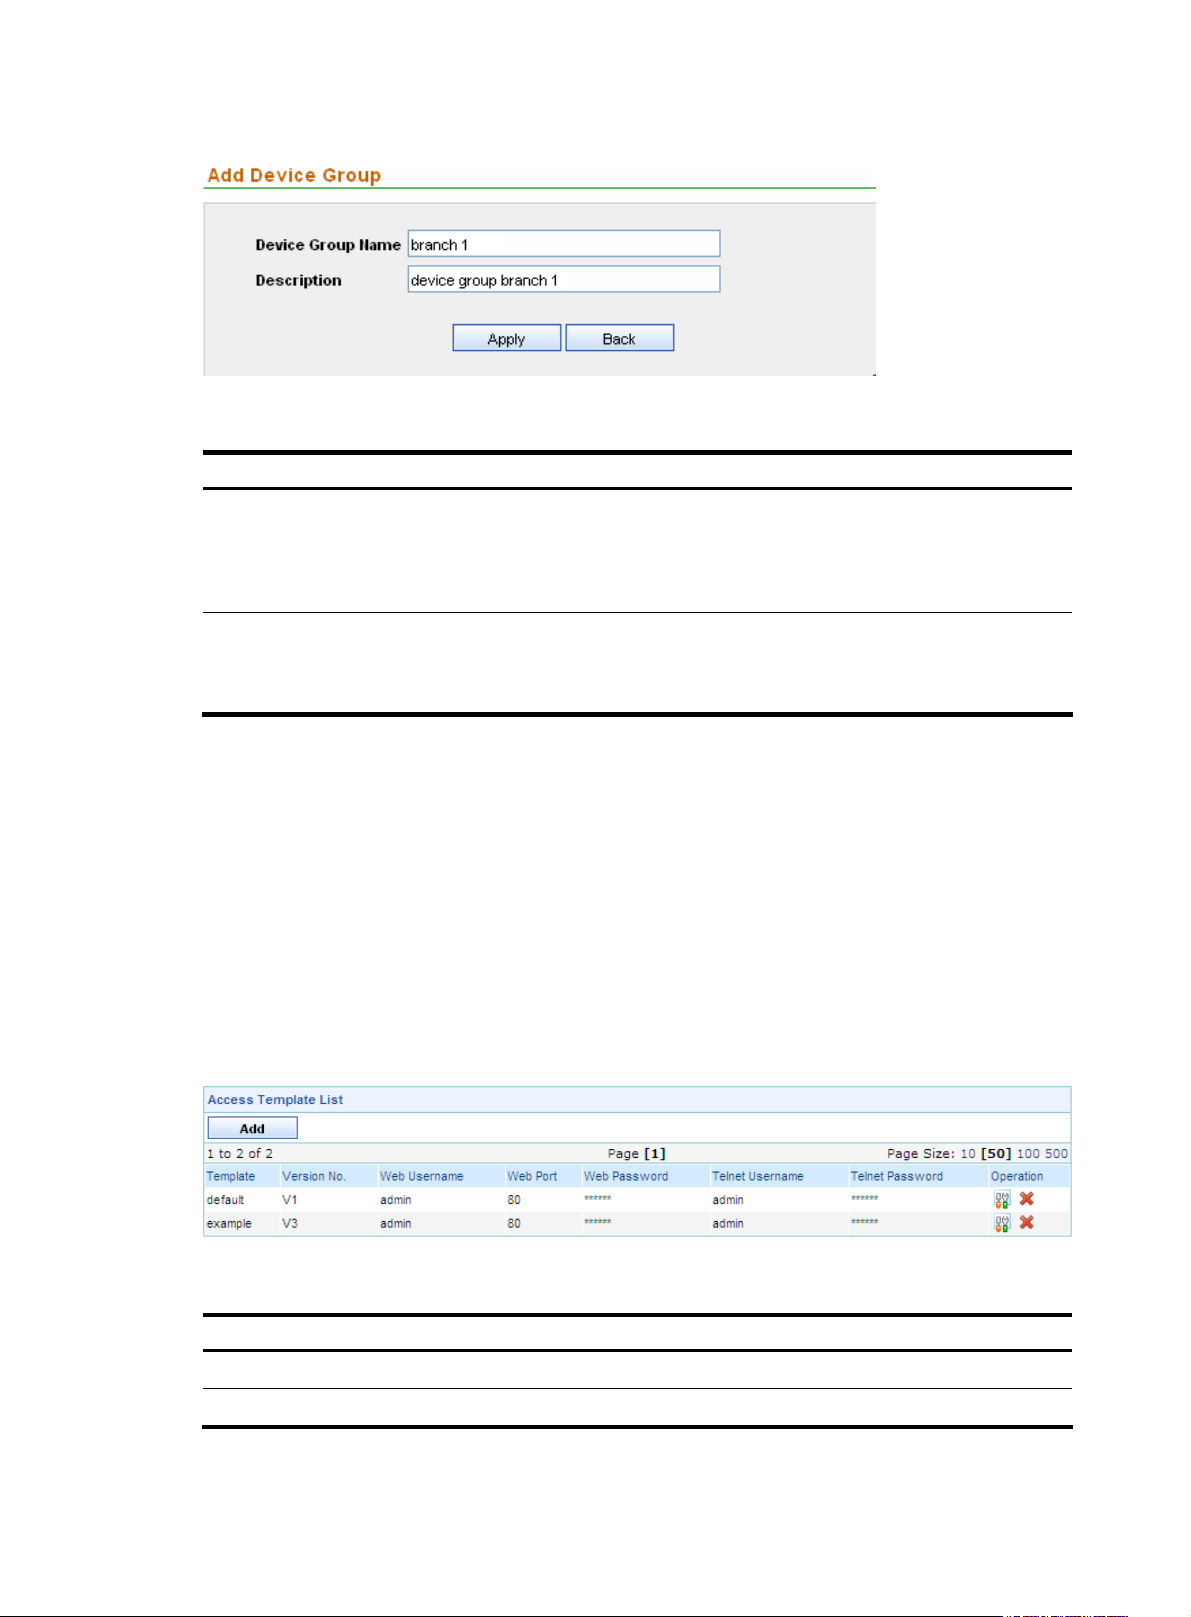
Figure 11 Add a device group
Table 3 Device group configuration items
Item Description
Required
Device Group Name
Description
Type the name for the device group.
The device group name can comprise up to 100 characters and must not
contain these characters: ” < > ’ & % : ; /
Optional
Type a description for the device group.
The description can comprise up to 100 characters.
Return to Device Group management functions.
Managing device access templates
The device access template management function allows you to configure information needed for
logging in to the device, such as the login password.
Configuration guide
From the navigation tree of the system management component, select Access Template List under Device
Management. The access template management page appears, as shown in
describes the template management functions.
Figure 12 Access template management page
Table 4 Template management functions
Figure 12. Table 4
Function Description
Template list Allows you to view details about access templates and modify and delete templates.
Adding a template Allows you to add templates.
12
Page 21

Template list
From the navigation tree of the system management component, select Access Template List under Device
Management. The access template management page appears, as shown in
access templates are displayed on the page.
Table 5 Fields of the template list
Field Description
Figure 12. Details of all
Table 5 describes the fields of the template list.
Template
Version No. SNMP version of the template
Web Username
Web Port
Web Password
Telnet Username
Telnet Password
Operation
Return to Template management functions.
Adding a template
Follow these steps:
1. From the navigation tree of the system management component, select Access Template List under
Device Management.
2. Click Add to enter the template configuration page.
Name of the template
Username for managing the device through web
Port of the device providing web access service
Password for managing the device through web, displayed as a string of
asterisks (*)
Username for telnetting to the device
Password for telnetting to the device, displayed as a string of asterisks (*)
• Click the icon of a template to modify the template.
• Click the icon of a template to delete the template.
3. Configure the template, as shown in Figure 13. Table 6 describes the template configuration
items.
4. Click Apply.
13
Page 22
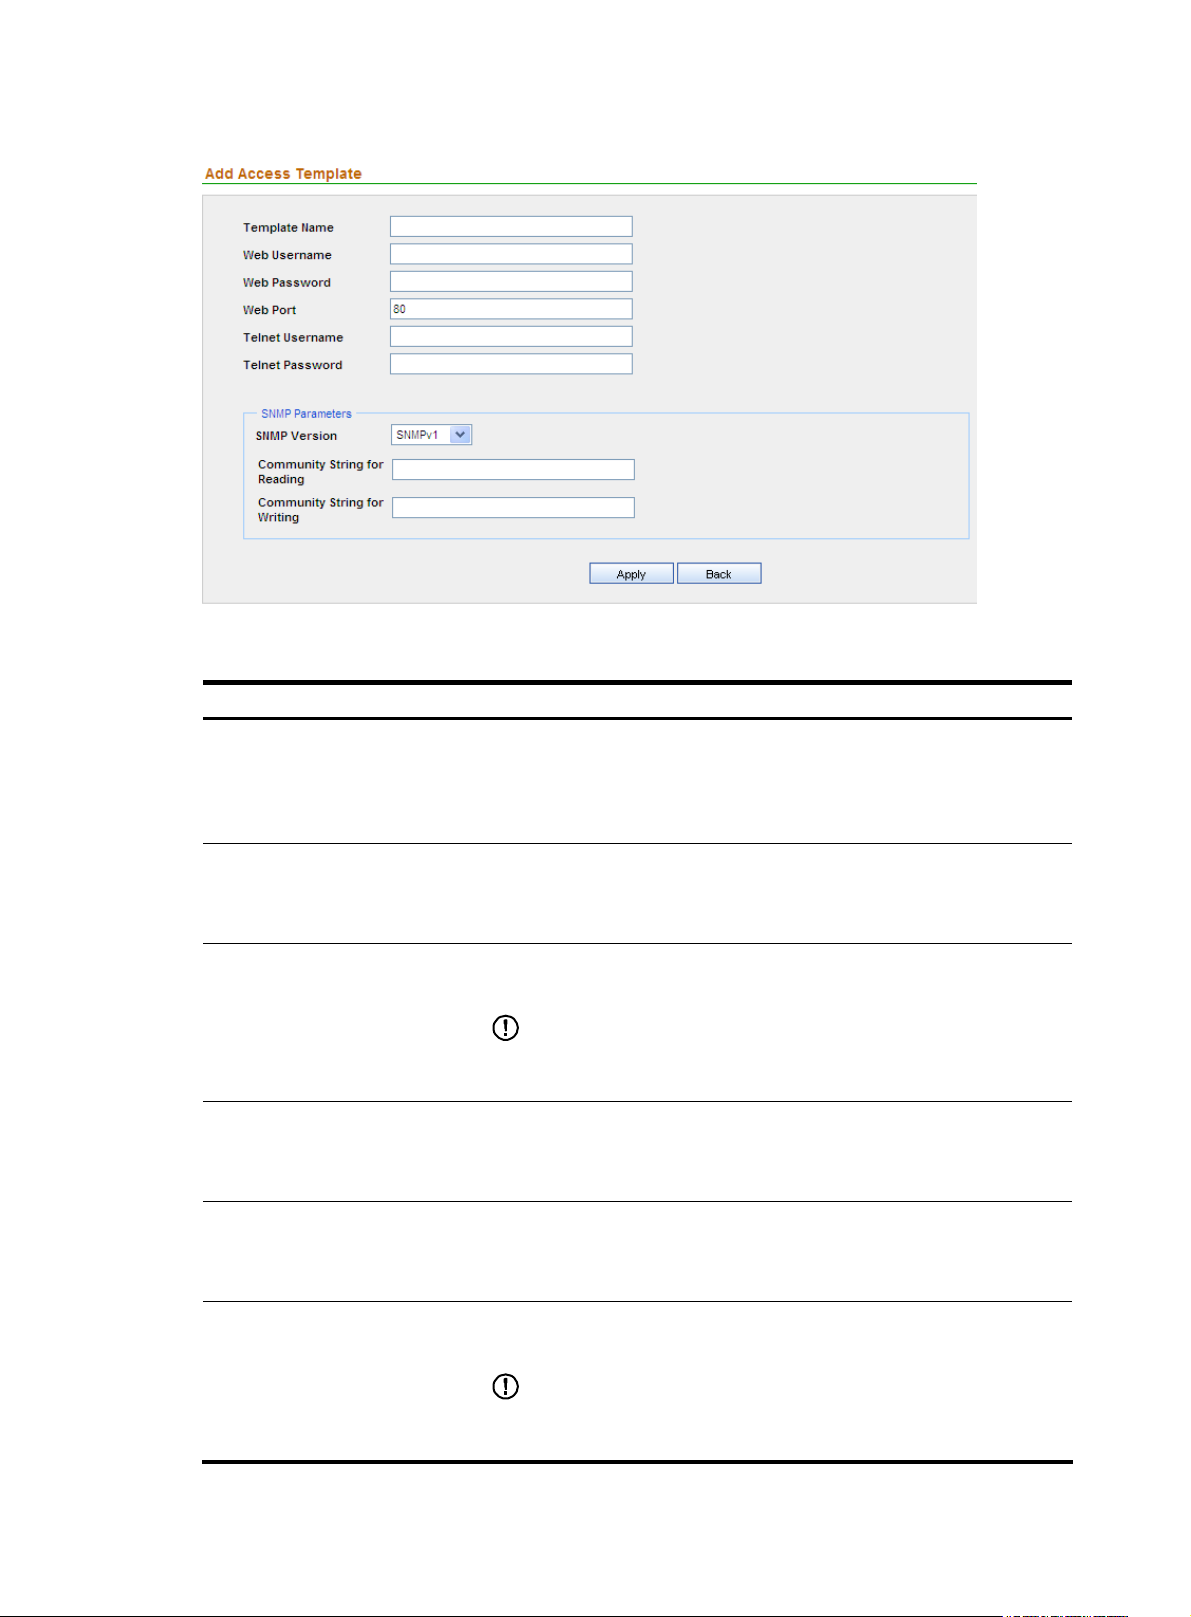
Figure 13 Add a template
Table 6 Template configuration items
Item Description
Required
Template Name
Web Username
Web Password
Web Port
Telnet Username
Type a name for the template.
The template name can comprise up to 20 characters and must not contain
these characters: ” < > % & : ; /
Required
Specify the username for managing the device through web.
The username can comprise up to 20 characters.
Required
Specify the password for managing the device through web.
IMPORTANT:
The strength of the password must meet the password strength requirements
of the device.
Required
Specify the port of the device providing web access service.
The default is 80.
Optional
Specify the username for telnetting to the device.
The username can comprise up to 20 characters.
Telnet Password
Optional
Specify the password for telnetting to the device.
IMPORTANT:
The strength of the password must meet the password strength requirements
of the device.
14
Page 23
Item Description
Required
SNMP Version
Community String for Reading
Community String for Writing
Select an SNMP version from the dropdown list. The options include
SNMPv1, SNMPv2C, and SNMPv3.
Required
Specify the SNMP read community string to be used for communication
with the device.
The string can comprise up to 20 characters.
Required
Specify the SNMP write community string to be used for communication
with the device.
The string can comprise up to 20 characters.
Authentication Username
Authentication Protocol
Return to Template management functions.
Managing devices
After completing device group and template configuration, you can add devices to be managed. Only
after you add devices to the system component successfully, can you add the devices to components such
as the firewall component and IPS component to collect statistics on and analyze attack and virus
information. The device management page allows you to add and delete devices. The device list shows
the details of all managed devices, and provides the links for you to export configurations and connect
to the devices through web or Telnet.
Configuration guide
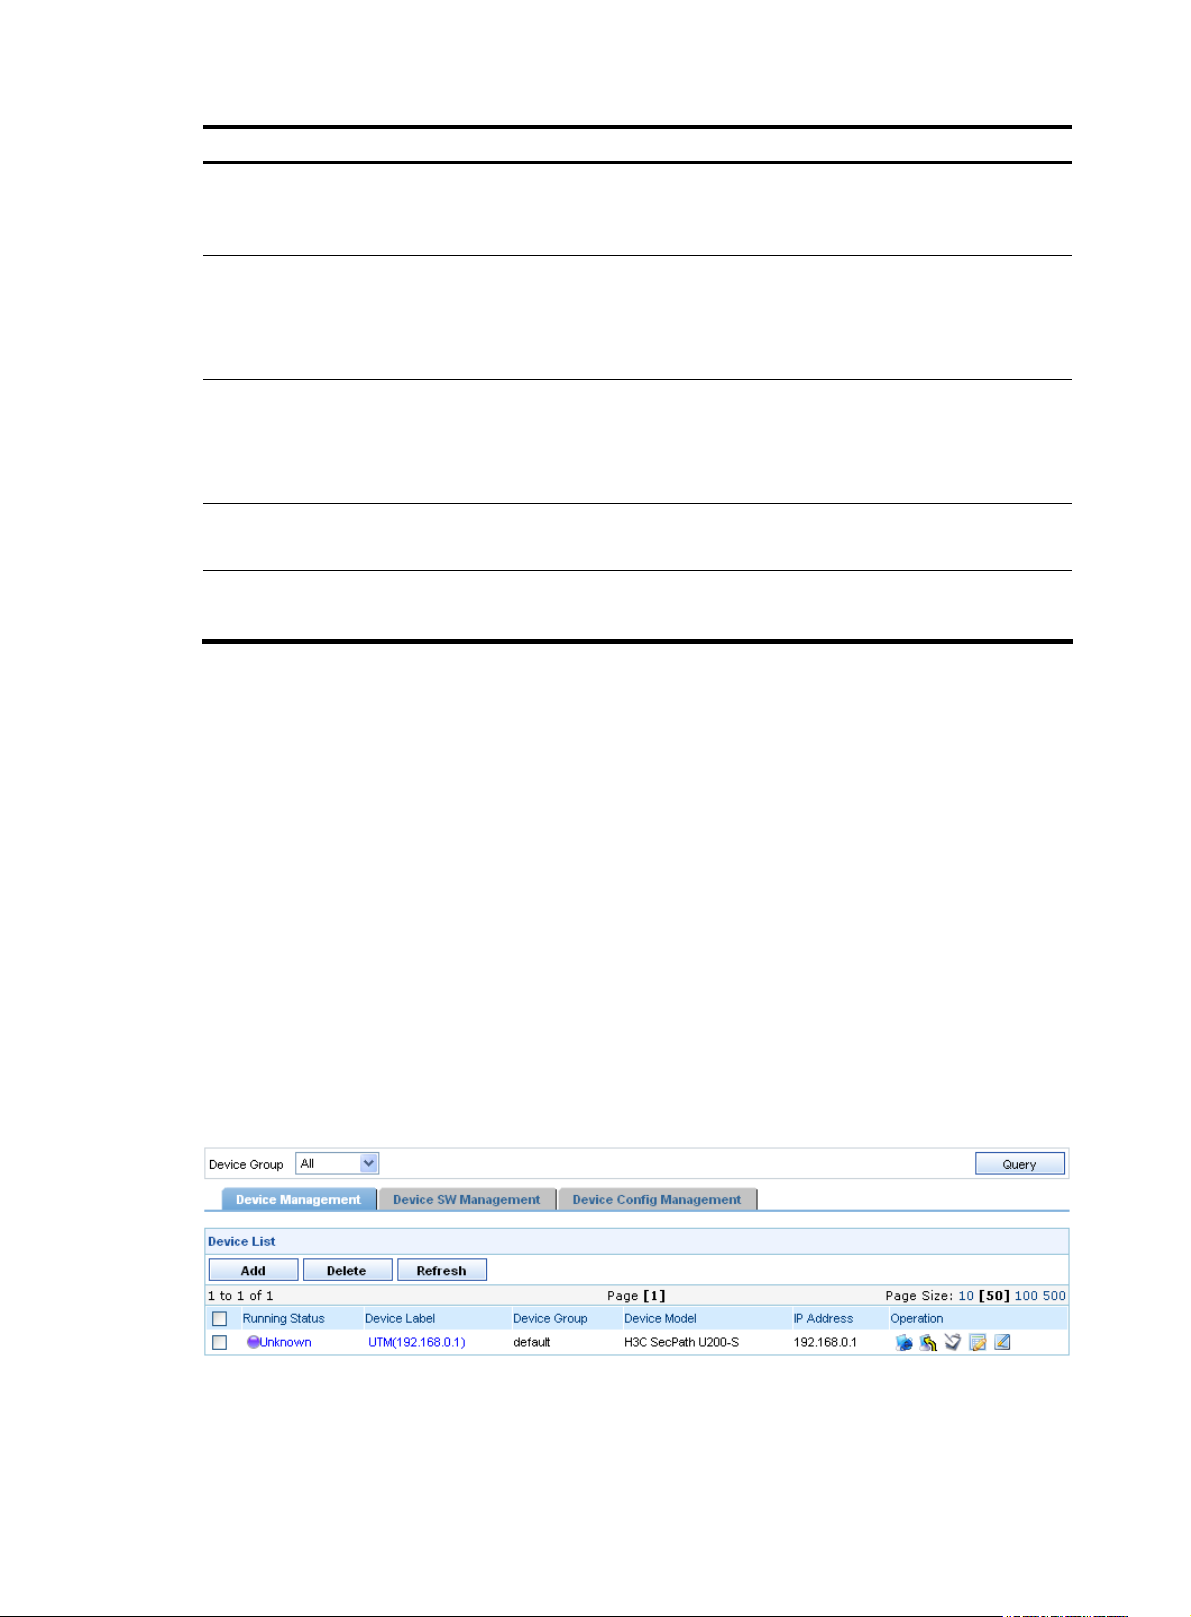
From the navigation tree of the system management component, select Device List under Device
Management. The device management page appears, showing the basic information of all managed
devices, as shown in
device management page.
Figure 14. Table 7 describes the device management functions provided on the
Required when SNMP version is SNMPv3.
Type the username for authentication.
Required when SNMP version is SNMPv3.
Select a protocol for authentication.
Figure 14 Device management page
15
Page 24

Table 7 Device management functions
Function Description
Device list
Device list
Adding a device Allows you to add devices to be managed.
Deleting devices
Refreshing device information Allows you to obtain the up-to-date device information.
Allows you to view details about devices, import service definitions, and
connect to the devices through web or Telnet.
Allows you to delete devices from the list of managed devices.
Follow these steps:
1. Select the check boxes before the devices to be deleted.
2. Click Delete.
From the navigation tree of the system management component, select Device List under Device
Management. The device management page appears, as shown in
device query option in the query section and
Table 9 describes the fields of the device list.
Figure 14. Table 8 describes the
Table 8 Device query option
Option Description
Device Group
Select a device group to list all devices in the device group.
Table 9 Fields of the device list
Field Description
Running Status
Device Label
Device Group
Device Model
IP Address
Status of the device. You can click the link to view the event list of the
device. For more information, see “
Name and IP address of the device. You can click the link to view the
details of the device and modify the relevant information. For more
information, see “
Device group to which the device belongs
Model of the device
IP address of the device
Managing events.”
Device information.”
16
Page 25

Field Description
• Click the icon of a device to open the web console of the device.
• Click the icon of a device to telnet to the device.
• Click the icon of a device to import the bandwidth management
service definitions for the device, so that the service definitions of the
SecCenter are the same as those of the UTM device. Generally, this
operation is required whenever the service definitions are upgraded
on the UTM device.
Operation
Return to Device management functions.
Adding a device
Follow these steps:
1. From the navigation tree of the system management component, select Device List under Device
Management. The device management page appears, as shown in
2. Click Add to enter the device configuration page.
3. Configure the device, as shown in Figure 15. Table 10 describes the device configuration items.
4. Click Add.
• Click the icon of a device to import the IPS attack signatures for
the device, so that the IPS attack signatures of the device in the
SecCenter are the same as those of the UTM device. Generally, this
operation is required whenever an IPS attack signature upgrade is
performed on the UTM device.
• Click the icon of a device to import the IPS virus signatures for the
device, so that the IPS virus signatures of the device in the SecCenter
are the same as those of the UTM device. Generally, this operation is
required whenever an IPS virus signature upgrade is performed on the
UTM device.
Figure 14.
17
Page 26
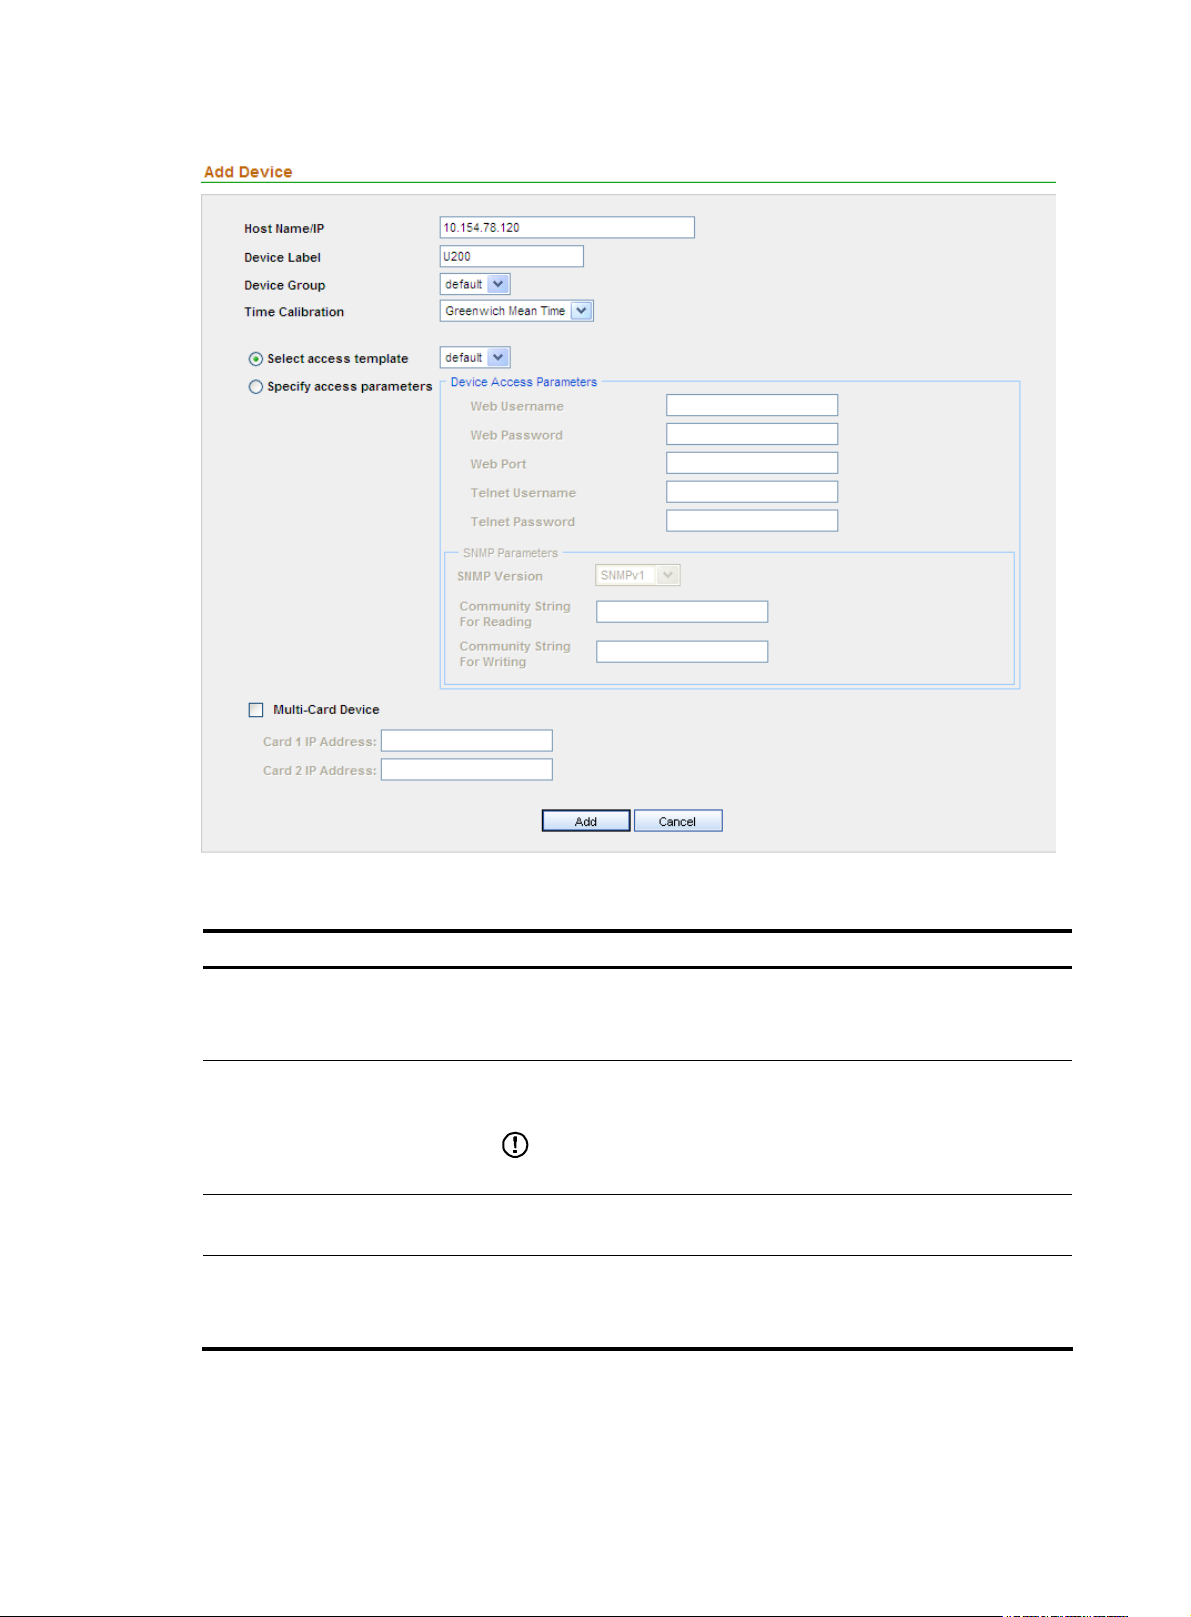
Figure 15 Add a device
Table 10 Device configuration items
Item Description
Required
Host Name/IP
Device Label
Device Group
Time Calibration
Type the name or IP address of the device to uniquely identify the device
in the SecCenter system.
Required
Type a label for the device, which can be used as an alias of the device.
IMPORTANT:
The device label can comprise up to 20 characters.
Select a device group for the device. By default, the device group named
default is selected.
Required
Configure the system to process and display traffic information based on
the GWT or local time zone.
18
Page 27

Item Description
Required. Select either of them.
Select access template
Specify access parameters
Web Username
Web Password
Web Port
• If you select Select access template, select a template from the
dropdown list. By default, the template named default is selected.
• If you select Specify access parameters, specify the access
parameters.
Required
Specify the username for managing the device through web.
The username can comprise up to 20 characters.
Required
Specify the password for managing the device through web.
IMPORTANT:
The strength of the password must meet the password strength
requirements of the device.
Optional
Specify the port of the device providing web access service.
The port number must be an integer in the range from 0 to 65534.
Telnet Username
Telnet Password
SNMP Version
Community String For Reading
Community String For Writing
Authentication Username
Authentication Protocol
Optional
Specify the username for telnetting to the device.
The username can comprise up to 20 characters.
Optional
Specify the password for telnetting to the device.
IMPORTANT:
The strength of the password must meet the password strength
requirements of the device.
Required
Select a version, which can be SNMPv1, SNMPv2C, or SNMPv3.
Required when the SNMP version is SNMPv1 or SNMPv2C.
Specify the SNMP read community string to be used for communication
with the device.
The string can comprise up to 20 characters.
Required when the SNMP version is SNMPv1 or SNMPv2C.
Specify the SNMP write community string to be used for communication
with the device.
The string can comprise up to 20 characters.
Required when SNMP version is SNMPv3.
Type the username for authentication.
Required when SNMP version is SNMPv3.
Select a protocol for authentication.
Multi-Card Device
Optional
Type the IP addresses of interface cards that are on the device. The IP
address must be in dotted decimal notation.
19
Page 28
Return to Device management functions.
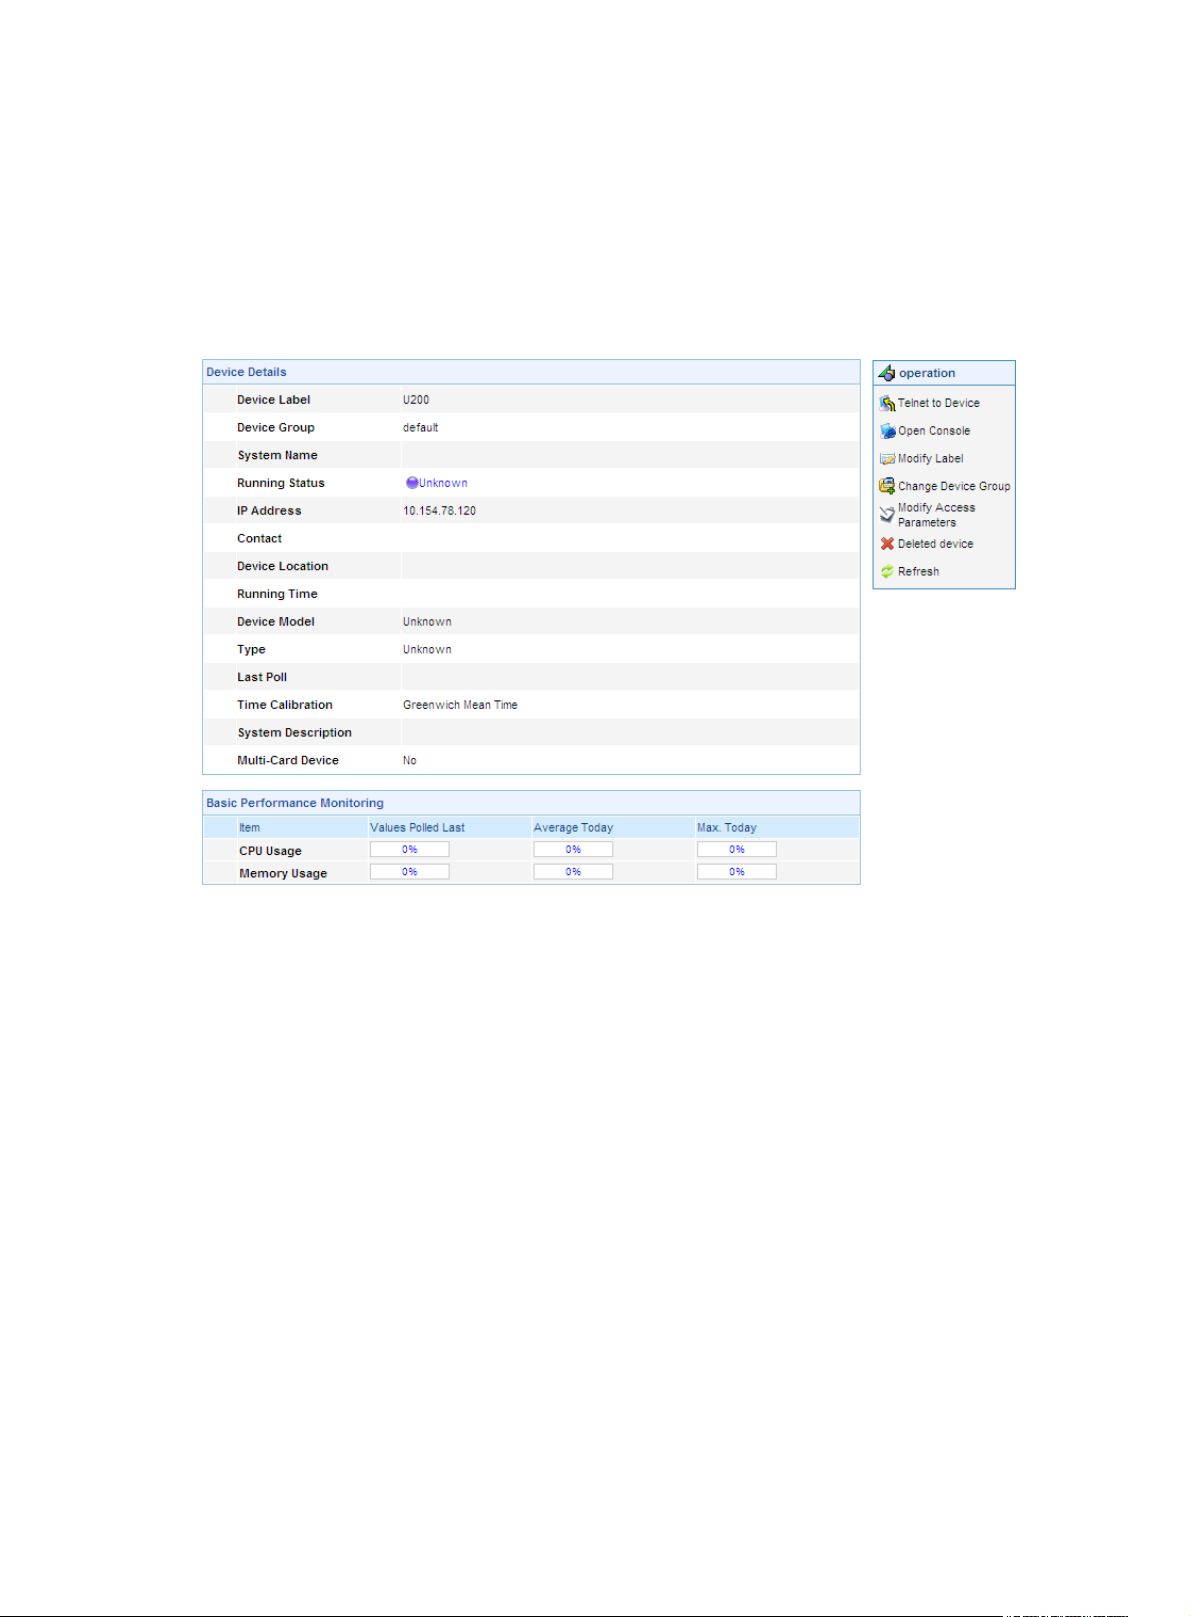
Device information
From the navigation tree of the system management component, select Device List under Device
Management. The device management page appears, as shown in
device label link of a device to display the details of the device and modify the information of the device,
as shown in
Figure 16 Device information
Figure 14. Then, you can click the
Figure 16.
Managing device software
Device software refers to the software that a UTM device runs to provide services. It can be regarded as
the operating system of the device.
The device software management function provides you with the software information of the UTM devices
and allows you to perform a series of operations to the software of UTM devices, including deploying
software to devices and backing up the software of devices. The device software list also displays the
device type, the current software version, and the latest available new software version.
Configuration Guide
From the navigation tree of the system management component, select Device List under Device
Management. The device management page appears, as shown in
SW Management tab to bring up the device software management page, as shown in
11 describes the device software management functions and
software list.
Figure 14. Then, select the Device
Figure 17. Table
Table 12 describes the fields of the device
20
Page 29
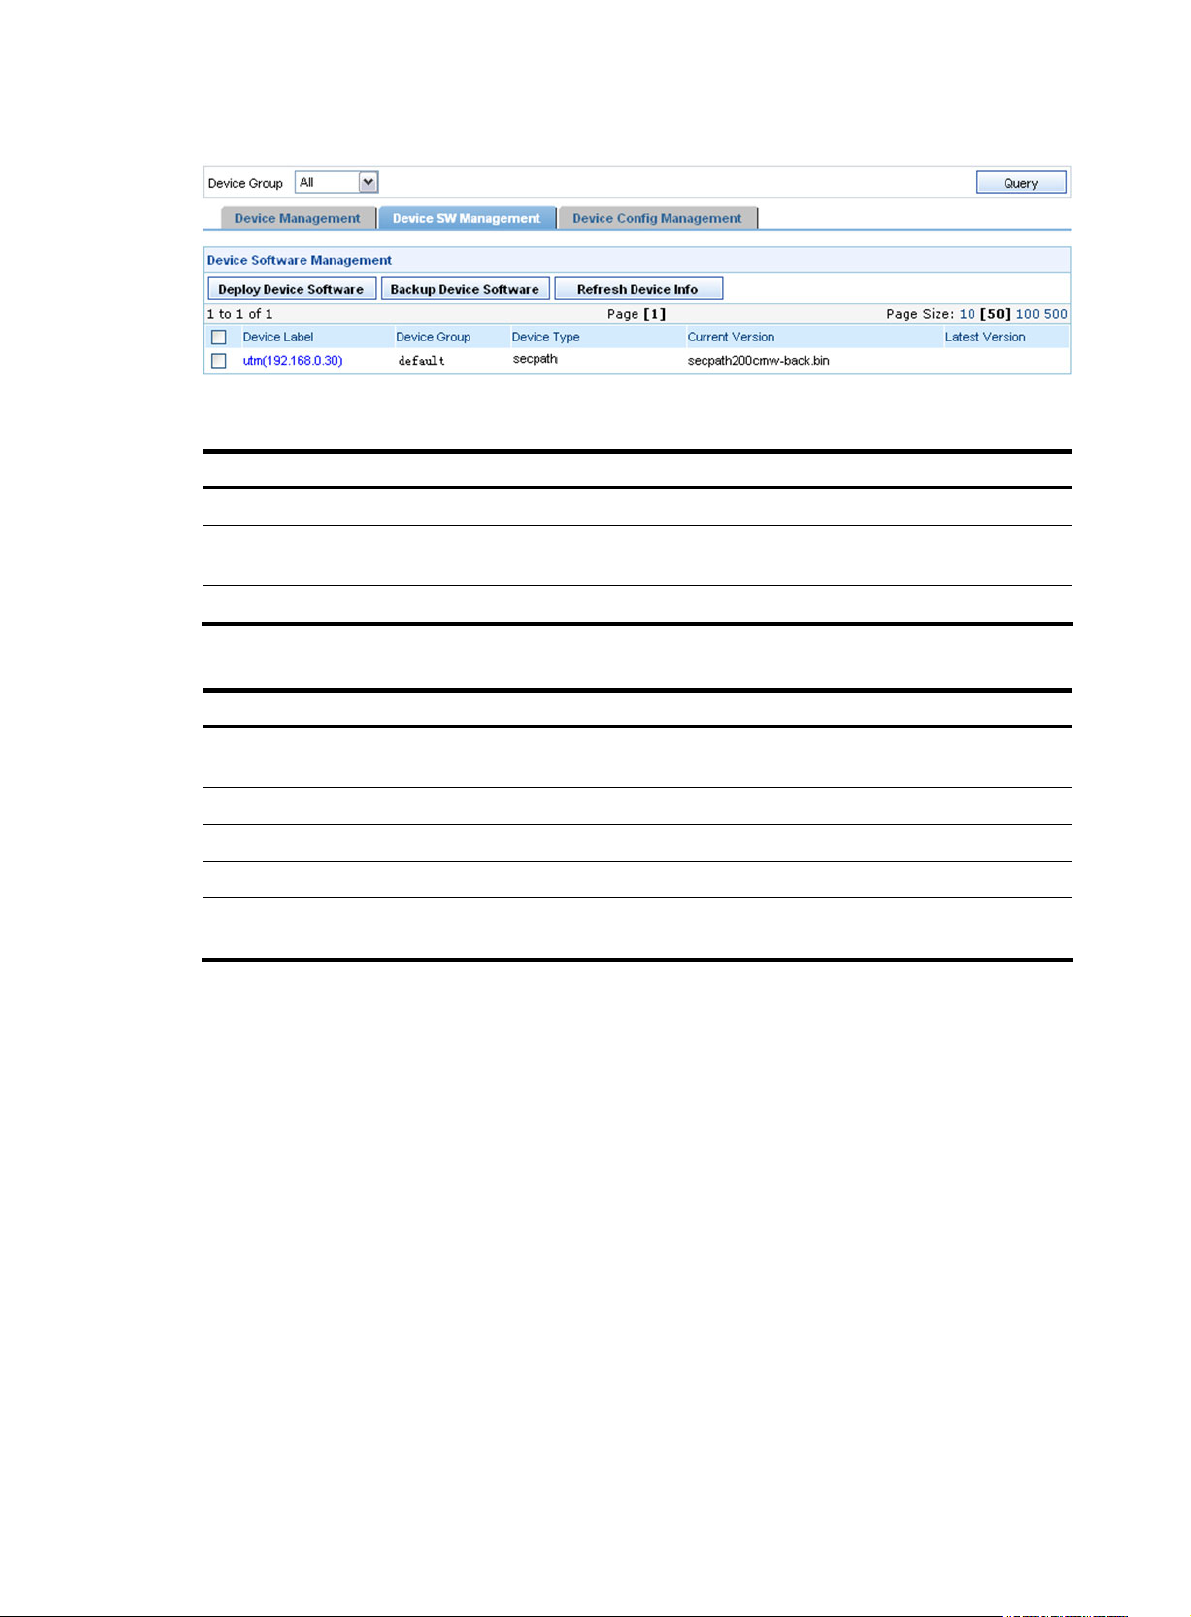
Figure 17 Device software management page
Table 11 Device software management functions
Function Description
Deploying software to devices Allows you to deploy software to devices as required.
Backing up the software of devices
Refreshing device information Allows you to obtain the up-to-date device information.
Table 12 Fields of the device software list
Field Description
Device Label
Device Group
Device Type
Current Version
Latest Version
Deploying software to devices
This software deployment function allows you to deploy main boot file to devices. On t he d evice soft ware
management page, click Deploy Device Software to enter the software deployment page, as shown in
Figure 18. Table 13 describes the software deployment configuration items. You can deploy software to
multiple devices at a time. You can specify deployment parameters, such as the deployment sequence,
policy, time, and error handling mode. A successfully created software deployment task is listed in the
deployment task management module.
Allows you to backup the software of selected devices to the device
software database.
Device name and IP address. You can click the link to view details about
the device and modify the configuration.
Device group to which the device belongs
Model of the device
Current software version of the device
Latest software version available for the device. This version information
comes from the software database.
How many boot files can be stored on a device depends on the device's disk space. Generally, two files,
one main boot file and one backup boot file, are stored on the device.
21
Page 30
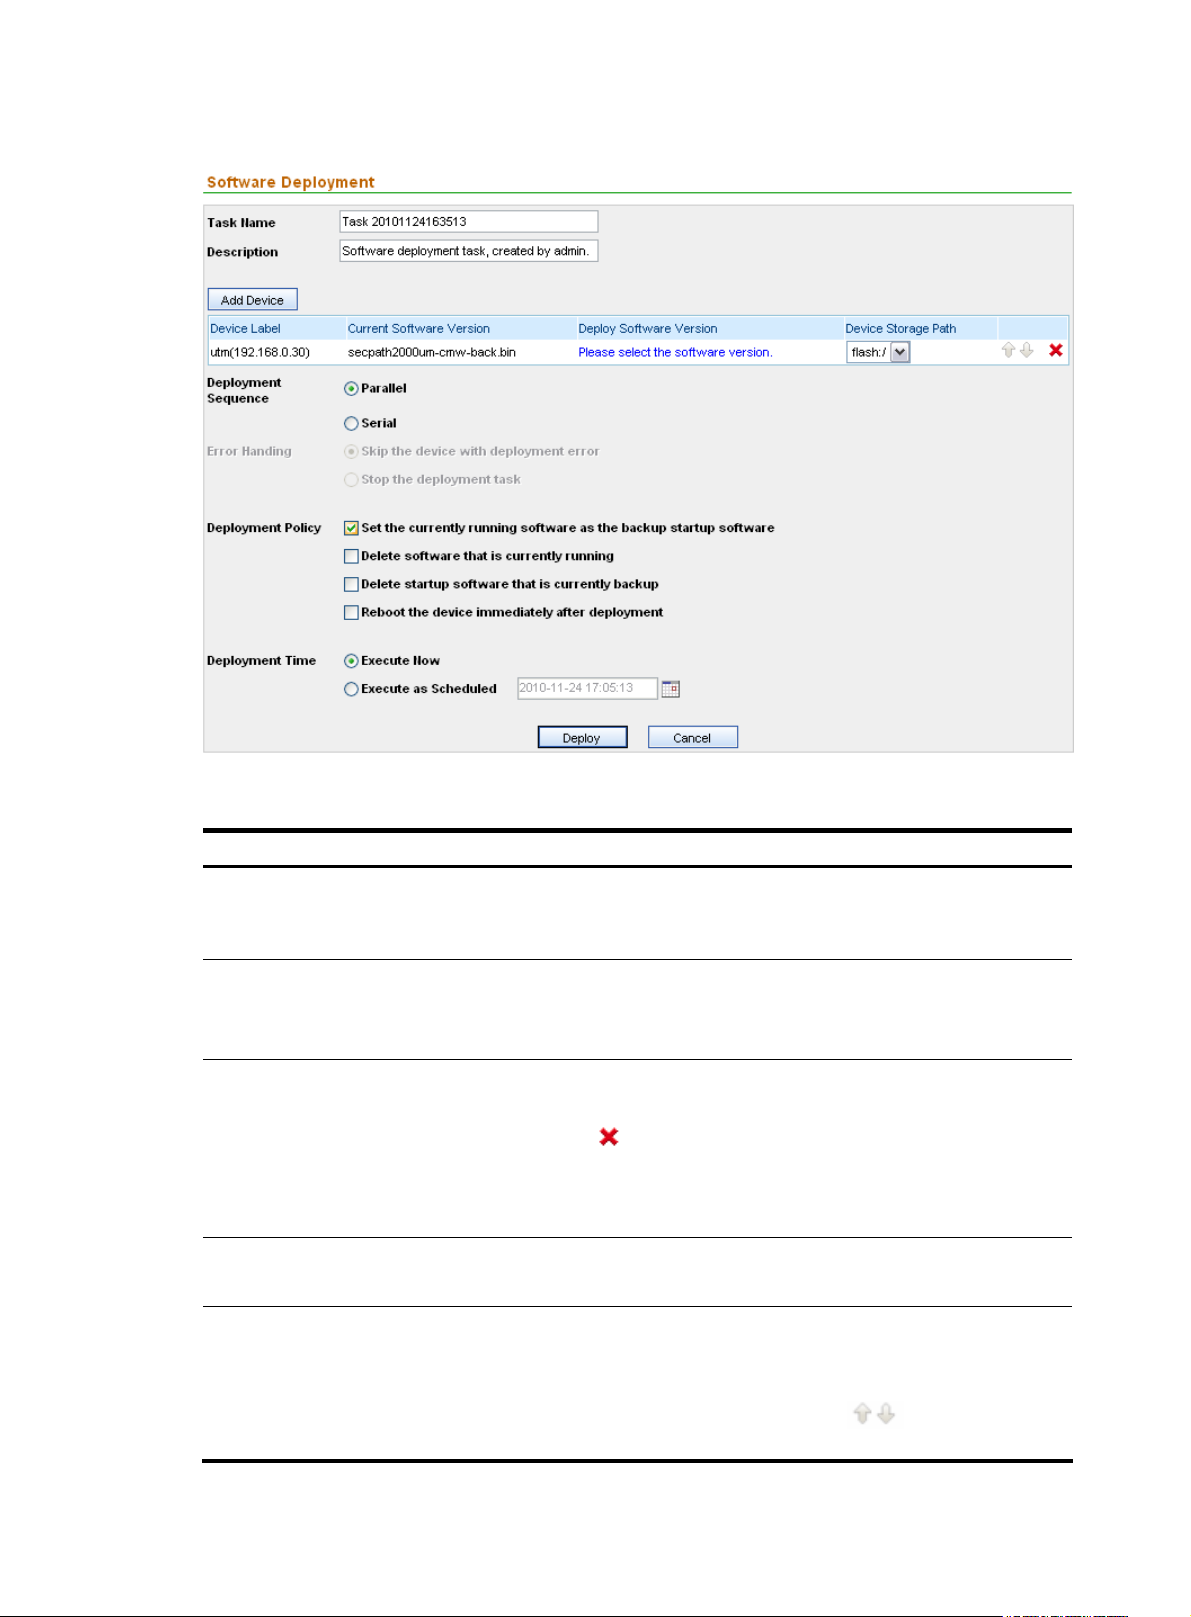
Figure 18 Deploy software to devices
Table 13 Software deployment configuration items
Item Description
Required
Task Name
Description
Add Device
Deploy Software Version
Deployment Sequence
Type the name of the deployment task. By default, it consists of the word Task,
a string indicating the current time, and a space in between.
Required
Type a description for the task.
The description must not contain these characters: ' " < > & %
Click this button to add a device to which you want to deploy a software
version. You can add multiple devices.
You can click the
Select a location from the Device Storage Path dropdown list to specify where
the software should be saved on the device. Generally, the root directory of the
CF card is selected.
Required
Click the link in this column to select the software version to be deployed.
Required
Select a deployment mode to deploy the software to the devices in parallel
(Parallel) or one by one (Serial).
icon of a device to remove it from the list.
When the deployment sequence is serial, the icons
adjusting the sequence.
22
are configurable for
Page 31

Item Description
Error Handling
Required when the deployment mode is Serial.
Specify the error handling scheme to be used when a deployment error occurs.
Required
Select the actions to be taken after deploying the software selected in the Deploy
Software Version column.
• Set the currently running software as the backup startup
software—Specifies secpath1000fe-cmw520-b5002.bin as the main startup
software and the current running software as the backup startup software.
• Delete software that is currently running—Specifies
secpath1000fe-cmw520-b5002.bin as the main startup software and
Deployment Policy
deletes the current running software from the device.
• Delete startup software that is currently backup—Specifies
secpath1000fe-cmw520-b5002.bin as the main startup software, deletes the
backup startup software from the device, and leaves the current running
software on the device.
• Reboot the device immediately after deploying—Specifies
secpath1000fe-cmw520-b5002.bin as the main startup software, leaves all
software files stored on the device, and reboots the device. After the device
reboots, secpath1000fe-cmw520-b5002.bin is the current running software
of the device.
Deployment Time Specify the execution time of the deployment task.
NOTE:
You must select a software version for the Deploy Software Version field before deploying software to
devices.
Return to Device software management functions.
Backing up the software of devices
On the device software management page, select devices and then click Backup Device Software to
back up the software of the selected devices. The Import from Device page appears with the operation
results, as shown in
Figure 19 Software backup result
If the backup operation fails, the system shows the reasons. The software backup files are stored in the
software database.
Figure 19. Table 14 describes the fields of the software backup result list.
23
Page 32

Table 14 Fields of the software backup result list
Field Description
Device Label
Software Name
Size
Start Time
Status
Result Description of the operation result or failure reason
Device name and IP address
Name of the software backed up
Size of the backup file for the software
Start time of the backup operation
Result of the backup operation
Return to Device software management functions.
Managing the device configuration
The device configuration management function allows you to manage configuration files of devices. A
configuration file records the configurations users have made on the device. The configuration file is used
by the device to filter traffic passing through.
A configuration file can be a startup configuration file or a running configuration file. The startup
configuration file refers to the configuration file that a device keeps and will use at next boot. The running
configuration file refers to the configuration currently used by a device, which you can save to the device
as a file, and once saved, becomes the startup configuration file.
The device configuration management function supports setting baseline versions for devices, managing
the running versions and startup versions of devices, and deploying configuration files to devices.
Configuration guide
From the navigation tree of the system management component, select Device List under Device
Management. The device management page appears, as shown in
Config Management tab to enter the device configuration management page, as shown in
Table 15 describes the device configuration management functions and Table 16 describes the fields of
the device configuration management list.
Figure 20 Device configuration management page
Table 15 Device configuration management functions
Function Description
Backing up configuration files
Figure 14. Then, select the Device
Figure 20.
Allows you to back up the running configuration file and/or the
startup configuration file of a device. Backup files are identified by
labels and version numbers.
24
Page 33

Function Description
Restoring a configuration file
Synchronizing configurations
Restarting devices Allows you to restart devices.
Table 16 Fields of the device configuration management list
Field Description
Device Label
Device Group Device group to which the device belongs
Last Backup Time Time of the last configuration file backup operation
Last Operate Time Time of the last configuration file operation
Backing up configuration files
From the navigation tree of the system management component, select Device List under Device
Management. The device management page appears, as shown in
Config Management tab to enter the device configuration management page. Select a device by
selecting the check box and click Backup to bring up the backup configuration page, as shown in
21. A backup file is uniquely identified by a version number that is assigned by the system. After a file is
Allows you to restore the startup and/or backup configuration file of
a device to another version.
Allows you to deploy new configuration settings to devices to make
them take effect.
Device name and IP address. You can click the link to view details about the device
and modify the configuration.
Check whether the current configuration of the device is consistent with that last
backed up.
Figure 14. Then, select the Device
Figure
backed up, click the
icon in the Management column of a device to view the detailed information of
the backup configuration files.
Figure 21 Backup configuration files
25
Page 34
Return to Device configuration management functions.
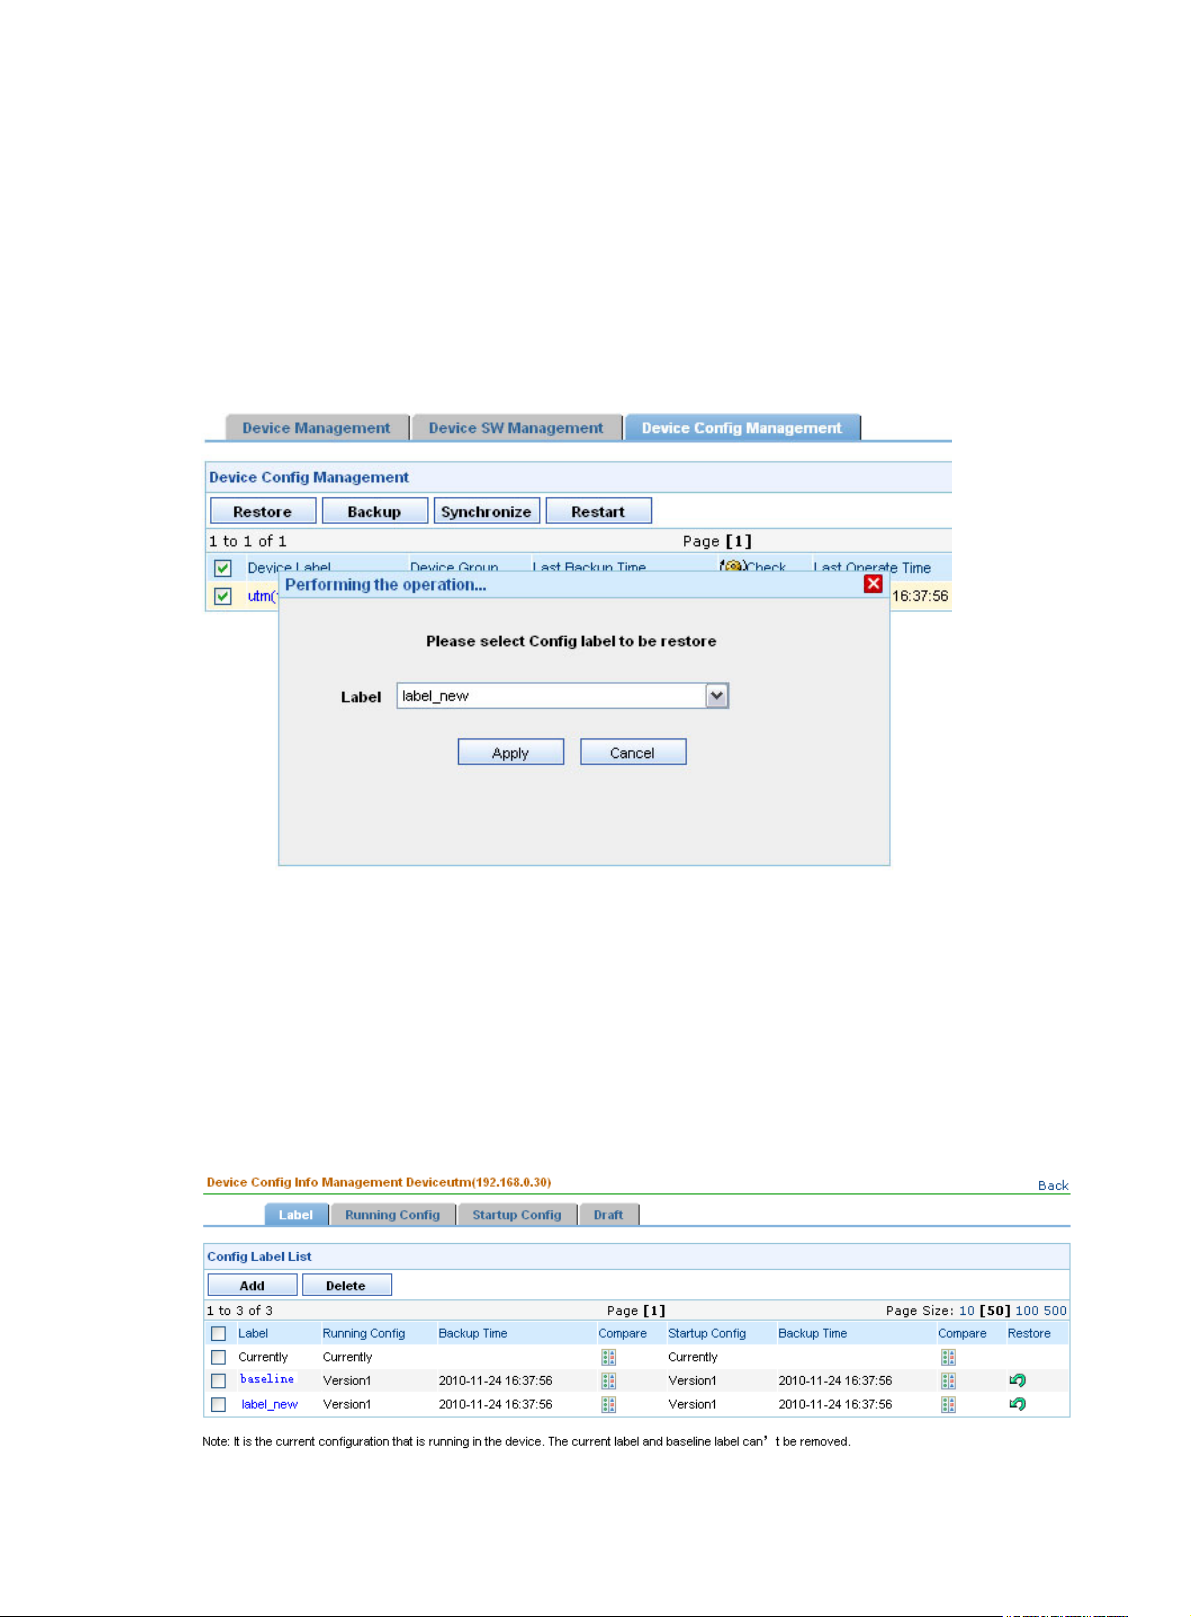
Restoring a configuration file
From the navigation tree of the system management component, select Device List under Device
Management. The device management page appears, as shown in
Config Management tab to enter the device configuration management page, as shown in
Select a device and click Restore to bring up the restoration configuration page, as shown in
Select a startup configuration file and/or running configuration file by their labels and click Apply to
specify the files as the startup and/or running configuration files for the device.
Figure 22 Restore configuration files
Figure 14. Then, select the Device
Figure 20.
Figure 22.
Return to Device configuration management functions.
Device configuration information management
On the device configuration management list, you can click the icon in the Management column of a
device to bring up the configuration information management page of the device, as shown in
Table 17 describes the tabs on the device configuration information management page and the functions
provided on the tabs.
Figure 23 Device configuration information management interface
Figure 23.
26
Page 35

Table 17 Tabs on the device configuration information management page and functions provided
Tab Description
Label A label represents a configuration file of a device. .
Label
Running Config
Startup Config
Draft Allows you to manage drafts for a device.
Allows you to perform operations on running configuration files of different
versions.
Allows you to view, back up, and delete the current startup configuration file of a
device.
The functions are the similar to those for management of running configuration
files.
A label is used to indicate the backup running and/or startup configuration files of a device.
On the device configuration management list, you can click the icon in the Management column of a
device to bring up the configuration information management interface of the device, as shown in
Figure
23.
The Label tab allows you to:
• Add and delete labels.
• View the information of the backup configuration file, such as version number and backup time. A
backup file is uniquely identified by a version number assigned by the system.
• Compare two configuration files to find the differences.
• Click the restoration icon to set the startup configuration file and/or running configuration file of a
label as the startup configuration file and/or running configuration file for the device.
Table 18 Fields of the configuration label list
Field Description
Label Label of a startup configuration file and/or running configuration file.
Running Config Version number of the running configuration file associated with the label.
Backup Time Time when the running configuration file is backed up.
Allows you to compare two configuration files including the drafts to find the
differences.
Follow these steps:
1. Click the
Compare
Startup Config Version number of the startup configuration file associated with the label.
Backup Time Time when the startup configuration file is backed up.
file on the left side of the comparison page.
2. Click the icon of another file and select Compare To to place the file on
the right side of the comparison page, as shown in Figure 24.
IMPORTANT:
The running configuration file does not support the xml format.
icon of a file and select Compare as Left from the menu to p l ace the
27
Page 36

Field Description
Restore
Allows you to set the configuration file(s) identified by the label as the startup
configuration file and/or running configuration file for the device.
Figure 24 Compare two configuration files
CAUTION:
The label Currently indicates the configuration file is currently used by the device and the label Baseline
indicates the baseline version. Configuration files with any of these labels cannot be deleted.
Return to Tabs on the device configuration information management page and functions provided.
Running Config
On the device configuration management list, you can click the icon in the Management column of a
device to bring up the configuration information management interface of the device, as shown in
23. Then, click the Running Config tab to enter the running configuration file management page, as
shown in
The Running Config tab allows you to:
• View, back up, restore and delete a running configuration file.
• Specify the running configuration as the baseline or save it as a draft.
• Compare two configuration files to find the differences.
Figure
Figure 25.
28
Page 37

Figure 25 Running configuration file list
Table 19 Fields of the running configuration list
Field Description
Draft
Version
Backup Time Time when the running configuration file is backed up.
Label Label for this version.
Compare
Set Baseline Allows you to set the running configuration file as the baseline.
Label Management Allows you to re-label the running configuration file.
Save as Draft
Restore
Uniquely identifies the running configuration file. The version number is assigned
automatically by the system for each backup file.
Allows you to compare two configuration files including the drafts to find the
differences.
Allows you to save the running configuration file as a draft, and then edit the
content of the draft.
Allows you to set the configuration file identified by the version as the running
configuration file for the device.
Return to Tabs on the device configuration information management page and functions provided.
You can save a configuration file as a draft, or create a new draft.
On the device configuration management list, you can click the icon in the Management column of a
device to bring up the configuration information management interface of the device, as shown in
23. Then, click the Draft tab to enter the draft management page, as shown in
Figure 26. You can
Figure
customize a configuration file and apply it to the device.
The Draft tab allows you to:
• Edit a configuration file and save it as a draft.
• Add and delete drafts.
• Click the restoration icon to replace the contents of the draft with the current startup or running
configuration file.
• Compare a draft with itself, another draft, or any configuration file to find the differences.
29
Page 38

Figure 26 Draft list
Table 20 Fields of the draft list
Field Description
Name Name of the draft.
Description Remarks on the draft.
Creation Time Time when the draft is created.
Last Modify Time Last time when the draft is modified.
Compare Allows you to compare the draft with a configuration file to find the differences.
Allows you to set the draft as the configuration file for the device.
Restore
IMPORTANT:
Do not set a draft as the startup configuration file.
Return to Tabs on the device configuration information management page and functions provided.
Managing the device software database
The device software database is used to save all device software. It allows you to import device software
to the database from files or devices, and deploy software to devices.
Configuration guide
From the navigation tree of the system management component, select Device Software Database under
Device Management to enter the device software database page, as shown in
describes the device software database functions,
option, and
Table 23 describes the fields of the device software database list.
Figure 27 Device software database page
Table 22 describe the device software database query
Figure 27. Table 21
30
Page 39

Table 21 Device software database functions
Function Description
Importing device software Allows you to import device software from a file or from a device.
Allows you to remove software that is no longer in use.
Deleting device software
Deploying software to device Allows you to deploy software to devices.
Follow these steps:
1. Select the check box before software names.
2. Click Delete.
Table 22 Device software database query option
Option Description
Software Name Specify the name of the software.
Table 23 Fields of the device software database list
Field Description
Software Name Name of the software file
Declaration Remarks on the software
Import Time Time when the software is imported
Size Size of the software file
Check
Rename Allows you to rename the software file.
Export Allows you to export the software to a local place
Deployment Allows you to deploy the software to devices.
Importing device software
From the navigation tree of the system management component, select Device Software Database under
Device Management to enter the device software database page, as shown in
Import to bring up the device software import page, as shown in
software from a file or from devices:
• To import device software from a file, specify the source and destination files.
• To import device software from devices, specify the devices.
Figure 28 Device software import page
Allows you to check whether the exported software is consistent with the
device software.
Figure 27. Then, click
Figure 28. You can import device
31
Page 40

Managing deployment tasks
This function allows you to view all deployment task information.
Configuration guide
From the navigation tree of the system management component, select Deploy Task under Device
Management to enter the deployment task list page, as shown in
Figure 29 Deployment task list
On the deployment task list, you can:
Figure 29.
• Execute deployment tasks immediately.
• Cancel deployment tasks.
• Delete deployment tasks.
• Refresh the deployment task information.
Table 24 describes the deployment task query option and Table 25 describes the fields of the deployment
task list.
Table 24 Deployment task query option
Option Description
Task Status Select a state to list all deployment tasks in the state.
Table 25 Fields of the deployment task list
Field Description
Execution Status Current status of the deployment task
Task Name Name of the deployment task
Task Type Type of the deployment task
Creation Time Time when the deployment task is created
Creator Creator of the deployment task
Start Time Time when the deployment task starts
End Time Time when the deployment task ends
Copy Allows you to create a deployment task based on the selected one.
32
Page 41

Managing events
Configuration guide
The event management function records the operations on managed devices and logs the events,
allowing you to track the status of devices.
From the navigation tree of the system management component, select Events under Device Management.
The event management page appears, as shown in
management functions.
Figure 30 Event management page
Figure 30. Table 26 describes the event
Table 26 Event management functions
Function Description
Device event list Displays detailed information of the device events.
Device interface event list Displays detailed information of the device interface events.
Device event list
Table 27 describes the event query options. You can use any combination of the options to query for the
events of interest.
Table 27 Event query options
Option Description
Time
Device IP
Severity
Select the time period during which the events occurred.
By default, the value of this option is --, which means any time.
Type the IP address of the device, in dotted decimal notation.
Select the severity level of the events.
Severity levels in descending order are critical, major, minor, and
warning. By default, the value of this option is --, which means all levels.
Table 28 describes the fields of the event list. You can select the check boxes before events and then click
Delete to delete the events.
33
Page 42

Table 28 Fields of the event list
Field Description
Severity
Source
Description
Time
Device interface event list
On the device interface event management page, you can set the query conditions to query specific
interface events, view interface event information, and delete the selected interface events.
describes the device interface event query options in the query section.
the device interface event list.
Figure 31 Device interface event list
Severity level of the event
Label and IP address of the device that is the source of the event
Description of the event
Time when the event occurred
Table 30 describes the fields of
Table 29
Table 29 Interface event query options
Option Description
Start Time/End Time
Select the time period during which the interface events occurred.
Table 30 Fields of the device interface event list
Field Description
Time
Device IP IP address of the device where the event occurred
Interface Interface where the event occurred
Status Status of the event
Time when the event occurred
34
Page 43
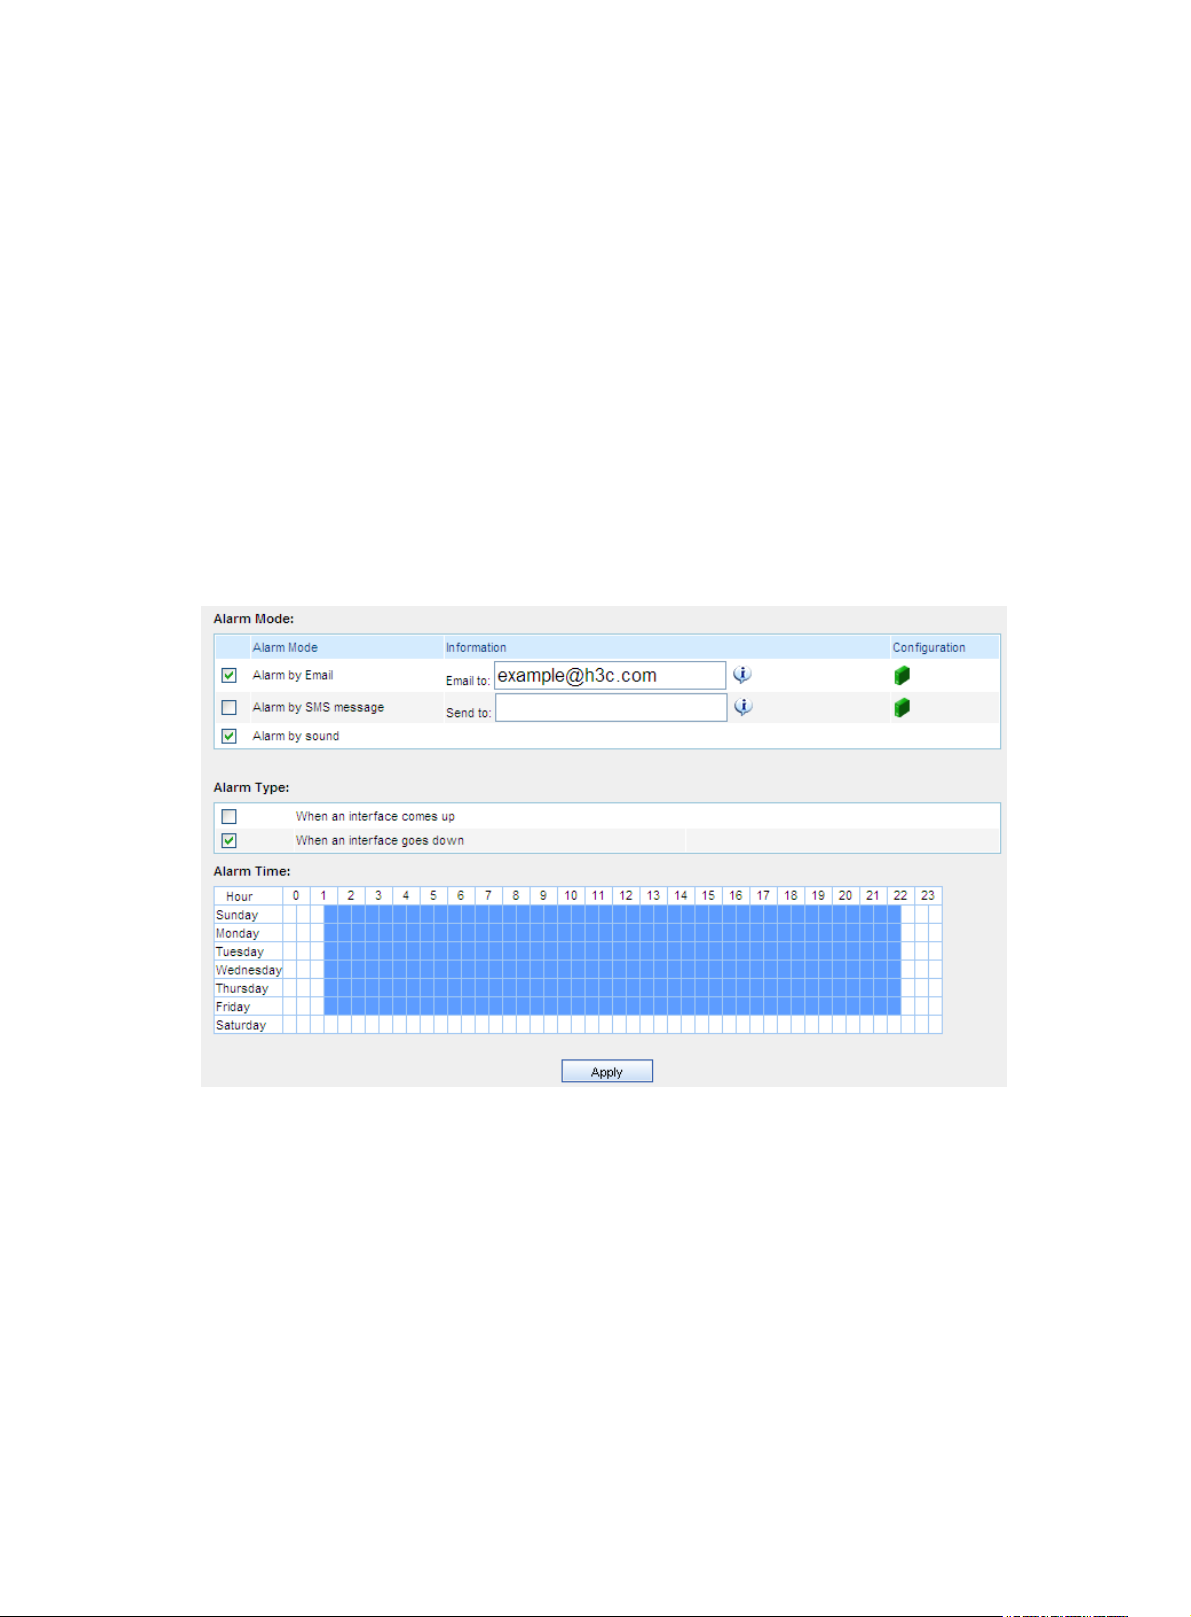
Configuring device interface alarming
This function allows you to specify when and for what events to generate alarms, how to raise alarms,
and where to send alarms.
Follow these steps:
1. From the navigation tree of the system management component, select Device Interface Alarms
under Device Management. The device interface alarming configuration page appears, as shown
in
Figure 32.
2. Select one or more alarm modes, and select one or both event types for which alarms will be
generated.
3. Click the alarm time points, or drag the cursor to select a time period.
4. Click Apply.
The system will raise alarms by the specified means when the specified types of events occurred during
the selected period of time.
Figure 32 Configure device interface alarming
Operator management
The operator management module allows you to perform the following tasks:
Managing Operators
•
Managing operation logs
•
Changing your password
•
Managing Operators
This function allows you to manage the rights of web users.
35
Page 44
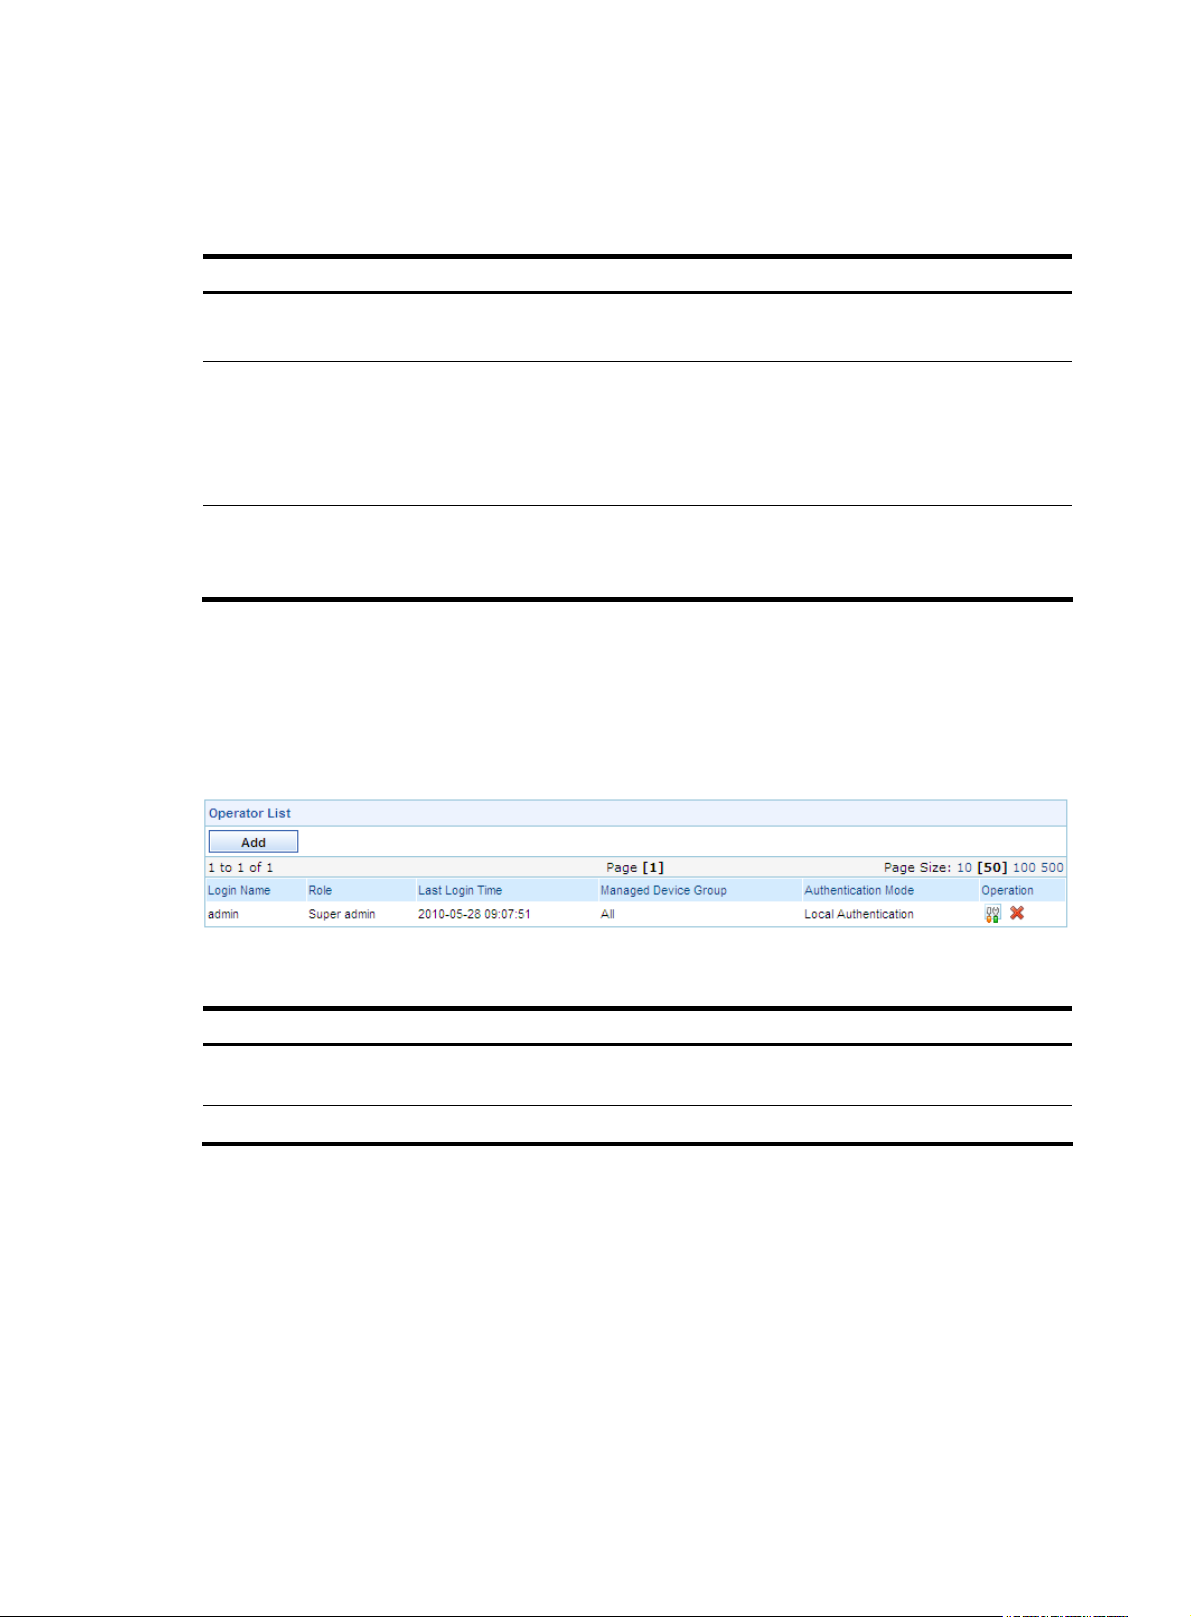
There are three user levels: common operator, system administrator, and super administrator. A higher
level operator has all the rights of operators of a lower level.
Table 31 describes the rights of the three user
levels.
Table 31 User levels and the rights
User level Rights
Common operator
(visitor level)
System administrator
(monitoring level)
Super administrator
(management level)
Configuration guide
From the navigation tree of the system management component, select Operators under Operator
Management. The operator management page appears, as shown in
operator management functions.
Figure 33 Operator management functions
• Use the Ping tool
• Cannot perform any configuration
• Use the Ping tool
• View configuration information except for user information
• View log information except for operation logs
• Perform configurations except for user configuration, operation logging
configuration, software upgrade, and factory defaults restoration
• View all configurations
• View all logs
• Perform all configurations
Figure 33. Table 32 describes the
Table 32 Operator management functions
Function Description
Operator list
Adding an operator Allows you to add operators.
Operator list
From the navigation tree of the system management component, select Operators under Operator
Management. The operator management page appears, as shown in
fields of the operator list.
Allows you to view details about operators, modify operator information,
and delete operators.
Figure 33. Table 33 describes the
36
Page 45

Table 33 Fields of the operator list
Field Description
Login Name
Role
Last Login Time
Managed Device Group
Authentication Mode Authentication mode of the operator
Operation
Return to Operator management functions.
Adding an operator
Follow these steps:
1. From the navigation tree of the system management component, select Operators under Operator
Management to enter the operator management page.
2. Click Add to enter the operator configuration page.
3. Configure the operator, as shown in Figure 34. Table 34 describes the operator configuration
items.
4. Click Apply.
Name of the operator
Operation level of the operator
Last time when the operator operated on the web
Device group for which the operator has operation rights
• Click the icon of an operator to modify the operator’s information.
• Click the icon of an operator to delete the operator.
Figure 34 Add an operator
37
Page 46

Table 34 Operator configuration items
Item Description
Login Name
Login Password
Confirm Password
Role
Manage Device Group
Authentication Mode
Type a name for the operator, a string of up to 40 characters.
Specify a password for the operator to use at login.
IMPORTANT:
The password must comprise 6 to 20 alphanumeric characters, and its
strength must meet the password strength requirements of the device.
Type the password again, which must be the same as that for Login
Password. If the two are not the same, an error message will appear,
telling you that they must be identical.
Select an operation level for the operator.
Specify which device group the operator can manage. The added
operator can perform only authorized operations for only the devices in
the selected device group. Thus, different operators manage different
devices and perform different operations.
Select an authentication mode for the operator.
Available authentication modes include local authentication and LDAP
authentication. If you select LDAP authentication, you must also select an
LDAP server.
Return to Operator management functions.
Managing operation logs
Configuration guide
Operations performed by all operators are recorded in operation logs. The super administrator can view
operation logs, query logs by different conditions, and delete logs.
From the navigation tree of the system management component, select Operation Logs under Operator
Management. The operation log management page appears, as shown in
the operation log query options. You can use any combination of the options to query for the logs of
interest.
Figure 35 Operation log management page
Table 36 describes the fields of the operation log list.
Figure 35. Table 35 describes
38
Page 47

Table 35 Operation log query options
Option Description
Operator
Gateway IP
Operation Result
Specify the operator whose logs you are interested in.
Type the IP address of the gateway.
Select the operation result of the operation logs you are interested in.
By default, the value of this option is --, which means both the succeeded and
failed operations.
Table 36 Fields of the operation log list
Field Description
Operator
IP Address
Time Time when the operation occurred
Operation
Result Whether the operation succeeded or failed
Details
Name of the operator
IP address of the PC used by the operator to log in
What the operator did
Operation details of the operator
Changing your password
This function allows you to change your password for login.
From the navigation tree of the system management component, select Password under Operator
Management to enter the page for changing your login password, as shown in
Figure 36.
Figure 36 Change your login password
Table 37 describes the configuration items for changing your password.
Table 37 Configuration items for changing your password
Item Description
Required
Old Password
Type the current password.
This password must be an alphanumeric string of 6 to 20 characters.
39
Page 48

Item Description
Required
New Password
Confirm Password
Type the new password.
This password must be an alphanumeric string of 6 to 20 characters.
Required
Type the new password again.
This password must be exactly the same as that for New Password.
System configuration
The system configuration module allows you to perform the following tasks:
Configuring service parameters
•
Configuring system parameters
•
Configuring management ports
•
Configuring the mail server
•
Configuring SMS alarming
•
Managing filters
•
Managing LDAP servers
•
Configuring SMS alarming
•
Configuring segments
•
Monitoring the disk space
•
Managing subsystems
•
Configuring service parameters
Follow these steps:
1. From the navigation tree of the system management component, select Service Parameters under
System Config. The service parameter configuration page appears, as shown in
2. Select options as needed.
Figure 37.
40
Page 49
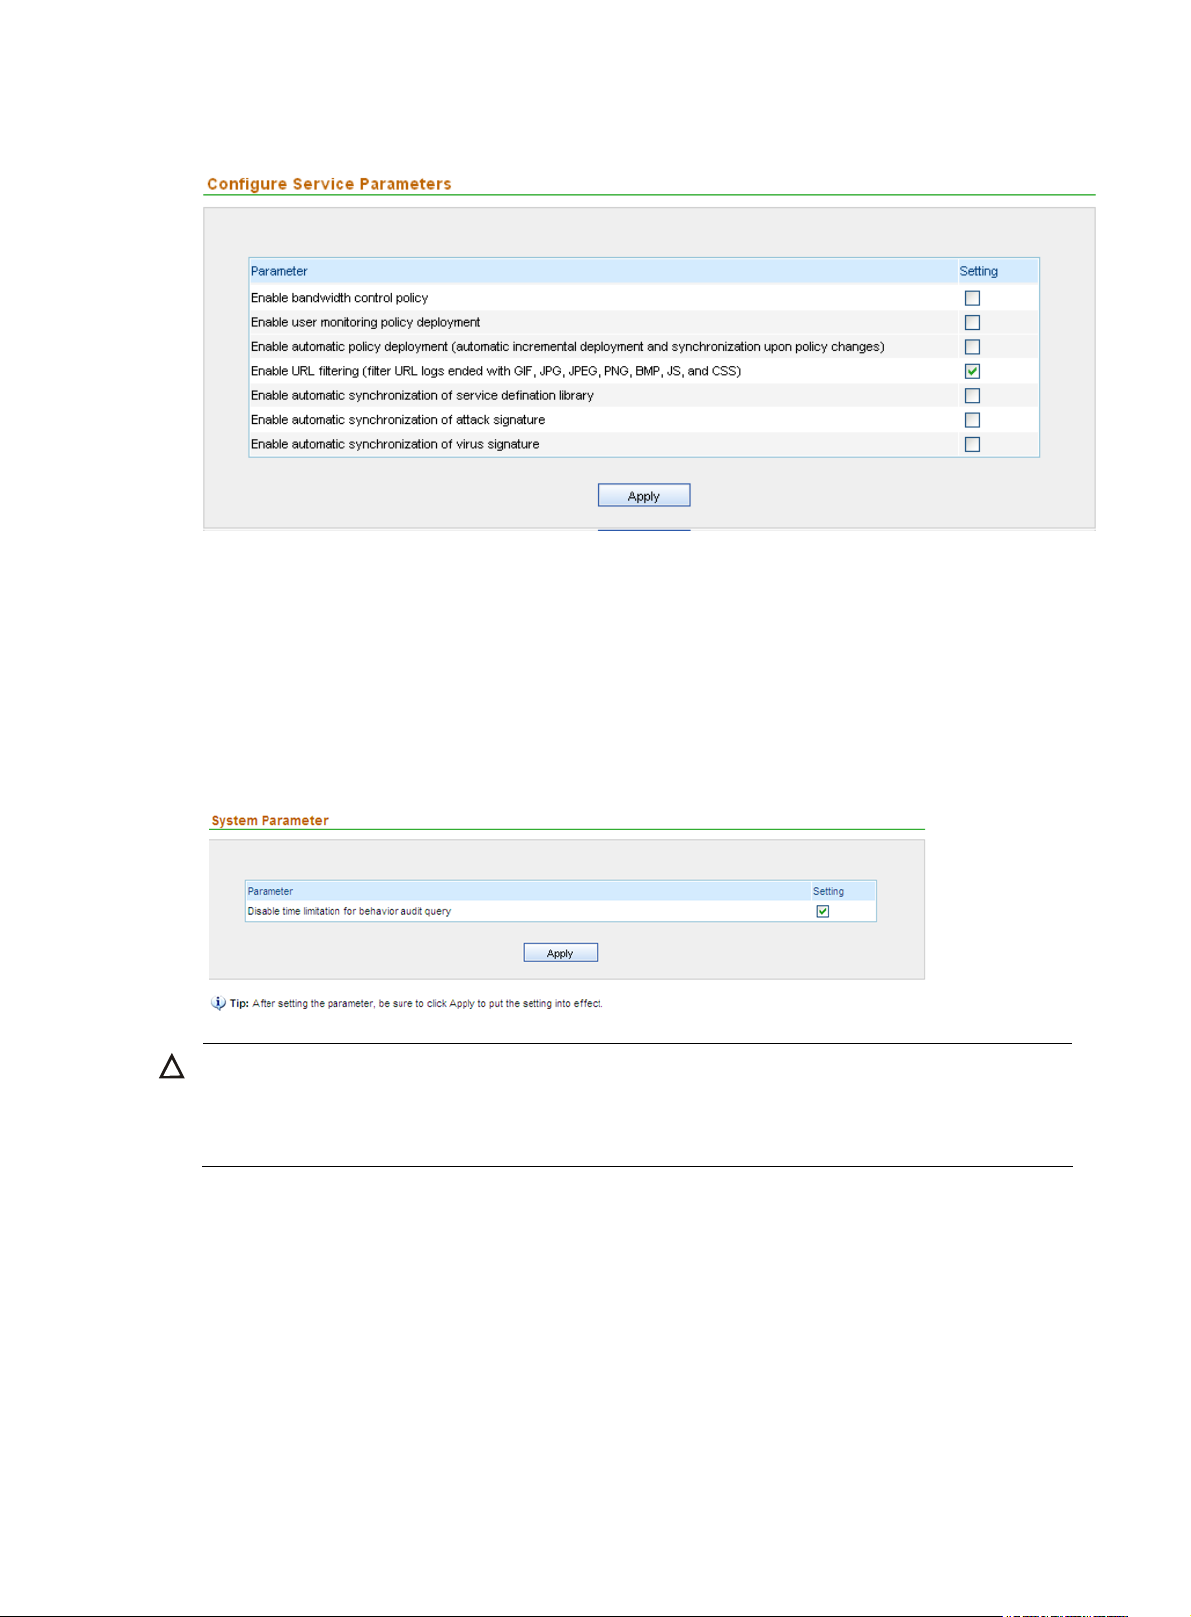
Figure 37 Service parameter configuration page
Configuring system parameters
Follow these steps:
1. From the navigation tree of the system management component, select System Parameters under
System Config. The service parameter configuration page appears, as shown in
2. Select options as needed.
Figure 38 System parameter configuration page
CAUTION:
If you disable time limitation for user behavior query, the system will not provide the total number of
records, and you must specify a proper time period. Too long a time period will cause the query to fail
because the query will take too much time.
Configuring management ports
Figure 38.
This function allows you to specify the SecCenter background ports for receiving various logs from
devices. After completing management port configuration, the devices will send different types of logs to
different background receiving ports.
Configuration guide
Follow these steps:
1. From the navigation tree of the system management component, select Management Ports under
System Config. The management ports configuration page appears, as shown in
Figure 39.
41
Page 50

2. Configure the ports. Table 38 describes the configuration items.
3. Click Apply.
Figure 39 Management port configuration page
Table 38 Management port configuration items
Item Description
Stream Logs Port
NAT Logs Port
Syslog Logs Port
Sflow Logs Port
Required
Type the port for receiving stream logs.
Stream logs are used for bandwidth management. You need to ensure that
the corresponding UTM devices are configured to send such logs to this
port. For more information, see “
The port number must be in the range from 1 to 65534. The default is
30010.
Required
Type the port for receiving NAT logs.
NAT logs are used for NAT log auditing. They are in an H3C proprietary
binary format. You need to ensure that the corresponding firewall devices
are configured to send such logs to this port. For more information, see
“
Configuration example 1.”
The port number must be in the range from 1 to 65534. The default is
30017.
Required
Type the port for receiving syslogs. Syslogs are used for security event
management functions such as behavior auditing, IPS, and firewall.
The port number must be in the range from 1 to 65534. The default is
30514.
Required
Type the port for receiving Sflow logs.
The port must be in the range from 1 to 65534. The default is 30019.
Configuration example 1.”
42
Page 51
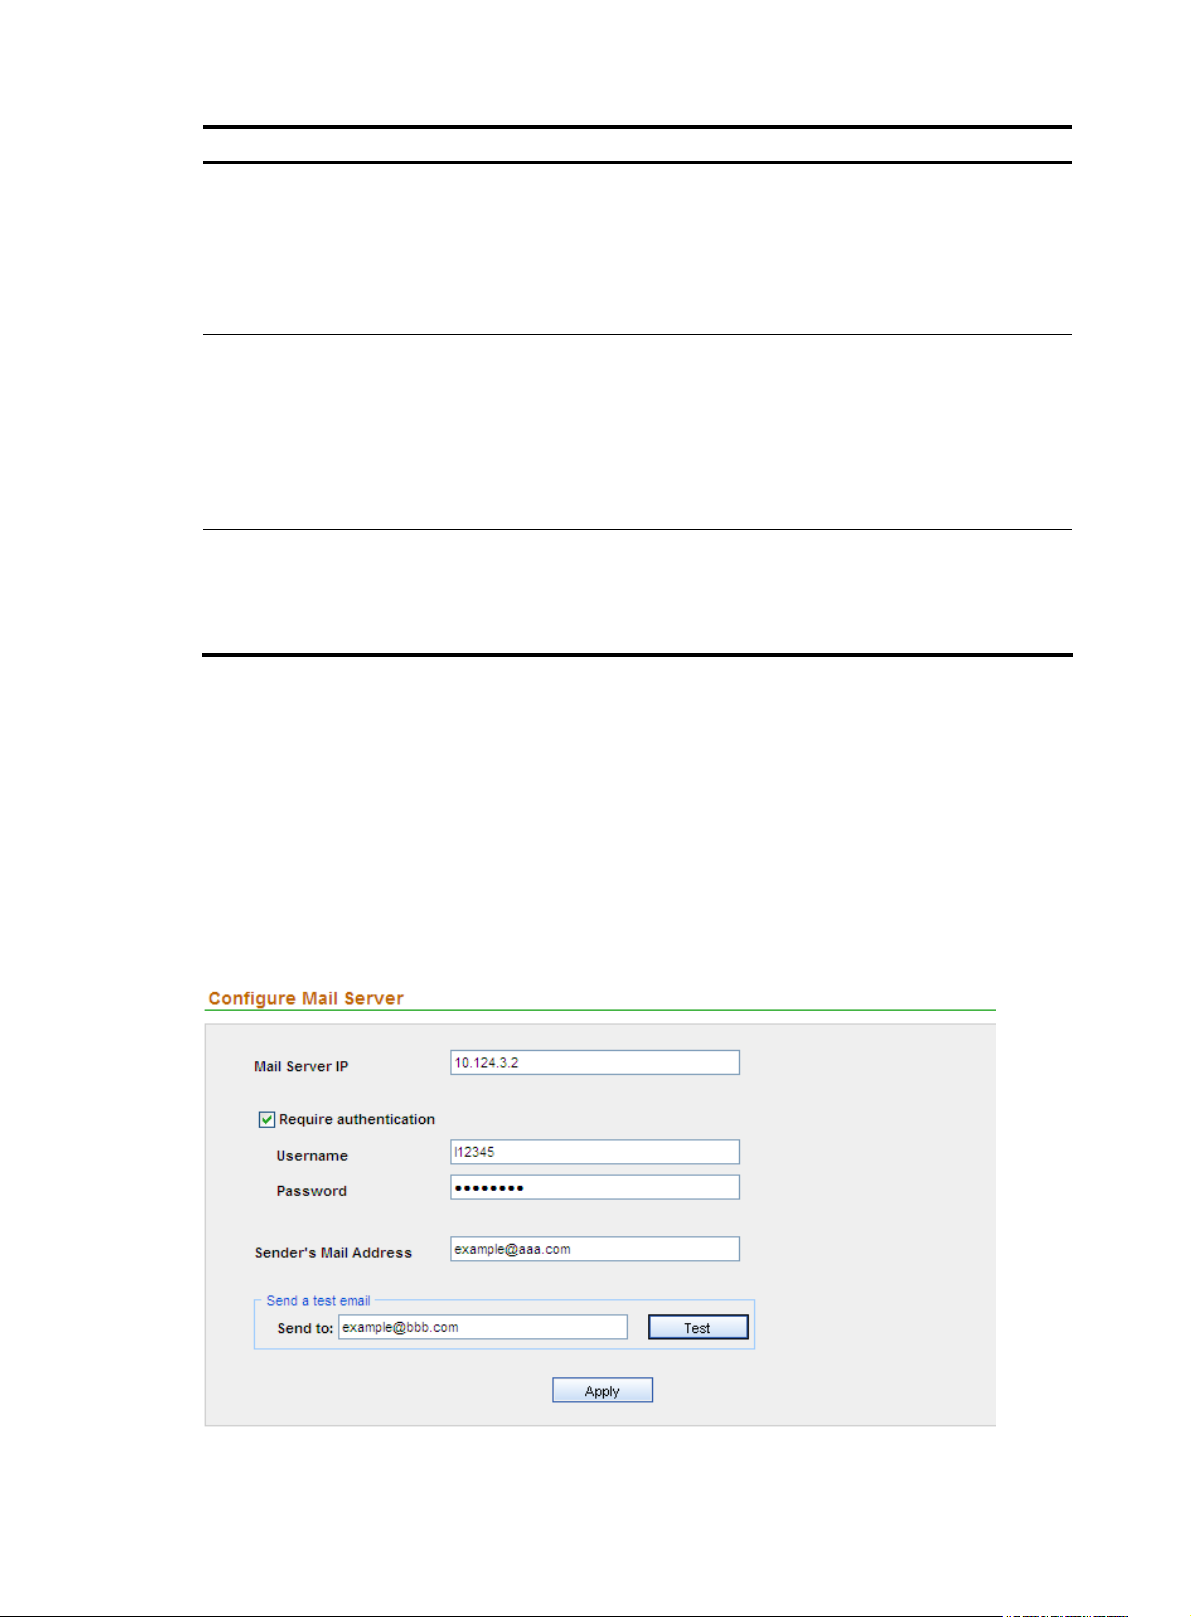
Item Description
Required
Type the port for receiving NetStream V5 logs. NetStream V5 logs are
NetStream V5 Logs Port
NetStream V9 Logs Port
Spam Mail Logs Port
used by H3C Intelligent Traffic Analysis System (iTAS) for network traffic
analysis.
The port number must be in the range from 1 to 65534. The default is
30014.
Required
Type the port for receiving NetStream V9 logs. NetStream V9 logs are
used for traffic cleaning. You need to ensure that the corresponding
devices are configured to send such logs to this port. For more information,
see “
Configuration example 1.”
The port number must be in the range from 1 to 65534. The default is
30011.
Required
Type the port for receiving spam mail logs.
The port number must be in the range from 1 to 65534. The default is
30030.
Configuring the mail server
This function allows you to configure the mail server information, so that the system emails alarm
information to the specified server.
Configuration guide
From the navigation tree of the system management component, select Mail Server under System Config.
The mail configuration page appears, as shown in
configuration items.
Figure 40 Configure the mail server
Figure 40. Table 39 describes the mail server
43
Page 52

Table 39 Mail server configuration items
Item Description
Required
Mail Server IP
Type the IP or domain name of the mail server.
The domain name can comprise up to 40 characters.
Require authentication
Username
Password
Sender’s Mail Address
Send to
Optional
Specify whether to authenticate users accessing the mail server.
Optional
Type the username for identity authentication on the mail server.
The password can comprise up to 40 characters.
Optional
Type the password for identity authentication on the mail server.
The password must comprise 6 to 20 alphanumeric characters, and its
strength must meet the password strength requirements of the device.
Required
Type the mail address of the sender.
Optional
Type an email address and click Test. An email will be sent to the email box
for testing.
Configuring SMS alarming
You can specify a phone number to which alarms are to be sent by Short Message Service (SMS)
messages.
Follow these steps:
1. From the navigation tree of the system management component, select SMS Alarm Configuration
under System Config. The SMS alarm configuration page appears, as shown in
2. Configure the settings. Table 40 describes the SMS alarming configuration items.
3. Click Apply.
Figure 41.
Figure 41 Configure SMS alarming
44
Page 53

Table 40 SMS alarming configuration items
Item Description
Enable SMS Alarm
COM Port
Baud Rate
Send to
Managing filters
A filter filters information captured by UTM devices to present you only information of interest through
reports. The IPS and firewall modules may use filters to filter various security events.
By configuring filters, you can specify filtering conditions flexibly.
Configuration guide
From the navigation tree of the system management component, select Filter Management under System
Config. The filter management page appears, as shown in
management functions.
Required
Specify whether to enable SMS alarming.
Required
Select a COM port for sending SMS messages. The port defaults to COM4.
Required
Select a baud rate for sending SMS messages.
Optional
Type a number and click Test. A message will be sent to the phone for testing.
Figure 42. Table 41 describes the filter
Figure 42 Filter management page
Table 41 Filter management functions
Function Description
Filter list Allows you to view details about filters and modify filter settings.
Adding a filter Allows you to add filters.
Allows you to delete filters that are no longer in use.
Deleting filters
Follow these steps:
1. Select the check boxes before the filters to be deleted.
2. Click Delete.
45
Page 54

Filter list
From the navigation tree of the system management component, select Filter Management under System
Config. The filter management page appears, as shown in
Figure 42. Table 42 describes the fields of the
filter list.
Table 42 Fields of the filter list
Field Description
Filter Name
Filter Description
Device
Operation
Return to Filter management functions.
Adding a filter
Follow these steps:
1. From the navigation tree of the system management component, select Filter Management under
2. Click Add to enter the filter configuration page, as shown in Figure 43.
3. Configure the filter. Table 43 describes the filter configuration items.
4. Click Add.
Figure 43 Add a filter
Name of the filter
Description of the filter
Device that the system collects statistics on
Click the icon of a filter to modify the settings of the filter.
System Config to enter the filter management page.
46
Page 55

Table 43 Filter configuration items
Item Description
Required
Filter Name
Filter Description
Event Severity
Type a name for the filter.
The filter name can comprise up to 40 characters.
Optional
Type a description for the filter.
The description can comprise up to 40 characters.
Optional
Select the severity of the events that you want the system to collect statistics
on.
Device
Source IP
Destination IP
Source Port
Destination Port
Protocol
Event
CAUTION:
Optional
Select the devices that you want the system to collect statistics on.
Optional
Specify the source IP addresses that you want the system to collect statistics
on.
Optional
Specify the destination IP addresses that you want the system to collect
statistics on.
Optional
Specify the source ports that you want the system to collect statistics on.
Optional
Specify the destination ports that you want the system to collect statistics
on.
Optional
Select the protocols that you want the system to collect statistics on.
Optional
Specify the events that you want the system to collect statistics on.
The configuration items given in the previous table can be used to define query conditions. For example,
you can enter source IP address 1.1.1.1 to search for data with the source IP address being 1.1.1.1, or
enter source IP address 1.1.1.1 and select the Invert selection check box to search for data whose source
IP address is not 1.1.1.1.
Return to Filter management functions.
Managing LDAP servers
This function allows you to configure LDAP servers. Then, you can select LDAP authentication to verify the
operator’s username and password when they log in to the SecCenter system.
47
Page 56

Configuration guide
From the navigation tree of the system management component, select LDAP Server Management under
System Config. The LDAP server management page appears, as shown in
the LDAP server management functions.
Figure 44 LDAP server management page
Table 44 LDAP server management functions
Function Description
LDAP server list Allows you to view details about LDAP servers and modify LDAP server settings.
Figure 44. Table 44 describes
Adding an LDAP server Allows you to add an LDAP server.
Deleting LDAP servers
LDAP server list
From the navigation tree of the system management component, select LDAP Server Management under
System Config. The LDAP server list is on the LDAP server management page, as shown in
Table 45 Fields of the LDAP server list
Field Description
Server Name
Server IP Address IP address of the LDAP server
Server Version
Operation
Import Users The device does not support importing users.
Return to LDAP server management functions.
Adding an LDAP server
Follow these steps:
Allows you to delete one or more LDAP servers from the system.
Figure 44.
Name of the LDAP server
Version information of the LDAP server
Click the
icon of a LDAP server to modify the settings of the filter.
1. From the navigation tree of the system management component, select LDAP Server Management
under System Config.
2. Click Add.
3. Configure an LDAP server, as shown in Figure 45. Table 46 describes the LDAP server
configuration items.
4. To test the connectivity to the LDAP server, click Test.
5. Click Add.
48
Page 57

Figure 45 Add an LDAP server
Table 46 LDAP server configuration items
Item Description
Server Name
Server Version
Server IP
Server Port
Admin DN
Admin Password
Username Attribute
Base DN
Required
Type a name for the LDAP server.
Required
Select an LDAP server version.
Required
Type an IP address for the LDAP server.
Required
Type a port number for the LDAP server.
Required
Type the administrator DN for the LDAP server.
Required
Type the administrator password for the LDAP server.
Required
Type a username attribute for the LDAP server.
Required
Type a base DN for the LDAP server.
Return to LDAP server management functions.
Configuring SMS alarming
You can specify an email address so that the system sends spam alarms by emails.
Follow these steps:
1. From the navigation tree of the system management component, select Spam Alarm Configuration
under System Config. The spam alarm configuration page appears, as shown in
Figure 46.
49
Page 58

2. Select Alarm by Email and enter the email address.
3. Click the alarm time points, or drag the cursor to select a time period.
4. Click Apply.
The system will raise alarms when it receives spam mails during the selected period of time.
Figure 46 Configure SMS alarming
Configuring segments
Segment management is a means of managing network behaviors between security zones. A segment
is a directional combination of two security zones. By configuring security policies on segments, you can
implement monitoring and controlling of bad network behaviors on the segments.
Configuration guide
From the navigation tree of the system management component, select Segment Setting under System
Config. The segment management page appears, as shown in
Figure 47 Segment management page
Figure 47.
On the segment management page, you can view the all configured segments, and:
50
Page 59

• Click the icon of a segment to modify the segment.
• Click the
Adding a segment
Follow these steps:
1. From the navigation tree of the system management component, select Segment Configuration
under System Config.
2. Click Add to enter the segment configuration page, as shown in Figure 48.
3. Specify a segment ID and an alias for the segment. A segment ID is an integer in the range 0 to
255.
4. Click Add.
Figure 48 Add a segment
icon of a segment to delete the segment.
CAUTION:
This feature is used in the bandwidth management component.
Monitoring the disk space
This function provides the usage statistics of the disk space under the system installation directory. It
allows you to set the minimum free disk space, so that an alarm is generated whenever the free disk
space is less than the threshold. You can also specify an email address so that the system sends
generated alarms to the mail box. This function helps reduce data loss due to lack of disk space.
Follow these steps:
1. From the navigation tree of the system management component, select Disk Monitoring under
System Config. The disk space alarm configuration page appears, as shown in
2. Set the disk space alarm threshold and specify the alarm mode. Table 47 describes the alarm
configuration items of the disk space for logs.
3. Click Apply.
The system will issue an alarm whenever the free disk space is less than the threshold.
Figure 49.
51
Page 60

Figure 49 Disk space alarm configuration page
Table 47 Alarm configuration items of the disk space for logs
Item Description
Required
Warning Disk Space
Set the minimum free disk space required. An alarm will be generated if
the free disk space is less than the minimum.
Optional
Send a report by email
Selecting the check box will make the system send generated alarms to
the specified mail box.
You can also select th e Residual Disk Monitoring tab to view the disk sp ac e usag e, o r sele ct the Detail tab
to view disk space usage statistics of function modules, as shown in
Figure 50.
52
Page 61

Figure 50 Free disk space monitoring page
Managing subsystems
Subsystem management implements unified management and monitoring of multiple SecCenter systems.
By adding these systems as the subsystems of your system, you can visit these subsystems without entering
the URLs, usernames, and passwords repeatedly.
Subsystem list
From the navigation tree of the system management component, select Subsystem Management under
System Config. The subsystem management page appears, as shown in
fields of the subsystem list.
Figure 51. Table 48 describes
53
Page 62

Figure 51 Subsystem management page
Table 48 Fields of the subsystem list
Field Description
Server IP IP address of the subsystem server
Port Service port of the subsystem server
User Name Username for logging in to the subsystem
Password Password for logging in to the subsystem
Link URL of the subsystem. Click the link to log in to the subsystem.
Adding a subsystem
Follow these steps:
1. From the navigation tree of the system management component, select Subsystem Management
under System Config.
2. Click Add to enter the subsystem configuration page, as shown in Figure 52.
3. Configure the subsystem. Table 49 describes the configuration items for adding a subsystem.
4. Click Add.
Figure 52 Add a subsystem
Table 49 Subsystem configuration items
Item Description
Server IP
Required
Specify the IP address of the subsystem server.
54
Page 63

Item Description
Required
Server Port
User Name
Password
Specify the server port providing web access service. The default port is
80.
Required
Specify the username for logging in to the subsystem.
The username can comprise up to 40 characters and must not contain
these characters: ” < > ’ & % : ; /
Required
Specify the password for logging in to the subsystem.
IMPORTANT:
The password must comprise 6 to 20 alphanumeric characters, and its
strength must meet the password strength requirements of the device.
55
Page 64

Bandwidth management
The bandwidth management component of the UTM Manager receives stream logs from managed
devices and analyzes and reports network applications such as P2P, flow media, and games, which are
identified through Layer-7 service identification techniques. The component monitors and collects
statistics on application traffic in real time, and provides traffic snapshots by application and user.
To access the bandwidth management component, select the Bandwidth Management tab. Then, you
can configure the functions described in the following sections:
•
Traffic snapshot
Service traffic analysis by device group
•
Service traffic analysis by user
•
Service traffic analysis by IP group
•
Traffic snapshot
The bandwidth management component collects statistics on network traffic and displays snapshots
about network applications during the past quarter to the past hour. The snapshot page displays traffic
graphs, pie charts, and optionally top N lists. You can query the traffic information by device group,
segment, direction, and the number of Top users concerned. These graphs and lists can help you better
understand how the network resources are used. Exporting of reports is supported.
Under Traffic Snapshot of the bandwidth management component, you can access three functions, as
shown in
Table 50 Traffic snapshot functions
Function Description
Traffic snapshot Displays information about recent applications traffic
Segment traffic comparison Display traffic comparison by segments
Traffic anomaly alarm Displays traffic anomaly alarms
Table 50.
Traffic snapshot
From the navigation tree of the bandwidth management component, select Traffic Snapshot under Traffic
Snapshot. The traffic snapshot page appears, as shown in
to view traffic information of interest.
the pie charts show the traffic statistics by application, and the lists under the histograms show the top
users’ traffic statistics. See
Figure 53. You can specify query conditions
Table 51 describes the traffic snapshot query options. The lists under
Table 52 and Table 53.
56
Page 65

Figure 53 Traffic snapshot
Table 51 Traffic snapshot query options
Option Description
Device Group Select a device group to collect statistics on the traffic of the device group.
Segment
Time
Select a segment to collect statistics on the traffic of the segment. A segment
represents a pair of security zones with the traffic direction specified.
Select the statistics duration, which ends at the current time. For example, one hour
means the last hour.
57
Page 66

g
g
Option Description
Top Users
Direction Select a traffic direction.
Lists Select this check box to display detailed information lists under the graphs.
Select a number to display detailed information about the specified number of top
users.
Table 52 Traffic statistics by application
Field Description
Service Name of the application.
Total Traffic Total traffic of the application, in Mbytes.
Max BW Maximum bandwidth that the application occupied, in Mbps.
Current BW Current bandwidth that the application occupies, in Mbps.
Table 53 Top users’ traffic statistics
Field Description
Top Rank of the user’s traffic
Username Username of the user
Total Traffic Total traffic of the user in the statistic interval, in Mbytes
Details
CAUTION:
Click the
to view the user’s service utilization statistics.
In the H3C SecCenter UTM Manager, some pages allow you to set the refresh interval in a device
such as
before the page is closed. That is, if you close the pa
the refresh setting you set before.
Segment traffic comparison
From the navigation tree of the bandwidth management component, select Segment Traffic Compare
under Traffic Snapshot. The segment traffic comparison page appears, as shown in
specify query conditions to view information of interest.
roup
. However, your setting on a page is only effective on the page
e and enter the page again, the system will not use
Figure 54. You can
Table 54 describes the query options.
58
Page 67

Figure 54 Traffic comparison by segments
Table 54 Traffic comparison query options
Option Description
Device Group Select a device group to collect statistics on its traffic.
Time
Direction Select a traffic direction.
Select the statistics duration, which ends at the current time. For example, one hour
means the last hour.
Traffic anomaly alarm
From the navigation tree of the bandwidth management component, select Traffic Anormaly Alarm
under Traffic Snapshot. The alarm information page appears, as shown in
a time range to view traffic anomaly alarm information of interest.
Figure 55 Alarm information
Table 55 Fields of the alarm information list
Figure 55. You can specify
Table 55 describes the fields of the list.
Field Description
Time Time when the alarm was generated
Device IP Device that generated the alarm
Alarm Content Content of the alarm
You can select one or more alarms and click Delete to delete them, or click the icon to export the
alarm information to an Excel file.
59
Page 68

g
To configure the alarming settings, follow these steps:
1. Select the Alarm configuration tab. See Figure 56.
2. Select alarm modes and specify the alarm type.
3. Click the alarm time points, or drag the cursor to select a time period.
4. Click Apply.
Figure 56 Alarm configuration
CAUTION:
• If the difference between the traffic in the current statistic interval and that in the last interval is
than the alarm threshold, an alarm is issued. For example, if you set the alarm threshold to 2 times and
the traffic in the last interval is 30 M, an alarm will be issued when the traffic in the current interval is less
than 15 M or greater than 60 M.
• If the traffic in the current statistic interval and that in the last interval are both a non-zero value less than
the minimum traffic, no alarm is issued.
60
reater
Page 69

Service traffic analysis by device group
Service traffic trend
For better traffic analysis, the bandwidth management component allows you to group applications into
two service levels and view traffic trend reports of different levels. A level-1 service may have several
level-2 services, that is, sub-categories. For example, the P2P service is a level-1 service, and under it are
level-2 services such as BT, eMule, and QQ.
To view the level-1 service traffic trend report page, select Service Traffic Trend under Analysis by Device
Group from the navigation tree of the bandwidth management component, as shown in
this page, you can do the following:
Figure 57. On
• Select a service to enter the level-2 service traffic trend report page. See
• Select a service type to enter the traffic trend report page of the specific service. See
• Click the
• Click the
• Click the
The bandwidth management component also allows you to view traffic analysis in different directions.
Usually, there are the internal network and the external network, and security devices such as UTM
devices reside between the two networks. The term upstream refers to the direction from the internal
network to the external network, the term downstream refers to the direction from the external network to
the internal network, and the term bidirectional refers to both the upstream and downstream directions.
icon to display the top users' traffic report. See “Top users' traffic statistics.”
icon to display the service traffic distribution. See “Service traffic distribution.”
icon to export reports.
Level-1 service traffic statistics
The level-1 service traffic statistics report page is divided into three areas:
• The upper area displays service traffic trend graphs for the upstream, downstream, and streams of
both directions.
• The middle area lists the service traffic summary, and you can click a service type link to enter the
level-2 service traffic statistics report page.
• The lower area lists the integral point traffic statistics.
Table 56 for the service traffic statistics query options.
See
Figure 58.
Figure 59.
61
Page 70

Figure 57 Level-1 service traffic statistics report page
Level-2 service traffic statistics
Similarly, the level-2 service traffic statistics report page is also divided into three areas:
62
Page 71

• The upper area displays traffic trend graphs for the upstream, downstream, and streams of both
directions of a service type.
• The middle area lists the service traffic summary, and you can click a service name link to enter the
statistics report page of the specific service.
• The lower area lists the integral point traffic statistics.
See
Table 56 for the service traffic statistics query options.
Figure 58 Level-2 service traffic statistics report page
63
Page 72

Table 56 Query options on the service traffic statistics report pages
Option Description
Device Group Select a device group to collect statistics on its service traffic.
Segment
Duration
Time Specify the statistics time. The value range depends on the value of the Duration option.
Select a segment to collect statistics on the traffic of the segment. A segment represents a
pair of security zones with the traffic direction specified.
Select the statistics duration. You can select Day, Week, or Month, or select Customize to
specify a statistics duration.
Traffic statistics of a specific service
The traffic statistics report page of a specific service is also divided into three areas:
• The upper area displays the traffic trend graph of a specific service, showing the trends for the
upstream, downstream, and streams of both directions.
• The middle area lists the traffic summary of the service.
• The lower area lists the integral point traffic statistics of the service.
Table 57 for the service traffic trend statistics query options.
See
Figure 59 Traffic statistics report page of s specific service
64
Page 73

Table 57 Service traffic trend query options
Option Description
Device Group Select a device group to collect statistics on its service traffic.
Duration
Time Specify the statistics time. The value range depends on the value of the Duration option.
Select the statistics duration. You can select Day, Week, or Month, or select Customize
to specify a statistics duration.
NOTE:
In a trend graph, you can drag your mouse to select a time range to display the traffic statistics reports
during the period of time.
Service traffic distribution
From the navigation tree of the bandwidth management component, select Service Traffic Distribution
under Analysis by Device Group to enter the level-1 service traffic distribution report page, as shown in
Figure 60. On this page, you can do the following:
• Select the link of a service type to display the level-2 service traffic distribution report page, as
shown in
• Click the
• Click the
• Click the
Level-1 service traffic distribution
Figure 61.
icon to display the top users' traffic report. See “Top users' traffic statistics.”
icon to display the service traffic trend. See “Service traffic trend.”
icon to export reports.
The level-1 service traffic distribution report page is divided into two areas:
• The upper area displays the traffic distribution of service types in a pie chart.
• The lower area lists the service traffic summary and you can click a service type link to enter the
level-2 service traffic distribution report page.
65
Page 74

Figure 60 Level-1 service traffic distribution report page
Level-2 service traffic distribution
Similarly, the level-2 service traffic distribution report page is divided into two areas:
• The upper area displays service traffic distribution of services of the same type in a pie chart.
• The lower area lists the service traffic summary.
Table 58 for the service traffic distribution query options.
See
66
Page 75
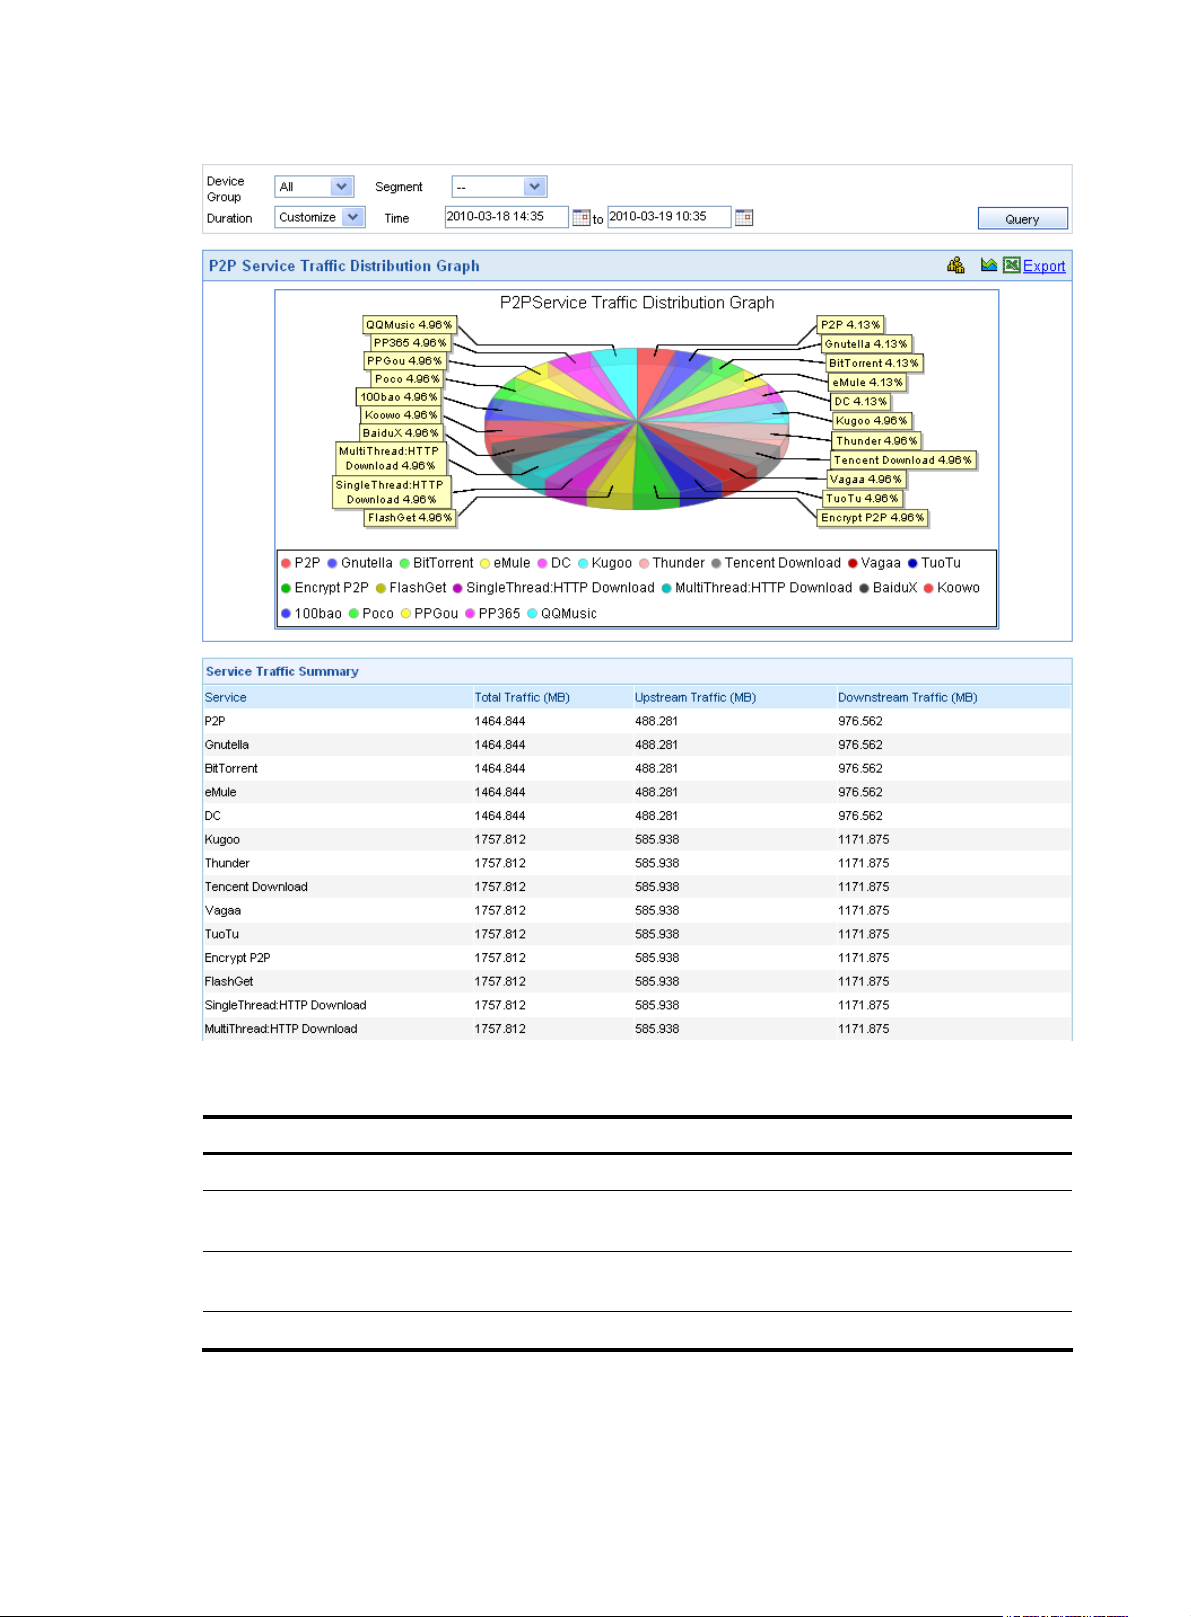
Figure 61 Level-2 service traffic distribution report page
Table 58 Service traffic distribution query options
Option Description
Device Group Select a device group to collect statistics on its traffic.
Segment
Duration
Time Select the statistics time. The value range varies with the statistics duration selected.
Select a segment to collect statistics on the traffic of the segment. A segment represents
a pair of security zones with the traffic direction specified.
Select the statistics duration. You can select Day, Week, or Month, or select Customize
to specify a statistics duration.
67
Page 76

Generic service analysis
From the navigation tree of the bandwidth management component, select Generic Service Analysis
under Analysis by Device Group to enter the generic service analysis report page, as shown in
The page displays the statistics of the top 30 services with unknown service ports. You can click the
icon to export the reports.
The generic service analysis report page is divided into two areas:
• The upper area displays the statistics in a bar chart.
• The lower area lists the summary.
Table 59 for the generic service analysis query options.
See
Figure 62 Generic service analysis report page
Figure 62.
Table 59 Generic service analysis query options
Option Description
Direction Select a traffic direction.
Service Type
Time Select the time during which the traffic occurred.
Select a service type.
By default, the value of this option is --, which means all types.
68
Page 77

Service traffic analysis by user
Top users' traffic statistics
From the navigation tree of the bandwidth management component, select Top Users' Traffic List under
Analysis by User to enter the top users' traffic report page, as shown in
top users' traffic statistics in descending order in both a bar chart and a list. The list details the upstream,
downstream, and total traffic statistics. On this page, you can do the following:
Figure 63. The page displays the
• Click the
single user.”
• Click the
distribution of a single user.”
• Click the
See
Table 60 for the top users' traffic statistics query options.
icon to display the service traffic trend of a single user. See “Service traffic trend of a
icon to display the service traffic distribution of a single user. See “Service traffic
icon to export reports.
69
Page 78

Figure 63 Top users' traffic report page
Table 60 Top users' traffic statistics query options
Option Description
Device Group Select a device group to collect statistics on its traffic.
Service Select a service name.
Direction Select a traffic direction.
Duration
Time Select the statistics time. The value range varies with the statistics duration selected.
Select the statistics duration. You can select Day, Week, or Month, or select Customize
to specify a statistics duration.
70
Page 79

Realtime traffic monitoring of a single user
To moni tor t he t raffic of sing le user in real ti me, sele ct Realtime Traffic Monitoring under Analysis by User
from the navigation tree of the bandwidth management component, as shown in
describes the realtime traffic monitoring query options.
users list. On this page, you can do the following:
Table 62 describes the fields of the monitored
Figure 64. Table 61
• Click Add to add users to the monitored users list. See
Figure 65 and Table 63.
• Select users and click Delete to remove the users from the monitored list.
Figure 64 Realtime traffic monitoring of a single user
Table 61 Realtime traffic monitoring query options
Option Description
Device Group Select the device group to which the user or users belong.
User IP Enter the IP address of the user of interest.
Time
Select a duration to view the realtime traffic statistics in the last one hour, 30
minutes, or 15 minutes.
Table 62 Fields of the monitored users list
Field Description
Device Group Device group to which the user belongs
Monitored IP IP address of the user
Current Upstream BW Current upstream bandwidth of the user, in Mbps
Current Downstream BW Current downstream bandwidth of the user, in Mbps
Current Total BW Current total bandwidth of the user, in Mbps
Details
Click the
icon to monitor the traffic of the user in real time.
71
Page 80

Figure 65 Add users to the monitored users list
Table 63 Configuration items for adding users to the monitored users list
Item Description
Device Group
Segment
Required
Select the device group to which the users belong.
Required
Enter the start and end IP addresses of the users’ network segment.
NOTE:
To place the realtime traffic monitoring configuration into effect, you must select the Enable user
monitoring policy deployment and Enable automatic policy deployment options on the page System
System Config > Service Parameters.
Service traffic trend of a single user
The service statistics trend report collects application statistics of a single user, and displays trend graphs
of different levels.
From the navigation tree of the bandwidth management component, select Service Traffic Trend under
Analysis by User to enter the level-1 service traffic trend report page, as shown in
you can do the following:
• Select the link of a service type in the Service Traffic Summary list to enter the level-2 service traffic
trend report of the service type, as shown in
Figure 67.
>
Figure 66. On this page,
• Further select a service type to enter the traffic statistics report page of the service, as shown in
Figure 68.
• Click the
icon to export reports.
Table 64 describes the service trend query options on the service traffic statistics report pages for a single
user.
Level-1 service traffic statistics of a single user
The report page of level-1 service traffic statistics for a single user is divided into three areas:
• The upper area displays the service traffic trend graphs for the upstream, downstream, and streams
of both directions.
• The middle area lists the service traffic summary, and you can click a service type link to enter the
level-2 service traffic statistics report page of the service type.
• The lower area lists the integral point traffic statistics.
72
Page 81

Figure 66 Level-1 service traffic statistics of a single user
Level-2 service traffic statistics of a single user
Similarly, the report page of level-2 service traffic statistics for a single user is divided into three areas:
• The upper area displays the traffic trend graphs for the upstream, downstream, and streams of both
directions of a service type.
73
Page 82

• The middle area lists the service traffic summary, and you can click a service name link to enter the
service statistics report page of the service.
• The lower area lists the integral point traffic statistics.
Figure 67 Level-2 service traffic statistics of a user
74
Page 83

Traffic statistics of a specific service for a single user
The traffic statistic report page of a specific service for a single user is also divided into three areas:
• The upper area displays the traffic trend of a specific service of a user for the upstream, downstream,
and streams of both directions in a line chart.
• The middle area lists the service traffic summary.
• The lower area lists the integral point traffic statistics.
Figure 68 Traffic statistics of a specific service for a single user
Table 64 Service trend query options on the service traffic statistics report page for a single user
Option Description
User Specify a user to collect the service traffic statistics of the user.
Duration
Time Select the statistics time. The value range varies with the statistics duration selected.
Select the statistics duration. You can select Day, Week, or Month, or select
Customize to specify a statistics duration.
Service traffic distribution of a single user
From the navigation tree of the bandwidth management component, select Service Traffic Distribution
under Analysis by User to enter the level-1 service traffic distribution report page for a single user, as
shown in
• Click a service type to enter the level-2 service traffic distribution report page, as shown in
Figure 69. On this page, you can do the following:
70.
75
Figure
Page 84

• Click the icon to export reports.
Table 65 describes the service distribution query options on the service traffic distribution report page for
a single user.
Level-1 service traffic distribution of a single user
The report page of the level-1 service traffic distribution for a single user is divided into two areas:
• The upper area displays the traffic distribution of service types in a pie chart.
• The low area lists the service traffic summary, and you can click a service type link to enter the
report page of the level-2 service traffic distribution.
Figure 69 Level-1 service traffic distribution of a single user
Level-2 service traffic distribution of a single user
Similarly, the report page of the level-2 service traffic distribution for a single user is divided into two
areas:
• The upper area displays the traffic distribution of services of the same type in a pie chart.
• The lower area lists the service traffic summary.
76
Page 85

Figure 70 Level-2 service traffic distribution of a single user
Table 65 Service traffic distribution query options on the distribution report page for a single user
Option Description
User Specify a user to collect the service traffic statistics of the user.
Duration
Time Select the statistics time. The value range varies with the statistics duration selected.
Select the statistics duration. You can select Day, Week, or Month, or select Customize to
specify a statistics duration.
Detailed session statistics
The detailed session statistics page displays detailed network usage information in the past hour.
Exporting of reports is supported.
Configuration guide
From the navigation tree of the bandwidth management component, select Detailed Session Statistics
under Analysis by User to enter the detailed session statistics report page, as shown in
66 describes the detailed session statistics query options.
session statistics list.
Figure 71. Table
Table 67 describes the fields in the detailed
Figure 71 Detailed session statistics report page
77
Page 86

Table 66 Detailed session statistics query options
Option Description
Source IP Specify a source IP address.
Destination IP Specify a destination IP address.
Service name
Source Port Specify a source port.
Destination Port Specify a destination port.
Start Time
End Time
Select a service name.
By default, the value of this option is --, which means all services.
Specify a time range.
Table 67 Fields of the detailed session statistics list
Field Description
Source IP:Port Source IP port of the session
Destination IP:Port Destination IP port of the session
Service Name Network service used in the session
Traffic Traffic that occurred during the session
Session Start Time Start time of the session
Session End Time End time of the session
Service traffic analysis by IP group
Traffic can be collected and analyzed by IP group. You can add IP addresses that you are interested in
to an IP group and make the system provide traffic analysis for the group.
Managing IP groups
Configuration guide
From the navigation tree of the bandwidth management component, select IP Groups under Analysis by
IP Group to enter the IP group management page, as shown in
groups.
Table 68 describes the IP group management functions.
Figure 72 IP group management page
Figure 72. The page lists details of all IP
78
Page 87

Table 68 IP group management functions
Function Description
IP group list Allows you to view details of all IP groups.
Adding an IP group Allows you to add an IP group.
Allows you to delete IP groups.
Follow these steps:
Deleting IP groups
Adding IP addresses to an IP group Allows you to add an IP address to an IP group.
Deleting IP addresses from an IP
group
1. Select the check boxes before the IP groups that you want to delete in
the IP group list.
2. Click Delete.
Allows you to delete IP addresses from an IP group.
Follow these steps:
1. Select the check boxes before the IP addresses that you want to delete
in the IP address list of an IP group.
2. Click Delete.
IMPORTANT:
Perform this operation on the IP address management page, which you
enter by clicking the icon of an IP group in the IP group list.
IP group list
From the navigation tree of the bandwidth management component, select IP Groups under Analysis by
IP Group to enter the IP group management page, as shown in
groups.
Table 69 Fields of the IP group list
Field Description
Group Name Name of the IP group
Description Description of the IP group
In the IP group list, you can:
• Click the
• Click the
• Click the
• Click the
Table 69 describes the fields of the IP group list.
icon of an IP group to enter the realtime traffic monitoring report page for the IP group.
See “
Realtime traffic snapshots of an IP group .”
icon of an IP group to enter the service traffic trend report page for the IP group. See
“
Service traffic trend of an IP group.”
icon of an IP group to enter the service traffic distribution report page for the IP group.
See “
Service traffic distribution of an IP group.”
icon of an IP group to add IP addresses to the IP group. See “Adding IP addresses to
an IP group.”
Figure 72. The page lists details of all IP
Return to
IP group management functions.
79
Page 88

Adding an IP group
From the navigation tree of the bandwidth management component, select IP Groups under Analysis by
IP Group to enter the IP group management page. On the page, click Add to enter the page for adding
an IP Group, as shown in
Figure 73 Add an IP group
Table 70 Configuration items for adding an IP group
Item Description
Group Name
Figure 73. Table 70 describe the configuration items for adding an IP group.
Required
Type the name for the group.
The group name can comprise up to 20 characters and must not contain
these characters: ” < > % & : ; /
Description
Return to IP group management functions.
Adding IP addresses to an IP group
From the navigation tree of the bandwidth management component, select IP Groups under Analysis by
IP Group to enter the IP group management page. On this page, you can do the following:
• Click the
shown in
• Click Add to add IP addresses to the IP group, as shown in
configuration item.
• Select one or more address ranges and click Delete to delete them from the IP group.
Figure 74 IP address management page
icon of an IP group to enter the IP address management page of the IP group, as
Figure 74. Table 71 describes the fields of the IP address management list.
Required
Type the description for the group.
The group description can comprise up to 40 characters.
Figure 75. Table 72 describes the
80
Page 89

Table 71 Fields of the IP address management list
Field Description
Start IP Start IP address of the IP group
End IP End IP address of the IP group
Operation
Click the icon to modify the IP address range
Figure 75 Add IP addresses to an IP group
Table 72 Configuration item for adding IP addresses to an IP group
Item Description
Segment
Required
Type an IP address or a range of IP addresses for the group.
Return to IP group management functions.
Realtime traffic snapshots of an IP group
This function collects statistics on network traffic and displays traffic snapshots of IP groups during the
past hour including traffic trend graphs, pie charts, and optionally statistics lists. These graphs and lists
can help you better understand how the network resources are used. Exporting of reports is supported.
From the navigation tree of the bandwidth management component, select Realtime Traffic Snapshot
under Analysis by IP Group to enter the IP group realtime traffic snapshot report page, as shown in
76. The page displays snapshots of an IP group about the traffic occurred during the past hour.
Figure
Table 73
describes the realtime traffic snapshots query options.
81
Page 90

Figure 76 Realtime traffic snapshots of an IP group
Table 73 Realtime traffic snapshots query options
option Description
IP Group Select an IP group to collect statistics of the group.
Service Select a service.
Direction Select a traffic direction.
Top Users Select a value to specify of top ranking users concerned
Lists Select this check box to display detailed information lists under the graphs.
Service traffic trend of an IP group
This function collects application statistics of an IP group, and displays trend graphs of different levels.
From the navigation tree of the bandwidth management component, select Service Traffic Trend under
Analysis by IP Group to enter the level-1 service traffic trend report page, as shown in
page, you can do the following:
• Click a service type link to enter the level-2 service traffic trend report of the service type, as shown
in
Figure 78.
• Further click the link of a service name to enter the traffic trend report page of the service, as shown
Figure 79.
in
Figure 77. On this
• Click the
icon to display the service traffic distribution. See “Service traffic distribution of an IP
group.”
• Click the
icon to export reports.
Level-1 service traffic statistics of an IP group
The level-1 service traffic statistics report of an IP group is divided into three areas:
82
Page 91

• The upper area displays service traffic trend graphs for the upstream, downstream, and streams of
both directions.
• The middle area lists the service traffic summary, and you can click a service type link to enter the
level-2 service traffic statistics report page.
• The lower area lists the integral point traffic statistics.
Table 74 describes the service traffic trend query options on the traffic trend report page for an IP group.
Figure 77 Level-1 service traffic statistics of an IP group
83
Page 92

Level-2 service traffic statistics of an IP group
Similarly, the level-2 service traffic statistics report of an IP group is also divided into three areas:
• The upper area displays traffic trend graphs for the upstream, downstream, and streams of both
directions of a service type.
• The middle area lists the service traffic summary, and you can click a service name link to enter the
statistics report page of the specific service.
• The lower area lists the integral point traffic statistics.
Table 74 describes the service traffic trend query options on the traffic trend report page for an IP group.
Figure 78 Level-2 service traffic statistics of an IP group
84
Page 93

Traffic statistics of a specific service for an IP group
The traffic statistics report of a specific service for an IP group is also divided into three areas:
• The upper area displays traffic trend graph of a specific service, showing the trends for the upstream,
downstream, and streams of both directions in a line chart.
• The middle area lists the traffic summary of the service.
• The lower area lists the integral point traffic statistics of the service.
Table 74 describes the service traffic trend query options on the traffic trend report page for an IP group.
Figure 79 Traffic statistics of a specific service for an IP group
Table 74 Service traffic trend query options on the traffic trend repot page for an IP group
Option Description
IP Group Select an IP group
Duration
Time Select the statistics time. The value range varies with the statistics duration selected.
Select the statistics duration. You can select Day, Week, or Month, or select Customize
to specify a statistics duration.
Service traffic distribution of an IP group
This function collects traffic statistics of an IP group, and displays distribution graphs of different levels.
From the navigation tree of the bandwidth management component, select Service Traffic Distribution
under Analysis by IP Group to enter the level-1 service traffic distribution report page, as shown in
80. On this page, you can do the following:
85
Figure
Page 94
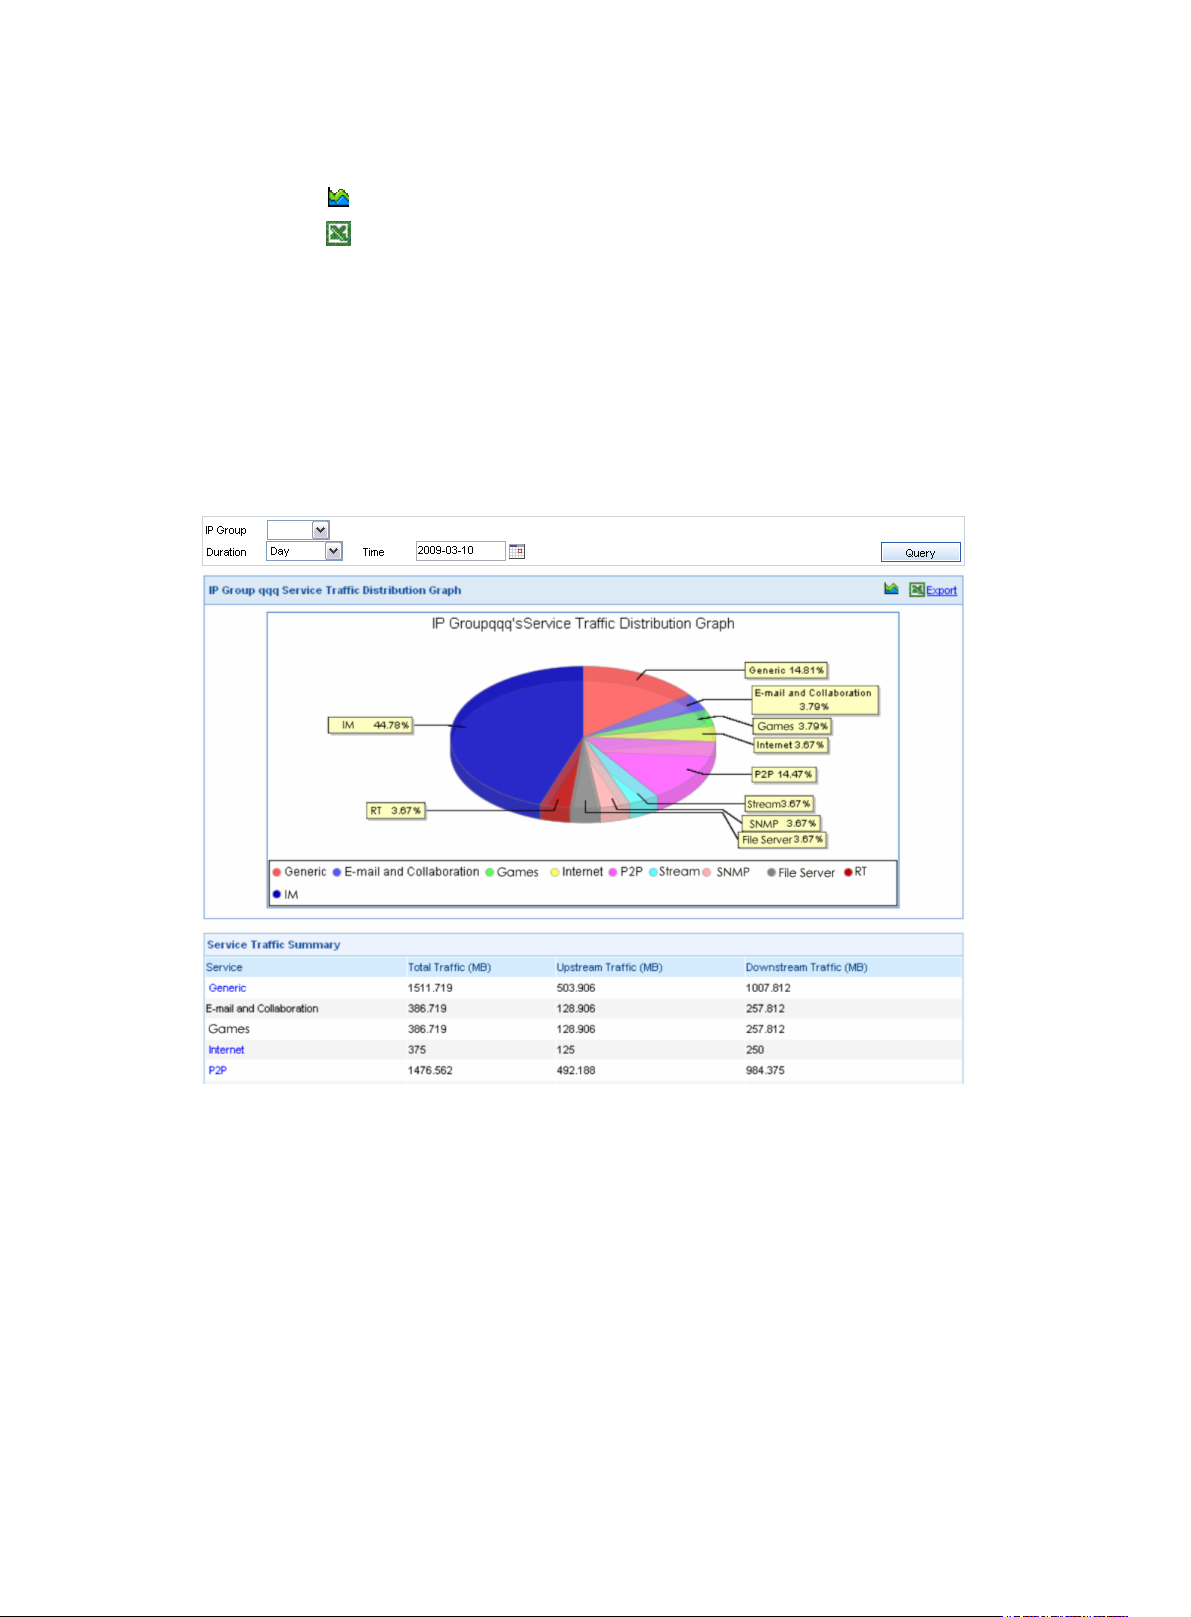
• Click a service type link to enter the level-2 service traffic distribution report of the IP group, as
shown in
Figure 81.
• Click the
• Click the
icon to display the service traffic trend. See “Service traffic trend of an IP group.”
icon to export reports.
Level-1 service traffic distribution of an IP group
The level-1 service traffic distribution report of an IP group is divided into two areas:
• The upper area displays the traffic distribution of service types in a pie chart.
• The lower area lists the service traffic summary, and you can click the service name link to enter the
level-2 service traffic distribution report page.
Table 75 describes the traffic distribution query options.
Figure 80 Level-1 service traffic distribution of an IP group
Level-2 service traffic distribution of an IP group
Similarly, the level-2 service traffic distribution report of an IP group is divided into two areas:
• The upper area displays the traffic distribution of services of the same type in a pie chart.
• The lower area lists the service traffic summary.
Table 75 describes the traffic distribution query options.
86
Page 95

Figure 81 Level-2 service traffic distribution of an IP group
Table 75 Traffic distribution query options
Option Description
IP Group Specify an IP group to collect the service traffic statistics of the group.
Duration
Time Select the statistics time. The value range varies with the statistics duration selected.
Select the statistics duration. You can select Day, Week, or Month, or select Customize to
specify a statistics duration.
Traffic statistics of top users in an IP group
Traffic statistics of top users in an IP group collects traffic statistics of all users in a specified IP group and
displays the top users' traffic statistics in descending order in both a bar chart and a list.
The list details the upstream, downstream, and total traffic statistics. Exporting of reports is supported.
Table 76 describes the top users' traffic statistics query options.
By default, the system displays no data. You need to select an IP group first and then the system will
display the traffic statistics of the top users in the IP group.
87
Page 96

Figure 82 Traffic statistics of top users in an IP group
Table 76 Top users' traffic statistics query options
Option Description
Direction Select a traffic direction.
IP Group Select an IP group to display its top users’ traffic statistics
Service Select a service name.
Device Group Select the device group the traffic of interest belongs to.
Duration
Time Select the statistics time. The value range varies with the statistics duration selected.
Select the statistics duration. You can select Day, Week, or Month, or select
Customize to specify a statistics duration.
88
Page 97

g
g
Behavior auditing
The behavior auditing component analyzes audit logs received from managed devices, allowing you to
audit terminal user behaviors precisely based on enormous logs. You can audit user behaviors such as
which websites and when the user visits, which protocols are used, and which files are sent in Emails. The
component also allows you to audit website visits, and file transfer, Email, and instant messaging
applications. It supports using a variety of combinations of query options to track and audit user
behaviors.
To access the behavior auditing component, select the Behavior Auditing tab. Then, you can configure
the functions described in the following sections:
•
User behavior analysis
User behavior auditing
•
Database auditing and analysis
•
URL analysis
•
Audit logs backup
•
User behavior analysis
The user behavior analysis module provides comprehensive website access analysis and Email
application analysis. The statistics information includes top N websites statistics and Email application
statistics. Exporting of reports is supported.
Website analysis
From the navigation tree of the behavior auditing component, select Websites under User Behavior
Analysis. The website analysis report page appears, as shown in
function provides statistics on website visits and visitors, and displays the statistics in bar graphs and lists:
• The website ranking contrast graph displays the websites with the top number of visits in a bar
chart.
• The website ranking list lists the number of visits to each of the top N websites and the visit
percentage.
• The user ranking contrast graph displays the users who pay the most number of visits to the websites
in a bar chart.
• The user ranking list lists the number of visits of the top N users and the visit percentage.
Table 77 describes the website analysis query options.
CAUTION:
The data source of this function is HTTP logs of the mana
is enabled on the devices.
Figure 83. The website analysis
ed devices. Make sure that UTM HTTP loggin
89
Page 98
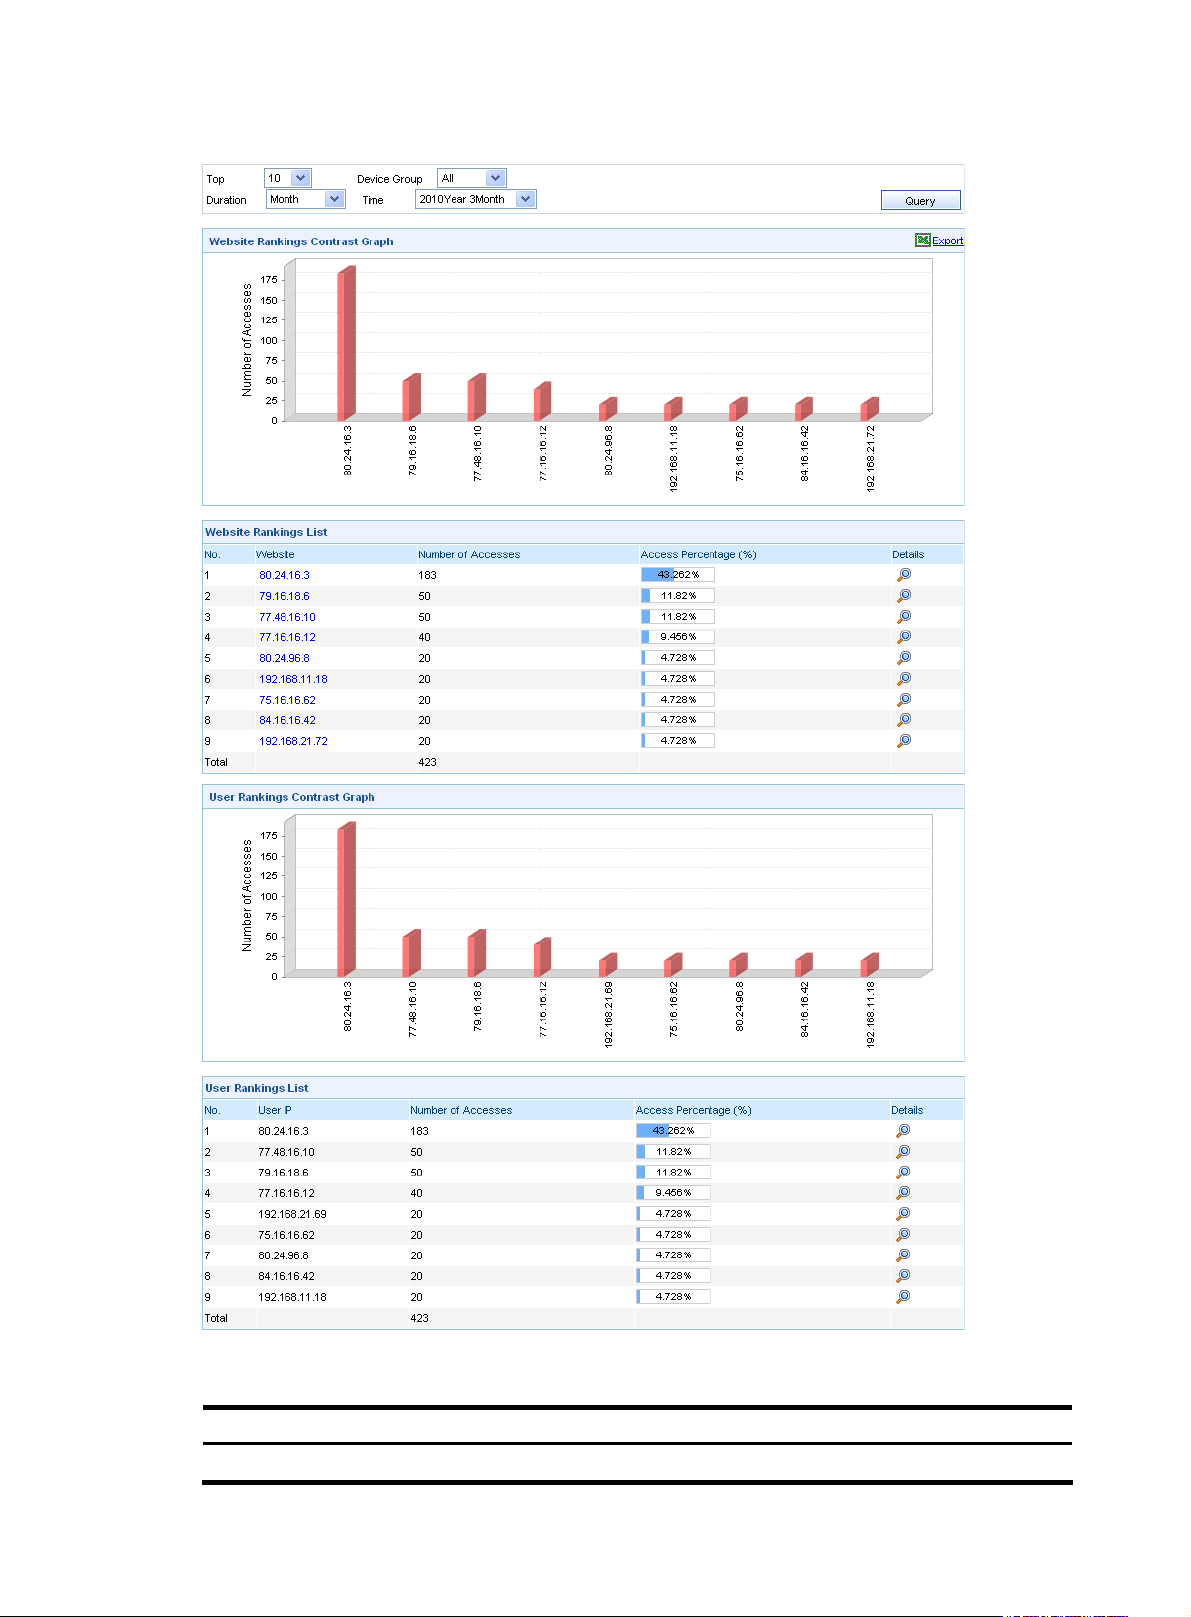
Figure 83 Website analysis
Table 77 Website analysis query options
Option Description
Device Group Select a device group to collect statistics on the traffic of the websites and users.
90
Page 99

Option Description
Duration
Time Select the statistics time. The value range varies with the statistics duration selected.
Top Select the number of websites or users to be involved in the analysis.
Select the statistics duration. You can select Day, Week, or Month, or select
Customize to specify a statistics duration.
In the website ranking list or the user ranking list, you can click the icon of an entry to enter the web
application auditing page. See “
Web application auditing.”
Email application analysis
From the navigation tree of the behavior auditing component, select Email Applications under User
Behavior Analysis to enter the Email application analysis report page, as shown in
displays top senders using SMTP and POP3 in bar chart and tabular form.
application analysis query options.
Figure 84 Email application analysis page
Figure 84. The page
Table 78 describes the Email
91
Page 100

Table 78 Email application analysis query options
Option Description
Device Group Select a device group to collect statistics on the traffic of the sender.
Duration
Time Select the statistics time. The value range varies with the statistics duration selected.
Top Select the number of senders to be involved for the analysis.
Select the statistics duration. You can select Day, Week, or Month, or select
Customize to specify a statistics duration.
User behavior auditing
This module supports the following user behavior auditing functions:
Web application auditing
•
FTP application auditing
•
Email application auditing
•
Instant message application auditing
•
Telnet application auditing
•
SQL application auditing
•
NAT logs auditing
•
Quick auditing
•
User details
•
User behavior alarm
•
You can click the
export reports in HTML format.
CAUTION:
icon on a function’s page to export reports in Excel format, or click the icon to
• The statistics for the auditing of web application, FTP application, Email application, instant message
application, Telnet application, and SQL server application are based on syslogs.
• The receiving port for syslogs defaults to 30514.
Web application auditing
From the navigation tree of the behavior auditing component, select Web Applications under User
Behavior Auditing to enter the web application auditing page. The page lists the website access details,
including the user IP, URL, Keyword, website title, and access time, as shown in
information helps you track user operations and understand user behaviors.
application auditing query options.
Figure 85. The
Table 79 describes the web
92
 Loading...