

Page 1

Hangzhou H3C Technologies Co., Ltd.
http://www.h3c.com
Document version: 5PW101-20110130
H3C SecCenter IPS Manager
Configuration Guide
Page 2

Copyright © 2009-2011, Hangzhou H3C Technologies Co., Ltd. and its licensors
All rights reserved
No part of this manual may be reproduced or transmitted in any form or by any means without prior
written consent of Hangzhou H3C Technologies Co., Ltd.
Trademarks
Notice
H3C,
, Aolynk, , H3Care,
SecPro, SecPoint, SecEngine, SecPath, Comware, Secware, Storware, NQA, VVG, V
, TOP G, , IRF, NetPilot, Neocean, NeoVTL,
2
G, VnG, PSPT,
XGbus, N-Bus, TiGem, InnoVision and HUASAN are trademarks of Hangzhou H3C Technologies Co.,
Ltd.
All other trademarks that may be mentioned in this manual are the property of their respective owners
The information in this document is subject to change without notice. Every effort has been made in the
preparation of this document to ensure accuracy of the contents, but all statements, information, and
recommendations in this document do not constitute the warranty of any kind, express or implied.
Page 3

Preface
The H3C SecCenter IPS Manager Configuration Guide describes Installation and uninstallation, System
management, IPS management and Configuration example, and so on.
This preface includes:
•
Audience
Conventions
•
Obtaining documentation
•
Technical support
•
Documentation feedback
•
Audience
This documentation is intended for:
• Network planners
• Field technical support and servicing engineers
• Network administrators working with the SecCenter IPS Manager
Conventions
This section describes the conventions used in this documentation set.
GUI conventions
Convention Description
Boldface
> Multi-level menus are separated by angle brackets. For example, File > Create > Folder.
Symbols
Convention Description
WARNING
CAUTION
IMPORTANT
NOTE
TIP
Window names, button names, field names, and menu items are in Boldface. For
example, the New User window appears; click OK.
An alert that calls attention to important information that if not understood or followed can
result in personal injury.
An alert that calls attention to important information that if not understood or followed can
result in data loss, data corruption, or damage to hardware or software.
An alert that calls attention to essential information.
An alert that contains additional or supplementary information.
An alert that provides helpful information.
Page 4

Network topology icons
Represents a generic network device, such as a router, switch, or firewall.
Represents a routing-capable device, such as a router or Layer 3 switch.
Represents a generic switch, such as a Layer 2 or Layer 3 switch, or a router that supports
Layer 2 forwarding and other Layer 2 features.
Obtaining documentation
You can access the most up-to-date H3C product documentation on the World Wide Web at
http://www.h3c.com.
Click the links on the top navigation bar to obtain different categories of product documentation:
[Technical Support & Documents > Technical Documents] – Provides hardware installation, software
upgrading, and software feature configuration and maintenance documentation.
[Products & Solutions] – Provides information about products and technologies, as well as solutions.
[Technical Support & Documents > Software Download] – Provides the documentation released with the
software version.
Technical support
customer_service@h3c.com
http://www.h3c.com
Documentation feedback
You can e-mail your comments about product documentation to info@h3c.com.
We appreciate your comments.
Page 5

Contents
Overview ······································································································································································ 1
Introduction to H3C SecCenter IPS Manager ················································································································1
What H3C SecCenter IPS Manager can do··················································································································1
Installation and uninstallation······································································································································ 2
Installing the IPS Manager ···············································································································································2
Registering the IPS Manager ···········································································································································2
Uninstalling the IPS Manager ··········································································································································3
System management···················································································································································· 5
Device management ·························································································································································5
Managing device groups ········································································································································5
Managing device access templates ·······················································································································6
Managing devices····················································································································································9
Managing events··················································································································································· 13
Configuring device interface alarming ··············································································································· 15
Operator management·················································································································································· 16
Managing operators············································································································································· 16
Managing operation logs····································································································································· 18
Changing your login password ··························································································································· 19
System configuration······················································································································································ 20
Configuring service parameters··························································································································· 20
Configuring management ports ··························································································································· 21
Configuring the mail server·································································································································· 22
Configuring SMS alarming ··································································································································24
Managing filters ···················································································································································· 24
Monitoring the disk space ···································································································································· 27
Managing subsystems··········································································································································· 28
IPS management·························································································································································31
Overview········································································································································································· 31
IPS device management ················································································································································ 31
Managing IPS devices ·········································································································································· 31
Managing signature files······································································································································ 34
Displaying device statistics··································································································································· 36
Realtime monitoring ······················································································································································· 37
Displaying event snapshots ·································································································································· 37
Displaying attack/virus/DDoS snapshot list······································································································· 41
Monitoring IPS devices ········································································································································· 43
Event analysis ································································································································································· 43
Displaying attack/virus/DDoS attack event analysis reports ··········································································· 43
Displaying attack event details ···························································································································· 47
Displaying virus event details······························································································································· 50
Displaying DDoS event details····························································································································· 52
Configuring the alarming function······················································································································· 53
Managing report export tasks······························································································································ 56
Policy management························································································································································ 59
Configuring attack protection policies ················································································································ 59
Configuring anti-virus policies······························································································································ 63
Configuring policy applications ·························································································································· 67
i
Page 6

Displaying attack signatures ································································································································ 70
Displaying virus category list ······························································································································· 71
Configuring custom events ··································································································································· 72
Importing and exporting policies························································································································· 80
Configuration example··············································································································································83
Network requirements ···················································································································································83
Adding IPS devices to the IPS Manager ······················································································································ 83
Index ···········································································································································································85
ii
Page 7

Overview
Introduction to H3C SecCenter IPS Manager
H3C SecCenter Intrusion Prevention System (IPS) Manager is a powerful system for comprehensive
analysis and centralized management of IPS devices. It is an important component of the H3C Security
Management Center (SecCenter).
The IPS Manager allows you to manage and control all H3C IPS devices in your network. It features great
scalability, visual realtime event monitoring, comprehensive security event analysis such as attack, DDoS
attack, and virus event analysis, and rich reports, enabling you to learn the network security status at any
time. Together with IPS devices, the IPS Manager provides you with visual, all-around, powerful network
security protection.
What H3C SecCenter IPS Manager can do
As a powerful, efficient IPS device management system, the IPS Manager allows for centralized
management of IPS devices, centralized collection and analysis of security events, and rich security event
statistics reports. From the all-around reports, you can learn the history security status as well as the
security trends of the network easily.
The IPS Manager presents the following key features:
• Visual realtime monitoring, helping you detect network attacks in time.
• Comprehensive analysis and rich statistics reports, reducing your analysis time.
• Fine log auditing, allowing you to track events easily.
• Realtime attack/virus event monitoring, helping you discover security problems in time.
• Centralized, periodic report exporting, releasing you from manual export of reports.
• Centralized configuration of security policies, facilitating security rule configuration, management,
and deployment.
• Centralized upgrade of signature files and license management, ensuring identification of new
attack behaviors.
• Friendly and easy-to-use interface, allowing easy deployment.
1
Page 8
Installation and uninstallation
Installing the IPS Manager
The software and hardware requirements of the IPS Manager are as follows:
• Hardware: P4 2.0 CPU or above, 1.5G memory or more, 80G disk or more.
• Operating system: Windows 2003 Server (recommended) or Windows XP, installed with the
up-to-date patches.
• Browser: IE 6.0 or above
To install H3C SecCenter IPS Manager, you only need to run the executable file install.exe, which is
under the installation directory, and proceed as prompted.
CAUTION:
After finishing installation, you must restart the operating system.
Registering the IPS Manager
In the address bar of the browser, enter http://localhost/ to open the login page. The default login
username and password are admin and admin1 respectively.
NOTE:
The last character of the password is digit 1.
When you log in to the IPS Manager for the first time, you will see the license information page and the
message “You haven’t registered. Please register to use the system normally.” To register the IPS
Manager, follow these steps:
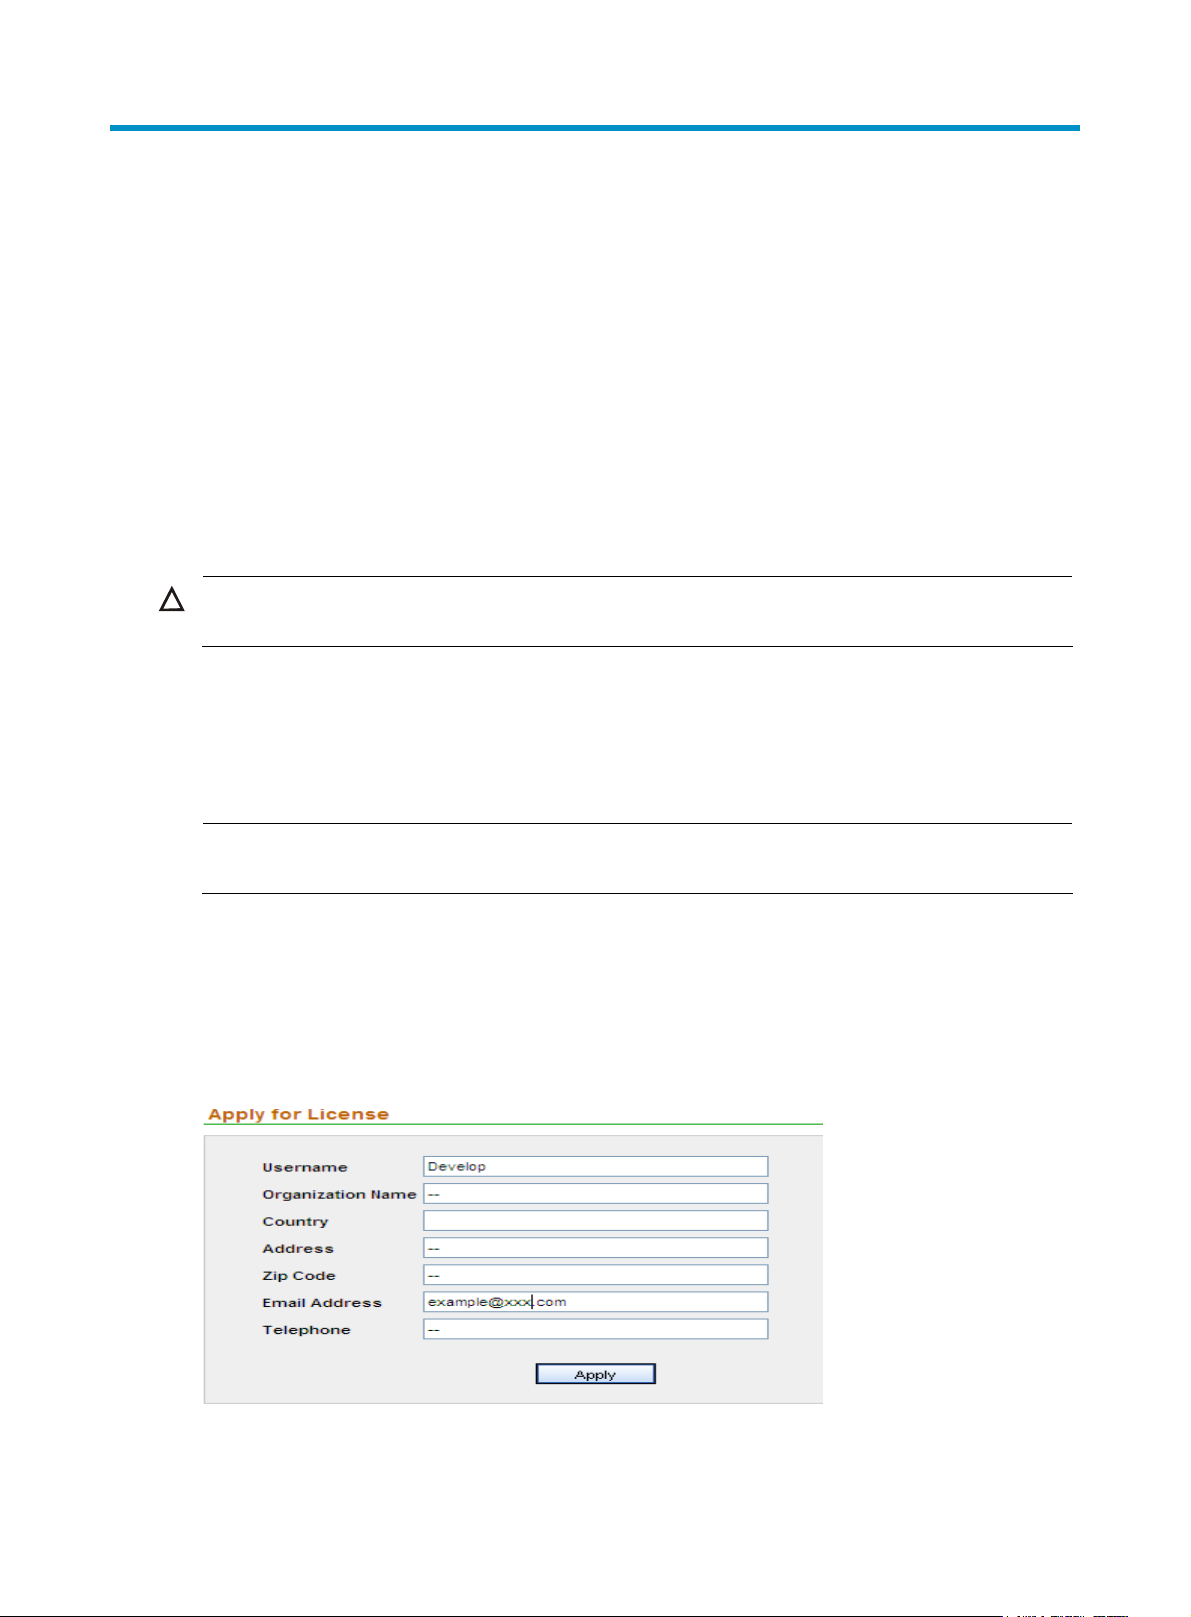
1. From the navigation tree, select License Application under License Management to enter the user
information page, as shown in
Figure 1 Input user information
Figure 1.
2. Type your information as required and click Apply. The following page appears, as shown in
Figure 2.
2
Page 9
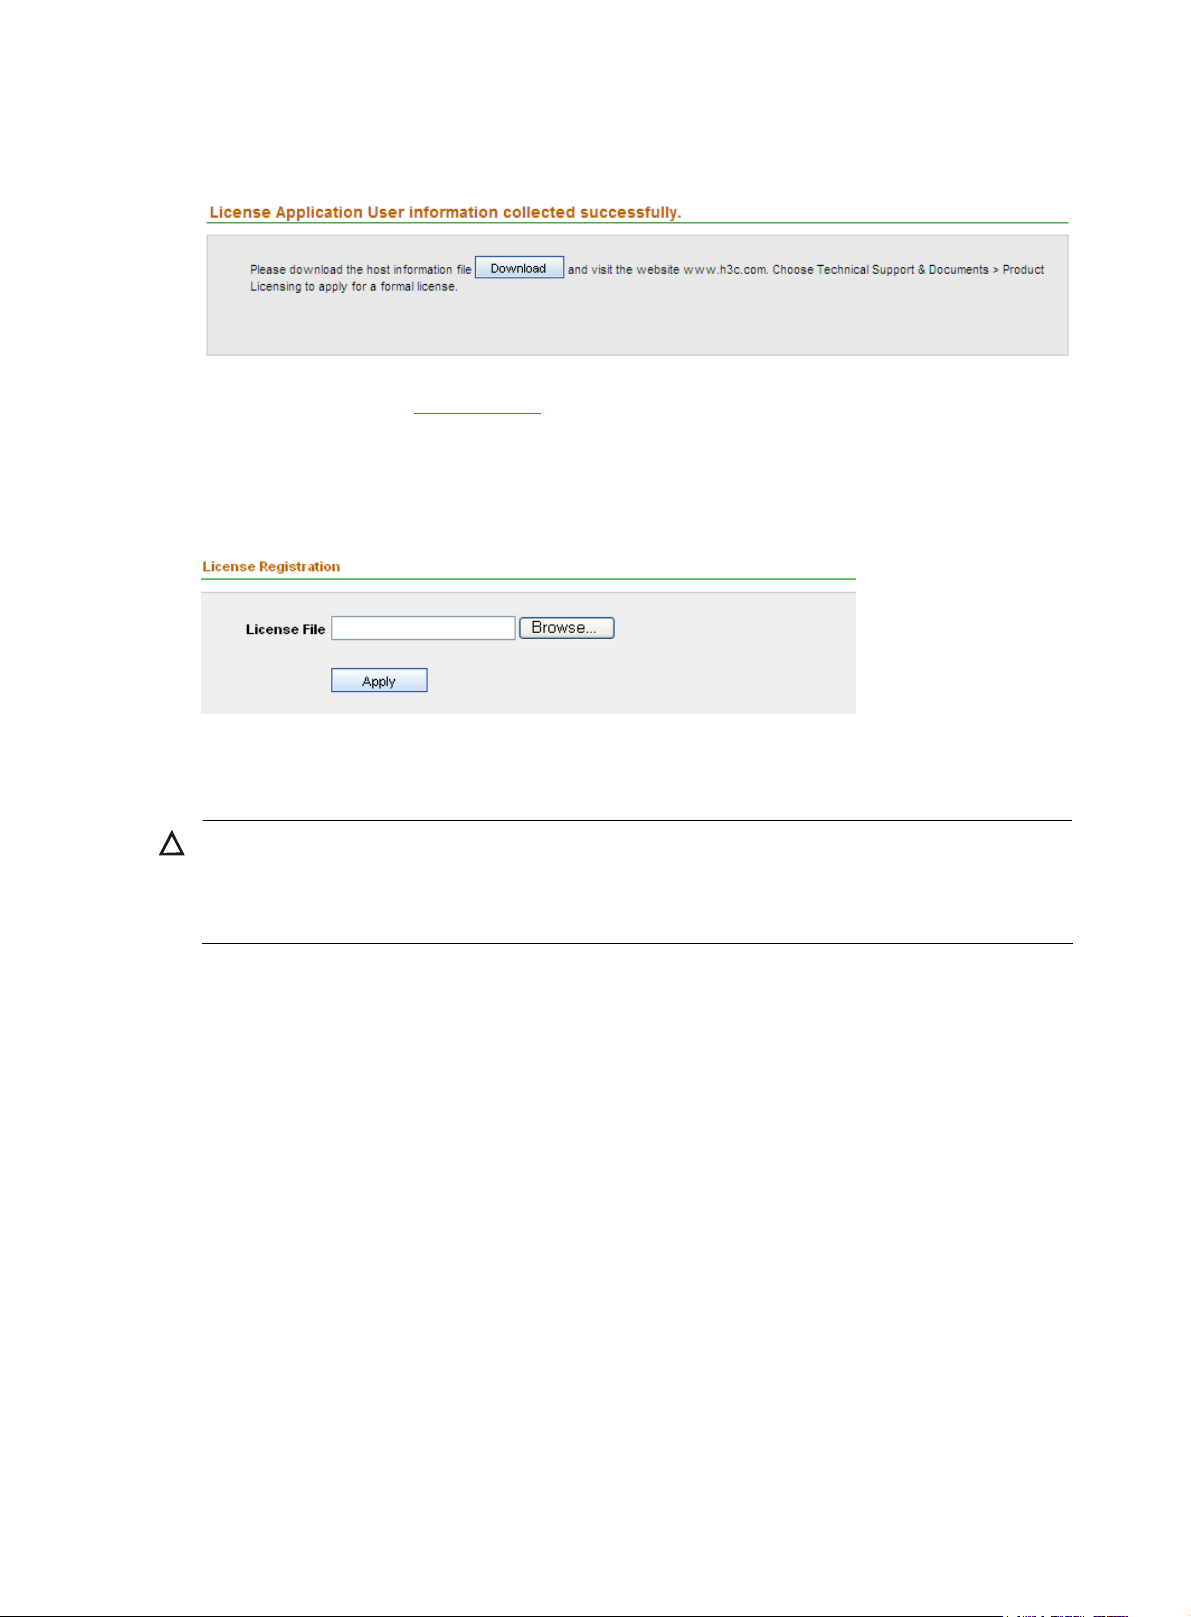
g
3. Click Download to download the host information file, and save it to a file.
Figure 2 Download the host information
4. Visit the website at www.h3c.com, choose Technical Support & Documents > Product Licensing.
Register your product, and obtain an activation file (also called license file) with the suffix lic.
5. From the navigation tree, select License Registration under License Management to enter the
license registration page, as shown in
Figure 3. Select the license file, and then click Apply.
Figure 3 Register your license
After the acknowledgment page appears, you can use the IPS Manager to configure devices and
perform other operations.
CAUTION:
H3C SecCenter IPS Manager is shipped with a trial license file named SecCenter IPS Mana
License.lic. The license is effective within one month. Before you get a formal license, you can register the
trial license.
Uninstalling the IPS Manager
To uninstall H3C SecCenter IPS Manager, follow these steps:
1. On the Windows desktop, click Start and select Programs > SecCenter > Uninstall SecCenter to
enter the page shown in
Files.
2. Click Uninstall. After the uninstallation completes, click Done.
Figure 4. In this example, the IPS manager is installed under C:\Program
er Evaluation
3
Page 10
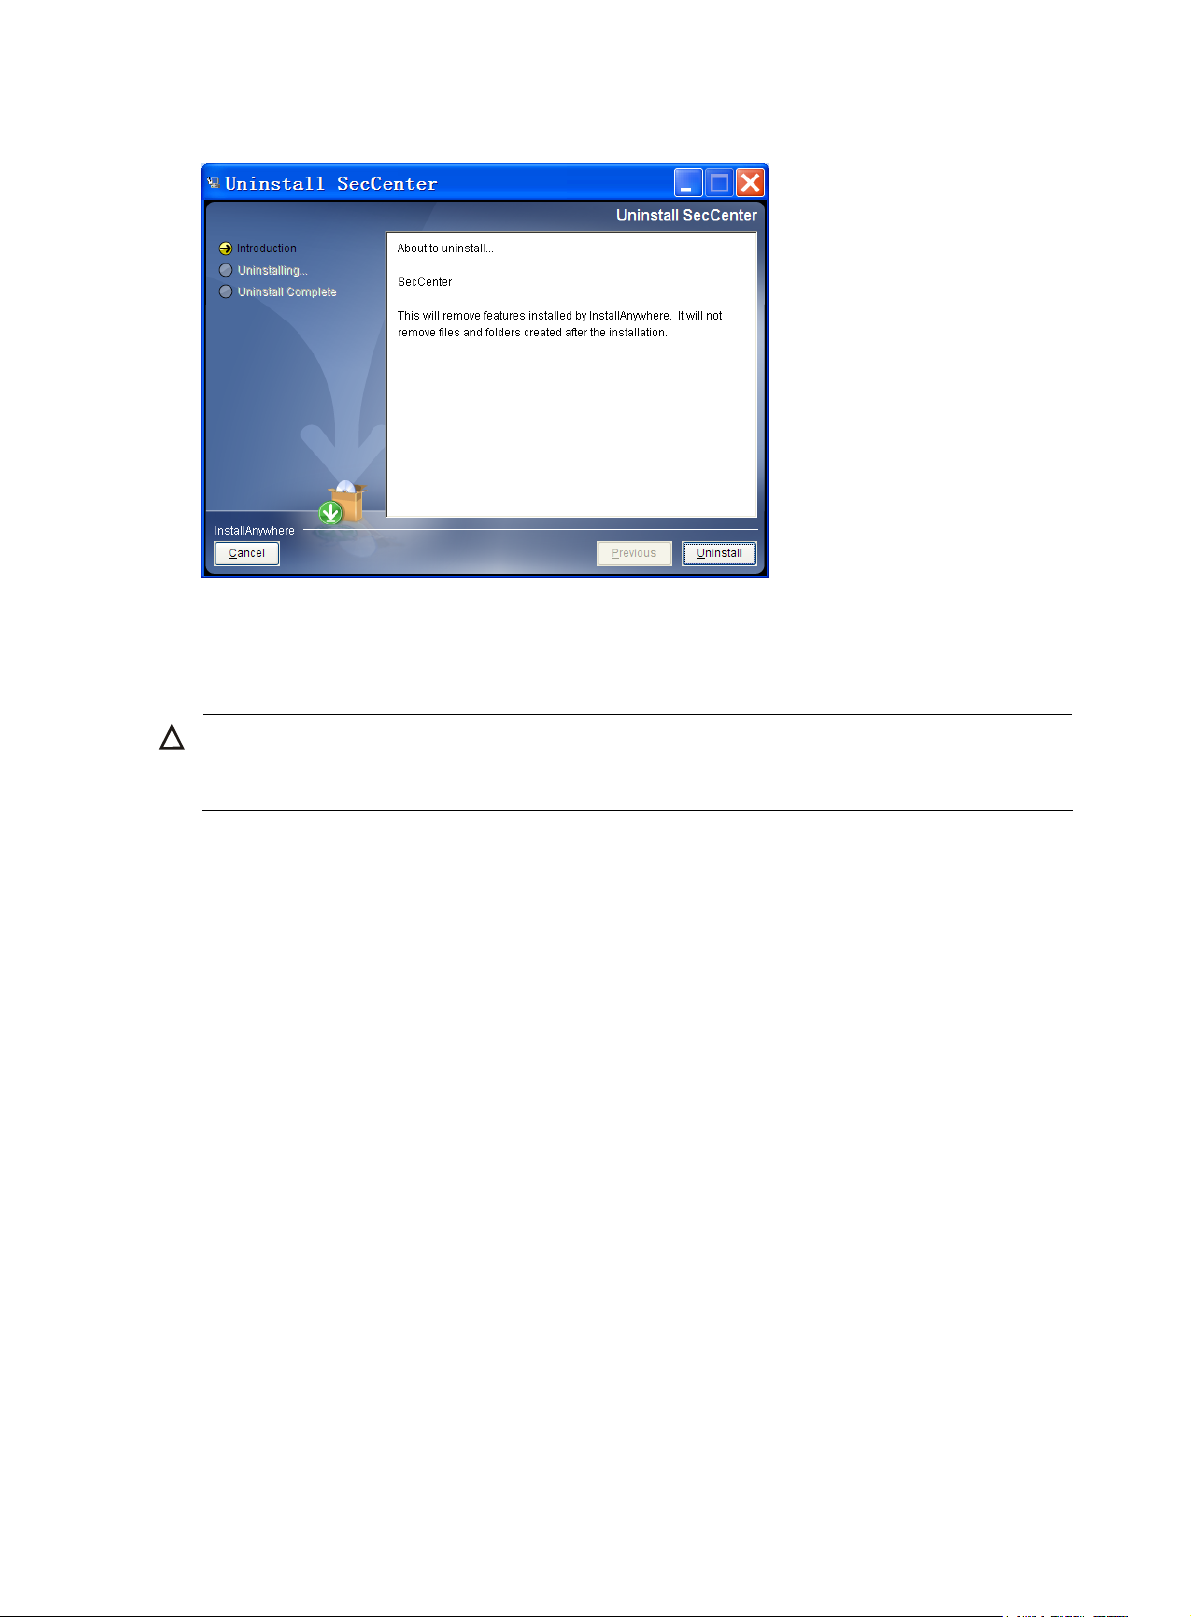
Figure 4 Uninstall the IPS Manager
3. Restart the operating system.
4. Remove all files and subdirectories under the SecCenter installation directory (C:\Program
Files\SecCenter in this example) and the installation directory itself, if any.
CAUTION:
During the uninstallation process, no system data backup operation is performed and all data will also be
removed.
4
Page 11
System management
The system management component of the IPS Manager is mainly used to configure IPS devices to be
managed by the H3C SecCenter.
To access the system management component, select the System Management tab. Then, you can
perform the following tasks:
•
Device management
Operator management
•
System configuration
•
• License management (see "
Registering the IPS Manager")
Device management
Managing device groups
The device group management function allows you to add, modify, and delete device groups. When you
add devices later, you can add devices to device groups so that you can manage and collect statistics on
users, devices, and IP addresses by device group.
Configuration guide
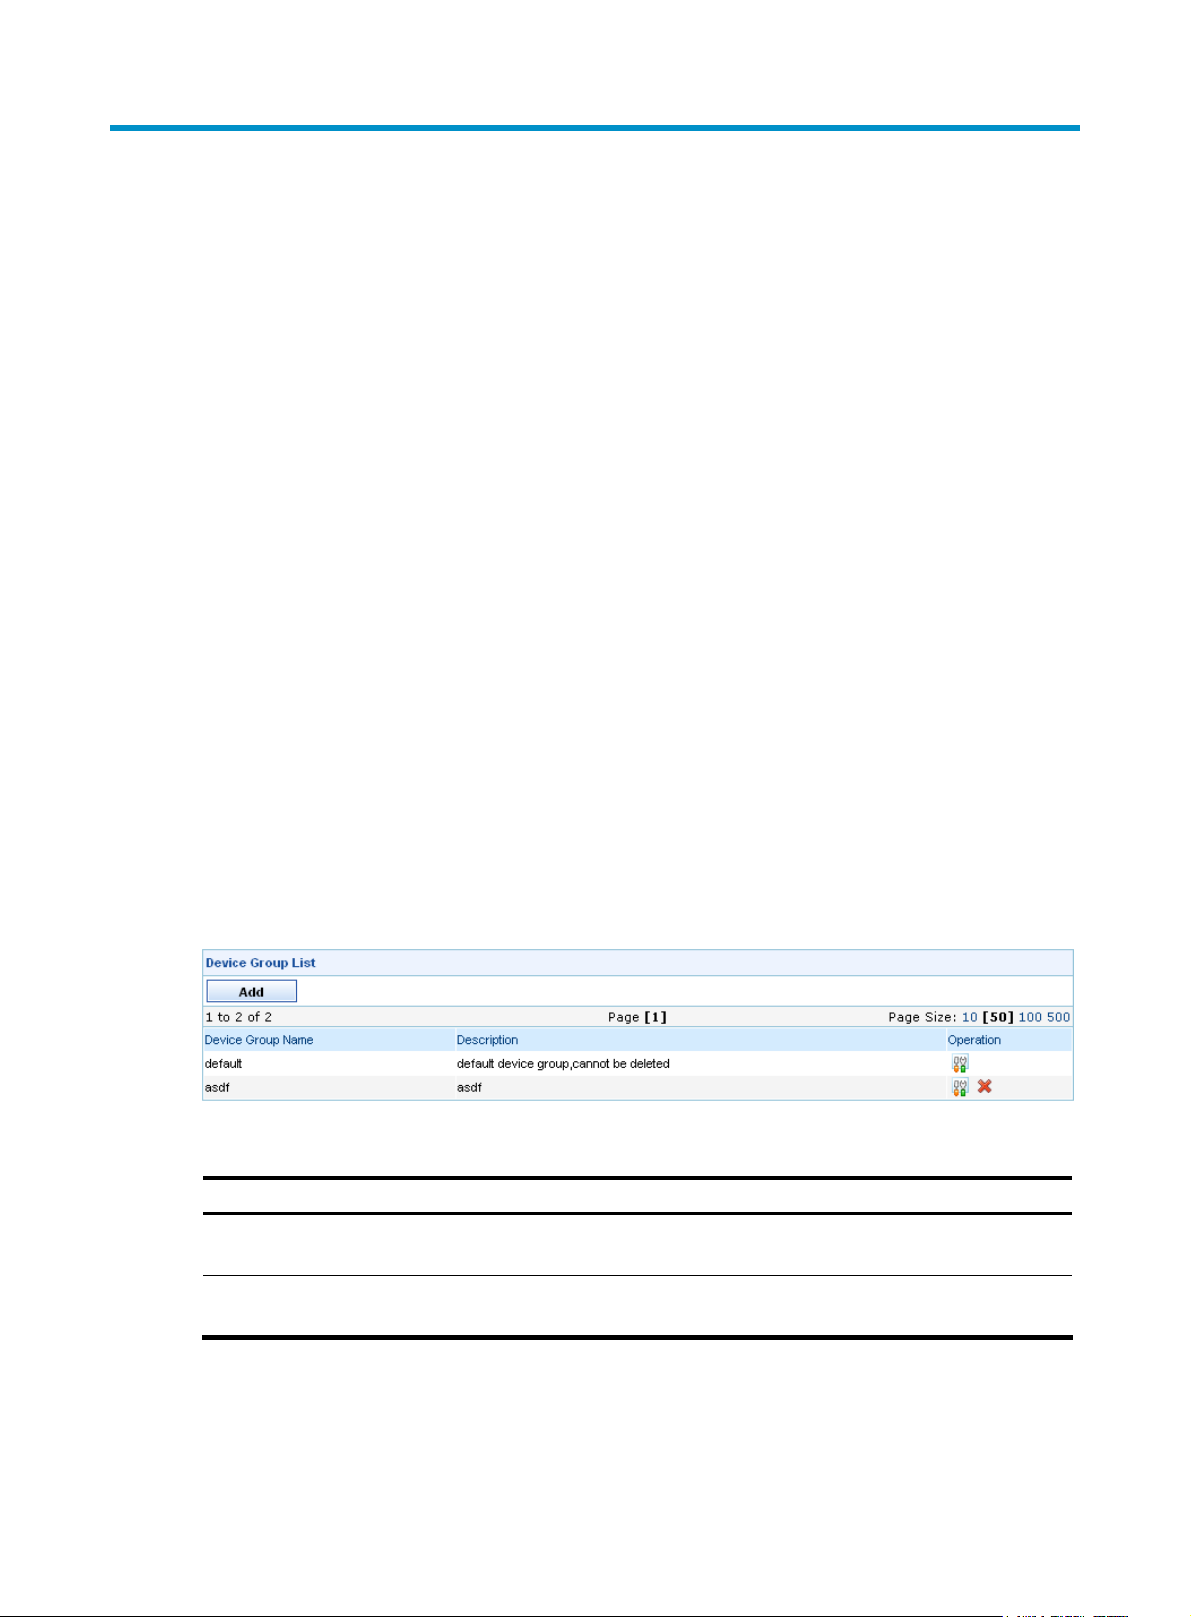
From the navigation tree of the system management component, select Device Group List under Device
Management. The device group management page appears, as shown in
the device group management functions.
Figure 5 Device group management page
Figure 5. Table 1 describes
Table 1 Device group management functions
Function Description
Device group list
Adding a device group
Device group list
From the navigation tree of the system management component, select Device Group List under Device
Management. The device group management page appears, displaying details about all device groups,
as shown in
Allows you to view details about device groups, and modify and delete device
groups.
Allows you to add a device group and configure the device group name and
description.
Figure 5. Table 2 describes the fields of the device group list.
5
Page 12
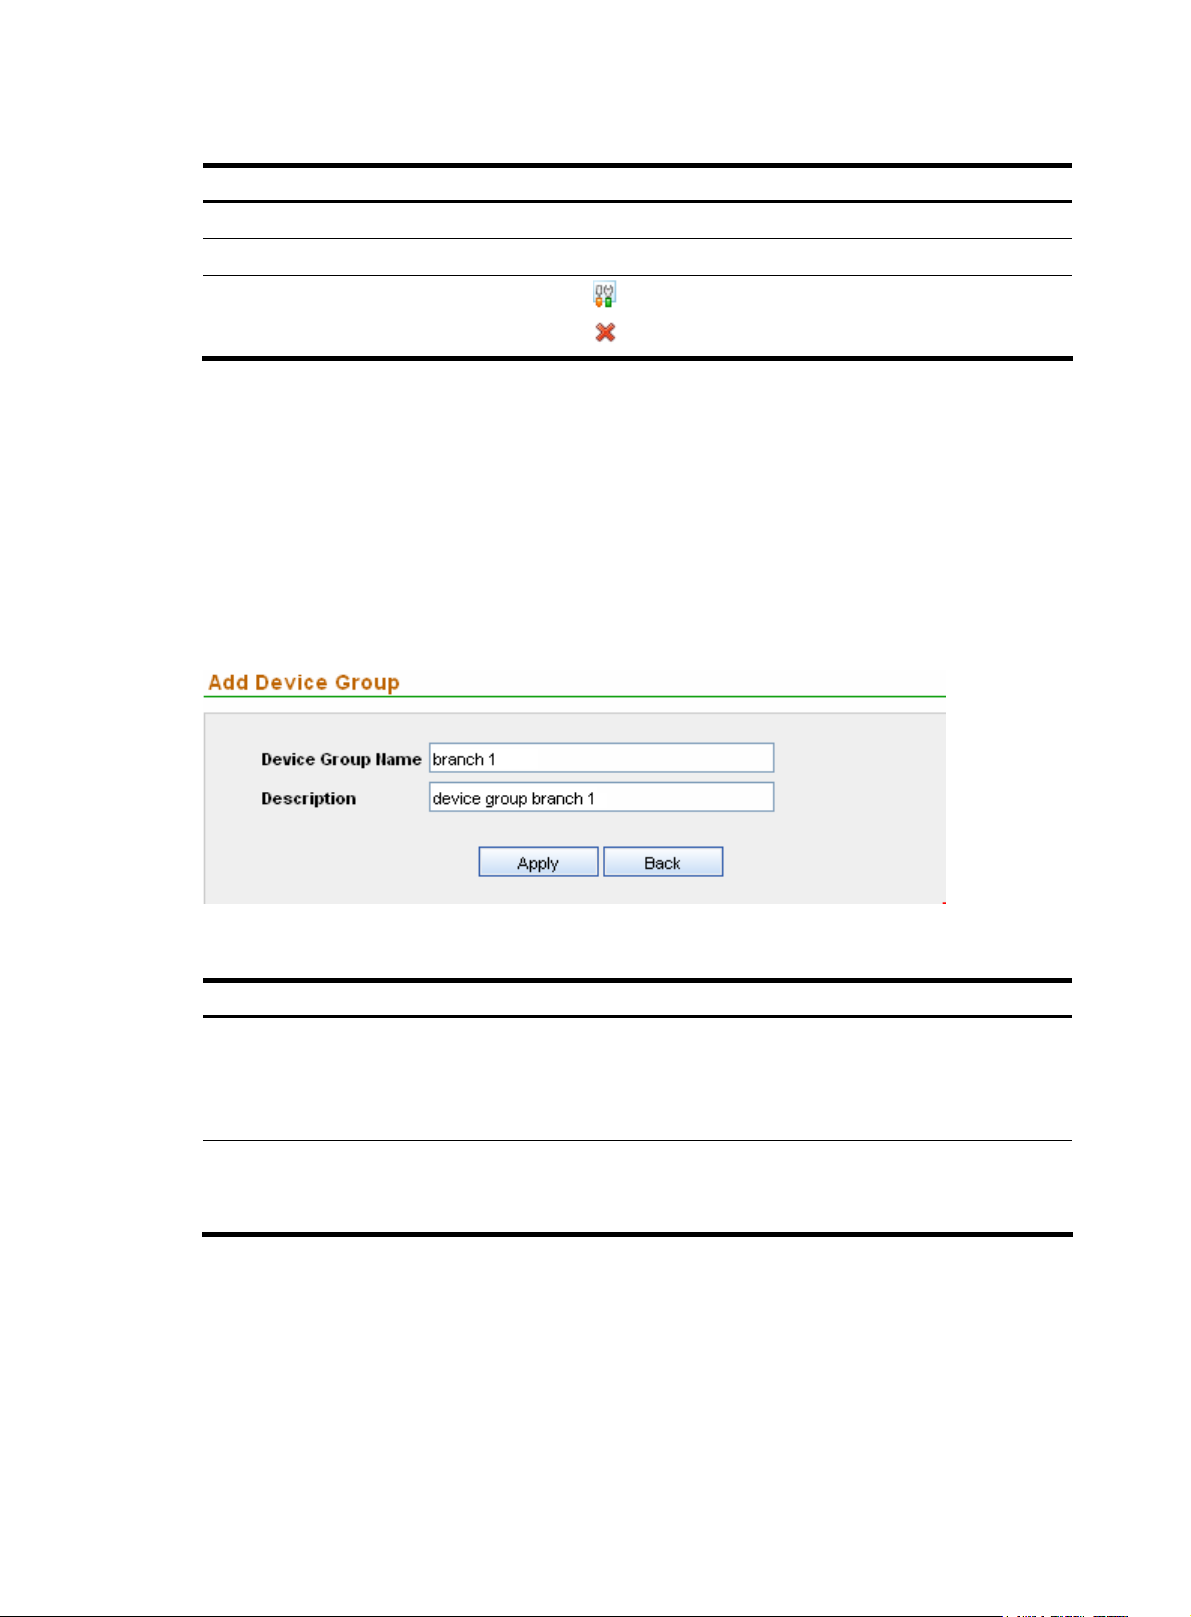
Table 2 Fields of the device group list
Field Description
Device Group Name
Description
Operation
Return to Device group management functions.
Adding a device group
1. From the navigation tree of the system management component, select Device Group List under
Device Management.
2. Click Add to enter the page for adding a device group, as shown in Figure 6.
3. Configure the settings. Table 3 describes the device group configuration items.
4. Click Apply.
Figure 6 Add a device group
Name for the device group
Description of the device group
• Click the icon of a device group to modify the device group.
• Click the icon of a device group to delete the device group.
Table 3 Device group configuration items
Item Description
Required
Device Group Name
Description
Type the name for the device group.
The device group name can comprise up to 100 characters and must not
contain these characters: ”<>’&%:;/
Optional
Type a description for the device group. The description can comprise up
to 100 characters.
Return to Device group management functions.
Managing device access templates
The device access template management function allows you to configure information such as the device
login password.
6
Page 13
Configuration guide
From the navigation tree of the system management component, select Access Template List under Device
Management. The access template management page appears, as shown in
the template management functions.
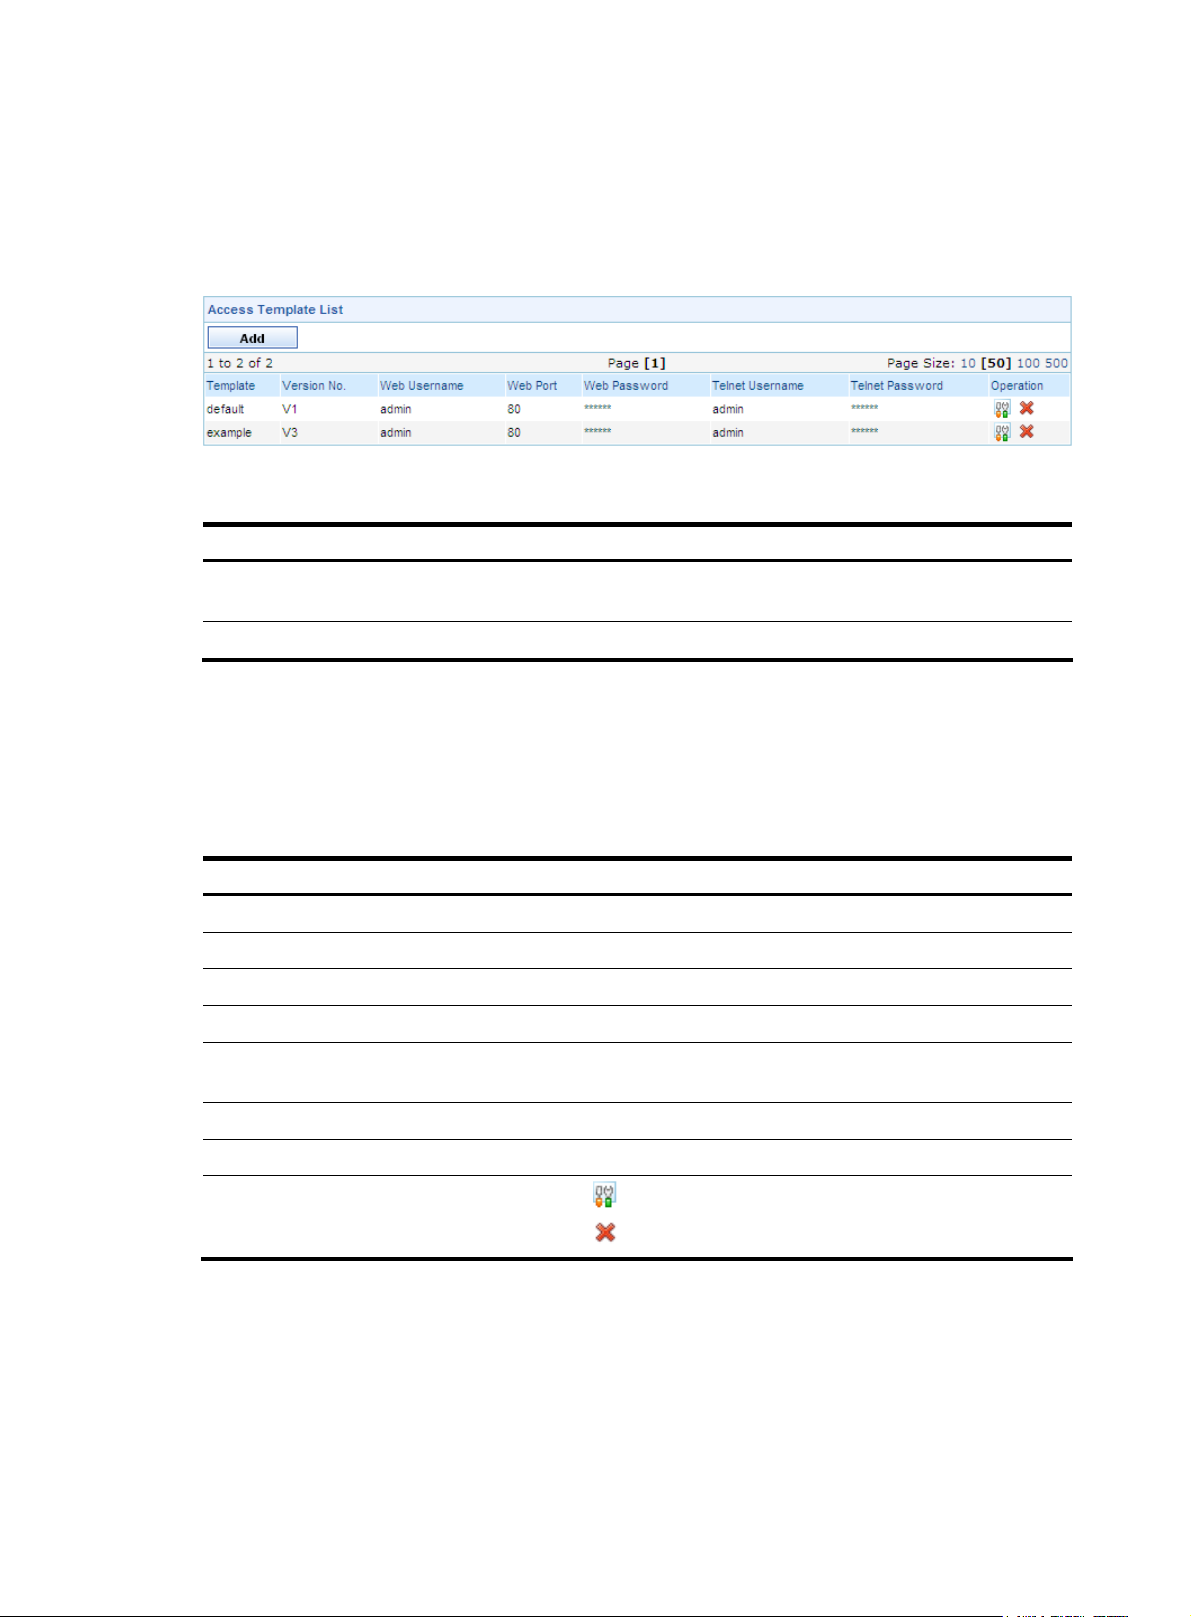
Figure 7 Access template management page
Table 4 Template management functions
Function Description
Figure 7. Table 4 describes
Template list
Adding a template Allows you to add templates.
Template list
From the navigation tree of the system management component, select Access Template List under Device
Management. The access template management page appears, as shown in
access templates are displayed.
Table 5 Fields of the template list
Field Description
Template
Version No. Version of the template
Web Username
Web Port
Web Password
Telnet Username
Telnet Password
Allows you to view details about access templates, and modify and delete
templates.
Figure 7. Details of all
Table 5 describes the fields of the template list.
Name of the template
Username for managing the device through web
Port of the device providing web access service
Password for managing the device through web, displayed as a string of
asterisks (*)
Username for telneting to the device
Password for telneting to the device, displayed as a string of asterisks (*)
Operation
Return to Template management functions.
Adding a template
1. From the navigation tree of the system management component, select Access Template List under
Device Management.
2. Click Add to enter the page for adding a template, as shown in Figure 8.
3. Configure the settings. Table 6 describes the template configuration items.
• Click the icon of a template to modify the template.
• Click the icon of a template to delete the template.
7
Page 14
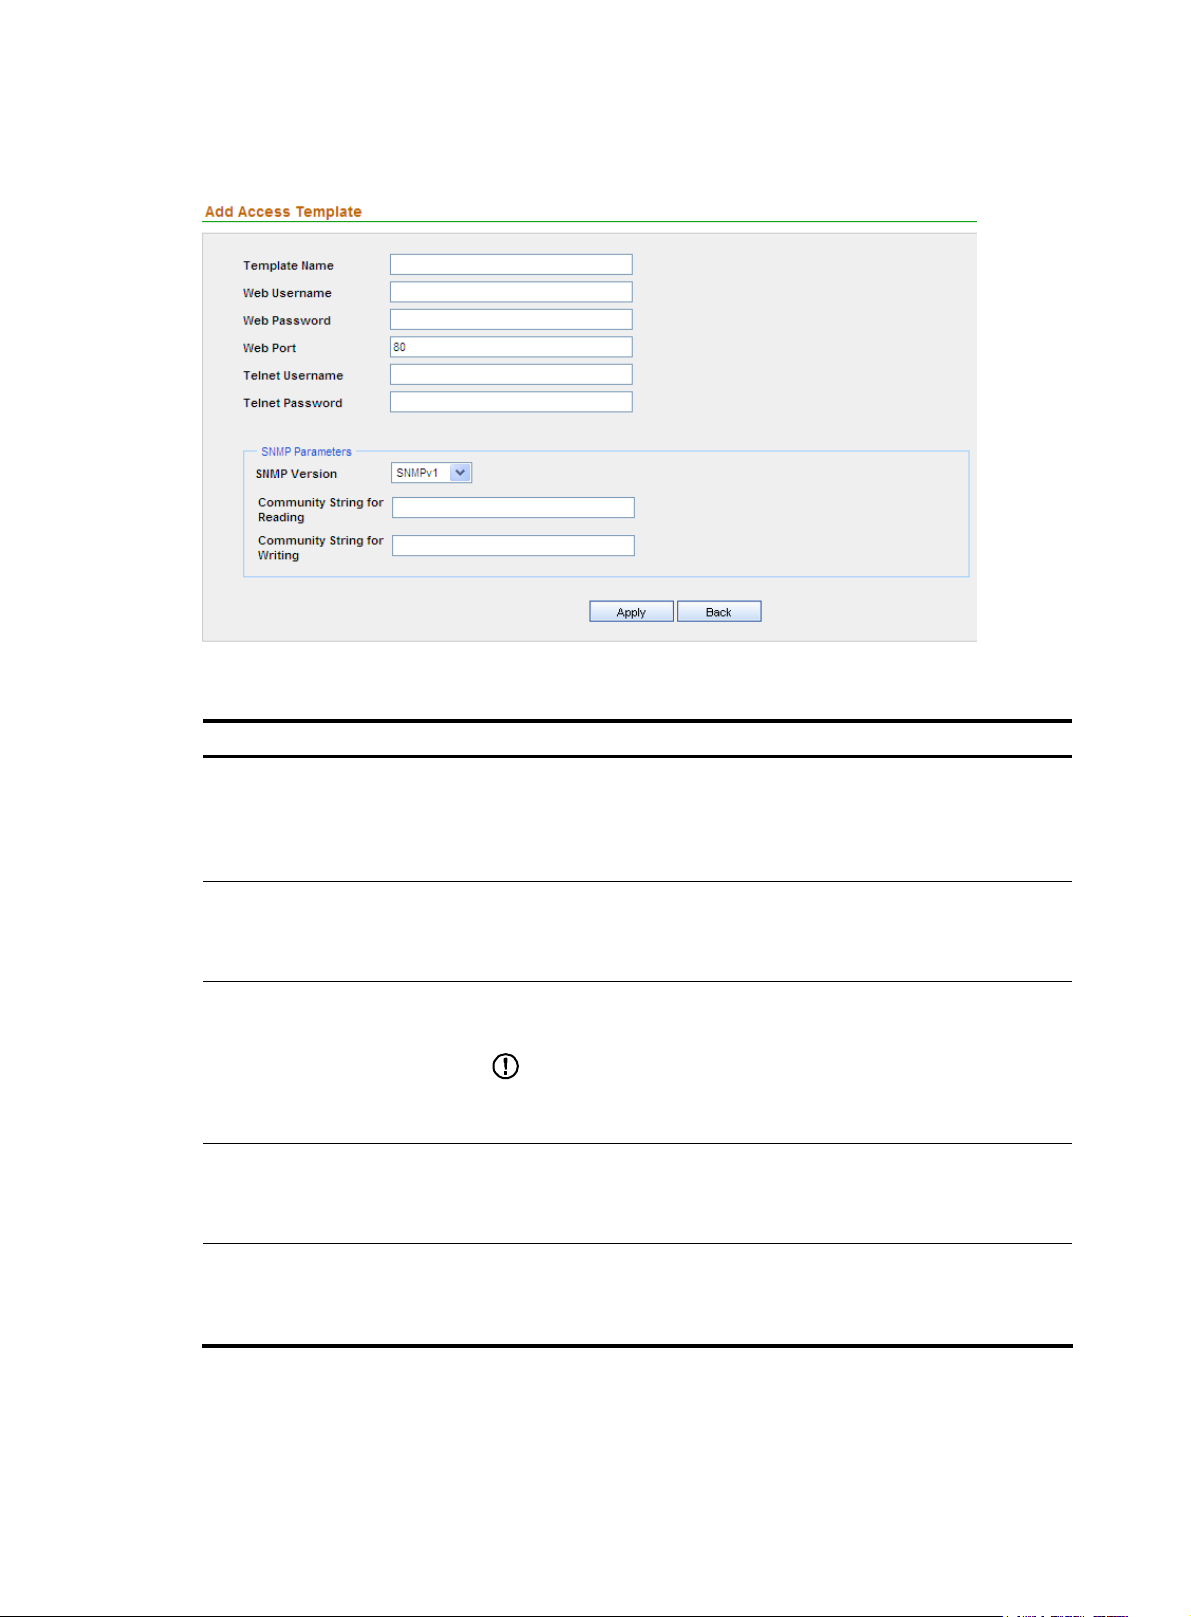
4. Click Apply.
Figure 8 Add a template
Table 6 Template configuration items
Item Description
Required
Template Name
Web Username
Web Password
Web Port
Telnet Username
Type a name for the template.
The template name can comprise up to 20 characters and must not contain
these characters: ”<>’&%:;/
Required
Specify the username for managing the device through web.
The username can comprise up to 20 characters.
Required
Specify the password for managing the device through web.
IMPORTANT:
The strength of the password must meet the password strength
requirements of the device.
Required
Specify the port of the device providing web access service.
Port 80 is the default.
Optional
Specify the username for telneting to the device.
The username can comprise up to 20 characters.
8
Page 15
Item Description
Optional
Specify the password for telneting to the device.
Telnet Password
SNMP Version
Community String for Reading
Community String for Writing
IMPORTANT:
The strength of the password must meet the password strength
requirements of the device.
Required
Select an SNMP version from the dropdown list. The options include
SNMPv1, SNMPv2C, and SNMPv3.
Required when the SNMP version is SNMPv1 or SNMPv2C.
Specify the SNMP read community string to be used for communication
with the device.
The string can comprise up to 20 characters.
Required when the SNMP version is SNMPv1 or SNMPv2C.
Specify the SNMP write community string to be used for communication
with the device.
The string can comprise up to 20 characters.
Authentication Username
Authentication Protocol
Return to Template management functions.
Managing devices
On the device list, you can add and remove IPS devices, and perform operations to the devices, such as
telnet, login and properties modification.
Configuration guide
From the navigation tree, select Device List under Device Management. The device management page
appears, as shown in
management functions provided on the device management page.
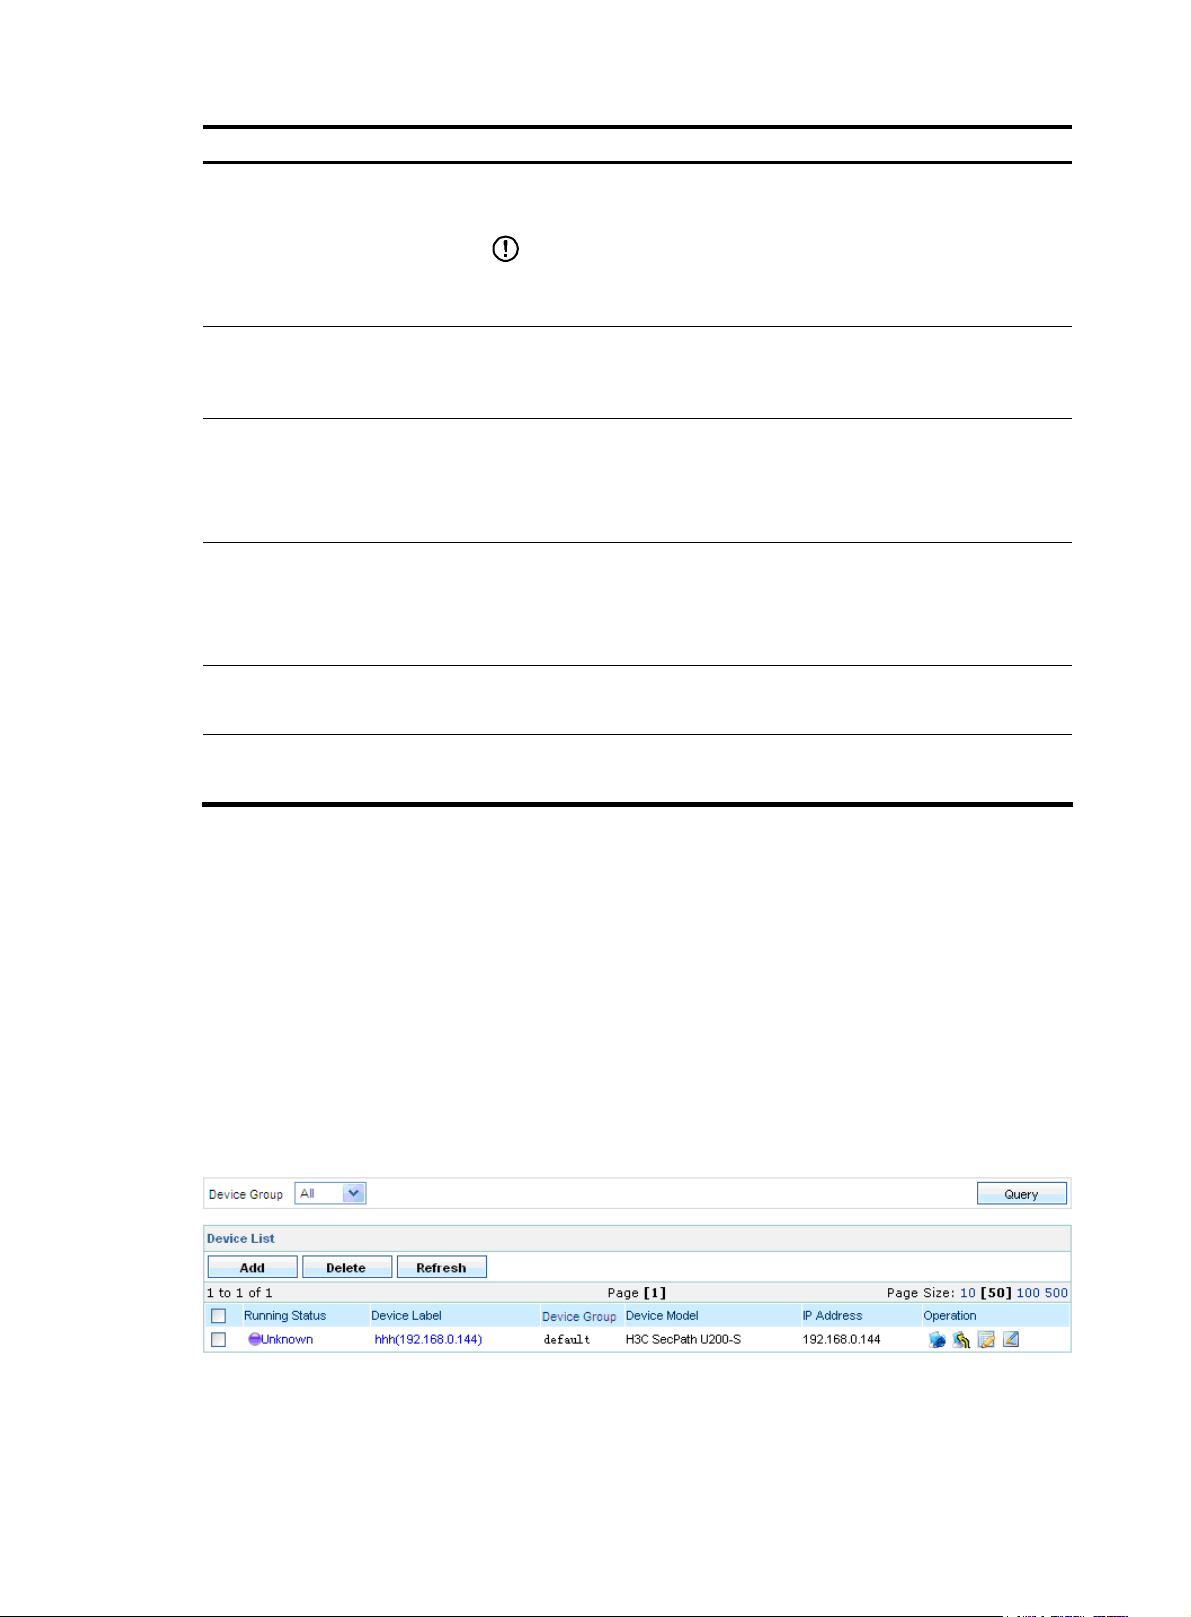
Figure 9 Device management page
Required when SNMP version is SNMPv3.
Type the username for authentication.
Required when SNMP version is SNMPv3.
Select a protocol for authentication.
Figure 9. All devices are displayed on the list. Table 7 describes the device
9
Page 16

Table 7 Device management functions
Function Description
Allows you to view details about devices, modify the access parameters,
Device list
Adding a device Allows you to add devices to be managed.
Deleting devices
export the configurations of devices, and access the devices through web
or Telnet.
Allows you to delete devices from the list of managed devices.
Follow these steps:
1. Select the check boxes before the devices to be deleted.
2. Click Delete.
Device list
Refreshing device information
Allows you to obtain the up-to-date device information.
From the navigation tree of the system management component, select Device List under Device
Management. The device management page appears, as shown in
device query option in the query section and
Table 9 describes the fields of the device list.
Figure 9. Table 8 describes the
Table 8 Device query option
Option Description
Device Group
Select a device group to list all devices in the device group.
Table 9 Fields of the device list
Field Description
Running Status
Device Label
Device Group
Device Model
Status of the device. You can click the link to view the event list of the
device. For more information, see “
Name and IP address of the device. You can click the link to view the
details of the device and modify the relevant information.
Device group to which the device belongs
Model of the device
Managing events.”
IP Address
IP address of the device
• Click the icon of a device to open the web console of the device.
• Click the icon of a device to telnet to the device.
• Click the icon of a device to import the IPS attack signatures for the
Operation
device, and click the
the IPS attack/virus signatures of the device in the SecCenter are the
same as those of the IPS device. Generally, this operation is required
whenever an IPS attack/virus signature upgrade is performed on the
IPS device.
icon to import the IPS virus signatures, so that
Return to Device management functions.
10
Page 17
Adding a device
After completing device group and template configuration, you can add devices to be managed. Only
after you add devices successfully, can you perform centralized analysis on attack, virus, and DDoS
events.
1. From the navigation tree of the system management component, select Device List under Device
Management to enter the device management page.
2. Click Add to enter the page for adding a device, as shown in Figure 10.
3. Configure the settings. Table 10 describes the device configuration items.
4. Click Add.
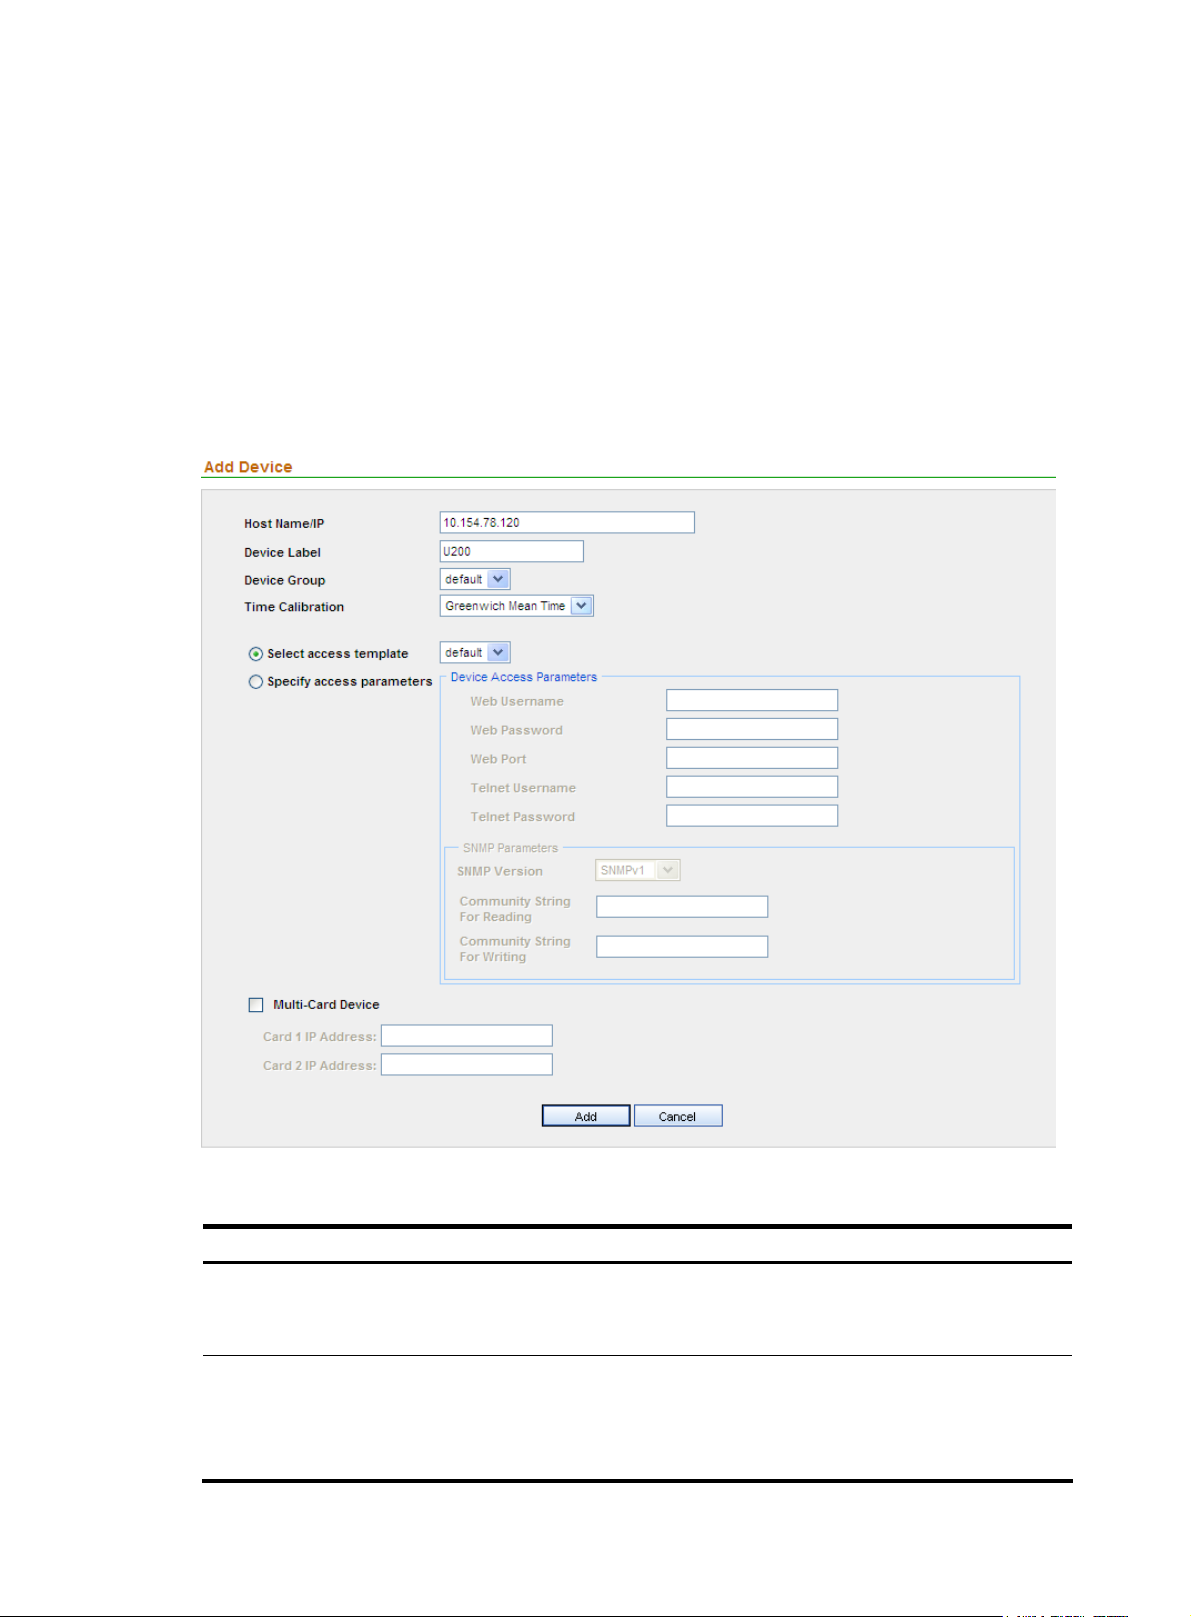
Figure 10 Add a device
Table 10 Device configuration items
Item Description
Required
Host Name/IP
Device Label
Type the name or IP address of the device to uniquely identify the device in
the SecCenter system.
Required
Type a label for the device, which can be used as an alias of the device.
The device label can comprise up to 20 characters and must not contain
illegal characters.
11
Page 18

Item Description
Required
Device Group
Select a device group for the device. By default, the device group named
default is selected.
Time Calibration
Select access template
Specify access parameters
Web Username
Web Password
Web Port
Telnet Username
Required
Specify the time zone.
Required. Select either of them.
• If you select Select access template, select a template from the
dropdown list. By default, the template named default is selected.
• If you select Specify access parameters, specify the access parameters.
Required
Specify the username for managing the device through web.
The username can comprise up to 20 characters and must not contain
illegal characters.
Required
Specify the password for managing the device through web.
IMPORTANT:
The strength of the password must meet the password strength
requirements of the device.
Required
Specify the port of the device that provides web access service.
The port number must be an integer in the range from 1 to 65534.
Optional
Specify the username for telneting to the device.
The username can comprise up to 20 characters and must not contain
illegal characters.
Telnet Password
SNMP Version
Community String For Reading
Community String For Writing
Optional
Specify the password for telneting to the device.
IMPORTANT:
The strength of the password must meet the password strength
requirements of the device.
Required
Select a version, which can be SNMPv1, SNMPv2C, or SNMPv3.
Required when the SNMP version is SNMPv1 or SNMPv2C.
Specify the SNMP read community string to be used for communication
with the device.
The string can comprise up to 20 characters.
Required when the SNMP version is SNMPv1 or SNMPv2C.
Specify the SNMP write community string to be used for communication
with the device.
The string can comprise up to 20 characters.
12
Page 19
Item Description
Authentication Username
Authentication Protocol
Multi-Card Device
Return to Device management functions.
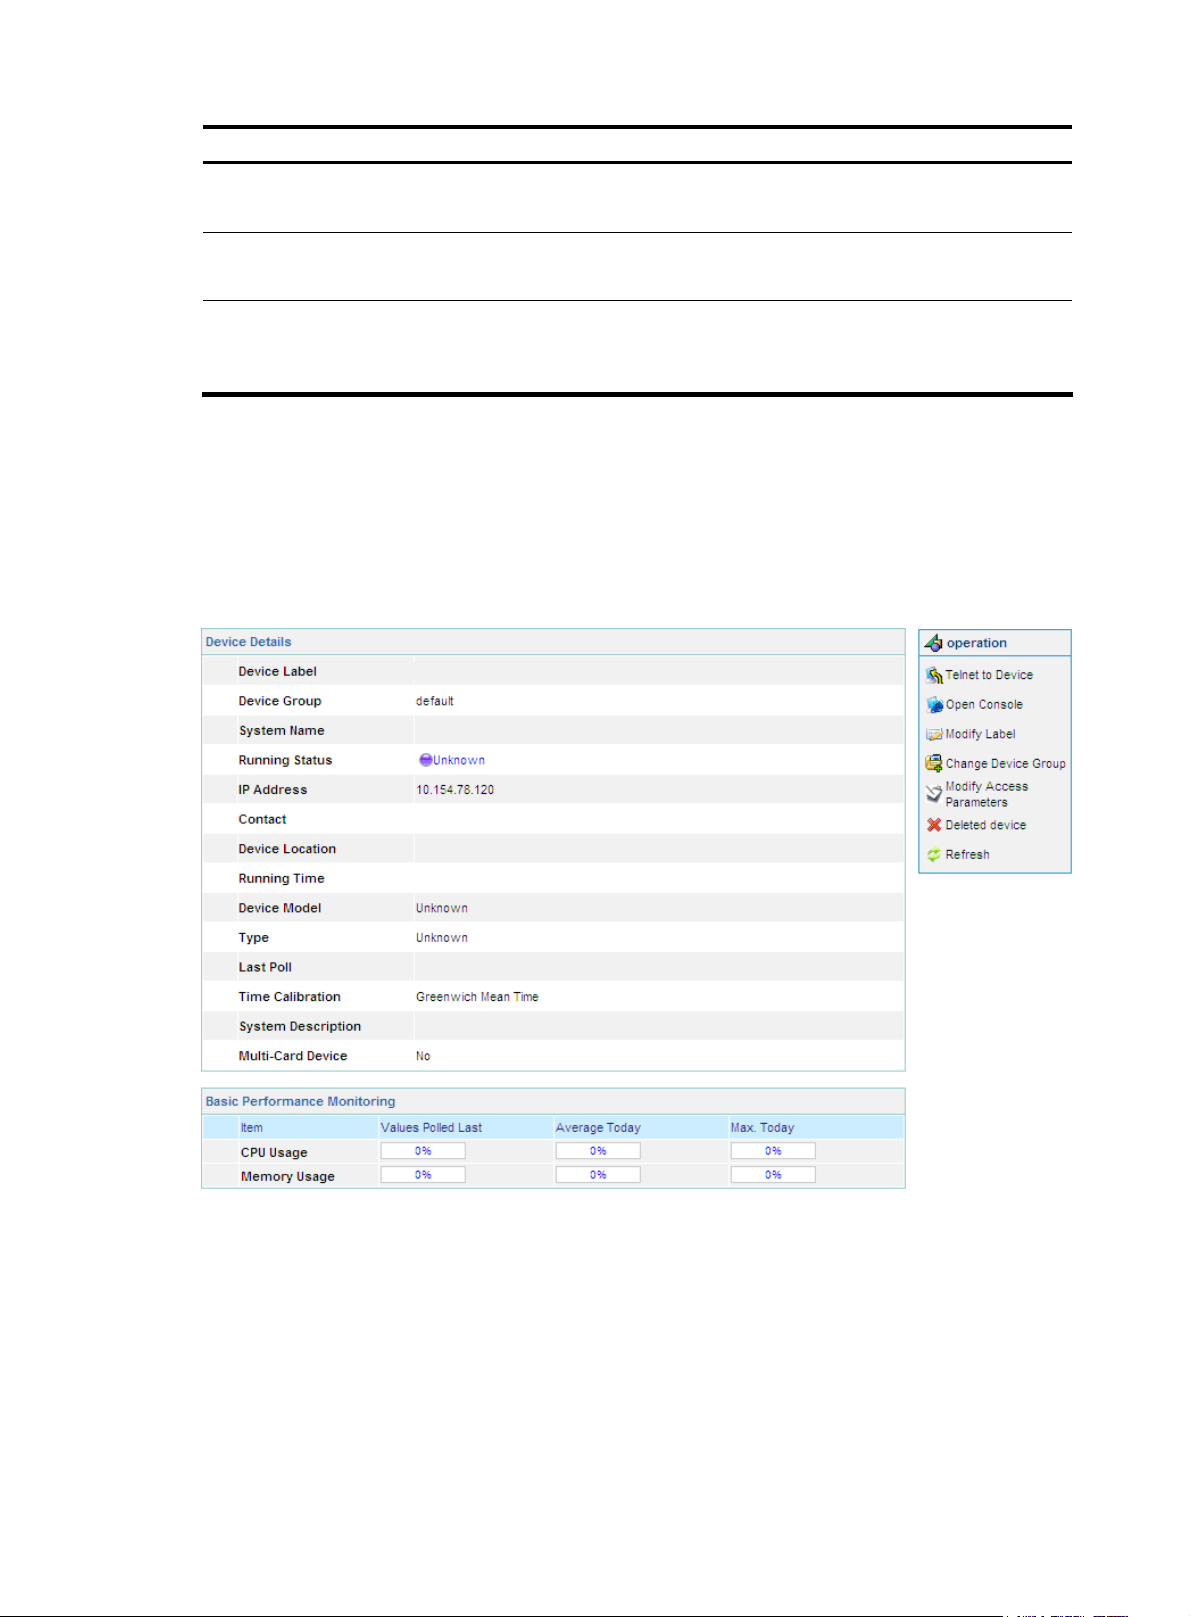
Device information
From the navigation tree of the system management component, select Device List under Device
Management to enter the device management page. Then, you can click the device label link of a device
to display the details of the device and modify the information of the device, as shown in
Figure 11 Device information
Required when SNMP version is SNMPv3.
Type the username for authentication.
Required when SNMP version is SNMPv3.
Select a protocol for authentication.
Optional
Type the IP addresses of interface cards that are on the IPS device. The IP
address must be in dotted decimal notation.
Figure 11.
Managing events
The event management function records the operations on managed devices and logs the events,
allowing you to track the status of devices.
Configuration guide
From the navigation tree of the system management component, select Events under Device Management.
The event management page appears, as shown in
functions.
Figure 12. Table 11 describes the event management
13
Page 20
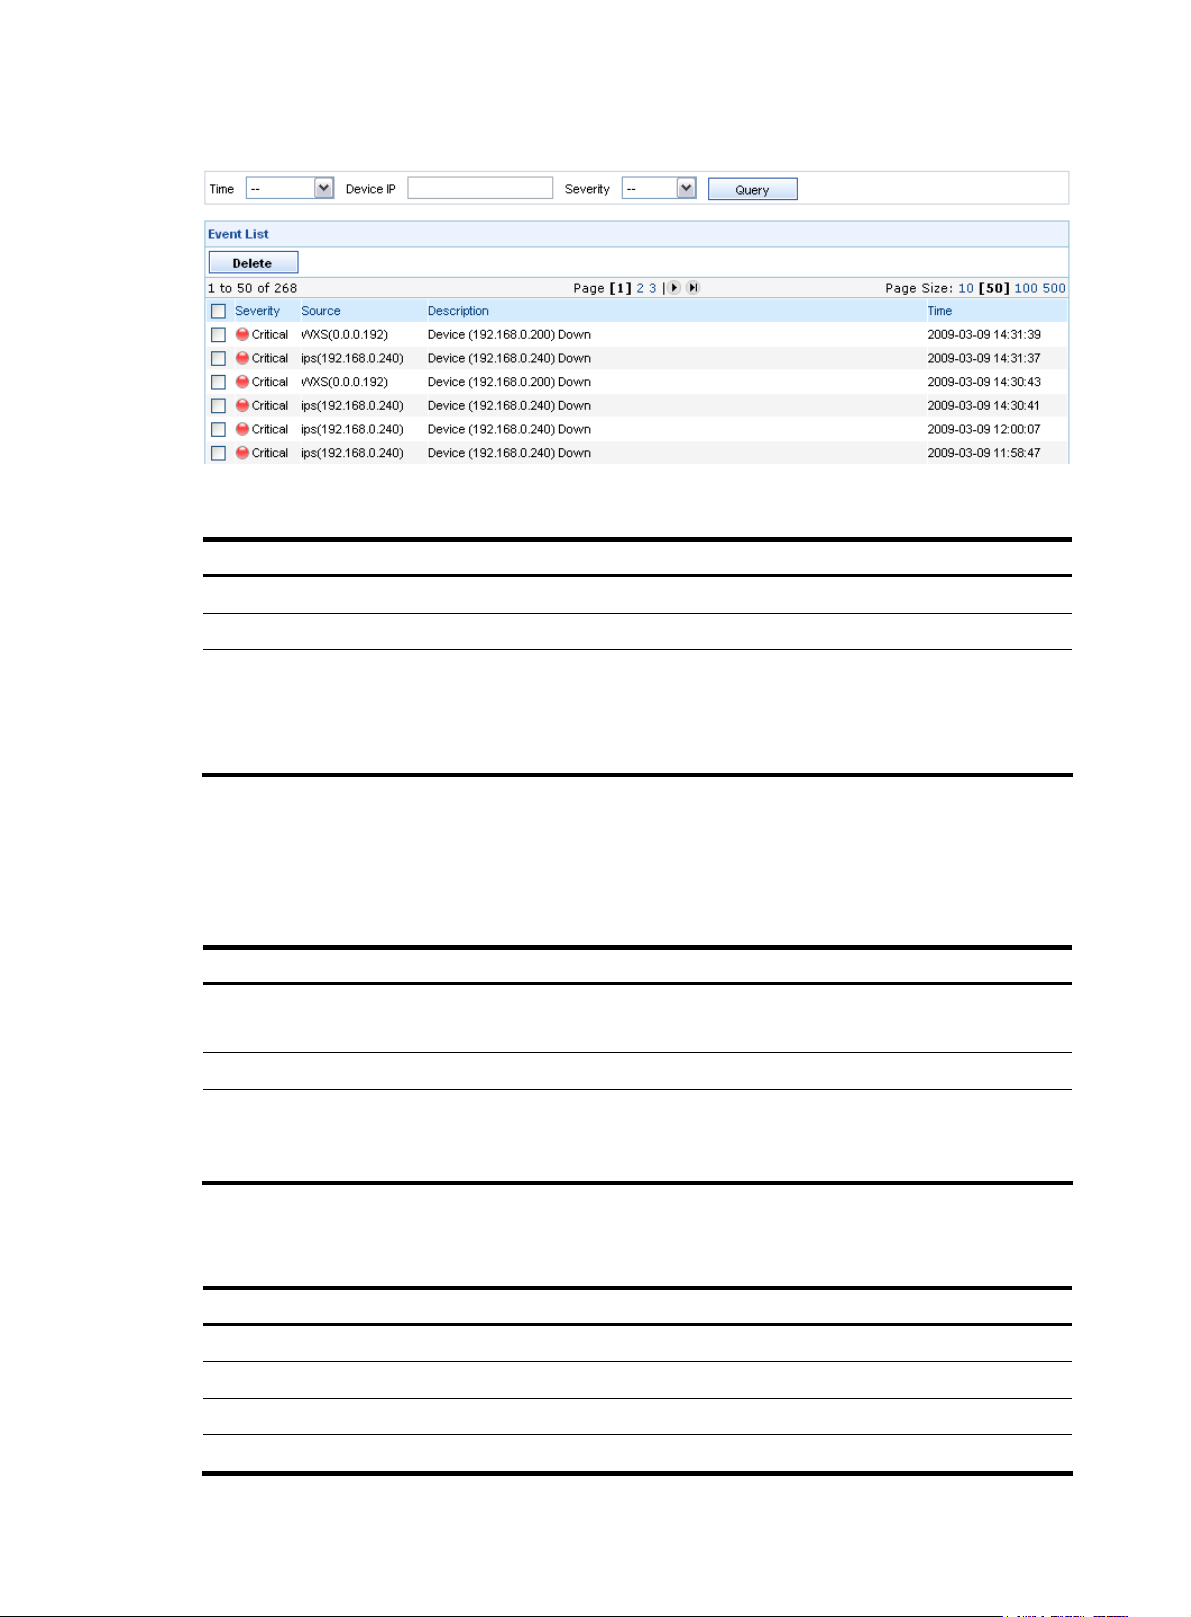
Figure 12 Event management page
Table 11 Event management functions
Function Description
Device event list Displays detailed information of the device events.
Device interface event list Displays detailed information of the device interface events.
Allows you to delete events from the event list.
Deleting events
Follow these steps :
1. Select the check boxes before events.
2. Click Delete to delete the events
Device event list
Table 12 describes the event query options. You can use any combination of the options to query for the
events of interest.
Table 12 Event query options
Option Description
Time
Device IP
Severity
Table 13 describes the fields of the event list.
Table 13 Fields of the event list
Field Description
Severity
Source
Select the time period during which the events occurred.
By default, the value of this option is --, which means any time.
Type the IP address of the device.
Select the severity level of the events. Severity levels in descending order
are critical, major, minor, and warning.
By default, the value of this option is --, which means all levels.
Severity level of the event
Label and IP address of the device that is the source of the event
Description
Time
Description of the event
Time when the event occurred
14
Page 21
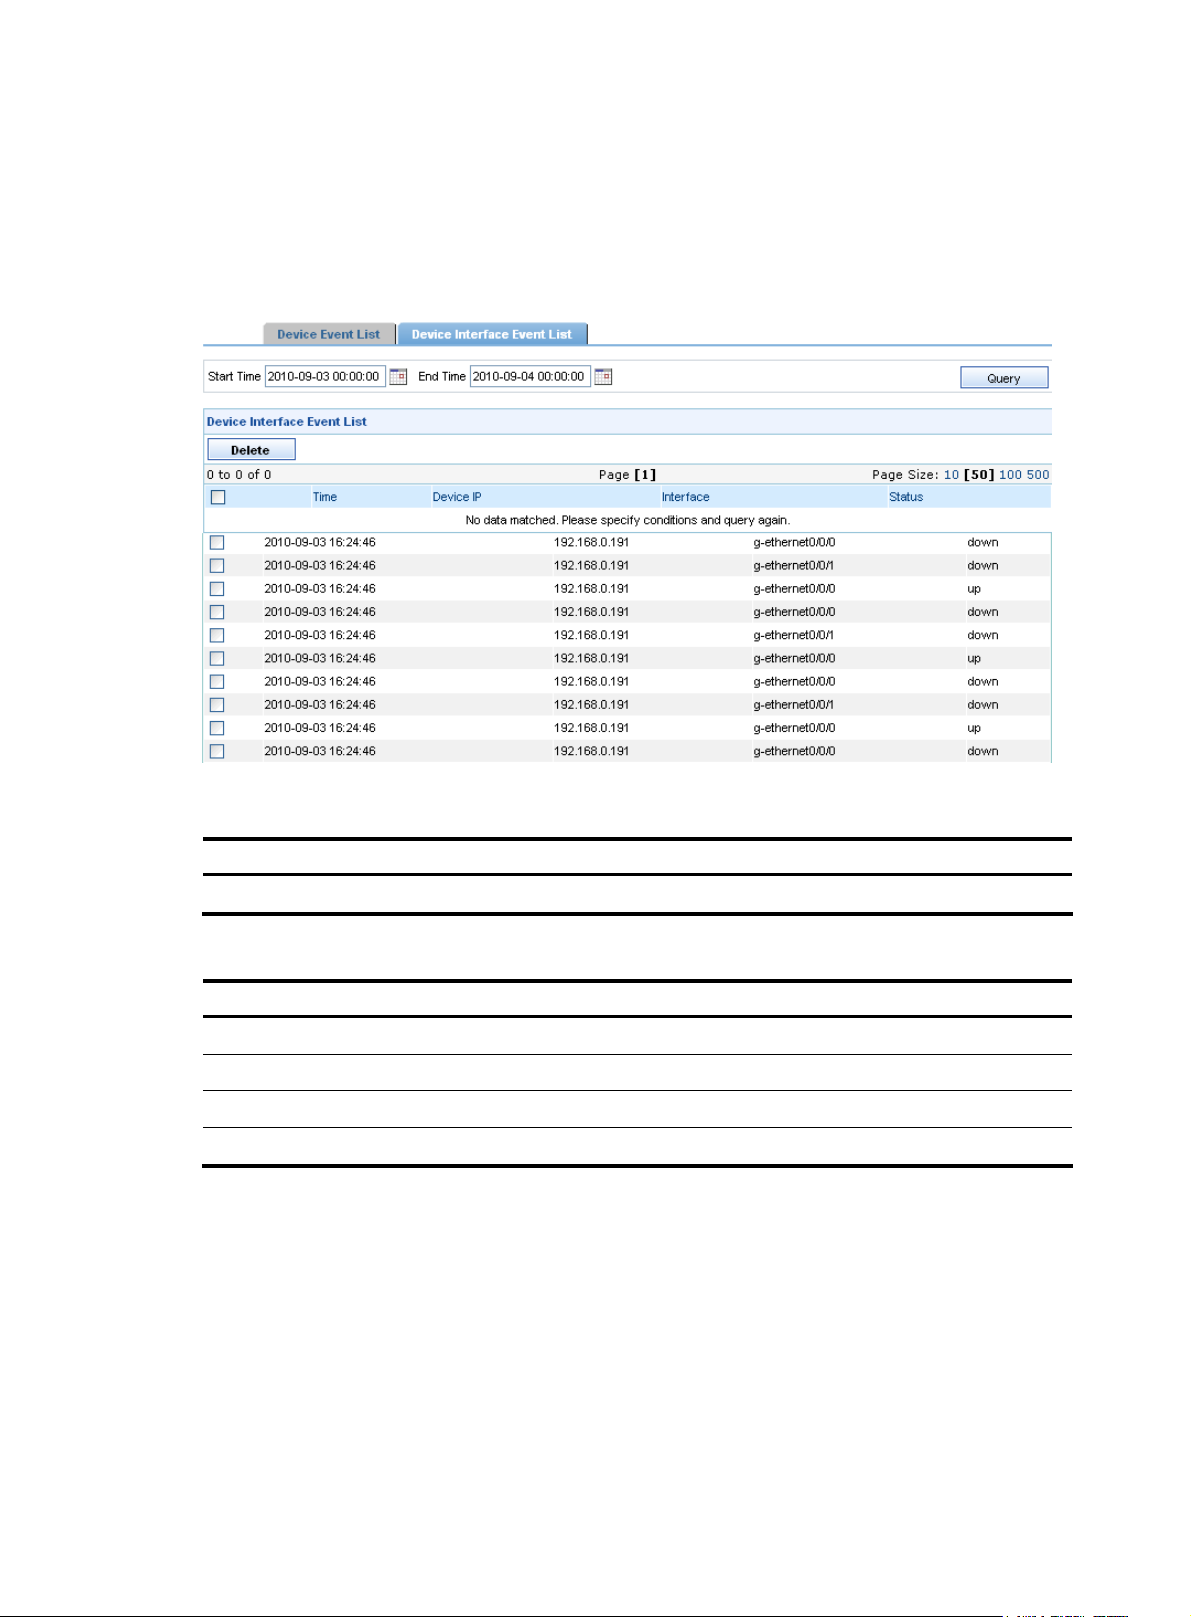
Device interface event list
On the device interface event management page, you can set the query conditions to query specific
interface events, view interface event information, and delete the selected interface events.
describes the device interface event query options in the query section.
the device interface event list.
Figure 13 Device interface event list
Table 14
Table 15 describes the fields of
Table 14 Interface event query options
Option Description
Start Time/End Time Select the time period during which the interface events occurred.
Table 15 Fields of the device interface event list
Field Description
Time Time when the event occurred
Device IP IP address of the device where the event occurred
Interface Interface where the event occurred
Status Status of the event
Configuring device interface alarming
This function allows you to specify when and for what events to generate alarms, how to raise alarms,
and where to send alarms.
1. From the navigation tree of the system management component, select Device Interface Alarms
under Device Management. The device interface alarming configuration page appears, as shown
in
Figure 14.
2. Select one or more alarm modes.
3. Select one or both event types for which alarms will be generated.
15
Page 22
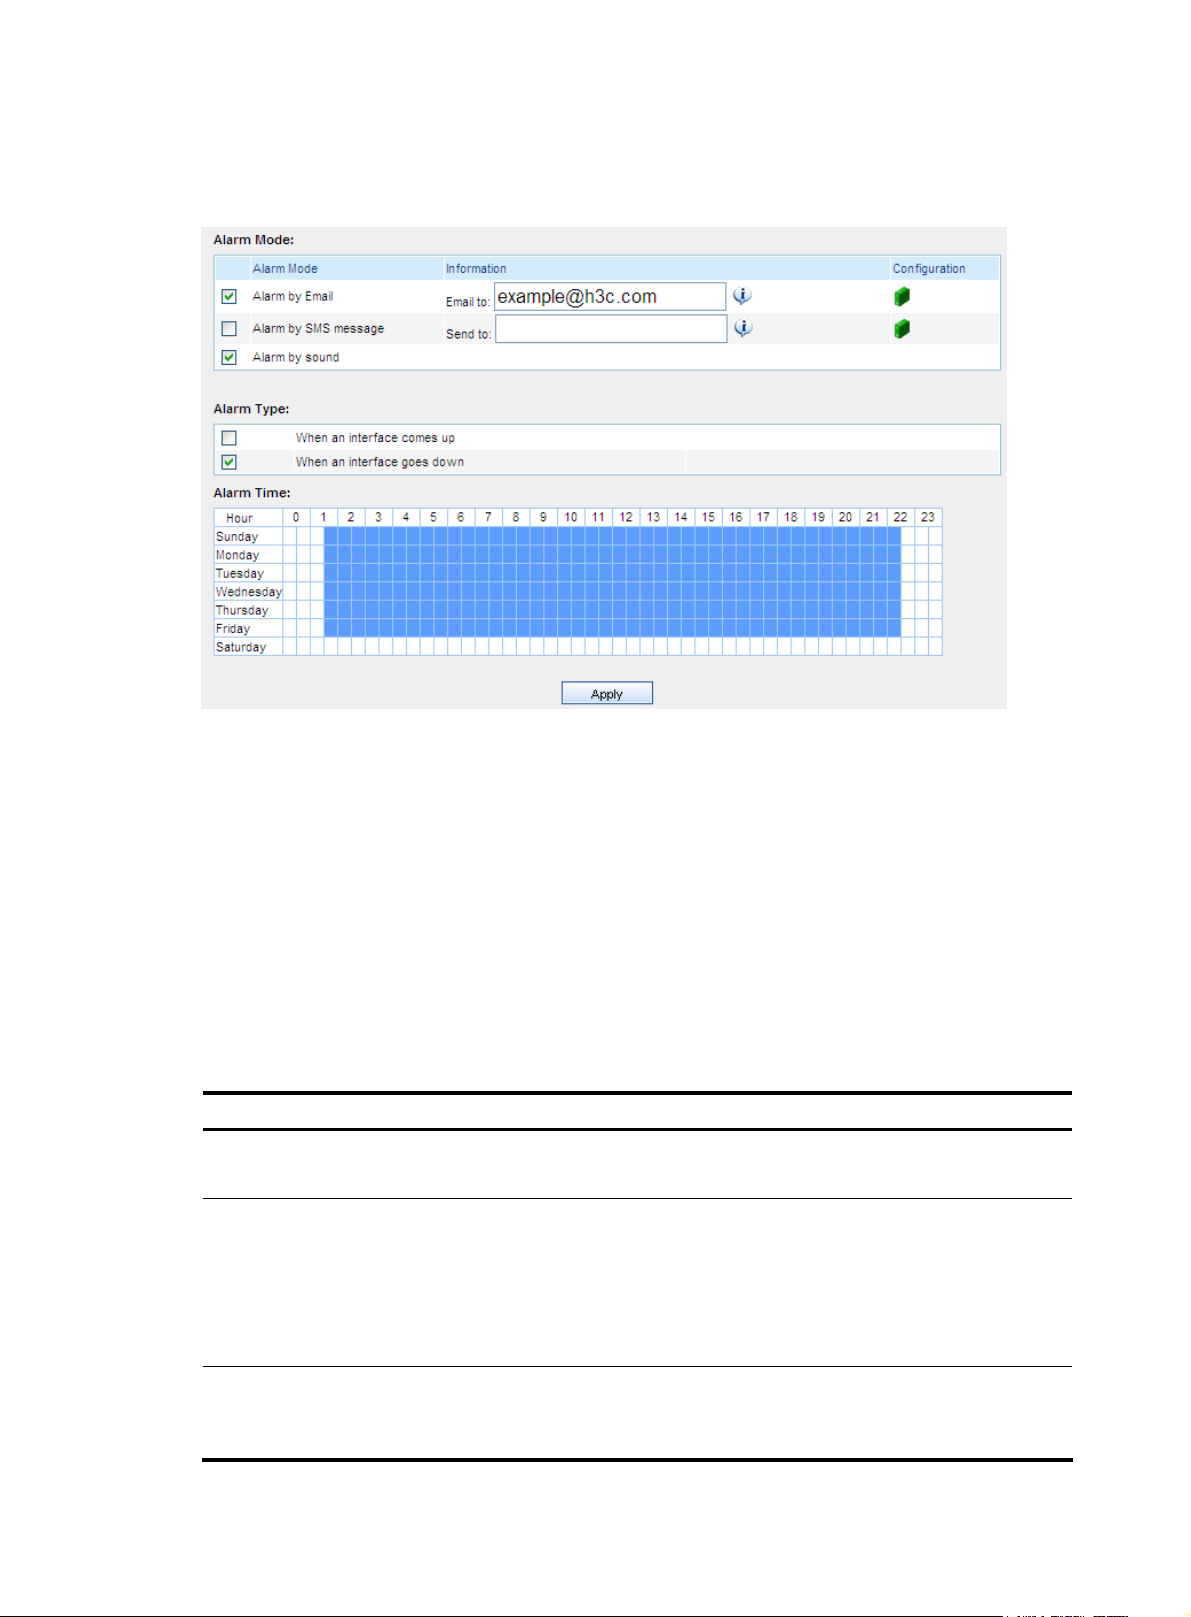
4. Click the alarm time points, or drag the cursor to select time periods. The system will raise alarms
by the specified means when the specified types of events occur during the selected time periods.
Figure 14 Configure device interface alarming
Operator management
The operator management module allows you to manage operators and operation logs, and to change
operator passwords.
Managing operators
This function allows you to manage the rights of web users. There are three user levels: common operator,
system administrator, and super administrator. A higher level operator has all the rights of operators of
a lower level.
Table 16 User levels and the rights
User level Rights
Common operator
(visitor level)
System administrator
(monitoring level)
Super administrator
(management level)
Table 16 describes the rights of the three user levels.
• Use the Ping tool
• Cannot perform any configuration
• Use the Ping tool
• View configuration information except for user information
• View log information except for operation logs
• Perform configurations except for user configuration, operation
logging configuration, software upgrade, and factory defaults
restoration
• View all configurations
• View all logs
• Perform all configurations
16
Page 23
Configuration guide
From the navigation tree of the system management component, select Operators under Operator
Management. The operator management page appears, as shown in
operator management functions.
Figure 15 Operator management functions
Table 17 Operator management functions
Function Description
Figure 15. Table 17 describes the
Operator list
Adding an operator Allows you to add operators.
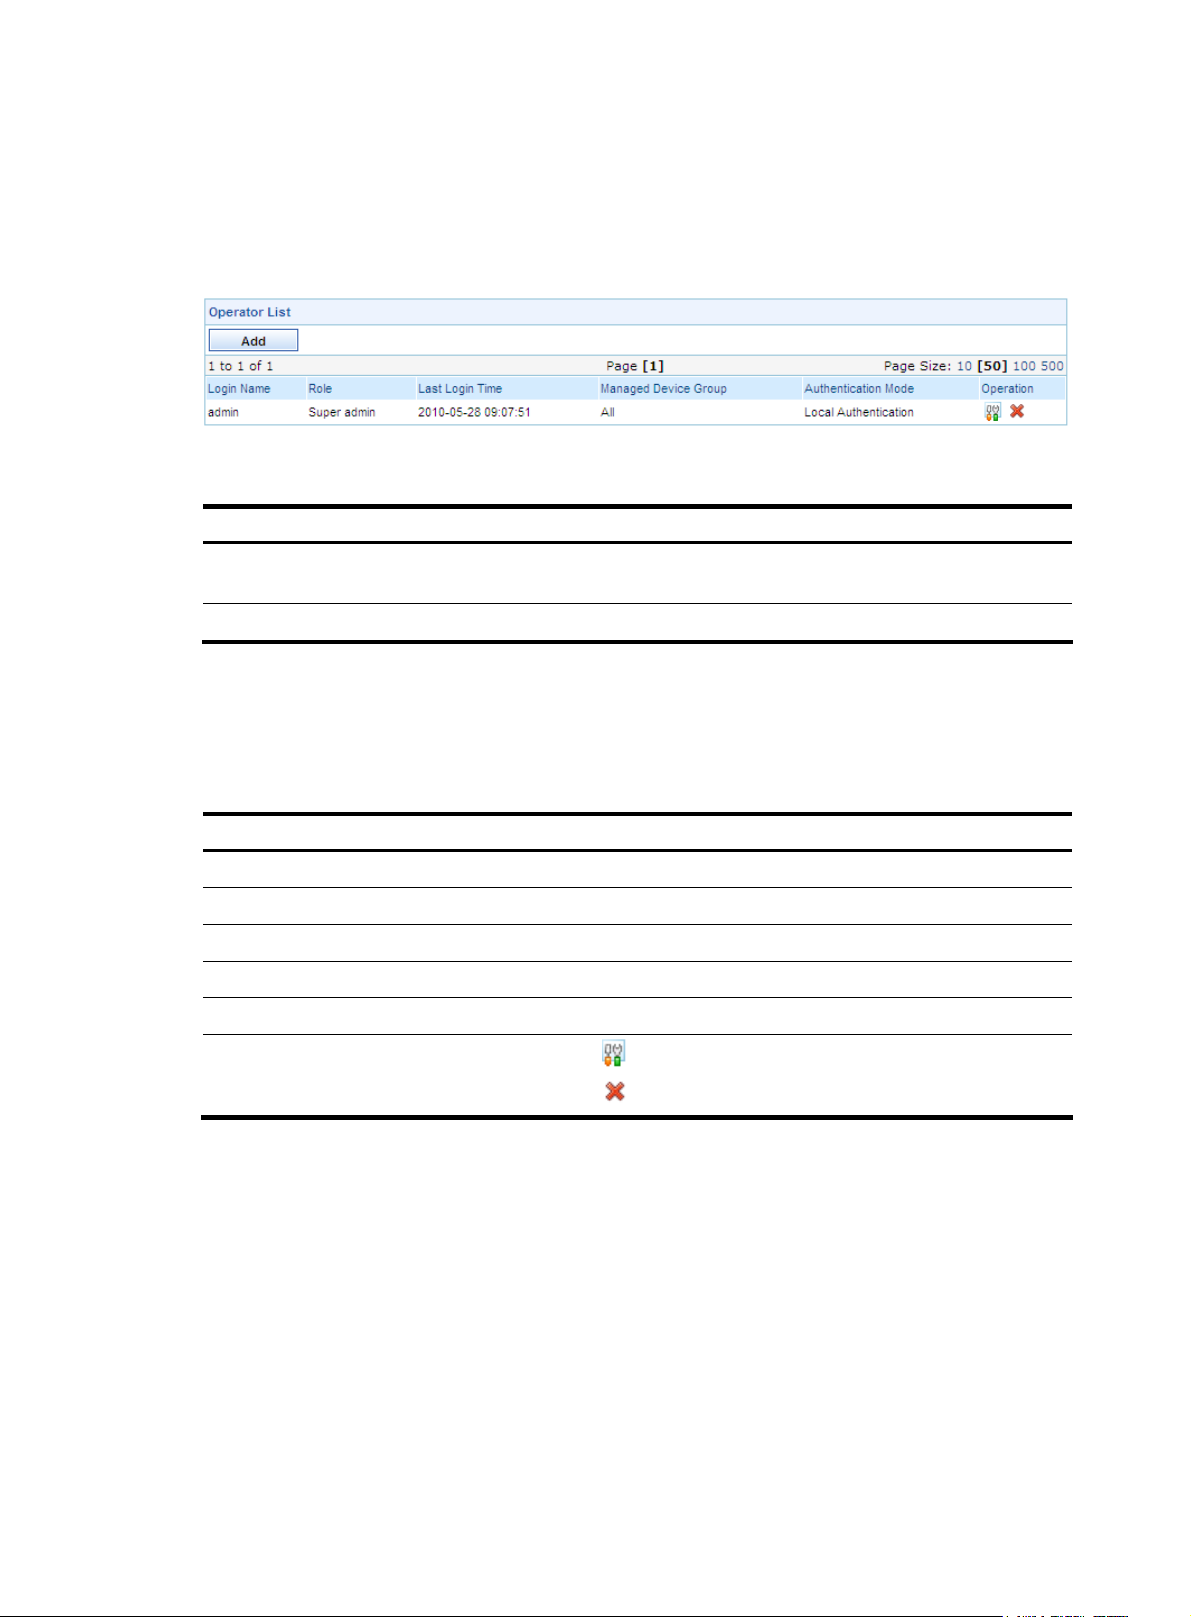
Operator list
From the navigation tree of the system management component, select Operators under Operator
Management. The operator management page appears, as shown in
Table 18 Fields of the operator list
Field Description
Login Name
Role
Last Login Time
Managed Device Group
Authentication mode Authentication mode of the operator
Operation
Allows you to view details about operators, modify operator information,
and delete operators.
Figure 15.
Name of the operator
Operation level of the operator
Last time when the operator operated on the web
Device groups for which the operator has operation rights
• Click the icon of an operator to modify the operator’s information.
• Click the icon of an operator to delete the operator.
Return to Operator management functions.
Adding an operator
1. From the navigation tree of the system management component, select Operators under Operator
Management to enter the operator management page.
2. Click Add to enter the page for adding an operator, as shown in Figure 16.
3. Configure the settings. Table 19 describes the operator configuration items.
4. Click Apply.
17
Page 24
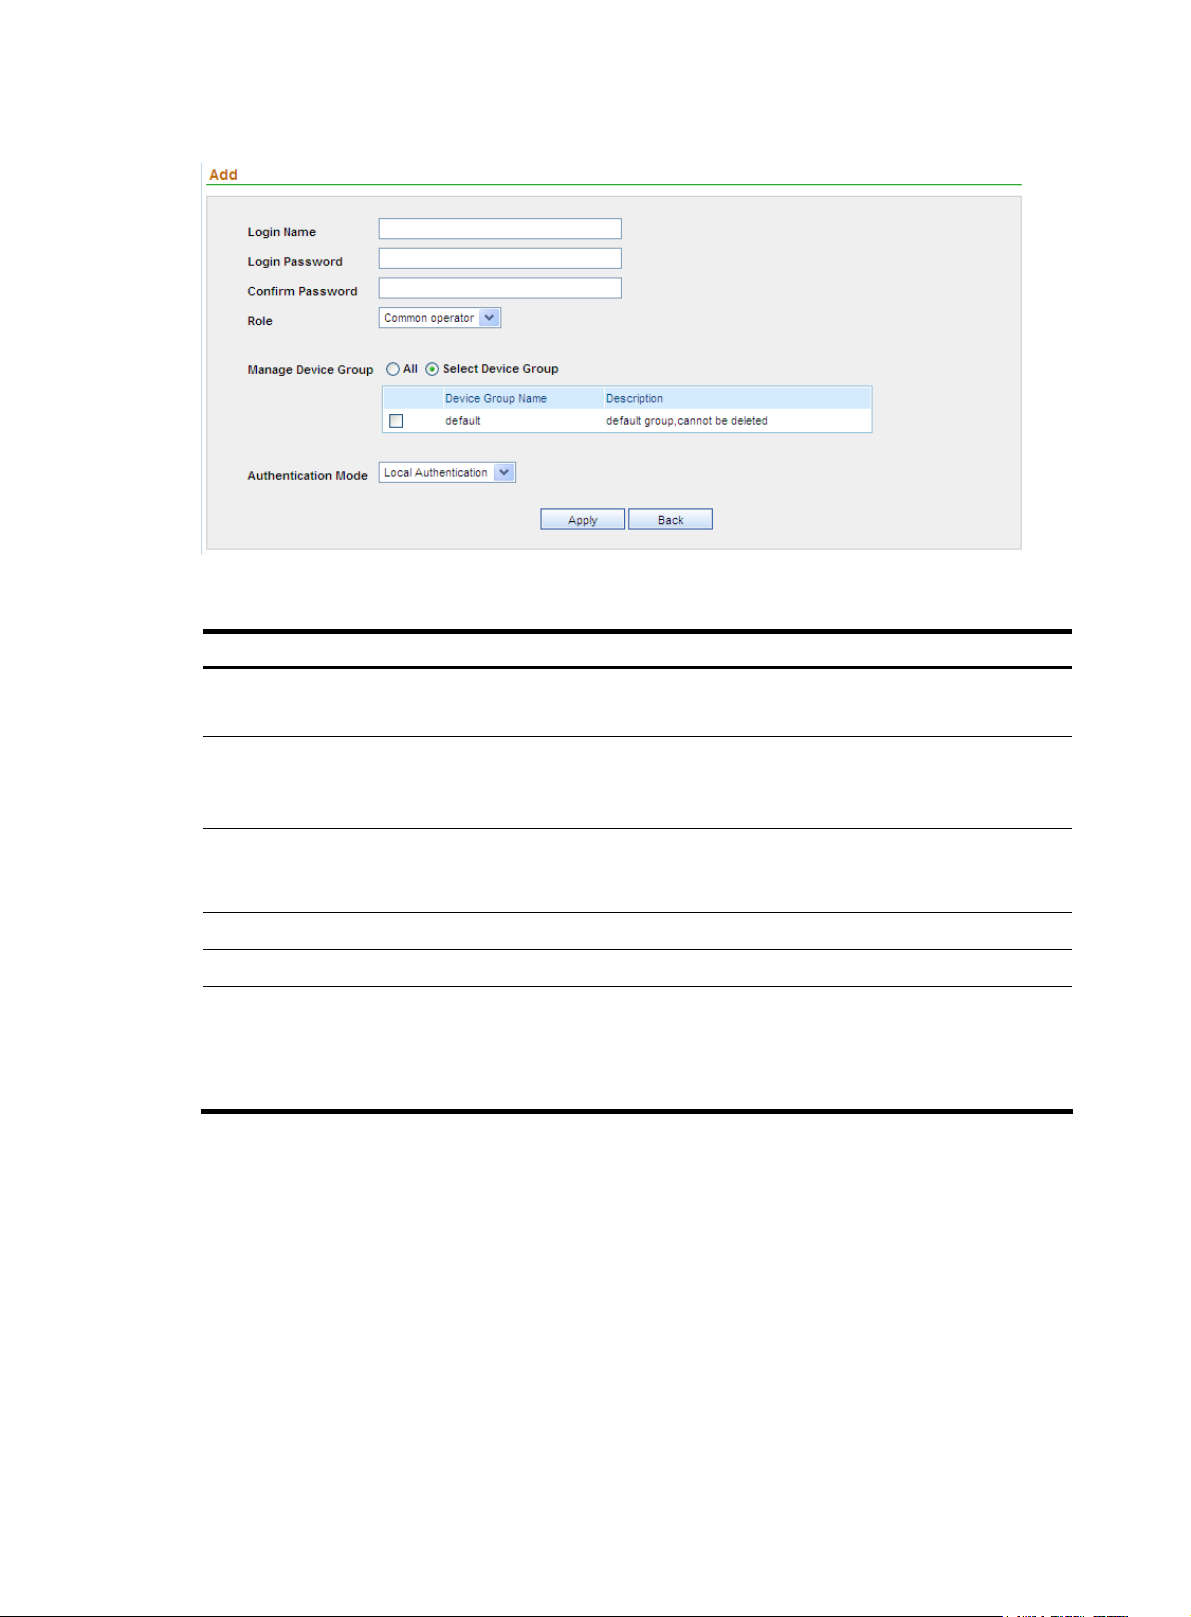
Figure 16 Add an operator
Table 19 Operator configuration items
Item Description
Login Name
Login Password
Confirm Password
Role
Manage Device Groups
Authentication Mode
Type a name for the operator.
The login name can comprise up to 40 characters.
Specify a password for the operator to use at login.
The password must comprise 6 to 20 alphanumeric characters, and its
strength must meet the password strength requirements of the device.
Type the password again, which must be the same as that for Login
Password. If the two are not the same, an error message will appear,
telling you that they must be identical.
Select an operation level for the operator.
Specify which device groups the operator can manage.
Required
Specify an authentication mode for the operator. Available options
include local authentication and LDAP authentication.
When you select LDAP authentication, select an LDAP server.
Return to Operator management functions.
Managing operation logs
Configuration guide
Operations performed by all operators are recorded in operation logs. The super administrator can view
operation logs, query logs by different conditions, and delete logs as needed.
From the navigation tree of the system management component, select Operation Logs under Operator
Management. The operation log management page appears, as shown in
18
Figure 17.
Page 25
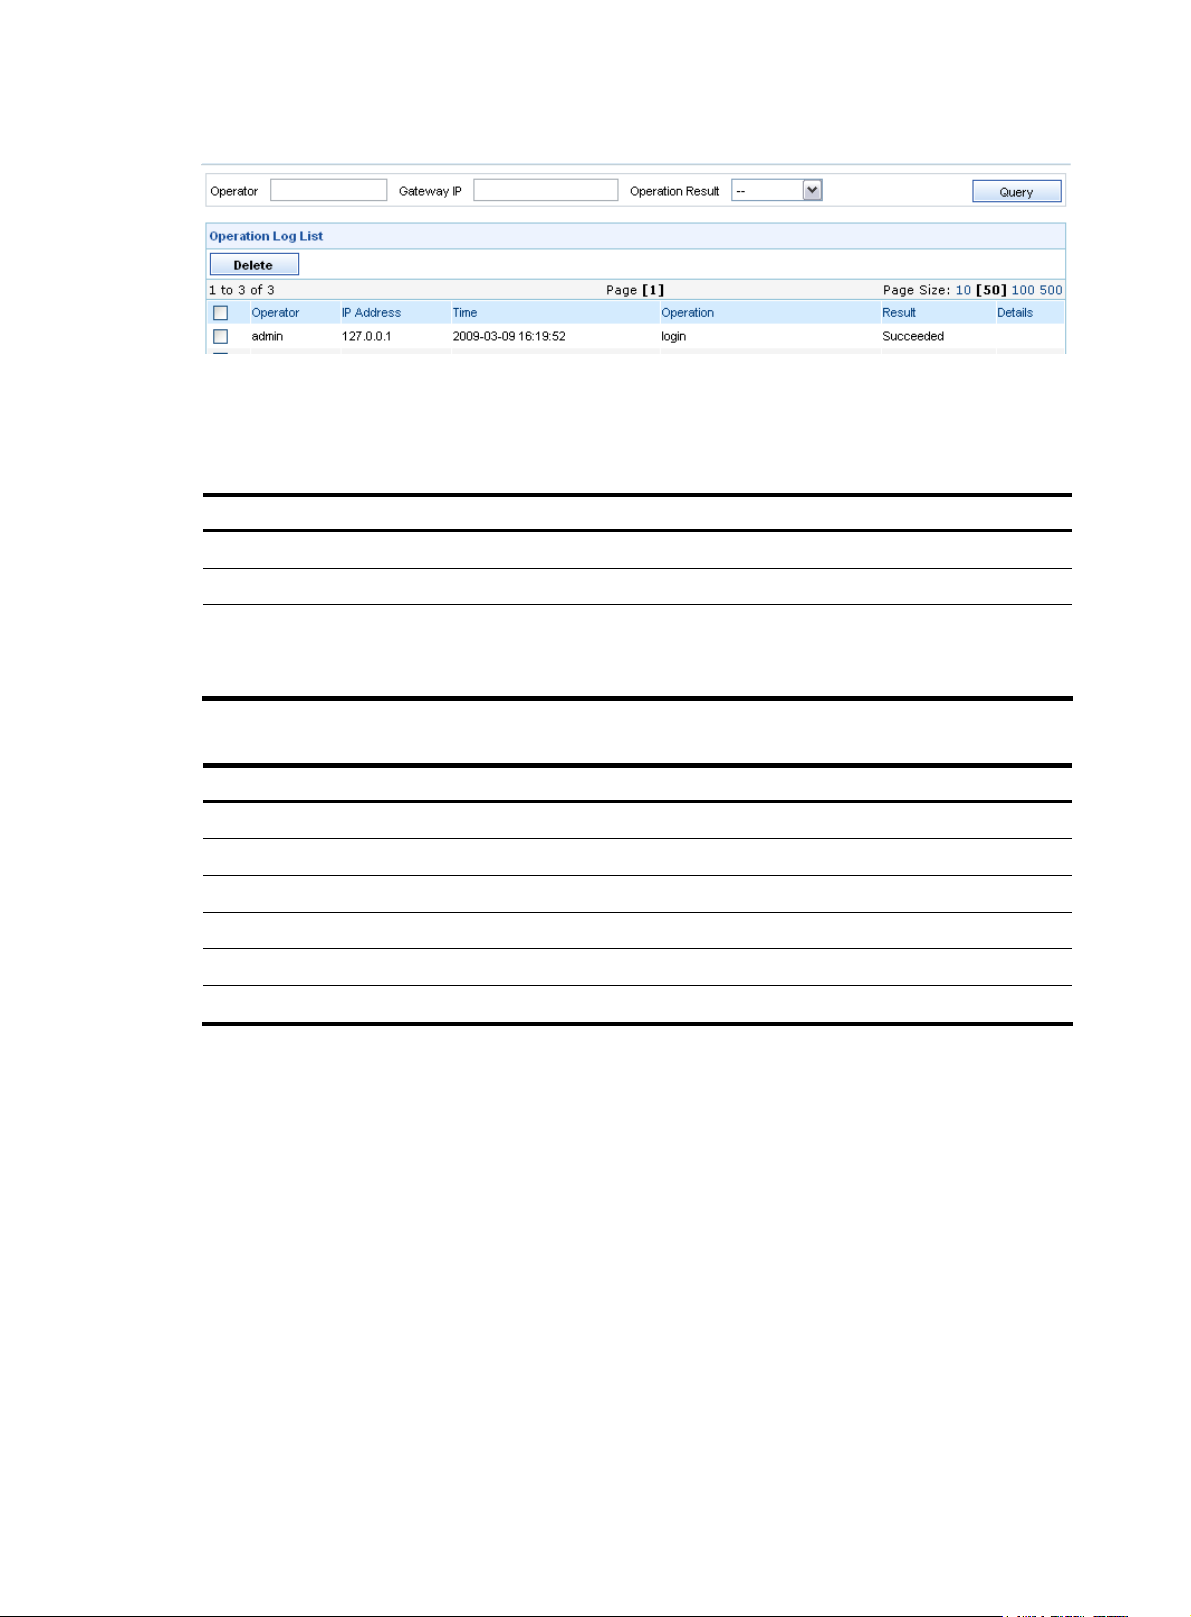
Figure 17 Operation log management page
Table 20 describes the operation log query options. You can use any combination of the options to query
for the logs of interest.
Table 21 describes the fields of the operation log list.
Table 20 Operation log query options
Option Description
Operator
Gateway IP
Operation Result
Specify the operator whose logs you are interested in.
Type the IP address of the gateway.
Select the operation result of the operation logs you are interested in.
By default, the value of this option is --, which means both the succeeded and
failed operations.
Table 21 Fields of the operation log list
Field Description
Operator
IP Address
Time Time when the operation occurred
Operation
Result Whether the operation succeeded or failed
Details
Name of the operator
IP address of the PC used by the operator to log in
What the operator did
Operation details
Changing your login password
This function allows you to change your login password.
From the navigation tree of the system management component, select Password under Operator
Management to enter the page for changing your login password, as shown in
Figure 18. Table 22
describes the configuration items for changing your password.
19
Page 26
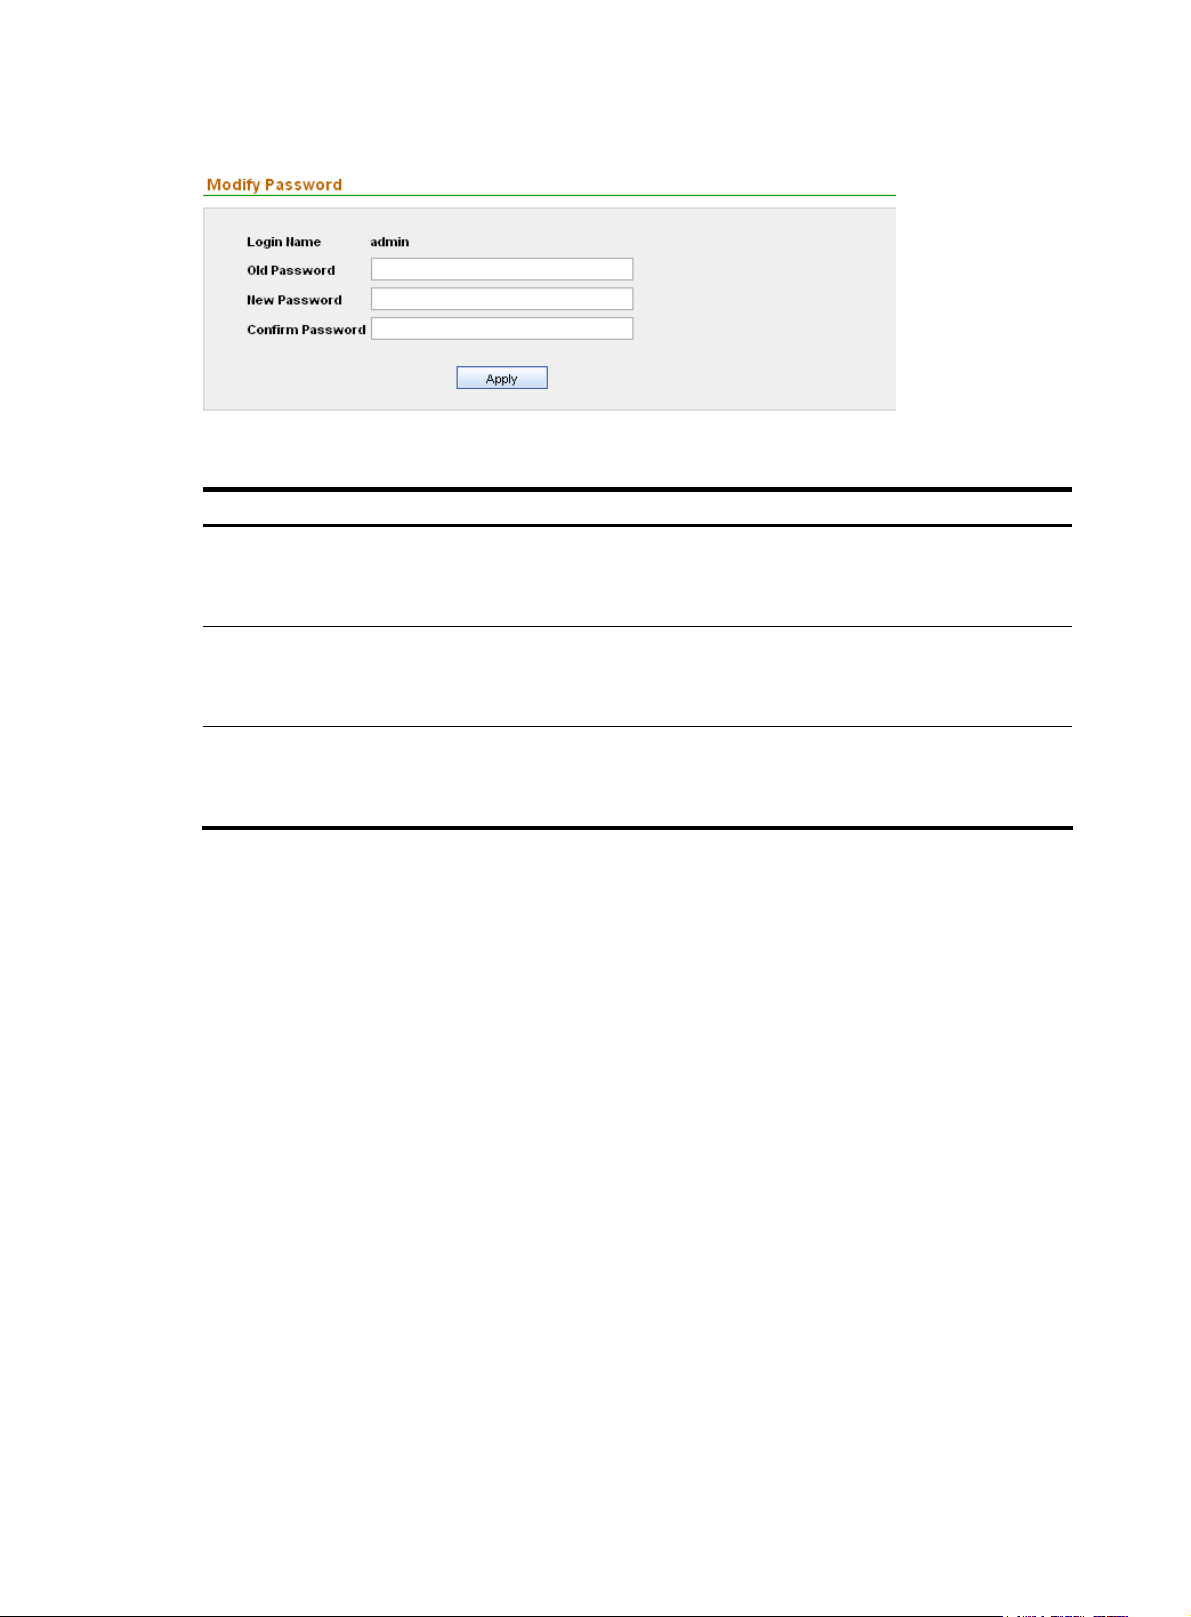
Figure 18 Change your login password
Table 22 Configuration items for changing your password
Item Description
Required
Old Password
New Password
Type the current password.
The password must be an alphanumeric string of 6 to 20 characters.
Required
Type the new password.
The password must be an alphanumeric string of 6 to 20 characters.
Required
Confirm Password
Type the new password again.
This password must be exactly the same as that for New Password.
System configuration
Configuring service parameters
Configuration guide
The service parameters configuration allows you to enable and disable IPS related services, such as
automatic policy deployment, automatic synchronization of attack signatures, and automatic
synchronization of virus signatures. The selected IPS services will be automatically performed, helping
you with IPS management.
From the navigation tree of the system management component, select Service Parameters under System
Config. The service parameter configuration page appears, as shown in
the service parameters configuration items.
Figure 19. Table 23 describes
20
Page 27
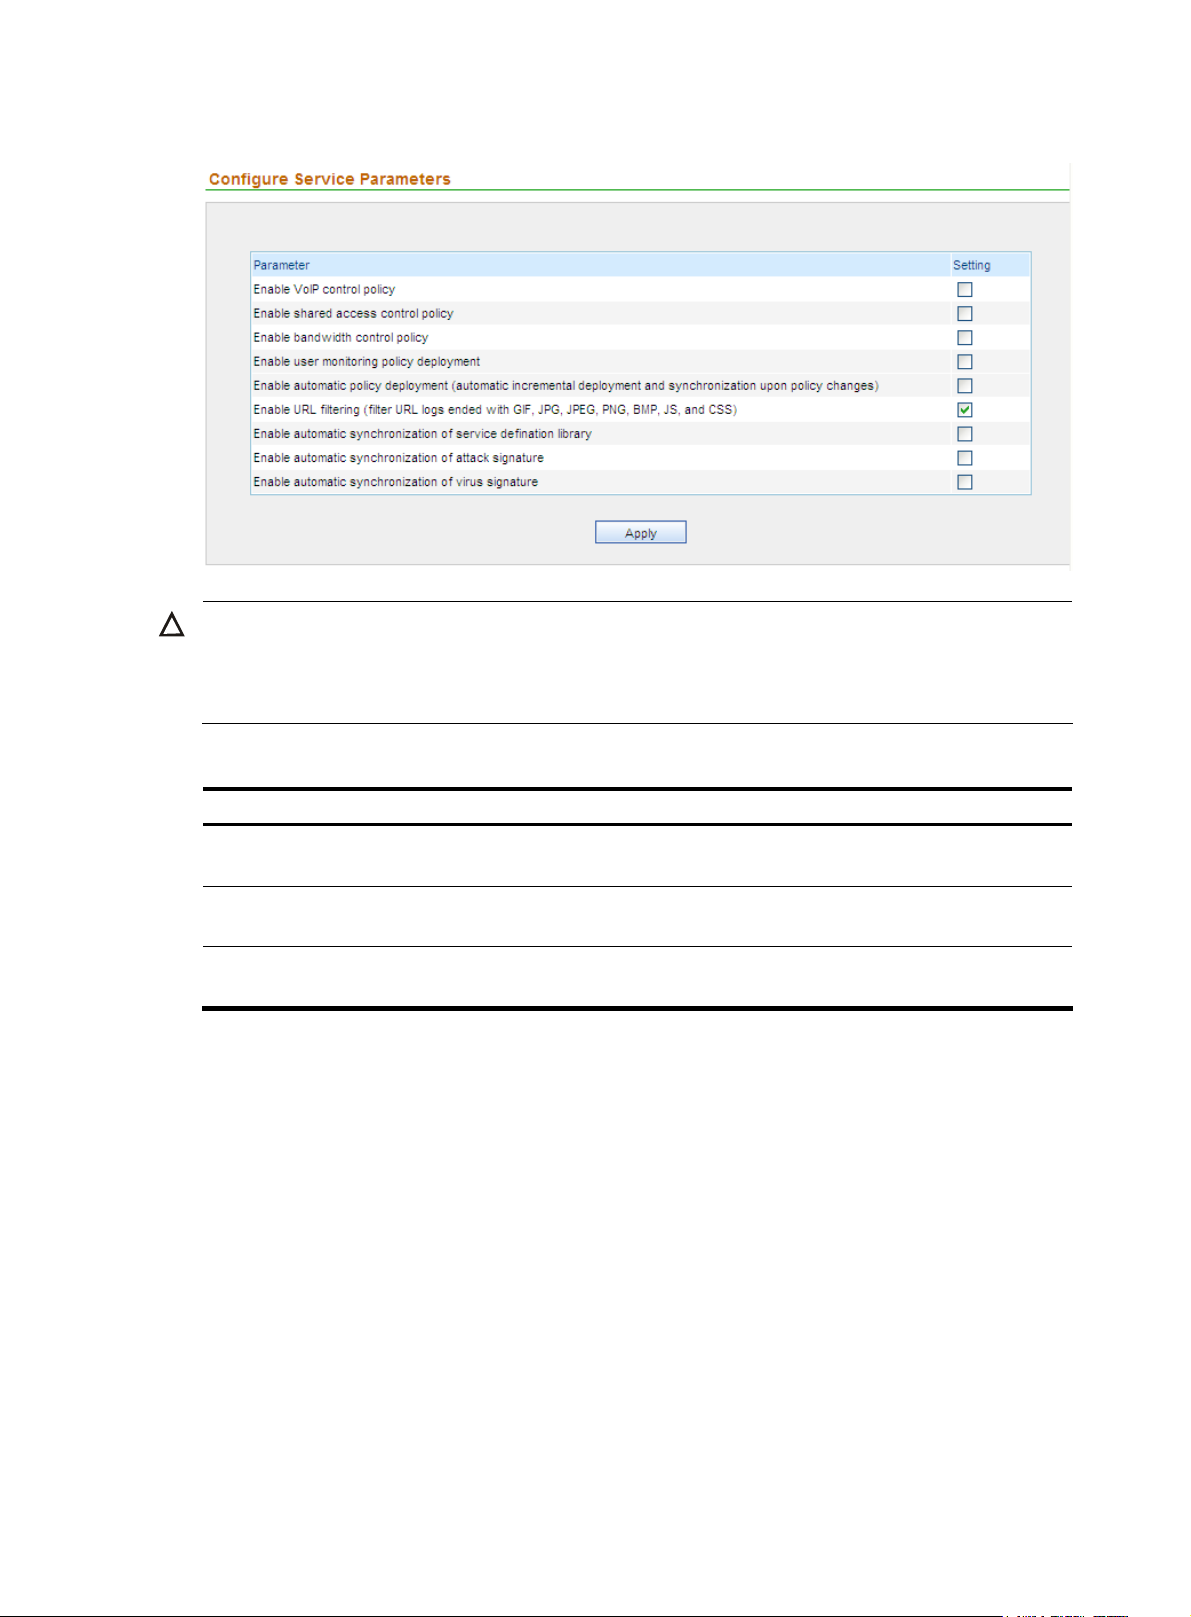
Figure 19 Service parameter configuration page
CAUTION:
On the service parameter configuration page, the IPS related configuration items are Enable automatic
policy deployment, Enable automatic synchronization of attack signature, and Enable automatic
synchronization of virus signature. Other items will not take effect in IPS management.
Table 23 Service parameters configuration items
Item Description
Enable automatic policy deployment
Enable automatic synchronization of
attack signature
Enable automatic synchronization of
virus signature
Automatically deploys and synchronizes the increased
configuration upon policy changes.
Automatically synchronizes the IPS attack signatures when
connected to the device.
Automatically synchronizes the IPS virus signatures when
connected to the device.
Configuring management ports
This function allows you to specify the SecCenter background ports for receiving various logs from
devices.
Configuration guide
1. From the navigation tree of the system management component, select Management Ports under
System Config. The management ports configuration page appears, as shown in
2. Configure the settings. Table 24 describes the management port configuration items.
3. Click Apply.
Figure 20.
21
Page 28
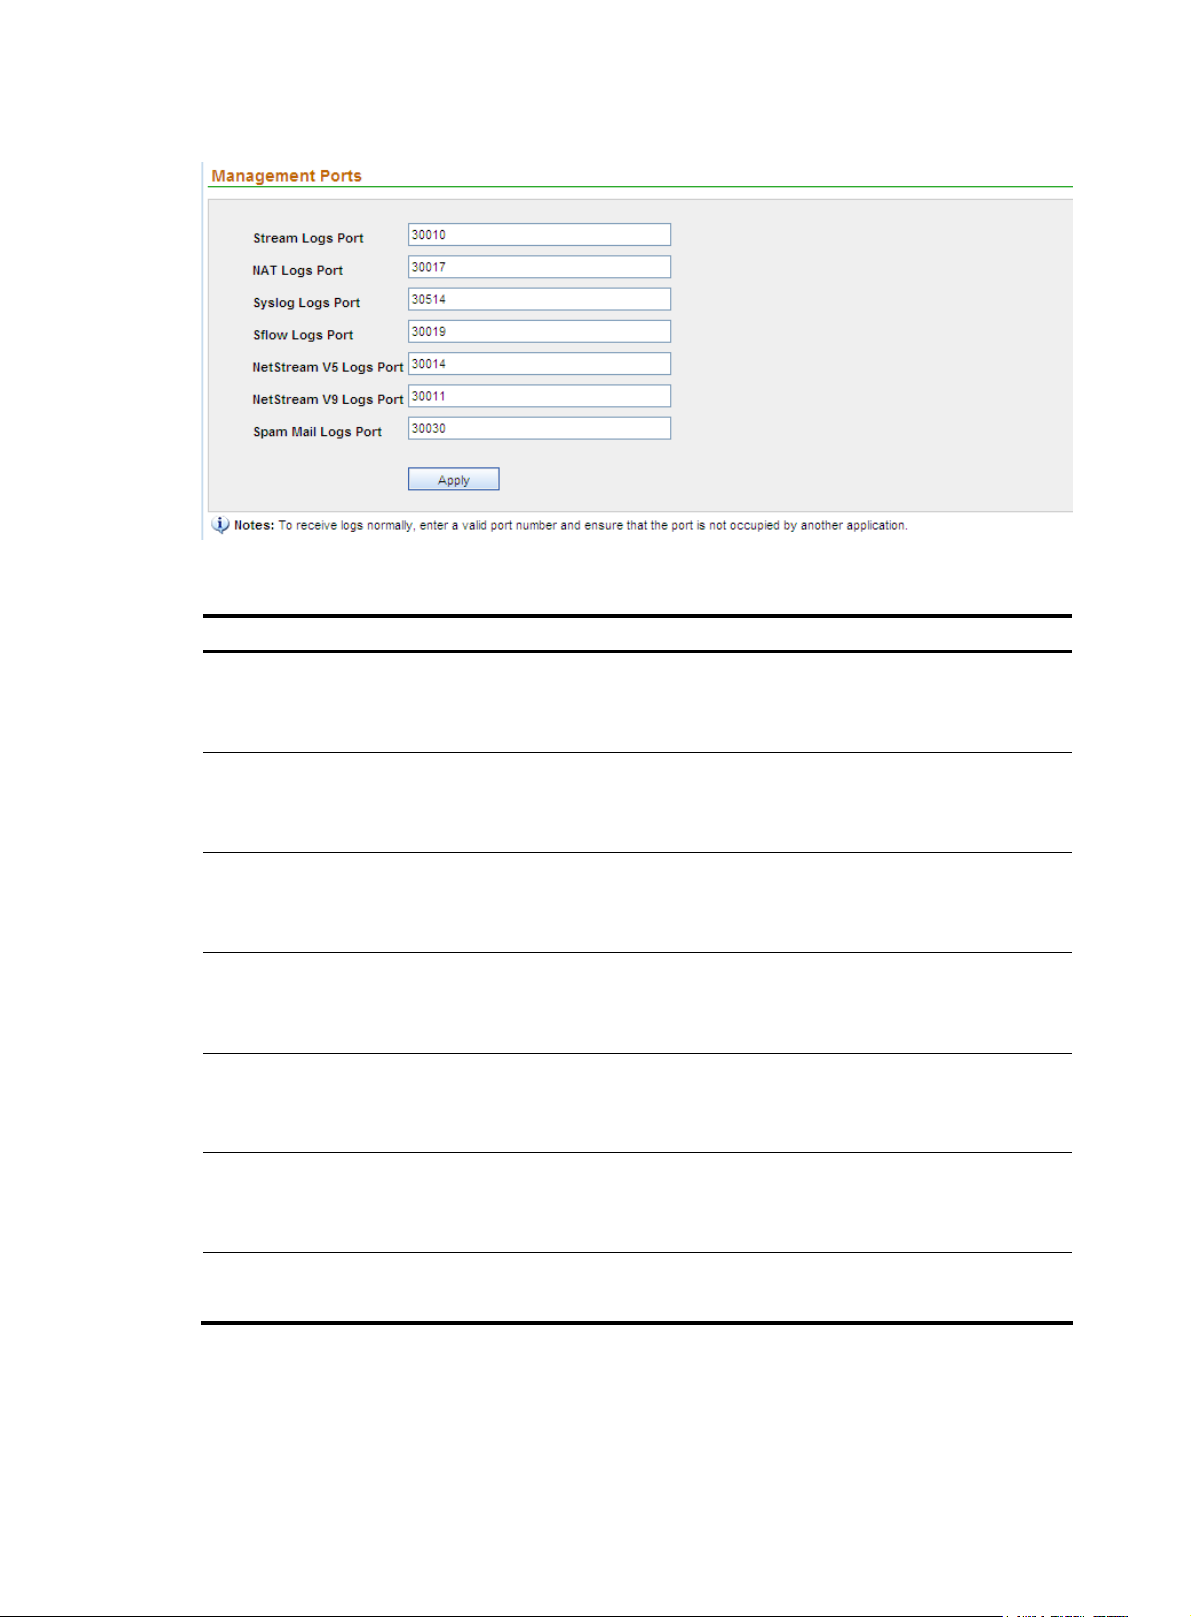
Figure 20 Management port configuration page
Table 24 Management port configuration items
Item Description
Required
Stream Logs Port
Type the port for receiving stream logs.
The port number must be in the range from 1 to 65534.
NAT Logs Port
Syslog Port
Sflow Logs Port
NetStream V5 Logs Port
NetStream V9 Logs Port
Spam Mail Logs Port
Required
Type the port for receiving NAT logs.
The port number must be in the range from 1 to 65534.
Required
Type the port for receiving syslogs.
The port number must be in the range from 1 to 65534.
Required
Type the port for receiving Sflow logs.
The port must be in the range from 1 to 65534.
Required
Type the port for receiving NetStream V5 logs.
The port number must be in the range from 1 to 65534.
Required
Type the port for receiving NetStream V9 logs.
The port number must be in the range from 1 to 65534.
Type the port for receiving spam mail logs.
The port number must be in the range from 1 to 65534.
Configuring the mail server
You can specify a mail server to which alarms are to be sent in mails.
22
Page 29

Configuration guide
1. From the navigation tree of the system management component, select Mail Server under System
Config. The Configure Mail Server page appears, as shown in
2. Configure the settings. Table 25 describes the mail server configuration items.
3. Click Apply.
Figure 21 Configure a mail server
Figure 21.
Table 25 Mail server configuration items
Item Description
Required
Mail Server IP
Require authentication
Username
Password
Sender’s Mail Address
Type the IP address or domain name of the mail server
The IP address can comprise up to 40 characters and must not contain illegal
characters.
Optional
Select this check box to configure authentication.
Optional
Username for authentication
The username can comprise up to 40 characters and must not contain illegal
characters.
Optional
Password for authentication
The password must comprise 6 to 20 alphanumeric characters, and its
strength must meet the password strength requirements of the device.
Required
Mail address of the sender
The mail address must comply with the correct format.
23
Page 30

Item Description
Optional
Send to
Type an email address and click Test. An email will be sent to the email box
for testing.
Configuring SMS alarming
You can specify a phone number to which alarms are to be sent by Short Message Service (SMS)
messages.
Configuration guide
1. From the navigation tree of the system management component, select SMS Alarm Configuration
under System Config. The SMS alarm configuration page appears, as shown in
2. Configure the settings. Table 26 describes the SMS alarming configuration items.
3. Click Apply.
Figure 22 Configure SMS alarming
Figure 22.
Table 26 SMS alarming configuration items
Item Description
Enable SMS Alarm
COM Port
Baud Rate
Send to
Managing filters
A filter can filter information about IPS devices to present only information that you are interested in
through reports.
By configuring filters, you can specify filtering conditions flexibly.
Required
Specify whether to enable SMS alarming.
Required
Select a COM port for sending SMS messages. The port defaults to COM4.
Required
Select a baud rate for sending SMS messages.
Optional
Type a number and click Test. A message will be sent to the phone for testing.
24
Page 31

Configuration guide
From the navigation tree of the system management component, select Filter Management under System
Config. The filter management page appears, as shown in
management functions.
Figure 23 Filter management page
Table 27 Filter management functions
Function Description
Figure 23. Table 27 describes the filter
Filter list
Filter list Allows you to view details about filters and modify filter settings.
Adding a filter Allows you to add filters.
Allows you to delete filters that are no longer in use.
Deleting filters
Follow these steps:
1. Select the check boxes before the filters to be deleted.
2. Click Delete.
From the navigation tree of the system management component, select Filter Management under System
Config. The filter management page appears, as shown in
Figure 23.
Table 28 Fields of the filter list
Field Description
Filter Name
Filter Description
Device
Operation
Name of the filter
Description of the filter
Device that the system collects statistics on
Click the icon of a filter to modify the settings of the filter.
Return to Filter management functions.
Adding a filter
1. From the navigation tree of the system management component, select Filter Management under
2. Configure the settings. Table 29 describes the filter configuration items.
3. Click Add.
System Config to enter the filter management page. Then, click Add to enter the page for adding
a filter, as shown in
Figure 24.
25
Page 32

Figure 24 Add a filter
Table 29 Filter configuration items
Item Description
Required
Filter Name
Filter Description
Event Severity
Device
Source IP
Type a name for the filter.
The filter name can comprise up to 40 characters and must not contain illegal
characters.
Optional
Type a description for the filter.
The description can comprise up to 40 characters and must not contain illegal
characters.
Optional
Select the severity of the events that you want the system to collect statistics on.
Optional
Select the devices that you want the system to collect statistics on.
Optional
Specify the source IP addresses that you want the system to collect statistics on.
Destination IP
Source Port
Optional
Specify the destination IP addresses that you want the system to collect statistics on.
Optional
Specify the source ports that you want the system to collect statistics on.
26
Page 33
Item Description
Destination Port
Protocol
Event
Optional
Specify the destination ports that you want the system to collect statistics on.
Optional
Select the protocols that you want the system to collect statistics on.
Optional
Specify the events that you want the system to collect statistics on.
Return to Filter management functions.
Monitoring the disk space
The disk monitoring function allows you to set a warning disk space value. When the free disk space
reaches this value, the system sends a warning message for you to adopt measures to avoid data loss due
to insufficient disk space.
Besides, it shows the disk usage information during the last 3 and 36 hours and sorts the information
based on system modules.
Configuration guide
1. From the navigation tree, select Disk Monitoring under System Config to enter the Alarm Config
page, as shown in
Figure 25.
2. Set the warning disk space and alarm mode. Table 30 describes the configuration items.
3. Click Apply.
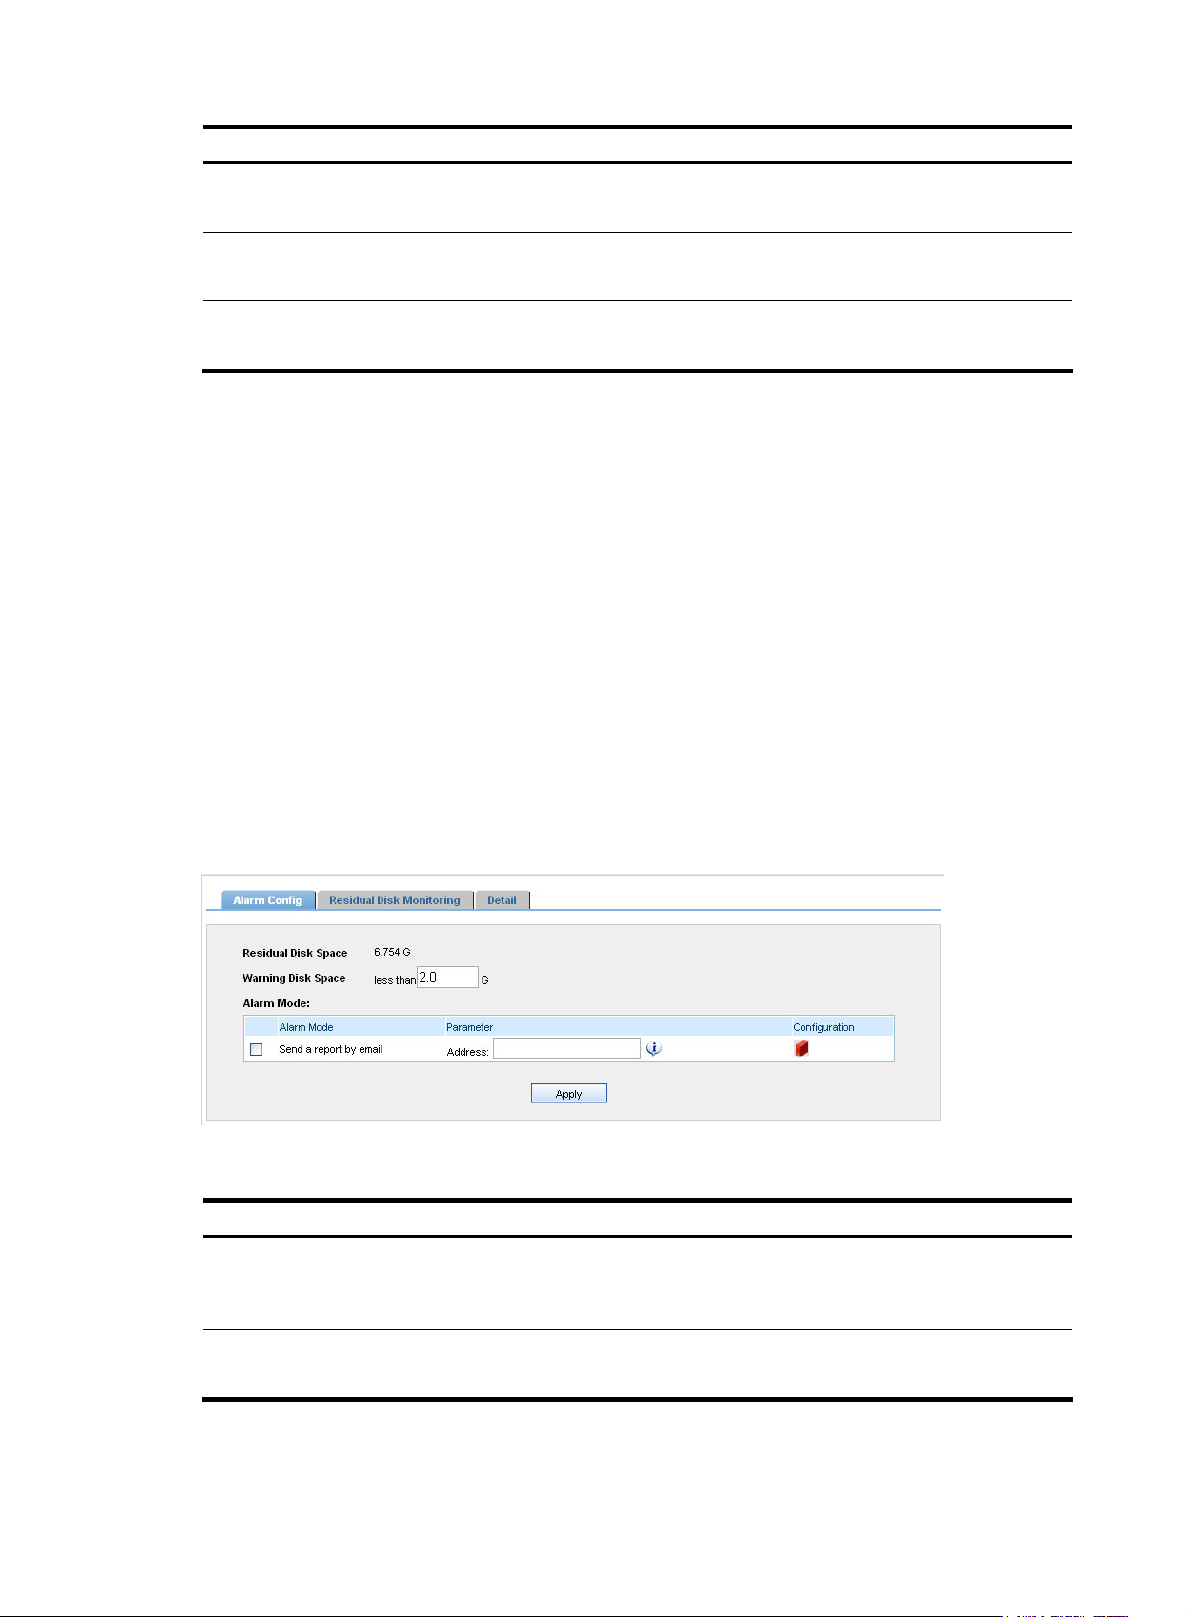
Figure 25 Alarm configuration
Table 30 Disk space alarm configuration items
Item Description
Required
Warning Disk Space
Send a report by email
Set the warning disk space. An alarm will be generated if the free disk space is
less than the minimum.
Optional
Select this check box to send alarms in emails to a specified mail box.
27
Page 34

The Residual Disk Monitoring tab page shows the disk usage information during the last 3 and 36 hours,
and 36 days, and the remaining disk space per day, as shown in
the information based on system modules.
Figure 26 Residual Disk Monitoring tab page
Figure 26. The Detail tab page sorts
Managing subsystems
Subsystem management implements unified management and monitoring of multiple IPS Manager
systems. By adding these systems as the subsystems, you can visit these subsystems without entering the
URLs, usernames, and passwords repeatedly.
Configuration guide
From the navigation tree of the system management component, select Subsystem Management under
System Config. The subsystem management page appears, as shown in
the fields of the subsystem list.
Figure 27. Table 31 describes
28
Page 35

Figure 27 Subsystem management page
Table 31 Fields of the subsystem list
Field Description
Server IP IP address of the subsystem server
Port Service port of the subsystem server
User Name Username for logging in to the subsystem
Password Password for logging in to the subsystem
Link URL of the subsystem. Click the link to log in to the subsystem.
Adding a subsystem
1. From the navigation tree of the system management component, select Subsystem Management
under System Config.
2. Click Add to enter the Add Subsystem page, as shown in Figure 28.
3. Configure the settings. Table 32 describes the configuration items for adding a subsystem.
4. Click Add.
Figure 28 Add a subsystem
Table 32 Configuration items for adding a subsystem
Item Description
Server IP
Server Port
Required
Specify the IP address of the subsystem server.
Required
Specify the server port providing web access service. The default port is 80.
29
Page 36

Item Description
Required
User Name
Specify the username for logging in to the subsystem.
The username can comprise up to 40 characters and must not contain illegal
characters. Unless otherwise stated, illegal characters include: ” < > ’ & % : ; /
Required
Password
Specify the password for logging in to the subsystem.
The password must comprise 6 to 20 alphanumeric characters, and its strength
must meet the password strength requirements of the device.
30
Page 37

IPS management
Overview
The IPS Manager allows for centralized management of IPS features of the IPS devices in the network and
centralized event information collection and analysis. It implements realtime monitoring, event snapshot,
comprehensive analysis, event details, attack/virus event alarms, centralized and periodic report
exporting, and centralized signature file upgrading.
To access the IPS management component of the IPS Manager, select the IPS tab. Then, you can
configure the following functions:
•
IPS device management
Realtime monitoring
•
Event analysis
•
Policy management
•
IPS device management
Managing IPS devices
With the management right on devices, you can add and delete devices, upgrade signature files, view
the detailed information of IPS devices, and change the device groups and labels of the devices.
Configuration guide
From the navigation tree of the IPS management component, select Devices under Device Management
to enter the IPS device management page, as shown in
of the IPS devices listed on the page.
Figure 29 IPS device management page
Table 33 IPS device management functions
Figure 29. You can view the detailed information
Function Description
IPS device list Allows you to view information about the current IPS devices.
Adding IPS devices
Allows you to add the IPS devices managed in the system management
component to the IPS management component.
31
Page 38

Function Description
Deleting devices
Updating signature files Allows you to update the signature files of devices.
Enabling logging
Disabling logging
Synchronizing policies Allows you to synchronize the IPS policies to IPS devices.
IPS device list
Allows you to delete IPS devices.
Follow these steps:
1. Select the check box before the IPS devices you want to delete on the
IPS device list.
2. Click Delete.
Allows you to enable the logging function of the devices.
Only after the logging function of a device is enabled, can the SecCenter
IPS Manager get the detailed intrusion protection information of the
device, and based on the information, collect statistics and export
reports.
Allows you to disable the logging function of the devices.
The SecCenter system does not collect statistics and export reports for
devices with the logging function disabled.
From the navigation tree of the IPS management component, select Devices under System Device
Management to enter the IPS device management page.
device list page, and
Table 35 describes the fields of the IPS device list.
Table 34 describes the query options on the IPS
Table 34 Query options on the IPS device list page
Option Description
Device IP Query an IPS device by its IP address.
Query an IPS device by its label.
NOTE:
Device Label
The label you input here must not include the parentheses and IP address.
For example, if the device label is wxsh (10.154.78.120), input only
wxsh.
Table 35 Fields of the IPS device list
Field Description
Device name and IP address. You can click the link to view the detailed
Device Label
Device Group Device group to which the device belongs.
information of the device and modify the device settings. For more
information, see “
Device information.”
Attack Signature Version Version of the attack signature file of the device.
AV Signature Version Version of the anti-virus signature file of the device.
Signature State Upgrading status of the signature files of the device.
Logging State
Policy Synchronization Policy synchronization status: synchronized or unsynchronized
This field indicates that whether the device is configured to send
NetStream logs to the SecCenter.
32
Page 39

Field Description
Policy Application Details
Return to IPS device management functions.
Adding IPS devices
This function is used to add IPS devices to the IPS device management component. You can add only the
devices that are under your management.
1. From the navigation tree of the IPS management component, select Devices under Device
Management to enter the device management page.
2. Click Add to enter the page for adding IPS devices, as shown in Figure 30.
3. Select the check boxes before the devices you want to add to the IPS management component and
then click Add. The IPS device list page appears, indicating that the devices are successfully
added.
Figure 30 Add IPS devices
Click the icon to enter the policy application configuration page. For
more information, see “
Configuring policy applications.”
Return to IPS device management functions.
Updating signature files
The IPS Manager can automatically detect signature file versions and current status of the IPS devices,
helping you know whether signature files are up-to-date. The IPS Manager allows you to update the
signature files of all managed IPS devices simultaneously.
1. From the navigation tree of the IPS management component, select Devices under Device
Management to enter the device management page.
2. Select devices, and then click Update Sig to enter the page for updating signature files of the
devices, as shown in
3. Click OK. After signature files are updated successfully, the IPS device list page appears.
Figure 31.
33
Page 40

Figure 31 Update signature files
Return to IPS device management functions.
Managing signature files
This function allows you to add, delete, and modify signature files. A device can detect various attacks
and viruses only after you specify signature files for it.
Configuration guide
From the navigation tree of the IPS management component, select Signature Files under Device
Management to enter the signature file management page, as shown in
signature files present in the IPS Manager.
Figure 32 Signature file management page
Table 36 Signature file management functions
Function Description
Signature files list Allows you to view all signature files present in the current system.
Uploading a signature file Allows you to save a signature file to a specified location.
Deleting signature files
Figure 32. This page lists all
Table 36 describes the signature file management functions.
Allows you to delete signature files.
Follow these steps:
3. Select the check boxes before the signature files that you want to
delete.
4. Click Delete.
34
Page 41

Signature files list
From the navigation tree of the IPS management component, select Signature Files under Device
Management to enter the signature file management page.
signature file management page, and
Table 37 Query options on the signature file management page
Option Description
Type
Table 38 Fields of the signature files list
Field Description
Filename Name of the signature file
Version Version information of the file
Type Type of the file, either Attack signature file or AV signature file.
Table 37 describes query options on the
Table 38 describes the fields of the signature files list.
Query signature files by type.
There are two types of signature files: Attack signature file and AV
signature file.
Path
In the Operation column of the signature files list, you can click the icon of a file to enter the page for
modifying the storage path of the file. For more information, see “
Return to
Signature file management functions.
Uploading a signature file
This function allows you to save a signature file to a specified location.
1. From the navigation tree of the IPS management component, select Signature Files under Device
Management to enter the signature file management page.
2. Click Upload to enter the Upload Signature File page, as shown in Figure 33.
3. Configure the settings. Table 39 describes the configuration items for adding a signature file.
4. Click OK. The signature file will be uploaded to the specified server.
Figure 33 Upload a signature file
Path where the file is saved in the IPS Manager. You can click the link to
download the file.
Modifying a signature file.”
35
Page 42

Table 39 Configuration items for uploading a signature file
Item Description
Server for Managed
Devices to Access
Signature File to be
Uploaded
Return to Signature file management functions.
Modifying a signature file
This function allows you to modify the storage path of a signature file, including the IP address and port
of the SecCenter server.
1. From the navigation tree of the IPS management component, select Signature Files under Device
Management to enter the signature file management page.
2. Click the icon of a signature file to enter the page, as shown in Figure 34.
3. Modify the storage path of the file.
4. Click OK.
Figure 34 Modify the storage path of a signature file
Required
Select the IP address of a server installed with SecCenter. Make sure that the IP
address is reachable to managed IPS devices.
Required
Select the signature file to be uploaded to the specified server.
Do not upload a signature file repeatedly.
Return to Signature file management functions.
Displaying device statistics
The device statistics function can collect statistics on devices by day, week, and month. You can select the
statistics period as needed, and display the statistics report, which provides statistics on each device,
including the total number of events, number of blocked events, des tination I P coun t, source IP cou nt, and
destination port count.
36
Page 43

Configuration guide
From the navigation tree of the IPS management component, select Device Statistics under Device
Management to enter the device statistics page, as shown in
Figure 35 Device statistics
In the Analysis column of the attack protection list or virus protection list, you can click the icon of a
device to enter the attack/virus event analysis page of the device. For more information, see “
attack/virus/DDoS attack event analysis reports.”
Figure 35.
Displaying
Realtime monitoring
The realtime monitoring function supports centralized monitoring of security events. It can collect and
report attack events, virus events, and DDoS attack events in real time, and provide the snapshot
information based on IPS devices and events.
Displaying event snapshots
The event snapshot presents the attack protection, virus protection, and DDoS attack protection
information in the last hour, including the time, total number of events, blocked events count, source
addresses, destination addresses, as well as event types. Besides, it provides the Top N lists of attack
events, virus events, DDoS attack events, targets, sources, ports, and protocols, helping you track the
latest security status of the network in an intuitive way.
Configuration guide
From the navigation tree of the IPS management component, select Event Snapshot under Realtime
Monitoring. The Snapshot page appears, as shown in
query options, and
and virus protection tabs.
Table 41 describes the fields of the event snapshot lists in snapshot, attack protection,
Figure 36. Table 40 describes the event snapshot
37
Page 44

Figure 36 Snapshot
Table 40 Event snapshot query options
Option Description
Select a device, a device group, or All devices from the Device dropdown list. The
system will display the relevant event information. All devices and device groups
Device
that are under your management will appear in the dropdown list.
• Select a device group: Specifies all devices in the device group.
• Select a device name: Specifies a single device.
Top
Statistics Time
Select a value in the Top dropdown list to specify the number of records to be
displayed in the graphs and lists.
Period of time during which the statistics were collected. The default snapshot
statistics time is the last hour.
38
Page 45

Table 41 Fields of the event snapshot lists in snapshot, attack protection, and virus protection tabs
Field Description
Attack Event/Attack
Destination IP
Virus Event/Virus
Source IP
DDoS Attack/DDoS
Attack Destination IP
Event Count Count of the events
Percentage Percentage of the events
• Attack protection lists include statistics on total attack events, attack events blocked,
attack source IP addresses, attack destination IP addresses, and attack event types.
• Virus protection lists include statistics on total virus events, virus events blocked, virus
destination IP addresses, and virus event types.
• DDoS attack lists include statistics on DDoS events and DDoS attack destination IP
addresses.
• In the Details column of an event snapshot list, you can click the icon of an attack, virus, or
DDoS event to enter event details page. For more information, see “
“
Displaying virus event details,” and “Displaying DDoS event details.”
Displaying attack event details,”
• Each attack event name is a link. You can click the link to view the event’s detailed information,
including event ID, event name, severity, description, application, and solution.
Besides the Snapshot tab, the system also provides Attack Protection tab (see
tab (see
Figure 38), and DDoS Attack tab (see Figure 39), which provide realtime monitoring reports of
Figure 37), Virus Protection
attack events, virus events, and DDoS attack events of the devices. The system collects statistics on the
attack/virus/DDoS attack event information during the last hour, presenting attack event/virus
event/DDoS event trend graphs. Under the trend graphs are Top N lists showing the detailed event
statistics, including Top N events, sources, targets, ports, and protocols.
Figure 37 Attack protection event snapshot
39
Page 46

Figure 38 Virus protection event snapshot
Figure 39 DDoS attack event snapshot
40
Page 47

Displaying attack/virus/DDoS snapshot list
The system presents attack, virus, and DDoS events not only through graphs but also lists. The
attack/virus/DDoS event snapshot lists present you the attack/virus/DDoS attack events that occurred
during the last hour in order of time, with the most recent event at the top. Each event record includes the
event’s time, device IP address, source IP address, destination IP address, event description, protocol,
source port, and destination port, helping you track the latest security status of the network in an intuitive
way.
The IPS Manager provides filters for you to choose information of interest. For more information about
filters, see “
Configuration guide
From the navigation tree of the IPS management component, select Attack Snapshot List, Virus Snapshot
List, or DDoS Current Event List under Realtime Monitoring to enter the attack snapshot list page, the virus
snapshot list page, or the DDoS current event list page, as shown in
Figure 40 Attack event snapshot list
Managing filters.”
Figure 40, Figure 41, and Figure 42.
Figure 41 Virus event snapshot list
Table 42 describes the query options of the attack/virus snapshot list. Table 43 describes the fields of the
attack/virus snapshot list, and
Table 44 describes the fields of the DDoS current event list.
41
Page 48

Table 42 Query options of the attack/virus snapshot list
Option Description
Filter Select a filter from the dropdown list to display specific attack or virus events.
Statistics Time
Period of time during which the statistics were collected. The attack or virus
snapshot statistics time is the last hour.
Table 43 Fields of the attack/virus snapshot list
Field Description
Time Time when the attack or virus event occurred.
Device IP IP address of the IPS device that captured the event.
Src IP/MAC Source IP address
Dest IP/MAC Destination IP address
Event Name of the event
Protocol —
Src Port Source port
Dest Port Destination port
Figure 42 DDoS event snapshot list
Table 44 Fields of the DDoS current event
Field Description
Time Time when the DDoS event occurred
Protected Network IP network segment protected against the DDoS attack
Src IP Source IP address of the DDoS attack
Dest IP Destination IP address of the DDoS attack
Attack Type Type of the DDoS attack
42
Page 49

Field Description
Protocol Name of the protocol used by the DDoS attack
Attack name Attack name of a DDOS attack
Threshold Threshold of the DDoS attack
Max Avg Rate Maximum average rate of the DDoS attack event
Monitoring IPS devices
In addition to the IPS event information of the entire network, the IPS management component also allows
you to view the IPS event and snapshot information of every IPS device.
Configuration guide
From the navigation tree of the IPS management component, select Device Monitoring under Realtime
Monitoring to enter the device monitoring page, as shown in
protection, virus protection, and DDoS attack protection information in the last hour, including the total
number of events, number of blocked events, number of source/destination IP addresses, and number of
source/destination ports.
Figure 43 Device monitoring
Figure 43. This page lists the attack
On the page, you can perform the following operations:
• Click the
device. For more information, see “
• Click the
more information, see “
“
Displaying DDoS event details.”
icon in the Snapshot column of a device to enter the event snapshot page of the
Displaying event snapshots.”
icon in the Details column of a device to enter the event details page of the device. For
Displaying attack event details,” “ Displaying virus event details,” or
Event analysis
The IPS management component features comprehensive analysis and statistics reports, through which
you can evaluate the network security status in real time, and take prevention measures accordingly.
Displaying attack/virus/DDoS attack event analysis reports
The system supports comprehensive analysis of attacks, viruses, and DDoS attacks, including:
43
Page 50

• Event trend analysis during a day, week, month, and a customized period
• Top N statistics reports by event, destination IP address, source IP address, destination/source port,
and protocol. You can export the reports.
Configuration guide
From the navigation tree of the IPS management component, select Attack Event Analysis under Event
Analysis. The attack event trend page appears by default, as shown in
view the attack event trend analysis during a day, week, month, or a customized period of time. This
page shows a trend graph comparing the counts of blocked attack events and the other attack events as
well as a trend graph of attack events by severity level. Under the trend graphs is a list showing the
detailed attack event statistics, including the number of events, number and percentage of blocked events,
and number of events of each severity level.
Figure 44 Attack event analysis
Figure 44. On the page, you can
From the navigation tree of the IPS management component, select Virus Event Analysis under Event
Analysis. The virus event trend page appears, as shown in
Figure 45. On the page, you can view virus
event trend analysis during a day, week, month, or a customized period of time. This page shows a trend
graph comparing the counts of blocked virus events and the other virus events as well as a list showing
the detailed virus event statistics, including the number of events, number and percentage of the blocked
events.
44
Page 51

Figure 45 Virus event analysis
From the navigation tree of the IPS management component, select DDoS Event Analysis under Event
Analysis. The DDoS event trend page appears, as shown in
Figure 46.
On the page, you can view DDoS event trend analysis during a day, week, month, or a customized
period of time. This page shows a trend graph of DDoS events, a trend graph of DDoS attack types, as
well as a list showing the detailed DDoS event statistics, including the number of events, proportion of the
DDoS events to t he total number of event s, and number of each type of DDoS atta cks.
Table 45 describes
the event analysis query options.
45
Page 52

Figure 46 DDoS attack event analysis
Table 45 Event analysis query options
Option Description
Select a device, a device group, or All devices from the Device dropdown list. The system
displays the relevant event analysis information. All devices and device groups that are
Device
under your management will appear in the dropdown list.
• Select a device group: Specifies all devices in the device group.
• Select a device name: Specifies a single device.
Filter Select a filter from the dropdown list to display specific attack or virus events.
Duration
Time Select the statistics time.
Select the statistics duration. You can select Day, Week, or Month, or select Customize to
specify a duration.
Besides the event trend graphs, the system also provides contrast graphs of Top N events, destination IP
addresses, source IP addresses, destination/source ports, and protocols.
Figure 47 shows a Top N attack
events contrast graph.
46
Page 53
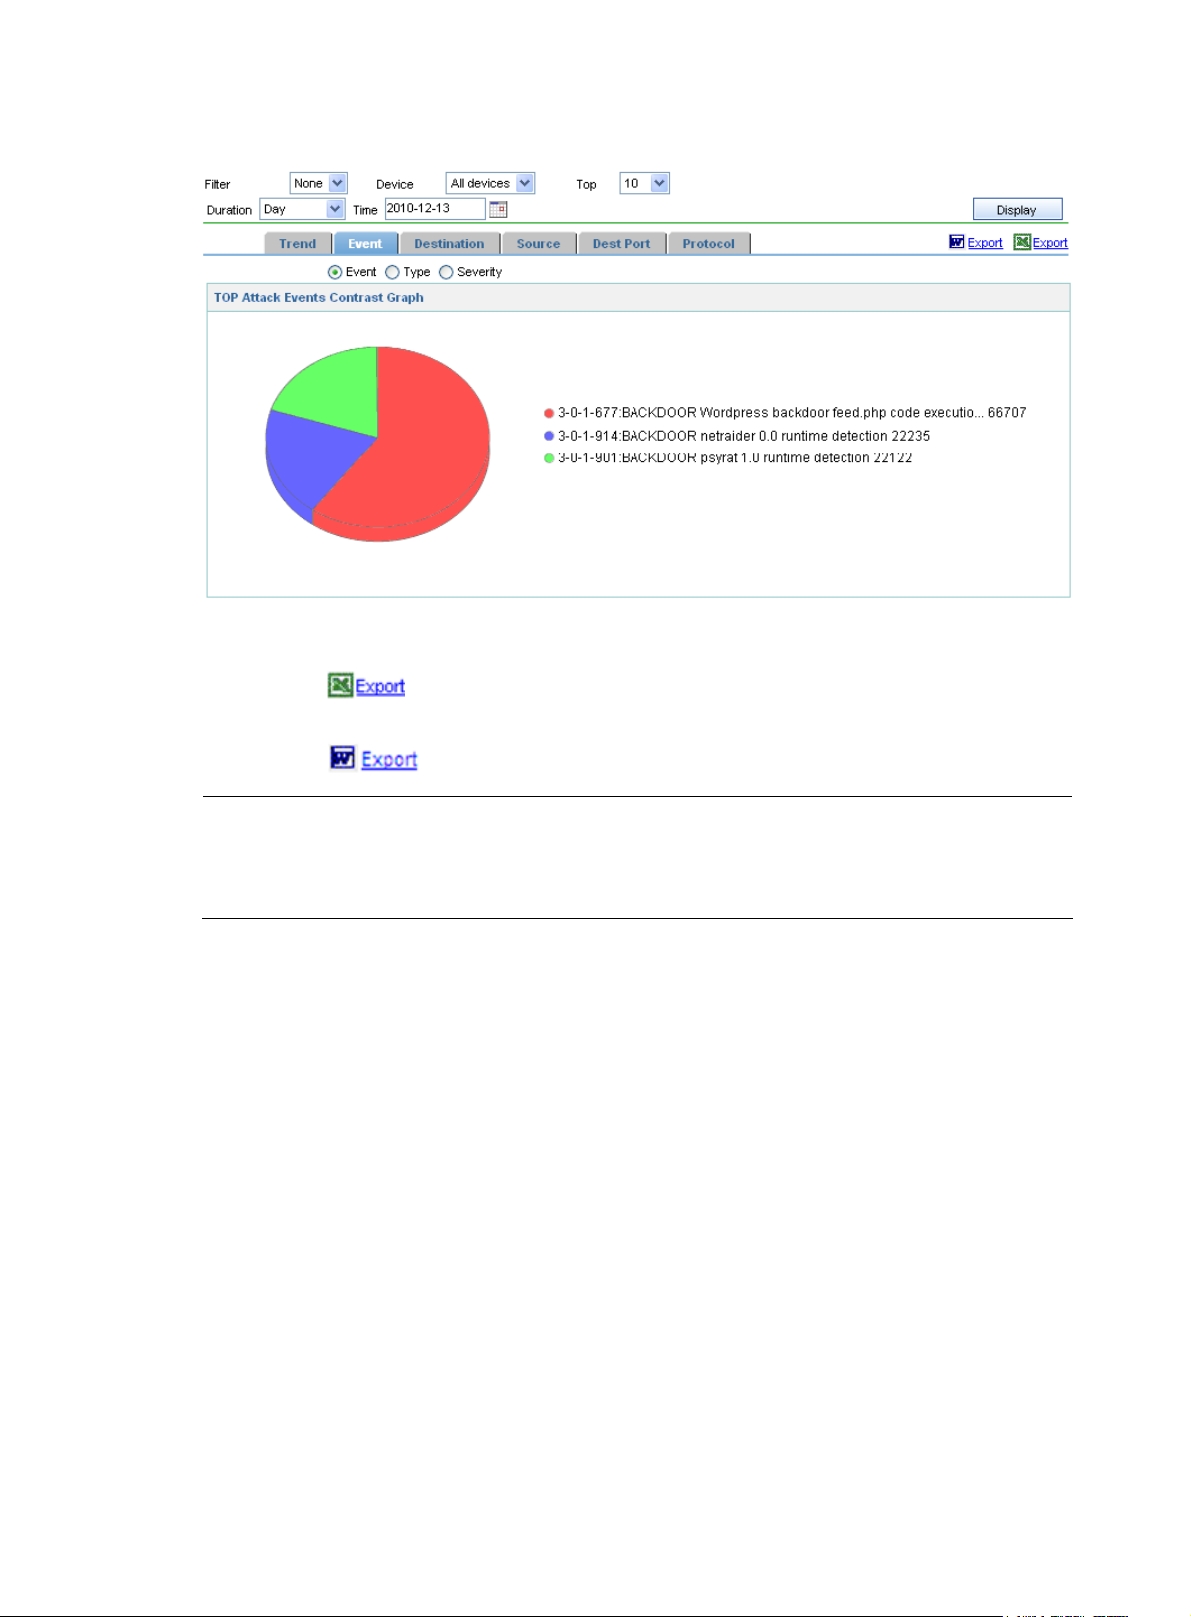
Figure 47 Top 10 attack events analysis
On the page, you can perform the following operations:
• Click the
link to export all the analysis reports that the event analysis function provides in
an excel file.
• Click the
link to export all the analysis reports in a Word file.
NOTE:
Logs are aggregated at 3 o’clock in the morning every day. When you query event information of the
current month, the system displays only the data collected from the first day of the month to the day before
the current day.
Displaying attack event details
The IPS Manager provides the powerful query function, which helps you quickly find the desired security
event information from history data of months. The event information can be exported as an HTML file,
an Excel file, and a Word file.
Configuration guide
From the navigation tree of the IPS management component, select Attack Event Details under Event
Analysis to enter the attack event details page, as shown in
attack events by event name, type, severity, source IP address, destination IP address, destination port,
and protocol to view the attack event details.
Table 47 describes the fields of the attack event details.
Figure 48. This page allows you to query
Table 46 describes the attack event query options, and
47
Page 54

Figure 48 Attack event details
Table 46 Attack event details query options
Option Description
Filter Select a filter from the dropdown list to display specific attack events.
Type
Device
Select the attack type. Options include Blocked attack events and Other attack events.
The default is --, which means any attack type.
Select a device, a device group, or All devices from the Device dropdown list. The system
will display the relevant event information. All devices and device groups that are under
your management will appear in the dropdown list.
• Select a device group: Specifies all devices in the device group.
• Select a device name: Specifies a single device.
Event Name Select an attack event by its name.
Protocol Select the protocol. The default is --, which means any protocol.
Severity Select the attack severity. The default is --, which means any severity.
Src IP Specify the source IP address.
Dest IP Specify the destination IP address.
Dest Port Specify the destination port.
ID Specifies the event ID.
Duration
Time Select the statistics time. The value range varies with the selected statistics duration.
Select the statistics duration. You can select Day, Week, or Month, or select Customize to
specify a duration.
Grouping by
Select a grouping mode. The system supports seven modes: None, Event, Src IP, Dest IP, Src
IP and Dest IP, Dest Port, and Protocol.
48
Page 55

Table 47 Fields of the attack event details
Field Description
Time Time when the attack event occurred
Src IP/MAC Source IP address
Dest IP/MAC Destination IP address
Description of the event.
Event
Dest Port Destination port
Protocol —
VLAN VLAN in which the attack event occurred
Event Count Number of events that occurred at the time
Agent IP IP address of the agent for the attack event
You can click the link of an event to view the detailed event information, including
the severity, description, and application (see
Figure 49).
Details
Click the
Figure 49 Attack event details
icon to view the attack event details, as shown in Figure 49.
49
Page 56

NOTE:
Logs are aggregated at 3 o’clock in the morning every day. When you query event information of the
current month, the system displays only the data collected from the first day of the month to the day before
the current day.
Displaying virus event details
This function helps you quickly find the desired virus event information from history data of months. The
virus event information can be exported as an HTML file, a Word file, and an Excel file.
Configuration guide
From the navigation tree of the IPS management component, select Virus Event Details under Event
Analysis to enter the virus event details page, as shown in
events by event name, type, severity, source IP address, destination IP address, source port, and protocol
to view the virus event details.
describes the fields of the virus event details.
Figure 50 Virus event details
Table 48 describes the query options of virus event details, and Table 49
Figure 50. This page allows you to query virus
Table 48 Virus event details query options
Option Description
Filter Select a filter from the dropdown list to display specific virus events.
Type Select the event type. The default is --, which means any virus type.
50
Page 57
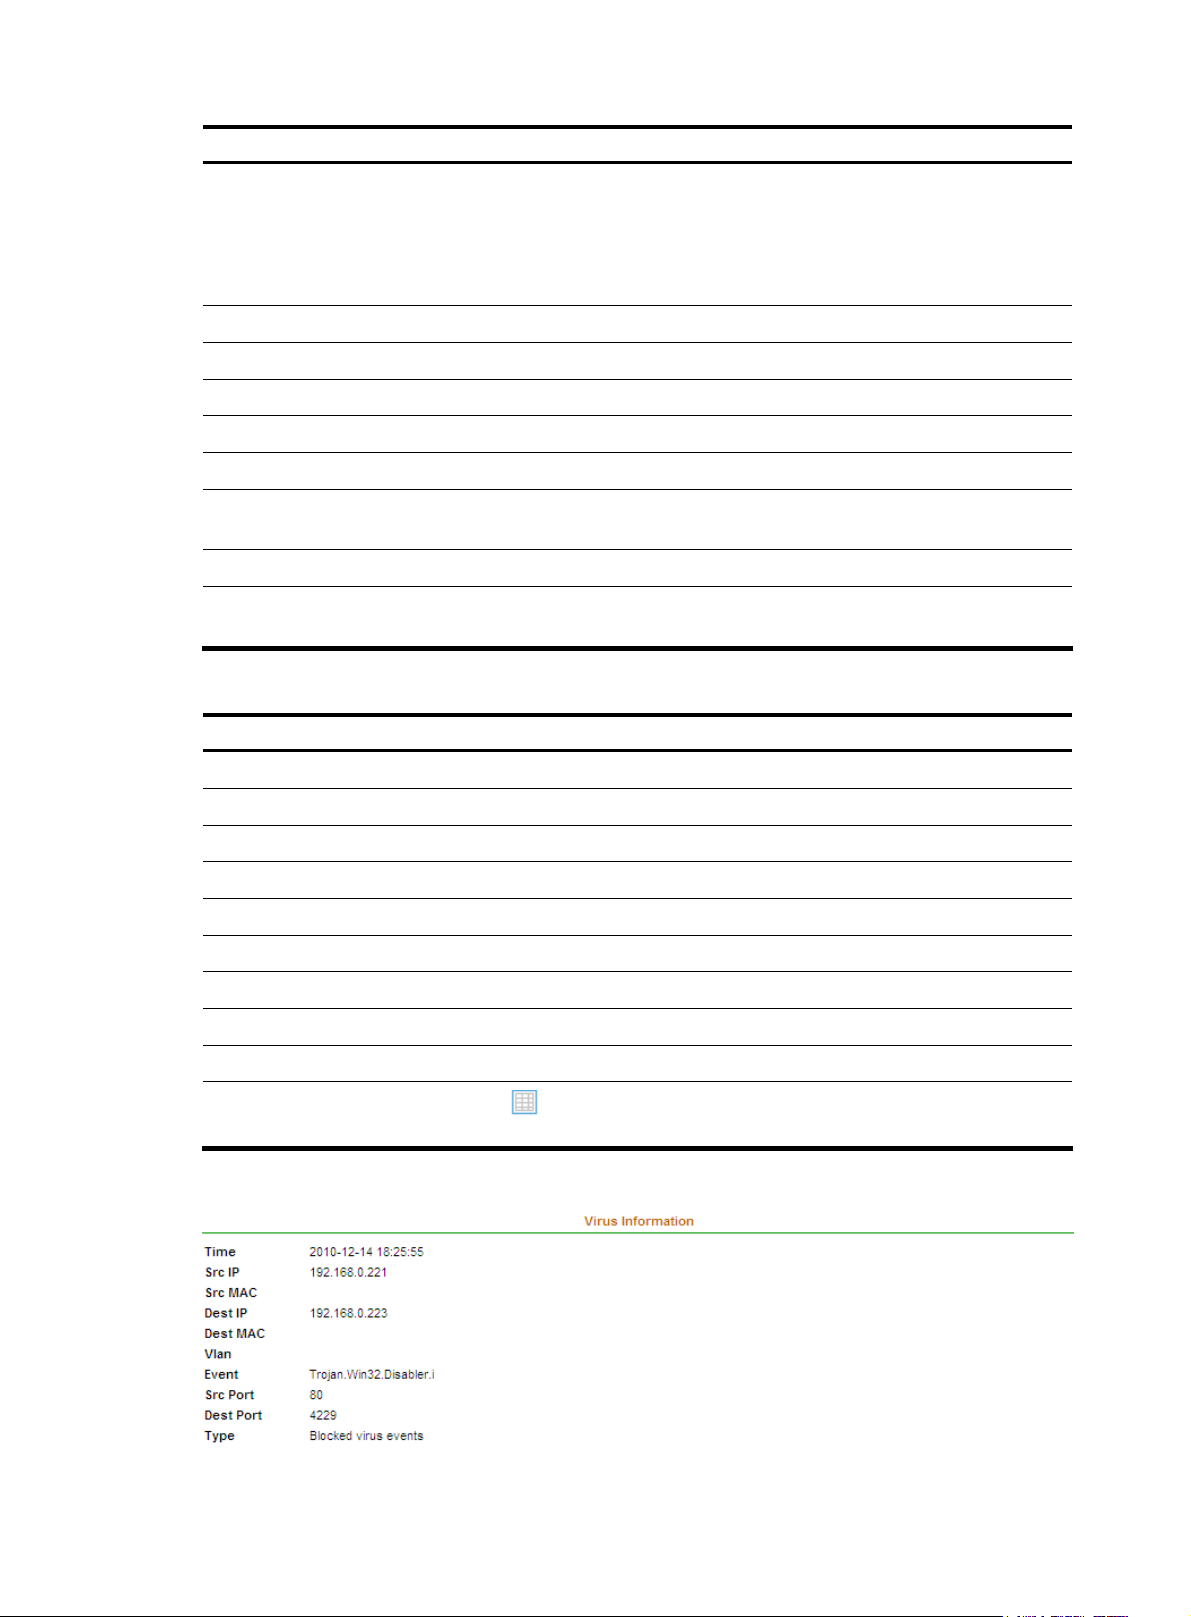
Option Description
Select a device, a device group, or All devices from the Device dropdown list. The system
will display the relevant event information. All devices and device groups that are under
Device
your management will appear in the dropdown list.
• Select a device group: Specifies all devices in the device group.
• Select a device name: Specifies a single device.
Event Select a virus event.
Protocol Select the protocol. The default is --, which means any protocol.
Src IP Specify the source IP address.
Dest IP Specify the destination IP address.
Src Port Specify the source port.
Duration
Select the statistics duration. You can select Day, Week, or Month, or select Customize to
specify a statistics duration.
Time Select the statistics time. The value range varies with the selected statistics duration.
Grouping by
Select a grouping mode. The system supports seven modes: None, Event, Src IP, Dest IP,
Src IP and Dest IP, Dest Port, and Protocol.
Table 49 Fields of the virus event details
Field Description
Time Time when the virus event occurred
Src IP/MAC Source IP address
Dest IP/MAC Destination IP address
Event Description of the event
Src Port Source port
Protocol —
VLAN VLAN in which the attack event occurred
Agent IP IP address of the agent for the attack event
Event Count Number of the events that occurred at the time
Details
Click the icon of a virus event to view the virus event details, as shown in
Figure 51.
Figure 51 Virus event details
51
Page 58

NOTE:
Logs are aggregated at 3 o’clock in the morning every day. When you query event information of the
current month, the system displays only the data collected
the current day.
Displaying DDoS event details
This function helps you quickly find the desired DDoS event information from history data of months. The
DDoS event information can be exported to HTML files, Word files, and Excel files.
Configuration guide
From the navigation tree of the IPS management component, select DDoS Event Details under Event
Analysis to enter the DDoS event details page, as shown in
DDoS events by attack type, source IP address, destination IP address, and protocol to view the DDoS
event details.
fields of the DDoS event details.
Figure 52 DDoS event details
Table 50 describes the query options of DDoS event details, and Table 51 describes the
from the first day of the month to the day before
Figure 52. This page allows you to query
Table 50 DDoS event details query options
Option Description
Filter Select a filter from the dropdown list to display specific DDoS events.
Attack Type Select a DDoS attack type
Select a device, a device group, or All devices from the Device dropdown list to display
the relevant event information. All IPS devices and device groups that are under your
Device
management will appear in the dropdown list.
• Select a device group: Specifies all IPS devices in the device group.
• Select a device name: Specifies a single IPS device.
Src IP Specify the source IP address.
Dest IP Specify the destination IP address.
Protocol Select the protocol. The default is --, which means any protocol.
52
Page 59

Option Description
Duration
Time Select the statistics time. The value range varies with the selected statistics duration.
Grouping by
Select the statistics duration. You can select Day, Week, or Month, or select Customize
to specify a duration.
Select a grouping mode. The system supports four modes: None, Attack Type, Dest IP,
and Protocol.
Table 51 Fields of the DDoS event details
Field Description
Start Time Time when the DDoS event started
End Time Time when the DDoS event ended
Protected Network IP network segment protected against the DDoS attack
Src IP Source IP address of the DDoS attack
Dest IP Destination IP address of the DDoS attack
Attack Type Type of the DDoS attack
Protocol Name of the protocol used by the DDoS attack
Attack name Attack name of a DDoS attack event
Threshold Threshold of the DDoS attack event
Max Avg Rate Maximum average rate of the DDoS attack event
Event Count Total number of events occurred during the specified time
NOTE:
Logs are aggregated at 3 o’clock in the morning every day. When you query event information of the
current month, the system displays only the data collected from the first day of the month to the day before
the current day.
Configuring the alarming function
The IPS management alarming function includes alarming configuration and alarm information. After the
alarming function is configured, when an attack or virus event matches any configured alarm condition,
the system will raise an alarm by sound or by Email and record the event. This function helps
administrators know about network threats and take proper actions in time.
Before using the alarming function, perform related alarming configurations first.
Configuration guide
1. From the navigation tree of the IPS management component, select Alarms under Event Analysis to
enter the event alarm page.
2. Select the Alarm Config tab to enter the alarming configuration page, as shown in Figure 53.
3. Configure the alarming function. Table 52 describes the alarm configuration items.
4. Click Apply.
53
Page 60

Figure 53 Alarming configuration
Table 52 Alarming configuration items
Item Description
Optional
The following alarm modes are available:
• Alarm by Email. If you select this mode, specify the email addresses and alarm time.
• Alarm by SMS message: If you select this mode, specify the message receivers and
alarm time.
Alarm Mode
• Alarm by sound. If you select this mode, the alarm time is optional.
• Collaborate with IPS devices: If you select this mode, specify the IPS devices to
collaborate with. The attack sources will be added to the IPS blacklists to filter traffic
with these source IP addresses. Separate the IP addresses with commas.
• Collaborate with firewall devices: If you select this mode, specify the firewall devices
to collaborate with. The attack sources will be added to the firewall blacklists to filter
traffic with these source IP addresses. Separate the IP addresses with commas.
An alarm type is defined by any combination of Attack, Virus, DDoS, and Filter.
Alarm Type
If you specify no alarm type (leaving the Attack, Virus, and DDoS options unselected),
the system will not raise alarms.
54
Page 61

Item Description
Specify the system to raise alarms when detecting attack events.
Attack
Virus
DDoS
Filter
Alarm Time
NOTE:
You can also specify a filter for attack events so that the system will raise alarms only for
detected attack events that match the filtering condition.
Specify the system to raise alarms when detecting virus events.
NOTE:
You can also specify a filter for virus events so that the system will raise alarms only for the
detected virus events that match the filtering condition.
Specify the system to raise alarms when detecting DDoS events.
NOTE:
You can also specify a filter for DDoS events so that the system will raise alarms only for the
detected DDoS events that match the filtering condition.
Optional
Select a filter.
To configure a filter, click to enter the filter management page. For more
information, see “
Optional
Required when alarming by emails or SMS is selected. If no alarm time is specified, the
system will not send any alarm email or message.
Managing filters.”
Select the Alarm Info tab and the system will display all alarms raised in the last day by default. You can
select a time range to query alarms that are raised during the specified time range, view the detailed
information of an alarm, and export alarms to an Excel file, as shown in
Figure 54. Table 53 describes
fields of the alarm information list.
Figure 54 Alarm information
55
Page 62

Table 53 Fields of the alarm information list
Field Description
Time Time when the attack/virus/DDoS event occurred
Device IP IP address of the device that detected the event
Alarm Type Type of the event recorded in the current alarm
Attack/Virus/DDoS
Attack Name
Filtering Rule
Name of the attack/virus/DDoS event
Name of the filter used for filtering events. The system only raises alarms for events
that match the filtering rule.
Managing report export tasks
This function is for report export management. The system will periodically export attack event histories
and virus event histories to .xls files according to your configuration. You can create export tasks, test the
tasks, and view exported files.
Configuration guide
From the navigation tree of the IPS management component, select Report Export Tasks under Event
Analysis to enter the report export task management page, as shown in
the report export task management functions.
Figure 55 Report export task management
Figure 55. Table 54 describes
Table 54 Report export task management functions
Function Description
Allows you to view the detailed information of all report export tasks,
Report export task list
Adding a report export task Allows you to add a report export task.
Deleting report export tasks
modify and test a report export task, and view the generated report files of
a task.
Allows you to delete useless report export tasks.
Follow these steps:
1. Select the check boxes before the tasks that you want to delete.
2. Click Delete.
56
Page 63

Function Description
Authorizes specific operators to perform the export tasks.
Follow these steps:
Authorizing operators
1. Select the check boxes before the tasks that you want to permit operators
to execute.
2. Click Authorize.
3. Select the operators, and click Apply.
Canceling authorization
Report export task list
From the navigation tree of the IPS management component, select Report Export Tasks under Event
Analysis to enter the report export task management page, as shown in
detailed information of all tasks.
management page, and
Figure 56 Report file list
Table 55 Query options on the report export task management page
Option Description
Period
Removes operators from the authorized operators of the task. The operation
procedure is similar to operator authorization procedure.
Figure 55. This page lists the
Table 55 describes the query options on the report export task
Table 56 describes fields of the report export task list.
Select the export interval, which can be Day, Week, Month, Year or All. The
system will display export tasks with the export interval being the one you selected.
Select a report export template. Three templates are available, attack analysis
Template
Filter Select a filter to filter the report export tasks.
report template, virus analysis report template, and DDoS analysis report
template.
Table 56 Fields of the report export task list
Field Description
Export Task Name of the report export task
Creation Time Time when the task was created
Period Reports export interval
Send Mail Whether the report file is to be sent to the specified mail box.
Generated Reports
Click the
task, as shown in
icon of a task to display the list of all generated report files of the
Figure 56. You can delete and download the files as desired.
57
Page 64

Field Description
• Click the icon of a task in the Operation column to enter the export task
modification page, where you can modify the task.
Operation
Authorized Operators Operators that are allowed to perform the export task.
Return to Report export task management functions.
Adding a report export task
1. From the navigation tree of the IPS management component, select Report Export Tasks under
Event Analysis to enter the report export task management page.
2. Click Add to enter the page for adding a report export task, as shown in Figure 57.
3. Configure an export task. Table 57 describes the configuration items of a report export task.
4. Click Add.
Figure 57 Add a report export task
• Click the icon of a task in the Operation column to test whether the task
can function. If the test succeeds, the system generates a file based on the data
of the current day. You can view the file on the report file list page or in the mail
box if you have specified a mail box.
Table 57 Configuration items of a report export task
Item Description
Required
Task Name
Period
Filter
Specify the name of the task.
The name can comprise up to 40 characters and must not contain illegal
characters.
Required
Specify the interval at which the system exports reports, which can be Day, Week,
Month, or Year. The default is Day.
Optional
Specify the data to be included in the report file by selecting a filter.
58
Page 65
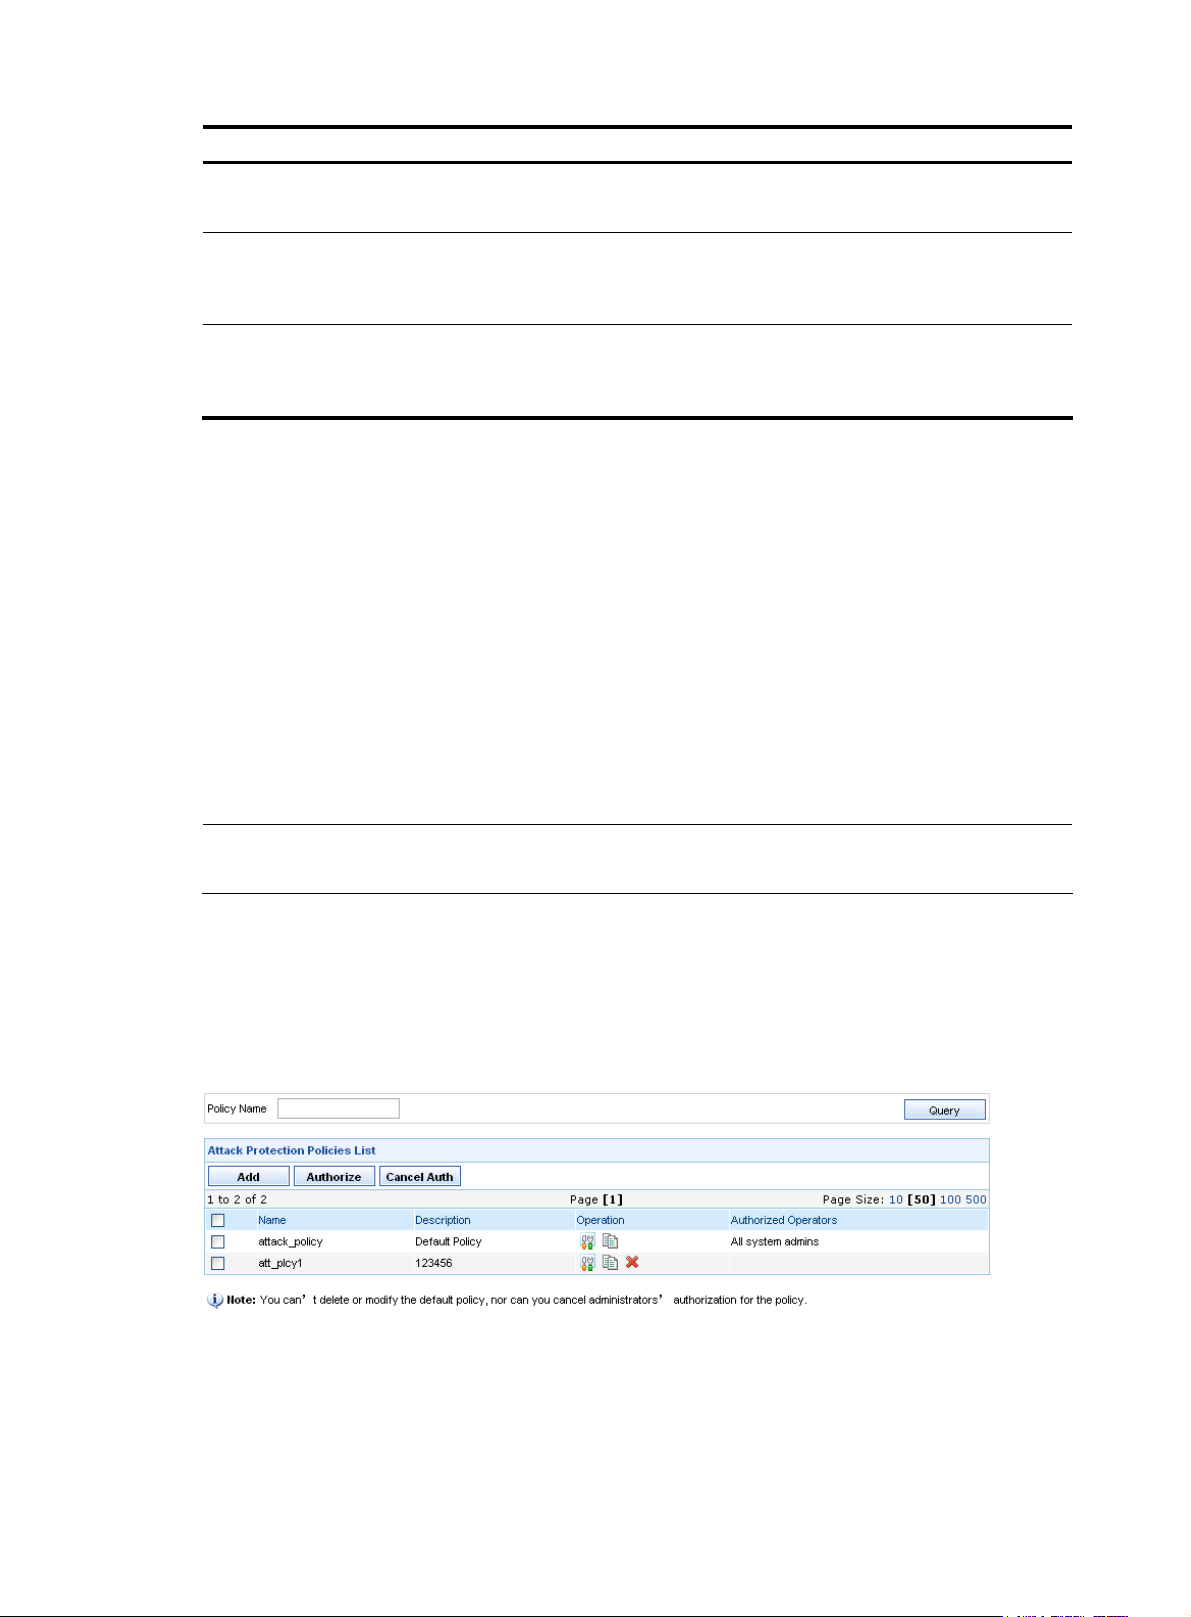
Item Description
Template
File Type
Notification Mode
Required
Specify the template for the reports. The default is attack analysis report template.
Required
Select a type for the file to be exported and saved. Options include Excel and
Word. Excel is selected by default.
Optional
Specify whether to send a report file by email. If yes, specify the mail address to
which the report file will be sent.
Return to Report export task management functions.
Policy management
The IPS policy management function allows you to configure attack protection and anti-virus policies, and
deploy policies to IPS devices so that the devices automatically identify and filter attacks. It also allows
you to customize the events for which the devices send alarm message, and import and export policies.
Configuring attack protection policies
Attack protection policies enable devices to filter attacks such as backdoor program, spyware, DoS
attacks, and DDoS attacks. On the attack protection policies management page, you can add, modify,
copy, and delete a user-defined attack protection policy.
NOTE:
attack_policy is the default attack protection policy. It cannot be modified or deleted.
Configuration guide
From the navigation tree of the IPS management component, select Attack Protection Policies under
Policy Management to enter the attack protection policies management page, as shown in
Table 58 describes the attack policy management functions.
Figure 58 Attack protection policies management page
Figure 58.
59
Page 66

Table 58 Attack policy management functions
Function Description
Allows you to query policies by policy name.
Querying policies
Attack protection policies list Allows you to view all attack protection policies.
Type a policy name keyword and click Query. The system will display all
attack protection policies whose names contain the keyword.
Adding an attack protection policy
Deleting attack protection
policies
Authorizing operators
Canceling authorization
Attack protection policies list
From the navigation tree of the IPS management component, select Attack Protection Policies under
Policy Management. The attack protection policy list appears, as shown in
the fields of the attack protection policies list.
Table 59 Fields of the attack protection policies list
Field Description
Allows you to add a new attack protection policy.
Allows you to delete attack protection policies.
Authorizes specific operators to manage the attack protection policies.
Follow these steps:
1. Select the check boxes before the policies that you want to permit
operators to manage.
2. Click Authorize.
3. Select the operators, and click Apply.
Removes operators from the authorized operators of the task. The operation
procedure is similar to operator authorization procedure.
Figure 58. Table 59 describes
Name Name of the attack protection policy
Description Description of the attack protection policy
Operation
Authorized Operators Operators that are authorized to manage the policy.
Return to Attack protection policies management page.
Adding an attack protection policy
1. From the navigation tree of the IPS management component, select Attack Protection Policies under
Policy Management to enter the attack protection policies management page.
2. Click Add to enter the page for adding an attack protection policy, as shown in Figure 59.
3. Configure an attack protection policy as described in Table 60.
4. Click OK.
• Click the icon of a user-defined policy to modify the policy.
• Click the icon of a user-defined policy to create a new policy by copying
rules from a selected policy.
• Click the icon of a user-defined policy to delete the policy.
60
Page 67

Figure 59 Add an attack protection policy
Table 60 Attack protection policy configuration items
Item Description
Required
Policy Name
Type a name for the policy.
The policy name can comprise up to 100 characters and must not contain these
characters: ^'<>&:;"/\
Description
Required
Type a description for the policy.
Required
Copy Rules From
Select a policy from the dropdown list. The system will create a policy by copying rules
from the selected policy.
5. Click OK. The rule management page appears, displaying rules of the policy, as shown in Figure
60. You can query rules, modify the policy description, status and action for rules, and restore the
default rule configuration.
Figure 60 Manage rules for an attack protection policy
61
Page 68

Table 61 Query options on the rule management page of an attack protection policy
Option Description
Type or select an event to display the rule by the event name.
To select an event, follow the steps:
Event
Event Type Select an event type to display rules of the selected type.
Severity Select a severity level to display the rules at the selected severity level.
Status Select a rule state to display rules in the selected state.
Action Select an action to display rules configured with the selected action.
Default Select an option to display the modified or default rules.
1. Click the
(see
Figure 61).
2. Click the ID of a rule to display the rule name in the Event filed.
icon to bring up the page, where you can locate a rule by its ID
Table 62 Fields of the attack protection rule list
Field Description
ID ID of the rule
Name Name of the protection rule
Type Type of the rule
Severity Severity of the rule
Status Application status of the rule
Action configured for the attack protection rule, which can be Block, Block+Notify,
Action
Default Shows whether the rule is a default one or a modified one
Block+Notify+Packet Trace, Permit, Permit+Notify, or Permit+Notify+Packet
Trace.
The system will take the action if the rule is matched.
• Click the icon of a rule to enter the rule modification page, where you can
Operation
change the application status and action of the rule, as shown in Figure 62. You
can also select a rule from the rule list (see
Figure 60), and click Modify.
• Click the icon of a rule to view the details of the rule.
62
Page 69

Figure 61 Select a rule for the Event field
Figure 62 Rule modification page
Return to Attack protection policies management page.
Configuring anti-virus policies
Anti-virus policies enable devices to filter virus attacks. On the anti-virus policy management page, you
can add, modify, copy, and delete a user-defined anti-virus policy.
Configuration guide
From the navigation tree of the IPS management component, select Anti-Virus Policies under Policy
Management to enter the anti-virus policies management page, as shown in
Figure 63.
63
Page 70

Figure 63 Anti-virus policies management page
Table 63 Anti-virus policy management functions
Function Description
Allows you to query policies by policy name.
Querying policies
Anti-virus policy list Allows you to view all anti-virus policies.
Adding an anti-virus policy Allows you to add a new anti-virus policy.
Type a policy name keyword and click Query. The system will display all
anti-virus policies whose names contain the keyword.
Deleting an anti-virus policy Allows you to delete an anti-virus policy.
Authorizing operators
Canceling authorization
Anti-virus policy list
From the navigation tree of the IPS management component, select Anti-Virus Policies under Policy
Management. The anti-virus policy list appears, as shown in
the anti-virus policy list.
Table 64 Fields of the anti-virus policy list
Field Description
Name Name of the anti-virus policy
Description Description of the anti-virus policy
Authorizes specific operators to manage the anti-virus policies.
Follow these steps:
1. Select the check boxes before the policies that you want to permit
operators to manage.
2. Click Authorize.
3. Select the operators, and click Apply.
Removes operators from the authorized operators of the task. The
operation procedure is similar to operator authorization procedure.
Figure 63. Table 64 describes the fields of
• Click the icon of a user-defined policy to modify the policy.
Operation
• Click the icon of a user-defined policy to add a by copying rules from a
selected policy.
• Click the icon of a user-defined policy to delete the policy.
Return to Anti-virus policy management functions.
64
Page 71

Adding an anti-virus policy
1. From the navigation tree of the IPS management component, select Anti-Virus Policies under Policy
Management to enter the anti-virus policies management page
2. Click Add to enter the page for adding an attack protection policy, as shown in Figure 64.
3. Configure an anti-virus policy, as described in Table 65.
4. Click OK.
Figure 64 Create an anti-virus policy
Table 65 Anti-virus policy configuration items
Item Description
Required
Policy Name
Description
Copy Rules From
5. Click OK. The rule management page appears, as shown in Figure 65. You can query rules,
Type a name for the policy.
The policy name can comprise up to 100 characters and must not contain these
characters: ^'<>&:;"/\
Required
Type a description for the policy.
Required
Select a policy from the dropdown list. The system will create a policy by copying rules
from the selected policy.
modify the description, status, and action for rules, and restore the default rule configuration.
65
Page 72

Figure 65 Rule management for an anti-virus policy
Table 66 Query options on the rule management page of an anti-virus policy
Option Description
Name Type a name to display the rule with this name.
Status Select a rule state to display rules in the selected state.
Action Select an action to display rules configured with the selected action.
Default Select an option to display the modified or default rules.
Table 67 Fields of the anti-virus rule list
Field Description
Name Name of the anti-virus rule
Virus Type Type of the virus
Status Application status of the anti-virus rule
Action configured for the anti-virus rule, which can be Block, Block+Notify,
Action
Block+Notify+Packet Trace, Permit, Permit+Notify, or Permit+Notify+Packet
Trace.
The system will take the action if the rule is matched.
Default Shows whether the rule is a default one or a modified one
• Click the icon of a rule to enter the rule modification page, where you can
Operation
change the application status and action of the rule, as shown in
can also select a rule from the rule list (see
Figure 65), and click Modify.
Figure 66. You
• Click the icon of an anti-virus rule to view the details of the rule.
66
Page 73
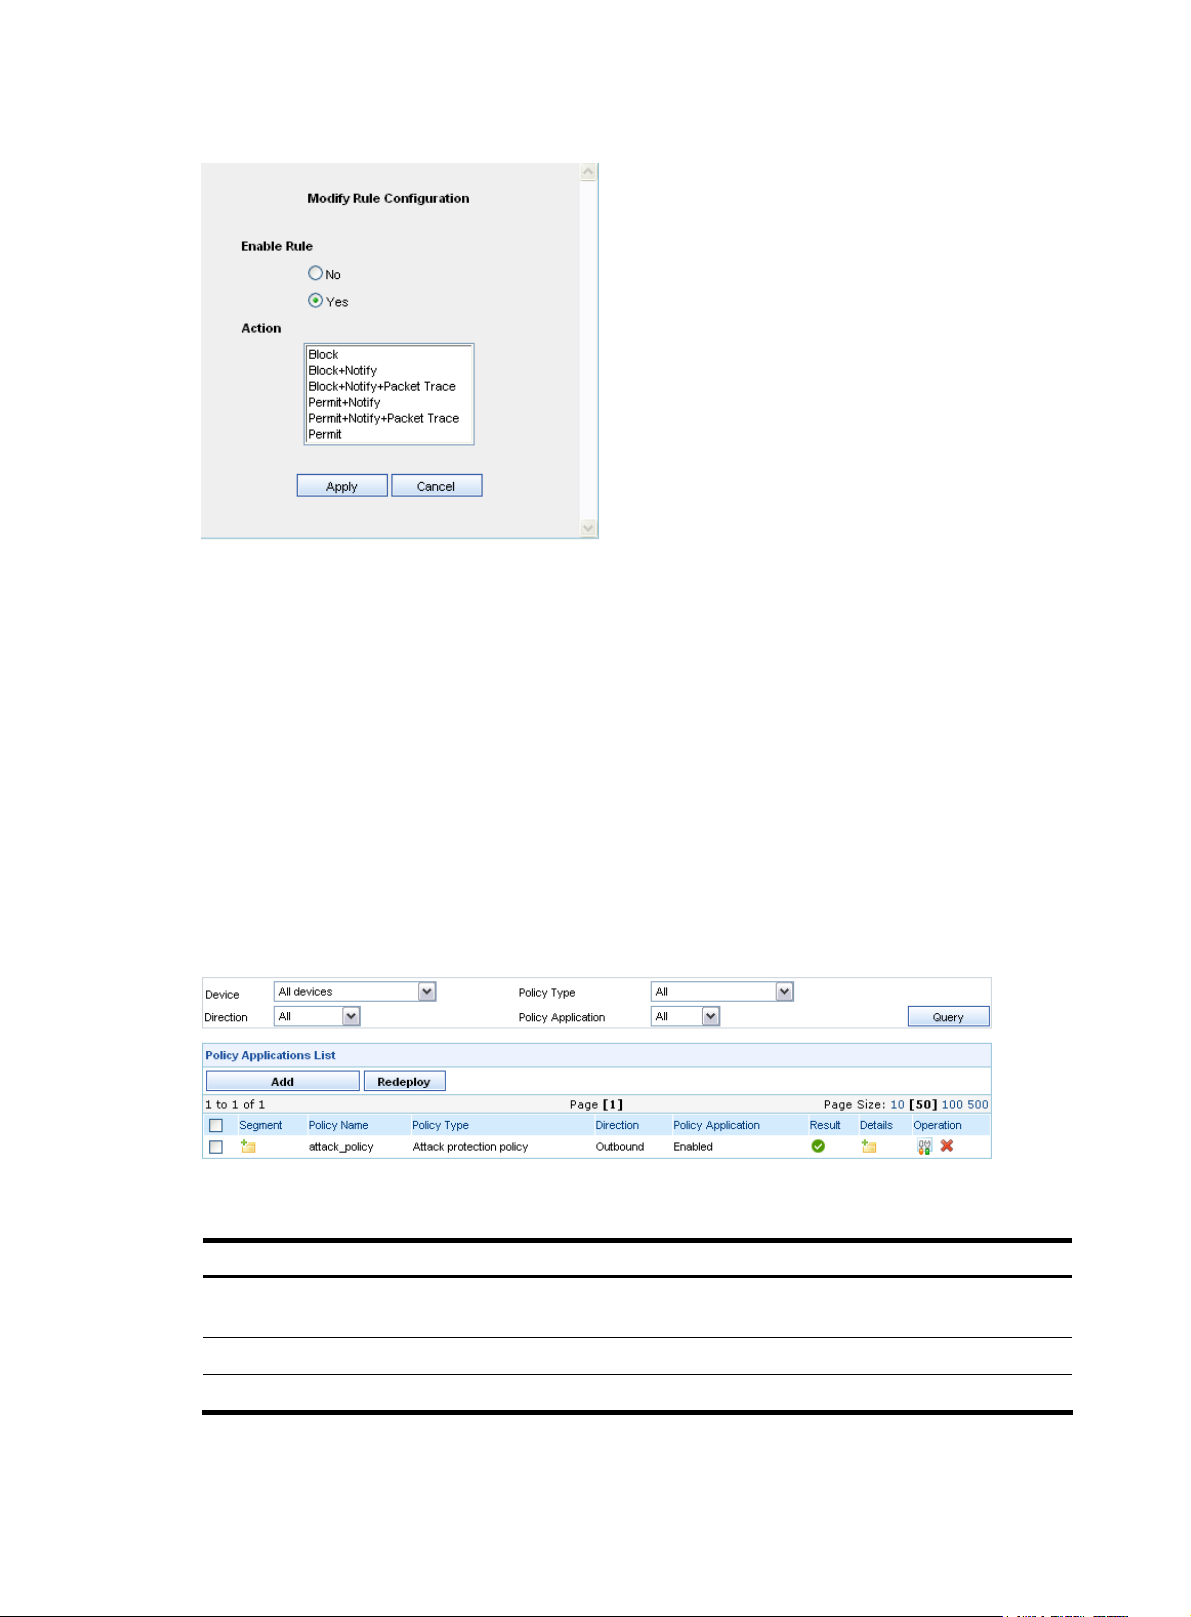
Figure 66 Modify an anti-virus rule
Return to Anti-virus policy management functions.
Configuring policy applications
A policy application refers to deploying a configured attack protection policy or anti-virus policy to
devices. On the policy application configuration page, you can select the segments and devices to which
the policy is to be applied, the policy type, the policy name, and the policy application direction, and
enable the policy on the device.
Configuration guide
From the navigation tree of the IPS management component, select Policy Applications under Policy
Management to enter the policy application management page, as shown in
describes the policy application management functions.
Figure 67 Policy application management page
Table 68 Policy application management functions
Function Description
Figure 67. Table 68
Querying policy applications
Policy application list Allows you to view all policy applications.
Adding a policy application Allows you to add a new policy application.
Allows you to query policy applications by different conditions. For more
information, see
Table 69.
67
Page 74

Function Description
Redeploying a policy application
Policy application list
From the navigation tree of the IPS management component, select Policy Applications under Policy
Management. The policy application list appears, as shown in
options and
Table 69 Query options on the policy application list page
Option Description
Device Select a device to display policies for the device.
Allows you to change the policy or change the device for a policy
application.
Follow these steps:
1. Select the check boxes before the policy applications that you want to
redeploy.
2. Click Redeploy.
Figure 67. Table 69 describes the query
Table 70 describes fields of the policy application list.
Policy Type
Direction
Policy Application
Select a policy type to display policies of the type. Options include all, attack
protection policy, and anti-virus policy.
Select a direction to which policies apply. Options include outbound, inbound,
bidirectional, and all.
Select a policy application status to display polices in the specified application
status.
Table 70 Fields of the policy application list
Field Description
Segment
Policy Name Name of the applied policy
Policy Type Type of the applied policy
Direction Policy’s application direction: Outbound, inbound, or bidirectional
Policy Application Status of the policy application, enabled, or disabled
Result Result of the policy application deployment, succeeded or failed
Details
Segment where the policy application is configured. When you place your cursor
over the
Detailed information of the policy application. When you place your cursor over
the
icon, the segment information is displayed.
icon, the policy application details are displayed.
Operation
Return to Policy application management functions.
Adding a policy application
1. From the navigation tree of the IPS management component, select Policy Applications under
Policy Management to enter the policy application management page
2. Click Add to enter the policy application configuration page, as shown in Figure 68.
• Click of a policy application to modify the application.
• Click of a policy application to delete the application.
68
Page 75

3. Configure a policy application, as described in Table 71.
4. Click OK.
Figure 68 Add a policy application
Table 71 Policy application configuration items
Item Description
Required
Please select segment
Policy Type
Policy
Direction
Internal Zone IP
Select segments to which the policy applies. At least one segment must be
selected.
Required
Select a policy type.
Required
Select a policy.
Which policies are available depends on the policy type.
Required
Select a direction to which the policy applies. Options include inbound,
outbound, and both.
Required
Select an IP address group from the dropdown list. The policy applies to all IP
addresses that are in the IP group on the internal zone IP list.
The default option All IPv4 specifies the whole internal zone.
Click to add an IP address group.
External Zone IP
Required
Select an IP address group from the dropdown list. The policy applies to all IP
addresses that are in the IP group on the external zone IP list.
The default option All IPv4 specifies the whole internal zone.
Click
to configure a new IP address group.
69
Page 76

Item Description
Required
Enable or disable the policy application.
Policy Application
NOTE:
If you select Disable, the system saves the policy application, but does not
deploy the application to IPS devices.
Return to Policy application management functions.
Displaying attack signatures
The attack signatures page displays the attack signatures in the attack signature file.
Configuration guide
From the navigation tree of the IPS management component, select Attack Signatures under Policy
Management to enter the attack signature list page, as shown in
options on the attack signature list page, and
Figure 69 Attack signature list
Figure 69. Table 72 describes the query
Table 73 describes fields of the attack signature list.
Table 72 Query options on the attack signature list page
Option Description
ID Type an event ID to query the event.
Event Type an event name keyword to query the events.
Event Type Select an event type to query events of the type.
Severity Select a severity level to query events of the severity.
70
Page 77

Table 73 Fields of the attack signature list
Field Description
ID Event ID
Event Event name
CVE CVE number of the event, if any. (CVE: Common Vulnerabilities & Exposures)
Event Type Type of the event
Severity Severity level of the event
Click the icon to view the detailed information of the attack protection rule,
Details
including the basic information, the detailed description, the relevant information
(click the links), the related application and the solution. See
Figure 70.
Figure 70 Detailed information of the event
Displaying virus category list
The virus category list displays the virus types supported by the system.
Configuration guide
From the navigation tree of the IPS management component, select Virus Category List under Policy
Management to enter the virus category list page, as shown in
option on the virus category list page.
Figure 71. Table 74 describes the query
71
Page 78

Figure 71 Virus category list
Table 74 Query option
Option Description
Virus Type Select a virus type to query the corresponding viruses.
Click the icon to view the virus category detailed information, including virus
Details
type, page, policy name, and the segment to which the policy applies. See
72.
Figure 72 Virus category information
Configuring custom events
Massive security events occur on the network. It is helpful if network administrators are aware of the
critical network events in time. The custom event analysis function is thus introduced. With this function,
administrators custom an analysis policy by defining sources of the event data, event type, event name,
source IP/port of attacks, destination IP/port of attacks, and protocols. The event analysis engine then
correlates and analyzes the massive event data against analysis policies. If matching a policy, an event
is recorded and an alarm is triggered.
Figure
Event analysis engine adopts the correlation technique to correlate original events of different
characteristics and generate one event record for multiple repeated events in a specific period. The
correlation analysis greatly reduces amount of event records.
A custom event is an analysis policy that contains one or more rules. Before you get started with the
custom event analysis function, the following describes concepts that are involved:
72
Page 79

• Policy: A policy contains one or more rules. If all rules of a policy are matched during a time period
(association interval in the policy), an alarm is triggered (a custom event is recorded).
• Rule: A rule contains on or more filters. If all filters of a rule are matched, the rule is considered to
be matched. A time period and a threshold of repeated matches can also be set for a rule.
• Event: An original security event that the event analysis engine receives and processes.
• Filter: Match criteria for different fields in an event, that is, the configuration items in a rule.
Configuration guide
From the navigation tree of the IPS management component, select Custom Events under Policy
Management to enter the custom event management page, as shown in
custom event analysis policy. When attack or virus events match the policy, an alarm is triggered.
The custom event management page shows a list of custom events (analysis policies), displaying
information about the custom event name, level, notification method, number of unacknowledged events,
time when last alarm is triggered, and the status of the policy. The page also allows you to add new
custom events, delete, modify, export, and import custom events, edit the notification method of custom
events, enable or disable custom events, authorize operators, and remove authorization.
describes the custom event management functions.
Figure 73 Custom event list
Figure 73. You can configure a
Table 75
Table 75 Custom event management functions
Function Description
Allows you to perform operations on custom events, such as view the
Custom event list
Adding a custom event Allows you to add a new custom event.
Deleting a custom event
Exporting and importing custom events Allows you to export or import custom events.
Changing the event notification method
Changing the event status
Displaying unacknowledged events
detailed information of all custom events, and modify custom event
settings.
Allows you to delete selected custom events,
Follow these steps:
1. Select the check boxes before the custom events to be deleted.
2. Click Delete.
Allows you to change the alarm mode for custom events. Batch
operation is supported.
Allows you to enable or disable custom events. Batch operation is
supported.
Allows you to display unacknowledged events and their detailed
information.
Modifying a custom event Allows you to modify custom event settings.
73
Page 80

Function Description
Authorizes specific operators to manage the custom events.
Follow these steps:
Authorizing operators
1. Select the check boxes before the events that you want to permit
operators to manage it.
2. Click Authorize.
3. Select the operators, and click Apply.
Canceling authorization
Custom event list
From the navigation tree of the IPS management component, select Custom Events under Policy
Management to enter the custom event management page.
event list.
Table 76 Fields of the custom event list
Field Description
Event Name Name of the custom event
Level Level of the custom event, which can be critical, major, minor, or warning.
Event Notification
Unacknowledged Events
Last Trigger Time when the last alarm was triggered.
Status
Removes operators from the authorized operators of the task. The
operation procedure is similar to operator authorization procedure.
Table 76 describes the fields of the custom
Alarm method when an event is recorded and an alarm is triggered, which can be
email alarm, sound alarm, or both.
Number of events that are not acknowledged.
If the field is null, that means all events of the particular kind are acknowledged.
Status of the custom event, which can be enabled or disabled.
Only enabled custom events can filter log data.
Operation Allows you to modify custom event settings.
Authorized Operators Displays operators who are authorized to custom the event.
Adding a custom event
1. From the navigation tree of the IPS management component, select Custom Events under Policy
Management to enter the custom event management page.
2. Click Add to enter the page for adding a custom event, shown in Figure 74.
3. Type the custom event name and description, select a level, configure rules and the alarm mode,
and specify the custom event status.
event.
4. Click OK.
Table 77 describes configuration items for adding a custom
74
Page 81

Figure 74 Add a custom event
Table 77 Configuration items for adding a custom event
Item Description
Required
Event Name
Type a name for the custom event.
The name can comprise up to 40 characters.
75
Page 82

Item Description
Required
Description
Level
Event Rules
Association Interval
Trigger Alarm
Type the description for the custom event.
The string can comprise up to 40 characters.
Required
Select a severity level for the custom event, which can be critical, major, minor, or
warning.
Required
Set rules for the custom event. For more information, see
Complete Definition of Rule shows the entire content of the rules that have been
defined.
Required when you have defined multiple rules.
If all rules of a policy are matched during the interval, the policy is matched.
The setting is not effective for a policy that contains only one rule.
Optional
Selecting the check box to send an alarm when the policy is matched. Two methods
are available:
Table 78.
• When Alarm by Email is selected, the email address and alert time are required.
• When Alarm by Sound is selected, the alert time setting is not needed.
Status
Required
Set whether to enable or disable the custom event.
Return to Custom event management functions.
Step1 Add an event rule.
1. On the page for adding a custom event shown in Figure 74, click the icon next to the Event Rule
text box to enter the page for configuring filters.
2. Configure the threshold, source device from which the log data is sent, source IP address of events,
destination IP address of events, source port of events, destination port of events, protocol, attack
event, and attack event name.
3. Click OK. An event rule is created and displayed in the Event Rule text box.
4. Click Add to add the rule to the Event Rules list box.
Table 78 describes configuration items for adding an event rule.
76
Page 83

Figure 75 Configuration items for adding an event rule
Table 78 Configuration items for adding an event rule
Item Description
Optional
If filters of a rule are all matched for or more than the specified times (Threshold) during
Threshold
the specified Interval, the rule is matched.
• Interval: A time period in seconds, and defaults to 5 seconds.
• Threshold: Number o times the attack matches the rule, and defaults to 1.
Device
Source IP
Destination IP
Source Port
Destination Port
Required
Select security devices from which the SecCenter system receives log data for analysis.
Optional
Specify source IP addresses as the match criteria. Invert selection is supported.
Optional
Specify destination IP addresses as the match criteria. Invert selection is supported.
Optional
Specify source ports as the match criteria. Invert selection is supported.
Optional
Specify destination ports as the match criteria. Invert selection is supported.
Protocol
Optional
Specify protocols as the match criteria. Invert selection is supported.
77
Page 84

Item Description
Event
Event Name
NOTE:
• The configuration items (filters) of a rule are match criteria . F or ex am pl e, if th e so ur ce IP i s 1.1.1.1, tr af fi c
sourcing from this address matches this criterion. If invert selection is also set, traffic that does not source
fr om 1.1.1.1 m atc he s t h is cr ite rio n .
• The filters of a rule are ANDed, and the conditions of a filter are ORed.
• Rules of a custom event (analysis policy) are ANDed.
Step2 Modify an event rule.
Optional
Select attack events as the match criteria. Invert selection is supported.
Attack event query by event ID, description, type, and severity is supported.
Optional
Specify attack event names as the match criteria, You can choose fuzzy match or exact
match, case sensitive match, and invert selection.
For example, to analyze the SQL injection attacks, specify SQL injection as the name for
a fuzzy match. Attacks with names including this substring match this criterion.
In the Event Rules list box shown in
modifying the configuration items of a rule. For more information, see
Figure 76 Event rules configuration area
Exporting and importing custom events
On the custom event management page shown in Figure 73:
• To export selected custom events and save them locally, select the target custom events and click
Export.
• To import the custom events that are exported and saved locally, click Import. Then the successfully
imported custom events are displayed in the custom event list.
Return to
Custom event management functions.
Figure 76, click the icon of a rule to bring up the page for
Table 78.
Changing the event notification method
1. On the custom event management page shown in Figure 73, select a custom event and click Alarm
Mode to enter the page for changing the event notification method, as shown in
2. Edit the alarm type and time.
3. Click OK.
Figure 77.
78
Page 85

Figure 77 Change event notification method
Return to Custom event management functions.
Changing the event status
1. On the custom event management page shown in Figure 73, select one or more custom events and
click Status. The page for changing the event status appears, as shown in
2. Select Enabled or Disabled.
3. Click OK.
Figure 78 Change the event status
Return to Custom event management functions.
Figure 78.
Displaying unacknowledged events
On the custom event management page shown in Figure 73, click the number link of unacknowledged
events of a custom event to enter the event history page, as shown in
of the matched event history, such as the time when the event occurred, and the number of events.
Figure 79. The page shows summary
79
Page 86

Figure 79 Matched event history
On the event history page, click the icon of an archived item to enter the event list page, as shown in
Figure 80. The page displays details of events that match the analysis policy.
Figure 80 Event list
Return to Custom event management functions.
Modifying a custom event
On the custom event management page shown in Figure 73, click the icon to enter the page for
modifying the custom event configuration. For descriptions of custom event configuration items, see
77.
Note that the custom event name is not configurable on the page for modifying a custom event.
CAUTION:
• After you modify a custom event (analysis policy), the related
and starts analysis with the new parameters; however, the archived events are not cleared.
• The SecCenter system synchronizes policy settings every 10 seconds. In other words, it takes up to 10
seconds to validate your modification.
Return to Custom event management functions.
Importing and exporting policies
You can import and export attack protection policies and anti-virus policies from and to devices, and
compare policies.
Table
analysis engine restarts, clears its cache,
Configuration guide
From the navigation tree of the IPS management component, select Policy Import/Export under Policy
Management to enter the policy importing and exporting page, as shown
the policy import and export management functions.
80
Figure 81. Table 79 describes
Page 87
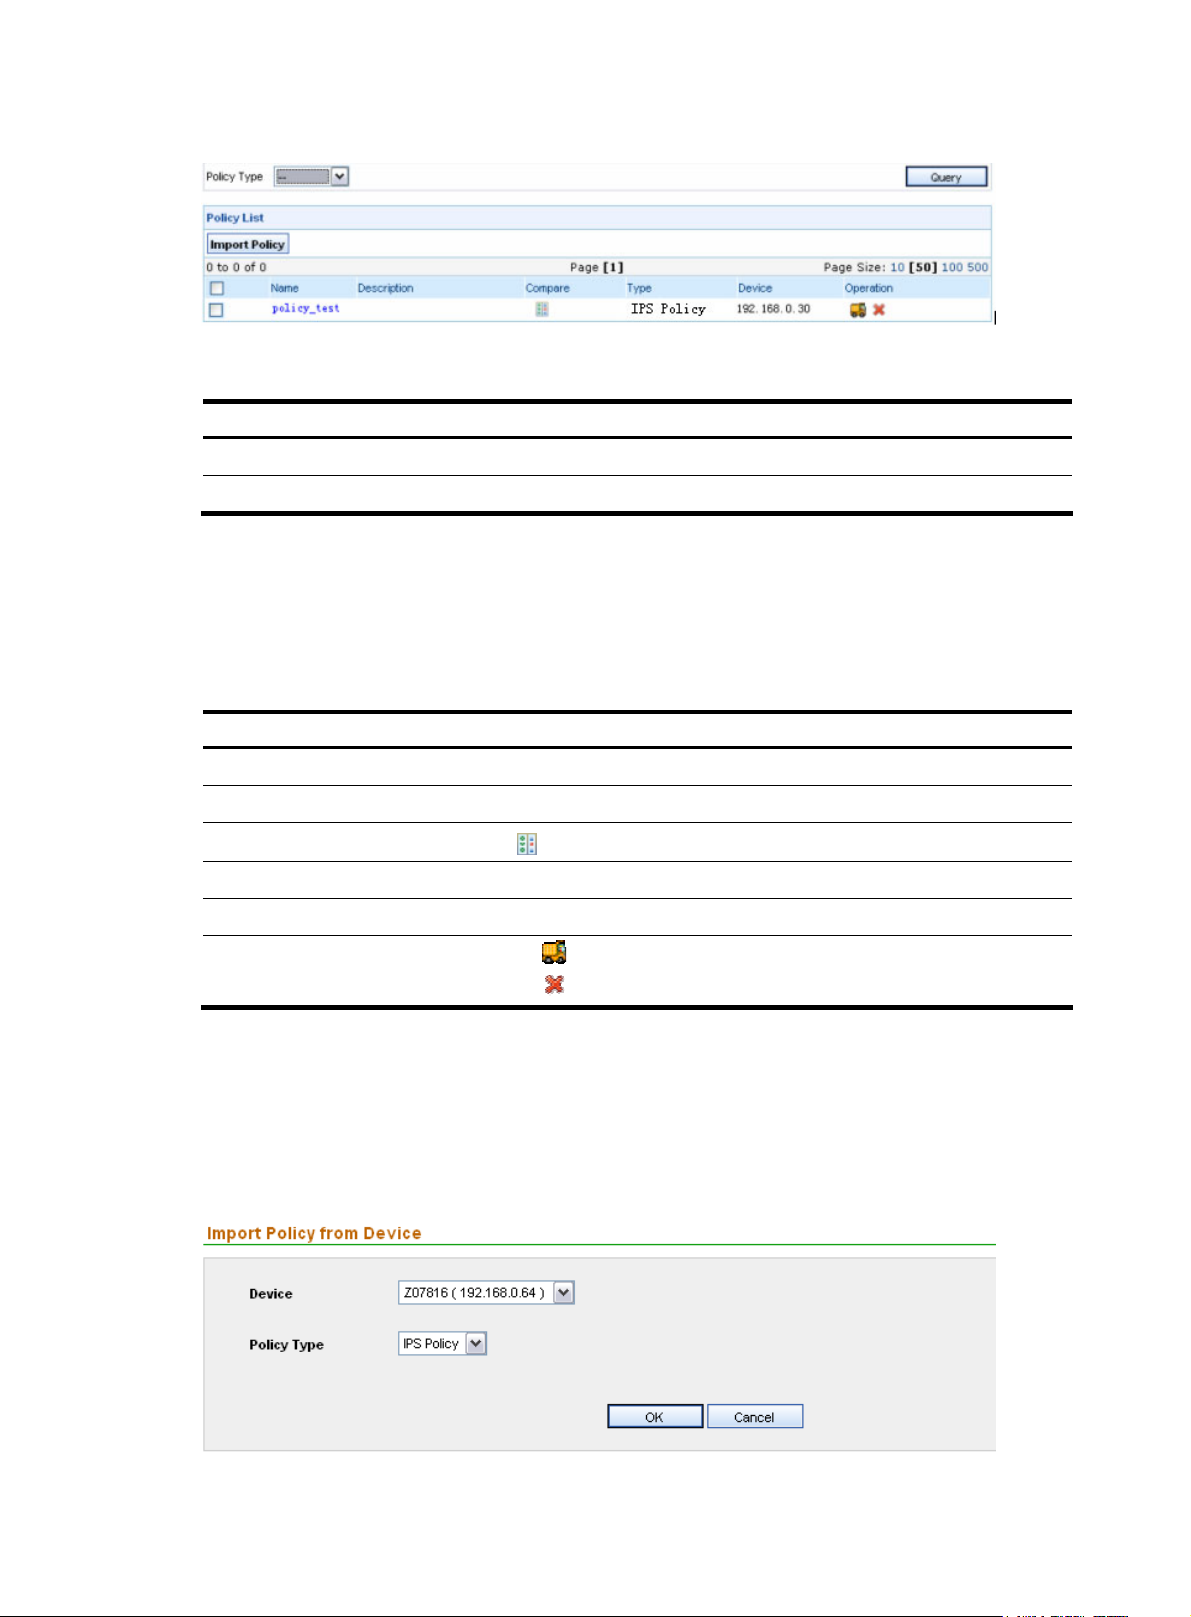
Policy list
Figure 81 Import and export policies
Table 79 Policy import and export management functions
Functions Description
Policy list Allows you to view all policies
Importing a policy from a device Allows you to import policies from devices
From the navigation tree of the IPS management component, select Policy Import/Export under Policy
Management. The policy list page appears, as shown in
types.
Table 80 describes the fields of the policy list.
Figure 81. You can query policies by policy
Table 80 Fields of the policy list
Field Description
Name Policy name
Description Description of the policy
Compare
Type Policy type
Device Device to which the policy applies.
Operation
Return to Policy import and export management functions.
Importing a policy from a device
On the policy list page, click Import Policy to enter the policy importing configuration page, as shown in
Figure 82. Table 81 describes the policy importing configuration items.
Figure 82 Import a policy from a device
Click the
icon to compare two selected policies.
• Click the icon of a policy to export it to the specified device.
• Click the icon of a policy to delete it.
81
Page 88

Table 81 Policy importing configuration items
Item Description
Device
Policy Type
Required
Select a device from which the policy is imported.
Required
Select a policy type, IPS policy or AV policy.
Return to Policy import and export management functions.
82
Page 89

Configuration example
Network requirements
H3C SecCenter IPS Manager works with IPS devices. The IPS Manager collects logs sent by IPS devices,
processes and analyzes the collected data, and presents the information to the IPS Manager users
through web pages.
You need to ensure that the SecCenter can receive logs from each managed IPS device.
Adding IPS devices to the IPS Manager
Adding devices to H3C SecCenter is the prerequisite to other operations, such as querying information
based on the devices. This section describes how to add devices to the H3C SecCenter:
1. Select the system management component, and then select Device List under Device Management
to enter the device management page.
2. Click Add to enter the page for adding a device, as shown in Figure 83.
3. You can simply input the IP address and label (a string for identifying a device) of a device, leaving
other fields with the default settings.
4. Click Add.
Figure 83 Add a device to the system management component
5. Select the IPS management component, and then select Devices under System Management from
the navigation tree to enter the device management page.
83
Page 90

NOTE:
6. Click Add to enter the page for adding IPS devices, as shown in Figure 84.
7. Select the device, and click Add. After the device is added, the SecCenter system is ready for
service operations.
Figure 84 Add devices to the IPS management component
You do not need to manually add devices that SecCenter has discovered automatically.
8. On the web interface of the IPS firewall device, set the IP address of the syslog server in the notify
action to that of the SecCenter server, and set the port number to 30514.
NOTE:
The SecCenter IPS Manager uses port 30514 to receive syslogs.
84
Page 91

Index
A
Adding IPS devices to the IPS Manager
D
Device management
E
Event analysis
I
Installing the IPS Manager
Introduction to H3C SecCenter IPS Manager
IPS device management
N
Network requirements
O
Operator management
Overview
P
Policy management
43
31
5
2
31
83
16
59
83
1
R
Realtime monitoring
Registering the IPS Manager
S
System configuration
U
Uninstalling the IPS Manager
W
What H3C SecCenter IPS Manager can do
37
2
20
3
1
85
 Loading...