

Page 1

H3C Intrusion Prevention System
Web-Based Configuration Guide
Hangzhou H3C Technologies Co., Ltd.
http://www.h3c.com
Document Version: 5PW103-20101101
Page 2

Copyright © 2009-2010, Hangzhou H3C Technologies Co., Ltd. and its licensors
All Rights Reserved
No part of this manual may be reproduced or transmitted in any form or by any means without prior
written consent of Hangzhou H3C Technologies Co., Ltd.
Trademarks
Notice
H3C, , Aolynk, , H3Care,
SecPro, SecPoint, SecEngine, SecPath, Comware, Secware, Storware, NQA, VVG, V
, TOP G, , IRF, NetPilot, Neocean, NeoVTL,
2
G, VnG, PSPT,
XGbus, N-Bus, TiGem, InnoVision and HUASAN are trademarks of Hangzhou H3C Technologies Co.,
Ltd.
All other trademarks that may be mentioned in this manual are the property of their respective owners.
The information in this document is subject to change without notice. Every effort has been made in the
preparation of this document to ensure accuracy of the contents, but all statements, information, and
recommendations in this document do not constitute the warranty of any kind, express or implied.
Page 3

Preface
H3C IPS products are new-generation intrusion prevention devices developed by H3C for enterprise
users, industry users, and Telecom users. They are one of the most crucial products in the intelligent
Safe Pervasive Network (iSPN) of H3C IToIP architecture.
An IPS device can be deployed in the inline mode on the critical path of a network to perform detailed
inspection of Layer 2-7 traffic passing through the p ath, and thus to precisely identify, block, and control
various types of network attacks or flood attacks in real time.
An IPS device can also be connected to a network in the bypass mode. In that case, the IPS device is
similar to the intrusion detection system (IDS) device in functions. It can capture packets by receiving
mirrored traffic and detecting copied packets, and execute security actions indirectly through response
packets, thus protecting the network.
Moreover, IPS devices can provide powerful and realistic bandwidth management and URL filtering
functions.
H3C IPS products involve the complete series of high end-to-low end IPSs, and provide box-type
devices and card-type IPS devices. For more information about IPS models, see H3C IPS Series
Products at the H3C website.
This preface includes:
z Audience
z Conventions
z About the H3C IPS Web-Based Configuration Guide
z Obtaining Documentation
z Technical Support
z Documentation Feedback
Audience
This documentation is intended for:
z Network planners
z Field technical support and servicing engineers
z Network administrators working with the H3C IPS products
Conventions
This section describes the conventions used in this documentation set.
Command conventions
Convention Description
Boldface Bold
italic
[ ]
Italic text represents arguments that you replace with actual values.
Square brackets enclose syntax choices (keywords or arguments) that are
optional.
text represents commands and keywords that you enter literally as shown.
Page 4
Convention Description
{ x | y | ... }
[ x | y | ... ]
{ x | y | ... } *
[ x | y | ... ] *
&<1-n>
# A line that starts with a pound (#) sign is comments.
Braces enclose a set of required syntax choices separated by vertical bars,
from which you select one.
Square brackets enclose a set of optional syntax choices separated by vertical
bars, from which you select one or none.
Asterisk marked braces enclose a set of required syntax choices separated by
vertical bars, from which you select at least one.
Asterisk marked square brackets enclose optional syntax choices separated by
vertical bars, from which you may select multiple choices or none.
The argument or keyword and argument combination before the ampersand (&)
sign can be entered 1 to n times.
GUI conventions
Convention Description
Boldface
>
Window names, button names, field names, and menu items are in Boldface.
For example, the
Multi-level menus are separated by angle brackets. For example,
Folder
>
.
New User
window appears; click OK.
File
>
Create
Symbols
Convention Description
Network topology icons
Convention Description
Means reader be extremely careful. Improper operation may cause bodily
injury.
Means reader be careful. Improper operation may cause data loss or damage to
equipment.
Means an action or information that needs special attention to ensure
successful configuration or good performance.
Means a complementary description.
Means techniques helpful for you to make configuration with ease.
Represents an H3C IPS device.
Represents a generic network device, such as a router, switch, or firewall.
Represents a routing-capable device, such as a router or Layer 3 switch.
Represents a generic switch, such as a Layer 2 or Layer 3 switch, or a router
that supports Layer 2 forwarding and other Layer 2 features.
Page 5

About the H3C IPS Web-Based Configuration Guide
Organization
The H3C IPS web-based configuration guide describes the following features:
Feature Description
Describes the Web-based network management (NM) for the IPS.
z Logging in to/out from the web interface
Web overview
Device
management
User
management
System
manage
ment
Network
management
High
availability
Time table
management
Action
management
Log management
IPS
z Introduction to web users and levels
z Introduction to the web interface and web-based NM functions
z Common web interface elements
z Configuration guidelines
Describes basic configurations for IPS management.
z Displaying system status, system information, and system time
z Configuring system monitoring
z Save configuration, manage the configuration file, and restore the factory
defaults
z Upgrading signature database and software versions
z Displaying license information, importing and exporting a license
z Setting the operating mode
z Configuring OAA
z Rebooting system
Describes user management functions for the IPS device.
z Managing user accounts and online users
z Configuring a security policy
Describes network management configurations for the IPS.
z Configuring management interface parameters, executing a ping operation,
creating a static route, and configuring DNS servers
z Displaying and configuring interface properties
z Creating security zones
z Creating a segment and configuring segment bandwidth control
Describes the high availability features of the IPS.
z Configuring Layer 2 fallback
z Configuring interface status synchronization
Describes the time table configuration for the IPS.
z Creating a time table
Describes action management configurations for the IPS.
z Creating a block, rate limit, or notify action
z Creating an action set
z Uploading packet trace files
Describes log management configurations for the IPS.
z Displaying, querying, deleting system logs, operation logs, attack logs, and
virus logs
z Querying service logs and URL logs
z Configuring device logs, data logs, and email logs
Describes the attack prevention configurations for the IPS.
z Creating an IPS policy
z Configuring rules for a policy
z Applying an IPS policy to a segment
z Configuring IPS policy shortcut application
Page 6

Feature Description
Describes URL filtering configurations for the IPS.
URL Filtering
z Configuring URL filtering global parameters
z Creating and applying a URL filtering policy
Describes anti-virus configurations for the IPS.
z Creating an anti-virus policy
Anti-virus
z Configuring rules for a policy
z Applying a policy to a segment
z Querying viruses
Describes DDoS prevention configurations for the IPS.
z Creating a DDoS policy
z Configuring learning rules
z Applying a DDoS policy to a segment
DDoS
z Maintaining a DDoS policy application
z Adding detection rules
z Adding a static filtering rule
z Configuring dynamic filtering rules
z Displaying DDoS statistics
Describes bandwidth management configuration for the IPS.
Bandwidth management
z Configuring protocols and services
z Creating a bandwidth management policy and applying the policy to a segment
Describes blacklist configurations for the IPS.
Blacklist
z Adding a blacklist entry manually
z Querying blacklist entries
Describes report configurations for the IPS.
z Displaying packet statistics
Report
z Configuring, querying traffic statistics reports and top N reports
z Querying attack reports and top N attack reports
z Querying virus reports and top N virus reports
Acronym Lists the acronyms used in the IPS web-based configuration guide.
Related Documentation
In addition to the H3C IPS web-based configuration guide, you can go to H3C SecBlade IPS Cards
Documentation Navigator to view manuals of the SecBlade series IPS cards for reference.
Obtaining Documentation
You can access the most up-to-date H3C product documentation on the World Wide Web at
http://www.h3c.com.
Click the links on the top navigation bar to obtain different categories of product documentation:
[Technical Support & Documents > Technical Documents] – Provides hardware installation, software
upgrading, and software feature configuration and maintenance documentation.
[Products & Solutions] – Provides information about products and technologies, as well as solutions.
[Technical Support & Documents > Software Download] – Provides the documentation released with
the software version.
Page 7

Technical Support
customer_service@h3c.com
http://www.h3c.com
Documentation Feedback
You can e-mail your comments about product documentation to info@h3c.com.
We appreciate your comments.
Page 8

Table of Contents
1 Web Overview............................................................................................................................................1-1
Overview.................................................................................................................................................1-1
Logging In to the Web Interface..............................................................................................................1-1
Logging Out of the Web Interface...........................................................................................................1-2
Introduction to Web Users and Levels....................................................................................................1-3
Introduction to the Web Interface............................................................................................................1-3
Introduction to the Web-Based NM Functions........................................................................................1-4
Common Web Interface Elements........................................................................................................1-10
Configuration Guidelines.......................................................................................................................1-13
2 Device Registration...................................................................................................................................2-1
Device Registration.................................................................................................................................2-1
License File Update ................................................................................................................................2-2
3 Device Management..................................................................................................................................3-1
System Status.........................................................................................................................................3-1
System Status Overview .................................................................................................................3-1
Viewing System Status....................................................................................................................3-1
System Information.................................................................................................................................3-5
System Information Overview .........................................................................................................3-5
Viewing System Information............................................................................................................3-5
System Time...........................................................................................................................................3-6
System Time Overview....................................................................................................................3-6
Configuring System Time................................................................................................................3-6
System Monitoring ..................................................................................................................................3-7
System Monitoring Overview...........................................................................................................3-7
Configuring System Monitoring.......................................................................................................3-7
Configuration Maintenance.....................................................................................................................3-8
Configuration Maintenance Overview .............................................................................................3-8
Saving the Current Configuration....................................................................................................3-9
Configuration File Management......................................................................................................3-9
Restoring the Factory Defaults......................................................................................................3-11
Signature Upgrade................................................................................................................................3-11
Signature Upgrade Overview........................................................................................................3-11
Signature Database Version Management...................................................................................3-12
Manual Upgrade............................................................................................................................3-12
Auto Upgrade ................................................................................................................................3-13
Software Upgrade.................................................................................................................................3-14
Software Upgrade Overview .........................................................................................................3-14
Upgrading Software.......................................................................................................................3-15
License..................................................................................................................................................3-16
License Overview..........................................................................................................................3-16
i
Page 9

Managing a License ......................................................................................................................3-16
Operating Mode ....................................................................................................................................3-17
Operating Mode Overview.............................................................................................................3-17
Configuring Operating Mode.........................................................................................................3-18
Configuration Guidelines...............................................................................................................3-19
OAA Configuration................................................................................................................................3-20
OAA Configuration Overview ........................................................................................................3-20
Configuring OAA Client .................................................................................................................3-22
OAA Configuration Example .........................................................................................................3-23
System Reboot......................................................................................................................................3-27
System Reboot Overview..............................................................................................................3-27
Rebooting the system....................................................................................................................3-27
4 User Management......................................................................................................................................4-1
User Management Overview ..................................................................................................................4-1
Configuring User Management...............................................................................................................4-1
Configuration Task List....................................................................................................................4-1
Managing User Accounts ................................................................................................................4-2
Managing Online Users...................................................................................................................4-3
Configuring the Security Policy .......................................................................................................4-4
5 Management Interface Configuration......................................................................................................5-1
Overview.................................................................................................................................................5-1
Management Interface Parameters.................................................................................................5-1
Ping..................................................................................................................................................5-1
Static Routes...................................................................................................................................5-1
DNS Servers....................................................................................................................................5-2
Configuring a Management Interface......................................................................................................5-2
Configuring Management Interface Parameters .............................................................................5-2
Executing a Ping Operation.............................................................................................................5-4
Creating a Static Route ...................................................................................................................5-4
Configuring DNS Servers................................................................................................................5-5
6 Interface Configuration.............................................................................................................................6-1
Overview.................................................................................................................................................6-1
Configuring and Displaying Interface Properties ....................................................................................6-1
7 Security Zone Configuration....................................................................................................................7-1
Overview.................................................................................................................................................7-1
Configuring a Security Zone ...................................................................................................................7-1
Configuration Task List....................................................................................................................7-1
Creating a Security Zone.................................................................................................................7-2
Security Zone Configuration Example ....................................................................................................7-4
8 Segment Configuration.............................................................................................................................8-1
Overview.................................................................................................................................................8-1
Configuring a Segment ...........................................................................................................................8-1
Configuration Task List....................................................................................................................8-1
Creating a Segment.........................................................................................................................8-1
ii
Page 10

Applying a Segment Bandwidth Control Scheme to the Segment..................................................8-4
Precautions.............................................................................................................................................8-4
9 Layer 2 Fallback.........................................................................................................................................9-1
Layer 2 Fallback Overview......................................................................................................................9-1
Configuring Layer 2 Fallback..................................................................................................................9-1
Guidelines...............................................................................................................................................9-2
10 Interface Status Synchronization.........................................................................................................10-1
Interface Status Synchronization Overview..........................................................................................10-1
Configuring Interface Status Synchronization.......................................................................................10-1
11 Time Table Management.......................................................................................................................11-1
Time Table Management Overview......................................................................................................11-1
Configuring Time Table Management...................................................................................................11-1
Configuration Task List..................................................................................................................11-1
Creating a Time Table...................................................................................................................11-1
12 Action Management...............................................................................................................................12-1
Action Management Overview..............................................................................................................12-1
Configuring Action Management...........................................................................................................12-1
Configuration Task List..................................................................................................................12-1
Creating a Block Action.................................................................................................................12-2
Creating a Notify Action.................................................................................................................12-3
Creating an Action Set...................................................................................................................12-4
Uploading Packet Trace Files .......................................................................................................12-7
13 Log Management...................................................................................................................................13-1
System Logs .........................................................................................................................................13-1
System Logs Overview..................................................................................................................13-1
Displaying Recent Logs.................................................................................................................13-1
Querying System Logs..................................................................................................................13-3
Deleting System Logs....................................................................................................................13-4
Backing Up System Logs ..............................................................................................................13-4
Operation Logs......................................................................................................................................13-4
Operation Logs Overview..............................................................................................................13-4
Displaying Recent Logs.................................................................................................................13-5
Querying Operation Logs ..............................................................................................................13-6
Deleting Operation Logs................................................................................................................13-8
Backing Up Operation Logs ..........................................................................................................13-8
Attack Logs ...........................................................................................................................................13-8
Attack Logs Overview....................................................................................................................13-8
Displaying Recent Logs.................................................................................................................13-9
Querying Attack Logs..................................................................................................................13-10
Deleting Attack Logs....................................................................................................................13-11
Virus Logs...........................................................................................................................................13-12
Virus Logs Overview....................................................................................................................13-12
Displaying Recent Logs...............................................................................................................13-12
Querying Virus Logs....................................................................................................................13-14
iii
Page 11

Deleting Virus Logs .....................................................................................................................13-15
Service Logs .......................................................................................................................................13-16
URL Logs............................................................................................................................................13-17
Log Configuration................................................................................................................................13-19
Log Configuration Overview........................................................................................................13-19
Configuring Device Logs .............................................................................................................13-19
Configuring Data Logs.................................................................................................................13-20
Configuring Email Parameters ....................................................................................................13-22
14 IPS...........................................................................................................................................................14-1
IPS Overview ........................................................................................................................................14-1
Configuring IPS.....................................................................................................................................14-1
Configuration Task List..................................................................................................................14-1
Creating IPS Policy........................................................................................................................14-2
Configuring Default Rules for the Policy........................................................................................14-3
Configuring User Defined Rules for the Policy..............................................................................14-6
Applying an IPS Policy to a Segment............................................................................................14-8
Configuring IPS Policy Fast Application......................................................................................14-10
IPS Configuration Example.................................................................................................................14-11
Configuration Guidelines.....................................................................................................................14-14
15 URL Filtering Configuration .................................................................................................................15-1
URL Filtering Overview.........................................................................................................................15-1
Configuring URL Filtering......................................................................................................................15-1
Configuration Task List..................................................................................................................15-1
Configuring Global Parameters for URL Filtering..........................................................................15-2
Creating and Applying a URL Filtering Policy...............................................................................15-4
URL Filtering Configuration Example..................................................................................................15-10
URL Filtering Configuration Example (Category-Based URL Filtering Supported).....................15-10
URL Filtering Configuration Example (Category-Based URL Filtering Unsupported).................15-15
Configuration Guidelines.....................................................................................................................15-19
16 Anti-Virus Configuration.......................................................................................................................16-1
Anti-Virus Overview...............................................................................................................................16-1
Configuring Anti-Virus...........................................................................................................................16-1
Configuration Task List..................................................................................................................16-1
Creating an Anti-Virus Policy.........................................................................................................16-2
Configuring Rules for the Policy....................................................................................................16-2
Applying the Policy to a Segment..................................................................................................16-5
Querying Viruses...........................................................................................................................16-6
Anti-Virus Configuration Example.........................................................................................................16-6
Configuration Guidelines.....................................................................................................................16-10
17 DDoS Protection Configuration ...........................................................................................................17-1
Overview...............................................................................................................................................17-1
Introduction to DDoS.....................................................................................................................17-1
Terminology of DDoS Protection...................................................................................................17-2
Implementation of DDoS Protection..............................................................................................17-2
iv
Page 12

DDoS Protection States.................................................................................................................17-3
Configuring DDoS Protection................................................................................................................17-3
DDoS Protection Configuration Task List......................................................................................17-3
Creating a DDoS Policy.................................................................................................................17-5
Configuring Learning Rules...........................................................................................................17-6
Applying a DDoS Policy on a Segment.........................................................................................17-8
Maintaining a DDoS Policy Application.......................................................................................17-10
Configuring Detection Rules........................................................................................................17-11
Configuring Static Filtering Rules................................................................................................17-15
Configuring Dynamic Filtering Rules...........................................................................................17-18
Displaying DDoS Data Statistics .................................................................................................17-19
DDoS Protection Configuration Example............................................................................................17-20
Configuration Guidelines.....................................................................................................................17-22
18 Bandwidth Management.......................................................................................................................18-1
Overview...............................................................................................................................................18-1
Introduction to Bandwidth Management........................................................................................18-1
Introduction to Services.................................................................................................................18-1
Configuring Bandwidth Management....................................................................................................18-1
Configuration Task List..................................................................................................................18-1
Configuring Protocols....................................................................................................................18-2
Configuring Services .....................................................................................................................18-4
Creating and Applying a Bandwidth Management Policy .............................................................18-6
Bandwidth Management Configuration Example................................................................................18-11
Configuration Guidelines.....................................................................................................................18-17
19 Blacklist..................................................................................................................................................19-1
Blacklist Overview.................................................................................................................................19-1
Configuring Blacklist..............................................................................................................................19-1
Configuration Task List..................................................................................................................19-1
Adding a Blacklist Entry Manually.................................................................................................19-1
Querying Blacklist Entries..............................................................................................................19-2
Blacklist Configuration Example ...........................................................................................................19-3
20 Packet Statistics....................................................................................................................................20-1
Overview...............................................................................................................................................20-1
Viewing Packet Statistics......................................................................................................................20-1
21 Traffic Statistics Report........................................................................................................................21-1
Overview...............................................................................................................................................21-1
Configuring Traffic Statistics Reports....................................................................................................21-1
Configuration Task List..................................................................................................................21-1
Configuring Traffic Statistics Reports............................................................................................21-2
Querying the Traffic Statistics Reports..........................................................................................21-3
Configuring Top N Reports............................................................................................................21-4
Querying Top N Reports................................................................................................................21-4
22 Attack Report.........................................................................................................................................22-1
Overview...............................................................................................................................................22-1
v
Page 13

Configuring Attack Reports...................................................................................................................22-1
Configuration Task List..................................................................................................................22-1
Querying Attack Reports ...............................................................................................................22-1
Querying Top N Attack Reports ....................................................................................................22-3
23 Virus Report...........................................................................................................................................23-1
Overview...............................................................................................................................................23-1
Configuring a Virus Report....................................................................................................................23-1
Configuration Task List..................................................................................................................23-1
Querying Virus Reports.................................................................................................................23-1
Querying Top N Virus Reports......................................................................................................23-3
24 Index .......................................................................................................................................................24-1
vi
Page 14
1 Web Overview
Overview
Hangzhou H3C Technologies Co., Ltd. (hereinafter referred to as H3C) provides the Web-based
network management function for the Intrusion Prevention System (IPS) of H3C to facilitate the
operations and maintenance on the IPS devices. Through this function, the administrator can visually
manage and maintain the IPS devices through the Web-based configuration interfaces.
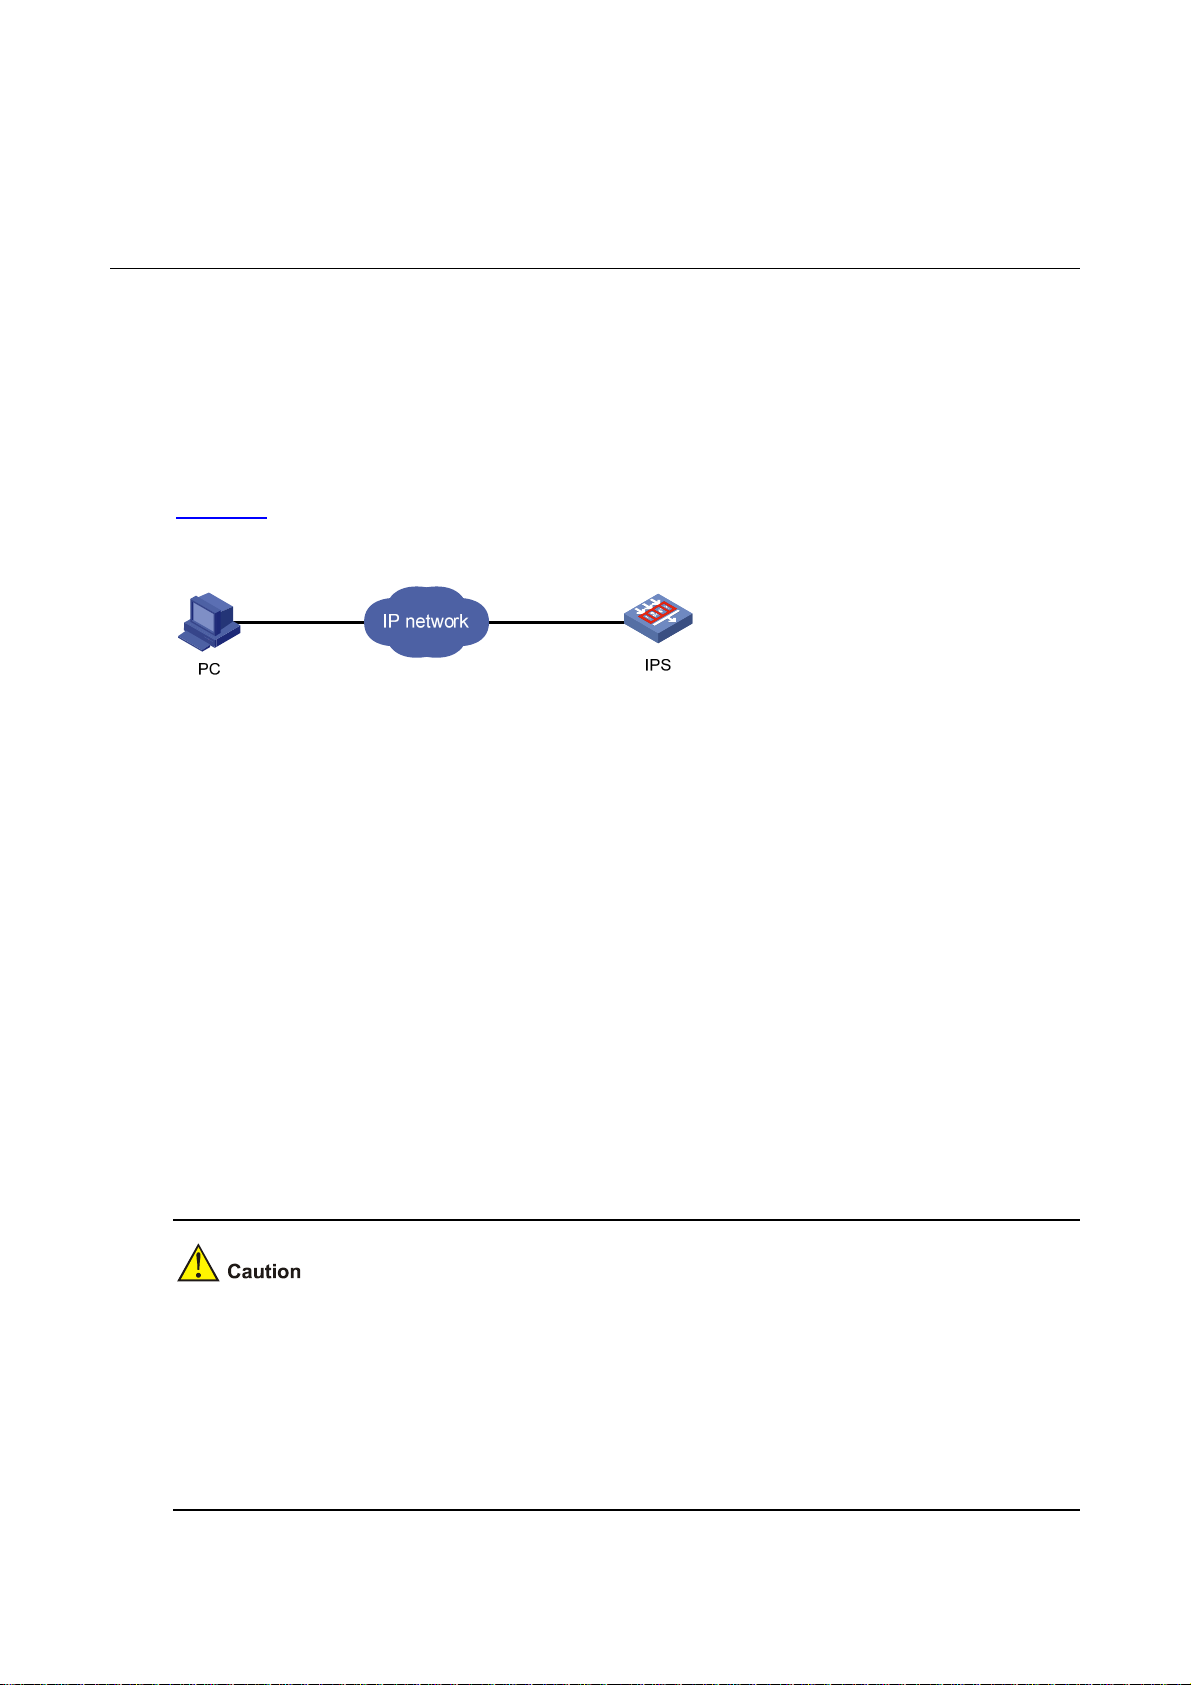
Figure 1-1 shows a Web-based network management operating system.
Figure 1-1 Web-based network management operating environment
Logging In to the Web Interface
The device is provided with the default Web login information .Y ou can use the default information to log
in to the Web interface. The default Web login inform ation is:
z Username: admin
z Password: admin
z IP address of the device: 192.168.1.1
To log in to the device through the Web interface, follow these steps:
Step1 Connect the device and PC
Connect the default management port meth 0/0 of the device to the PC using a crossover Ethernet
cable. For the IPS cards with silkscreen LSWM1IPS10 for S5800 and S5820X series switches, the
default management port is meth 0/0. For other models of IPS cards, the default management port is
meth 0/2.
z If the IPS device provides two management ports, you can use only one to manage the device at a
time.
z By default, a management port with the smallest ID is the default management port, and it is
assigned IP address 192.168.1.1/24. To make a management port with a larger ID the default
management port, remove the IP address of the original default management po rt and assign an IP
address to the management port that you want to configure as the default one.
1-1
Page 15
Step2 Configure an IP address for the PC and ensure that the PC and device can communicate with each
other.
Modify the IP address to one within the network segment 192.168.1.0/24 (except for 192.168.1.1), for
example, 192.168.1.2.
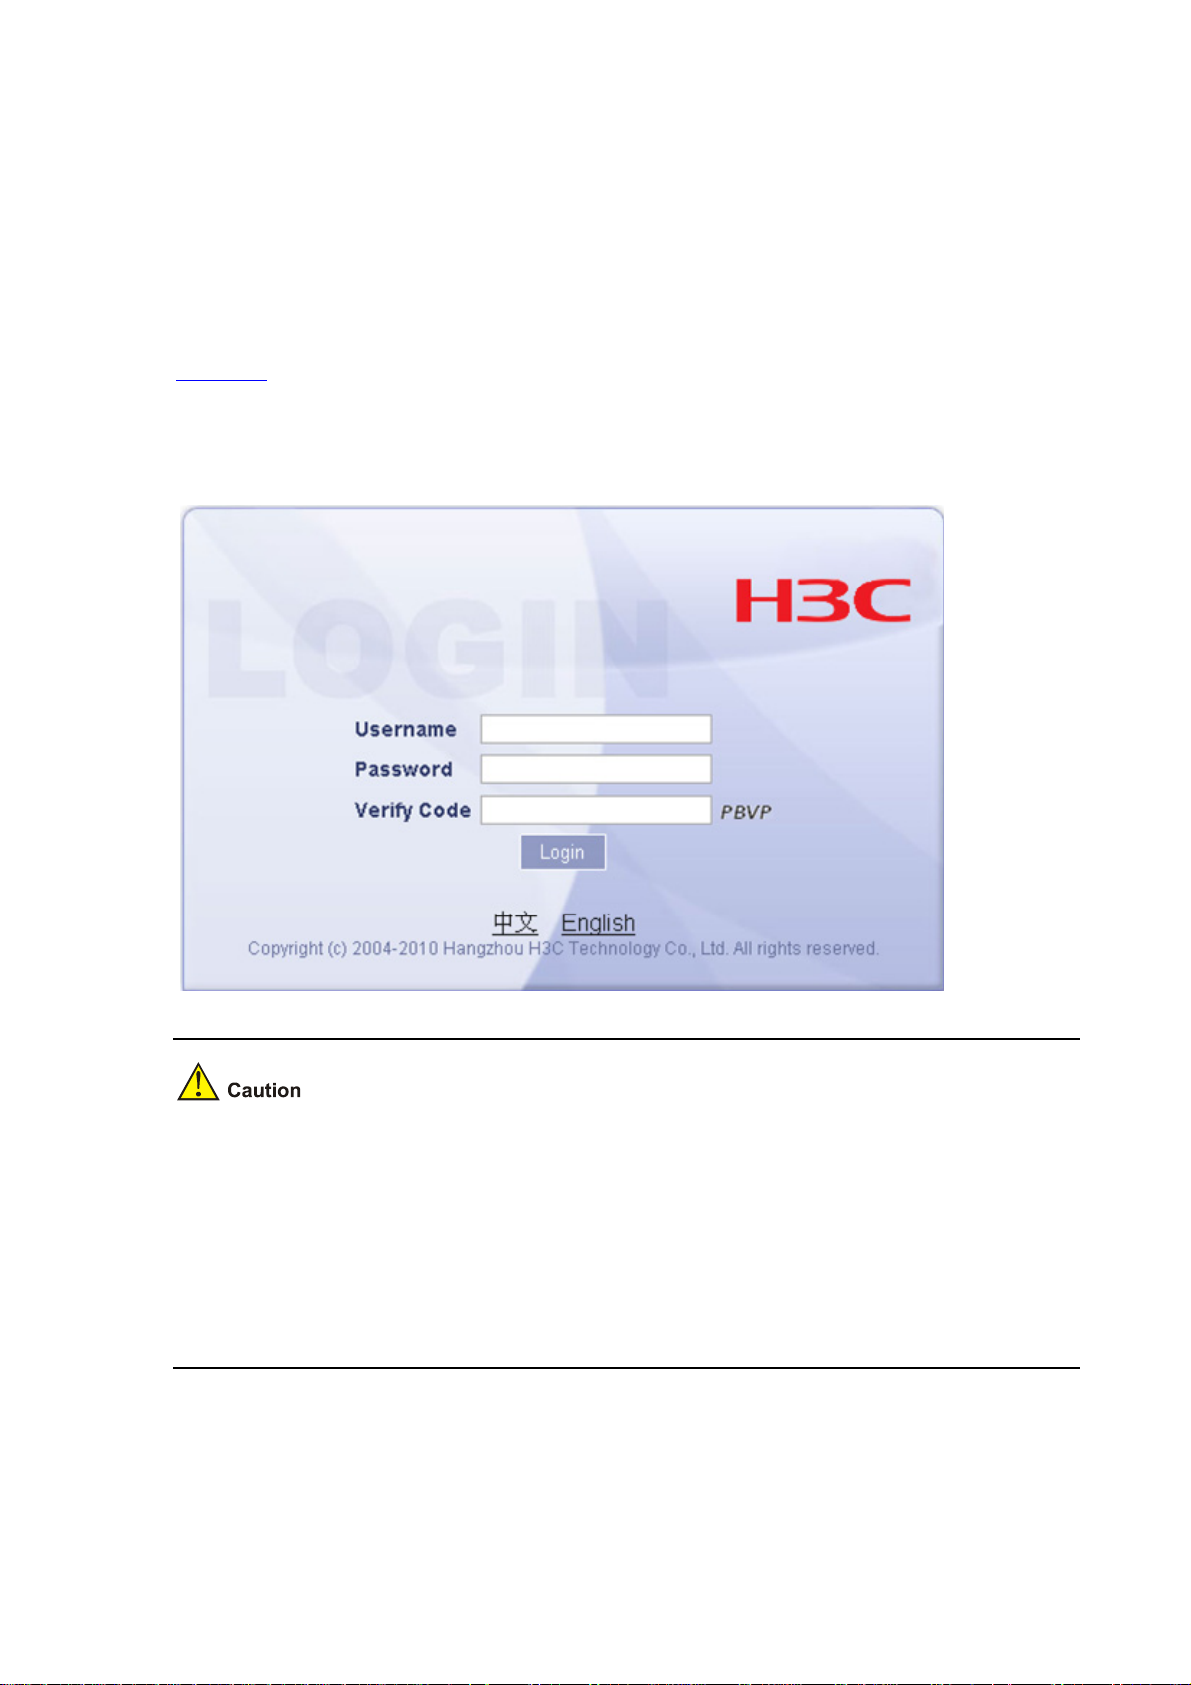
Step3 Launch the IE browser, and input the login information.
On the PC, launch the IE browser, type https://192.168.1.1 in the address bar (the HTTPS service is
enabled by default), and press Enter. You can enter the login page of the Web interface, as shown in
Figure 1-2.
Click Chinese or English on the login page, in put the username (admin) password (admin), and ve rify
code shown on the page, and click Login to enter the Web interfa ce.
Figure 1-2 Login page of the Web interface
z The PC where you configure the device is not necessarily the Web-based network management
terminal.
z After the first-time login, you are recommended to change the default password. For detailed
operation, refer to User Management.
z A verify code will expire in 2 minutes, so you need to use the code within the expiration time. To
obtain a new verify code, click the verify code image.
z Up to 5 users can concurrently log in to the device through the Web interface.
Logging Out of the Web Interface
Click Logout in the upper-right corner of the W eb interface. The system gives a confirmation dialog box ,
on which you can click OK to quit Web-based network management.
1-2
Page 16
Introduction to Web Users and Levels
Web user levels include Level 0, Level 1, Level 2, Level 3, and auditor. Table 1-1 lists the Web user
levels and corresponding operation rights.
Table 1-1 Web user levels and operation rights
User level Operation right
z Use the network diagnosis tool ping
Level 0 (Visit)
Level 1 (Monitor)
Level 2 (System)
Level 3 (Manage)
Auditor
z View the IP address of the management port, management rights,
static routes, and DNS server information
z Unable to perform configuration
z Have the privileges of Level-0 users
z View all the other configuration information except user information
z View all the other logs excepts operation logs
z Unable to perform configuration
z Unable to monitor packet distribution in real time
z Have the privileges of Level-1 users
z Perform all the other configuration operations except user
configuration, operation log configuration, device log configuration,
software upgrade, and configuration maintenance
z Have the privileges of Level-2 users
z View all configuration information
z View all logs
z Perform all configuration operations
z View/back up/delete operation logs
z Unable to perform other operations except the above ones
This manual assumes that a Level-3 user performs the configuration operations unless otherwise
specified.
Introduction to the Web Interface
The Web interface is composed of three parts: navigation area, title area, and body area, as shown in
Figure 1-3.
1-3
Page 17
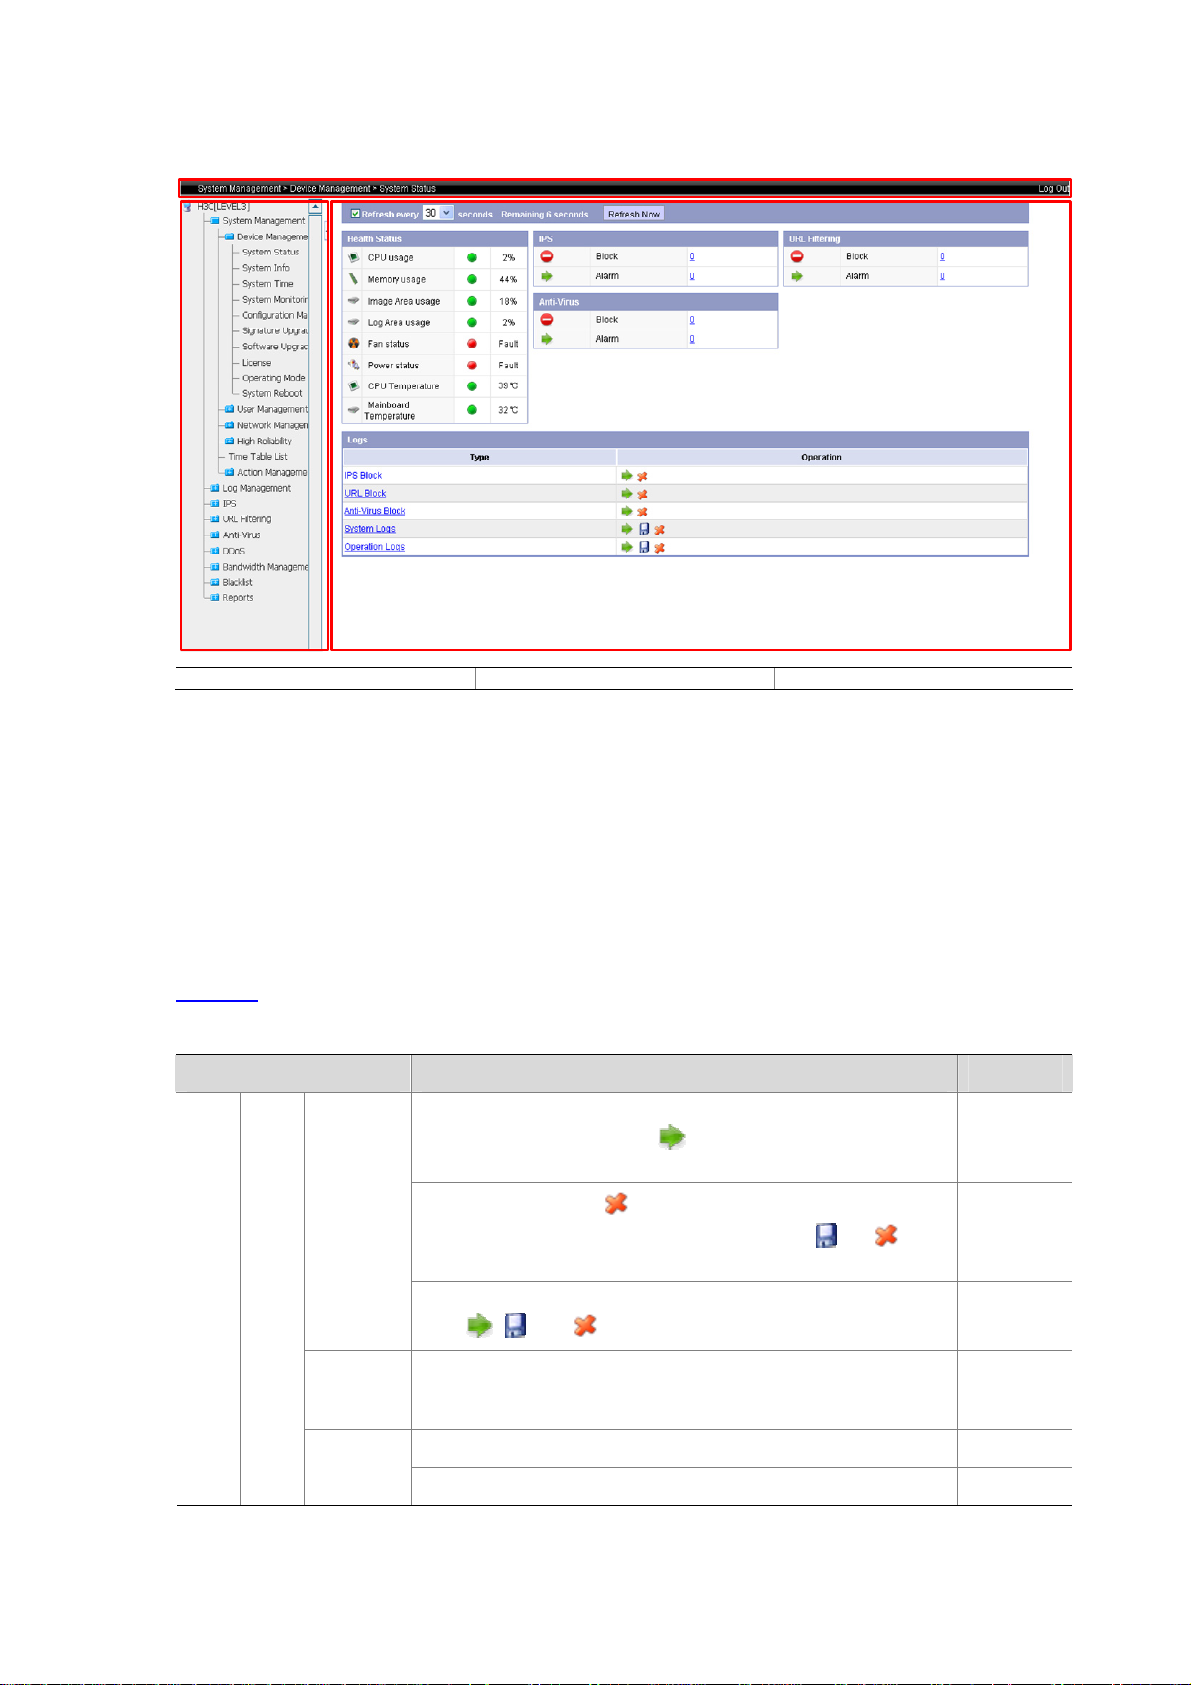
Figure 1-3 Web-based configuration interface
(2)
(1)
(3)
(1) Navigation area (2) Title area (3) Body area
z Navigation area—Organizes the Web-based NM function menus in the form of a navigation tree,
where you can select function menus as needed. The result is displ ayed in the body area.
z Title area—Displays the path of the current configuration interface in the navigation area; provides
the Logout button to log out of the Web interface.
z Body area—The area where you can configure and display a function.
Introduction to the Web-Based NM Functions
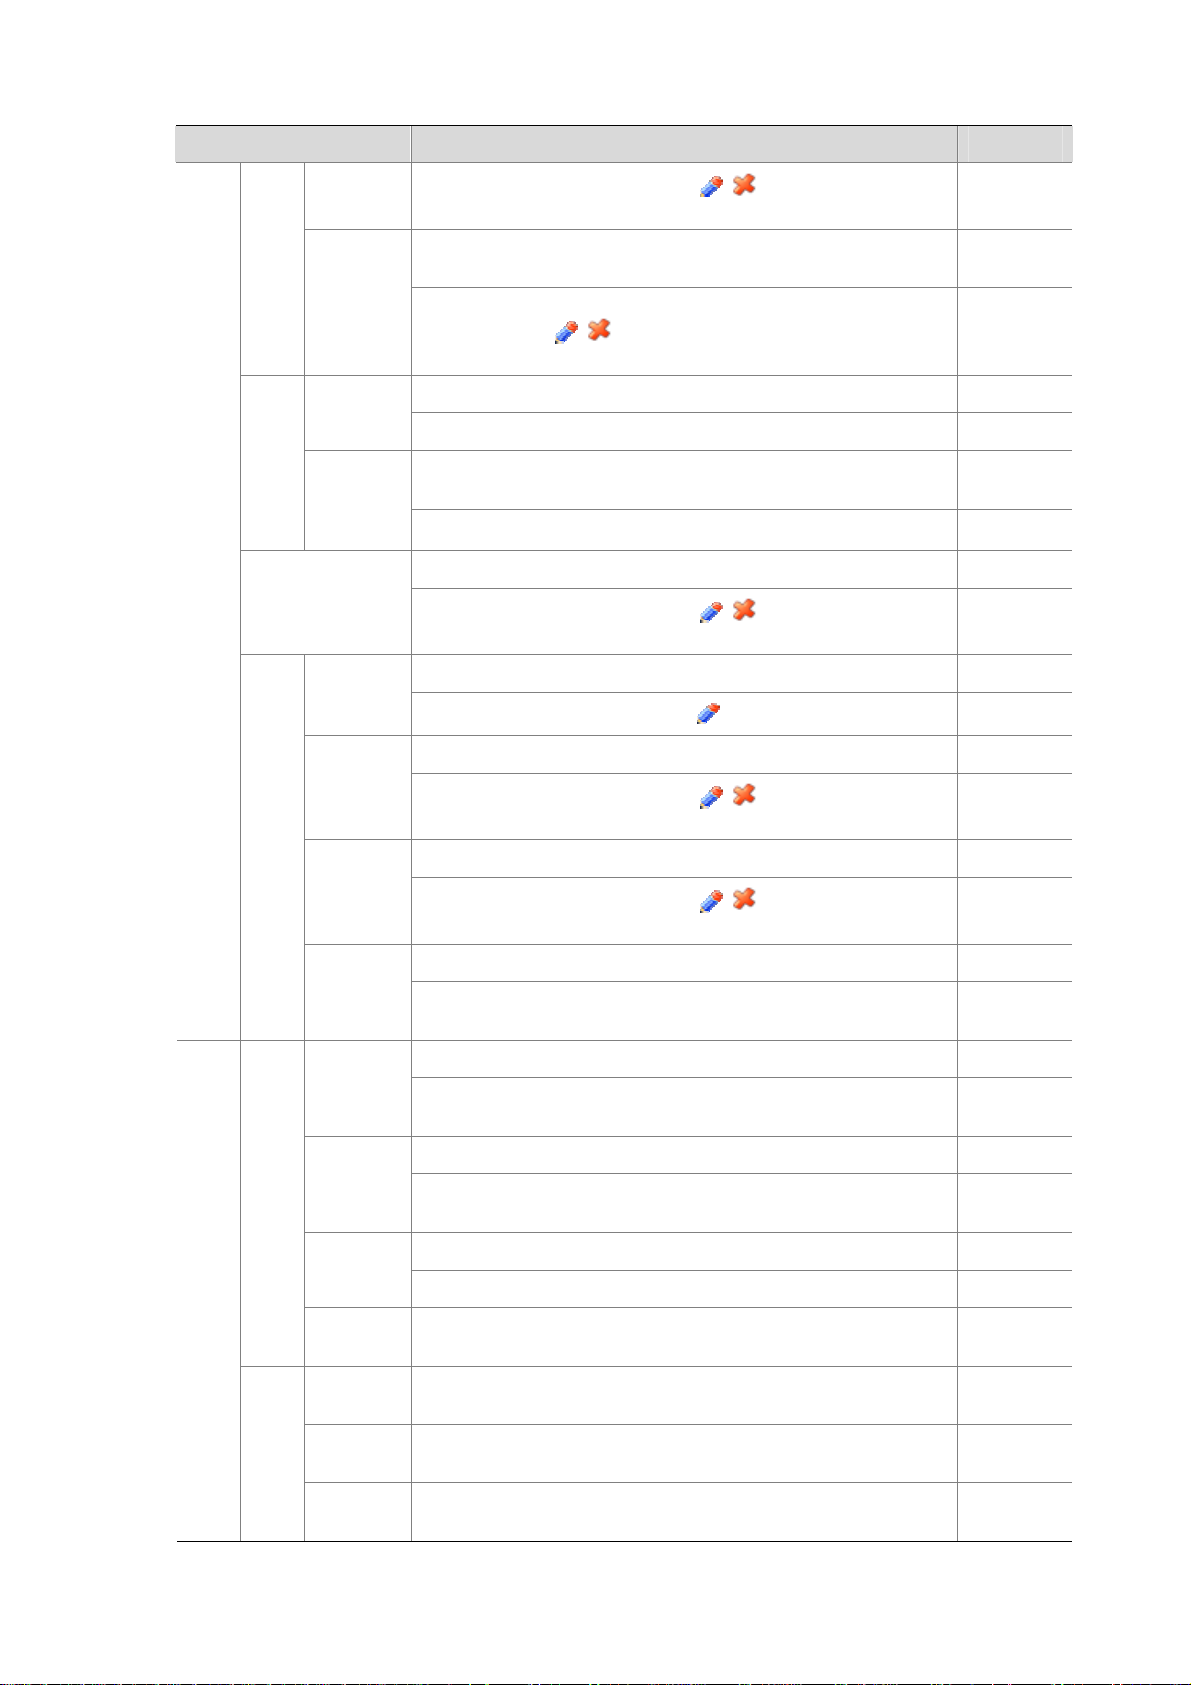
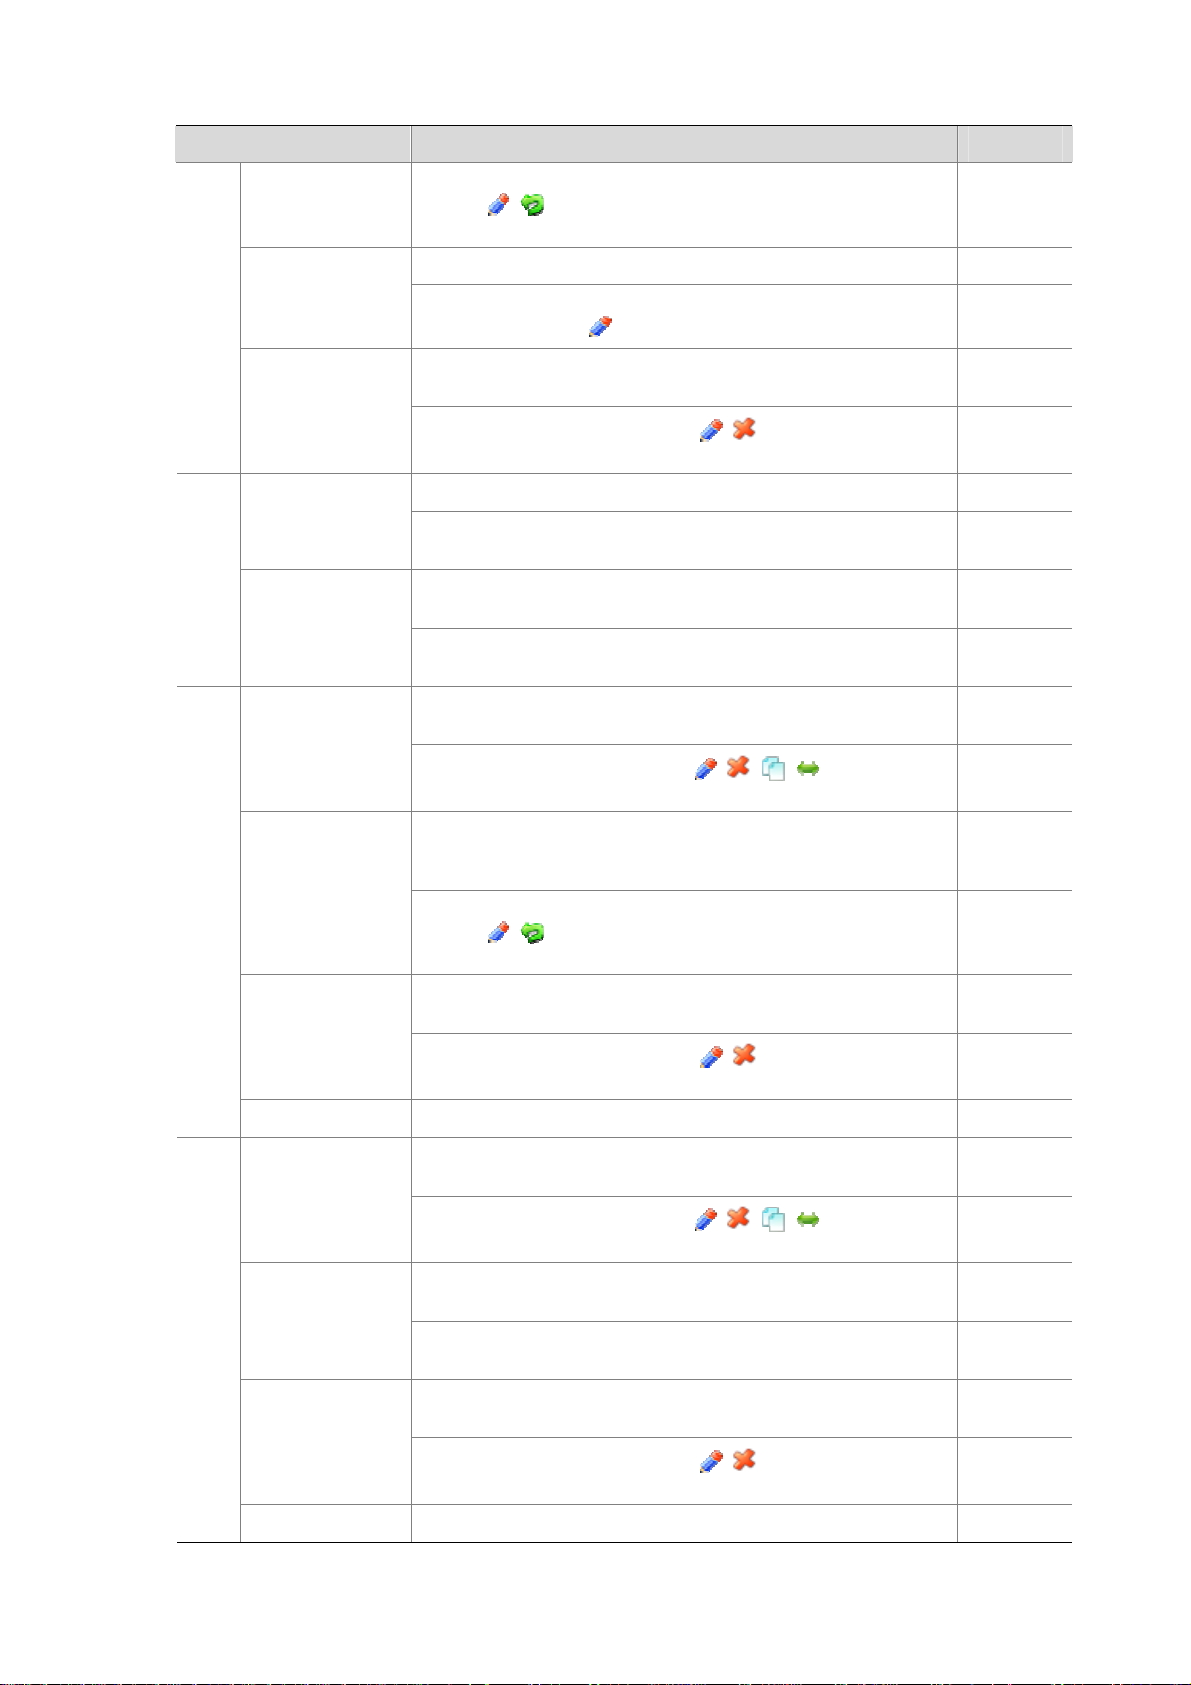
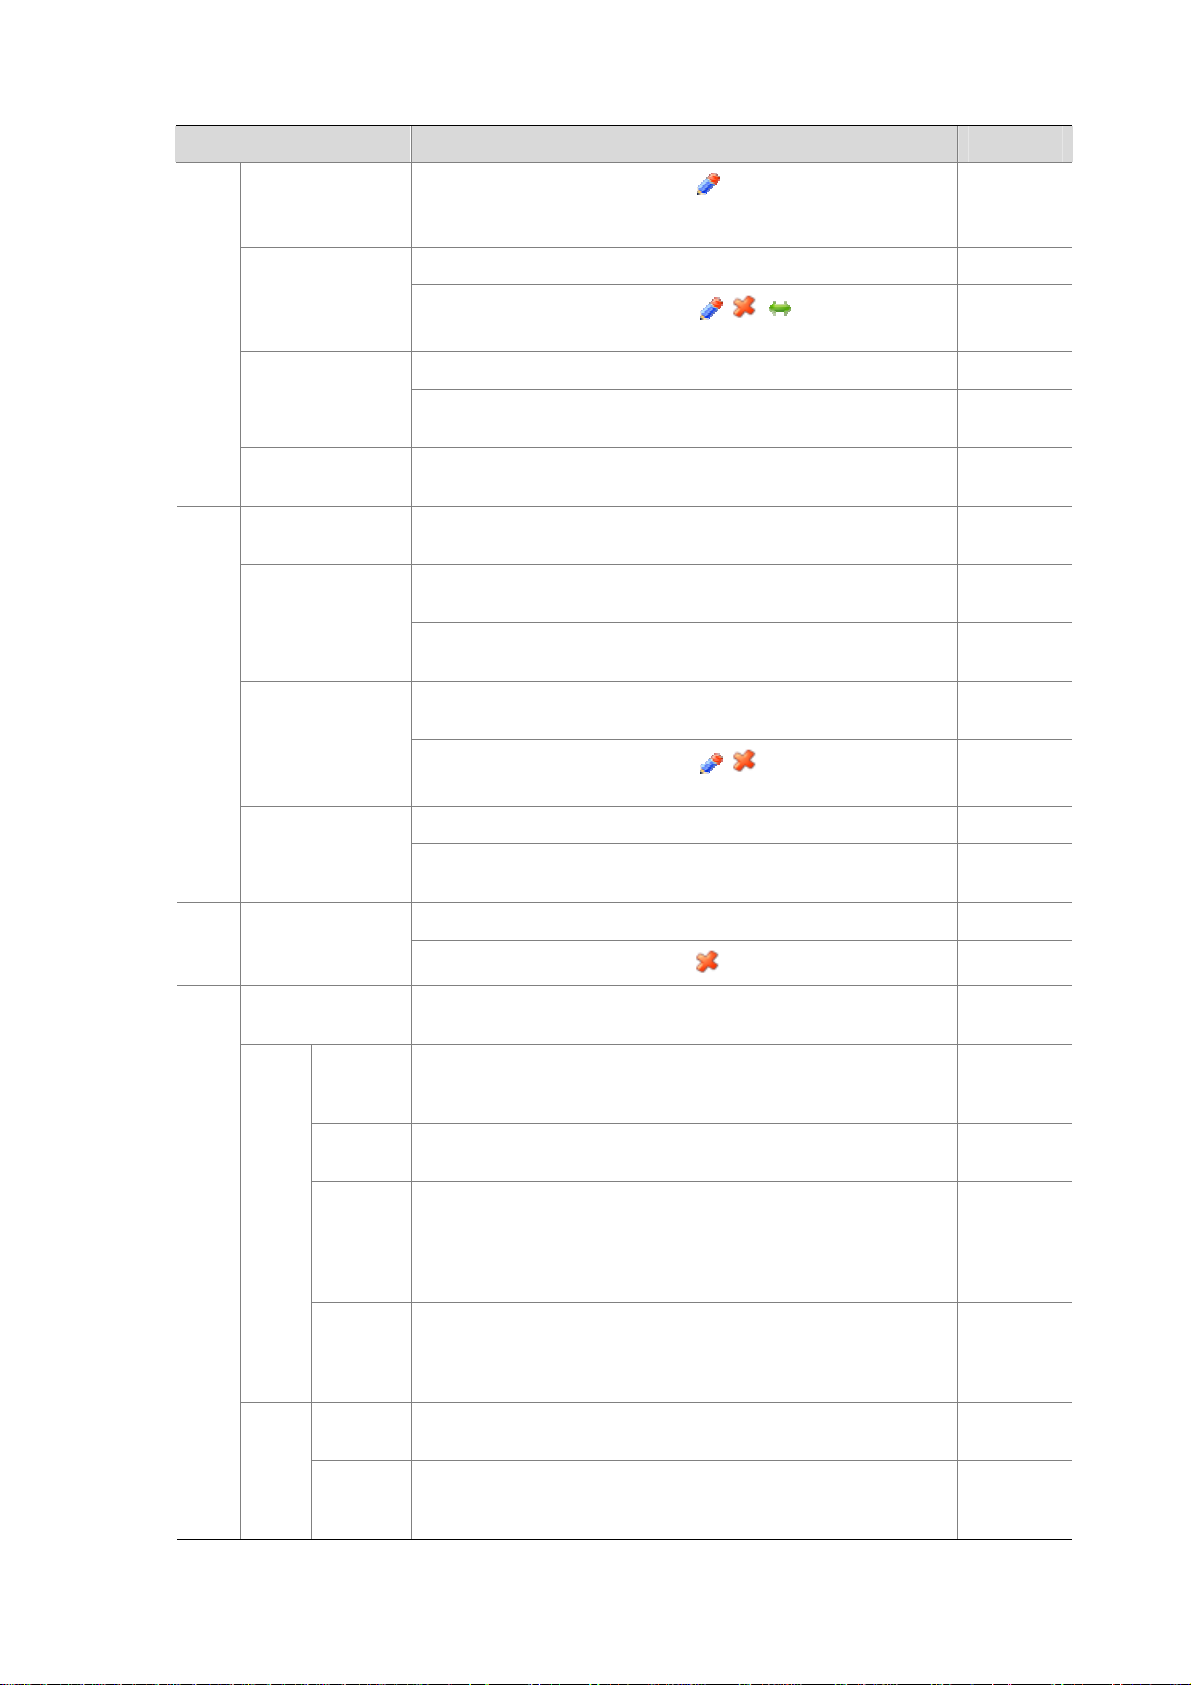
Table 1-2 lists the Web-based NM functions.
Table 1-2 Web-based NM functions
Menu item Description User level
Syst
em
Man
age
ment
Devi
ce
Man
age
ment
System
Status
Displays the current status of system software and hardware.
Allows you to use links or the
block logs, anti-virus block logs, and system logs.
Allows you to use icon for IPS block logs, URL block logs,
anti-virus block logs, and allows you to use icons
system logs.
Allows you to use the link to view operation logs, and use
icons
, , and .
icon to view IPS block logs, URL
and for
Level 1
Level 2
Level 3
System
Informatio
n
System
Time
Displays the current software versions, hardware versions,
versions of signature packages, device serial number, MAC
address of the NM port, and system time.
Displays system date, time, and time zone. Level 1
Allows you to set system time source and time zone. Level 2
1-4
Level 1
Page 18

Menu item Description User level
Displays system thresholds, including CPU usage threshold,
System
Monitoring
memory usage threshold, hardware usage threshold, CPU
temperature upper and lower limits, and main board temperature
upper and lower limits.
Allows you to set system thresholds, including CPU usage
threshold, memory usage threshold, hardware usage threshold,
CPU temperature upper and lower limits, and main board
temperature upper and lower limits.
Level 1
Level 2
Configurat
ion
Maintenan
ce
Signature
Upgrade
Software
Upgrade
License
Operating
Mode
OAA
Configurat
ion
Allows you to save the current configuration; add, delete, upload,
download, import, and export the configuration file; restore the
factory defaults.
Displays current versions and history versions of signature
packages, and configuration information of signature package auto
upgrade.
Allows you to roll back signature packages to a history version.
Upgrade signature package manually. Enable signature package
auto upgrade and set the upgrade time.
Displays the software versions, upload date, sizes of the version
files, and version status on the device.
Allows you to update and delete a software version, and modify
software version status.
Displays license information, and allows you to import and export
license file.
Displays operating mode configuration information. Level 1
Allows you to set operating mode parameters. Level 2
Displays OAA client configuration information. Level 1
Allows you to configure OAA client and test connectivity between
OAA client and server.
Level 3
Level 1
Level 2
Level 1
Level 3
Level 1
Level 2
User
Man
age
ment
Netw
ork
Man
age
ment
System
Reboot
User
Accounts
Online
Users
Security
Policy
Managem
ent
Interface
Interface
Configurat
ion
Security
Allows you to reboot the device. Level 2
Displays user information, and allow you to add, modify and delete
user accounts.
Displays all users that log in to the Web interface and allow you to
kick out the logged-in users except yourself.
Displays security related information and allow you to configure the
settings including timeout time, password strength, and lock
settings.
Displays the IP address and protocol used by each management
interface, display static routes and DNS server information, and
allow you to perform ping operations.
Allows you to specify the IP address and protocol used by each
management interface, add or delete static routes, and configure
DNS servers.
Displays interface properties, including connection status,
interface status, interface type, transmission rate, and duplex
mode.
Allows you to configure interface properties, such as interface
status, interface type, transmission rate, and duplex mode.
Displays all security zones, name links, and segment links. Level 1
Level 3
Level 3
Level 3
Level 0
Level 2
Level 1
Level 2
1-5
Page 19
Menu item Description User level
Zone
Allows you to use icons or buttons , ,
perform corresponding functions.
Add
, and
Remove
to
Level 2
Segment
Configurat
ion
Layer 2
High
Avail
abilit
y
Time Table List
Actio
n
Man
age
ment
Fallback
Interface
Status
Synchroni
zation
Action Set
List
Block
Action List
Notify
Action List
Displays all segments, segment links, internal zone links, and
external zone links.
Allows you to control bandwidth for a specific segment by using
Activate, Add Segment, Apply
icons or buttons
Delete
.
Displays the parameters related to Layer 2 fallback. Level 1
Allows you to set the parameters related to Layer 2 fallback. Level 2
Displays the configuration information of interface status
synchronization.
Allows you to set interface status synchronization. Level 2
Displays all the time tables, and use the name links. Level 1
Allows you to use icons or buttons
Delete
.
Displays all the action sets, and use the name links. Level 1
Allows you to use icons or buttons
Displays all the block actions, and use the name links. Level 1
Allows you to use icons or buttons , ,
Delete
.
Displays all the notify actions, and use the name links. Level 1
Allows you to use icons or buttons , ,
Delete
.
, ,
Activate, Add
, ,
Activate, Add
,
Activate, Add
Activate, Add
, and
, and
, and
Delete
, and
, and
.
Level 1
Level 2
Level 1
Level 2
Level 2
Level 2
Level 2
Log
Man
age
ment
Syst
em
Logs
Oper
ation
Logs
Packet
Trace File
Upload
Recent
Logs
Query
Logs
Delete
Logs
Back Up
Logs
Recent
Logs
Query
Logs
Delete
Logs
Displays the parameters for uploading packet trace files. Level 1
Allows you to configure the parameters for uploading packet trace
files.
Displays the recent 25 system logs of the day. Level 1
Allows you to export the system logs of the day to a file in the
format of CSV.
Displays the system logs based on the query conditions. Level 1
Allows you to export the queried system logs to a file in the format
of CSV.
Displays system log file list. Level 1
Allows you to delete system log files. Level 2
Displays all system log files, open and export the specified system
log files to a file in the format of CSV.
Displays the recent 25 operation logs of the day, and export the
operation logs of the day to a file in the format of CSV.
Displays the operation logs based on the query conditions, and
export the queried operation logs to a file in the format of CSV.
Displays the system log file list and delete the operation log files.
Level 2
Level 2
Level 2
Level 2
Level
3/Auditor
Level
3/Auditor
Level
3/Auditor
1-6
Page 20

Menu item Description User level
Attac
k
Logs
Virus
Logs
Back Up
Logs
Recent
Logs
Query
Logs
Delete
Logs
Recent
Logs
Query
Logs
Delete
Logs
Displays all operation log files, open and export the specified
operation log files to a file in the format of CSV.
Displays the recent 25 IPS block or alert logs of the day. Level 1
Allows you to export the attack logs of the day to a file in the format
of CSV.
Displays the attack logs based on the query conditions. Level 1
Allows you to export the queried attack logs to a file in the format of
CSV.
Query the attack logs based on the query conditions. Level 1
Allows you to delete the attack logs based on the query conditions. Level 2
Displays the recent 25 virus block or alert logs of the day. Level 1
Allows you to export the virus logs of the day to a file in the format
of CSV.
Displays the virus logs based on the query conditions. Level 1
Allows you to export the queried virus logs to a file in the format of
CSV.
Query the virus logs based on the query conditions. Level 1
Allows you to delete the virus logs based on the query conditions. Level 2
Level
3/Auditor
Level 2
Level 2
Level 2
Level 2
IPS
Displays the service logs based on the query conditions. Level 1
Service Logs
URL Logs
Device
Logs
Log
Confi
gurat
ion
Fast Application Allows you to configure an IPS policy and apply it to a segment. Level 2
Policy
Management
Data Logs
Mail
Configurat
ion
Allows you to delete the queried service logs or export them to a
file in the format of CSV.
Displays the URL logs based on the query conditions. Level 1
Allows you to delete the queried URL logs or export them to a file in
the format of CSV.
Displays the remote output parameters and local storage control
parameters for system and operation logs.
Allows you to set the remote output parameters and local storage
control parameters for system and operation logs.
Displays the parameters for data logs, such as log aggregation and
log lifetime.
Allows you to set the parameters for data logs, such as log
aggregation and log lifetime.
Displays the parameters for sending mails. Level 1
Allows you to set the parameters for sending mails. Level 2
Displays IPS policies and display details of a policy by clicking its
name link.
Allows you to use icons or buttons
Delete
and
.
, , , ,
Activate, Add
,
Level 2
Level 2
Level 1
Level 3
Level 1
Level 2
Level 1
Level 2
Default Rule
Management
Displays default rules of an IPS policy, allows you to search for an
IPS policy by certain criteria and display its default rules, and use
rule name links, action set links, and the
1-7
Query
button.
Level 1
Page 21
Menu item Description User level
Allows you to modify policy name and description, and use icons or
Level 2
Level 2
User Defined Rule
Management
buttons , ,
Rule, Disable Rule
Displays user defined rules of an IPS policy. Level 1
Allows you to configure user defined rules for an IPS policy, and
use icons or buttons ,
Apply, Activate, Modify Action Set, Enable
Reset Rule
, and
Add, Delete
.
, and
Activate
.
URL
Filter
ing
AntiVirus
Man
age
ment
Segment Policy
Management
Global
Configuration
Policy
Management
Policy
Management
Rule Management
Displays policy application list and use the links and buttons in the
list.
Allows you to use icons or buttons
Delete
.
Displays global configuration of URL filtering. Level 1
Allows you to configure global settings of URL filtering, and
activate the configuration.
Displays URL filtering policies and the segments where the policies
are applied
Allows you to add, modify, and delete URL filtering policy
application, and activate configuration.
Displays anti-virus policies and display details of a policy by
clicking its name link.
Allows you to use icons or buttons
Delete
and
Displays information about an anti-virus policy, search for a policy
by certain criteria, and use rule name links, action set links, and the
Query
Allows you to modify policy name and description, and use icons or
buttons , ,
Rule, Disable Rule
.
button.
Apply, Activate, Modify Action Set, Enable
Reset Rule
, and
Activate, Add
, ,
, , , ,
.
, and
Activate, Add
,
Level 1
Level 2
Level 2
Level 1
Level 2
Level 1
Level 2
Level 1
Level 2
DDo
S
Displays policy application list and use the links and buttons in the
Segment Policy
Management
Query Viruses Displays virus list. Level 1
DDoS Policies
Learning Rule
Segment Policy
Detection Rule Displays detection rules of a protected object and use ID links. Level 1
list.
Activate, Add
Allows you to use icons or buttons
Delete
.
Displays DDoS policies and allows you to display details of a policy
by clicking its name link.
Allows you to use icons or buttons
Delete
and
Displays information about a DDoS policy, including name,
description and learning rules..
Allows you to modify policy name, description and learning rules,
and use icon
Displays policy application list and allows you to use the links and
buttons in the list.
Allows you to use icons or buttons
Delete
.
.
Activate
.
, ,
, , , ,
Activate, Add
, ,
, and
Activate, Add
, and
,
Level 1
Level 2
Level 1
Level 2
Level 1
Level 2
Level 1
Level 2
1-8
Page 22
Menu item Description User level
Band
width
Man
age
ment
Static Filtering
Rule
Dynamic Filtering
Rule
Protection Status
Configuration
Wizard
Policy
Management
Service
Management
Allows you to use icons or buttons ,
Selected, Unlock Selected, Enable Selected, Disable Selected
Delete
and
Displays static filtering rules applied in a direction on a segment. Level 1
Allows you to use icons or buttons , , ,
Enable Selected, Disable Selected
Displays dynamic filtering rules based on the query conditions. Level 1
Allows you to use buttons
Disable Selected
Displays the protection status and DDoS statistics of a protected
project.
Allows you to configure a bandwidth management policy and apply
it to a segment.
Displays bandwidth polices and the segments where the policies
are applied.
Allows you to add, modify, and delete bandwidth policy
applications, and activate the configuration.
Displays service tree and information and matching rules of the
selected service.
Allows you to use icons or buttons
and
Activate
.
Activate, Enable Selected
.
.
Activate, Save, Add, Lock
Activate, Add
Delete
, and
, ,
.
, and
Add, Delete, Apply
Level 2
,
,
Level 2
Level 2
Level 1
Level 2
Level 1
Level 2
Level 1
,
Level 2
Blac
klist
Rep
ort
Protocol
Management
Blacklist
Management
Packet Statistics
Traffic
Statistics
Reports
Top N
Traffi
c
Statis
tics
Repo
rts
Reports
Traffic
Statistics
Report
Configura
tion
Top N
Report
Configura
tion
Displays protocol tree and information about the selected protocol. Level 1
Allows you to use buttons
Activate
Displays blacklist entries matching the conditions. Level 1
Allows you to use icons or buttons
Allows you to collect and display real-time packet distribution
information based on the specified criteria.
Displays traffic statistics reports based on the query conditions. Level 1
Displays top N reports based on the query conditions. Level 1
Allows you to add and delete traffic statistics report parameters. Level 2
Allows you to add and delete top N report parameters. Level 2
.
Add, Remove, Reset, Apply
Activate, Add
,
, and
, and
Delete
.
Level 2
Level 2
Level 2
Attac
k
Repo
rts
Attack
Reports
Top N
Attack
Reports
Displays attack reports based on the query conditions. Level 1
Displays top N attack reports based on the query conditions. Level 1
1-9
Page 23
Menu item Description User level
Virus
Repo
rts
Virus
Reports
Top N
Virus
Reports
Displays virus reports based on the query conditions. Level 1
Displays top N virus reports based on the query conditions. Level 1
Common Web Interface Elements
Common buttons and icons
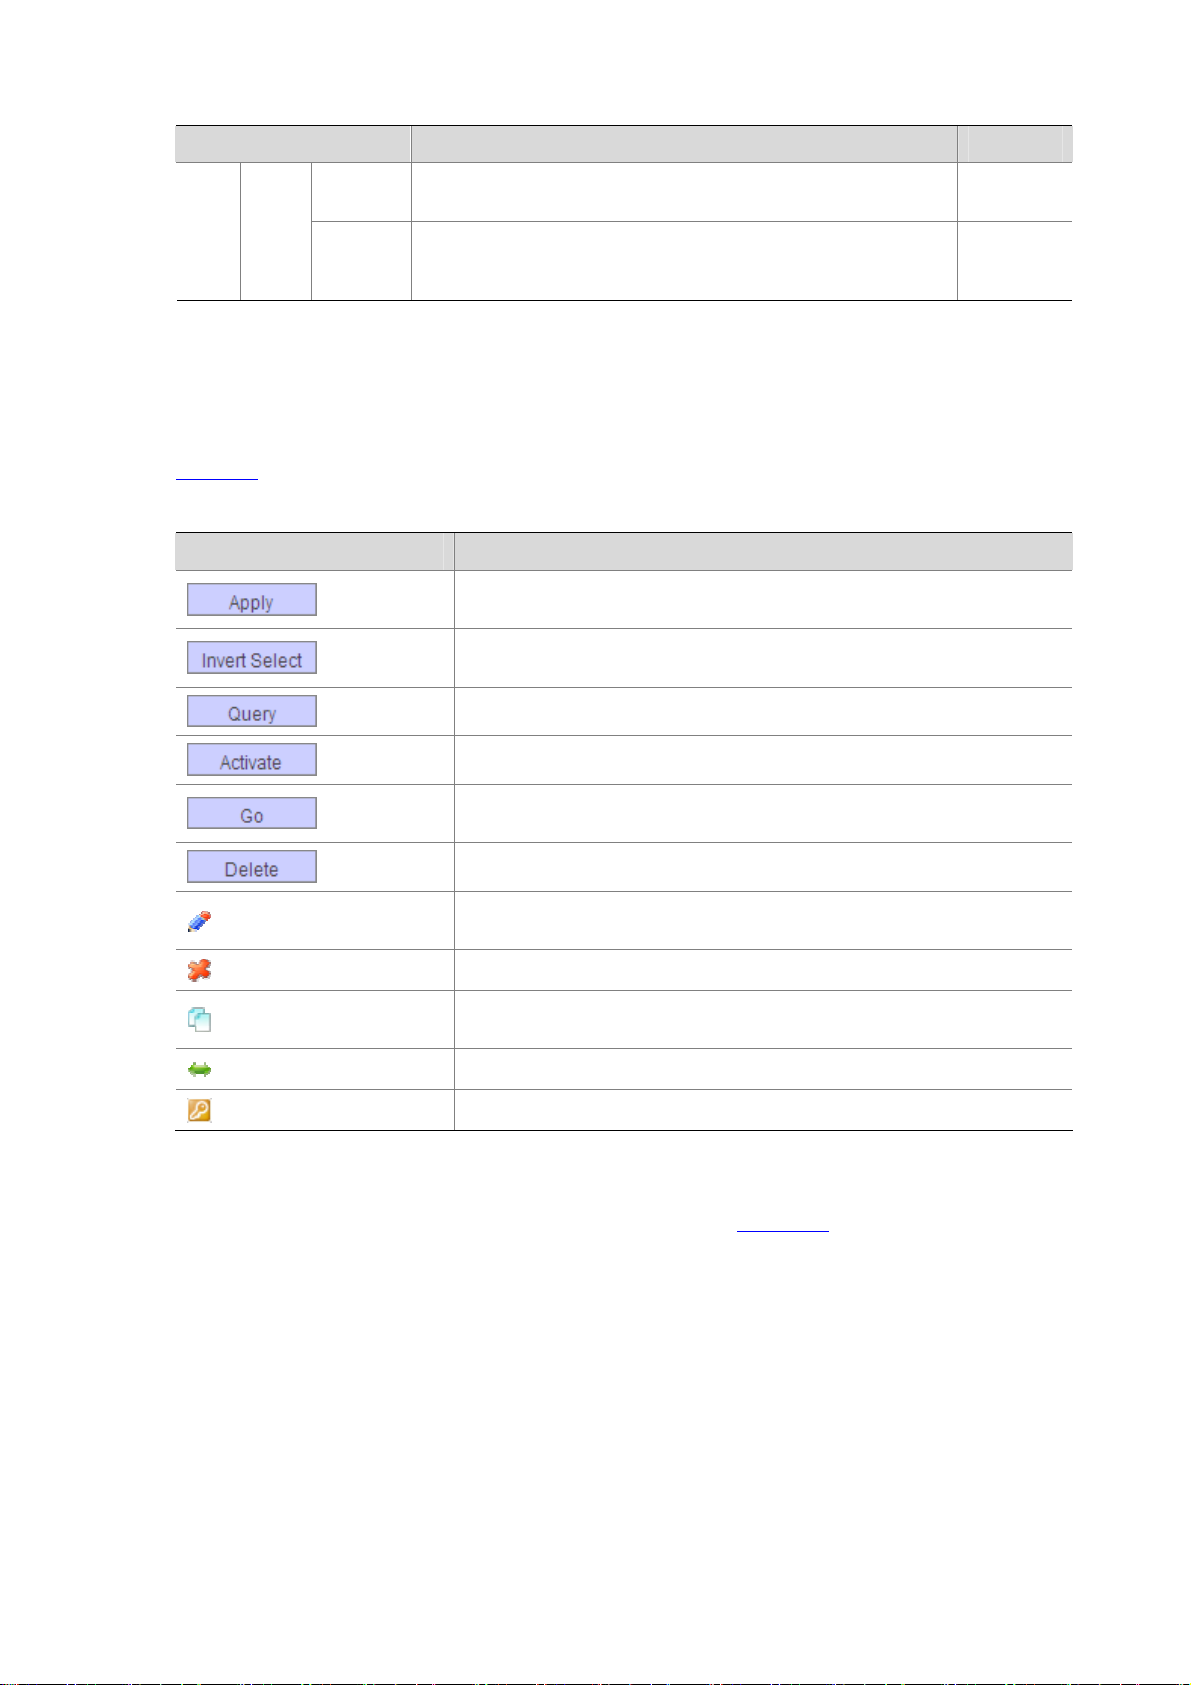
Table 1-3 describes the commonly used buttons and icons on the Web interface.
Table 1-3 Common buttons and icons
Button and icon Description
Bring the configuration on the current page into effect or save the
configuration into the database.
Select all entries that were not selected, and deselect those that were
selected.
Query all entries matching the query criteria.
Activate a configuration in the database, and bring it into effect.
Go to the selected page. Applicable to a list displayed on more than one
page.
Delete the selected entries.
Enter the detailed configuration page of an entry to allow you to view and
modify its parameters.
Delete an entry.
Copy the configuration of an entry and enter the page for adding a new
entry,
Enter the page for managing segment policies.
Indicate that the entry is a default one.
Content display by pages
The web interface can display contents by pages, as shown in Figure 1-4. You can set the number of
entries that are displayed per page, and use the First, Prev, Next, and Last links to view the contents
on the first, previous, next, and last pages, or go to any page that you want to check.
You can also click the column headings—such as Timestamp, Module, Severity, and Log Content
—to sort the contents.
1-10
Page 24
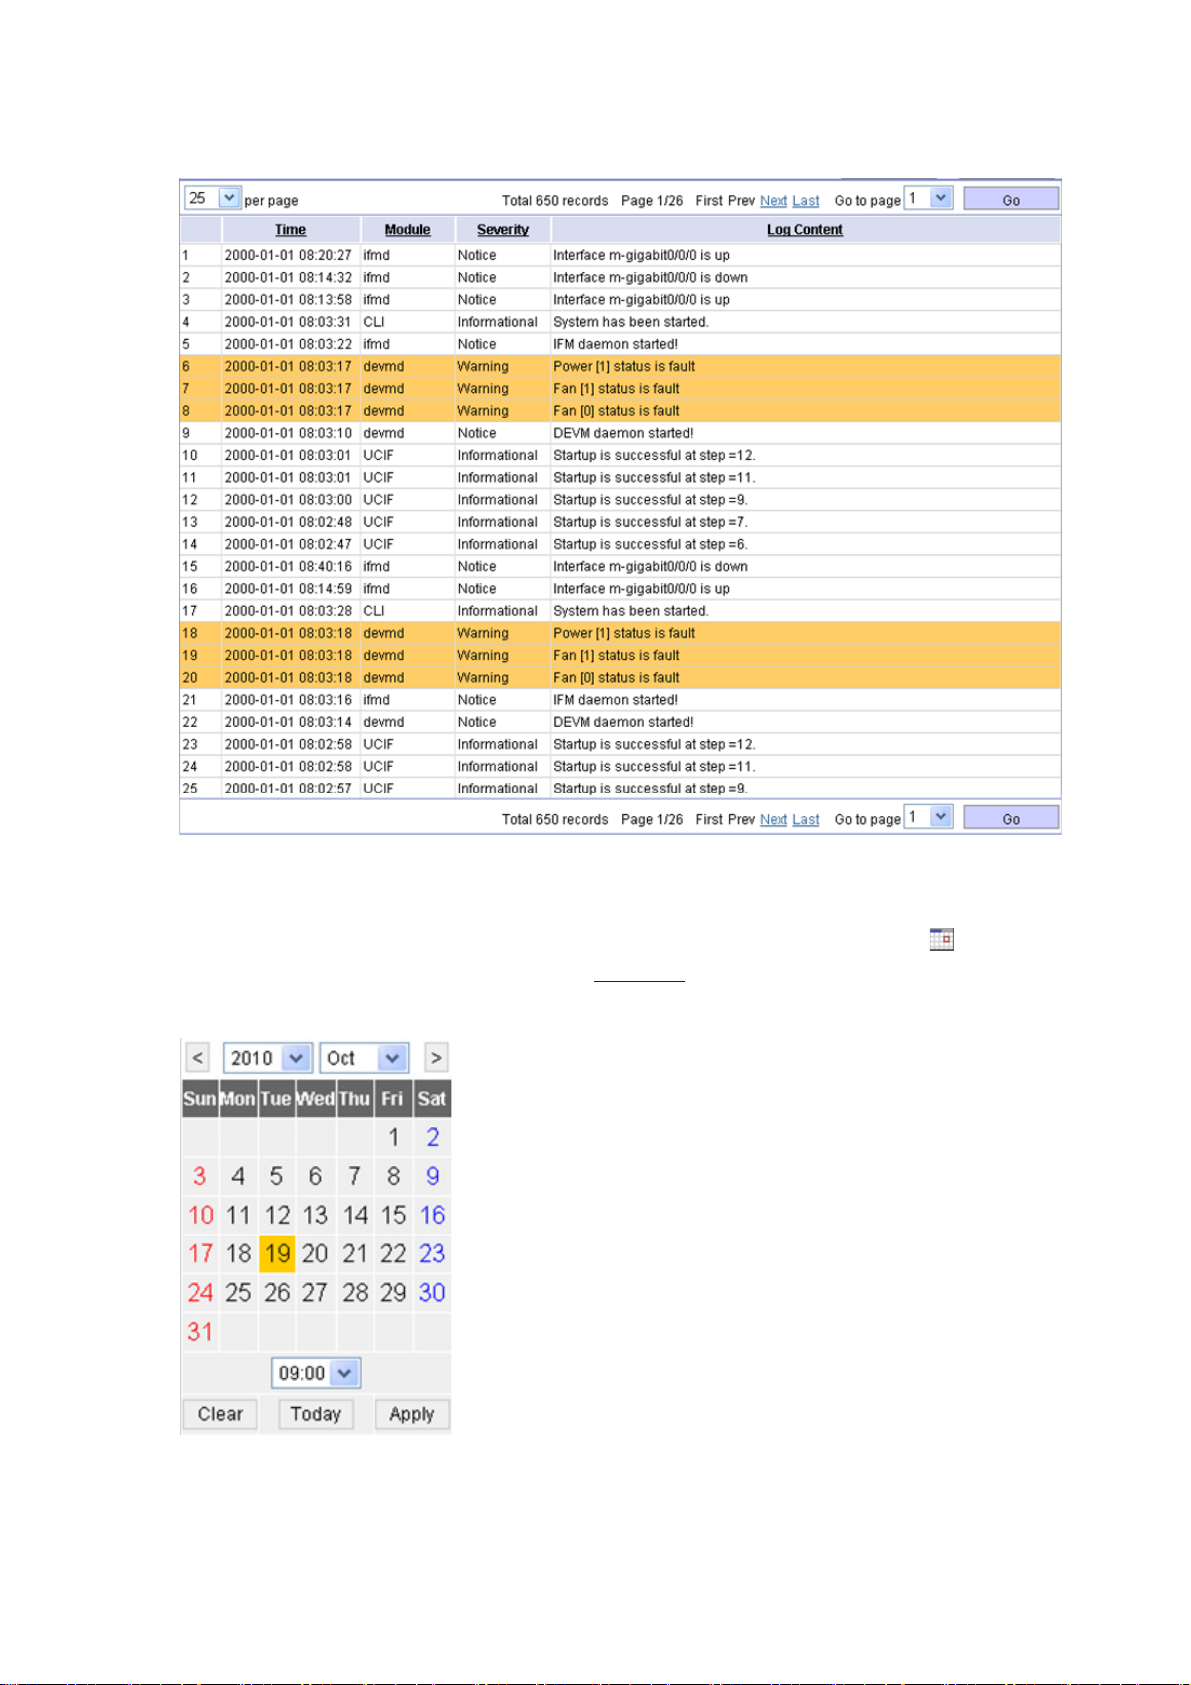
Figure 1-4 Content display by pages
Calendar
To facilitate setting time, the Web interface provides calendar interface. You can click to display the
calendar interface for setting time, as shown in
Figure 1-5.
Figure 1-5 Calendar
z To set a time, select year, month, day and hour, and click Apply.
z To cancel the time setting, click Clear.
1-11
Page 25
z To set a time to the system time of the local host, click Today. Note that, for the definition library
update module, today refers to the current system time of the device.
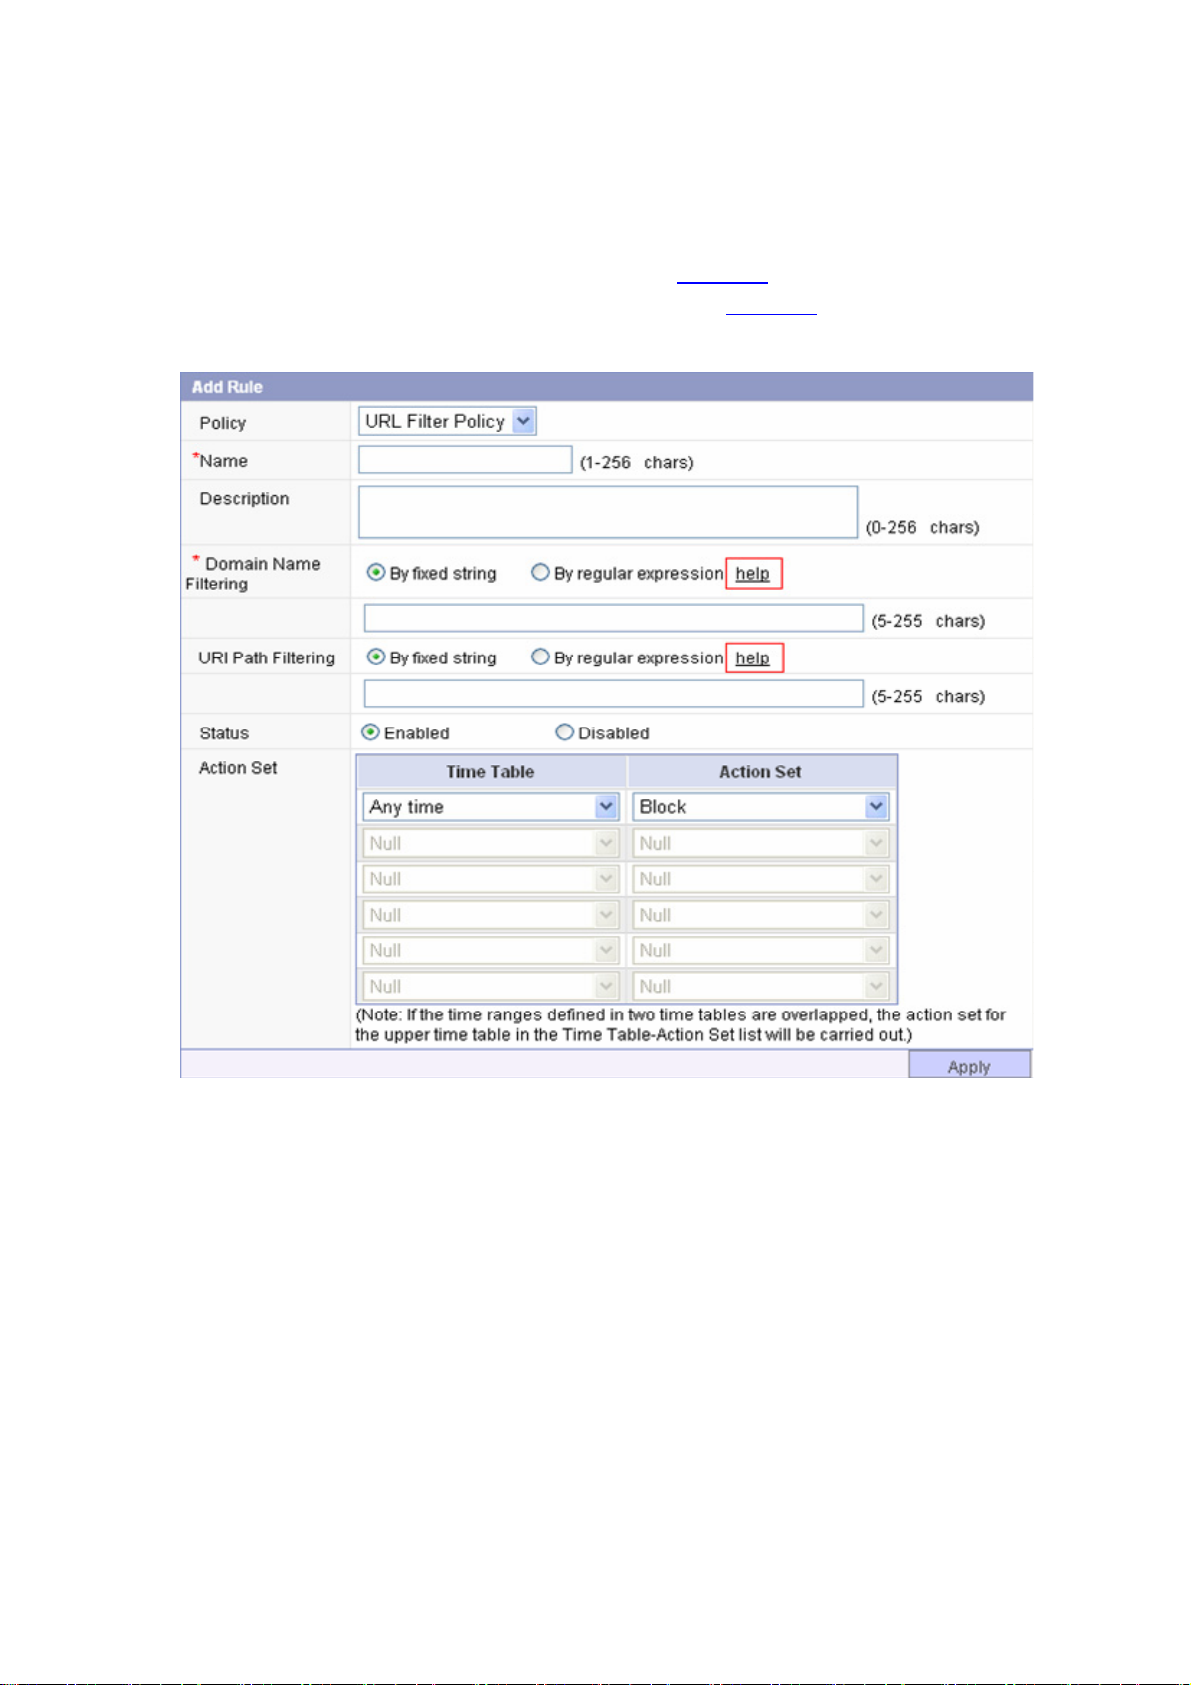
Regular expression help information
To facilitate configuring regular expressions, the Web interface provides help links on the page where
you need to configure a regular expression, as shown in
the help link to display the help information page, as shown in
Figure 1-6. To view the help information, click
Figure 1-7.
Figure 1-6 Regular expression help link
1-12
Page 26
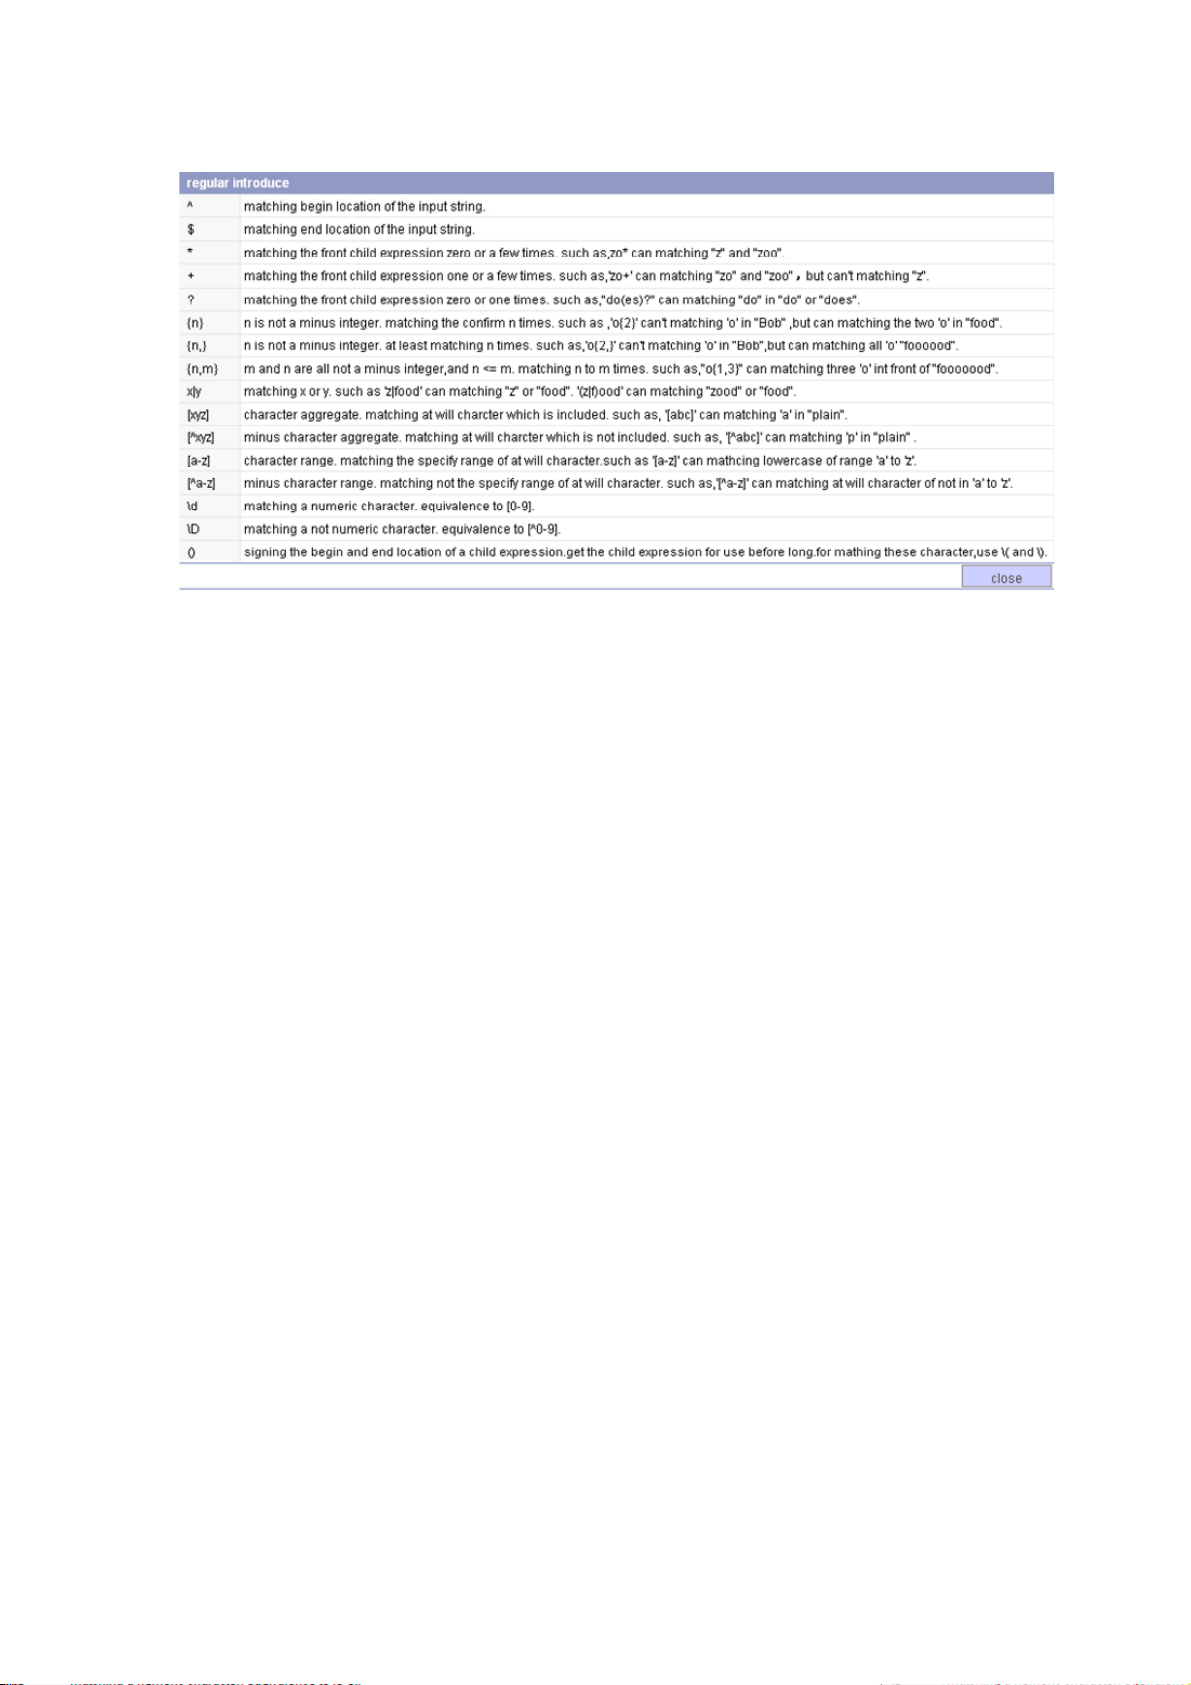
Figure 1-7 Regular expression help information
Configuration Guidelines
z The web console supports Windows XP, Windows 2000, Windows Server 2003 Enterp rise Edition,
Windows Server 2003 Standard Edition, Windows Vista, Linux and MAC OS operating systems.
z The web console supports Microsoft Internet Explorer 6.0 SP2 and higher, and Mozilla Firefox
3.0.10 and higher. To ensure that the web console can operate normally, it is recommended to
enable Script ActiveX controls marked safe for scripting, Run ActiveX controls and plug-ins, and
Active scripting when using Microsoft Internet Explorer, and enable JavaScript when using Mozill a
Firefox.
z Some Web pages do not support the Back, Next, Refresh buttons provided by the browser. Using
these buttons may result in abnormal display of these Web pages.
z Because the Windows firewall limits the number of TCP connections, when you use IE to log in to
the Web interface, sometimes you may be unable to open the Web interface. To a void this problem,
it is recommended to turn off the Windows firewall before login.
z If the software version of the device changes, when you log in to the device through the Web
interface, you are recommended to delete the temporary Internet files on IE; otherwise, the Web
page content may not be displayed correctly.
1-13
Page 27
2 Device Registration
You can log in to the H3C website for registering a license for your device. The website will generate a
license file based on the serial number of the device and the serial number on the software license
certificate shipped with the device. Only after you import the license file can you update the signature
database and virus definition file to enable the IPS device to defend against new attacks in rea l time.
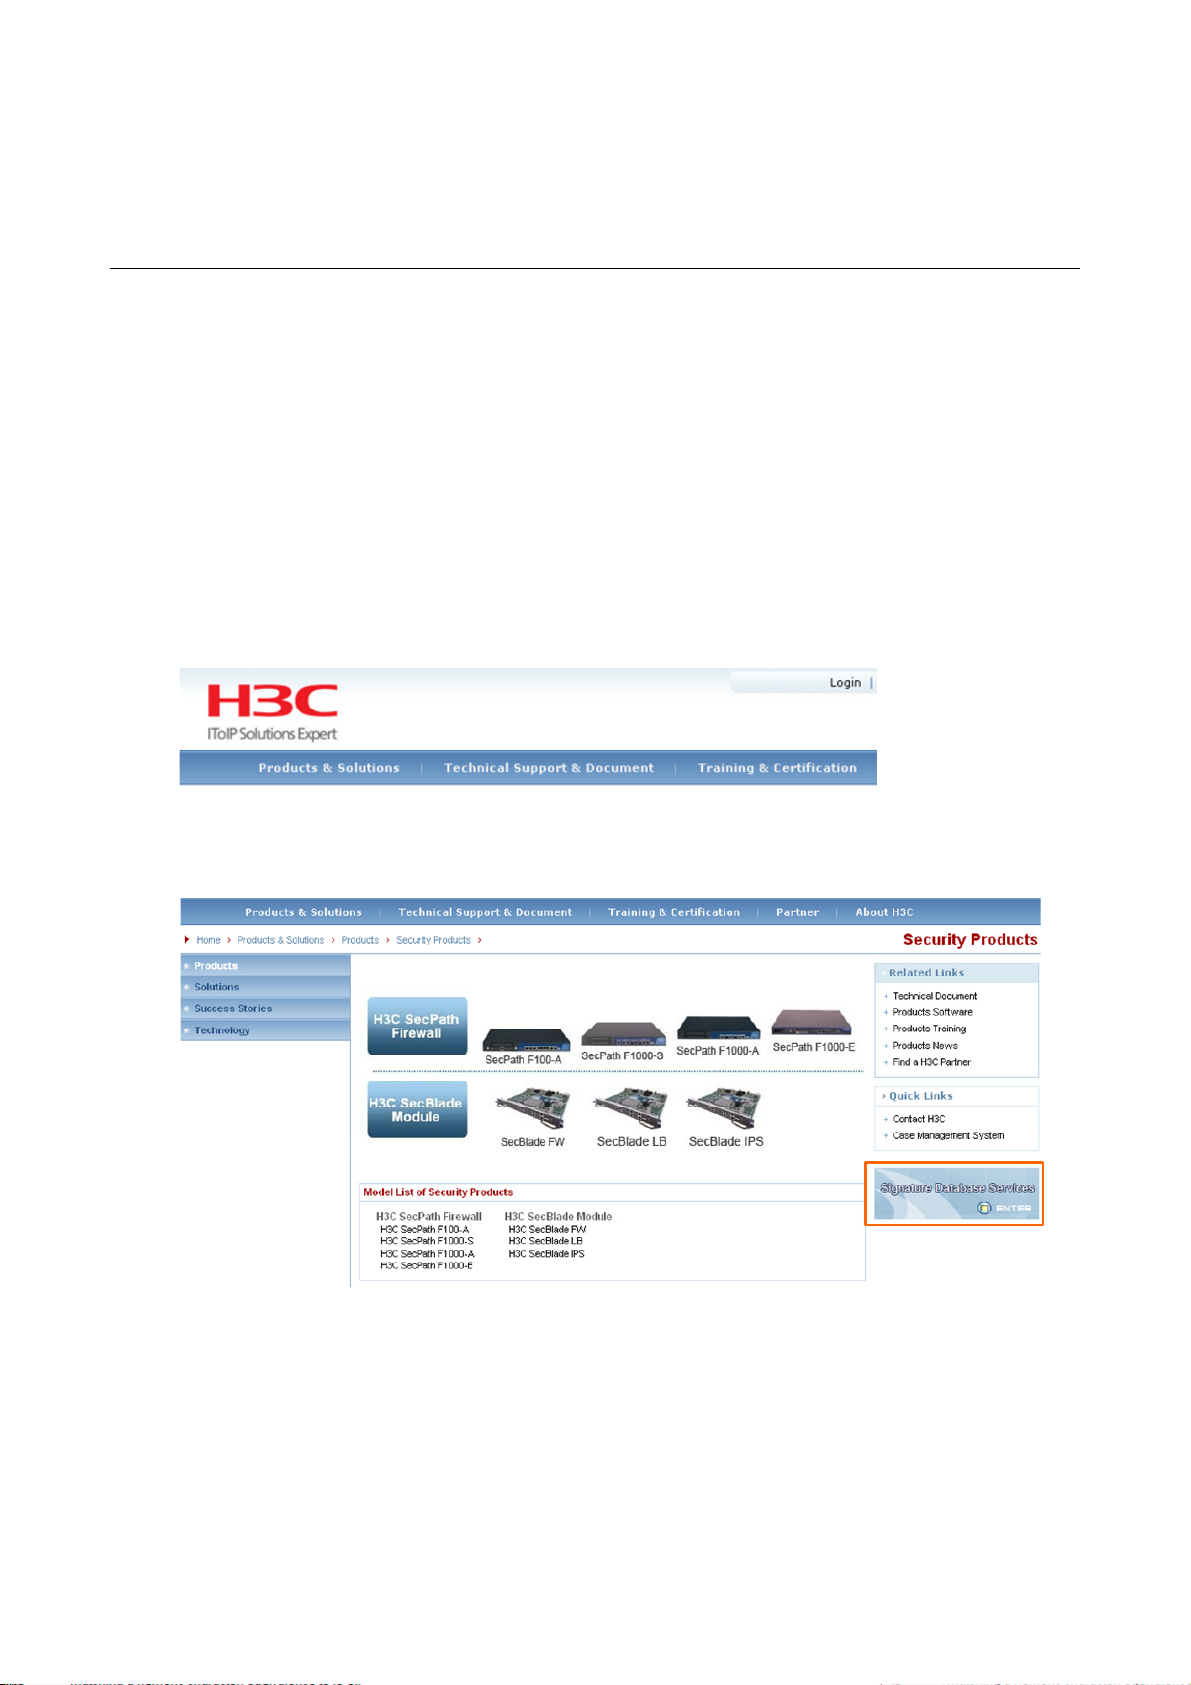
Device Registration
After logging in to the H3C website at www.h3c.com, select Product & Solutions > Products >
Security Products, and then click Signature Database Services at the lower right part of the page to
enter the registration page.
Figure 2-1 Home page of the H3C website
Figure 2-2 Signature database services
2-1
Page 28
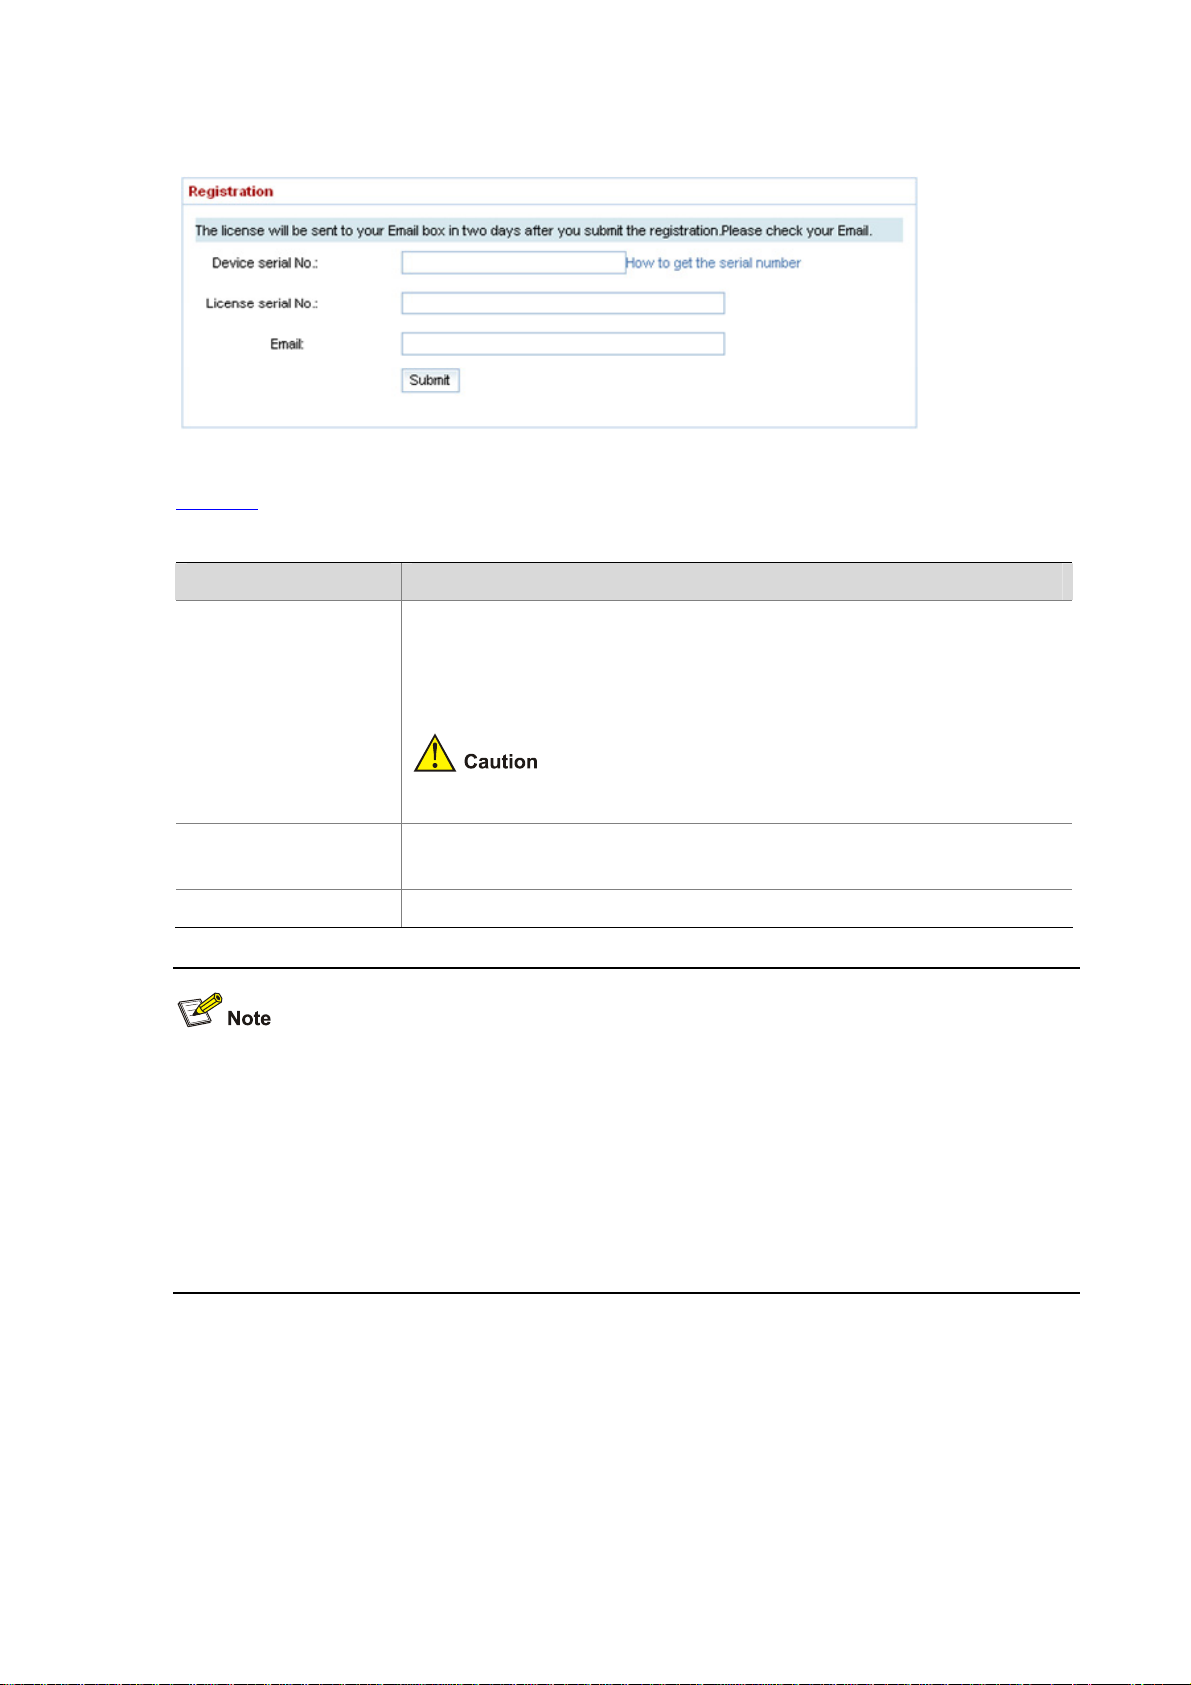
Figure 2-3 Registration page
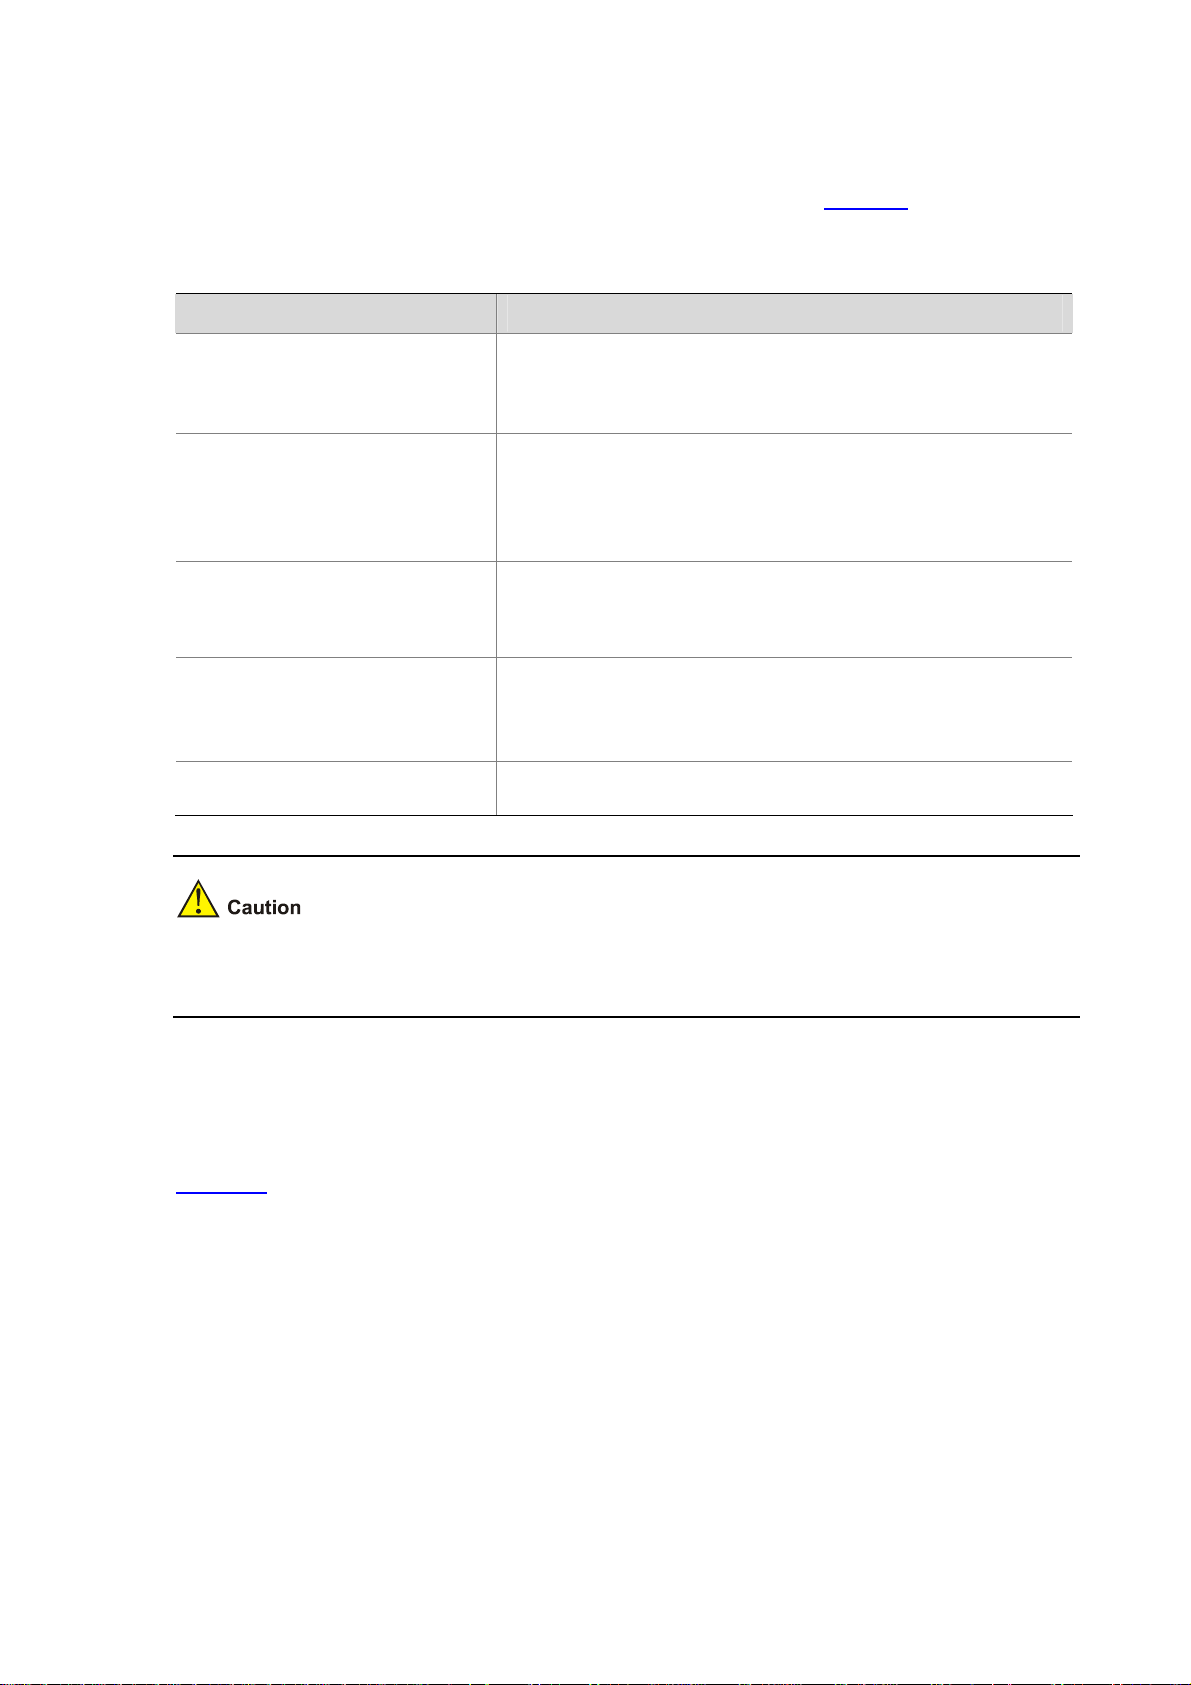
Table 2-1 shows the detailed device registration configuration items.
Table 2-1 Device registration configuration items
Item Description
Device serial number, which can be obtained from:
z Device chassis
z Bar code on the warranty card shipped with the device
Device serial No.
(20 digits or letters)
z Web interface: Select System Management > Device Management >
System Info from the navigation tree to display the device serial number.
The device serial number is not the serial number on the software license
certificate shipped with the device.
License serial No.
(26 digits or letters)
Email Enter your Email address to receive the license file
Obtained from the software license certificate shipped with the device
z A software license certificate can be used by only one device.
z The license file generated based on the registration information will be sent to your Email address
within two working days.
z After you received the license file, log in to the web page and select System Management >
Device Management > License from the navigation tree. Then specify the path and file name on
the License Import tab and click Import to import the license. For other information, refer to
Device Management.
License File Update
With the initial license file, you can update the signature database and virus definition file for free within
one year. After that, you need to purchase a new software licen se certificate and follow the steps above
to generate another license file to update the signature database and virus definition file.
2-2
Page 29

3 Device Management
System Status
System Status Overview
The system status module helps you understand the current status of the system, including the
following information:
z Health status: Displays the current health status of the system. It helps you understand the usages
of CPU, memory, hardware image area, and hardware log area; the status of fan and power; the
temperatures of CPU and the main board.
z IPS: Displays the statistics of IPS detection. It helps you understand the statistics of IPS attack
logs.
z URL filtering: Displays the statistics of URL filtering. It helps you understand the statistics of URL
logs.
z Anti-Virus: Displays the statistics of anti-virus management. It helps you understand the statistics
of virus logs.
z Logs: It links you to various log pages conveniently.
Viewing System Status
After logging into the Web interface, you can directly enter the page which can also enter by selecting
System Management > Device Management > System Status, as shown in
Figure 3-1.
3-1
Page 30
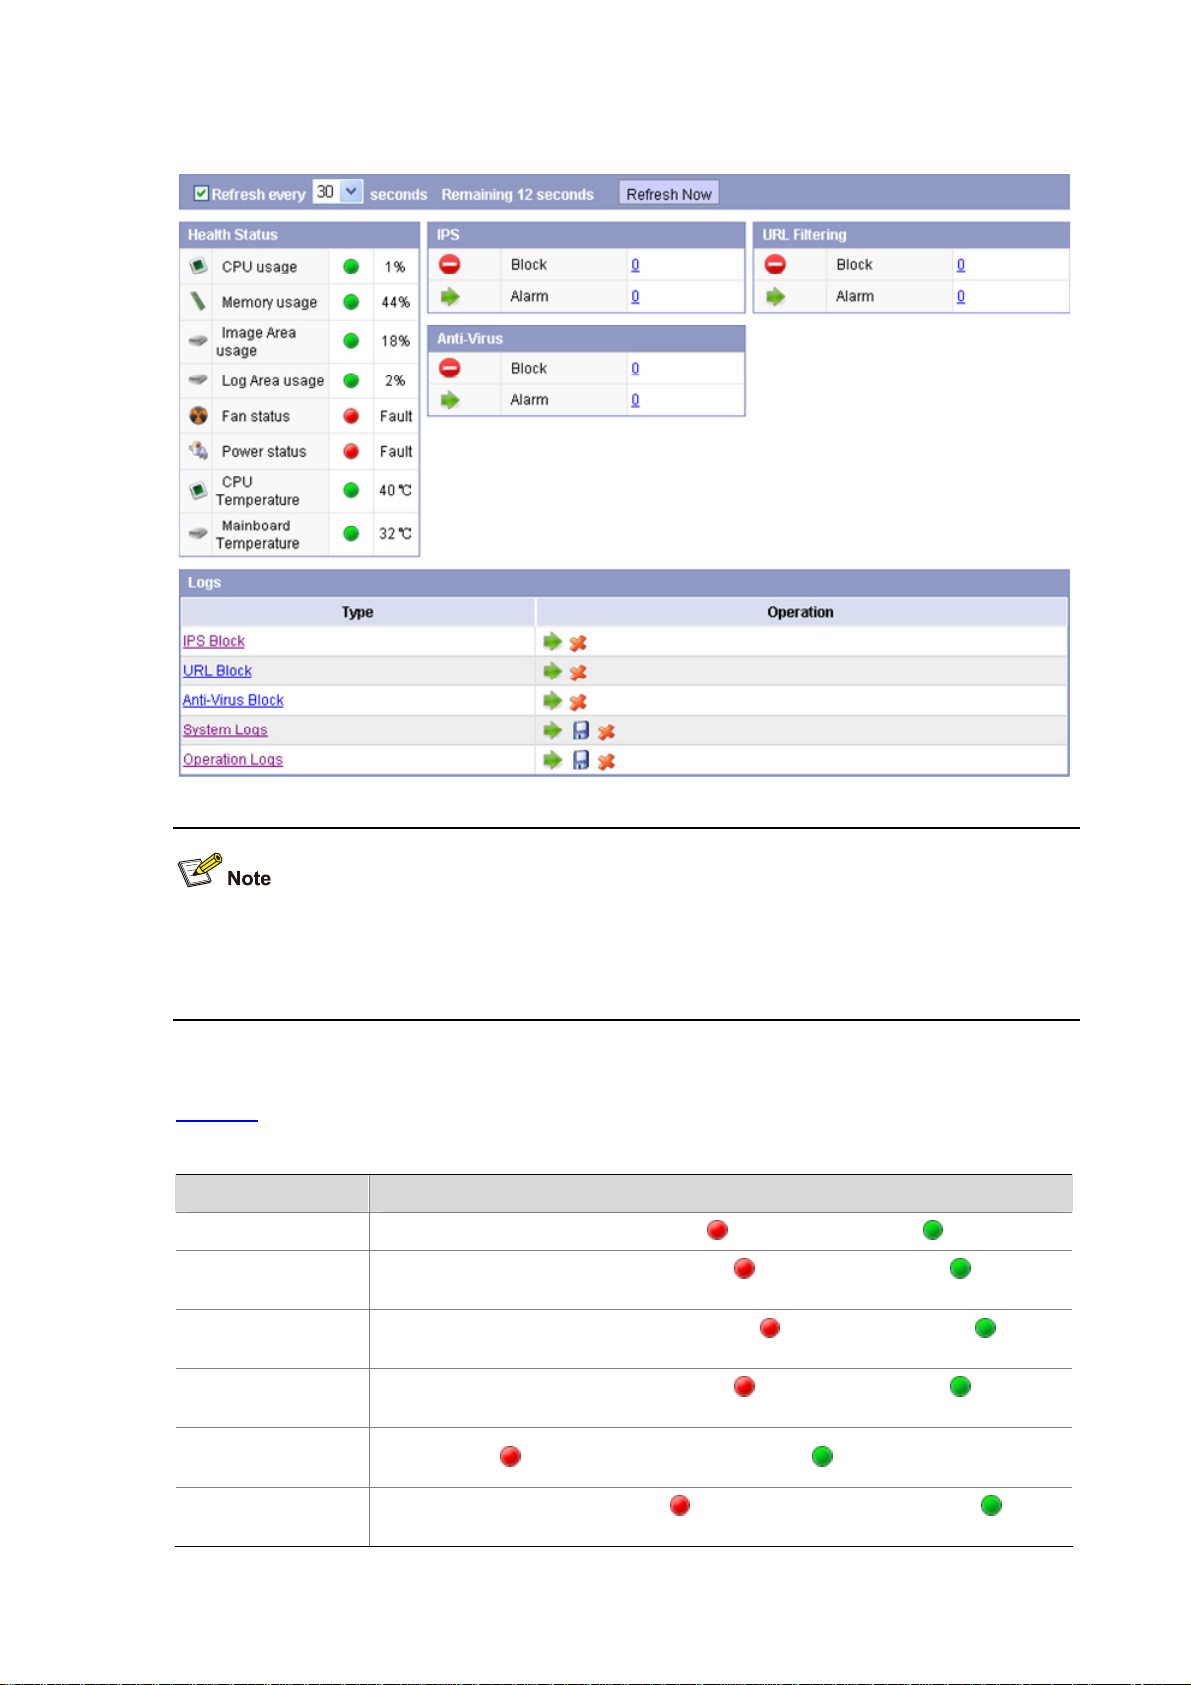
Figure 3-1 System status page
Select the check box on the top of the above figure, and then the system will automatically refresh the
system status page at the specified interval; or you can click Refresh Now to manually refresh the
page.
Health status
Table 3-1 describes the fields of health status.
Table 3-1 Health status fields
Field Description
CPU usage
Memory usage
Image Area usage
If the CPU usage exceeds the threshold, is displayed; otherwise, is displayed.
If the memory usage exceeds the threshold,
displayed.
If the image area usage exceeds the threshold,
displayed.
is displayed; otherwise, is
is displayed; otherwise, is
Log Area usage
Fan status
Power status
If the log area usage exceeds the threshold,
displayed.
If any fan fails, and
If any power supply unit (PSU) fails,
Normal
are displayed.
Fault
are displayed; otherwise, and
and
3-2
is displayed; otherwise, is
Normal
Fault
are displayed; otherwise, and
are displayed.
Page 31

Field Description
CPU Temperature
Mainboard
Temperature
If the temperature exceeds the threshold,
If the temperature exceeds the threshold,
is displayed; otherwise, is displayed.
is displayed; otherwise, is displayed.
Put your cursor on or of a field, and you can view the corresponding data of the item. For example,
if you put cursor on
or of the fan status field, the current status of each fan is displayed.
IPS
Table 3-2 describes the fields of IPS detection
Table 3-2 IPS detection fields
Item Description
Block Displ ays the total number of the block logs in IPS attack logs.
Alarm Displays the total number of the alert logs in IPS attack logs.
By clicking the corresponding number, you can jump to the page which yo u can also enter by selecting
Log Management > Attack Logs > Query Logs.
URL filtering
Table 3-3 describes the fields of URL filtering detection.
Table 3-3 URL filtering detection fields
Item Description
Block Displ ays the total number of the block logs in URL logs.
Alarm Displays the total number of the alert logs in URL logs.
By clicking the corresponding number, you can jump to the page which yo u can also enter by selecting
Log Management > URL Logs.
Anti-Virus
Table 3-4 describes the fields of anti-virus management.
3-3
Page 32

Table 3-4 Anti-virus management fields
Item Description
Block Displ ays the total number of the block logs in virus logs.
Alarm Displays the total number of the alert logs in virus logs.
By clicking the corresponding number, you can jump to the page which yo u can also enter by selecting
Log Management > Virus Logs > Query Logs.
Logs
Table 3-5 describes the fields of logs.
Table 3-5 Log fields
Item Description
IPS Block
URL Block
Anti-Virus Block
System Logs
Query the latest IPS attack logs.
z If you click IPS Block or its corresponding icon , you can enter the page that can
also be accessed by selecting Log Management > Attack Logs > Query Logs.
z If you click the icon , you can enter the page that can also be accessed by selecting
Log Management > Attack Logs > Delete Logs.
Query the latest URL logs.
If you click
can also be accessed by selecting
URL Block
or its corresponding icon or , you can enter the page that
Log Management > URL Logs
.
Query the latest virus logs.
z If you click Anti-Virus Block or its corresponding icon , you can enter the page
that can also be access by selecting Log Management > Virus Logs > Query Logs.
z If you click the icon , you can enter the page that can also be accessed by selecting
Log Management > Virus Logs > Delete Logs.
Query the latest system logs.
z If you click System Logs or its corresponding icon , you can enter the page that
can also be accessed by selecting Log Management > System Logs > Recent
Logs.
z If you click the icon , you can save the latest system logs to the CSV file.
z If you click the icon , you can enter the page that can also be accessed by selecting
Log Management > System Logs > Delete Logs.
Query the latest operation logs.
Operation Logs
z If you click Operation Logs or its corresponding icon , you can enter the page
that can also be accessed by selecting Log Management > Operation Logs >
Recent Logs.
z If you click the icon , you can save the latest operation logs to the CSV file.
z If you click the icon , you can enter the page that can also be accessed by selecting
Log Management > Operation Logs > Delete Logs.
3-4
Page 33

System Information
System Information Overview
The system information module helps you underst and the current sof tware versions, hardware versi ons,
versions of signature databases, device serial number, MAC address of network management interface,
and system time information.
Viewing System Information
Select System Management > Device Management > System Info from the navigation tree, and
enter the page as shown in
Figure 3-2 System information page
Figure 3-2.
Table 3-6 describes the fields of system information.
Table 3-6 System information fields
Item Description
Software Version Displays the version of the system software.
PCB Hardware Version Displays the version of PCB.
CPLD Hardware Version Displays the version of CPLD logic.
BootROM Base Section Version Displays the version of the base section of the BootROM.
BootROM Extended Section Version Displays the version of the extended section of the BootROM.
Displays the version of IPS signature database.
IPS Signature Database Version
Support for this field depends on the device model.
AV_SS Signature Database Version Displays the version of anti-virus signature database.
3-5
Page 34

Item Description
Device Serial Number Displays the serial number of the device.
System Name Displays the system name.
MAC of Network Management Interface Displays the MAC address of the network management interface.
System Time Displays the current system time.
System Time Zone Displays the current system time zone.
System Time
System Time Overview
You need to configure a correct system time so that the device can work with other devices properly.
The system time module helps you set the system date, time, and time zone. The device supports
setting system time through manual configuration and automatic synchronization of Simple Network
Time Protocol (SNTP) server time.
An administrator can by no means keep time synchronized among all the devices within a network by
changing the system clock on each device, because this is a huge amount of workload and cannot
guarantee the clock precision. SNTP, however, allows quick clock synchronization within the entire
network and ensures a high clock precision so that the devices can provide diverse applications based
on the consistent time.
Configuring System Time
Select System Management > Device Management > System Time from the navigation tree, and
enter the page as shown in
Figure 3-3 System time page
Figure 3-3.
Table 3-7 describes system time configuration items.
3-6
Page 35

Table 3-7 System time configuration items
Item Description
Local Date and Time
Local Date
Time
Source
Time Zone
Local Time
SNTP Server
Primary SNTP Server
Secondary SNTP Server
Synchronization Interval
System Monitoring
Set the system date and time manually.
If you do not select the Time Source check box, the Local Date
and Local Time fields display the current system time, which
changes in real time; if you configure the SNTP server as the time
source, and the time synchronization is successful, these fields
display the synchronized time.
Enable clock automatic synchronization with an SNTP server,
and specify the IP address of the SNTP server and the
synchronization interval.
Set the time zone to which the system belongs.
The local time zone is based on Greenwich Mean Time (GMT).
After your configuration takes effect, the system time, log and
debugging information use the local time adjusted according to
the time zone.
System Monitoring Overview
The system monitoring module helps you view and set system thresholds, including CPU usage
threshold, memory usage threshold, hardware usage threshold, CPU temperature upper and lower
limits, and main board temperature upper and lower limit s.
Configuring System Monitoring
Select System Management > Device Management > System Monitoring from the navigat ion tree,
and enter the page as shown in
Figure 3-4 System monitoring
Figure 3-4.
Table 3-8 describes system monitoring configuration items.
3-7
Page 36

Table 3-8 System monitoring configuration items
Item Description
Set the upper limit of CPU usage.
CPU usage threshold
Memory usage threshold
When the CPU usage exceeds the configured threshold, the system triggers an
alarm.
Set the upper limit of memory usage.
When the memory usage exceeds the configured threshold, the system triggers an
alarm.
Image area usage
threshold
Log area usage threshold
CPU temperature
threshold
Mainboard temperature
threshold
Set the upper limit of image area usage.
When the image area usage exceeds the configured threshold, the system triggers
an alarm.
Set the upper limit of log area usage.
When the log area usage exceeds the configured threshold, the system triggers an
alarm.
Set the upper and lower limits of CPU temperature.
When the CPU temperature exceeds the configured temperature range, the
system triggers an alarm.
Set the upper and lower limits of main board temperature.
When the main board temperature exceeds the configured temperature range, the
system triggers an alarm.
Configuration Maintenance
Configuration Maintenance Overview
The configuration maintenance module provides the following functions:
z Saving the current configuration
z Configuration file management
z Restoring the factory defaults
Saving the current configuration
This module helps you save the current configuration to the disk.
To increase the access rate of the device and to prolong the service life of the disk by reducing the
reading and writing operations to the disk, some configurations are not directly saved to the disk when
they are submitted, but saved to the memory database firstly. Therefore, you need to save the current
configuration to the disk manually; otherwise, after the device reboot, the configurations that are not
saved to the disk will probably be lost.
Configuration file management
This module provides the following functions:
z Import configuration file: Import the compressed package of the specified configuration file saved
on the local host or device to the disk, and then reboot the device to validate the configuration.
z Upload configuration file: Upload the compressed package of the configuration file saved on the
local host to the device.
z Export configuration file: Back up the current configuration of the device as an encrypted and
compressed package, and download this package to the local host .
3-8
Page 37

z Add configuration file: Back up the current configuration of the device as an encrypted and
compressed package.
z Download configuration file: Download the compressed package of the device configuration file to
the local host.
z Delete configuration file.
With these functions, when multiple devices of the same type and with similar configurations are
present on the network, you can configure one of the devices, export the configuration to the local
device, and then export the configuration from the local device to other devices, thus avoiding repeated
work.
z When you use a compressed package of the specified configuration file, make sure that the current
device and the device imported from the compressed package have the same software version
and the same license file configuration; otherwise, the compressed package cannot be used.
z When you are importing or exporting the compressed package of the configuration file, you cannot
activate the configuration.
z Configuration information of high availability, security policy, management interface configuration,
interface configuration, and system monitoring does not support configuration file management.
Restoring the factory defaults
This operation will remove all configurations of the current users and restore the system to factory
defaults.
Saving the Current Configuration
Select System Management > Device Management > Configuration Maintenance from the
navigation tree to enter the configuration maintenance page. Click the Save Curre nt Configuration tab
to save the current configuration to the device, as shown in
Figure 3-5 Save current configuration page
Figure 3-5.
Click Save and confirm your action.
Configuration File Management
Select System Management > Device Management > Configuration Maintenance from the
navigation tree to enter the configuration maintenance page. Click the Configuration File Information,
Import Configuration File, Upload Configuration File, Export Configuration File, or Add Current
Configuration tab to manage the configuration file, as shown in
Figure 3-6.
3-9
Page 38

Figure 3-6 Configuration file management page
z In the Configuration File Information tab, you can view the related information of configuration
Table 3-9 describes the fields of configuration file information.
files.
z In the Configuration File Information tab, click the icon and set the directory on the local host
to save the configuration file in the pop-up dialog box. You can download the encrypted and
compressed package of the specified configuration file to the local host and save it.
z In the Configuration File Information tab, click the icon , and you can import the encrypted and
compressed package of the specified configuration file to the disk of the device and then reboot the
device to validate the configuration.
z In the Import Configuration File tab, you can set the directory on the local host to save the
encrypted and compressed package of the specified configuration file. Click Import to import the
compressed package of the configuration file that is saved on the local host to the disk of the de vice,
and then reboot the device to validate the configuration.
z In the Upload Configuration File tab, you can set the directory on the local host to save the
encrypted and compressed package of the specified configuration file. Click Upload to upload the
compressed package of the configuration file that is saved on the local host to the device.
3-10
Page 39

z In the Export Configuration File tab, you can set the configuration ID. Click Export, set the
directory on the local host to save the configuration file in the pop-up dialog, and then you can back
up the current configuration of the device as an encrypted and compressed package with the
specified configuration ID, and download this package to the local host.
z In the Add Configuration File tab, input the configuration ID and click Add to back up the current
configuration of the device as an encrypted and compressed package with the specified
configuration ID.
Table 3-9 Fields of configuration file information
Item Description
Configuration ID ID of the encrypted and compressed package of the configuration file
Date Date to create the encrypted and compressed package of the configuration file
Software Version
Product Model
Software version of the device when the encrypted and compressed package of
the configuration file is created
Product model of the device on which the encrypted and compressed package of
the configuration file is created
Restoring the Factory Defaults
Select System Management > Device Management > Configuration Maintenance from the
navigation tree to enter the configuration maintenance page. Click the Restore Defaults tab to restore
all the configurations on the device to the factory defaults, as shown in
Figure 3-7 Restore the factory defaults
Before restoring the factory defaults, determine whether to keep the license file (if you do not select the
Keep license file check box, when the factory defaults are restored, the current license file is d eleted).
Then click Reset and confirm your action.
Figure 3-7.
Signature Upgrade
Signature Upgrade Overview
Signature databases record the attack signature and virus signatures that can be recognized by the
device; therefore, for IPS devices, their signature databases must be upgra ded in real time and must be
of the latest version.
Signature databases can be upgraded either automatically or manually:
z Manual upgrade: Manual upgrade allows you to download the signature databases file saved on
the local host of the user to the device by using the HTTP or TFTP protocol. Manual upgrade is
generally performed within the LAN of the user. In addition, manual upgrade allows you to
download any version of the signature database that is compatible with the device.
3-11
Page 40

z Auto upgrade: Auto upgrade helps you download the signature database file of the latest version
from a certain signature database version server directly to the device by using specific protocol at
a specified interval or immediately if necessary.
z Version of the signature database is related to the version of device software. You must make sure
that the version of the new signature database is compatible with the current version of the device
software before you upgrade the signature database; otherwise, signature database upg rade fails.
z You must make sure that the current License file is valid and is not expire d before you upgrade the
signature database. If the License file has been expired, contact H3C technical support staff.
z If the software of the new version contains new features that have to be used with the signature
database together, to use these new features, you need to upgrade the signature database to the
version that matches the new software version after the software upgrade.
Signature Database Version Management
Select System Management > Device Management > Signature Upgrade from the navigation tree
to enter the signature database upgrade p age.
z In the Current Version tab and History Version tab, you can view the current versions of various
types of signature database and their history version (the previous one), as shown in
z In the History Version tab, click the icon , and you can roll back a certain type of signature
database to a specified history version (that is, the previous one).
Figure 3-8 Current version and history version
Figure 3-8.
Manual Upgrade
Select System Management > Device Management > Signature Upgrade from the navigation tree
to enter the signature database upgrade page. You can upgrade signature database manually in the
Manual Upgrade tab, as shown in
Figure 3-9.
3-12
Page 41

Figure 3-9 Manual upgrade
Table 3-10 describes configuration items of manual upgrade.
Table 3-10 Configuration items of manual upgrade
Item Description
Signature Type Set the type of the signature database to be upgraded.
Protocol Specify the protocol (HTTP or TFTP) to be used to download the upgrade database.
Set the directory on the local host to save the upgrade package and its file name, for
example, 192.168.1.16/abc.
Upgrade Package
Location
The directory of the file can include letters, digits, and underline (_), and cannot include
any Chinese character.
After configuring the parameters, click OK to upgrade the signature database. The Manual Upgrade
tab page displays the upgrade progre ss, as shown in
Figure 3-10 Upgrade progress
Auto Upgrade
To realize the auto grade of the signature database, you must select Sy stem Management > Network
Management > Management Interface from the navigation tree and then configure DNS serv ers. For
detailed configuration, refer to Network Management Configuration of this manual.
Figure 3-10.
Select System Management > Device Management > Signature Upgrade from the navigation tree
to enter the signature database upgrade page. You can set related parameters for the auto upgrade in
the Auto Upgrade tab, as shown in
Figure 3-11.
3-13
Page 42

Figure 3-11 Auto upgrade
z On the Auto Upgrade page, you can view the types of signature databases from the leftmost list,
and set whether to enable the auto upgrade function and the time of auto upgrade on the right side
of the page. For example, as shown in
Figure 3-11, the auto upgrade function of the IPS signature
database is enabled, the first upgrade time is at 11:00 2010-9-8, and after that, the signature
database is upgraded at 11:00 every 7 days; the auto upgrade function of the anti-virus signature
database is not enabled. After configuring the parameters, click Apply to complete the
configuration.
Figure 3-12 Upgrade process
z You can click Upgrade Now to download the signature database file of the latest version from a
certain signature database version server to the device and then upgrade the signature database
immediately..
Software Upgrade
If the software of the new version contains new features that have to be used with the signature
database together, to use these new features, you need to upgrade the signature database to the
version that matches the new software version after the software upgrade.
Software Upgrade Overview
The software upgrade module helps you manage and upgrade the versions of IPS device software.
Through the web interface, you can conveniently perform operations like sof tware upgrading, specifying
main/backup version, and deleting the version file.
3-14
Page 43

Upgrading Software
Select System Management > Device Management > Software Upgrade from the navigation tree to
enter the software upgrade configuration page, as shown in
Figure 3-13 Software upgrade page
Figure 3-13.
The upper part of the page allows you to view an d manage the current sof t ware versi ons of the device.
The list shows the name of the software versions, upload date, size of the version file, and version
status. You can specify a non-main software version as the main software version by clicking the icon
, specify a non-backup software version as a backup version by clicking the icon ; and delete a
software version by clicking the icon
.
The lower part of the page allows you to upgrade software version of the device.
Table 3-11 describes software upgrade configuration items.
Table 3-11 Software upgrade configuration items
Item Description
Set the IP address of the TFTP server and file name, such as 192.168.1.6/abc.bin.
z You can store up to three software version files on the device. If you download a
software version file that has the same name as a current version file through the
web interface, no matter how many version files are stored on the device, the
following prompt appears “Version file with the same name already exists in the
Software Version
Version Status
device. Do you wish to replace it?”. If the device stores three version files and th e
file to be downloaded has a different name with the existing files, the download
operation fails, and the following prompt appears “Up to thr ee version files can be
supported”.
z You should make sure that the disk has enough space; otherwise, the downloading
of the software version fails when the size of the software version to be downloaded
exceeds the available space of the disk partition no matter whether a software
version with the same name exists in the disk partition.
z The file name is a string of 1 to 64 characters, which can include letters, digits, dots
(.), hyphens (-), and underlines (_).
Specify the status of the downloaded software version:
z Main: The software version is the main version, which is used to boot and start up
the device.
z Backup: The software version is the backup version, which is used to boot and start
up the device when the main version is unavailable.
z Other: The software version is neither the main version nor the backup version.
3-15
Page 44

Item Description
Reboot after upload
to apply the new
version
License
License Overview
A license can control the statuses of signature databases and time sensitive features:
z The license controls whether to upgrade the signature databases. A signature database records
the attack signature and virus signatures that can be recognized by the device; therefore, for the
security device, its signature database must be upgraded in real time. When the license of the
signature database is expired, you cannot simply upgrade the signature database and need to
recharge to obtain a new license, and then upgrade the signature databa se.
z The license controls the lifetime of time-sensitive features. When the license of a feature is expired,
you cannot use the feature and need to recharge to obtain a new license. Meanwhile, the device
periodically accesses the website http://www.h3c.com.cn to check the expiration times of features.
If the device cannot access this website, all time-sensitive features are not available.
Specify whether to reboot the device to make the upgraded software take effect after
the software is uploaded.
This item can be selected only when the version status is selected as main.
The license module allows you to view the license information, import license and export license.
To apply for a new License, contact H3C technical support staff.
Managing a License
Select System Management > Device Management > License from the navigation tree to enter the
license page, as shown in
Figure 3-14.
3-16
Page 45

Figure 3-14 License
z In the License tab, you can view the following information:
1) Signature database type contained in the license, and their expiration times.
2) Time-sensitive features contained in the license, their expiration times, and their statuses. If a
feature is available, a green indicator is displayed in the Status column; if a feature is expired, a red
indicator is displayed in the Status column.
z In the License Import tab, you can set the file name and the directory on the local host to save t he
license, and click Import to import the license to the device.
z In the License Export tab, click Export, and set the directory on the local host to save the license
in the pop-up dialog.
Operating Mode
Operating Mode Overview
IPS devices can take security actions to attacks and services. The way to take security actions of the
IPS devices depends on the connecting mode, which can be either direct connection or bypass
connection.
z Direct connection means that the device is on the link where data is forwarded, therefore, the
device can directly capture data packets and take various security actions, as shown in
3-15.
Figure
Figure 3-15 Network diagram for direct connection
3-17
Page 46

z Bypass connection means that the device is not on the link where data is forwarded. Therefore, the
device captures data packets by receiving traffic mirroring and detecting duplicate packets, and it
cannot take security actions directly and can only take security actions through response packets,
as shown in
Figure 3-16.
Figure 3-16 Network diagram for bypass connection
General device
Mirroring port
General portMonitor port
Response port
IPS
Configuring Operating Mode
Select System Management > Device Management > Operating Mode from the navigation tree to
enter the operating mode page, as shown in
Figure 3-17 Operating mode page
Table 3-12 describes operating mode configuration items.
Figure 3-17.
Table 3-12 Operating mode configuration items
Item Description
Select the connecting mode: directly connected or bypassed.
Connecting Mode
Application Mode
For network diagram for direct connection, see
bypass connection, see
Set the application mode: report logs only or integrated function set.
z Report logs only: Only sends log packets to the specified device or host, and no
blocking or interfering actions are taken.
z Integrated function set: Sends log packets to the specified device or host, and
blocking or interfering actions are taken.
Figure 3-16.
3-18
Figure 3-15; for network diagram for
Page 47

Item Description
In the bypassed connecting mode, the source MAC address of
the responded interfering packets:
Source MAC for
Interfering
z Management interface: Take the MAC address of the
management interface as the source MAC address
z Packets: Take the source MAC address of the captured
packets as the source MAC address
z Customize: Manually configured source MAC address
In the bypassed connecting mode, the next hop MAC address
Next Hop MAC
of the responded interfering packets.
It is usually the MAC address of the
General port
in
Figure
3-15.
Select the interface to send the responded interfering packets; you can select to return
by original path or select a certain interface.
Return by original
path/A certain
interface (the
drop-down list at the
bottom right corner)
z Return by original path: Sends the responded interfering packets from the interface
through which the device captured data packets.
z A certain interface: Sends the responded interfering packets from the selected
interface. The drop-down list only displays interfaces that are not in the security
zone.
This drop-down list is available only after you select both the
check box and the
Integrated function set
check box.
Table 3-13 Configuration limitation if the Bypassed check box is selected
In the bypassed
connecting mode,
when the IPS
device is
connected to a
switch, there are
some configuration
limitations for the
Source MAC for
Interfering
and
Next Hop MAC
Table 3-13 for
see
details.
Directly connected
,
Devices in the bypassed connecting
mode
When the
General device
3-16 is a Layer 2 switch
General port
The
Mirroring port
When the
General
device
in
Monitor port
same VLAN.
Figure 3-16
is a Layer 3
switch
General port
The
Mirroring port
Monitor port
different VLANs.
Configuration Guidelines
in Figure
,
, and the
are in the
,
, and the
are in
Source MAC for Interfering Next Hop MAC
Management interface
Select
Customize
Packets
, and cannot select
.
When you select
Customize
or
, the
Null
MAC address cannot be conflicted
with another MAC address in the
Layer 2 domain.
Management interface
Select
Customize
Packets
, and cannot select
.
When you select
Customize
or
, the
Null
MAC address cannot be conflicted
with another MAC address in the
Layer 2 domain.
z Null
No limitation
z Virtual interface MAC
address of the VLAN to
which the General port
belongs
When configuring operating mode, note that:
1) When the device is in bypassed connecting mode and connected to a switch, avoid the following
configurations; otherwise, the switch may not learn MAC address successfully.
z Configure the source MAC address of the captured packets as the source MAC address on the
device.
3-19
Page 48

z Apply the policy using blocking or interfering actions on the device.
z The interfaces connected with the management interface and service interface (A management
interface is the interface through which the device sends out packets and manages bypass traffics;
a service interface is the interface through which the device receives bypass traffics and performs
detections. The two interfaces can actually be the same one) are configured in the same VLAN.
OAA Configuration
The OAA client and the OAA server mentioned in the following configuration procedure and
configuration examples indicate the ACFP client and the ACFP server in the OAA architecture.
OAA Configuration Overview
Basic data communication networks co mpri se of routers and switches, which forward data packets. As
data networks develop, more and more services run on them. It has become inappropriate to use
legacy devices for handling some new services. Therefore, some security products such as firewalls,
Intrusion Detection System (IDS), and Intrusion Prevention System (IPS), and voice and wireless
products are designed to handle specific services.
For better support of new services, manufacturers of legacy networking devices (routers and switches
in this document) have developed various dedicated service boards (cards) to specifically handle these
services. Some manufacturers of legacy networking devices provide a set of software/hardware
interfaces to allow the boards (cards) or devices of other manufacturers to be plugged into or conne cted
to these legacy networking devices to handle these services. This gives full play to the advantages of
respective manufacturers for better support of new services while reducing user investments.
The open application architecture (OAA) is an open service architecture developed with this concept.
The Application Control Forwarding Protocol (ACFP) is developed based on the OAA architecture. For
example, collaborating IPS/IDS cards or IPS/IDS devices acting as ACFP clients run software
packages developed by other manufacturers to support the IPS/IDS services. A router or switch mirrors
or redirects the received packets to an ACFP client after matching the ACFP collaboration rules. The
software running on the ACFP client monitors and detects the packets. Based on the monitoring and
detection results, the ACFP client sends back responses to the router or switch through collaboration
Management Information Bases (MIBs) to instruct the router or switch to process the results, such as
filtering out the specified packets.
3-20
Page 49

ACFP architecture
Figure 3-18 Diagram for ACFP architecture
As shown in
z Routing/switching component: As the main part of a router and a switch, it performs complete
Figure 3-18, the ACFP architecture consists of:
router/switch functions and is also the core of user management control.
z Independent service component: It is also known as the Open Application Platform (OAP), the
main part open for development by a third party and is mainly used to provide various unique
service functions.
z Interface-connecting component: It connects the interface of the routing/switching component to
that of the independent service component, allowing the devices of two manufacturers to be
interconnected.
OAA collaboration
OAA collaboration means that the independent service component can send instructions to the
routing/switching component to change its functions. OAA collaboration is mainly implemented through
the Simple Network Management Protocol (SNMP). Acting as a network management system, the
independent service component sends various SNMP commands to the routing/switching component,
which can then execute the instructions received because it support s SNMP agent. In this process, the
cooperating MIB is the key to associating the two components with each other.
ACFP management
ACFP collaboration provides a mechanism, which enables the ACFP client (the independent service
component in
Figure 3-18) to control the traffic on the ACFP serv er (the routing/switching component in
Figure 3-18) by implementing the following functions:
z Mirroring and redirecting the traffic on the ACFP server to the ACFP client
z Permitting/denying the traffic from the ACFP server
z Carrying the context ID in a packet to enable the ACFP server and ACFP client to communicate the
packet context with each other. The detailed procedure is as follows: The ACFP server maintains a
context table that can be queried with context ID. Each context ID corresponds with an ACFP
collaboration policy that contains information including inbound interface and outbound interfa ce of
the packet, and collaboration rules. When the packet received by the ACFP server is redirected or
mirrored to the ACFP client after matching a collaboration rule, the packet carries the context ID of
the collaboration policy to which the collaboration rule belongs. When the redirected packet is
returned from the ACFP client, the packet also carries the context ID. With the context ID, the
ACFP server knows that the packet is returned after being redirected and then fo rwards the packet
normally.
For the ACFP client to better control traffic, a two-level structure of the collaboration policy and
collaboration rules is set in the collaboration to manage the traffic matching the collabo ration rule based
on the collaboration policy, implementing flexible traffic management.
3-21
Page 50

T o better sup port the Client/Server collaboration mode and granularly and flexibly set different rules, the
collaboration content is divided into four parts: ACFP server information, ACFP client information, ACFP
collaboration policy and ACFP collaboration rules. These four parts of information are saved in the
ACFP server.
An ACFP server supports multiple ACFP clients. Therefore, ACFP client information, ACFP
collaboration policy, and ACFP collaboration rules are org anized in the form of tables.
ACFP server information is generated by the ACFP server itself. ACFP client information, ACFP
collaboration policy, and ACFP collaboration rules are generated on the ACFP client and sent to the
ACFP server through the collaboration MIB or collaboration protocol.
Configuring OAA Client
Select System Management > Device Management > OAA Configuration to enter the OAA
configuration page, as shown in
Figure 3-19 OAA configuration
Figure 3-19.
Table 3-14 describes OAA client configuration items.
Table 3-14 OAA client configuration items
Item Description
ACFP Client
Username
Specify whether to enable ACFP client.
The ACFP client is enabled by default.
Set the username of the OAA client. The username should be the same with the
related configuration of the SNMP on the OAA server.
3-22
Page 51

Item Description
Authentication Password
Encryption Password
OAA Server IP Set the IP address for the OAA server.
VLAN ID Specify the VLAN to which the internal interface belongs.
IP Address Set the IP address for the internal interface.
Subnet Mask Set the subnet mask for the internal interface.
Set the authentication password and encryption password for the OAA client.
Three security levels are available: no authentication no privacy, authentication
without privacy, and authentication with privacy. The security level you set must be
the same with the related configuration of the SNMP on the OAA server.
The device supports MD5 authentication mode and DES privacy mode. If
authentication and encryption are needed, the authentication mode and privacy
mode on the OAA server must be MD5 and DES respectively.
After configuring the OAA client, click Test Connectiv to test the connectivity between the OAA client
and the server.
After configuring the parameters on the OAA page, click Test Connectiv to test the connectivity
between the OAA client and the server. After you confirm that the test is successful, click Apply to
submit your configuration.
OAA Configuration Example
Network requirements
z The intranet is interconnected to the Internet through Device that acts as the ACFP server.
z IPS is connected to Device. With the OAA configurations, IPS can detect and control the traffic on
Device.
3-23
Page 52

Figure 3-20 Network diagram for OAA configuration
Internet
Ten-GigabitEthernet2/0/1
192.1681.2/24
GE4/0/2
Router
GE4/0/1
EnterPrise
IPS
OAA client
Vlan-int100
192.168.1.1/24
Device
OAA server
Switch
Network
Management
Configuration procedure
1) Configure the OAA server
Follow these steps to configure the OAA server (the detailed configuration is omitted here):
z Enable the OAA server.
z Configure a VLAN interface for VLAN 100, and set the IP address of the interface to 192.168.1.1.
z Specify the SNMP version as v3.
z Create a user with the username v3user, and specify the security level as no authentication no
privacy.
2) Configure the OAA client
# Configure the OAA client.
z Select System Management > Device Management > OAA Configuration, and perform the
following operations, as shown in
Figure 3-21.
3-24
Page 53

Figure 3-21 OAA configuration
z Type v3user as the username.
z Type 192.168.1.1 as the IP address of the OAA server.
z Type 100 as VLAN ID.
z Type 192.168.1.2 as the IP address.
z Type 255.255.255.0 as subnet mask.
z Click Apply.
# Test the connectivity.
z Click Test Connectiv on OAA configuration page.
z The system prompts that the connectivity test succeeded.
# Add an internal security zone.
z Select Sy stem Management > Network Management > Security Zone, and click Add, as shown
Figure 3-22. Perform the following operations on the Add Security Zone page, as shown in
in
Figure 3-23.
Figure 3-22 Security zone
3-25
Page 54

Figure 3-23 Add a security zone
z Type zone1 as the name.
z Add interface GigabitEthernet 4/0/1.
z Click Apply.
# Add an external security zone.
z Click Add.
z Type zone2 as the name.
z Add interface GigabitEthernet 4/0/2.
z Click Apply.
# Add segment 0.
z Select System Management > Net work Management > Segment Configurati on, and click Add
Segment, as shown in
as shown in
Figure 3-25.
Figure 3-24. Perform the following operations on the Add Segment page,
Figure 3-24 Segment configuration
Figure 3-25 Add a segment
3-26
Page 55

z Select 0 from the Segment No drop-down list.
z Select zone1 from the Internal Zone drop-down list, and zone2 from the External Zone
drop-down list.
z Select Ten-GigabitEthernet2/0/1 from the Internal Interface drop-down list.
z Click Apply.
After the above configuration, you need to apply the security policies (such as URL filtering policies,
anti-virus policy) on segment 0, and then you can detect and control the traffic on Device.
System Reboot
System Reboot Overview
The system reboot module allows you to reboot the device through the web interface. After the system
reboots, you need to re-log in to the Web interface.
Rebooting the system
Select System Management > Device Management > System Reboot from the navigation tree to
enter the system reboot configuration page, as shown in
Figure 3-26.
Figure 3-26 System reboot page
You need to save the configurations to the disk before you reboot the device; otherwise, unsaved
configuration may be lost after reboot.
Click Reboot and confirm your action.
3-27
Page 56

4 User Management
User Management Overview
The user management module allows you to manage web users.
Web users fall into five categories: Level 0, Level 1, Level 2, Level 3, and auditor.
their authorities.
Table 4-1 User levels and their authorities
User level Authorities
z Perform ping operations
Level 0 (visit level)
Level 1 (monitor level)
Level 2 (system level)
Level 3 (manage level)
Auditor
z View the IP address of the management interface, management privilege, static
route, and DNS server information only.
z Cannot perform any configurations.
z Own user authorities of level 0.
z View configurations except user information.
z View logs except operation logs.
z Cannot perform any configurations.
z Cannot monitor real-time packet distribution.
z Own user authorities of level 1.
z Perform configurations except user configuration, operation log c onfiguration,
modify logging configuration, software upgrade, and configuration maintenance.
z Own user authorities of level 2.
z View all configurations and all logs.
z Perform all configurations.
z View, back up, and delete operation logs.
z Cannot perform any other operations.
Table 4-1 describes
Configuring User Management
Configuration Task List
Table 4-2 describes the user management functions.
Table 4-2 User management functions
Task Remarks
You can display information about all user accounts, add new user accounts, and
modify user information.
Managing User Accounts
Managing Online Users
By default, the user
You can unlock a user on the page for modifying user information.
You can view all users that have logged in to the system and kick any of them out
of the system.
Users cannot kick themselves out.
admin
of level 3 is predefined in the system.
4-1
Page 57

Task Remarks
Configuring the Security
Policy
Managing User Accounts
Select System Management > User Managem ent > User Accounts from the navigation tree to enter
the page listing all users, as shown in
Figure 4-1 User account list
On the page, you are allowed to perform the following operations:
z Click Add to enter the page for adding a user account, as shown in Figure 4-2.
z Click the icon of a user to enter the page for modifying the user account information, as shown
in
Figure 4-3. You can also set whether to lock the user. However, if you enter the modification
page of the account you are using, the lock configuration item is not displayed.
You can set the parameters related to Web login security, such as idle timeout,
password strength, and locking upon login failures.
Figure 4-1.
z Modify the user level by selecting the check box of a user, selecting a level from the Level
drop-down list, and then clicking Apply.
Figure 4-2 Add a user
4-2
Page 58

Figure 4-3 User information configuration page
Table 4-3 describes user account configuration items.
Table 4-3 User account configuration items
Item Description
Username This field displays a user name.
Password
Confirm Password
Description Set the description of the user.
Level Set the user level.
Status
Return to
User management functions.
Managing Online Users
Set a password for the user to log in to the system.
The password must comply with the strength requirements; otherwise, the
password configuration will fail. For more information about password strength
requirements, see
Type the password the same as that you set in the
not the same, a message appears telling you that the two passwords are not
consistent.
Set the user status, normal or lock.
z Lock: The user is locked and cannot log in to the system.
z Normal: The user is not locked.
This configuration item is displayed when you enter the modification page of
another user account rather than the account you are using.
Configuring the Security Policy.
Password
text box. If they are
Select System Management > User Management > Online Users from the navigation tree to enter
the page displaying a list of online users, as shown in
4-3
Figure 4-4.
Page 59

Figure 4-4 Online user display page
Select the check box of a user and click Kick Out to kick the online user out of the system.
Table 4-4 describes items in the online user list.
Table 4-4 Item description of the online user list
Item Description
Username User names.
Level User levels.
Login Time The time when the users log in to the system.
Recent Operation Time The time at which the last user operation occurred.
Login IP The IP address of the host where the user resides.
Language The language displayed on the Web interface
Return to
User management functions.
Configuring the Security Policy
Select System Managem ent > User Management > Security Policy from the navigation tree to enter
the page for configuring the security policy, as shown in
Figure 4-5 Security policy configuration page
Figure 4-5.
Table 4-5 describes security policy configuration items.
4-4
Page 60

Table 4-5 Security policy configuration items
Item Description
Idle timeout
Password strength
Lock upon
Unlock Set the time period a locked user must wait before the user is unlocked.
Set the time period after which the idle users will be logged out.
If a user is idle for the time period, the system will log out the user.
Set the requirements on the user passwords.
There are three strength levels, low, middle, and higher, each containing certain
security requirements. For details, see Figure 4-5.
Set the number of unsuccessful password attempts after which the user account
will be locked.
When a user account is locked, you cannot log in with this account and a message
appears displaying "User is locked, please try again later."
Return to
User management functions.
4-5
Page 61

5 Management Interface Configuration
Overview
The management interface module allows you to specify management interface parameters, perform
ping operations, and configure static routes and DNS servers.
Management Interface Parameters
Management interface parameters include the IP address and mask of the management interface, and
the status of HTTP, HTTPS, SSH, and Telnet. A device may have multiple managem ent interfaces. You
can log in to the device through any of the management interfaces to configure, manage, and maintain
the device.
Ping
You can use the ping command to check whether a device is reachable.
A successful ping operation involves the following steps:
1) The source device sends an ICMP echo request (ECHO-REQUEST) to the destination device.
2) The destination device responds by sending an ICMP echo reply (ECHO-REPLY) to the source
device after receiving the ICMP echo request.
3) The source device displays related statistics after receiving the reply.
If the source device does not receive an ICMP echo reply from the destination device before the timeout
timer expires, it displays output information and st atistics during the ping operation. If the source device
receives an ICMP echo reply before the timeout timer expires, it displays the bytes of the echo reply,
packet sequence number, Time to Live (TTL), response time, and statistics during the ping operation.
Statistics du ring the ping operation include the numbe r of packets sent, number o f echo replies received,
percentage of packets lost, and the mini mum, maximum and average round trip times.
Static Routes
You can manage a device through multiple management stations. The device reports detected
anomalies and network attacks to the management stations. You can manage the device from remote
management stations, or allow the management stations to receive and analy ze logs gene rated by the
device, so as to detect and prevent network security threats effe ctively.
The route management module manages routes from the device to the management st ations. You can
establish a routing table on the device by manually configuring static routes. Each entry in the routing
table specifies the next hop to reach a specific management station.
The device selects the default route for a packet only when it cannot find any matching entry in the
routing table. A static route with its destination IP address and subnet mask configured as 0.0.0.0
serves as a default route.
5-1
Page 62

DNS Servers
Domain name system (DNS) is a distributed databa se used by TCP/IP applications to translate domain
names into corresponding IP addresses. With DNS, you can use easy-to-remember domain names in
some applications and let the DNS server translate them into correct IP addresses.
Domain name resolution is implemented by querying the DNS server. The resolution procedure is as
follows:
1) A user program sends a name query to the resolver of the DNS client.
2) The DNS re solver lo oks up the lo cal d om ain name cach e for a match. If a match is fou nd, it send s
the corresponding IP address back. If not, it sends a query to the DNS server.
3) The DNS server looks up the corresponding IP address of the domain name in its DNS database. If
no match is found, it sends a query to a higher DNS server. This process continues until a result,
whether successful or not, is returned.
4) The DNS client returns the resolution result to the application after receiving a response from the
DNS server.
Figure 5-1 Dynamic domain name resolution
Figure 5-1 shows the relationship between the user program, DNS client, and DNS server . The resolver
and cache comprise the DNS client. The user program and DNS client can run on the same device or
different devices, while the DNS server and the DNS client usually run on differe nt devices.
Configuring a Management Interface
Configuring Management Interface Parameters
z After the IP address of a management interface is changed, Web users that have already logged in
to the management interface cannot perform operations in IE any more. They need to log in to the
interface again by using the new IP address.
z If a device has multiple management interfaces, you are recommended to use one of them, and
configure others as standby interfaces.
5-2
Page 63

Select System Management > Network Management > Management Interface from the n avigation
tree to enter the page as shown in
Figure 5-2. On the Management Interface Configuration tab, you
can view and configure parameters including the IP address and mask of a specific management
interface, and the status of HTTP, HTTPS, SSH, and Telnet.
Figure 5-2 Management interface configuration
Table 5-1 describes the configuration items of management interface parameters.
Table 5-1 Management interface parameter configuration items
Item Description
Management Interface Select an interface to be co nfigured.
IP Address Specify an IP address and a subnet mask for the management interface.
Enable or disable HTTP, HTTPS, SSH and Telnet.
Protocol
z This configuration item is effective globally.
z The total number of HTTP and HTTPS connections on the device cannot
exceed 5. The total number of SSH and Telnet connections on the device
cannot exceed 7.
z You are not recommended to log in to the Web network management
interface on a host through HTTP and HTTPS at the same time.
5-3
Page 64

Executing a Ping Operation
Select System Management > Network Management > Management Interface from the n avigation
tree to enter the page as shown in
Interface Configuration page.
Type a destination IP address in the Ping text box, and then click Test to start a ping operation. The
result of the ping operation is displayed below the text box, as shown in
Figure 5-3 Ping operation result
Figure 5-2. You can perform ping operations on the Management
Figure 5-3.
Creating a Static Route
Select System Management > Network Management > Management Interface from the n avigation
tree to enter the page as shown in
Add to enter the Add Static Route page as shown in
Figure 5-4 Add a static route
Figure 5-2. On the Static Route tab, all static routes a re listed. Click
Figure 5-4.
5-4
Page 65

Table 5-2 describes the configuration items of creating a static route.
Table 5-2 Static route configuration items
Item Description
Destination IP Specify the IP address of a destination management station, in dotted decimal notation.
Subnet Mask Specify the subnet mask for the management station, in dotted decimal notation.
Gateway IP Specify the next hop to reach the management station, in dotted decimal notation.
Configuring DNS Servers
Select System Management > Network Management > Management Interface from the n avigation
tree to enter the page as shown in
Configuration tab.
Table 5-3 describes the DNS server configuration items.
Table 5-3 DNS server configuration items
Item Description
Figure 5-2. You can configure DNS servers on the DNS
Preferred DNS Server Specify the IP address of the preferred DNS server.
Alternate DNS Server Specify the IP address of the alternate DNS server.
5-5
Page 66

6 Interface Configuration
Overview
The interface configuration module allows you to manage device interface attributes, including the
interface type, up/down status, transmission rate, and duplex mode.
Configuring and Displaying Interface Properties
Select System Management > Ne t work Management > Interface Configuration from the navigation
tree to enter the page as shown in
Figure 6-1 Interface priorities configuration page
Figure 6-1.
The interface status, attributes, and statistics are displayed on the page.
interface priorities configuration items.
Table 6-1 Interface priorities configuration items
Item Description
Interface This field displays the interface type and number.
Connection Status This field displays whether the interface is connected to another network device.
Configure the medium type of the interface, which can be:
z Copper—The interface is an electrical interface and is connected to a twisted pair.
Interface Type
Management Status Config ure the up/down state of the interface.
Rate
z Fiber—The interface is an optical interface and is connected to an optical fiber.
Support for the medium types depends on your device model.
Configure the interface transmission rate, which can be
z 1000M—1000 Mbit/s
z 100M—100 Mbit/s
z 10M—10 Mbit/s
z Auto—The transmission rate is automatically negotiated.
Table 6-1 describes the
6-1
Page 67

Item Description
Rate Negotiated
Auto
If
is selected for
negotiated.
If the connection status or management status is
Rate
, this field displays the transmission rate automatically
Down
, this field displays
Configure the interface communication mode, which can be
Duplex
Duplex Negotiated
z Full Duplex
z Half Duplex
z Auto—Automatically negotiated communication mode
If
Auto
is selected for
Duplex
, this field displays the communication mode negotiated
automatically.
If the connection status or management status is
Down
, this field displays
Bytes Sent This field displays bytes sent on the interface.
Bytes Received This field displays bytes received on the interface.
Packets Sent This field displays the number of packets sent on the interface.
Packets Received This field displays the number of packets received on the interface.
Clear Counters
Click
to clear statistics of the corresponding interface.
Unknown
Unknown
.
.
6-2
Page 68

7 Security Zone Configuration
Overview
With security zones, an administrator can classify interfaces based on security needs, that is, assign
them to different zones, thus implementing hierarchical policy management. A security zone can
include physical and logical interfaces, and Layer 2 physical trunk in terfaces + VLAN. Interfaces added
to the same security zone have consistent security needs in security policy control.
As shown in
Internal zone, and add the IPS device’s interface connecting to the external network to the External
zone. After that, you only need to define security policies for the two security zones. If networking
changes, you can modify interfaces in the security zones, instead of modifying security policies.
Security zones simplify policy maintenance and separate network services from security services.
Figure 7-1 Security zones
Figure 7-1, you can add the IPS device’s interface connecting to the internal network to the
Configuring a Security Zone
Configuration Task List
Perform the tasks in Table 7-1 to configure a security zone.
Table 7-1 Security zone configuration task list
Task Description
Creating a Security
Zone
Required
Create a security zone and add interfaces to it.
By default, no security zone is created.
7-1
Page 69

Task Description
Required
Activate all Class B configurations.
Activating
Configurations
z There are two categories of configurations in the system: Class A and Class B.
Class A configurations take effect immediately, while Class B configurations must
be activated to take effect.
z The Activate button is present on all pages with Class B configuratio ns. Clicking
the button on any page will activate all Class B configurations. You are
recommended to complete all Class B configurations before clicking the Activate
button.
Creating a Security Zone
For interfaces without VLAN configuration
Select System Management > Network Management > Security Zone from the navigation tree to
enter the page as shown in
Figure 7-2 Security zone configuration page (for interfaces without VLAN configuration)
Figure 7-2. Click Add to enter the page as shown in Figure 7-3.
Figure 7-3 Create a security zone for interfaces without VLAN configuration
Table 7-2 describes the configuration items of creating a security zone.
7-2
Page 70

Table 7-2 Configuration items of creating a security zone for interfaces without VLAN configuration
Item Description
Name Specify the name of the security zone.
Interface Assign interfaces to or remove interfaces from the security zone.
For OAA enabled interfaces with VLAN configuration
Select System Management > Network Management > Security Zone from the navigation tree to
enter the page as shown in
Figure 7-4. Click Add to enter the page as shown in Figure 7-5.
Figure 7-4 Security zone configuration page (for OAA enabled interfaces with VLAN configuration)
Figure 7-5 Create a security zone for OAA enabled interface with VLAN configuration
Table 7-3 describes the configuration items of creating a security zone.
7-3
Page 71

Table 7-3 Configuration items of creating a security zone for OAA enabled interfaces with VLAN
configuration
Item Description
Specify the name of the security zone.
Name
Interface
VLAN ID
Application Mode
Return to
Security zone configuration task list.
The Any zone is a reserved security zone for some devices. Support for the
configuration of this zone depends on your device model.
Assign interfaces to or remove interfaces from the security zone.
If your device serves as an ACFP client, the Available Interfaces field lists the
interfaces of the ACFP server. Otherwise, the Available Interfaces field lists the
interfaces of your device.
When you try to assign a Layer 2 Ethernet interface to the security zone, you must
associate one or more VLANs with the interface. If you do not specify any VLAN, you
will associate all VLANs with the interface.
You can assign the association between a Layer 2 Ethernet interface and a VLAN to
one security zone only.
The SR6600 IPS card does not support VLAN ID configuration.
Select the application mode (normal or cascaded) of the security zone.
In cascaded mode, policy applications are used based on VLAN IDs. The cascaded
mode is applied to ACFP internal interfaces, whereas the normal mode applies to
other cases.
Security Zone Configuration Example
Network requirements
As shown in Figure 7-6, the IPS device serves as the network edge device that connects the Intranet to
the Internet. Interface GigabitEthernet 0/0/0 on the IPS device is connected to the Intranet, which is
configured as security zone Internal, and interface GigabitEthernet 0/0/1 is connected to the Extranet,
which is configured as security zone External.
Configure security zones on the IPS device to facilitate network management.
Figure 7-6 Network diagram for the security zone configuration
Configuration procedure
# Configure security zone Internal.
7-4
Page 72

z Select System Management > Network Management > Security Zone to enter the page as
shown in
Figure 7-7. Click Add to enter the page and operate on the page as shown in Figure 7-8.
Figure 7-7 Security Zone Configuration
Figure 7-8 Configure security zone Internal
z Input Internal in the Name text box.
z Select interface g-ethernet0/0/0.
z Click Apply to complete the operation.
# Configure security zone External.
z Click Add to enter the page and operate on the page as shown in Figure 7-9.
Figure 7-9 Configure security zone External
z Input External in the Name text box.
z Select interface g-ethernet0/0/1.
7-5
Page 73

z Click Apply to complete the operation.
7-6
Page 74

8 Segment Configuration
Overview
A segment refers to the combinatio n of two security zones in specific direction s. You can apply different
security policies to a segment to monitor and regulate network behaviors.
Configuring a Segment
Configuration Task List
Perform the tasks in Table 8-1 to complete segment management.
Table 8-1 Segment configuration task list
Task Description
Creating a Segment
Applying a Policy to the
Segment
Applying a Segment
Bandwidth Control
Scheme to the Segment
Activating Configurations
Required
Create a segment and add security zones to it.
By default, no segment is created.
Optional
Apply a security policy to a security zone in the segment or specific IP addresses
of the security zone. The security policy can be related to IPS, anti-virus, URL
filtering, DDoS, and bandwidth management. For details, refer to corresponding
Web configuration manuals.
Optional
Apply a segment bandwidth control scheme to the segment.
Required
Activate all Class B configurations, including the configured segments, policy
applications, segment bandwidth control schemes.
z There are two categories of configurations in the system: Class A and C lass
B. Class A configurations take effect immediately, while Class B
configurations must be activated to take effect.
z The Activate button is present on all pages with Class B configurations.
Clicking the button on any page will activate all Class B configurations. You
are recommended to complete all Class B configurations before clicking the
Activate button.
Creating a Segment
On a chassis
Select System Management > Net work Management > Segment Configuration from the navigation
tree to enter the page as shown in
Figure 8-2.
Figure 8-1. Then click Add Segment to enter the page as shown in
8-1
Page 75

Figure 8-1 Segment configuration on a chassis
Figure 8-2 Create a segment on a chassis
Table 8-2 describes the configuration items of creating a segment.
Table 8-2 Configuration items of creating a segment on a chassis
Item Description
Segment No Specifies the segment ID.
Internal Zone
External Zone
Specifies the internal zone of the segment. You can select one of the existing security
zones only.
Specifies the external zone of the segment. You can select one of the existing security
zones only.
Return to
Segment configuration task list.
On a card
Select System Management > Net work Management > Segment Configuration from the navigation
tree to enter the page as shown in
Figure 8-3. Then click Add Segment to enter the page as shown in
Figure 8-4.
8-2
Page 76

Figure 8-3 Segment configuration on a card
Figure 8-4 Create a segment on a card
Table 8-3 describes the configuration items of creating a segment.
Table 8-3 Configuration items of creating a segment on a card
Item Description
Segment No Specifies the segment ID.
Internal Zone
External Zone
Start VLAN
End VLAN
Acfp Policy Priority
Specifies the internal zone of the segment. You can select one of the existing security
zones only, and make sure that the security zone includes at least one interface.
Specifies the external zone of the segment. You can select one of the existing security
zones only, and make sure that the security zone includes at least one interface.
Specifies the start VLAN ID and the end VLAN ID of the segment. Note that the start
VLAN ID must be greater than the end VLAN ID.
Support for this configuration item depends on your device model.
Priority of the ACFP policy applied to the segment.
On a host device implementing load balancing and stateful failover on multiple cards, the
host device distributes traffic to the card that has a higher ACFP policy priority.
If the host device does not use the ACFP policy priority of cards, you are recommended
to set the ACFP policy priority to 0.
8-3
Page 77

Item Description
Internal Interface
Specifies the internal interface of the segment. The card is connected to the host device
through this interface.
Return to
Segment configuration task list.
Applying a Segment Bandwidth Control Scheme to the Segment
Select System Management > Ne t work Management > Interface Configuration from the navigation
tree to enter the page as shown in
Table 8-4 describes the segment bandwidth control configuration items.
Table 8-4 Segment bandwidth control configuration items
Item Description
Segment List
Configure
Segment
Bandwidth
Control
Up Set the bandwidth upper limit for traffic from the internal zone to the external zone.
Down Set the bandwidth upper limit for traffic from the external zone to the internal zone
This field displays basic information about all segments.
Select a segment that you want to apply the segment bandwidth control scheme to.
Figure 8-1 or Figure 8-3.
Return to
Segment configuration task list.
Precautions
Before creating a segment, you must configure security zones and assign at least one interface to each
security zone configured on a card. For more information, see
Configuring a Security Zone.
8-4
Page 78

9 Layer 2 Fallback
Layer 2 Fallback Overview
The internal monitoring module of the device monitors the health status of the device periodically in a
high frequency. As long as detecting a detection engine or software system fault, or a large traffic, the
device can automatically fall back to be a simple Layer 2 switching device. In this way, the device does
not detect any network traffic, which ensures the continuity of network services. This function is called
Layer 2 fallback.
You can also manually enable or disable Layer 2 fallback.
Configuring Layer 2 Fallback
Select System Management > High Reliability > Layer 2 Fallback to enter the page for configuring
Layer 2 fallback, as shown in
Figure 9-1.
Figure 9-1 Layer 2 fallback
Table 9-1 describes the configuration items of setting Layer 2 fallback.
Table 9-1 Configuration items for Layer 2 fallback
Item Remarks
z If the device is in the automatic detection status, the status indicator is green, and the
button at the right of the indicator is Enable. When the device detects a fault or a large
traffic, it automatically enables Layer 2 fallback. You can also click Enable to manually
Layer 2
Fallback
Action for Data
Packets
make the device fall back to be a Layer 2 device.
z If the device is enabled with the Layer 2 fallback function, the status indicator is red, and
the button at the right of the indicator is Disable. After waiting for a period of time, the
device automatically disables Layer 2 fallback and enters the automatic detection status.
You can also click Disable to manually disable Layer 2 fallback.
Set how the device processes the data packets received when Layer 2 fallback is performed.
z Permit: The device does not check the data packets received and forwards them directly.
z Block: The device discards the data packets received so that the traffic can be blocked.
After the configuration, click
By default, the device permits the data packets received.
Apply
to make the configuration take effect.
Current
Networking
Mode
Display the current networking mode of the device as
9-1
Directly connected
Bypassed
or
.
Page 79

Guidelines
Note the following when configuring Layer 2 fallback:
1) The Layer 2 fallback function takes effect only when the networking mode of the device is directly
connected. When the networking mode of the device is bypassed, the Layer 2 fallback function is
invalid, and cannot be configured. If the device is already in the state of Layer 2 fallback when its
networking mode is configured as bypassed, you can only disable the Layer 2 fallback function.
9-2
Page 80

10 Interface Status Synchronization
Interface Status Synchronization Overview
In a network, when an IPS device is connected to two adjacency devices, the interface status of the
network devices may not be consistent and the devices cannot update the information related to
interface status (for example routing information) because the devices cannot be aware of the st atus of
the interface on the original peer device.
To solve this problem, the interface status synchronization module is introduced. The interface status
synchronization module provides three synchronization modes. You can select one according to the
interface requirements of the network devices at the two ends of the IPS device. The following
describes the three modes in detail.
1) Hub
No interface status synchronization is performed, and the status of each interface is independent.
2) Breaker
If the link status of the interface on one end changes from up to down, the link st atus a nd mana gement
status of the interface on the peer end change s from up to down; if the link st atus of the interface on one
end changes from down to up, the interface on the peer end does not perform any interface status
synchronization.
3) Wire
In the Wire mode, the link status of the interfaces on the two ends should be the same after interface
status synchronization is performed. When the link status of the interface on one end becomes down,
the device changes the link status and management status of the interface on the peer end from up to
down; when the link status of the interface on the peer end changes from down to up:
z If the current management status of the peer interface is down, the device tries to change the
management status and link status of the peer interface to up; if succeeds, the link status and
management status of the two interfaces are up; otherwise, the device changes the lin k status and
management status of both of the two interfaces to down.
z If the management status of the peer interface is up, and the physical connection status is down,
the device changes the link status and management status of the local interface to down.
z If the management status of the peer interface is up, and the physical connection status is up, the
link status and management status of both of the two interfaces are up.
Configuring Interface Status Synchronization
Select System Management > High Reliability > Interface Status Synchronization to enter the
page for configuring interface status syn ch ronization, as shown in
10-1
Figure 10-1.
Page 81

Figure 10-1 Interface status synchronization
Table 10-1 describes the configuration items for setting interface status synchronization.
Table 10-1 Configuration items for setting interface status synchronization
Item Remarks
Device Access Mode
Synchronize After
Set the interface status synchronization mode of the device: Hub, Breaker or
Wire.
Set the validation waiting time for an interface to change to a new status.
If you select the Breaker or Wire mode, this item is configurable.
When the interface status synchronization mode of the device is set to Wir e, a
short validation waiting time for an interface to change to a new status may easily
cause interface pair flapping, so set a longer one.
10-2
Page 82

11 Time Table Management
Time Table Management Overview
A time t able is used to define time information. It can be reference d by the rules of the policie s su ch as
bandwidth management and URL filter , so the system can take dif ferent actions on the matched pa ckets
at different time ranges.
Each time table contains a time range in a unit of half an hour and of a period of seven days. This time
range can be continuous or discontinuous.
Configuring Time Table Management
Configuration Task List
Perform the tasks in Table 1 1-1 to configure time table management.
Table 11-1 Time table management configuration task list
Task Remarks
Required
Create a time table and set the valid time range.
By default, two time tables that can be modified and deleted exist. The default
Creating a Time Table
Activating
Configurations
configurations are as follows:
two time tables exist:
z work: Valid from 8:00 am to 18:00 pm from Monday to Friday.
z weekend: Valid at all times except 8:00 am to 18:00 pm from Monday to Friday.
Required
Activate the configurations of a time table to make the configurations take effect.
z There are two categories of configurations in the system: Class A and Class B.
Class A configurations take effect immediately, while Class B configurations must
be activated to take effect.
z The Activate button is present on all pages with Class B configurations. Clicking
the button on any page will activate all Class B configurations. You are
recommended to complete all Class B configuration before clicking the Activate
button.
Creating a Time Table
Select System Management > Time Table List from the navigation tree to enter the page for
displaying a time table, as shown in
page, as shown in
Figure 1 1 -2.
Figure 11-1. Then click Add to enter the time table configuration
11-1
Page 83

Figure 11-1 Time table management
Figure 11-2 Create a time table
Table 11-2 shows the configuration items for creating a time table.
Table 11-2 Configuration items for creating a time table
Item Remarks
Name Set the name of a time table.
Description Set the description for the time table.
Set the time ranges for the time table to take effect.
You can select the blue icon, and then highlight the desired time ranges in the time
Click to select time
ranges to take effect
table to set the valid time ranges; select the white icon, and you will clear the time
ranges you set.
The longitudinal grids in a time table represent the seven days (from Sunday to
Saturday) in a week, the latitudinal grids represent the 24 hours (from 00:00 to 24:00,
that is, 00:00 in the second day) in a day, and each grid represents half an hour.
Return to
Time table management configuration task list.
11-2
Page 84

12 Action Management
Action Management Overview
An action management module manages actions and action sets. An action set is a group of actions
that can be applied in IPS, bandwidth, and URL policies to configure the actions conducted to the
matching packets. The actions in clude block action and notify actions.
z Block action—Blocking and isolating the attack packets once an attack is detected. It is suitable for
IPS, bandwidth management, and URL filtering.
z Notify action—Sending notification messages once an attack is detected. It can be applied for IPS,
bandwidth management, and URL filtering.
Configuring Action Management
Configuration Task List
Follow the steps in Table 12-1 to configure action management:
Table 12-1 Action management configuration task list
Task Description
Creating a Block Action
Creating
an action
Creating an Action Set
Uploading Packet Trace Files
Creating a Notify Action
Required
Use either operation
Create a bloc action or notify action, and configure the action.
z By default, a block action named Block exists.
z By default, a notify action named Notify exists.
Optional
Create an action set and configure the actions in it.
By default, a system-defined action set exists, as shown in
The system-defined action set varies by device.
Optional
You can upload the trace files generated by the packet trace action to
the TFTP server. With the IP address of the TFTP server configured,
the system uploads the trace files to the TFTP server at a specified
upload time. Meanwhile, the system checks the disk partitions at
certain times. When the partition usage reaches the threshold, the
system automatically uploads the packet trace files starting from the
oldest ones until the usage falls into the normal range.
If the specified TFTP server is not reachable, or the server is reachable
but the TFTP server service is not enabled, the trace file fails to be
uploaded, and the system removes the trace file if the partition usage
reaches the threshold.
Figure 12-5.
12-1
Page 85

Task Description
Activating Configurations
Creating a Block Action
Select System Management > Action Management > Block Actions in the navigation tree to enter
the block action list displaying page, as shown in
configuration page, where the action type is Block by default, as shown in
Figure 12-1 Block action list
Required
Activate the configuration of an action and action set.
z The system has Class A and Class B configurations. Class A
configurations take effect immediately, while Class B configurations
must be activated to take effect.
z The Activate button is present on all pages with Class B
configurations. Clicking the button will activate all Class B
configurations. You are recommended to complete all Class
B configurations before clicking the Activate button.
Figure 12-1. Click Add to enter the action
Figure 12-2.
Figure 12-2 Block action configuration page
Table 12-2 describes the configuration items for creating a block action.
12-2
Page 86

Table 12-2 Block action configuration items
Item Description
Name Enter a name for the block action
Description Enter a description for the block action, for example, the function of this action
Specify the sending mode of TCP reset packets, including
z Do not send—Do not send any TCP reset packets
z Send to src IP—Send TCP reset packets to the source IP address of the TCP
TCP Reset Mode
HTTP Request
Quarantine Duration
connection
z Send to dest IP—Send TCP reset packets to the destination IP address of the
TCP connection
z Send to both—Send TCP reset packets to both the source and destination IP
addresses of the TCP connection
Specify how to process HTTP requests:
z Drop HTTP Request—Directly drop the received HTTP requests.
z Redirect to URL—Redirect HTTP requests to a specified URL. You need to
configure the URL address if this checkbox is selected.
z Return response page—Return the response page to users who initiate an
HTTP request. With this checkbox selected, you need to configure the
content in the respond page, including the rule description and the
customized description. The rule description defines the policies, while the
customized description is configured by users to define the response content.
You can use either description type or both.
Configure whether to quarantine packets sourced from a specific IP address
(namely adding the IP address of the source to the blacklist) and specify the
quarantine period (namely the lifetime of the blacklist entry).
z Do not quarantine—Do not quarantine any packets.
z Quarantine—Quarantine packets sourced from a certain IP address. You
need to configure the quarantine period together with this selection.
Return to
Action management configuration task list.
Creating a Notify Action
Select System Management > Action Management > Notify Actions in the navigation tree to enter
the notify action list displaying page, as shown in
configuration page, where the action type is Notify by default, as shown in
Figure 12-3 Notify action list
Figure 12-3. Click Add to enter the action
Figure 12-4.
12-3
Page 87

Figure 12-4 Notify action configuration page
Table 12-3 describes the configuration items for creating a notify action.
Table 12-3 Notify action configuration items
Item Description
Name Enter a name for the notify action
Description Enter a description for the notify action, for example, the function of the action
Notificatio
n
Methods
Output to local
database
Notify by
Email
Output to
syslog host
Output notification messages to the local database
Send notification messages to users by Email
You can configure the Email address and other related parameters on the page
you enter by selecting
Configuration
Output notification messages to the loghost. You need to select one or more
loghosts from the loghost list.
You need to manually add loghosts to the loghost list. To do this, enter the
loghost information such as the name, description, IP address, and listening port
number, and then click
effective and up to ten loghosts can be added here.
. For details, refer to Log Management.
Log Management
Add
to complete the operation. The loghosts are globally
>
Logging Configuration
>
Mail
Return to
Action management configuration task list.
Creating an Action Set
Select System Management > Action Management > Action Sets in the navigation tree to enter the
action set list displaying page, as shown in
list, as shown in
Figure 12-6.
Figure 12-5. Click Add to enter the action set configuration
12-4
Page 88

Figure 12-5 Action set list
Figure 12-6 Action set configuration page
Table 12-4 describes the configuration items for creating an action set.
Table 12-4 Action set configuration items
Item Description
Name Enter a name for the action set
Description Enter a description for the action set, for example, the function of the action set
12-5
Page 89

Item Description
Select the actions to be included in the action set:
z Permit/block—Either is required. You can allow or deny packets to pass. You must
select a block action in the pull-down box if Block is selected.
z Packet trace—Trace the packets, that is, obtain some information from the packets
and form a packet trace file in use for analysis. Click the hyperlink for the packet trace
name, which is Packet Trace by default, to enter the configuration page as shown in
Figure 12-7. In this page, you can modify the trace action. Detailed description is given
Table 12-5.
in
z Notify—Add the notify action in the action set. You need to select a notify action from
the drop-down list.
Actions
z Interfere—You can select this action together with only the Permit action. This action
allows packets to pass but with interference information so that the destination
receives faulty packets.
z When you click the hyperlink for packet trace, a dialog box appears to pro mpt that
modifications that have not been saved will get lost if you want to enter the new page.
Click OK to enter the packet trace configuration page.
z Control the time for packet tracing since a great amount of packet trace files will be
generated in case of high traffic rate, resulting in great occupation of storage space
and thus affecting normal operation of the system.
Figure 12-7 Packet trace configuration page
Table 12-5 Packet trace action configuration items
Item Description
Name Enter a name for the packet trace action
Description
Max Captured Length of
Each Packet
Max Number of Packets
Captured Each Time
Enter a description for the packet trace action, for example, the function of the
packet trace action
Specify the maximum length of data to be captured from each packet
Specify the maximum number of packets contained in a packet trace file
12-6
Page 90

Return to Action management configuration task list.
Uploading Packet Trace Files
Select System Management > Action Management > Upload Packet Trac e in the navigation tree to
enter the page as shown in
uploading packet trace files.
Figure 12-8 Packet trace file upload configuration page
Table 12-6 describes the configuration items of packet trace file upload.
Figure 12-8. In this page, you can display and configure parameters for
Table 12-6 Packet trace file upload configuration items
Item Description
TFTP Upload Select the checkbox to enable uploading packet trace files.
TFTP Server IP Enter the IP address of the TFTP server to which you upload the packet trace file.
Specify when to upload the packet trace file when the maximum number of packets
are captured..
When Max Packets are
Captured
z Upload immediately—Upload the trace file once the number of packets saved in
this file reaches the configured threshold.
z Upload at a certain time—Upload all the trace files in each of which the n umber
of packets reaches the configured threshold at a certain time.
Return to
Action management configuration task list.
12-7
Page 91

13 Log Management
System Logs
System Logs Overview
The system logs feature enables you to save the system messages to the log buffer or send them to the
log hosts. The analysis and archiving of the logs can enable you to check the security holes of the
firewall, when and who try to disobey security policies.
System logs are saved on the disk in the format of log files, with the name of sys-date.log. For example,
the system logs on 1st, October, 2007 are saved in file sys-20071001.log. The size of each log file
cannot exceed 300 MB. If the system logs generated in one day are too large, they will be saved in
multiple log files, with the name sys-date.log.n respectively, where a larger value of n indicates that the
logs are generated earlier. The latest system logs in one day are saved in file sys-current.log.
The functions provided by the system log module are listed in the following table :
Table 13-1 System log functions
Function Description
Displaying Recent Logs Displays the recent system logs.
Querying System Logs Allows you to query the system logs based on different conditions.
Deleting System Logs Allows you to delete the specified system log files from the disk.
Backing Up System Logs
Displaying Recent Logs
Select Log Management > System Logs > Recent Logs to enter the page as shown in Figure 13-1.
This page displays the recent 25 system logs.
Allows you to back up the specified system log files to the local host in
the format of CSV.
13-1
Page 92

Figure 13-1 Recent logs
Table 13-2 describes the configuration items for displaying the recent logs.
Table 13-2 Configuration items for displaying the recent logs
Item Description
Time
Module
Severity
Log Content
Time when a system log was generated
Module to which a system log belongs
Severity level of a system log, including the following (from high to low):
z Emergency: The system is unavailable.
z Alert: Information that demands prompt reaction
z Critical: Critical information
z Error: Error information
z Warning: Warnings
z Notice: Normal information that needs to be noticed
z Informational: Informational information
The system logs with different severity levels are displayed with shadings in different colors:
z Emergency, alert and critical information are displayed with red shadings.
z Errors and warnings are displayed with orange shadings.
z Notice and informational messages are displayed with white shadings.
Content of a log
13-2
Page 93

Click Export to CSV, and a popup window appears. You can display the log contents in the format of
CSV, or save them in the format of CSV locally.
z Select the Refresh every seconds checkbox, and the system will automatically refresh the logs in
the specified interval; click the Refresh Now button, and you can refresh the latest logs manually.
z To display the logs in the order defined by the title items, click the title items in the log information
table.
Return to
System log functions.
Querying System Logs
Select Log Managem ent > System Logs > Query Logs to enter the page for querying system logs, as
shown in
Figure 13-2 Query system logs
Figure 13-2. The page allows you to query system logs based on different conditions.
After setting the severity level and the time range for the system logs to be queried,
z Click Export to CSV, and a popup windows appears. You can ope n the system l ogs or save them
locally in the format of CSV.
z To display all the system logs matching the query condition, click Query. The detailed description
of the information is as shown in
Table 13-2.
13-3
Page 94

To display the logs in the order defined by the title items, click the title items in the log information table.
Return to
System log functions.
Deleting System Logs
Select Log Management > System Logs > Delete Logs to enter the page as shown in Figure 13-3.
Figure 13-3 Delete system logs
Select the checkbox before the system log files to be deleted, and then click Delete to delete the
corresponding system log files.
Return to
System log functions.
Backing Up System Logs
Select Log Management > Sy stem Logs > Back up Logs to enter the page as shown in Figu re 13-4.
Figure 13-4 Back up system logs
Select the system log files to be backed up, and then click Back Up to back up the system log files to
the local host in the format of CSV.
Return to
System log functions.
Operation Logs
Operation Logs Overview
The operation logs function enables you to save the operations performed on the Web interface and
command lines. The analysis and archiving of the logs can enable you to know the operations
performed on the device, thus to analyze and solve the problems.
Operation logs are saved on the disk of the device in the format of log files, with the name of
oper-date.log. For example, the operation logs on 1st, October, 2007 are saved in file
oper-20071001.log. The size of each log file cannot exceed 300 MB. If the operation logs in one day are
13-4
Page 95

too large, they will be saved in multiple log files, with the name sys-date.log.n respectively, where a
larger value of n indicates that the logs are generated earlier. The latest operation logs in one day are
saved in file oper-current.log.
The functions provided by the operation log module are listed in the following table:
Table 13-3 Operation log functions
Function Description
Displaying Recent Logs Displays the recent operation logs.
Querying Operation Logs Allows you to query the operation logs based on different conditions.
Deleting Operation Logs Allows you to delete the specified operation log files from the disk.
Backing Up Operation Logs
Displaying Recent Logs
Select Log Management > Opera tion Logs > Recen t Logs to enter the p age as shown in Figure 13-5.
This page displays the recent 25 operation logs.
Figure 13-5 Recent operation logs
Allows you to back up the specified operation log files to the local host in the
format of CSV.
Table 13-4 describes the fields for displaying the recent logs.
Table 13-4 Fields for displaying the recent logs
Item Description
Time
Module
Time when an operation log was generated
Module to which an operation log belongs
13-5
Page 96

Item Description
Type of the client where an operation log was generated, including the following:
z Web: Operations performed on the Web interface
Client Type
z Console: Operations performed on the console port
z Telnet: Operations performed when a user telnets the device from a remote
client
z SSH: Operations performed when a user connects to the device using SSH from
a remote client
User The user that performs the operation
IP Address IP address of the user that performs the operation
The result of an operation, including:
Operation Result
Log Content
z succeeded
z failed
Content of a log
Click Export to CSV, and a popup window appears. You can display the log contents in the format of
CSV, or save them in the format of CSV locally.
z If you select the Refresh every seconds checkbox, the system will automatically refresh th e l o gs
in the specified interval; if you click the Refresh Now button, you can refresh the latest logs
manually.
z To display the logs in the order defined by the title items, click the title items in the log information
table.
Return to
Operation log functions.
Querying Operation Logs
Select Log Management > Operation Logs > Query Logs to enter the page for querying operation
logs, as shown in
conditions.
Figure 13-6. The page allows you to query operation logs based on different
13-6
Page 97

Figure 13-6 Query operation logs
After setting the username, IP address and time range of the operation logs to be que ried,
z Click Export to CSV, and a popup windows appears. You can open the operation logs or save
them locally in the format of CSV.
z To display all the operation logs matching the query condition, click Query. The detailed
description of the information is as shown in
Table 13-4.
To display the logs in the order defined by the title items, click the title items in the log information table.
Return to
Operation log functions.
13-7
Page 98

Deleting Operation Logs
Select Log Management > Operation Logs > Delete Logs to enter the page for deleting operation
logs, as shown in
Figure 13-7 Delete operation logs
Select the checkbox before the operation log files to be deleted, and then click Delete to delete the
corresponding operation log files.
Figure 13-7.
Return to
Operation log functions.
Backing Up Operation Logs
Select Log Management > Operation Logs > Back up Logs to enter the page for backing up
operation logs, as shown in
Figure 13-8 Back up operation logs
Select the operation log files to be backed up, and then click Back Up to back up the operation log file s
to the local host in the format of CSV.
Return to
Operation log functions.
Attack Logs
Attack Logs Overview
Figure 13-8.
The system analyzes and archives the attack event s occurred durin g device running to generate att ack
logs and saves them in the database. Attack logs enable you to monitor the device running status and
diagnose network device faults.
The functions provided by the attack logs module are listed in the following table:
13-8
Page 99

Table 13-5 Attack logs functions
Function Description
Displaying Recent Logs Displays the recent attack logs.
Querying Attack Logs Allows you to query the attack logs based on different conditions.
Deleting Attack Logs Allows you to delete the specified attack logs.
Displaying Recent Logs
Select Log Management > Attack Logs > Recent Logs to enter the page for displaying recent logs.
This page displays the recent 25 block logs or alert logs, as shown in
respectively.
Figure 13-9 Recent block logs
Figure 13-9 and Figure 13-10
Figure 13-10 Recent alert logs
Table 13-6 describes the fields for displaying the recent logs.
Table 13-6 Fields for displaying the recent logs
Item Description
ID of an attack
Attack ID
Click the link corresponding to the ID, and you can enter the page for modifying the
IPS policy rule that the attack matches.
Time
Attack Name
Segment
Time when an attack was performed
Name of the rule that an attack matches.
Click the link corresponding to the attack name, and you can enter the page for
modifying the IPS policy rule that the attack matches.
Segment where the attack is generated
13-9
Page 100

Item Description
Direction
Src ID The source IP address of an attack
Dest IP The destination IP address of an attack
Src Port The source port of an attack
Dest Port The destination port of an attack
App Layer The application layer protocol corresponding to an attack
Hit Count Count of times that the attack is detected.
Severity
Packet Trace Packet Trace file name generated (with the download file link)
Direction of the attack: from inside to outside or from outside to inside.
Severity level of an attack, including the following:
z Emergency: The system is unavailable.
z Alert: Information that demands prompt reaction
z Warning: Warnings
z Informational: Informational information
Click Export to CSV, and a popup window appears. You can display the log contents in the format of
CSV, or save them in the format of CSV locally.
z Select the Refresh every seconds checkbox, and the system will automatically refresh the logs in
the specified interval; click the Refresh Now button, and you can refresh the latest logs manually.
z To display the logs in the order defined by the title items, click the title items in the log information
table.
Return to
Attack logs functions.
Querying Attack Logs
Select Log Management > Attack Logs > Query Logs to enter the page for querying attack logs, as
shown in
Figure 13-11. The page allows you to query attack logs based on different conditions.
13-10
 Loading...