


X16-1D
USB Accelerometer
Data Logger
User Manual
Document Revision: Rev B
Firmware Version: 1110
Date: March 22, 2016

Table of Contents
1 Introduction..........................................................................................................................................1
1.1 About This Manual..................................................................................................................1
1.2 Document Conventions............................................................................................................1
1.3 Appendix..................................................................................................................................1
1.4 Product Summary.....................................................................................................................2
1.5 Feature List..............................................................................................................................2
1.6 Items Included with X16-1D...................................................................................................3
1.6.1 Single Unit Purchase..........................................................................................................3
1.6.2 5 Unit Kit...........................................................................................................................3
1.7 Component Names...................................................................................................................4
1.8 Quick Start Guide....................................................................................................................5
2 Operation..............................................................................................................................................8
2.1 USB Interface...........................................................................................................................8
2.2 Memory Card...........................................................................................................................8
2.3 Battery......................................................................................................................................8
2.4 Setting The RTC.......................................................................................................................9
2.5 Status Indicators.....................................................................................................................11
2.6 System Configuration Options...............................................................................................11
2.6.1 deadband..........................................................................................................................12
2.6.2 deadbandtimeout..............................................................................................................13
2.6.3 dwell.................................................................................................................................13
2.6.4 microres............................................................................................................................14
2.6.5 rebootondisconnect..........................................................................................................14
2.6.6 samplesperfile..................................................................................................................14
2.6.7 samplerate........................................................................................................................14
2.6.8 starttime and stoptime......................................................................................................14
2.6.9 stoponvusb.......................................................................................................................15
2.6.10 statusindicators.................................................................................................................15
2.7 Example Configuration Files.................................................................................................15
2.7.1 Example A........................................................................................................................15
2.7.2 Example B........................................................................................................................15
2.7.3 Example C........................................................................................................................16
3 Data Interpretation.............................................................................................................................16
3.1 Data Files...............................................................................................................................16
3.2 Data Format...........................................................................................................................17
3.3 Data Conversion.....................................................................................................................18
4 System Details...................................................................................................................................18
4.1 Sensor.....................................................................................................................................18
4.1.1 Sensor Special Features...................................................................................................19
4.2 Operating and Storage Conditions ........................................................................................20
4.3 Dimensions............................................................................................................................20
5 Troubleshooting.................................................................................................................................21
6 Appendix............................................................................................................................................23
6.1 What is an Accelerometer......................................................................................................23
A

6.2 Using “R” to Analyze Data....................................................................................................25
6.2.1 What is “R”......................................................................................................................25
6.2.2 Introduction to R Commands...........................................................................................26
6.2.3 Online Resources for R....................................................................................................27
6.2.4 Example Scripts in R.......................................................................................................28
Index of Figures
Figure 1: X16-1D Data Logger..................................................................................................................2
Figure 2: X16-1D and Accessories............................................................................................................3
Figure 3: 5 Unit kit of Loggers..................................................................................................................3
Figure 4: X16-1D Data Logger Components.............................................................................................4
Figure 5: Exploded View of the X16-1D..................................................................................................4
Figure 6: Installing Battery........................................................................................................................5
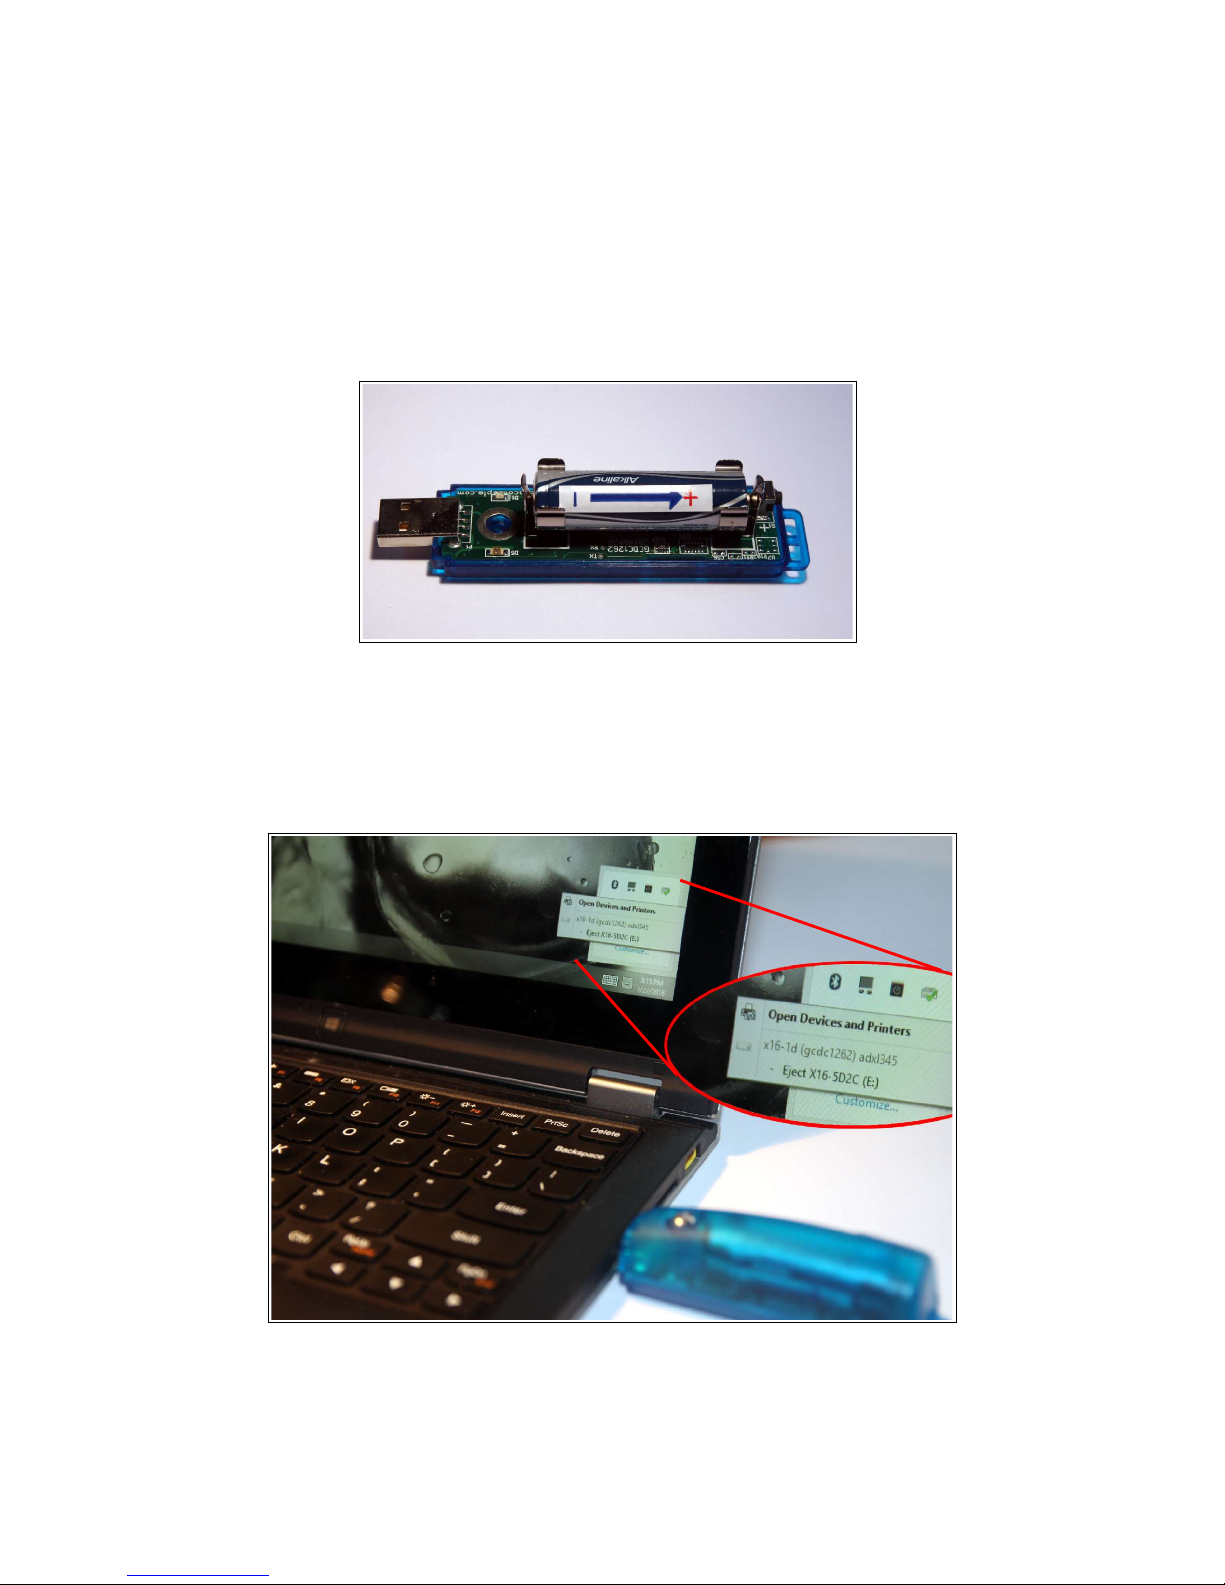
Figure 7: Connecting to PC........................................................................................................................5
Figure 8: Editing Config.txt File................................................................................................................6
Figure 9: Starting the X16-1D...................................................................................................................7
Figure 10: Sensor Orientation....................................................................................................................7
Figure 11: Expected Battery Life...............................................................................................................9
Figure 12: Example Time Entry in time.txt File.....................................................................................10
Figure 13: LED Status Indicators............................................................................................................11
Figure 14: Graphical Illustration of the Deadband Feature....................................................................13
Figure 15: Graphical Illustration of the Dwell Feature...........................................................................13
Figure 16: Configuration File Example A..............................................................................................15
Figure 17: Configuration File Example B..............................................................................................15
Figure 18: Configuration File Example C..............................................................................................16
Figure 19: Example Data File.................................................................................................................17
Figure 20: 800Hz sample configuration.................................................................................................20
Figure 21: Enclosure Dimensions...........................................................................................................20
Figure 22: Spring-mass Accelerometer...................................................................................................23
Figure 23: Simplified MEMS Accelerometer Design (L) and Actual MEMS Accelerometer (R).........24
Figure 24: R Command Line Interface ..................................................................................................25
Figure 25: RStudio Interface ..................................................................................................................26
Index of Tables
Table 1: Configuration File Tags and Descriptions..................................................................................12
Table 2: Data File Header Tags................................................................................................................17
Table 3: Example Data Conversion.........................................................................................................18
Table 4: Accelerometer Sensor Characteristics........................................................................................19
Table 5: Operating and Storage Conditions.............................................................................................20
B

1 Introduction
1.1 About This Manual
Thank you for purchasing the X16-1D accelerometer data logger. Gulf Coast Data Concepts spent
considerable efforts developing an easy to use data logger for the scientific researcher, student, or
hobbyist. Please read this manual to understand the operation and capabilities of the X16-1D. If the
logger fails to operate as expected, please refer to the troubleshooting guide (page 21).
1.2 Document Conventions
The quick start guide in section 1.8 provides a basic summary of operation to begin using the X16-1D
data logger. This user manual continues into further details of configurations and capabilities starting
in section 2. Each section also presents relevant tips and warnings to help the user.
This icon indicates a helpful tip that may enhance the performance of the logger or aide in
the application of the logger.
This icon indicates a warning, restriction, or limitation that the user should be aware of
regarding the logger operation.
1.3 Appendix
The appendices to this document include several educational discussions regarding accelerometers
(section 6.1) as well as software and analysis procedures (section 6.2). These short discussions will
help new users learn about the X16-1D and how to use the data.
Gulf Coast Data Concepts Page 1 X16-1D, Rev B
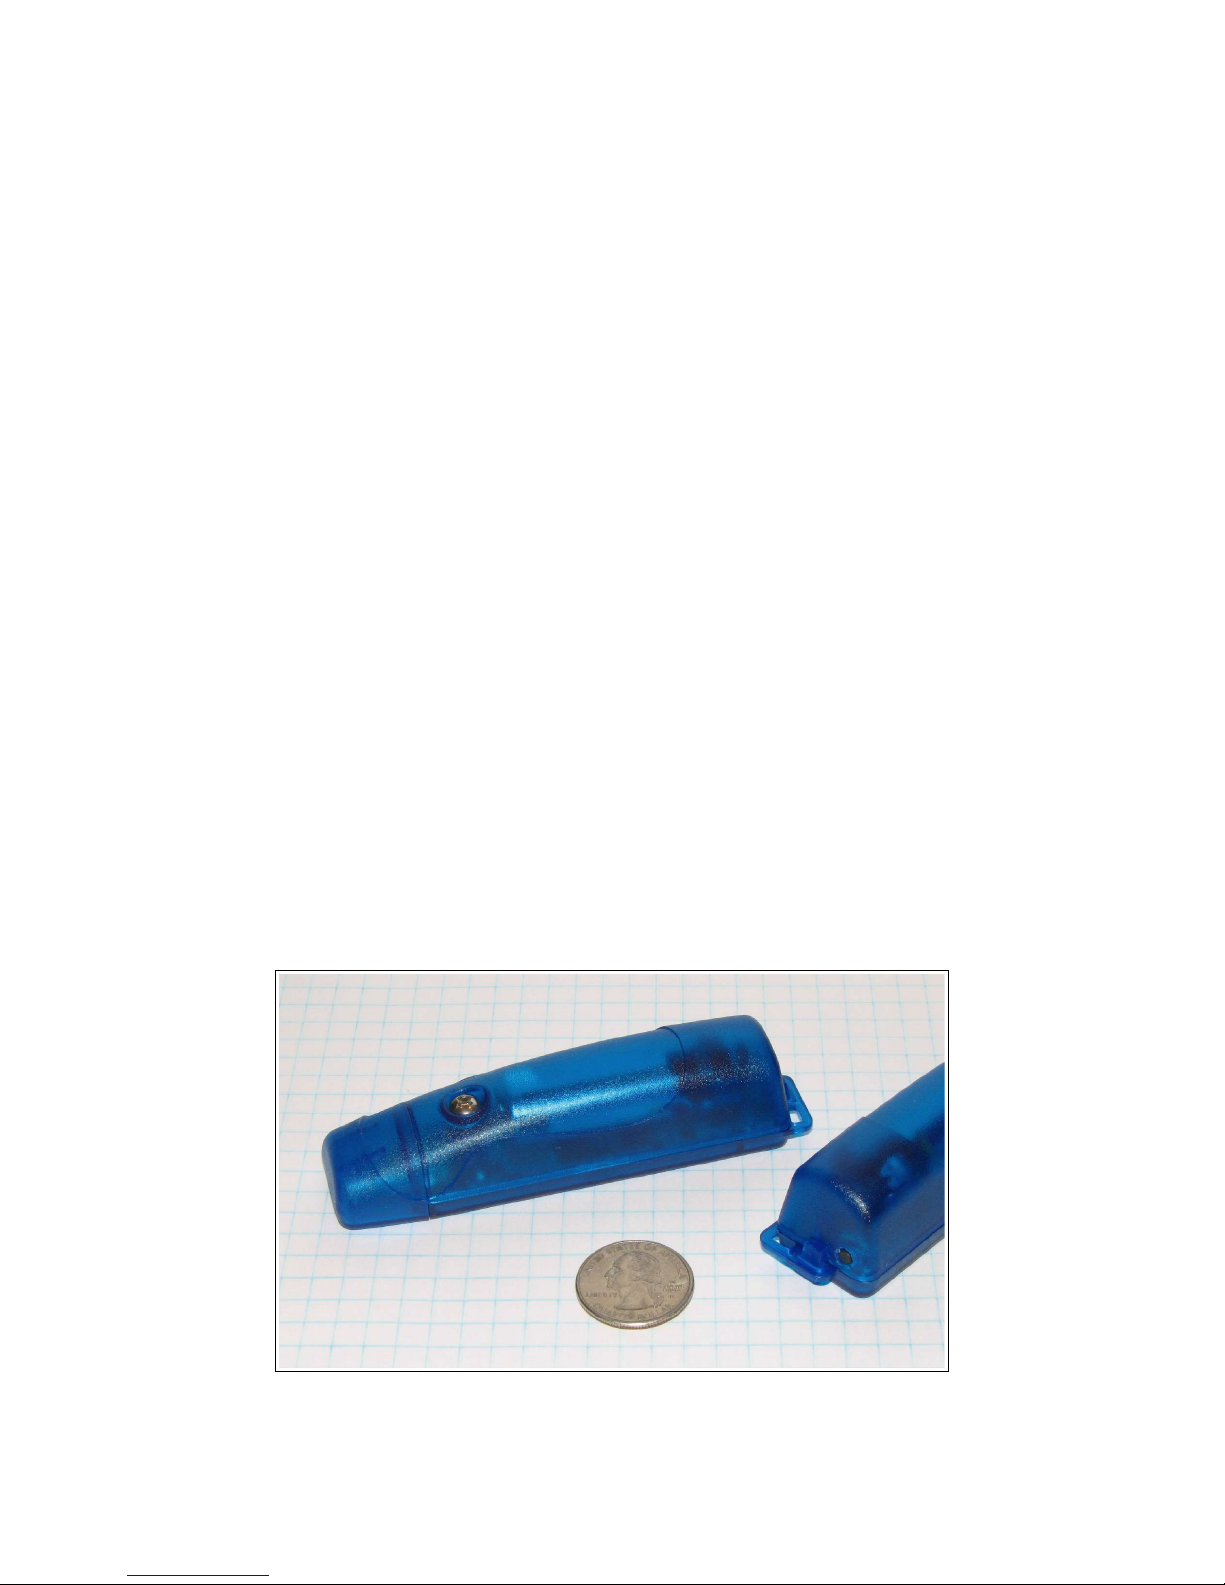
1.4 Product Summary
The X16-1D is a low cost and compact self-recording accelerometer data logger. Data from the digital
3-axis accelerometer sensor is time stamped using a real time clock and stored to a microSD card in
simple text format. When connected via the USB to a personal computer, the X16-1D appears as a
standard mass storage device containing the comma delimited data files and the user setup file. The
X16-1D is powered from a replaceable AA type alkaline battery (or LR6).
1.5 Feature List
• 3-axis ±16g accelerometer
• 16-bit resolution
• User selectable sample rate of 12, 25, 50, 100, 200, 400 Hertz
• Finite Impulse Response filter
• Accurate time stamped data using Real Time Clock (RTC)
• Convenient on/off button
• Data recorded to a removable microSD card (8GB included)
• Easily readable comma separated text data files
• Data transfer compatible with Windows or Linux via Universal Serial Bus (USB) interface (no
special software required)
• Uses a standard replaceable “AA” type alkaline battery
• Weight 2oz (55g) with alkaline battery
• Size 1x1x4.1 inch (26x26x104 mm)
Gulf Coast Data Concepts Page 2 X16-1D, Rev B
Figure 1: X16-1D Data Logger
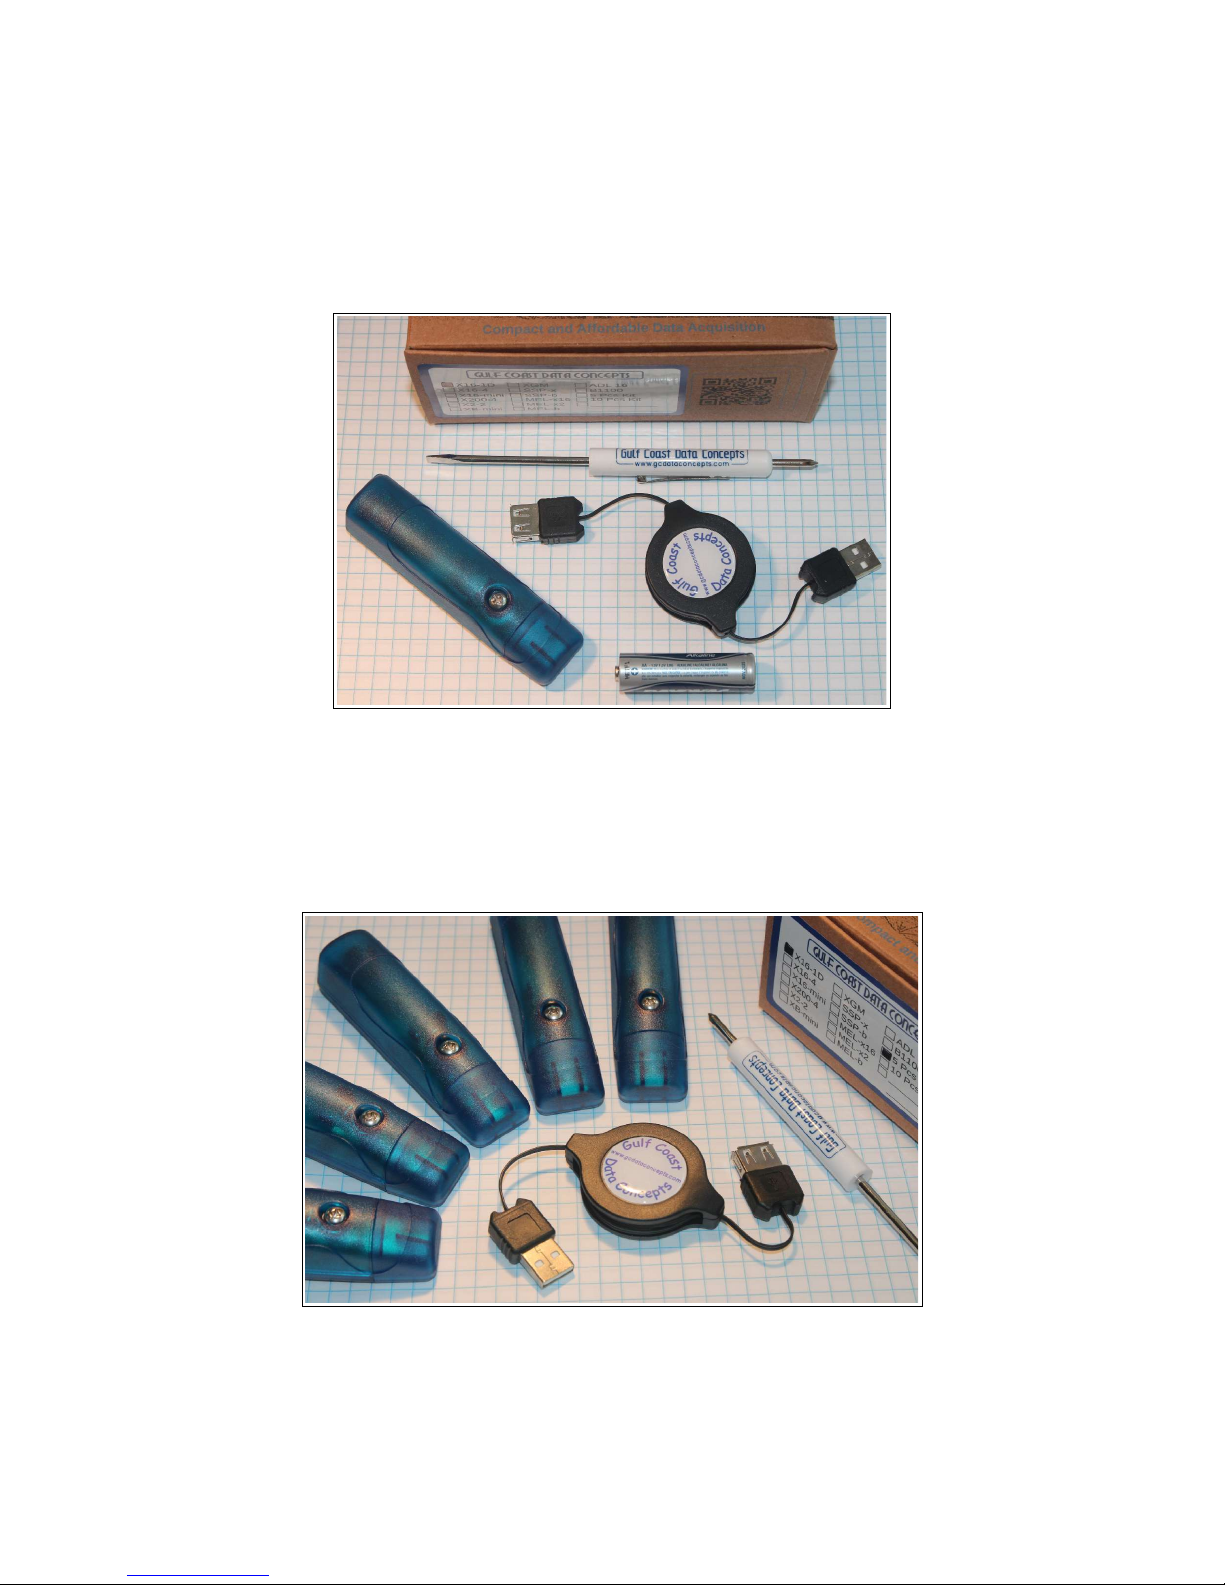
1.6 Items Included with X16-1D
1.6.1 Single Unit Purchase
The X16-1D is packaged with the logger, a USB extender cable, a screwdriver, and an AA
alkaline battery.
Figure 2: X16-1D and Accessories
1.6.2 5 Unit Kit
A kit includes 5 X16-1D loggers, a USB extender cable, and a screwdriver. Batteries are not
included with kits.
Figure 3: 5 Unit kit of Loggers
Gulf Coast Data Concepts Page 3 X16-1D, Rev B
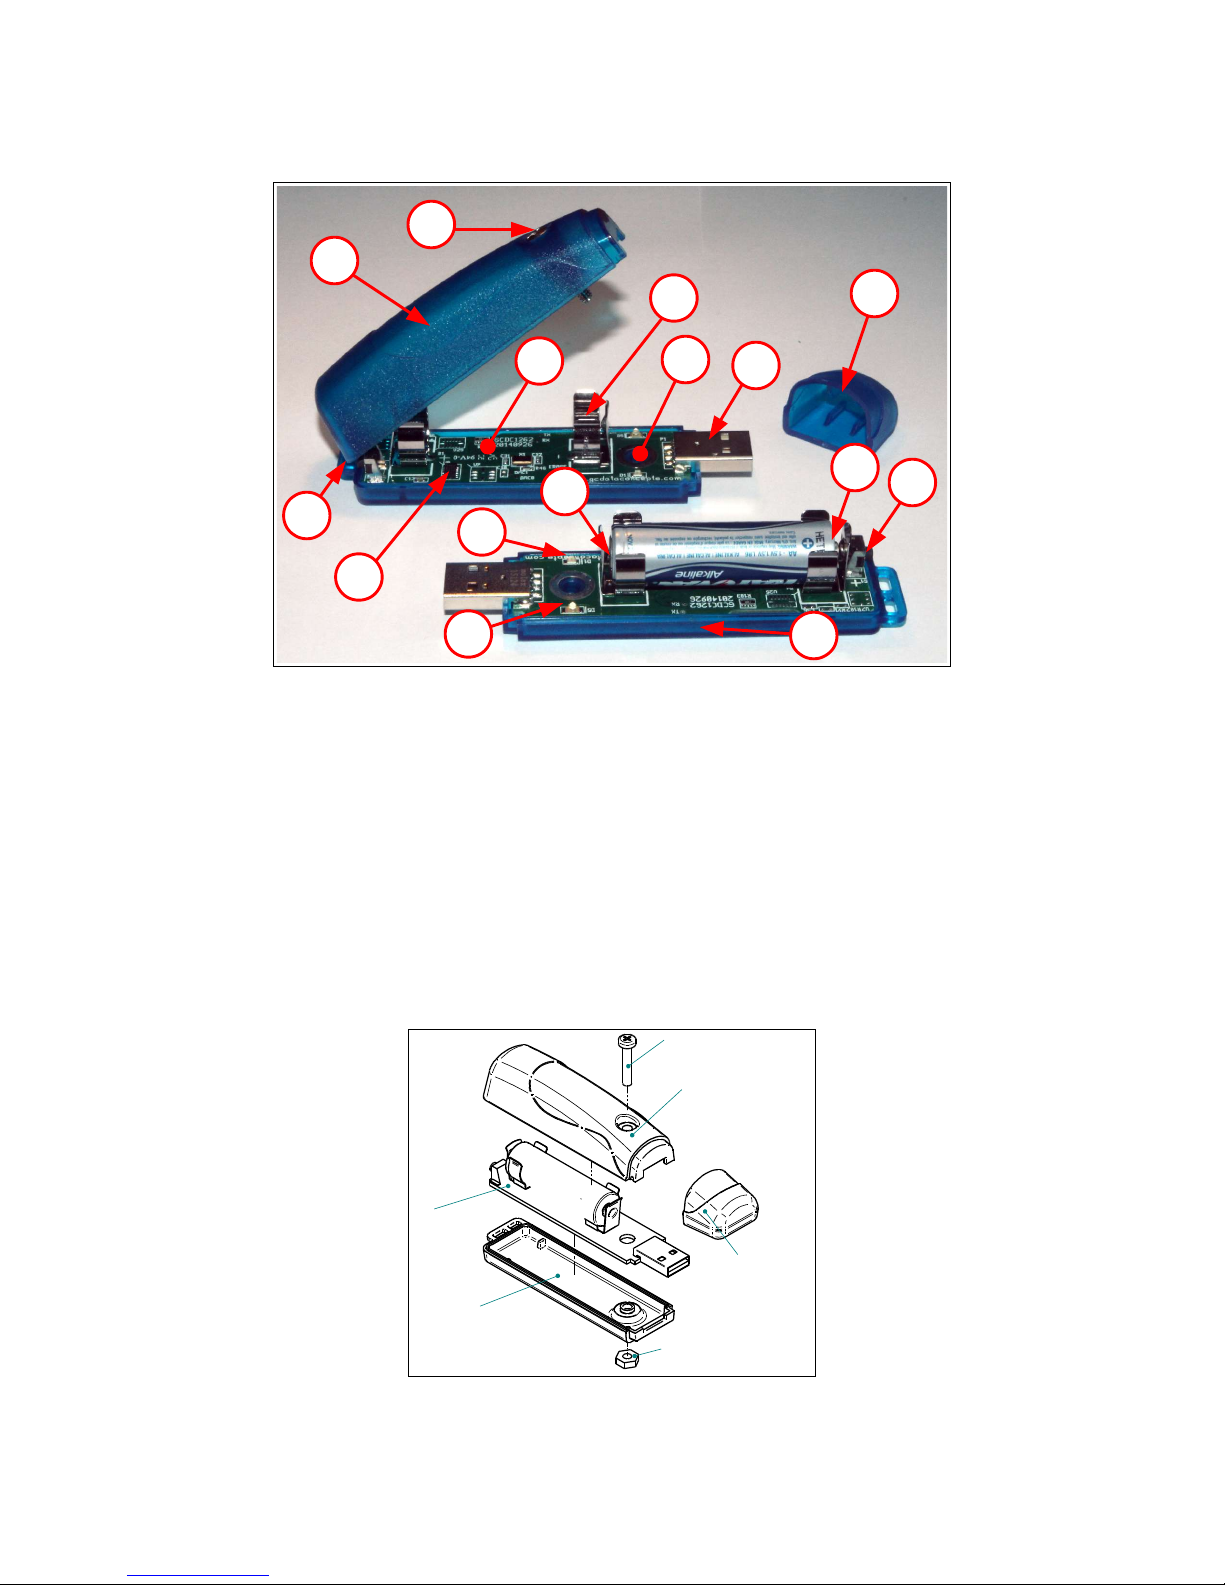
1.7 Component Names
0.75" Length
#6-32 Machine Screw
PCB Enclosure
(Top)
PCB Enclosure
(Cap)
Printed Circuit Board
PCB Enclosure
(Bottom)
#6-32 Hex Nut
M
I
D
K
H
N
A
F
L
B
O
C
Figure 4: X16-1D Data Logger Components
A Type-A USB connector I Enclosure top
B Blue LED status indicator J Enclosure bottom
C Red LED data indicator K Enclosure cap
D AA Battery holder L Enclosure hinge
E Positive terminal M #6-32 3/4” screw
F Negative terminal N #6 nut
G On/Off button O ADXL345 sensor
E
G
J
H MicroSD card (under circuit board)
Figure 5: Exploded View of the X16-1D
Gulf Coast Data Concepts Page 4 X16-1D, Rev B
1.8 Quick Start Guide
The X16-1D is a simple, economical solution to capture continuous motion data and quickly deliver the
information for analysis. The following instructions outline the steps to begin using the X16-1D.
Configuration settings and mounting methods will depend on the particular application.
Step 1: Disassemble the enclosure by unscrewing the #6 machine screw and opening the parts
like a clam shell. Place an AA type battery into the battery holder with the positive
battery terminal facing away from the USB connector. Reassemble the enclosure.
Figure 6: Installing Battery
Step 2: Plug the X16-1D into a computer and allow the computer operating system to register
the device as a Mass Storage Device. Notice that the logger will mount with a drive
label using the last digits of the serial number.
Gulf Coast Data Concepts Page 5 X16-1D, Rev B
Figure 7: Connecting to PC
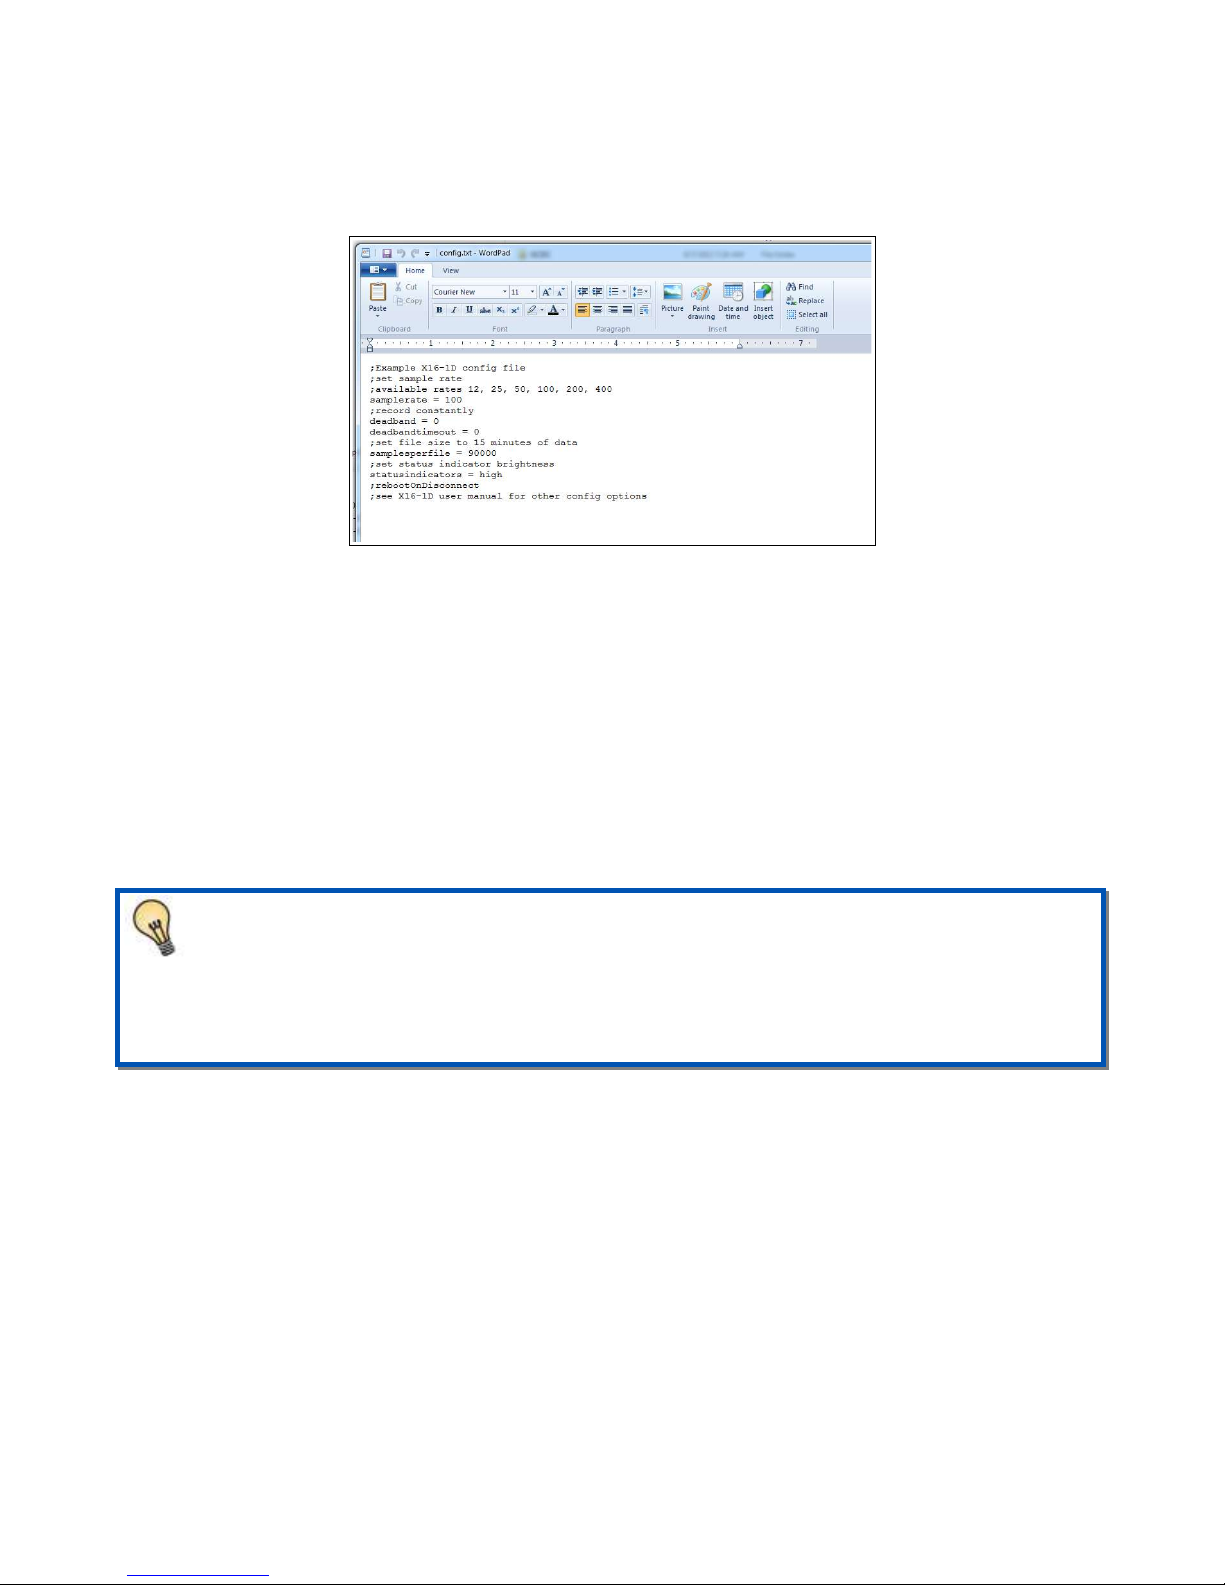
Step 3: Configure the X16-1D by editing the appropriate tags in the config.txt file using a
simple text editor. In Windows, do not use Notepad as the editor does not terminate new
lines properly. GCDC recommends Windows Wordpad or Notepad++ to edit the
config.txt file. Refer to section 2.6 for a complete list of configuration options.
Figure 8: Editing Config.txt File
Step 4: If necessary, initialize the RTC clock by creating a time.txt file (see section 2.4). Once
the time.txt file is saved, immediately unplug the logger to start the initialization
process. The logger will load the time.txt file, initialize the clock, and delete the time.txt
file. Initializing the RTC ensures the data files include the correct year, month, and day
and that the data samples can be correlated to a specific date and time.
Step 5: After removing from the USB port, attach the X16-1D logger to the target object. The
logger is small and light weight so double-sided tape, Velcro, or a spot of cyanoacrylate
glue are sufficient methods of attachment.
The X16-1D is small and light weight so attachment methods do not need to be
substantial. Double-sided tape, a spot of cyanoacrylate glue (contact cement), zip-ties,
magnetic base, or adhesive putty are example methods of attachment. These methods do
not cause adverse signal attenuation considering the relatively low frequency bandwidth
of the X16-1D logger. Command Poster Adhesive strips by 3M offer excellent temporary
attachment of the logger to most surfaces.
Step 6: Press the on/off button located at the rear of the enclosure to initiate data recording, (see
Figure 9). Logging will start about 3-5 seconds after pressing the button. The red LED
will blink as the configuration file is accessed. If the time.txt file is present, the RTC is
initialized with the time written in the file. Then, the blue LED will begin to blink at a 1
second interval indicating the system is operating. The red LED will blink periodically
as data is written to the microSD card.
Gulf Coast Data Concepts Page 6 X16-1D, Rev B
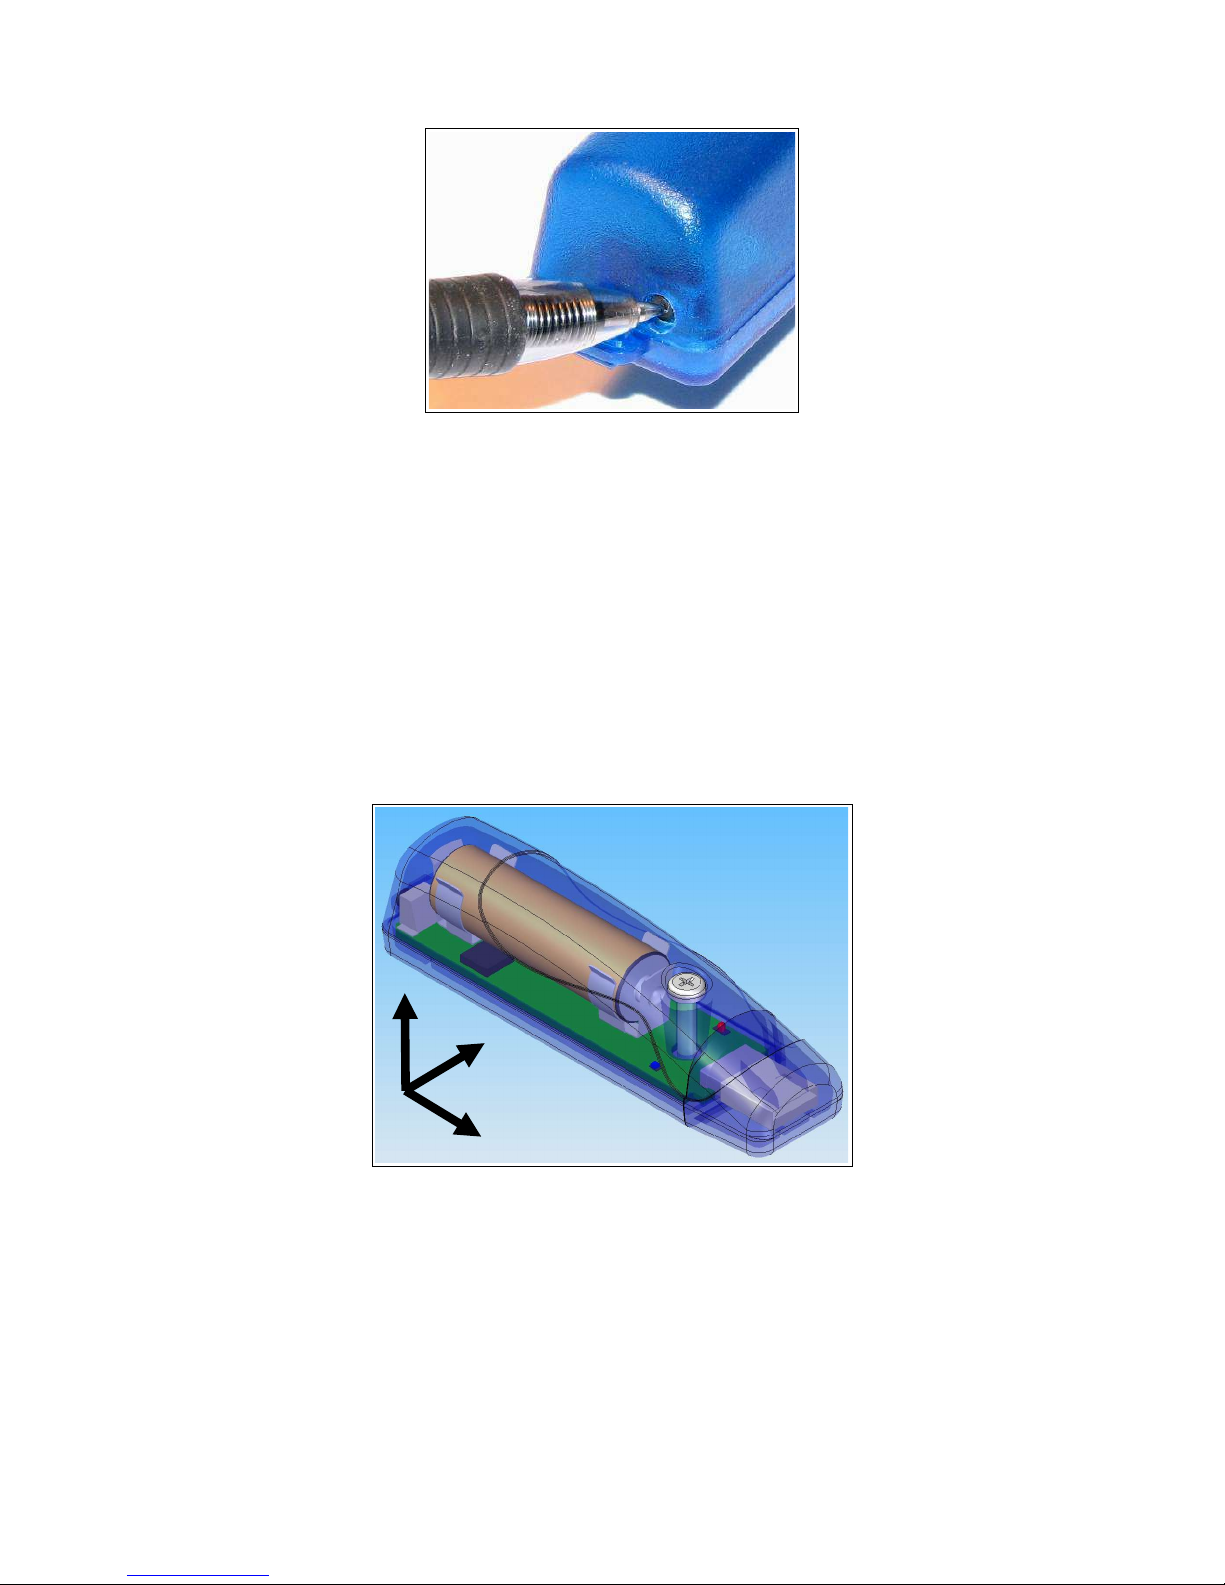
Figure 9: Starting the X16-1D
Step 7: To stop recording, press and hold the button for about 3 seconds. The red and blue
LEDs will begin to blink rapidly for 2 seconds and then turn off. Release the button and
the X16-1D turns off. Pressing the button again restarts the logger and data is recorded
to a new file.
Step 8: Plug the logger into a PC and allow the logger to mount as a USB drive. The data file
will appear in the “GCDC” directory.
Step 9: The data recorded to the files must be converted to determine acceleration in “g” units.
Divide the Ax, Ay, Az columns by 2048 to determine g units. See section 3.3 for a
complete discussion of data conversion.
Gulf Coast Data Concepts Page 7 X16-1D, Rev B
+Z
+Y
+X
Figure 10: Sensor Orientation

2 Operation
2.1 USB Interface
The X16-1D connects to a PC using a standard Type-A USB connector and supports the USB mass
storage device interface for file access and file transfers. Nearly all computer operating systems
recognize the X16-1D as a typical USB external memory drive. When connected to a PC, the X16-1D
deactivates logging and operates only as a USB interface to the microSD card. Note that some tablet
operating systems block access to USB mass storage devices and will not recognize the X16-1D.
2.2 Memory Card
The X16-1D stores data to a removable 8GB microSD flash memory card and is compatible with
microSD and microSDHC type cards. The logger needs only the config.txt file to operate. The X161D will use default configuration settings if the config.txt is not present. The “config.txt” and
“time.txt” files must occur in the root directory (see section 2.6 and section 2.4). The X16-1D will
create a folder called “GCDC”, if not already present, to place the data files.
Interrupting the power to the logger can result in corruption of the microSD card. For
example, removing the logger from the USB port during file transfers to the PC or
removing the battery during logging activity. Reformat the card if it becomes corrupted
(FAT32 file structure). If data transfers to/from the card become slow, consider formatting
the card using “SD Card Formatter” software provided by the SD Association
(www.sdcard.org).
2.3 Battery
The X16-1D is powered by a single “AA” sized battery. Gulf Coast Data Concepts recommends an
alkaline battery (ANSI type 15A or IEC type LR6) or lithium battery (ANSI type 15L or IEC FR6) to
operate the X16-1D. The battery is not used when the device is connected to a computer USB port.
The X16-1D will log constantly for approximately 48 hours at 50 Hz and approximately 28 hours at
100 Hz when using a standard alkaline AA battery. Figure 11 illustrates the expected continuous
logging time versus sample rate.
The RTC continues to operate from the battery when the device is “off”. The RTC should be
reinitialized if the battery is removed or completely depleted (see Section 2.4).
Use a lithium primary AA battery to improve low temperature performance and extend
operating time. The lithium chemistry has a wider operating temperature -40°F – 140°F
(-40°C – 60°C) and about 30% more capacity over a standard alkaline battery.
Gulf Coast Data Concepts Page 8 X16-1D, Rev B

A 5v supply via the USB connector provides extended operation of the device independent
of the internal battery. Common USB power adapters or USB battery packs for consumer
electronics can provide the required 5v supply. The logger does not implement power
saving features when connected to an external power supply so power consumption will
be higher than when using the AA battery.
The logger is always “on” maintaining the real time clock and will eventually discharge the
battery completely after several months. The discharged battery may leak chemicals and
corrode the electronics. Remove the AA battery prior to long term storage of the X16-1D.
The X16-1D is not compatible with NiMH type rechargeable batteries. The NiMH battery
delivers 1.2 volts nominally, which is near the voltage cut-off limit of the logger. The X161D will not operate very long or may activate at all.
2.4 Setting The RTC
A real time clock (RTC) integrated into the X16-1D determines the time for each line of data recorded.
The RTC is initialized using a user-created text file named “time.txt” located in the root directory of the
microSD card. This is a separate file from the config.txt file and it is needed only when initializing the
RTC. The system looks for the time.txt file upon booting. If the file exists, the time stored in the file is
loaded to the RTC and the time.txt file is deleted. The time information in the time.txt file must be in
Gulf Coast Data Concepts Page 9 X16-1D, Rev B
Figure 11: Expected Battery Life

the exact “yyyy-MM-dd HH:mm:ss” 24-hour format, occur on the first line, and end with a newline
character. Figure 12 provides an example time.txt file that will initialize the RTC to 2:26:30 pm June
16, 2014.
The time file method of setting the RTC does not require special communication drivers so it can be
implemented using a simple text editor. Direct initialization of the RTC is possible but requires
specific device drivers and software from Gulf Coast Data Concepts.
The RTC maintains ±50ppm accuracy (-40°C to +85°C), which means that the accuracy may drift
about 4 seconds every day. The RTC is powered by the battery at all times, even when the logger is
“off”.
Figure 12: Example Time Entry in time.txt File
Initializing the RTC ensures that the start time and individual time stamps can be
correlated to an absolute time – the year, month, day, hour, minute, second, and fractional
second. An uninitialized RTC or reset of the RTC will lead to indeterminate start time
recorded in the data file header.
After unplugging the logger from the USB port, the logger will load the config.txt file and
time.txt file, if present. Therefore, there is a delay between when the time.txt was created
and when the logger actually loads the time information. For most applications, this simple
method of initializing the clock results in sufficient accuracy.
Initialization of the RTC is limited to +/-1 second. The RTC register that handles the
fractional seconds counter is not accessible so the initialization process can not reset the
seconds to an even value.
Gulf Coast Data Concepts Page 10 X16-1D, Rev B

2.5 Status Indicators
System status is indicated by the two LEDs located near the USB connector. The blue LED indicates
system operation and blinks once per second to indicate a properly operating system. The blue LED
blinks when the X16-1D is recording data, in standby mode, or is connected to a computer via the USB
port. The red LED blinks when data is written or read from the microSD memory card. In data
logging mode, the period at which the red LED blinks depends on the sample rate and other
configuration settings. The LEDs will flicker during user initiated shutdown. The “statusindicators”
tag in the configuration file turns off or changes the brightness of the status indicators (see section
3.2.4.10).
Figure 13: LED Status Indicators
2.6 System Configuration Options
The X16-1D is configured using a set of tags and settings stored in a text file named “config.txt”,
which is located in the root directory of the microSD card. The system reads the configuration file at
boot time. Table 1 lists the configuration file tags. A tag is followed by an equal sign (“=”) and an
applicable tag setting. A line finishes with a newline character. Tags are not case sensitive. Tab and
space characters are ignored. Lines starting with a semicolon (“;”) are treated as comments and
ignored by the system. The system will use the default settings listed in Table 1 if the config.txt file is
not found.
Do not use the Windows Notepad editor because it does not terminate new lines properly.
GCDC recommends Windows Wordpad or Notepad++ to edit the config.txt file.
Gulf Coast Data Concepts Page 11 X16-1D, Rev B

Table 1: Configuration File Tags and Descriptions
Tag Valid Settings Default Description
deadband An integer between
0 and 16384
deadbandtimeout An integer between
0 and 65535
dwell An integer between
0 and 65535
microres - Off The presence of this tag sets the device to record
rebootondisconnect - off on disconnect The presence of this tag causes the system to start
samplesperfile An integer greater
than 0
samplerate 12, 25, 50, 100,
200, 400
starttime and stoptime See section 2.6.8 - Defines when to start and stop recording
stoponvusb - Off Stops data logging if 5v USB power is present (see
statusindicators “Normal”, “High”,
“Off”
0 Sets the deadband to a range expressed in “counts”.
A new sample is recorded if any sensor axis
exceeds the previous recorded reading by the
deadband value
3 Specifies the period in seconds when a sample is
recorded regardless of the deadband setting. This
feature ensures periodic data is recorded during
very long periods of inactivity.
1 The number of samples recorded after a deadband
threshold triggered event
time stamps with 0.1ms effective precision.
recording after disconnect from a USB port.
90000 The number of lines of data per data file before a
new file is created
100 Sets the rate at which data is collected and recorded
to the microSD card.
section 2.6.9)
Normal LED status indicators can be activated with normal
brightness (Normal), activated with high brightness
(High), or completely deactivated (Off).
2.6.1 deadband
“deadband” defines the minimum difference between recorded sensor readings. A new sample from
the accelerometer sensor must exceed the previous recorded reading before the logger records the data.
The deadband setting is expressed in "counts" units and is applied to the output of each axis. The
deadband value can be set to an integer between 0 and 32767. The deadband function is an effective
way to reduce the amount of data collected by defining the granularity of the data.
The deadband functions as a event threshold limit when used in conjunction with the “dwell” feature.
Figure 14 illustrates the deadband feature filtering out small changes in acceleration from the recorded
data. Only when the deadband limit is exceeded will a new data sample be pushed to the file. Note
that this feature will result in samples with inconsistent time periods. Therefore, the data sets should be
re-sampled to establish uniform time periods.
Gulf Coast Data Concepts Page 12 X16-1D, Rev B

Figure 14: Graphical Illustration of the Deadband Feature
2.6.2 deadbandtimeout
“deadbandtimeout” defines the period in seconds when a sample is recorded by the logger regardless of
the deadband setting. This feature ensures periodic data is recorded during extended periods of
inactivity. A valid setting for the deadbandtimeout is an integer between 0 and 16384.
2.6.3 dwell
Use “dwell” together with “deadband” to create an event trigger configuraion. The “dwell” tag defines
the number of consecutive samples recorded at the set sample rate after a deadband threshold event.
The deadband threshold event occurs when a sensor reading exceeds the last recorded value by the
deadband setting. A valid dwell setting is an integer between 0 and 65535. See section 2.7.2 for an
example implementation of the deadband/dwell features.
Figure 15: Graphical Illustration of the Dwell Feature
Gulf Coast Data Concepts Page 13 X16-1D, Rev B

2.6.4 microres
The “microres” option sets the device to record time stamps with 0.1ms precision. In micro-resolution
mode, the time stamps are recorded as XX.YYYYZZ where XX are seconds, YYYY are 0.1
milliseconds, and ZZ are spurious digits beyond the precision capability. The micro-resolution option
should be implemented at sample rates greater than 200 hertz to provide the best timing precision.
Micro-resolution is best suited for applications requiring precise timing, such as vibration
analysis, and is recommended for sample rates above 200 Hz. The standard timing
precision (default) of 1 milli-second is suitable for most general applications, such as
monitoring human motion.
2.6.5 rebootondisconnect
The X16-1D incorporates an on/off button for initiating and terminating the data recording process.
Data recording is automatically started upon disconnect from a computer USB port if the tag word
“rebootondisconnect” is included in the configuration file.
2.6.6 samplesperfile
“samplesperfile” defines the number of data lines each file can have before a new file is created. This
tag controls the size of the data files into easily manageable lengths for later processing. This setting is
loaded as a signed 32-bit integer, which can translate into very large data files. The user should
exercise caution before setting large files and test the end-user software application for data limitations.
2.6.7 samplerate
The “samplerate” tag defines the data rate in Hertz, or samples per second. Valid sample rate settings
are 12, 25, 50, 100, 200, and 400 Hz. See section 4.1 for special features regarding the sample rates.
2.6.8 starttime and stoptime
The X16-1D starts and stops data recording based on the times defined using the “starttime” and
“stoptime” tags. The times must be in “MM HH DD” 24-hr format with the three entries separated by
a space. Entries marked with “*” operate as a wild card. The X16-1D continues to record after the
start time unless defined otherwise by the stoptime tag. Note that the configuration option does not
include the month. Example timing configurations:
Example 1: On the 15th day, start recording at 12:30pm and
stop recording at 6:00pm.
starttime = 30 12 15
stoptime = 00 18 15
Example 2: Start recording at the beginning of every hour
and stop recording 45 minutes later.
starttime = 00 *
stoptime = 45 *
Gulf Coast Data Concepts Page 14 X16-1D, Rev B

2.6.9 stoponvusb
The “stoponvusb” tag stops data logging operations when a 5v supply is detected on the USB
connector. Without the stoponvusb option (default), the device switches power from the internal
battery to the USB 5v and continues to log data.
2.6.10 statusindicators
The brightness intensity of the LED status indicators is defined using the “statusindicators” tag and
valid settings of “normal”, “high”, and “off”.
2.7 Example Configuration Files
2.7.1 Example A
The following configuration records data at 100 hertz. Deadband and deadbandtimeout are set to zero
so the logger will record constantly at the set sample rate. Each data file is 90,000 lines long, which is
15 minutes of data. The status indicators are set to high brightness. The logger is activated with the
on/off button (notice “rebootondisconnect” is not active).
;Example X16-1D config file
;set sample rate
;available rates 12, 25, 50, 100, 200, 400
samplerate = 100
;record constantly
deadband = 0
deadbandtimeout = 0
;set file size to 15 minutes of data
samplesperfile = 90000
;set status indicator brightness
statusindicators = high
;rebootOnDisconnect
;see X16-1D user manual for other config options
Figure 16: Configuration File Example A
2.7.2 Example B
The deadband and dwell settings configure the device to record at least 5 seconds of data when a
change greater than 0.1g is detected. The deadbandtimeout setting forces a sample write every hour.
; Example X16-1D Config file
; set to 25Hz
samplerate = 25
; trigger at 0.1g
deadband = 100
; record 5 seconds of data
dwell = 125
;force a write every hour
deadbandtimeout = 3600
; set file length
samplesperfile = 30000
; LEDs on
statusindicators = normal
Figure 17: Configuration File Example B
Gulf Coast Data Concepts Page 15 X16-1D, Rev B

2.7.3 Example C
The logger must be turned on with the on/off button. It will enter a standby mode (blue LED blinks)
while it waits for the start time. The logger will start recording at 10:30am and turn off at 2:00pm. The
logger will record constantly at 400Hz and create 51 data files in the 3.5 hours. The micro-resolution is
activated to provide the best timing precision at the 400 Hz sample rate.
; Example X16-1D Config file
; set to 400Hz
samplerate = 400
; activate precision timing
microres
; record constantly
deadband = 0
deadbandtimeout = 0
; set file length
samplesperfile = 100000
; set logger to turn on with clock
starttime = 30 10
stoptime = 00 14
; LEDs on
statusindicators = normal
Figure 18: Configuration File Example C
3 Data Interpretation
3.1 Data Files
The X16-1D creates a new data file when the system is booted or when the maximum number of data
lines is reached in the previous data file. A system boot condition occurs when the on/off button is
pressed, 5v power is restored to the system via the USB connector, or when the X16-1D is removed
from a computer USB port with the “rebootondisconnect” feature enabled. Data files are placed in a
folder named “GCDC” and are named data-XXX.csv, where XXX is a sequential number starting with
001. The system will create up to 999 files. At the beginning of each file, a header is written
describing the system configuration and the current time when the file was created. Figure 19
represents an example data file.
A short gap in data may occur between sequential files as data is purged from the cache
and a new file is allocated on the microSD card.
Gulf Coast Data Concepts Page 16 X16-1D, Rev B

;Title, http://www.gcdataconcepts.com, x16-1d, ADXL345
;Version, 1110, Build date, Dec 30 2015, SN:CCDC4016131F31B
;Start_time, 2016-01-04, 10:25:14.000
;Temperature, -999.00, deg C, Vbat, 1444, mv
;SampleRate, 100,Hz
;Deadband, 0, counts
;DeadbandTimeout, 0,sec
;Headers, time,Ax,Ay,Az
0.003,799,650,-1773
0.013,805,661,-1808
0.023,766,687,-1844
0.033,790,670,-1818
0.042,801,663,-1808
0.052,769,657,-1786
0.062,790,683,-1795
0.072,813,719,-1853
0.081,824,670,-1784
Figure 19: Example Data File
3.2 Data Format
Data is written to files in comma separated text format starting with the file header information and
followed by event data entries. Table 2 lists the valid header tags, although not all tags may occur in
the header. Each data line contains a time entry and the raw accelerometer sensor readings from the X,
Y, and Z axes. The time entry is seconds elapsed from the start time recorded in the header. Add the
elapsed time to the start time to determine the complete date and time of the sample.
The last line of the final data file records the reason for the termination, such as “shutdown: switched
off”, “shutdown: low battery”, “shutdown: max files exceeded”, “shutdown: vbus disconnect”, or
“connected to computer”. The line is designated as a comment with a semicolon (“;”).
Table 2: Data File Header Tags
Tag Description
Deadband A new sample from the sensor must exceed the last reading by the
deadband value
DeadbandTimeout The period in seconds when a sample is recorded regardless of the
deadband setting
Headers The names of each column of data in the file
SampleRate Rate at which data is recorded to the microSD card
Start_Time The current time when the data file was created
Temperature Not supported on X16-1D, reports -999
Title The name of the USB Accelerometer X16-1D unit and sensor type
Vbat Battery voltage measured at the file start time
Version The version control information of the firmware, including unique
serial number
Gulf Coast Data Concepts Page 17 X16-1D, Rev B

3.3 Data Conversion
The X16-1D records the raw digital data from the accelerometer sensor. This helps reduce processor
load, increase sample rate capability, and avoids data errors due to floating point calculations. The 16bit data, or 65536 discreet counts, covers the full range of the +/-16g sensor. Therefore, the conversion
factor is 65536 / 32 = 2048 counts/g.
Table 3 lists the converted data using the example raw data in Figure 19.
Table 3: Example Data Conversion
Raw Data (Low Gain) Converted Data
Time Ax Ay Az Time Ax (g) Ay (g) Az (g)
0.003 799 650 -1773 01/04/2016 10:25:14.003 0.390137 0.317383 -0.865723
0.013 805 661 -1808 01/04/2016 10:25:14.013 0.393066 0.322754 -0.882813
0.023 766 687 -1844 01/04/2016 10:25:14.023 0.374023 0.335449 -0.900391
0.033 790 670 -1818 01/04/2016 10:25:14.033 0.385742 0.327148 -0.887695
0.042 801 663 -1808 01/04/2016 10:25:14.042 0.391113 0.323730 -0.882813
0.052 769 657 -1786 01/04/2016 10:25:14.052 0.375488 0.320801 -0.872070
0.062 790 683 -1795 01/04/2016 10:25:14.062 0.385742 0.333496 -0.876465
0.072 813 719 -1853 01/04/2016 10:25:14.072 0.396973 0.351074 -0.904785
0.081 824 670 -1784 01/04/2016 10:25:14.081 0.402344 0.327148 -0.871094
To determine acceleration in g's, divide the raw data by 2048. A “g” is 32.174 ft/sec2 or
9.807 m/sec2.
4 System Details
4.1 Sensor
The X16-1D uses the Analog Devices ADXL345 3-axis digital accelerometer sensor, which is based on
micro-electro machined semiconductor technology (MEMS). This accelerometer sensor is similar to
those used in cellphones, laptops, hard drives and other consumer electronics. Appendix 6.1 describes
how a MEMS accelerometer sensor works. Table 4 lists the basic sensor and logger performance
parameters but refer to Analog Devices for detailed sensor specifications.
Gulf Coast Data Concepts Page 18 X16-1D, Rev B

Table 4: Accelerometer Sensor Characteristics
Parameter Condition Min Typical Max Units
Acceleration range ±16.0 g
Sensitivity 2048 count/g
Sensitivity Deviation ±1.0 %
Nonlinearity X, Y, Z axis ±0.5 %FS
Zero-g Offset Level
Accuracy
Inter-Axis Alignment Error
Cross-Axis Sensitivity
X, Y axis -150 +150 mg
Z axis -250 +250 mg
±0.1 Degrees
±1 %
The ADXL345 accelerometer sensor “pushes” data to the logger at selected rates based on a clock
internal to the sensor. The sensor's clock precision and drift are undefined. For example, a selected
sample rate of 50 Hz may actually push data at 52 Hz. The X16-1D incorporates a precise real time
clock to independently time stamp the data as it leaves the sensor and to ensure that accurate timing is
recorded to the data file. Therefore, the time stamps should be used as the reference for determining
the actual sample rates.
The accelerometer sensor is based on microelectromechanical systems (MEMS)
technology and is not affected by magnetic fields. Glue a magnet to the bottom of the
plastic enclosure to facilitate easy attachment to iron surfaces.
The MEMS accelerometer sensor will detect the acceleration of gravity, which is a
convenient feature for validating the sensor operation. Setting the logger on a flat level
surface will result in -2048 counts (-1g) in the z-axis.
4.1.1 Sensor Special Features
The X16-1D implements an 8X over-sample and finite impulse response (FIR) filter algorithm at
sample rates up to 400Hz. This means that the digital accelerometer sensor provides 8X the sample
rate requested in the config.txt file. For example, “samplerate=400” sets the sensor to stream at 3200
Hz, which is the maximum capability of the ADXL345. The eight samples are averaged and processed
through the FIR filter to improve the response characteristics. The oversampling and FIR algorithm
increases the sensor's native 13-bit resolution to the 16-bit data recorded in the data file.
The X16-1D will support sample rates of 800, 1600, and 3200 Hz but the X16-1D deactivates the
oversampling and FIR filter and records the native 13-bit resolution from the sensor. However, these
sample rates are not guaranteed and the time stamps may become inaccurate or the logger operation
could become unstable. Performance is dependent on the microSD card capability.
Figure 20 shows an example configuration setting the logger to record at 800 Hz. The 13-bit data from
the sensor is right padded (LSB) into a 16-bit value to maintain consistency with the oversampled data.
Therefore, the conversion factor is still 2048 counts/g.
Gulf Coast Data Concepts Page 19 X16-1D, Rev B

; Example X16-1D Config file
1.01
1.04
4.10
; set to 800Hz
samplerate = 800
; record constantly
deadband = 0
deadbandtimeout = 0
; set file length
samplesperfile = 100000
; set logger to turn on with clock
statusindicators = normal
Figure 20: 800Hz sample configuration
4.2 Operating and Storage Conditions
The X16-1D is protected from general handling conditions by the plastic enclosure but is not protected
from adverse environmental conditions, such as rain, sweat, splashes, and water submersion. The
temperature range is limited primarily by the AA battery capabilities.
Table 5: Operating and Storage Conditions
Parameter Value
Temperature Range (alkaline battery) -0°F ~ 130°F (-18°C ~ 55°C)
Relative Humidity (alkaline battery) <90%
4.3 Dimensions
The X16-1D electronics are enclosed in a three-part semi-transparent blue plastic enclosure. The top
and bottom enclosure components and the printed circuit board are secured together with a 0.75” long
#6-32 screw and nut. A slip-on cap protects the USB connector. The X16-1D weighs 2oz (55g) with an
alkaline battery.
Gulf Coast Data Concepts Page 20 X16-1D, Rev B
Figure 21: Enclosure Dimensions

5 Troubleshooting
Problem Resolution
I press the on/off button but the logger does not
appear to activate and no LEDs blink.
I press the on/off button, the blue LED blinks
once per second but the red LED does not indicate
logging.
The blue LED blinks slowly. The microSD card is not present or is corrupted.
I press the on/off button but the logger records
only for a short period of time.
The logger seems to ignore the config.txt file and
use default settings.
Install a new battery.
The logger could be operating correctly but the
status indicators are turned off. Check the
“statusindicator” option in the config.txt file.
The deadband setting is set too high and the
logger is waiting to detect an event.
The logger is in standby mode waiting for a start
time to occur. Check the config.txt file for the
start/stop settings.
Check that the card is inserted properly and the
card is not corrupted.
Install a new battery.
The microSD card is full and data files must be
deleted.
Check that the config.txt file is properly formatted
and not corrupted. Each setting should occur on a
separate line.
The blue LED blinks irregularly and/or the red
LED stays lit. The logger will not mount to a PC.
Some IT organizations implement an automatic
encryption of all removable media devices. This
will encrypt the config.txt file and the logger will
not be able to access the file. Do not allow
encryption of the device.
The logger is unstable due to a configuration
problem. Remove the microSD card and use a
card reader to access the config.txt file. Edit the
config.txt file such that samplerate is 400 Hz or
less. Re-install the microSD card. Pull and
replace the battery to reset the system. Press the
on/off button and the logger will return to normal
operation.
Gulf Coast Data Concepts Page 21 X16-1D, Rev B

Problem Resolution
I plug the logger into a USB port but the PC does
not indicate an external drive present.
The microSD card is not present in the logger or
is not inserted properly. Remove and reinsert the
card to ensure that the card is correctly seated into
the card holder.
The microSD card is corrupted or damaged.
Reformat the card or replace the card.
The on/off button could be jammed in the plastic
enclosure and the logger is stuck in the “off” state.
Check that the button moves freely and “clicks”
when pressed.
The USB connection could be faulty or the
extender cable (if present) could be faulty.
Remove the extender cable and plug the logger
into another USB port.
The start time in the data file header is incorrect. Initialize the RTC.
The Z-axis data is missing in the file. No, it's present but the column headers are shifted
due to the presence of the “headers” tag.
The logger is stationary but it registers 1g. This is normal and indicates Earth's gravity is
fully operational and stable.
But the logger actually registers something other
than 1g when stationary.
The sensor will exhibit a slight offset error. Add
or subtract the appropriate amount to correct the
error. A 3-axis tumble calibration test is the best
method to determine the sensor offset error. The
errors are particular to the sensor and are normally
consistent throughout all data sets.
Gulf Coast Data Concepts Page 22 X16-1D, Rev B

6 Appendix
Acceleration
(gravity)
Spring
Proof
Mass
X = displacement
Force = −K × X
where : k= spring constant
x= displacement
6.1 What is an Accelerometer
Acceleration is the change in velocity. A stationary body has no acceleration and a body moving at a
constant velocity has no acceleration. However, a body changing from a stationary condition to motion
experiences acceleration by means of a force. Newton's second law establishes this relationship as
F=ma.
An accelerometer [ak-se-lə-ˈrä-mə-tər] sensor measures the force acting on a known mass to determine
“proper” acceleration. There are many ways to measure force with each method having benefits and
limitations. A simple method measures the displacement of a spring-mass system (see Figure 22). As a
force acts upon the mass, such as gravity, the spring will stretch a certain distance relative to the spring
constant. Knowing the spring constant and spring displacement, the force acting upon the mass is
calculated. Acceleration is the force divided by the mass.
Figure 22: Spring-mass Accelerometer
Micro electro machined sensor (MEMS) technology takes the spring-mass concept and miniaturizes it
onto a semiconductor chip. Figure 23 illustrates the general concept of a MEMS accelerometer system
and Error: Reference source not found shows the internal layout of an actual MEMS accelerometer
sensor. The mass and spring system is etched into the semiconductor layer. When the sensor
experiences an acceleration, the proof mass moves and the distance between the interleaving “fingers”
changes. The change in electrical capacitance between the fingers is proportional to the displacement
of the spring-mass system. The capacitance is measured, filtered, and converted to a digital output
representing acceleration.
Gulf Coast Data Concepts Page 23 X16-1D, Rev B

Figure 23: Simplified MEMS Accelerometer Design (L) and Actual MEMS
Proof
Mass
Springs
Position
Sensing
Fingers
Axis
(Direction of Motion)
Accelerometer (R)
Accelerometer sensors exhibit several types of limitations, including offset error, drift error, sensitivity
error, and noise. Offset and sensitivity errors are corrected by calibrating the sensor against known
accelerations. Drift errors are typically related to temperature changes but can be minimized by
maintaining a consistent environment temperature. Noise is the random variations introduced into the
sensor system. Oversampling algorithms and signal filters minimize the effects of sensor noise. Each
of these sensor errors affect how the data is processed into a usable result. For example, integrating
acceleration to determine displacement is heavily skewed due to the drift and noise characteristics of
the sensor.
Accelerometer sensors detect translation motion within the axis of the proof-mass. Rotational motion
causes centripetal acceleration that is interpreted as translational motion by the accelerometer. For
example, spinning about the z-axis will cause acceleration in the x/y axes even though there is no
translational motion in the x/y plane. A gyroscope sensor, which measures rotational velocity about an
axis, is needed to discern rotational motion from translational motion. An accelerometer sensor and
gyroscope sensor are required to determine the six variables of 3D motion. This combination of
sensors is considered an inertial measurement unit (IMU) system. Some IMU systems include an
additional magnetometer sensor (compass) and GPS to further aid the calculations of motion.
Gulf Coast Data Concepts Page 24 X16-1D, Rev B

6.2 Using “R” to Analyze Data
6.2.1 What is “R”
You collected a data set using a GCDC logger and realized, “Wow, that's a lot
of data! Now what?”. Data analysis is tedious and the process is particular to
each user's application. Don't expect to find a magic software solution that
will reduce your data into your perfect answer. However, don't despair.
There are several options available, combined with a little bit of user effort,
that provide powerful and versatile analysis capabilities.
Spreadsheets, such as Microsoft Excel or OpenOffice Calc, are great choices for plotting moderately
sized data sets. The user interfaces are highly polished and customized plotting is easy to handle.
Although, most spreadsheets can handle only about 100,000 lines of data before performance begins to
slow. Furthermore, scripting complex analysis procedures in a spreadsheet is cumbersome. We
recommend trying “R” because it is more powerful than a spreadsheet and it is easy to learn.
“R” is a high-level programming language used most commonly for statistical analysis of data. R is
based on the “S” language, which was developed by the Bell Laboratories in the 1970s. R provides a
simple workspace environment that can manipulate large data sets using simple math commands and
complex function libraries. R is widely used by statisticians and data miners and the language is well
supported by the open source community. The software is compact, free, and available for Windows,
Mac, and Linux (visit www.r-project.org).
Matlab is another common software application for analyzing data but it is usually reserved to
universities or businesses with copious budgets (it's expensive software!). Octave is a free open source
adaptation of Matlab with nearly the same capabilities. Although, Octave is a significantly larger
download and more complicated installation than R. We favor R because it's small, easy to learn, and
free.
Figure 24: R Command Line Interface
Gulf Coast Data Concepts Page 25 X16-1D, Rev B

R is implemented from a command line interface as seen in Figure 24. If you are an experienced
programmer, you may even cringe at some of the constructs used in R. Don't worry, it just works.
User input occurs at the “>” prompt and the R interpreter responds with the results. A single result is
preceded by a [1] to indicate the response number. The “;” character is used to add comment
information that the R interpreter ignores.
The R workspace includes a single command line interface window and a separate graphics window for
displaying plots. “RStudio” is free software package that provides a more versatile interface to the R
interpreter. RStudio is available at www.rstudio.com
Figure 25: RStudio Interface
6.2.2 Introduction to R Commands
R recognizes basic math operators, such as +,-,*, and /. Assignments are made using “<-”. For
example:
> 2+2
[1] 4
> a<-2+2 ;assign “a” the result of 2+2
> a
[1] 4
In the above example, 'a' was assigned the value '4' and can be used later. R works with vectors and
matrices as well.
> b<-c(1,2,3) ;”c” is a function call that creates a vector
> b
[1] 1 2 3
> a*b
[1] 4 8 12
Gulf Coast Data Concepts Page 26 X16-1D, Rev B

More complex math steps are handled in separate functions or external scripts.
> fun<-function(a,b){
+ c<-a+b ; the “+” indicates the user input wrapped into next line
+ return(c)
+ }
> fun(2,2)
[1] 4
R will read a data file from the X16-1D data logger using the “read.table” function.
> data<-read.table(“d:\\GCDC\\data-001.csv”, sep=”,”,comment=”;”, fill=TRUE)
“data” is a matrix of 4 columns containing the time, Ax,Ay,Az values from the file. Values within the
matrix are accessed as follows:
> data[100,2] ;row 100, column 2
[1] 101
> a*data[100,2]
[1] 404
The raw data is converted and assigned to new vectors.
> dataX_g<-data[,2]/2048 ;convert the x-axis to g and assign to new vector
> dataY_g<-data[,3]/2048
> dataZ_g<-data[,4]/2048
Now, the acceleration in g's is plotted against the elapsed time.
> plot(data[,1], dataX_g, type=”l”) ; create a line plot of x-axis values
> lines(data[,1], dataY_g, type=”l”, col=”blue”) ; add another line to plot
The converted data can be combined into a new matrix and then exported to a new csv data file.
> output<-array(c(data[,1],dataX_g, dataY_g, dataZ_g), dim=c(length(data[,1]),4))
> write.table(output, “c:\\output_data.csv”, sep=”,”)
An analysis can be automated by saving the commands into an external text file. Use “source” to call
the file and R will execute the script inside workspace.
>source(“d:\\hello_world.r”)
[1] hello world
Documentation of the available commands is accessed using “help” or by using an internet search
engine.
> help(“plot”) ; opens a browser with the help documentation for “plot”
6.2.3 Online Resources for R
Home page for R to download the software:
https://www.r-project.org/
A complete introduction to R at their website:
https://cran.r-project.org/doc/manuals/r-release/R-intro.html
Another good tutorial for R beginners:
http://www.cyclismo.org/tutorial/R/
Gulf Coast Data Concepts Page 27 X16-1D, Rev B

R is widely supported by user created packages that expand the capabilities of the language. These
packages are libraries of functions built for specific applications. Here is a list of available packages:
https://cran.r-project.org/web/packages/available_packages_by_name.html
If you ever get stuck trying to solve an issue with R, it's very likely someone else faced the same
challenge and posted the question to R forums. Search the internet and you will find a solution to get
you back on track.
6.2.4 Example Scripts in R
Several example applications using R scripts are available at the GCDC website or are included with
the X16-1D data logger. These examples educate the user on basic operation of the data logger,
interpretation of acceleration data, and the use of R scripts.
End of User Manual
Gulf Coast Data Concepts Page 28 X16-1D, Rev B
 Loading...