

Page 1
Update 3.1.1 Dec. 2003
Page 2

Table Of Contents
Welcome . . . . . . . . . . . . . . . . . . . . . . . . . . . . . . . . . . . . . . . . 5
Basics . . . . . . . . . . . . . . . . . . . . . . . . . . . . . . . . . . . . . . . . . . . 9
G-tech Front Side . . . . . . . . . . . . . . . . . . . . . . . . . . . . . . . 10
G-tech Back Side. . . . . . . . . . . . . . . . . . . . . . . . . . . . . . . . 11
Cables. . . . . . . . . . . . . . . . . . . . . . . . . . . . . . . . . . . . . . . . . 11
Menus and Scroll Bars . . . . . . . . . . . . . . . . . . . . . . . . . . . 12
Operating Modes . . . . . . . . . . . . . . . . . . . . . . . . . . . . . . . 13
Quick Setup . . . . . . . . . . . . . . . . . . . . . . . . . . . . . . . . . . . . . 17
Quick Setup and Use . . . . . . . . . . . . . . . . . . . . . . . . . . . . 18
Setting Time and Date . . . . . . . . . . . . . . . . . . . . . . . . . . . 18
Setting Vehicle Redline. . . . . . . . . . . . . . . . . . . . . . . . . . . 20
Setting the Shiftlight Setpoint. . . . . . . . . . . . . . . . . . . . . . 21
Setting Vehicle Weight. . . . . . . . . . . . . . . . . . . . . . . . . . . 23
Calibrating RPMs. . . . . . . . . . . . . . . . . . . . . . . . . . . . . . . . 25
Calibrating Accelerometers . . . . . . . . . . . . . . . . . . . . . . . 28
Calibration & Temperature . . . . . . . . . . . . . . . . . . . . . . . 35
Mounting the G-tech . . . . . . . . . . . . . . . . . . . . . . . . . . . . 36
Assembling the Bracket . . . . . . . . . . . . . . . . . . . . . . . . . . 37
Mounting the Bracket . . . . . . . . . . . . . . . . . . . . . . . . . . . . 40
G-Window. . . . . . . . . . . . . . . . . . . . . . . . . . . . . . . . . . . . . . 45
Drag Strip Mode Basics . . . . . . . . . . . . . . . . . . . . . . . . . . 46
G-Window: Tachometer . . . . . . . . . . . . . . . . . . . . . . . . . 47
G-Window: Acceleration Bars . . . . . . . . . . . . . . . . . . . . 47
Self-leveling the G-tech . . . . . . . . . . . . . . . . . . . . . . . . . . 49
Acceleration Runs. . . . . . . . . . . . . . . . . . . . . . . . . . . . . . . . . 51
Measuring Your Runs. . . . . . . . . . . . . . . . . . . . . . . . . . . . .52
Stopping the E.T. clock . . . . . . . . . . . . . . . . . . . . . . . . . . .54
Viewing Run Results. . . . . . . . . . . . . . . . . . . . . . . . . . . . . .55
Discarding Run Results. . . . . . . . . . . . . . . . . . . . . . . . . . . .57
Saving a run / default name. . . . . . . . . . . . . . . . . . . . . . . . 58
G-tech Stored Runs Capacity . . . . . . . . . . . . . . . . . . . . . .59
The G-tech Keyboard Screen. . . . . . . . . . . . . . . . . . . . . .60
Renaming and saving a run . . . . . . . . . . . . . . . . . . . . . . . .60
Checking Free Memory . . . . . . . . . . . . . . . . . . . . . . . . . . .62
Saving a run / low on memory . . . . . . . . . . . . . . . . . . . . .63
Analyzing Runs . . . . . . . . . . . . . . . . . . . . . . . . . . . . . . . . . . . 65
Loading a Stored Run . . . . . . . . . . . . . . . . . . . . . . . . . . . .66
Overview — Run Viewing Menu . . . . . . . . . . . . . . . . . . . 68
Results . . . . . . . . . . . . . . . . . . . . . . . . . . . . . . . . . . . . . . . . .72
HP & Torque vs RPMs. . . . . . . . . . . . . . . . . . . . . . . . . . . .72
HP vs time. . . . . . . . . . . . . . . . . . . . . . . . . . . . . . . . . . . . . .74
RPM vs time . . . . . . . . . . . . . . . . . . . . . . . . . . . . . . . . . . . .75
Speed vs time . . . . . . . . . . . . . . . . . . . . . . . . . . . . . . . . . . .78
Measuring 0-40 MPH, etc.. . . . . . . . . . . . . . . . . . . . . . . . .80
Measuring 50-70 MPH, etc.. . . . . . . . . . . . . . . . . . . . . . . .81
Measuring 0-100-0, etc. . . . . . . . . . . . . . . . . . . . . . . . . . . .84
Gs (Acceleration) vs time . . . . . . . . . . . . . . . . . . . . . . . . .86
Braking Distance . . . . . . . . . . . . . . . . . . . . . . . . . . . . . . . . .88
Stored Runs . . . . . . . . . . . . . . . . . . . . . . . . . . . . . . . . . . . . . 93
Recalling a Stored Run. . . . . . . . . . . . . . . . . . . . . . . . . . . . 94
Reviewing Stored Run . . . . . . . . . . . . . . . . . . . . . . . . . . . .94
Renaming A Stored Run . . . . . . . . . . . . . . . . . . . . . . . . . .95
Table Of Contents
1 G-TECH / Pro Competition User Guide, Release 3.1 1
Page 3

Deleting a Stored Run . . . . . . . . . . . . . . . . . . . . . . . . . . . 96
Downloading A Stored Run . . . . . . . . . . . . . . . . . . . . . . 97
Deleting ALL Stored Runs. . . . . . . . . . . . . . . . . . . . . . . . 98
Downloading All Stored Runs. . . . . . . . . . . . . . . . . . . . . 99
Advanced Features . . . . . . . . . . . . . . . . . . . . . . . . . . . . . . . 101
Setting U.S. or Metric Mode . . . . . . . . . . . . . . . . . . . . . 102
Setting the Speed Mark . . . . . . . . . . . . . . . . . . . . . . . . . 105
Setting the Distance Marks . . . . . . . . . . . . . . . . . . . . . . 106
Shiftlights Overview . . . . . . . . . . . . . . . . . . . . . . . . . . . . 107
Enabling / Disabling Shiftlights . . . . . . . . . . . . . . . . . . . . 110
Cornering Lights Overview . . . . . . . . . . . . . . . . . . . . . . 111
Setting the Cornering Lights . . . . . . . . . . . . . . . . . . . . . 112
Displaying Firmware Version . . . . . . . . . . . . . . . . . . . . . 115
Resetting to Factory Defaults . . . . . . . . . . . . . . . . . . . . 116
Serial Port Baud Rate . . . . . . . . . . . . . . . . . . . . . . . . . . . 118
Adjusting the LCD Contrast . . . . . . . . . . . . . . . . . . . . . 119
Multiple Vehicles. . . . . . . . . . . . . . . . . . . . . . . . . . . . . . . . . 121
Multiple Vehicle Usage . . . . . . . . . . . . . . . . . . . . . . . . . . 122
Vehicle-Specific Data . . . . . . . . . . . . . . . . . . . . . . . . . . . 122
Selecting a Vehicle . . . . . . . . . . . . . . . . . . . . . . . . . . . . . 123
Renaming a Vehicle. . . . . . . . . . . . . . . . . . . . . . . . . . . . . 124
Showing the Active Vehicle. . . . . . . . . . . . . . . . . . . . . . 125
Pro Features . . . . . . . . . . . . . . . . . . . . . . . . . . . . . . . . . . . . 127
Reaction Time / Start Mode . . . . . . . . . . . . . . . . . . . . . 128
Using the Timing Tree Modes. . . . . . . . . . . . . . . . . . . . 129
Setting the Rollout Distance . . . . . . . . . . . . . . . . . . . . . 134
Additional Info . . . . . . . . . . . . . . . . . . . . . . . . . . . . . . . . . . 137
Tips for Improving Accuracy. . . . . . . . . . . . . . . . . . . . . .141
Accelerometer Tips . . . . . . . . . . . . . . . . . . . . . . . . . . . . .142
X-Y-Z Gs Screen . . . . . . . . . . . . . . . . . . . . . . . . . . . . . . .143
Erasing Accel. Calibration . . . . . . . . . . . . . . . . . . . . . . . .144
RPM Calibration Tips . . . . . . . . . . . . . . . . . . . . . . . . . . . .145
Drag Strip Concepts . . . . . . . . . . . . . . . . . . . . . . . . . . . .147
Adjusting the bracket. . . . . . . . . . . . . . . . . . . . . . . . . . . .149
Removing the bracket . . . . . . . . . . . . . . . . . . . . . . . . . . .150
Permanent Mounting . . . . . . . . . . . . . . . . . . . . . . . . . . . .151
Firmware Upgrades . . . . . . . . . . . . . . . . . . . . . . . . . . . . .152
Battery Replacement . . . . . . . . . . . . . . . . . . . . . . . . . . . .152
Frequently Asked Questions. . . . . . . . . . . . . . . . . . . . . .153
Troubleshooting . . . . . . . . . . . . . . . . . . . . . . . . . . . . . . . .154
I Want To... . . . . . . . . . . . . . . . . . . . . . . . . . . . . . . . . . . . .155
G-tech-Computer Connection. . . . . . . . . . . . . . . . . . . .157
Horsepower, Torque & G-tech . . . . . . . . . . . . . . . . . . .157
What does my vehicle weigh? . . . . . . . . . . . . . . . . . . . .160
Glossary . . . . . . . . . . . . . . . . . . . . . . . . . . . . . . . . . . . . . . . 162
For more info . . . . . . . . . . . . . . . . . . . . . . . . . . . . . . . . . .165
2 G-TECH / Pro Competition User Guide, Release 3.1
Page 4

List Of Figures
Figure 1: G-tech front. . . . . . . . . . . . . . . . . . . . . . . . . . . . . . . . . . . . . . 10
Figure 2: G-tech rear . . . . . . . . . . . . . . . . . . . . . . . . . . . . . . . . . . . . . . 11
Figure 3: G-tech cables. . . . . . . . . . . . . . . . . . . . . . . . . . . . . . . . . . . . . 11
Figure 4: A G-tech menu with a scroll bar. . . . . . . . . . . . . . . . . . . . . 12
Figure 5: Configuration Mode — Main Screen . . . . . . . . . . . . . . . . . 14
Figure 6: Drag Strip Mode — Main Screen . . . . . . . . . . . . . . . . . . . . 14
Figure 7: Switching between Drag Strip & Configuration Modes . . 15
Figure 8: G-tech accelerometer calibration request . . . . . . . . . . . . . 35
Figure 9: Mounting bracket parts. . . . . . . . . . . . . . . . . . . . . . . . . . . . . 37
Figure 10: Drag Strip Mode — G-Window screen . . . . . . . . . . . . . 46
Figure 11: G-Window tachometer. . . . . . . . . . . . . . . . . . . . . . . . . . . 47
Figure 12: Acceleration Bars & Primary Acceleration Indicator. . . . 48
Figure 13: Primary Acceleration Direction Indicator. . . . . . . . . . . . . 48
Figure 14: Staging Screen . . . . . . . . . . . . . . . . . . . . . . . . . . . . . . . . . . . 52
Figure 15: G-tech is staged and ready to go . . . . . . . . . . . . . . . . . . . 53
Figure 16: G-tech screen during a run . . . . . . . . . . . . . . . . . . . . . . . . 53
Figure 17: G-tech screen at completion of 1/4 mile run . . . . . . . . . 55
Figure 18: G-tech Run Viewing Menu . . . . . . . . . . . . . . . . . . . . . . . . 55
Figure 19: G-tech 1/4 mile results screen . . . . . . . . . . . . . . . . . . . . . .56
Figure 20: G-tech milestones screen . . . . . . . . . . . . . . . . . . . . . . . . . .56
Figure 21: Run Save menu. . . . . . . . . . . . . . . . . . . . . . . . . . . . . . . . . . .56
Figure 22: Confirmation before discarding run. . . . . . . . . . . . . . . . . .57
Figure 23: G-tech Run Viewing menu . . . . . . . . . . . . . . . . . . . . . . . . .58
Figure 24: G-tech Run Save menu . . . . . . . . . . . . . . . . . . . . . . . . . . . .58
Figure 25: G-tech display while run is being saved. . . . . . . . . . . . . . .58
Figure 26: G-tech 30 file limit warning. . . . . . . . . . . . . . . . . . . . . . . . .59
Figure 27: Choose a file to delete . . . . . . . . . . . . . . . . . . . . . . . . . . . .59
Figure 28: Low on Memory Warning . . . . . . . . . . . . . . . . . . . . . . . . .63
Figure 29: Deleting runs to free memory . . . . . . . . . . . . . . . . . . . . . .64
Figure 30: Run Viewing Menu. . . . . . . . . . . . . . . . . . . . . . . . . . . . . . . .68
Figure 31: G-tech Run Viewing Menu Capabilities . . . . . . . . . . . . . . .71
Figure 32: Horsepower / Torque summary . . . . . . . . . . . . . . . . . . . .73
Figure 33: Graph of Horsepower & Torque vs RPMs . . . . . . . . . . . . 73
Figure 34: Graph of horsepower vs time . . . . . . . . . . . . . . . . . . . . . .75
Figure 35: Graph of RPMs vs Time . . . . . . . . . . . . . . . . . . . . . . . . . . .76
Figure 36: RPMs vs Time — launch . . . . . . . . . . . . . . . . . . . . . . . . . . .77
Figure 37: RPMs vs Time — milestones . . . . . . . . . . . . . . . . . . . . . . .77
List Of Figures
3 G-TECH / Pro Competition User Guide, Release 3.1 3
Page 5

Figure 38: RPMs vs time — shifts and gears . . . . . . . . . . . . . . . . . . . 78
Figure 39: Graph of Speed vs time . . . . . . . . . . . . . . . . . . . . . . . . . . . 79
Figure 40: Graph of Gs vs time . . . . . . . . . . . . . . . . . . . . . . . . . . . . . . 87
Figure 41: Braking and accelerating. . . . . . . . . . . . . . . . . . . . . . . . . . . 87
Figure 42: Cornering Lights Behavior . . . . . . . . . . . . . . . . . . . . . . . . 111
Figure 43: Configuration Mode Menu Summary. . . . . . . . . . . . . . . 138
Figure 44: Drag Strip Mode Menu Summary. . . . . . . . . . . . . . . . . . 139
Figure 45: Performing an Acceleration Run. . . . . . . . . . . . . . . . . . . 140
Figure 46: Permanent Mounting Stem . . . . . . . . . . . . . . . . . . . . . . . 151
4 G-TECH / Pro Competition User Guide, Release 3.1
Page 6

Welcome
Note: DO NOT CALIBRATE ACCELEROMETERS or ERASE ACCELEROMETER CALIBERATION
on G-tech units which were shipped after August 2003. They have already been calibrated in the
factory. Older G-techs will automatically request calibration. If you are unsure contact tech support.
5 G-TECH / Pro Competition User Guide, Release 3.1 5
Welcome
Page 7

Note: DO NOT CALIBRATE ACCELEROMETERS or ERASE ACCELEROMETER CALIBERATION
on G-tech units which were shipped after August 2003. They have already been calibrated in the
factory. Older G-techs will automatically request calibration. If you are unsure contact tech support.
6 G-TECH / Pro Competition User Guide, Release 3.1
Page 8

G-TECH / Pro Competition
Performance Meter
As you become more familiar with the G-tech’s powerful
capabilities, you will learn how to create very valuable tuning
records and increase the consistency of your measurements.
Thank you for purchasing your G-TECH / Pro Competition
Performance Meter.
I am very pleased and proud to present this product to you
and welcome you to our G-tech users family.
As you read along and especially as you start having fun with
your G-tech you will realize something. You will see that this
is a precision instrument with a high level of sophistication
usually found in products from large industrial conglomerates.
But in the case of the G-tech, the development comes from
enthusiasts, guys who are not driven by the bottom line, guys
who – just like you – have gasoline in their blood and a love
for cars. Guys who have spent years of sleepless nights to
perfect this product.
It’s up to you to decide how far you want to take the G-tech.
You can do 0-60 MPH and 1/4 mile measurements after only
a brief setup procedure.
For us, the G-tech has been a labor of love. It has all of the
features you’ll ever want and there is truly nothing else like it
in the world. Our motto has always been to bring the latest
technology and innovation into the hands of our customers
and maybe contribute, in a small way, to brightening their day.
So, without further ado, go out there and have some fun.
Please drive safely.
Jovo Majstorovic
President, Tesla Electronics Inc.
Welcome
7 G-TECH / Pro Competition User Guide, Release 3.1 7
Page 9

Warning: Always obey all local and federal laws when
using this device. This device is not intended for street or
highway use. Use only in designated areas, closed courses
and racetracks.
Tesla Electronics, Inc. shall not be held liable for technical or
editorial errors or omissions made herein; nor for incidental
or consequential damages resulting from the furnishing, performance or use of this material.
Warning: Adverse weather conditions can severely impair
a vehicle’s controllability, especially at high speed. When
using this device, drive cautiously and within the limits of
your vehicle under the conditions.
Warning: Don’t take your eyes off the road. The G-tech
will record your results for viewing and playback after the
run. This device is designed as a test and tuning tool to measure performance and safety characteristics of a given vehicle. Use it for that purpose only.
8 G-TECH / Pro Competition User Guide, Release 3.1
Tesla Electronics, Inc. shall not be held liable in any way for
any incidental or consequential damages to the vehicle,
driver, passengers, and/or other involved parties or property
occurring while using the G-tech.
TESLA Electronics Inc. reserves the right to make changes to
this manual and other product specifications at any time
without any further notice.
The content of this manual is for informational use only and
is not intended as a commitment of any kind.
Please drive safely.
Page 10

Basics
This section will give you a basic overview of the Gtech.
Every new user should read this section!!!
Basics
9 G-TECH / Pro Competition User Guide, Release 3.1 9
Page 11
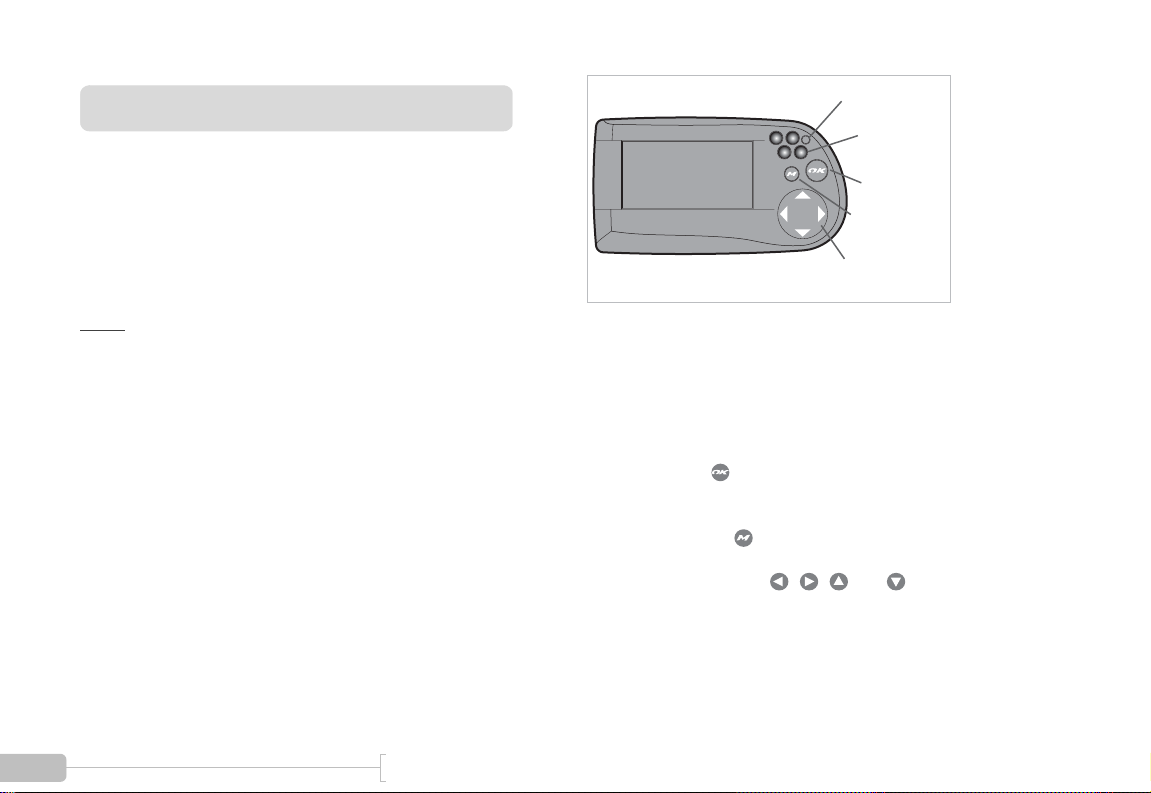
G-tech Front Side
We want you to be up and running in no time, so we have
created a “Quick Setup Procedure” to streamline the process.
Photosensor
LEDs
OK Button
Menu Button
Please follow the steps described in this section to familiarize
yourself with the product, and to set it up.
Note:
Competition product simply as the “G-tech”.
All input to the G-tech is done through the buttons on the
right-hand side.
10 G-TECH / Pro Competition User Guide, Release 3.1
In this manual, we will refer to the G-TECH / Pro
Figure 1: G-tech front
• Photosensor – measures ambient light
• Light Emitting Diodes (LEDs) – red lights that turn on
under certain conditions
• OK button ( ) – used to confirm entry of data and
make menu selections
• MENU button ( ) – brings up multi-line menus
• Navigation buttons ( , , and ) – used for
moving cursor around in menus, graphs, etc.
Navigation
Buttons
Page 12
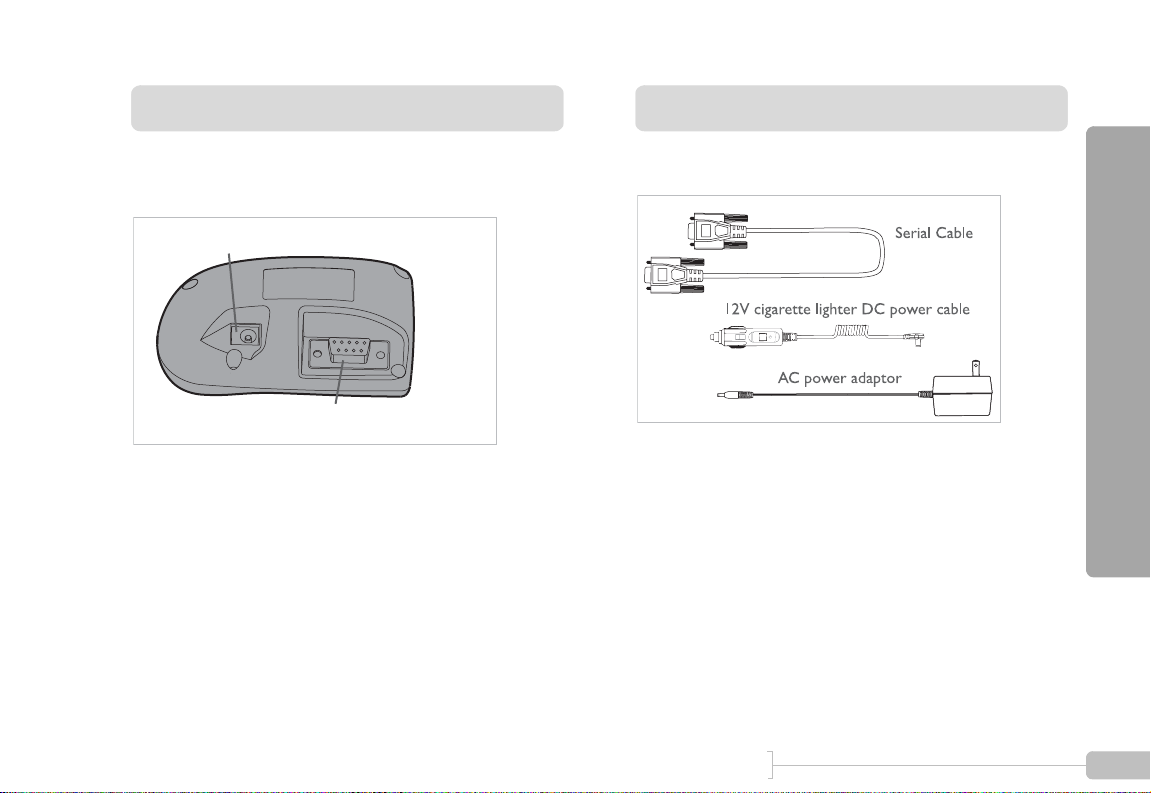
G-tech Back Side
Cables
The back of the G-tech has 2 connectors as shown in Figure
2:
DC Power Jack
Serial Communications Port
Figure 2: G-tech rear
• DC Power Jack – plug in either of the supplied DC
power cables into this connector
• Serial Communications Port – plug in the supplied
serial cable into this port to enable communications
between the G-tech and a computer
The G-tech ships with 3 separate cables:
Basics
Figure 3: G-tech cables
• Serial Cable – used to connect the G-tech to a com-
puter for data transfer
• AC Power Adapter – this cable supplies power from
any 120V AC wall socket
• 12V cigarette lighter DC Power Cable – supplies
power from vehicle’s accessory (cigarette lighter) socket
11 G-TECH / Pro Competition User Guide, Release 3.1 11
Page 13
The 12V cigarette lighter DC Power Cable has a fuse in the
end that plugs into your vehicle. If the cable does not seem to
provide power when the vehicle is running, the fuse may be
blown and need replacing.
To replace the fuse, unscrew the tip and replace the fuse
with a standard 1 AMP fuse. Fuses can normally be purchased
at any automotive parts store.
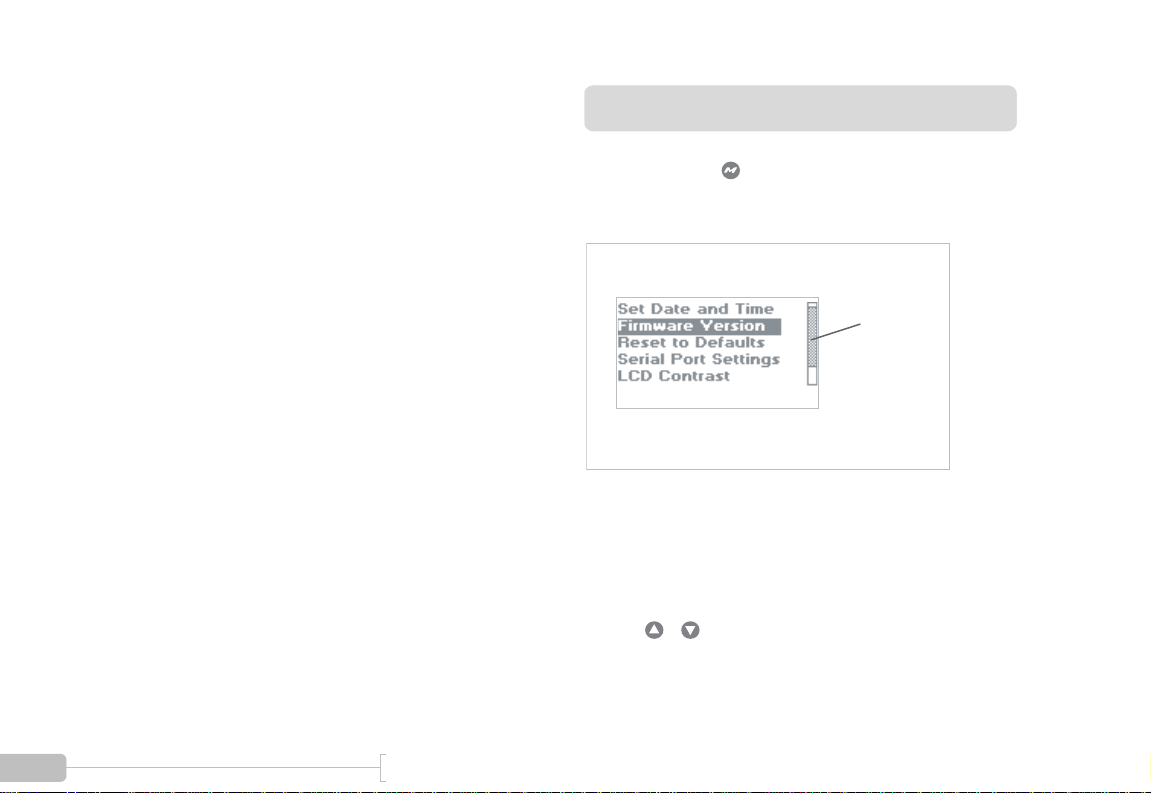
Menus and Scroll Bars
Generally, pressing will bring up a multi-line text menu.
An example of one of the G-tech’s menus is shown in Figure
4:
Scroll bar
Figure 4: A G-tech menu with a scroll bar
Some menus have a scroll bar on the right hand side. This
means that there are more items in the menu than the Gtech can display at once.
Use the / arrow keys to move through all the choices
in the menu.
12 G-TECH / Pro Competition User Guide, Release 3.1
Page 14

The shaded portion of the scroll bar will move as you scroll
through the choices.
Operating Modes
The G-tech has two basic modes of operation:
• Configuration Mode
• Drag Strip Mode
You use Configuration Mode to tailor the G-tech to your
vehicle and personal preferences.
In Drag Strip Mode, you can use the G-tech to make all sorts
of popular measurements, including:
• 0-60 MPH Times
• 1/4 mile E.T. and trap speed
• Horsepower and torque measurements
• Braking distance measurements
• Cornering / lateral G measurements
The G-tech remembers which mode it was last in when you
power off. When you power it on again, it starts up again in
the same mode it was in before.
13 G-TECH / Pro Competition User Guide, Release 3.1 13
Basics
Page 15
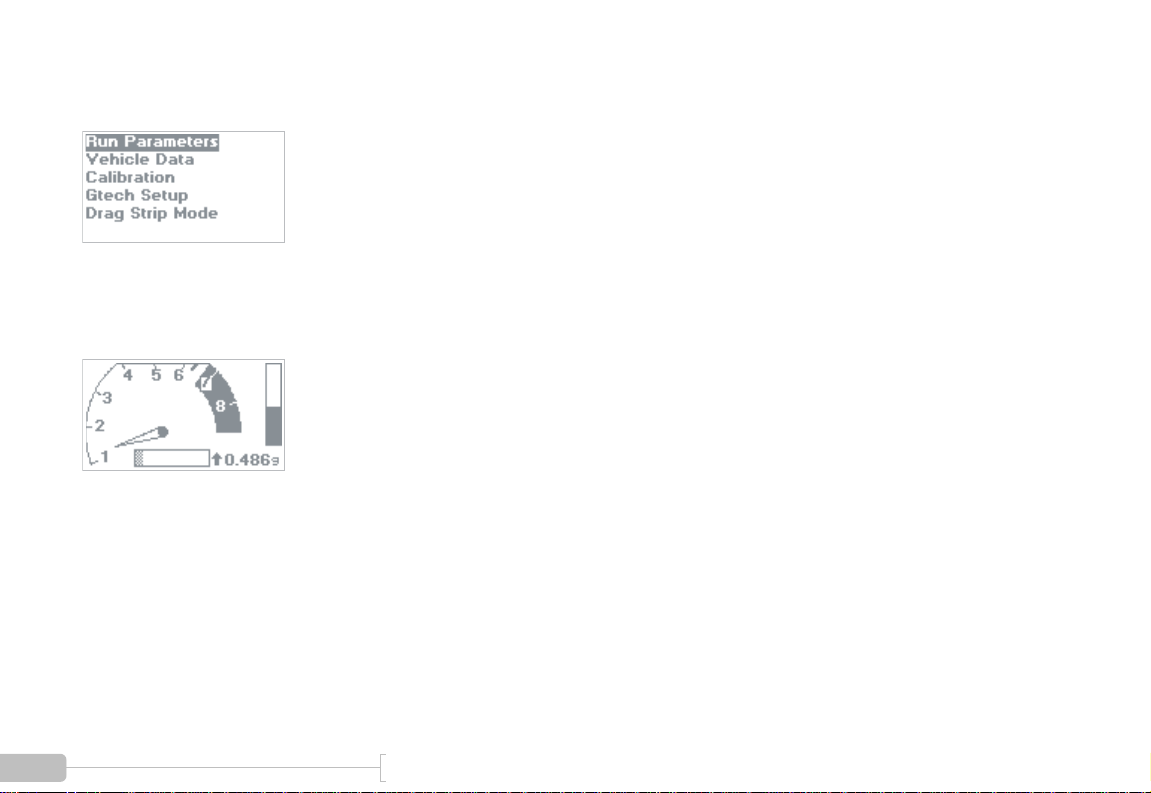
If you power on your G-tech and the display looks like Figure
5, your G-tech is in Configuration Mode.
Figure 5: Configuration Mode — Main Screen
If you power on your G-tech and the display looks like Figure
6, your G-tech is in Drag Strip Mode.
Figure 6: Drag Strip Mode — Main Screen
You can easily switch between the two modes, as shown in
Figure 7.
14 G-TECH / Pro Competition User Guide, Release 3.1
Page 16
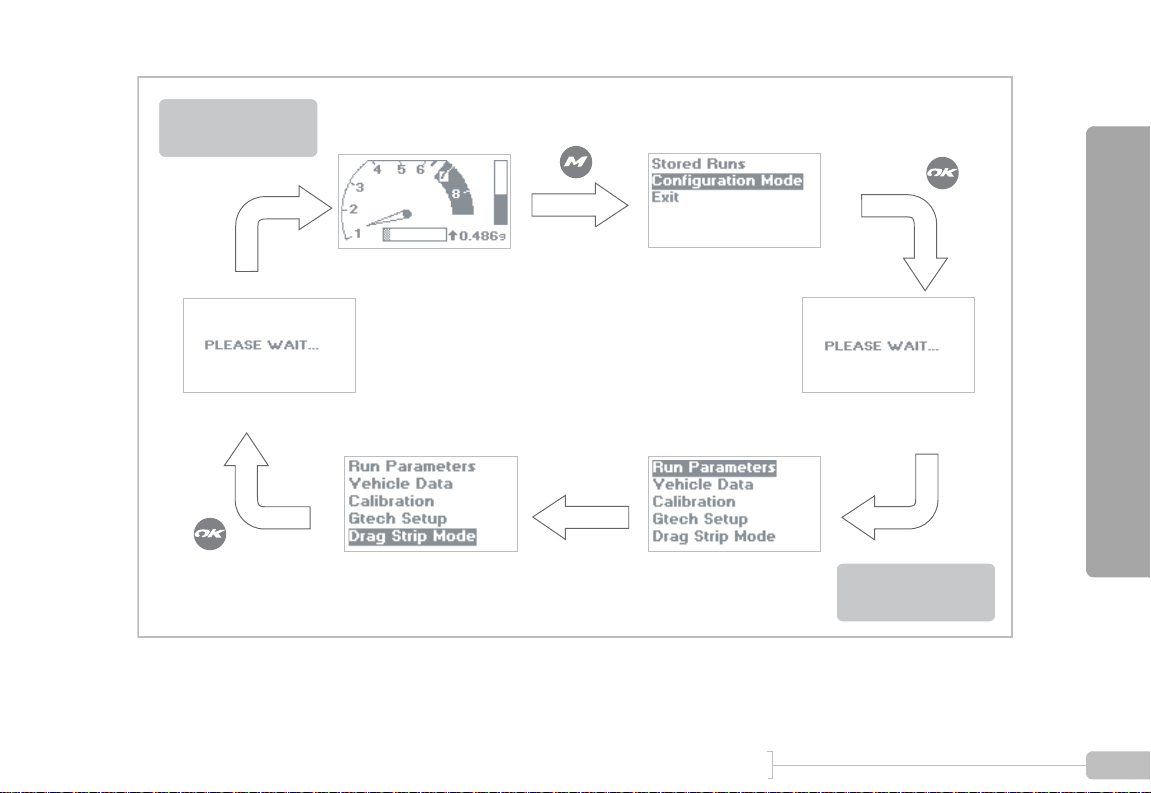
Drag Strip Mode
Main Screen
Figure 7: Switching between Drag Strip & Configuration Modes
Basics
Configuration Mode
Main Screen
15 G-TECH / Pro Competition User Guide, Release 3.1 15
Page 17

16 G-TECH / Pro Competition User Guide, Release 3.1
Page 18

Quick Setup
Note: DO NOT CALIBRATE ACCELEROMETERS or ERASE ACCELEROMETER CALIBERATION
on G-tech units which were shipped after August 2003. They have already been calibrated in the
factory. Older G-techs will automatically request calibration. If you are unsure contact tech support.
This section will get you up and running as quickly as
possible.
This section must be completed to obtain accurate
results!!!
17 G-TECH / Pro Competition User Guide, Release 3.1 17
Quick Setup
Page 19
Quick Setup and Use
Setting Time and Date
Here you will customize the G-tech for your vehicle and your
personal preferences.
The G-tech saves your configuration choices internally, even
when it is powered off.
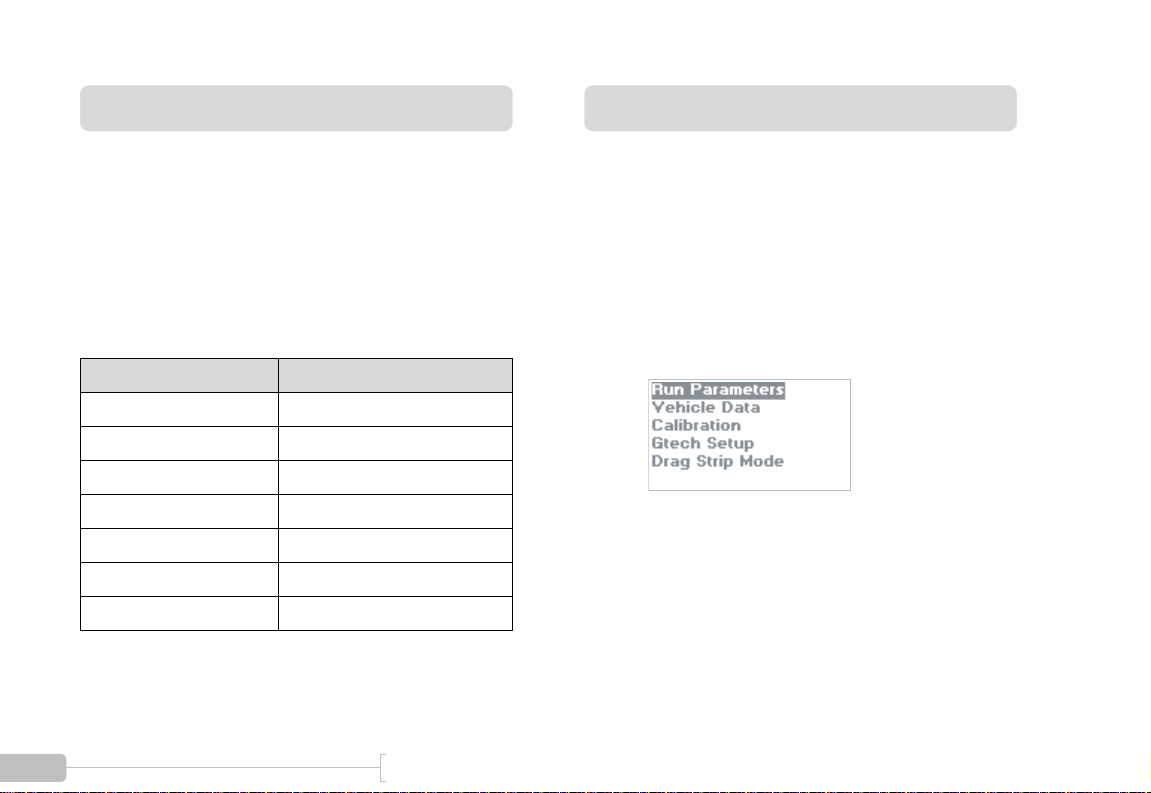
The table below summarizes the Quick Setup Procedure, and
how much time each step will take to perform.
Setup Item Estimated Completion Time
Set time and date 1 minute
Set vehicle redline 1 minute
Set shiftlight setpoint 1 minute
Set vehicle weight 1 minute
Calibrate RPMs 2 minutes
Calibrate accelerometers 3 minutes
Mount G-tech 2 minutes
The G-tech has an internal clock that keeps time and date,
even when no power is applied.
Whenever you make measurements with the G-tech, it
stores the time and date as well. This makes it easy to review
your measurements and make sense of them.
Start in Configuration Mode.
1
18 G-TECH / Pro Competition User Guide, Release 3.1
Page 20
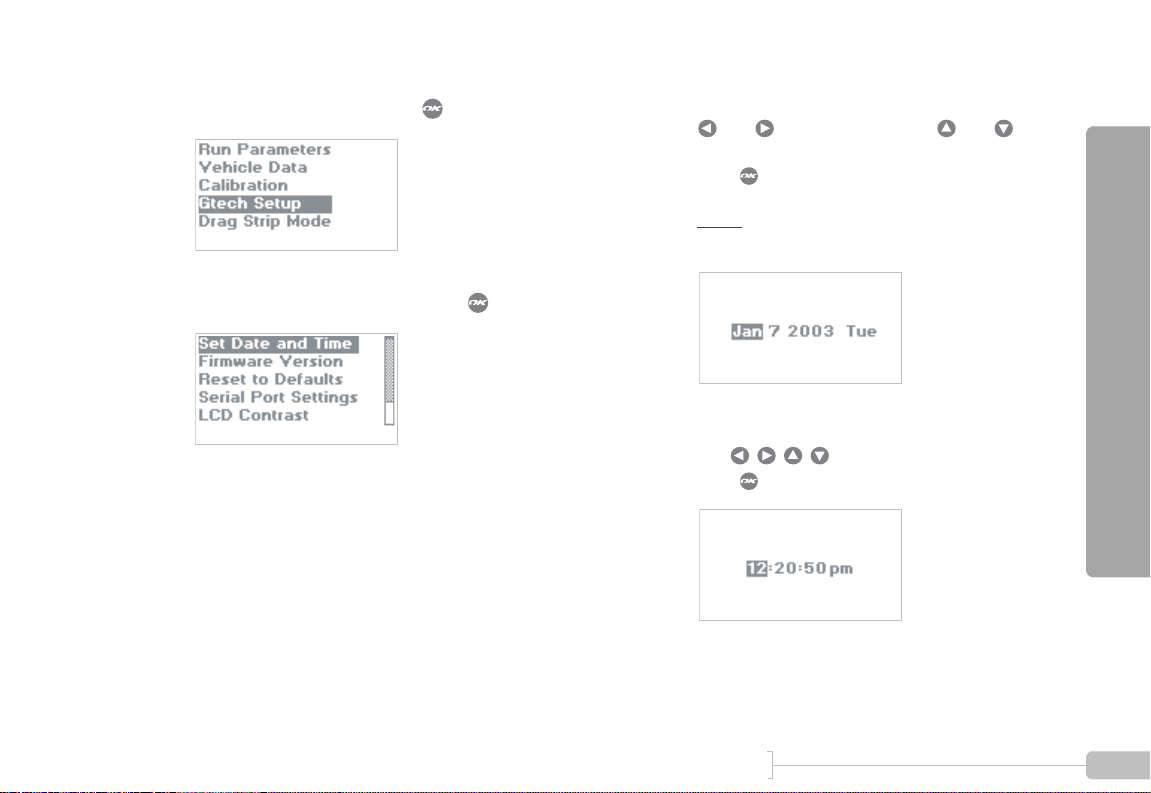
2
Select “Gtech Setup” and press .
Set the date.
4
and move between fields, and
change values.
Press when done.
Note:
automatically and cannot be set.
3
Select “Set Date and Time” and press .
Set the time.
5
Use to move and adjust fields.
Press when done.
19 G-TECH / Pro Competition User Guide, Release 3.1 19
Day of week (e.g. Tuesday) is calculated
Quick Setup
Page 21
Setting Vehicle Redline
You should set the vehicle redline value in the G-tech before
using it.
This will allow the G-tech to display the graphical tachometer
(p. 47) so that it matches your vehicle’s own tachometer.
This step is essential for accurate RPM calibration (p. 25).
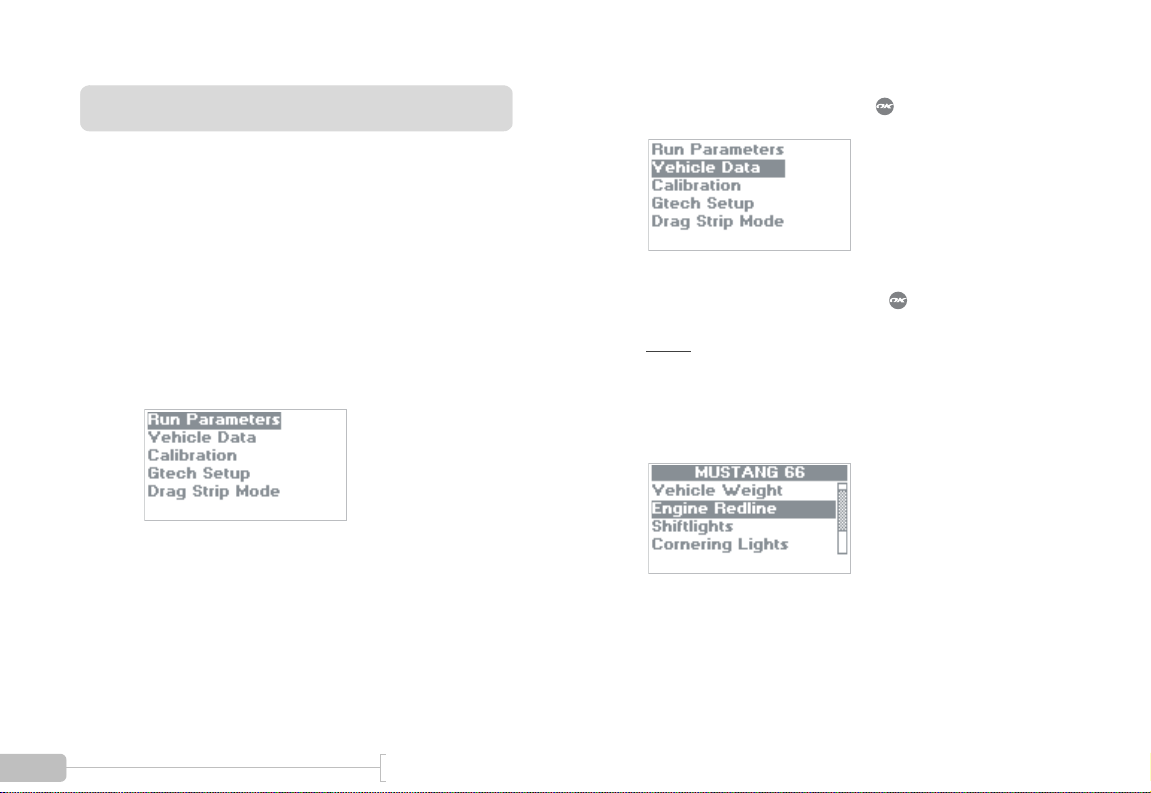
2
Select “Vehicle Data” and press .
3
Select “Engine Redline” and press .
Note:
Start in Configuration Mode.
1
20 G-TECH / Pro Competition User Guide, Release 3.1
many places throughout this document. This is
because the G-tech can be used in multiple vehicles
and allows you to name each one (p. 122). On a new
G-tech, you will see the text “noname1” here.
You will see the text “MUSTANG 66” in
Page 22
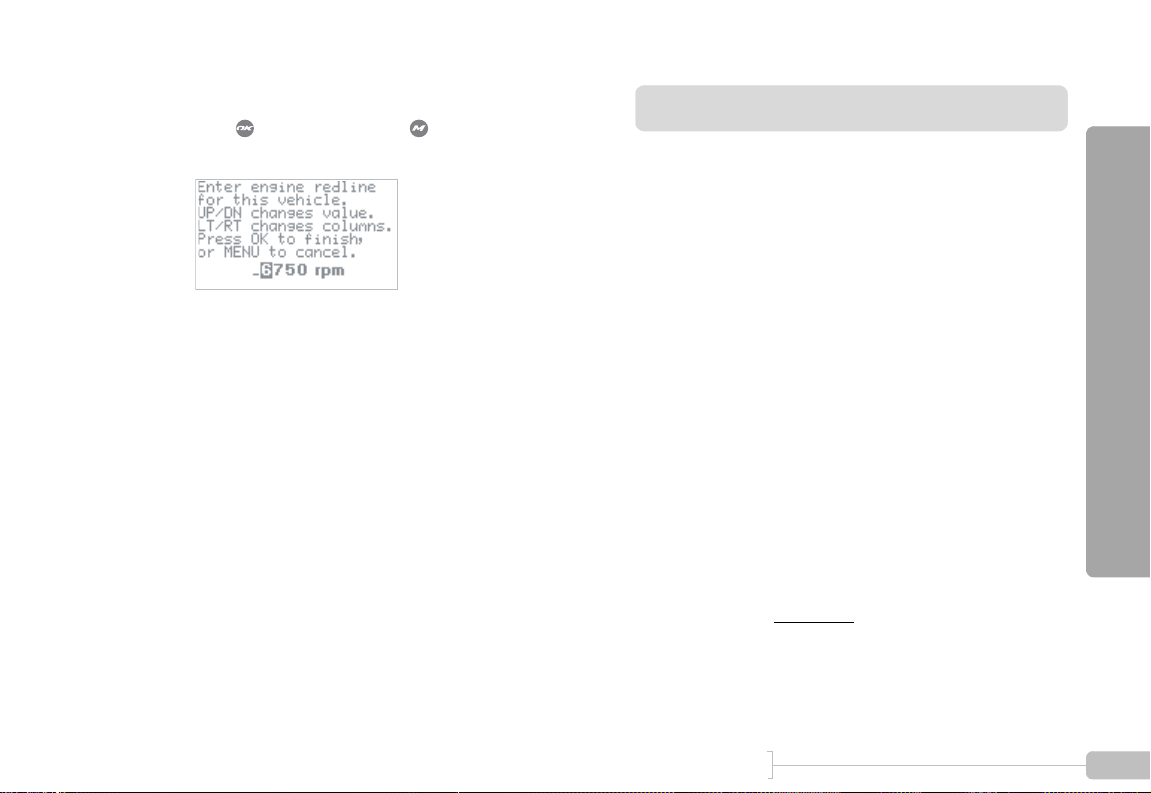
Enter vehicle’s engine redline.
4
Press when done or press to abort and discard the changes.
Setting the Shiftlight Setpoint
The shiftlights illuminate to indicate when you should upshift
into the next gear.
If you have a manual transmission vehicle, or a vehicle whose
gears can be shifted under driver control, this feature may be
of interest to you.
If you do not have control over when your vehicle shifts
gears, you probably want to disable the shiftlights altogether
(page 110).
Before using the G-tech’s shiftlights feature, you must set the
shiftlight setpoint RPM value.
Some people set the shiftlight setpoint to the same value as
their vehicle’s redline value; other people set it to a lower
value, so that the lights turn on before they reach redline in a
run. It is your preference and can be changed at any time.
The shiftlight setpoint is also indicated on the graphical
tachometer on the G-Window (page 47).
Quick Setup
21 G-TECH / Pro Competition User Guide, Release 3.1 21
Page 23
Note: This step must be performed in the vehicle, it cannot
be performed when powered by the AC power adapter.
Start your vehicle, and plug the G-tech into your
1
vehicle’s accessory power outlet.
Put the G-tech in Configuration Mode.
2
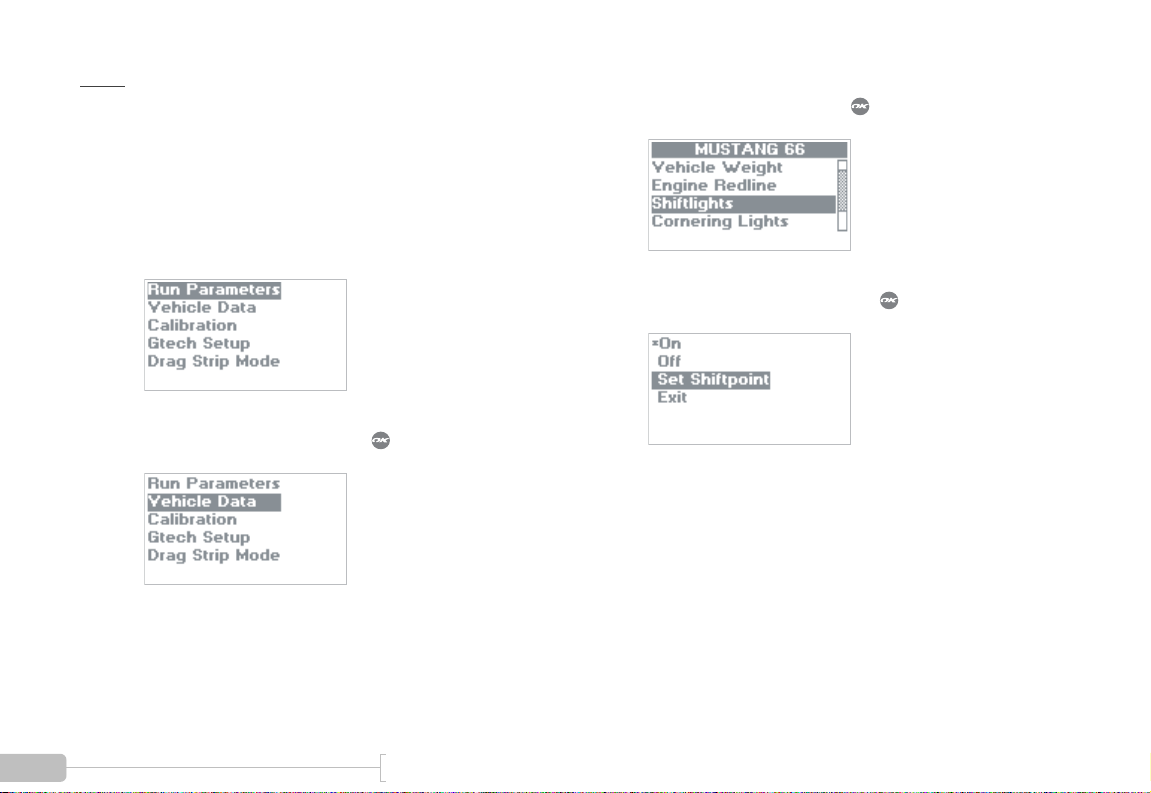
3
Select “Vehicle Data” and press .
4
Select “Shiftlights” and press .
5
Select “Set Shiftpoint” and press .
22 G-TECH / Pro Competition User Guide, Release 3.1
Page 24
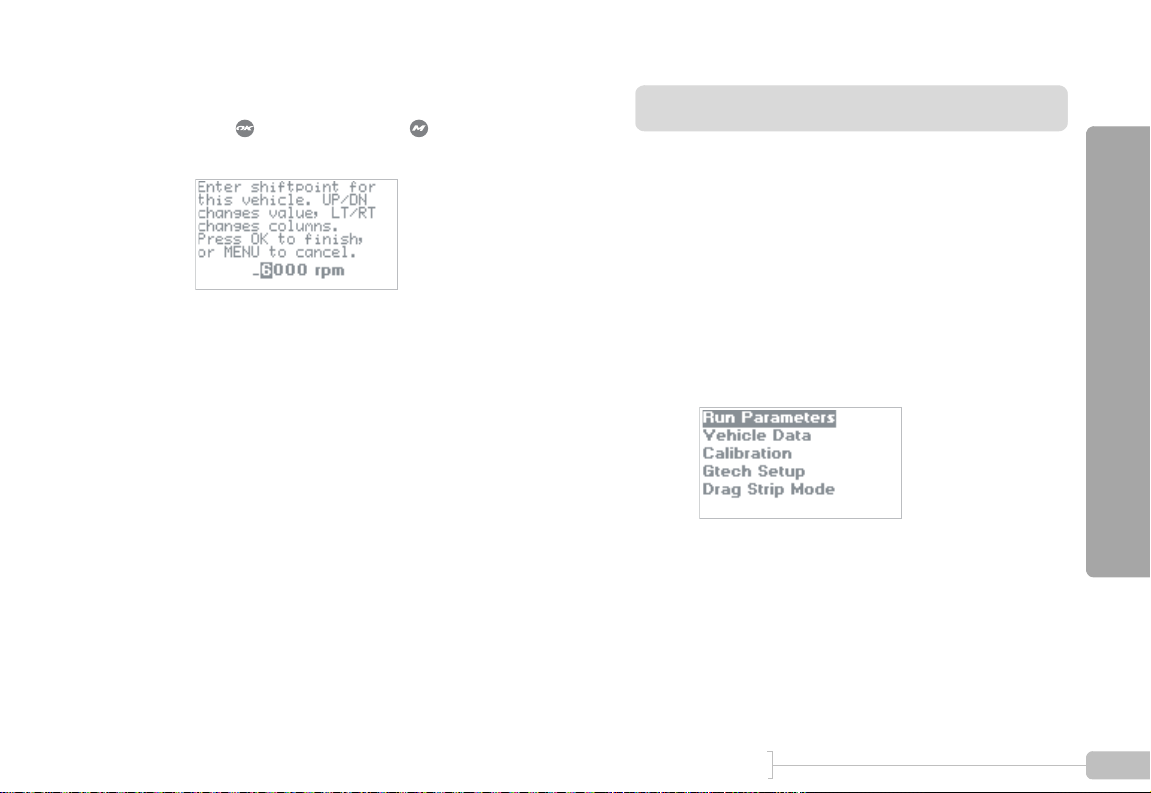
Enter RPM shiftpoint.
6
Press when done or press to abort and discard the changes.
Setting Vehicle Weight
The G-tech uses your vehicle’s weight in its horsepower and
torque calculations.
Thus, it is extremely important that you enter an accurate
weight for your vehicle before using the G-tech. Please refer
to page 160 for details on determining an accurate vehicle
weight.
Start in Configuration Mode.
1
Quick Setup
23 G-TECH / Pro Competition User Guide, Release 3.1 23
Page 25
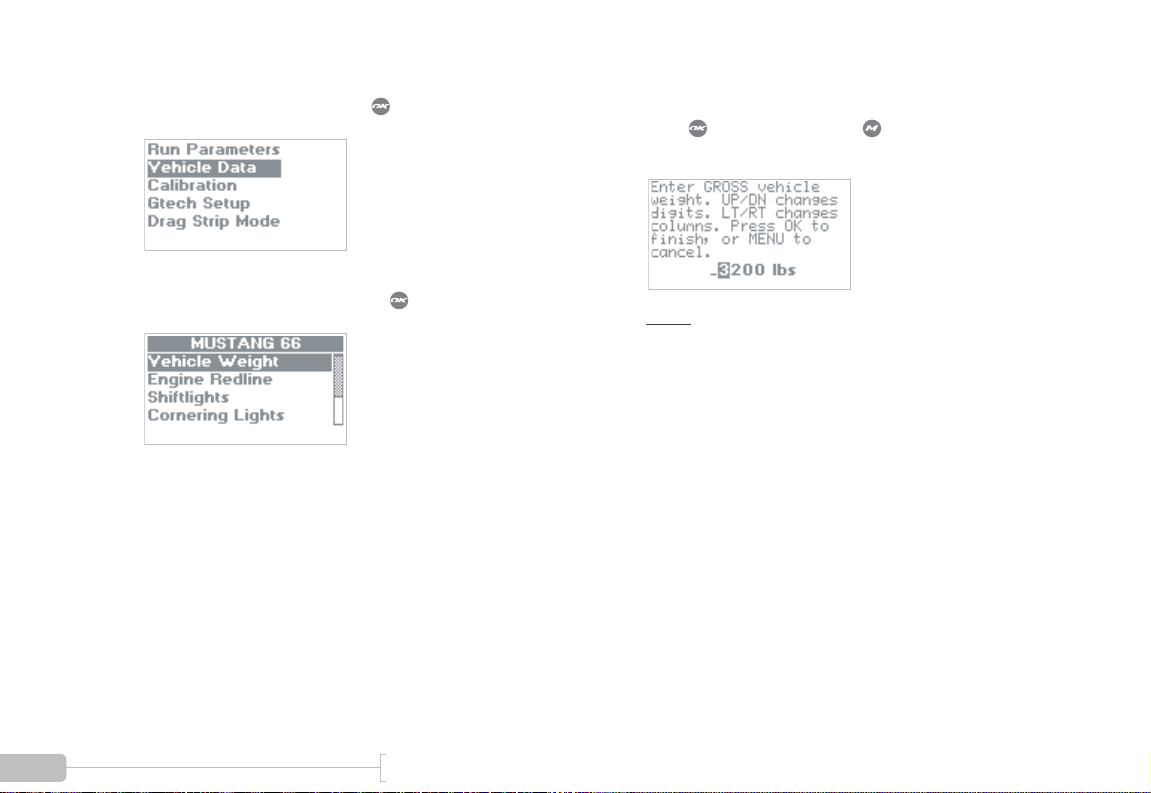
2
Select “Vehicle Data” and press .
3
Select “Vehicle Weight” and press .
Enter your gross vehicle weight.
4
Press when done or press to abort and discard the changes.
Note: Be sure to include weight of fuel, driver,
equipment, etc. (page 160)
24 G-TECH / Pro Competition User Guide, Release 3.1
Page 26

Calibrating RPMs
Some of the most exciting features in the G-tech rely on
good RPM measurements.
Since every vehicle has a unique electronic “RPM signature,”
the G-tech must learn the RPM signature at two different
points for your particular vehicle before it can measure and
record RPMs.
Start in Configuration Mode.
1
Quick Setup
Follow the steps below to calibrate the G-tech for your vehicle’s RPM signature.
Note:
to this step!
Note: For detailed information on calibrating RPMs, please
refer to “RPM Calibration Tips” on page 145.
25 G-TECH / Pro Competition User Guide, Release 3.1 25
You must set the redline in the G-tech (page 20) prior
2
Select “Calibration” and press .
Page 27
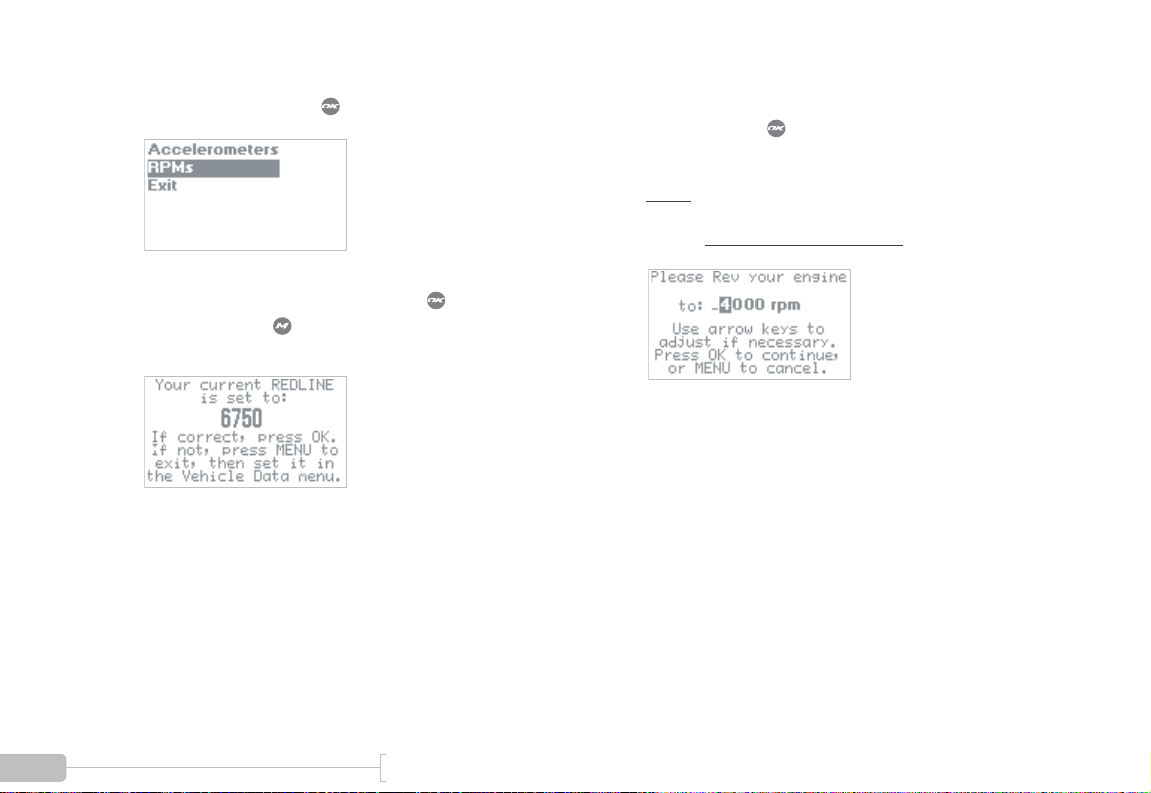
3
Select “RPMs” and press .
4
If the redline value is set properly, press to continue. If not, press to cancel, and then set the
redline in the G-tech (page 20).
High RPM calibration: Match vehicle RPMs to G-
5
tech. Then press when vehicle RPMs are steady
at the requested value.
Note: The RPM value shown here may be different than the value your G-tech displays. During this
process, use the value on your G-tech!
26 G-TECH / Pro Competition User Guide, Release 3.1
Page 28
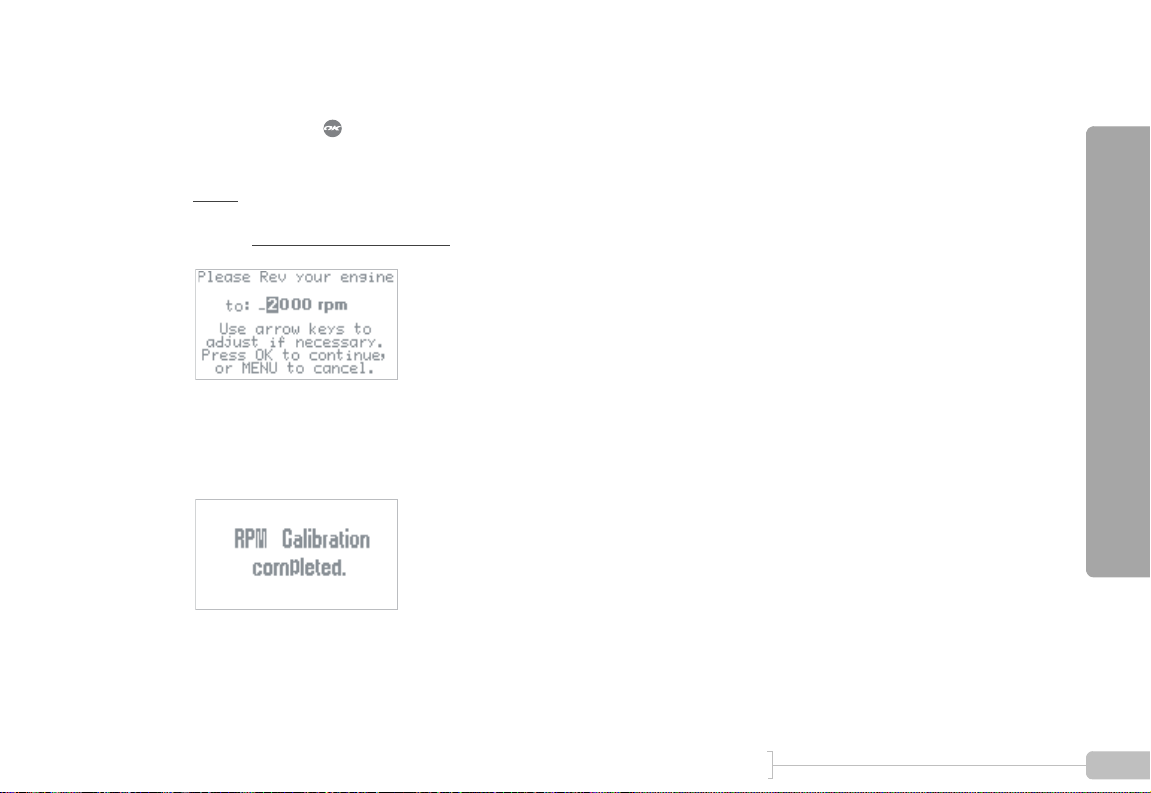
Low RPM calibration: Again match vehicle RPMs to
6
G-tech, and press when vehicle RPMs are
steady at the requested value.
Note: The RPM value shown here may be different than the value your G-tech displays. During this
process, use the value on your G-tech!
You will see this screen briefly when the procedure
7
is complete, and then you will be returned to the
previous menu in Step 4.
For detailed information on calibrating RPMs, please refer
to “RPM Calibration Tips” on page 145.
Quick Setup
27 G-TECH / Pro Competition User Guide, Release 3.1 27
Page 29

Calibrating Accelerometers
Note: DO NOT CALIBRATE ACCELEROMETERS or ERASE ACCELEROMETER CALIBERATION
on G-tech units which were shipped after August 2003. They have already been calibrated in the
factory. Older G-techs will automatically request calibration. If you are unsure contact tech support.
The G-tech contains high-precision measuring instruments
called accelerometers.
Note:
erometers must
very important!
Do not perform the calibration with the engine running. A running engine causes vibrations in the vehicle that can affect your
calibration results.
In order to obtain accurate measurements, the accel-
be calibrated. Do not skip this procedure, as it is
Note:
calibration (i.e. upside down, rotated by 90 degrees, etc.), it will
reject the calibration and display a message notifying you of this
fact. Just re-attempt the calibration and pay close attention to
the instructions on the display.
Note:
ent temperatures that are as far apart as possible (page 35). If
you attempt to perform a calibration and the G-tech determines
that it has already been calibrated at (or near) the current temperature, it will “reject” your calibration attempt and notify you
with a message on the display. If you get this message, let the Gtech warm up or cool down so that its temperature is significantly different than the current temperature, and try again.
If you do not have the G-tech oriented properly during
The G-tech functions best when calibrated at 2 differ-
The accelerometer calibration procedure does not need to be
done inside the vehicle. You may find the procedure easier if you
do it indoors using the AC adapter to power your G-tech.
The accelerometer calibration procedure will generally go faster
if you can rest the G-tech on a flat, level surface such as a table
or a console. Generally, the faster the calibration goes, the better
the results.
Please follow the steps below to calibrate the G-tech’s accelerometers.
28 G-TECH / Pro Competition User Guide, Release 3.1
Page 30
Start in Configuration Mode.
Note: DO NOT CALIBRATE ACCELEROMETERS or ERASE ACCELEROMETER CALIBERATION
on G-tech units which were shipped after August 2003. They have already been calibrated in the
factory. Older G-techs will automatically request calibration. If you are unsure contact tech support.
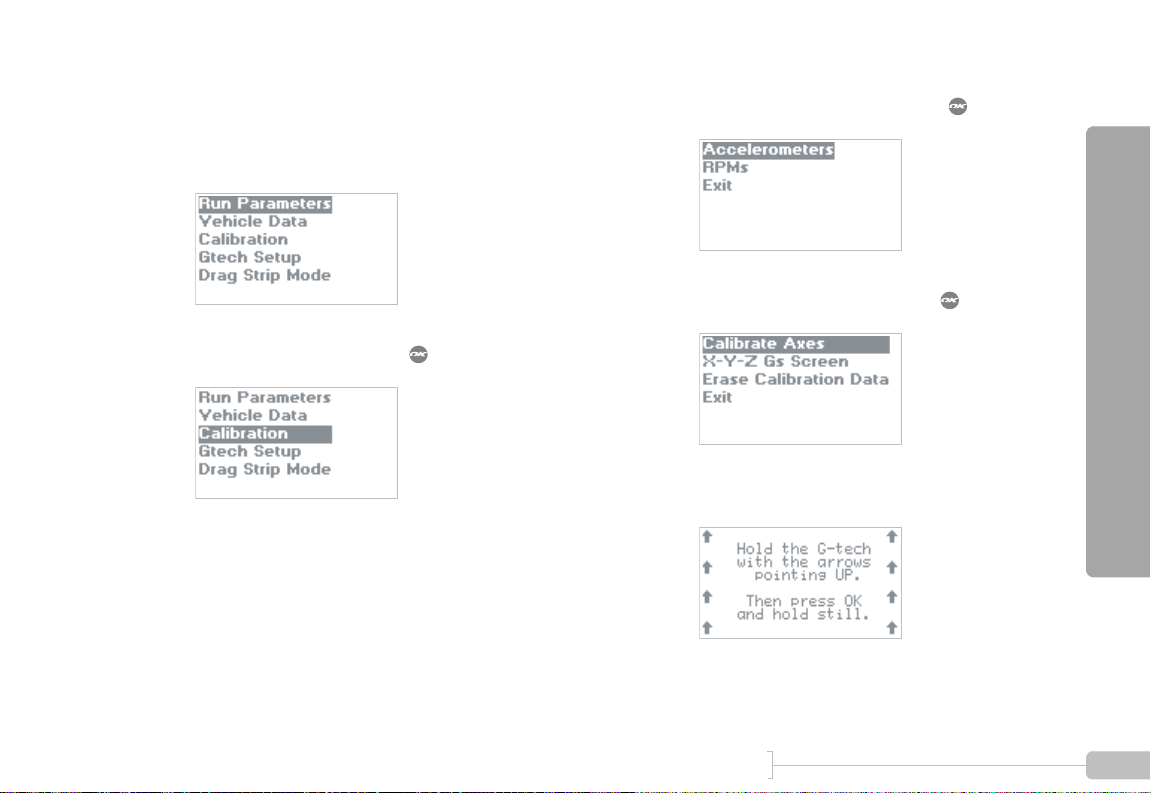
1
2
Select “Calibration” and press .
3
Select “Accelerometers” and press .
4
Select “Calibrate Axes” and press .
You will see the following screen:
5
Quick Setup
29 G-TECH / Pro Competition User Guide, Release 3.1 29
Page 31

With the G-tech resting on a flat, level surface, ori-
Note: DO NOT CALIBRATE ACCELEROMETERS or ERASE ACCELEROMETER CALIBERATION
on G-tech units which were shipped after August 2003. They have already been calibrated in the
factory. Older G-techs will automatically request calibration. If you are unsure contact tech support.
6
ent it with the arrows pointing up to the sky as
shown in the picture below.
Hold the G-tech very still, and then press .
7
The G-tech will automatically move on to the next
step once it takes some measurements.
Note: If you are not holding the G-tech very still,
you will see a blinking black bar on the display as
shown below. If you see a display like this, you must
hold the G-tech very steady until the black bar goes
away.
30 G-TECH / Pro Competition User Guide, Release 3.1
Page 32

8
Note: DO NOT CALIBRATE ACCELEROMETERS or ERASE ACCELEROMETER CALIBERATION
on G-tech units which were shipped after August 2003. They have already been calibrated in the
factory. Older G-techs will automatically request calibration. If you are unsure contact tech support.
Next, orient the G-tech as shown and press .
Next orient the G-tech as shown with the arrows
9
pointing up, and press .
Quick Setup
31 G-TECH / Pro Competition User Guide, Release 3.1 31
Page 33

Again orient the G-tech as shown with the arrows
Note: DO NOT CALIBRATE ACCELEROMETERS or ERASE ACCELEROMETER CALIBERATION
on G-tech units which were shipped after August 2003. They have already been calibrated in the
factory. Older G-techs will automatically request calibration. If you are unsure contact tech support.
10
pointing up, and press .
Lay the G-tech on a flat (horizontal) surface with
11
the display facing up, as shown, and press .
32 G-TECH / Pro Competition User Guide, Release 3.1
Page 34

Orient the G-tech with the display facing down, as
Note: DO NOT CALIBRATE ACCELEROMETERS or ERASE ACCELEROMETER CALIBERATION
on G-tech units which were shipped after August 2003. They have already been calibrated in the
factory. Older G-techs will automatically request calibration. If you are unsure contact tech support.
12
shown, and press .
Now it is time for some final checks.
13
Orient the G-tech as shown, read the screen, and
press .
The following instruction screen will appear. Read it
14
and then press .
Quick Setup
33 G-TECH / Pro Competition User Guide, Release 3.1 33
Page 35

Tilt the G-tech back as shown, so the ball rests in
Note: DO NOT CALIBRATE ACCELEROMETERS or ERASE ACCELEROMETER CALIBERATION
on G-tech units which were shipped after August 2003. They have already been calibrated in the
factory. Older G-techs will automatically request calibration. If you are unsure contact tech support.
15
the box. The G-tech will automatically advance to
the next calibration step when you have accomplished this.
16
Re-orient the G-tech as shown and press .
The following instruction screen will appear. Read it
17
and then press .
34 G-TECH / Pro Competition User Guide, Release 3.1
Page 36

Tilt the G-tech clockwise as shown so that the ball
Note: DO NOT CALIBRATE ACCELEROMETERS or ERASE ACCELEROMETER CALIBERATION
on G-tech units which were shipped after August 2003. They have already been calibrated in the
factory. Older G-techs will automatically request calibration. If you are unsure contact tech support.
18
rests in the square.
This screen indicates that the calibration procedure
19
is complete.
For more information on calibrating the accelerometers,
please refer to “Accelerometer Tips” on page 142.
Calibration & Temperature
The G-tech’s accelerometers are sensitive to changes in temperature. Ideally, you will calibrate the G-tech at two different
temperatures that are far apart. This helps the G-tech maintain accuracy across a wide range of temperatures.
To maintain accuracy, the G-tech monitors temperature with
a built-in thermal sensor. When the G-tech detects that its
current temperature is far from the calibration temperature, it
displays a message as shown in Figure 8.
Figure 8: G-tech accelerometer calibration request
If this text automatically appears on your display, you should
put the G-tech into Configuration Mode and then perform
an accelerometer calibration (“Calibrating Accelerometers”
on page 28).
Quick Setup
35 G-TECH / Pro Competition User Guide, Release 3.1 35
Page 37

For more information on accelerometers, calibration, and
Note: DO NOT CALIBRATE ACCELEROMETERS or ERASE ACCELEROMETER CALIBERATION
on G-tech units which were shipped after August 2003. They have already been calibrated in the
factory. Older G-techs will automatically request calibration. If you are unsure contact tech support.
accuracy, please refer to “Accelerometer Tips” on page 142.
Mounting the G-tech
The G-tech is shipped with a sophisticated mounting system
that is used to hold the G-tech steady in your vehicle.
This section describes:
• the different pieces of the mounting bracket
• how to assemble the mounting bracket
• how to mount the bracket in your vehicle
Note: In order to obtain accurate measurements, the G-tech
must be mounted properly. Please read this section carefully, it is
very important!
For directions on removing the mounting bracket from
your windshield, please refer to “Removing the bracket” on
page 150.
For directions on permanently mounting the bracket in
your vehicle, please refer to “Permanent Mounting” on
page 151.
36 G-TECH / Pro Competition User Guide, Release 3.1
Page 38

Figure 9 shows the different pieces of the G-tech mounting
bracket.
Suction Cup
Suction Cup
Release Tab
Mounting Bracket
Figure 9: Mounting bracket parts
Large (Vacuum) Nut
Small
(Tensioning)
Nut
Mounting
Clip
Assembling the Bracket
Note: Steps 1-3 may already be performed on your mounting bracket at the factory. These steps are provided so that you
can always properly re-assemble your mounting bracket from its
pieces if necessary.
Insert the Large Vacuum Nut into the Mounting
1
Bracket.
Quick Setup
37 G-TECH / Pro Competition User Guide, Release 3.1 37
Page 39

Insert the suction cup into the mounting bracket.
2
Turn the suction cup clockwise into the Large Vac-
3
uum Nut until approximately 1/4 inch of threads
protrude.
1/4"
38 G-TECH / Pro Competition User Guide, Release 3.1
Page 40

Place the Small Tensioning Nut on the threaded
4
spindle, and turn it clockwise a until it is snug on the
stem. There should be a small gap between the
Small Tensioning Nut and the Large Vacuum Nut.
Now back off the Large Vacuum Nut counter-
5
clockwise until it touches the Small Tensioning Nut.
No Gap
Small Gaps
39 G-TECH / Pro Competition User Guide, Release 3.1 39
Quick Setup
Page 41

Gently insert the rubber ball of the mounting clip
6
into the mounting bracket. It should go in with little
force and fit snugly.
Mounting the Bracket
Find a place on your vehicle’s windshield where you
1
can mount the G-tech without affecting visibility.
Note: Make sure the mounting area on the windshield is very clean and dry; otherwise, the mounting
bracket may not work properly.
Place the large rubber suction cup on the mounting
2
area of the windshield. Make sure there is a large
gap between the Large Vacuum Nut and the
mounting bracket.
AIR
Large Gap
40 G-TECH / Pro Competition User Guide, Release 3.1
Page 42

Push the Large Vacuum Nut firmly towards the
3
windshield to expel all air between the suction cup
and the windshield. This is a very important step
to ensure proper operation of the mounting system.
At this point, the mounting bracket should stay
4
attached to the windshield when you remove your
hands.
If it doesn’t, inspect the rubber suction cup for
cracks or tears, and make sure the windshield surface is clean.
Turn the Large Vacuum Nut clockwise in order to
5
create a vacuum between the suction cup and the
windshield. Be sure to turn the Large Vacuum Nut
as far as possible.
VACUUM
Tighten
Quick Setup
Gap
41 G-TECH / Pro Competition User Guide, Release 3.1 41
Page 43

The mounting clip should be steady and should not
6
move easily. If this is not the case, slowly turn the
Small Tensioning Nut counter-clockwise just
enough to secure the mounting clip.
Note:
sioning Nut for fine adjustments the first time you
mount the G-tech. After the initial mounting, you
would secure the clip by turning the Large Vacuum
Nut clockwise to tighten it.
Note: The clip should be completely rigid. A Gtech which slips during a run will lead to inaccurate
results.
You should only need to use the Small Ten-
Loosen
Insert the small end of the power cord into the DC
7
jack, which is located on the back of the G-tech.
DC Power Jack
42 G-TECH / Pro Competition User Guide, Release 3.1
Page 44

Snap the G-tech into the mounting clip.
8
Note: Do not move the mounting clip if you need
to adjust the orientation of the G-tech! This will damage your mounting system and will not be covered
under warranty.
To safely re-orient the mounting clip for easier viewing, please refer to “Adjusting the bracket” on
page 149.
Plug the large end of the power cord into your
9
vehicle’s 12V cigarette lighter socket. The G-tech
will power on.
Note: Some vehicles supply power to the 12V
socket only when the ignition is in the ACCESSORY
position or when the vehicle is running.
Note: The G-tech does not have an ON/OFF
switch. Please be sure to unplug the G-tech when exiting your vehicle so as to not drain your vehicle’s battery.
Quick Setup
43 G-TECH / Pro Competition User Guide, Release 3.1 43
Page 45

44 G-TECH / Pro Competition User Guide, Release 3.1
Page 46

G-Window
This section will show you how to use the G-tech
to monitor your vehicle’s performance as you are
driving.
G-Window
45 G-TECH / Pro Competition User Guide, Release 3.1 45
Page 47

Drag Strip Mode Basics
Put the G-tech into Drag Strip Mode (Figure 7 on page 15)
to measure the performance of your vehicle.
In Drag Strip Mode, you can use the G-tech:
• to monitor your acceleration and RPMs on the G-Win-
dow during everyday driving
• to measure straight-line performance (1/4 mile, 0-60
MPH, etc.) on the Run Window
When you first come up in Drag Strip Mode, the G-tech
automatically begins measuring acceleration and RPMs, and
displays the G-Window
46 G-TECH / Pro Competition User Guide, Release 3.1
(Figure 10):
Tachometer
Figure 10: Drag Strip Mode — G-Window screen
The G-Window
• Tachometer – displays vehicle RPMs
• Acceleration Bars – indicate forward and lateral (cor-
nering) G force in real time
Acceleration
Bars
has two main indicators:
Page 48

G-Window: Tachometer
e
G-Window: Acceleration Bars
The tachometer (Figure 11) indicates the vehicle redline and
shiftlight shiftpoint that you entered during the Quick Setup
Procedure.
The tach needle displays the vehicle RPMs in real-time.
Note:
adapter, there is no RPM signal, and the tachometer reading is
meaningless.
Current RPMs
Figure 11: G-Window tachometer
When the G-tech is powered by the 12V DC wall
Shiftpoint
Redlin
This section explains how to read the acceleration indicators
on the G-Window.
Note:
have already (1) calibrated your accelerometers (page 28) and
(2) done at least one acceleration run (page 52).
Note: If you have moved or re-oriented the G-tech mounting
clip since your last forward acceleration run, the acceleration
bars will not be accurate! See page 49 for more information.
The acceleration bars show instantaneous forward and lateral
vehicle acceleration.
When you punch the accelerator, you will see a surge in the
forward acceleration indicator.
When you turn your vehicle, you will see a surge in the lateral
acceleration indicator.
Dominant acceleration is indicated by the dark (solid) bar; the
shaded (grey) bar indicates lesser acceleration.
For the acceleration bars to be meaningful, you must
G-Window
47 G-TECH / Pro Competition User Guide, Release 3.1 47
Page 49

Figure 12 illustrates the major components of the accelera-
ateral
Acceleration
alue
cc
on
on
tion bars.
• Primary Acceleration Direction – shows direction of
dominant acceleration
Forward
Acceleration
Bar
L
Bar
Primary
elerati
A
Directi
Primary
Acceleration
V
Figure 12: Acceleration Bars & Primary Acceleration
Indicator
• Lateral Acceleration Bar – indicates amount of lateral
(cornering) Gs – like you see in car magazines for skidpad tests
• Forward Acceleration Bar – indicates amount of for-
ward Gs
• Primary Acceleration Value – shows amount of domi-
nant acceleration
Figure 13 summarizes how to read the Primary Acceleration
Direction Indicator.
If you see... It means you are...
Accelerating forward strongly
Braking strongly
Turning left
Turning right
Figure 13: Primary Acceleration Direction Indicator
48 G-TECH / Pro Competition User Guide, Release 3.1
Page 50

Self-leveling the G-tech
Note: If the G-tech is mounted in your vehicle and the vehicle is not moving, both acceleration bars should register very
close to 0.000g. If not, you need to “self-level” the G-tech.
If your G-Window acceleration bars do not read zero when
your vehicle is stopped, you need to help the G-tech determine which direction is forward. We call this process “selfleveling.”
To self-level the G-tech, simply do an acceleration run
(page 52). You need only go far enough to trigger the G-tech
and start the E.T. clock... just a few feet.
Once you have done this, DO NOT move the G-tech
mounting clip. Leave it in exactly the same mounting position
that it was in when you did the acceleration run.
When you get back to the G-Window, the G-tech’s acceleration bars should read very close to 0.000 when the vehicle is
stopped.
Example 1: Typical display during forward driving
Strong Forward Acceleration
Forward Acceleration Bar is darkly shaded – indicates that
•
forward acceleration is dominant, i.e. stronger than lateral
acceleration
• Primary Acceleration Direction is pointing up – indicates
that acceleration is forward (arrow would point down if you
braked hard)
• Primary Acceleration Value reads 0.646g – indicates
amount of forward acceleration
• Lateral Acceleration Bar is lightly shaded and very small –
indicates the vehicle is not quite going in a straight line (if
vehicle were going perfectly straight ahead, there would be
no lateral acceleration, only forward)
G-Window
49 G-TECH / Pro Competition User Guide, Release 3.1 49
Page 51

Example 2: Typical display accelerating out of a corner
Strong Lateral Acceleration
Lateral Acceleration Bar is darkly shaded – indicates that
•
lateral (sideways) acceleration is dominant, i.e., stronger than
forward acceleration
• Primary Acceleration Direction is pointing left – indicates
that lateral acceleration (and turn) is to the left (arrow
would point right if vehicle were turning to the right)
• Primary Acceleration Value reads 0.644g – indicates the
amount of lateral acceleration, like a skidpad rating for a car
• Forward Acceleration Bar is lightly shaded and small – indi-
cates the vehicle is not experiencing significant lateral acceleration
50 G-TECH / Pro Competition User Guide, Release 3.1
Page 52

Acceleration Runs
This section will show you how to use the G-tech
to measure your vehicle’s straight-line performance.
Acceleration Runs
51 G-TECH / Pro Competition User Guide, Release 3.1 51
Page 53

Measuring Your Runs
To perform a timed measurement of your vehicle’s straightline acceleration, the G-tech has a special display called the
Run Window.
You will use the Run Window to make measurements such
as:
• 1/4 mile E.T. and speed
• 0-60 MPH measurements
• braking distance measurements
• horsepower and torque measurements
To get to the Run Window
• Make sure that the G-tech is in Drag Strip Mode, dis-
playing the tachometer on the G-Window
• Press
You will initially see the Staging Screen as shown in Figure 14.
:
.
Figure 14: Staging Screen
Note:
means it is configured to use the reaction time light tree. Please
refer to “Reaction Time / Start Mode” on page 128 for information on disabling the reaction time light tree.
At this point, the G-tech is making sure that the vehicle is
completely stopped. This process takes about 1 second, and
is called “staging” in this manual.
After about 1 second, the Upper Left LED will begin blinking,
and the screen will appear as in Figure 15. At this point, the
G-tech is ready for you to perform an acceleration run.
If your G-tech does not look like Figure 14, that
52 G-TECH / Pro Competition User Guide, Release 3.1
Page 54

Blinking
Figure 15: G-tech is staged and ready to go
Note: If your G-tech continues to read “Staging...” for more
than 1 second after the screen in Figure 14 appears, the accel-
erometers need to be re-calibrated. Press to go back to the
G-Window screen with the tachometer and refer to “Calibrating
Accelerometers” on page 28 for details on this procedure.
To begin an acceleration run, press the throttle and accelerate your vehicle briskly off the line.
The G-tech will detect the forward acceleration and automatically start the E.T. clock. The blinking LED will go off once
you have launched successfully.
Note:
amount of “oomph” off the starting line, so don’t baby it! If your
G-tech doesn’t start its E.T. clock, try launching your car with
more force.
During the acceleration run, the horsepower, torque, and
RPM indicators will be updated in real-time. The E.T. clock
will continue to run as well.
As you move forward and pass certain milestones, the Gtech will automatically display them for you, as shown in Figure 16:
Figure 16: G-tech screen during a run
To avoid false starts, the G-tech requires a decent
0-60 MPH time
1/8 mile time
60ft time
E.T. clock
Tachometer
• Tachometer — indicates instantaneous vehicle RPMs
Acceleration Runs
53 G-TECH / Pro Competition User Guide, Release 3.1 53
Page 55

• E.T. clock — indicates elapsed run time
The G-tech stores the time for each of the following milestones as you pass them:
• 60 ft. time (displayed in real-time)
• 330 ft. time
• 0-60 MPH time (displayed in real-time)
• 660 ft. (1/8 mile) time and speed (displayed in real-time)
• 1000 ft. time
• 1/4 mile time and speed
Stopping the E.T. clock
Simply letting off the gas and coasting for a brief period will
cause the G-tech’s clock to stop automatically. In fact, any
one of the following conditions will cause the clock to stop:
User...
Ve hi cl e .. . coasts for a little over 1 second
Speed... exceeds 300 MPH
Distance... exceeds 4000 ft.
Elapsed Time... approaches 1 minute
presses button
Note:
G-tech will automatically give you all results up to the point when
the run stopped. The next section describes the conditions that
cause a run to stop.
54 G-TECH / Pro Competition User Guide, Release 3.1
You don’t need to do a full 1/4 mile to get results. The
Note:
clock will continue running. This is to allow braking distance
measurements. If you are not interested in braking distance,
simply let off the throttle and coast until the E.T. clock stops.
When the E.T. clock stops, the display freezes and shows you
the latest measured values (Figure 17).
If you brake strongly at the end of a run, the E.T.
Page 56

If you completed a full 1/4 mile run, the E.T. clock will show
the E.T.; otherwise, it will show the value when the clock
stopped.
Viewing Run Results
The HP value that is displayed represents the peak horsepower measured during the run
For information on viewing peak HP & TQ, please refer to
“HP & Torque vs RPMs” on page 72.
.
Figure 17: G-tech screen at completion of 1/4 mile run
When you are done viewing the information on this screen,
press to leave the Run Window
ing Menu.
Note: If you do not reach at least the 60 ft. mark during a
run, no results will be saved and you will be returned immediately to the G-Window instead.
and view the Run View-
When a run has completed and you press , you will see
the Run Viewing Menu as in Figure 18.
Figure 18: G-tech Run Viewing Menu
The G-tech automatically assigns a name to each run you
make. The name is based on the date and the run results.
Every run can be renamed, but for now let’s concentrate on
viewing the results.
Since “Results” is already selected in the menu, simply press
to view the results for the run you just did.
The first screen you will see (Figure 19) shows the 1/4 mile
results, reaction time and rollout distance:
Acceleration Runs
55 G-TECH / Pro Competition User Guide, Release 3.1 55
Page 57

Figure 19: G-tech 1/4 mile results screen
Note:
measuring feature (page 128). Thus, the “Reaction” field reads
0.000.
Note: If you do not travel a full 1/4 mile, the “E.T.” and
“Speed” fields will read 0.000.
In this example, we did not use the Reaction Time
After you have reviewed the run milestones, press to
return to the Run Viewing Menu (Figure 18).
There are other entries in the Run Viewing Menu that we will
explore soon, but for now let’s concentrate on the basic
functionality.
Press to leave the Run Viewing Menu, and you will see
the Run Save Menu (Figure 21).
To view all the milestones from your run, press again to
get the Milestones screen (Figure 20).
Figure 20: G-tech milestones screen
Note: The G-tech will display “0.000” for any milestone
that you did not reach during the run.
56 G-TECH / Pro Competition User Guide, Release 3.1
Figure 21: Run Save menu
At this point you can:
• Save the run with the title that was created automati-
cally by the G-tech (see “Saving a run / default name” on
page 58)
• Rename the run to a title that you prefer and then save
the run (see “Renaming and saving a run” on page 60)
• Discard this run altogether (i.e., discard the results)
Page 58

• View Run Again and return to the Run Viewing Menu
For now, let’s just discard these results, since we are just getting familiar with the G-tech. We will come back to the other
choices later in this manual.
Discarding Run Results
Discarding a run causes you to lose all the information about
the run forever.
Therefore, when you select “Discard this run” from the Run
Save Menu, the G-tech requires that you confirm this decision (Figure 22).
Figure 22: Confirmation before discarding run
Press to confirm. The G-tech will discard all the results,
and return to the main window in Drag Strip Mode, the GWindow.
Acceleration Runs
57 G-TECH / Pro Competition User Guide, Release 3.1 57
Page 59

Saving a run / default name
As mentioned before, once you finish a run, you will press
to view the Run Viewing Menu (Figure 18 on page 55).
You will be presented with a menu similar to Figure 23:
Figure 23: G-tech Run Viewing menu
To reach the Run Save Menu at this point, you can either
scroll down to the menu item labeled “Exit” and press , or
you can simply press . Now you will see the G-tech Run
Save menu (Figure 24):
Figure 24: G-tech Run Save menu
To save the run with the standard name, select “Save this
run” and press .
The G-tech will display a message as shown in Figure 25 as it
saves all the run data into its internal memory.
Figure 25: G-tech display while run is being saved
Notice that the G-tech gives you an update on how much
free memory you have left after saving the run.
58 G-TECH / Pro Competition User Guide, Release 3.1
Page 60

G-tech Stored Runs Capacity
The G-tech can store approximately 300 total seconds of
racing. For example:
Typical Run Length Typical Number of Runs Stored
10 seconds 30 runs
12 seconds 25 runs
15 seconds 20 runs
20 seconds 15 runs
This is a rough guideline — you should always be aware of
how much free storage memory you have left (See “Checking Free Memory” on page 62.)
The G-tech imposes a limit of 30 runs total that can be
stored, regardless of length. Enthusiasts who store many
short runs might encounter this situation. If you do encounter
this situation, you will see the following screen when you
attempt to store the 31st run:
Acceleration Runs
Figure 26: G-tech 30 file limit warning
Press to delete a file to make space for the run you just
performed. You will then be presented with the following
screen:
Figure 27: Choose a file to delete
Press to cancel, or press to automatically replace the
selected file with the new run.
59 G-TECH / Pro Competition User Guide, Release 3.1 59
Page 61

The G-tech Keyboard Screen
Renaming and saving a run
Some of the G-tech features allow you to enter text. The Gtech has an on-screen keyboard to allow this.
• Use to move the selection cursor
around the keyboard
• Press to append the currently-selected character
to the text in the entry area
• To erase a letter in the entry area, move the selection
cursor to the back-arrow ( ), and press .
When done, press the button or move the cursor to
“Enter” on the keyboard, and press .
Entry Area
Keyboard
By default, the G-tech auto-names every run that you save by
using the date and run results to create the name.
However, there may be times where you wish to rename a
run with information (such as the track name, the vehicle,
weather conditions, etc.) that is more meaningful to you.
Refer back to the G-tech Run Save menu in Figure 24. However, instead of accepting the default name, this time we will
rename the run.
Select “Rename, then save”.
1
60 G-TECH / Pro Competition User Guide, Release 3.1
Page 62

Use the keyboard (page 60) to edit the run name.
2
First you will erase the original name.
Now use the keyboard (page 60) to enter the new
3
run name.
To finish, either move the selection cursor to the
4
“Enter” key on the keyboard and press , or simply press .
The run will be saved with the new name.
5
Acceleration Runs
61 G-TECH / Pro Competition User Guide, Release 3.1 61
Page 63

Checking Free Memory
Since the G-tech allows you to store runs internally, over
time you may begin to use up the free memory.
Deleting stored runs (p. 96) will free up memory. Also, you
may want to download your runs to the PC (p. 99) for future
analysis before deleting them.
The length of the stored run determines how much memory
it uses inside the G-tech (longer runs take up more memory).
You can use the following procedure to check how much
free memory you have left in your G-tech.
Start in Drag Strip Mode.
1
2
Press to bring up the Drag Strip Main Menu,
then press to select “Stored Runs.”
3
Press to choose “Select a run.”
62 G-TECH / Pro Competition User Guide, Release 3.1
Page 64

A screen such as this will appear (yours may look a
4
little different). The top line of the display shows
you how much free memory you have.
Saving a run / low on memory
Suppose you perform a run and then want to save the run,
but the G-tech doesn’t have enough free memory.
In this situation, the G-tech will give you an opportunity to
delete one or more of your saved runs to make room for the
new run.
Should this occur, you will see a screen such as Figure 28.
Figure 28: Low on Memory Warning
At this point, you have two choices:
• If you decide you don’t want to save the run, press
• If you want to save the run, press to delete one or
more of your stored runs in order to make room
Acceleration Runs
63 G-TECH / Pro Competition User Guide, Release 3.1 63
Page 65

If you press , a screen resembling Figure 29 will appear.
Figure 29: Deleting runs to free memory
The top line (“required”) indicates how much room you
need to free up before saving the run. In this example, the Gtech is indicating that you need to free up 3.1% more memory.
The line below it (“selected”) indicates how much room will
be freed if you delete the run that is currently selected. In this
example, the G-tech is indicating that if you delete the current run (which is named “05/08/02 12.557-114.9”), it will
free up 4.2% of the memory.
Since 4.2% is larger than the required 3.1%, deleting this run
will allow you to save the new run.
Use the arrow keys to move to between different runs.
If you press , the selected run will be deleted, and the
numbers will be updated accordingly.
Once you have deleted enough runs to make room for the
new run, the new run will automatically be saved.
64 G-TECH / Pro Competition User Guide, Release 3.1
Page 66

Analyzing Runs
This section will show you how to use the G-tech
to review and analyze the details of your runs.
Analyzing Runs
65 G-TECH / Pro Competition User Guide, Release 3.1 65
Page 67

Loading a Stored Run
Use the following procedure to recall/load a stored run.
Start in Drag Strip Mode.
1
2
Press to bring up the Drag Strip Main Menu,
then press to select “Stored Runs.”
3
Press to choose “Select a run.”
4
Use , , , and to select a run, and then
press to load it.
66 G-TECH / Pro Competition User Guide, Release 3.1
Page 68

A menu such as this will appear. The name of the
5
run you selected is on the top line. Since “View this
run” is selected, press .
While the run is being loaded, the G-tech displays a
6
screen such as this.
Once the run has been loaded, the G-tech displays
7
the Run Viewing Menu as shown below. Notice
that the name of the run you selected is on the top
line.
Analyzing Runs
67 G-TECH / Pro Competition User Guide, Release 3.1 67
Page 69

Overview — Run Viewing Menu
The Run Viewing Menu (Figure 30) provides you with many
options for analyzing your runs.
Figure 30: Run Viewing Menu
You can choose to view your run immediately after completing it, and you can also recall it later.
Figure 31 on page 71 provides an overview of each option in
the Run Viewing Menu. Use it to become familiar with what
each option does and then choose the options that interest
you.
68 G-TECH / Pro Competition User Guide, Release 3.1
Page 70

Run Viewing Menu
Menu Item Graph Provides Useful For... Go to...
Results 60 ft. time, 330 ft. time, 0-60 MPH
time, 1/8 mile E.T. and trap speed,
1000 ft. time, 1/4 mile E.T. and trap
speed
HP & TQ
vs RPM
Graph of Horsepower & Torque
curves for a particular gear and
RPM range
• Measuring vehicle’s straight line
performance
• Getting a “dyno plot” of your
vehicle
• Determining the best shift point
p. 72
Analyzing Runs
p. 72
69 G-TECH / Pro Competition User Guide, Release 3.1 69
Page 71

Menu Item Graph Provides Useful For... Go to...
HP vs time Graph of Horsepower output
throughout the run
• Estimating effects of wind drag
on your vehicle
• Looking at horsepower through-
out the run
p. 74
RPM vs
time
Speed vs
time
70 G-TECH / Pro Competition User Guide, Release 3.1
Graph of Vehicle RPMs throughout
the run
Graph of Vehicle speed throughout
the run
• Seeing where you shifted into
each gear
• Measuring time between gear
shifts
• Detecting wheelspin
• Measuring time to get from one
speed to another speed (e.g. 0100 MPH, 50-70 MPH, 0-100-0
MPH, etc.)
p. 75
p. 78
Page 72

Menu Item Graph Provides Useful For... Go to...
Gs vs time Graph of Forward acceleration
throughout the run
Braking
Distance
Figure 31: G-tech Run Viewing Menu Capabilities
Graph of Speed vs. Distance • Measuring how many feet it
• See how strong your car was
pulling (accelerating) throughout the run
• See how many negative Gs your
car pulls while braking hard
• Detecting wheelspin
takes your vehicle to stop from a
given speed
p. 86
p. 88
Analyzing Runs
71 G-TECH / Pro Competition User Guide, Release 3.1 71
Page 73

Results
HP & Torque vs RPMs
The “Results” menu entry provides you with all the information you’d get from a dragstrip timeslip, including milestones
such as 60 ft. time, 1/8 mile time and speed, etc. For runs performed with a reaction time start mode (
time is given as well.
For more information on the “Results” menu entry, please
refer to “Viewing Run Results” on page 55.
p. 129), your reaction
One of the most exciting features of the G-tech is its ability
to measure and graph your vehicle’s horsepower and torque
against an RPM range.
The G-tech’s “HP & TQ vs RPM” menu entry provides you
with a graph of horsepower and torque in an RPM range.
This is the “dyno plot” that everyone is accustomed to seeing.
After you perform a run, the G-tech analyzes the data and
then creates a graph based on the gear in which maximum
horsepower was attained.
Note: In order for you to get consistent HP & TQ graphs,
there is an optimal driving technique to use. This technique is
different than the driving technique you would use for a quick 1/
4 mile!
Please refer to “Horsepower, Torque & G-tech” on page 157 for
more information on optimal technique for performing horsepower runs.
72 G-TECH / Pro Competition User Guide, Release 3.1
Page 74

To view the horsepower (HP) and torque (TQ) graph for a
run, select the menu choice titled “HP & TQ vs RPM” and
press :
Note:
Vehicle weight is displayed because the G-tech uses
vehicle weight in the horsepower calculation. If you accidentally
entered the wrong weight, the calculated horsepower will be off.
Refer to “Horsepower, Torque & G-tech” on page 157 for more
information on vehicle weight and horsepower/torque calculations.
To proceed to the HP & TQ vs RPM graph, press again.
Analyzing Runs
You will see a screen (Figure 32) that gives you a summary of
the horsepower and torque measurements for the run.
You will see a graph such the one shown in Figure 33. Of
course the shape of the curve, as well as the numbers and
ranges, will be different for your vehicle.
Peak Horsepower Marker (+)
Horsepower Cursor
Torque Cursor
RPMs
RPM value
at cursor
Torque
value at
cursor
Figure 32: Horsepower / Torque summary
The G-tech calculates horsepower and torque throughout
the RPM range measured during the run and finds the peak
value for each. It displays the values, along with the vehicle
weight, on the summary screen.
Peak Torque
Marker (+)
HP & TQ
Horsepower
value at
cursor
Figure 33: Graph of Horsepower & Torque vs RPMs
73 G-TECH / Pro Competition User Guide, Release 3.1 73
Page 75

You will notice a few things about the graph screen:
• The horsepower curve is drawn with a thick line; the
torque curve is drawn with a thin line.
• The peak horsepower and torque values are marked on
the graph with vertical bars.
• The peak horsepower and torque markers correspond
to the values seen on the Horsepower/Torque summary screen (Figure 32).
• The graph has moveable cursors for HP and TQ. The
cursors move left and right using and .
HP vs time
The “HP vs time” menu entry provides you with a graph of
horsepower throughout the run.
This is not the optimal graph for analyzing horsepower. It will
show artifacts around shiftpoints that are due to factors other
than engine horsepower. The graph will also show the
increasing effect of aerodynamic drag on the vehicle and the
corresponding lower “net horsepower” as the speed
increases.
• The HP cursor rides along the HP curve, and the TQ
cursor rides along the TQ curve.
• As the cursor moves, the “RPM,” “HP,” and “TQ” val-
ues are updated to reflect the current cursor position.
74 G-TECH / Pro Competition User Guide, Release 3.1
To view the horsepower (HP) vs. time graph for a run, select
the menu choice titled “HP vs time” and press :
You will see a graph such the one shown in Figure 34. Of
course the shape of the curve, as well as the numbers and
ranges, will be different for your vehicle.
Page 76

Cursor (current position)
RPM vs time
Change as
cursor
Horsepower
Shifts
Figure 34: Graph of horsepower vs time
• As you move the cursor with and , the horse-
power and time values are adjusted to match the cursor.
• Note the “dips” in measured horsepower on the 1-2
shift and the 2-3 shift
• This was a “3rd gear horsepower run” because the user
spent the most time in 3rd gear
• Each tic mark on the horizontal axis represents 1 second
• Each tic mark on the vertical axis represents 10 HP
Time
moves
The “RPM vs time” menu entry provides you with a graph of
vehicle RPMs throughout the run.
This is one of the most-used G-tech graphs.
By looking at the data in this graph, you can find out:
• how much time you spent in each gear
• what time each shift occurred
• how long each shift lasted
• the RPM range in each gear
• the RPMs (and implied gear) for each milestone
• whether you experienced wheelspin (look for a sudden
sharp rise in RPMs)
• whether you should stay in a particular gear longer for
better results (for example, maybe you’re shifting into
4th gear just before the 1/4 mile mark and would actually benefit from remaining in 3rd gear through the finish
line)
Analyzing Runs
75 G-TECH / Pro Competition User Guide, Release 3.1 75
Page 77

To view the RPM vs. time graph for a run, select the menu
choice titled “RPM vs time” and press :
RPMs
60ft. mark
Cursor (current position)
Both
change as
cursor
moves
Milestone
In order to give you the feel and excitement of the run, the
RPMs are replayed in real-time, just as they were happening
during the run. This means that if you did a 15-second run, it
Region
Figure 35: Graph of RPMs vs Time
will take 15 seconds to draw the RPM plot. During RPM
replay, the G-tech illuminates an LED at any point where the
shiftlights were on during the run.
Note:
To finish the replay quickly, rather than in real-time,
simply press the button while it is being drawn.
Once the graph is fully drawn, you will see a graph such the
one shown in Figure 35.
Note:
Your graph will look different due to your driving style
On this graph, and move the cursor along the RPM
curve.
As the cursor moves, the RPM value and timestamp value
adjust to reflect the values at the cursor position.
Each tic mark on the horizontal axis represents 1 second.
Each tic mark on the vertical axis represents 1000 RPM.
and vehicle.
76 G-TECH / Pro Competition User Guide, Release 3.1
Time
Page 78

RPMs rise
after launch
RPMs drop
during launch
Launched here (clock starts)
330 ft.
60 ft.
60 mph
1/8 mile
1000 ft.
1/4 mile
Analyzing Runs
Figure 36: RPMs vs Time — launch
You will see a tall vertical bar on the graph that marks the
launch where the G-tech began timing.
Thus you can see what your RPMs were at launch, and even
for a brief period before launch.
Generally you will see a dip in RPMs at the launch, as the
clutch engages and loads the engine.
Note:
By using the G-tech to analyze graphs of your RPMs (p. 75) and
your forward acceleration (p. 86), you can perfect your launch
technique and improve your times!
77 G-TECH / Pro Competition User Guide, Release 3.1 77
The launch is perhaps the most crucial part of a run.
Figure 37: RPMs vs Time — milestones
You will see a plus sign (+) on the graph at each place where
a milestone occurred (Figure 37). When you move the cursor over a milestone marker, the milestone region will be
updated with the name of the milestone and its timestamp.
Note:
either direction) to update the milestone region. If you move the
cursor near another milestone, but not over it, the milestone
region will not
Assuming that you let off the throttle during a shift, note that
by placing the cursor at each peak in the graph, you can
determine the time and RPM value where you shifted into
each gear.
You must move the cursor over a milestone (from
be updated.
Page 79

Figure 38 shows how to use this graph to analyze the time
spent in each gear and how long each shift took.
Speed vs time
Start of shifts (clutch disengaged, let off
throttle, RPMs drop)
2nd gear
1st gear
.
End of shifts (clutch re-engaged, re-apply
throttle, RPMs rise again)
3rd gear
Figure 38: RPMs vs time — shifts and gears
You can determine how long a gear shift took by doing the
following:
• place the cursor at a peak RPM value for one gear and
make note of the time
• move the cursor to the right just until the RPMs begin
rising again and make note of the time
The difference between these times is the shift time. Your
vehicle actually slows a bit during shifts, so keep this time to a
minimum!
The “Speed vs time” menu entry provides you with a graph
of speed throughout the run.
You can use this graph to measure things such as:
• time to get from one speed to another speed (e.g., 0-50
MPH, 40-60 MPH, etc.)
• time to accelerate from 0 to a certain speed, and brake
to 0 again (e.g., 0-100-0 test)
• time to brake to a halt from a particular speed (e.g., 60-
0 braking time)
To view the speed vs. time graph for a run, select the menu
choice titled “Speed vs time” and press :
78 G-TECH / Pro Competition User Guide, Release 3.1
Page 80

You will see a graph such as the one shown in Figure 39. Of
course the shape of the curve, as well as the numbers and
milestones, will be different for your vehicle.
70 MPH marker
Cursor
80MPH marker
A plus sign (+) marks where each 10 MPH increment
occurred on your run. Whenever you move the cursor past a
plus sign, the numbers on the bottom of the graph are
updated to reflect the time to get to that speed from 0 MPH.
For example, when you move the cursor over the 7th plus
sign, the numbers reflects the 0-70 MPH time.
Analyzing Runs
Note:
Speed
Speed at cursor
Figure 39: Graph of Speed vs time
You can use and to move the cursor on the graph.
As you move the cursor, the current speed and elapsed time
indicators are updated to match the cursor position.
Each tic mark on the horizontal axis marks a 1-second difference.
Each tic mark on the vertical axis marks a 10 MPH difference.
79 G-TECH / Pro Competition User Guide, Release 3.1 79
Time
Time at cursor
the cursor rolls over a different 10 MPH marker.
The speed milestone indicator will not change until
Page 81

Measuring 0-40 MPH, etc.
Suppose you want to measure the time it takes you to reach
a certain speed (say, 40 MPH) from a standstill. This section
will show you how to do it.
Note: In this example, we measure 0-40 MPH time, but
you can use the same procedure to measure the time it takes to
reach any speed you wish.
Perform an acceleration run, making sure you hit
1
the speeds you want to measure.
In this example, we are measuring 0-40 MPH, so
we made sure the driver reached 40 MPH during
the acceleration run.
80 G-TECH / Pro Competition User Guide, Release 3.1
Page 82

To view the Speed vs. Time graph, select the menu
2
choice titled “Speed vs time” and press :
Measuring 50-70 MPH, etc.
Suppose you want to measure a vehicle’s acceleration at
highway speeds (sometimes referred to as a “passing test”).
This test is often done in the vehicle’s top gear (5th or 6th
gear in most vehicles) to measure how well the vehicle can
accelerate on the highway without downshifting.
Analyzing Runs
On this graph, notice how the speed (vertical axis)
3
rises for a while, and then falls again. This is because
the vehicle braked to a complete stop at the end of
the run.
For now (0-40 MPH), we only care about the rising
part of the graph, during acceleration from 0 to 40
MPH.
Use the keys to move the cursor over the
40 MPH milestone on the rising part of the graph.
The 0-40 MPH time is displayed.
81 G-TECH / Pro Competition User Guide, Release 3.1 81
You may also wish to use this feature to measure the same
interval (e.g. 50-70 MPH) in several different gears. For example, many vehicles can cover 50-70 MPH in 2nd gear, 3rd
gear, 4th gear, and 5th gear. This measurement will tell you
which single gear is the best choice for this speed range.
Let’s suppose you want to measure your 50-70 MPH time.
This example will show you how to use the G-tech to do it.
Note:
cedure described below -- we have just chosen 40-60 MPH for
this particular example.
You can measure any interval you wish using the pro-
Page 83

Perform an acceleration run, making sure you hit
1
the speeds you want to measure.
In this example, we are measuring 40-60 MPH, so
we made sure the driver reached 60 MPH during
the acceleration run.
To view the Speed vs. Time graph, select the menu
2
choice titled “Speed vs time” and press :
82 G-TECH / Pro Competition User Guide, Release 3.1
Page 84

On this graph, notice how the speed (vertical axis)
3
rises for a while, and then falls again. This is because
the vehicle braked to a complete stop at the end of
the run.
For measuring the 40-60 MPH acceleration time,
we only care about the rising part of the graph, during acceleration from 40 to 60 MPH.
Use the keys to move the cursor over the
40 MPH milestone on the rising part of the graph.
Press and a box will be drawn around the 40
MPH milestone.
Since the cursor is still on 40 MPH, a 40-40 MPH
time of 0.000 is displayed.
4
Now use the key to move the cursor over the
60 MPH milestone on the rising part of the graph.
Since the cursor is now on 60 MPH, the 40-60
MPH time is displayed.
Analyzing Runs
83 G-TECH / Pro Competition User Guide, Release 3.1 83
Page 85

Measuring 0-100-0, etc.
This ensures the only light that will come on during your
run is the 60 MPH speedmark light.
Suppose you want to perform the classic 0-100-0 MPH
timed measurement... how quickly can your vehicle reach 100
MPH, and how quickly can it bring the vehicle back to a stop?
The G-tech provides you with all the tools you need to perform this test!
This section will show you how to perform this measurement.
Note:
0 - 60MPH - 0 MPH. You can measure “0 - <any speed> - 0”
you wish using the procedure described below -- we have just
chosen 0 - 60MPH - 0 MPH for this particular example.
When doing a test like this, we recommend:
Next, set the speed mark to the desired speed (in this case,
60 MPH - see page 105 for details on setting the speed
mark).
In this example, we demonstrate measuring
• disabling all distance marks (page 106)
• disabling your shiftlights (page 110)
To do the 0-60-0 test:
Launch your vehicle and start an acceleration run
1
(page 52).
84 G-TECH / Pro Competition User Guide, Release 3.1
Page 86

Keep accelerating until the speedmark light comes
2
on.
Immediately brake hard, all the way to a stop.
3
Keep the vehicle at a stop until the E.T. clock stops
4
counting (about one second once you have completely stopped).
Bring up the “Speed vs time” graph for this run.
5
Analyzing Runs
85 G-TECH / Pro Competition User Guide, Release 3.1 85
Page 87

Notice the “upside down V” shape to the curve.
6
Use the key to move the cursor all the way to
the right hand side of the screen. In this case, the
driver actually went up to 61 MPH, so we get the
0-61-0 time, which is displayed on the bottom line.
Gs (Acceleration) vs time
Gs (pronounced like “Geez”) are a measure of acceleration.
The “Gs vs time” menu entry provides a graph of forward
acceleration (“Gs”) vs time. Larger G values indicate stronger
acceleration.
This graph is useful for seeing how hard your vehicle was pulling when it was accelerating (positive Gs) and how hard it
was decelerating while braking (negative Gs.)
To view the Gs vs. time graph for a run select the menu
choice titled “Gs vs time” and press :
You will see a graph such the one shown in Figure 40.
86 G-TECH / Pro Competition User Guide, Release 3.1
Page 88

Accelertation(Gs)
Forward Gs at cursor
Cursor
Time
Time at cursor
0Gs
Accelerating
(Positive Gs)
Shifts
(Gs drop)
Braking
(Negative Gs)
Analyzing Runs
Vehicle
stopped
(0Gs)
Figure 40: Graph of Gs vs time
Some things to note about this graph:
Figure 41: Braking and accelerating
• When the G plot is above the horizontal axis, it means
the vehicle is accelerating.
• As with other graphs, you can use and to move
the cursor. The G-reading and timestamp always reflect
their respective readings at the current cursor position.
• Each tic mark on the horizontal axis marks 1 second
• When the G plot is below the horizontal axis, it means
the vehicle is decelerating (e.g. coasting, braking).
• The brief dips you see in the graph are shift points.
When you shift, you temporarily remove power, and
• Each tic mark on the vertical axis marks 0.1G of acceler-
ation
Figure 41 highlights some other useful information on the
graph.
this causes the vehicle to decelerate briefly, until you reengage the next gear.
• In a very powerful vehicle, or a traction-limited vehicle,
you may also spot dips in acceleration that are not due
to shifts.
87 G-TECH / Pro Competition User Guide, Release 3.1 87
Page 89

These are due to more power being applied to the
wheels than can be handled. The net result is that the
wheels spin and the vehicle does not accelerate.
Braking Distance
• The large dip you see at the end of the graph is hard
braking at the end of the run.
• Notice at the end of the graph, Gs are zero. This is
because the vehicle came to a stop. Hence there is no
acceleration or deceleration.
The “Braking Distance” graph is useful for seeing how many
feet it took your vehicle to stop from a specific speed.
For example, you can use this graph to determine 60-0 MPH
braking distance. This is a common measurement in automobile reviews.
As another example, when upgrading the brakes or tires on
your car, you might be interested in a “before” and “after”
comparison of your braking distance.
This graph also allows you to view intermediate braking
results, such as 100MPH - 40MPH, or any other endpoints
you choose.
Note:
your run, and let the E.T. clock stop
not be very useful to you.
If you do not brake to a complete stop at the end of
, the data on this graph will
88 G-TECH / Pro Competition User Guide, Release 3.1
Page 90

Perform an acceleration run, ending the run by
1
braking hard to a complete stop. Make sure that
the E.T. clock continues to run until the vehicle is completely stopped. If the E.T. clock stops before the
vehicle has come to a stop, your results will not be
meaningful.
To view the braking distance graph, select the
2
menu choice titled “Braking distance” and press :
Analyzing Runs
89 G-TECH / Pro Competition User Guide, Release 3.1 89
Page 91

You will see a graph such the one shown below.
3
On the vertical axis, the tic marks identify 10 MPH
increments.
Each plus sign (+) identifies a 10 MPH milestone
during vehicle braking.
The cursor is “live” and can be moved along the
plot with and .
Cursor
30MPH
Speed(MPH)
Distance (ft.)
20MPH
10MPH
As the cursor is moved, the “current speed” and
4
“distance to stop” fields are updated. Each time the
cursor is rolled over a plus sign on the graph, the
braking milestone information is updated for that
milestone. In the following graph:
• At the cursor, “current speed” is 29.4 MPH,
and “distance to stop” is 45ft. Thus, it took 45
ft. to stop from 29.4 MPH.
• The braking milestone information indicates
that it took 47 feet to brake from 30 MPH.
Moving the cursor further to the right would
give braking distance from 20 MPH, 10 MPH,
etc.
Cursor at 29.4 MPH
30MPH
Braking Milestone
Information
90 G-TECH / Pro Competition User Guide, Release 3.1
Current Speed
at Cursor
Distance to Stop
from 29.4 MPH
Page 92

For intermediate braking results (e.g. 50-20 MPH), use the
button while on a milestone, as shown in the following
example.
Move the cursor to the right until it reaches the 20
2
MPH milestone. The G-tech displays the braking
distance from 50-20 MPH.
Move the cursor to the upper milestone, and press
1
. In this example we will measure 50-20 MPH
braking distance, so we put the cursor on the 50
MPH milestone and press . A box appears
around the milestone, indicating that braking distance will be measured relative to 50 MPH.
91 G-TECH / Pro Competition User Guide, Release 3.1 91
Move the cursor to the left until it reaches the 60
3
MPH milestone. The G-tech displays the braking
distance from 60-50 MPH.
Notice that in all cases, the bottom line of information always reflects the braking distance from the
current cursor position to 0 MPH.
Analyzing Runs
Page 93

92 G-TECH / Pro Competition User Guide, Release 3.1
Page 94

Stored Runs
This section will show you how to rename, delete,
and download your stored runs to a PC.
Refer to “Saving a run / default name” on page 58
for more information on storing runs in your Gtech.
Stored Runs
93 G-TECH / Pro Competition User Guide, Release 3.1 93
Page 95

Recalling a Stored Run
Reviewing Stored Run
Once you have stored a run in the G-tech, you can recall it at
any time and examine its details.
Please refer back to “Loading a Stored Run” on page 66 for
details on loading (recalling) a stored run.
Once the run has been loaded, you can do any of the following:
• View the run results (milestones, E.T., graphs, etc.)
See “Reviewing Stored Run” on page 94.
• Rename the run
See “Renaming A Stored Run” on page 95.
• Delete the run from the G-tech’s internal memory
See “Deleting a Stored Run” on page 96.
• Download the run to the PC
See “Downloading A Stored Run” on page 97.
Once you have recalled a run from the G-tech (page 66),
you can review the run as follows:
1
Select “View this run” and press .
While the run is being loaded, you will see a screen
2
similar to the following:
94 G-TECH / Pro Competition User Guide, Release 3.1
Page 96

At this point, the Run Viewing Menu will appear as
3
shown.
For details on using the Run Viewing menu, please
refer to “Overview — Run Viewing Menu” on
page 68.
Renaming A Stored Run
Once you have recalled a stored run from the G-tech
(page 66), you can rename it as follows:
1
Select “Rename this run” and press .
At this point, the procedure is the same as renam-
2
ing a new run. Please refer to “Renaming and saving
a run” on page 60.
Stored Runs
95 G-TECH / Pro Competition User Guide, Release 3.1 95
Page 97

Deleting a Stored Run
Once you have recalled a stored run from the G-tech
(page 66), you can choose to delete it from the G-tech’s
internal memory. This will free up memory so that you can
store other runs.
The procedure to delete a recalled run is as follows:
1
Select “Delete this run” and press .
2
The following screen will appear. Press if you
want to delete the run, or if not.
96 G-TECH / Pro Competition User Guide, Release 3.1
Page 98

Downloading A Stored Run
Use the following procedure to send the current run to a
computer:
Once you have recalled a stored run from the G-tech
(page 66), you can transfer it from the G-tech to a computer.
Note:
from the G-tech.
Note: Before transferring a run to the computer, you should
connect the serial cable between the G-tech and the computer.
Refer to “G-tech-Computer Connection” on page 157 for more
information on connecting the G-tech to a computer. You should
also ensure that the G-tech Performance Analysis System Software (PASS) is ready to receive data from the G-tech. Further
instructions are provided with the PC software.
Transferring a run to the computer does not delete it
1
Select “Download to PC” and press .
You will see a screen such as this. The computer
2
and the G-tech will “see” each other and begin
communicating back and forth.
You can press at any time to abort the process,
even if the G-tech has not begun the transfer.
Stored Runs
97 G-TECH / Pro Competition User Guide, Release 3.1 97
Page 99

Deleting ALL Stored Runs
At some point, you may wish to delete all of the stored runs
in your G-tech.
2
Press to bring up the Drag Strip Main Menu,
then press to select “Stored Runs”.
Note:
information about the runs in your G-tech. Be sure this is what
you want to do before proceeding!
Use the following procedure to delete all the stored runs on
your G-tech.
1
98 G-TECH / Pro Competition User Guide, Release 3.1
This is a drastic step that will cause you to lose all
Start in Drag Strip Mode.
3
Choose “Delete all” and press .
Page 100

You will see this screen.
4
To proceed with the delete, press .
To cancel this and keep all your runs intact, press
.
Downloading All Stored Runs
At some point, you may wish to download all of the stored
runs in your G-tech.
Perhaps you want to analyze all your runs in more detail on a
computer, or perhaps you just want to transfer all your runs
to a computer so you can delete them on the G-tech.
Stored Runs
Note:
5
To finish the process, press . To cancel this and
keep all your runs intact, press .
99 G-TECH / Pro Competition User Guide, Release 3.1 99
connect the serial cable between the G-tech and the computer.
Refer to “G-tech-Computer Connection” on page 157 for more
information on connecting the G-tech to a computer. You should
also ensure that the G-tech PASS PC software is ready to receive
data from the G-tech. Further instructions are provided with the
PC software.
Note:
from the G-tech.
Before transferring a run to the computer, you should
Transferring runs to the PC does not remove them
 Loading...