

GSV GPS-702, GSV4004B, GPS-702GG User Manual

GSV GPS Silicon Valley
GSV4004B
GPS IONOSPHERIC SCINTILLATION & TEC MONITOR
(GISTM)
USER'S MANUAL
(1 August 2007)
1131 Seena Avenue, Los Altos, CA 94024, USA 1-650-961-8250
1-650-961-7461 (FAX)

TABLE OF CONTENTS
Getting Started .................................... 1
Installation .................................... 2
Running GSV4004B
GSV4004B Scintillation/TEC Logs
GSV4004B Specific Commands .................................... 8
Tracking SBAS (WAAS, EGNOS, MSAS) SVs ………………………… 9
C/A-To-P Biases ………………………… 10
SLOG Details .................................... 11
Off-Line Utility Programs .................................... 14
Suggested Scintillation Analysis Procedures ………………………… 17
Directions For Loading New Firmware 23
Appendix A – EuroPak-3M and L1/L2 Antenna
Data Sheets
Appendix B – Example SLOG Script for
Periodic Files for 60-Second Logs
Appendix C – Example SLOG Script for
Recording High-Rate (50-Hz) Logs
Appendix D – ISMVIEW4 Off-Line Utility
Program
Appendix E – SBAS PRN Assignments ………………………… E-1
.................................... 3
.................................... 3
A-1
………………………… B-1
………………………… C-1
................................... D-1
LIST OF TABLES
I. Specific GSV4004B Data Logs .................................... 3
II. RAWSINB Data Log - Message ID = 327 .................................... 5
III. ISMRB Data Log - Message ID = 274
IV. C/A-to-P SV Biases (May 2003)
V. Threshold Parameters Specified in
ScintRaw Script
VI. PARSEISMR Extracted Data Fields ………………………… 14
VII. PARSESIN Extracted Data Fields ………………………… 15
D.1. Key-Stroke Commands
D.2. Extracted Data Fields .................................... D-4
.................................... 6
………………………… 11
.................................... 12
.................................... D-3
ii

LIST OF FIGURES
1. GSV4004B GPS Ionospheric Scintillation and TEC Monitor ......... 2
2. Example Phase Sigma Plots in a Non-Scintillation
Environment for GPS PRNs
3. Example Phase Sigma Plots in a Non-Scintillation
Environment for an SBAS GEO
4. Example Corrected S4 Plots in a Non-Scintillation
Environment for GPS PRNs
5. Example Corrected S4 Plots in a Non-Scintillation
Environment for an SBAS GEO
6. Example Estimated Multipath Error Plotted Against Corrected
S4 in a Non-Scintillation Environment for GPS PRNs
7. Example Estimated Multipath Error Plotted Against Corrected
S4 in a Non-Scintillation Environment for an SBAS GEO
8. Example Detrended Raw Amplitude and Phase Data in a
Non-Scintillation Environment for GPS PRN 2 Where S4
Exceeded 0.3
D.1. ISMVIEW4 Main Menu ......... D-1
D.2. ISMVIEW4 Display ......... D-2
D.3. ISMVIEW SV ISMR Data Extraction
......... 18
......... 19
......... 19
......... 20
......... 20
......... 21
......... 22
......... D-3
iii

GSVGPS Silicon Valley
GETTING STARTED
INTRODUCTION
This manual covers the operation of GPS Silicon Valley’s GPS Ionospheric Scintillation and TEC Monitor
(GISTM) system Model GSV4004B. The GSV4004B, with its optional antenna, consists of three major
components: an L1/L2 GPS Antenna (NovAtel’s Model 532, 533 or GPS702), a GPS receiver (NovAtel’s
EuroPak-3M) and a power supply with various interconnecting cables. The EuroPak-3M enclosure houses the
GPS receiver and a low phase noise oven-controlled crystal oscillator (OCXO) that is required for monitoring
phase scintillation. The GPS receiver, the Euro-3M, with modified software (firmware), can track up to 11 GPS
signals signal at the L1 frequency (1575.42 MHz) and the L2 frequency (1227.6 MHz). It measures phase and
amplitude (at 50-Hz rate) and code/carrier divergence (at 1-Hz rate) for each satellite being tracked on L1, and
computes TEC from combined L1 and L2 pseudorange and carrier phase measurements. The 11
dual channels are configured as SBAS satellite tracking channels, and to measure a noise floor for C/N
correction computations. The 11
designated as Channel 12. The last half of the 12
GPS channels (Channel 0 through Channel 9) and 3 SBAS-GEO channels (Channels 10, 11 and 12).
Scintillation measurements are also available on all 3 SBAS-GEO channels. However, the phase scintillation
parameters are somewhat degraded because the SBAS networks are steering the phase of the signal.
Older optional firmware loads assigned only one SBAS-GEO channel with 11 GPS channels. That option is no
longer available.
See Appendix A for specifications for the EuroPak-3M receiver and the L1/L2 antennas. Two CDROMs are
distributed with the GSV4004B – a NovAtel CDROM and a GSV Utilities CDROM. A preliminary manual for the
EuroPak-3M is included on the GSV Utilities CDROM. However, this EuroPak-3M manual should only be used
for the hardware and installation descriptions. The NovAtel data logs from the GSV4004B are based upon
NovAtel’s OEM4 receiver, as the GSV4004B firmware is based upon OEM4 firmware. The OEM4 manuals are
also included on the GSV Utilities CDROM. This GSV4004B manual only augments the NovAtel manuals.
The primary purpose of the GSV4004B GISTM is to collect ionospheric scintillation and TEC data for all visible
GPS satellites (up to 10), and up to 3 SBAS-GEO satellites, and output data logs, called ISMRB or ISMRA, to a
serial port in either binary or ASCII format. Either of two (NovAtel GPSolution4 or SLOG) programs can be used
to control the GSV4004B operations, but SLOG is recommended for collecting scintillation logs. The
GSV4004B’s Data Logging operation can be controlled to collect the ISMR data logs that are generated every
minute. Details of the ISMR data are presented in the GSV4004B Scintillation/TEC Log section. Another offline PC-based program, ISMVIEW4.EXE, may be used to review the ISMR data. Raw 50-Hz phase and
amplitude data logs are also available.
In addition, data extraction programs are supplied for extracting records from the binary files. They are
described within. Example source C++ code is also supplied so the users can write their own extraction
programs.
This manual augments the NovAtel manuals provided with the GSV4004B. Minimum PC requirements are
specified in those manuals. If the high-speed phase and amplitude data logs are to be collected, GSV
recommends using an external high-speed serial port device as a buffer between the GSV4004B and the PC.
The GSV4004B can have serial port output rates as high as 230 kBaud. An example of such a high-speed
serial device is the Inside Out Networks Edgeport USB Expansion Module (www.ionetworks.com
have indicated that certain PC serial ports cannot cope with the high-speed logs.
From time-to-time, there may be GSV4004B firmware upgrades. If there is an upgrade, it will be distributed free
of charge, most likely via email. A section in the manual is devoted to instructions for loading the upgraded
firmware.
th
dual channel is designated as Channels 10 and 11. The 12th dual channel is
th
dual channel is the noise floor channel. Thus, there are 10
th
and 12th
and S4
0
). Test results
1 August 2007
1
GSVGPS Silicon Valley
INSTALLATION
INSTALLING HARDWARE
Figure 1 presents the GSV4004B and an optional antenna (GPS-702 or GPS-702GG)
Panel is described in the NovAtel manual for the EuroPak-3M enclosure. See the applicable NovAtel manuals
for hardware installation instructions.
1
. The GSV4004B Rear
GSV4004B GPS-702 or GPS-702GG L1/L2 Antenna
Figure 1. GSV4004B GPS Ionospheric Scintillation and TEC Monitor and Optional Antenna
INSTALLING SOFTWARE
The NovAtel GPSolution4 software program is distributed on the NovAtel CDROM provided with the
GSV4004B. It can be installed using the “autorun” feature on the CDROM. Then, simply execute the program
from Windows and follow instructions. Consult the NovAtel manuals for operating instructions.
After installation, set up GPSolution4 to recognize the special GISTM logs as follows:
1. Open GPSolution4, and open the appropriate GSV4004B serial port (computer port, not the receiver
port).
2. Select "Update All Convert4 Log Definitions" from the main menu.
3. “Updating Convert4 Conversion Definitions” will appear in the status bar. Once updated, GPSolution4
and Convert4 will be aware of the ISM logs.
4. These procedures are not necessary for subsequent execution of GPSolution4 and Convert4.
GPSolution4 is no longer supported by NovAtel, so it is recommended that SLOG and the parsing utilities
defined herein be used (or other programs developed by the user). The SLOG and other utility programs are
distributed on the second utilities CDROM provided with the GSV4004B. For SLOG and the utility programs,
simply copy all files from the CDROM to a sub-directory you have selected on your hard disk. The SLOG
program manual and example script files used by SLOG are provided on the CDROM, as is this manual.
1
The GSV-702 antenna has been discontinued by NovAtel. The GSV-702GG replaces it and covers the GLONASS band.
However, GLONASS satellites are not tracked by the GSV4004B.
1 August 2007
2
GSVGPS Silicon Valley
RUNNING THE GSV4004B
INITIALIZING THE GSV4004B
The GSV4004B initializes itself upon power-up and begins to acquire satellites using default information. It
automatically locks to the 10 MHz OCXO internal to the enclosure. However, the following non-factory
configuration command should be sent to the receiver to ensure that the GSV4004B provides valid low-phase
noise scintillation parameters:
CLOCKADJUST DISABLE
to disable receiver hardware clock adjustments (to GPS time). These clock adjustments could cause jumps in
the phase data. The downside to this is that clock drift over a very long period of time could cause the
receiver’s time offset from GPS to exceed its limits, but unlikely. Since the clock adjustments should be very
small, the user may chose to not use this command.
Other specific GSV4004B commands controlling filter bandwidths are described later. Default values are set in
the GSV4004B.
RECORDING DATA ON HARD DISK
Either NovAtel’s GPSolution4 or SLOG programs can be used to select data logs from the GSV4004B. These
logs will be continuously recorded to a specified disk file. (It is recommended that SLOG be used to avoid
possible Windows crashes. However, GPSolution4 is excellent for monitoring general receiver performance in
a Windows GUI environment, especially during installation. SLOG is a Windows based program as well that is
executed using the Command Prompt; it does not have a Windows GUI.) The use of SLOG is described in the
SLOG Details Section.
GSV4004B SCINTILATION/TEC LOGS
In addition to the data logs described in the NovAtel manuals, the GSV4004B supports the scintillation/TEC data
logs listed in Table I. For each selected data log, you may also select one the following trigger methods:
Table I. Specific GSV4004B Data Logs
LOG ID BYTE COUNT DESCRIPTION
RAWSINB 327 H + 4 + (n * 420) GISTM 50-Hz phase and amplitude data, and 1-Hz TEC data
(rate = 1 per sec)
DETRSINB 326 H + 4 + (n * 420) GISTM detrended RAWSINB data (rate = 1 per sec)
ISMRB 274 H + 4 + (n*152) GISTM main data record (rate = 1 per 60 sec)
Note: n is the number of SVs being tracked.
RANGEB and RANGEA Data Logs. These NovAtel logs will be slightly different that specified in the
OEM4 manual in that there will be an odd number of observations when a GEO is tracked in the 12th channel
(Channel 11a). Nothing is reported for the noise-floor half of the 12
DATA LOG FORMATS
1 August 2007
3
th
channel (Channel 11b).

GSVGPS Silicon Valley
These three data logs, ISMRB, RAWSINB and DETRSINB, are peculiar to the GSV4004B. Please refer to
NovAtel's GPS OEM4 Receiver User Manuals for detailed descriptions of other data logs.
BINARY LOG STRUCTURE
The structure of the binary messages is given in the NovAtel manuals.
RAWSINB Data Log. The receiver collects raw phase measurements and raw amplitude measurements at
50 Hz rate (i.e. 50 sets of measurements a second) and stores them in the binary RAWSINB data log every
second on the second. Continuous data will be recorded when the ONTIME trigger is specified with 1.0 second
period. Each log contains data blocks for all the satellites being tracked. Each data block contains 50 sets of
data; the first set is at time specified in Time of Week (TOW), the second set at TOW+0.02 seconds, and so on.
The ADR (phase) in this log is that of the tracking model. It contains frequencies up to the tracking loop
bandwidth (default at 10 Hz). This log also includes raw 1-second TEC and ΔTEC data. The format of the
RAWSINB data logs is given in Table II.
The scale factor of the raw power measurements is meaningless. This is because the actual receiver and
antenna gains are unknown. In the end, this does not matter because subsequent detrending and forming of
S4 will normalize the measurements.
The raw phase measurements include satellite motion, the rate of change of the ionosphere and satellite and
receiver oscillator drift. Thus, observation scintillation in the measurements without detrending is not possible,
although the use of FFT programs with windowing may be used without detrending.
DETRSINB Data Log. The DETRSINB data log has the Message ID of 326. The data log is the same
format as the RAWSINB log, with the exception that the data it contains is the receiver-detrended scintillation
data, and the scale of the power measurements is Ratio * 1048576 (ratio of raw to low-pass filtered). The
DETRSINB data logs should not be requested at the same time the RAWSINB data logs are requested to
prevent port overload. The GSV4004B will ignore the second request unless the original request is canceled
(un-logged).
DETRSINB data logs are different if the “60-second averaging” amplitude detrending is selected. If this 60second averaging is selected, the detrended data is simply the raw data divided by the previous 1-minute raw
data average. See more detail on this below under the discussions of the Filter Bandwidth command. Further
detrending (by averaging) is recommended to remove the ambiguity between 60-second intervals.
1 August 2007
4

GSVGPS Silicon Valley
Table II. RAWSINB Data Log - Message ID = 327
Message byte count = H + 4 + (n * 420) (n = the number of SVs being tracked)
Field # Data Bytes Format Units Offset
1 header H 0
2 Number of SV observations 4 integer H
For First SV observation
3 PRN 2 integer H+4
4 reserved 2 H+6
5 L1 TEC at TOW 4 float TECU H+8
6
L1 ΔTEC (1-sec) at TOW
7 First L1 ADR 8 double cycles H+16
8
L1 ΔADR for TOW + 0.00
9 L1 Power for TOW + 0.00 4 unsigned integer (nbp-wbp)*
10
L1 ΔADR for TOW + 0.02
11 L1 Power for TOW + 0.02 4 unsigned integer (nbp-wbp)*
...
107
L1 ΔADR for TOW + 0.98
108 L1 Power for TOW+ 0.98 4 unsigned integer (nbp-wbp)*
109... For Next SV Observation
* See text regarding scale factor (units) for detrended power.
ISMRB Data Log. Both the RAWSINB and the DETRSINB data logs described above contain only raw or
detrended-raw measurements (TEC, TEC-phase, phase and amplitude). They are available for diagnostic or
analytical purposes. The user must supply data analysis programs to process this raw data. A data reduction
program is supplied with the GSV4004B ISM to convert the data to a convenient ASCII format. However, the
receiver automatically reduces these raw measurements every minute on the minute and stores the results in
the ISMRB data log. The GSV4004B provides continuous data at the specified ONTIME (or ONNEW) trigger
with a 60 second period. Each log contains data blocks for the all satellites being tracked, including an SBAS
GEO, if one has been assigned and is visible. The format of the ISMRB data log is given in Table III.
TEC Calculations
the satellite and is reported in TEC Units (TECU = Electrons *10
ionospheric delay between L1 and L2 signals.
TEC = [9.483 * (PR
where:
PR
L2
PR
L1
Δ
C/A-P,PRN
TEC
TEC
TEC (Total Electron Content) is a measure of the number of electrons along the path from
L2
– PR
L1
- Δ
C/A-P,PRN
is the L2 pseudo-range in meters
is the L1 pseudo-range in meters
is the input bias between SV C/A- and P-code code chip transitions in meters (see below)
is the TEC result due to internal receiver L1/L2 delay
RX
is the user defined TEC offset
CAL
4 float TECU H+12
4 signed integer millicycles H+24
/10000
4 signed integer millicycles H+32
/10000
4 signed integer millicycles H+41
/10000
-16
). The number is proportional to the
) + TEC
+ TEC
RX
CAL
] TECU
H+28
H+36
8
H+42
0
1 August 2007
5

GSVGPS Silicon Valley
Table III. ISMRB Data Log - Message ID = 274
Message byte count = H + 4 + (n * 152) (n = number of SVs being tracked)
Field #
Data
1 Header H 0
2 Number of SV observations 4 integer N/A H
For First SV observation
3 PRN 2 integer N/A H+4
4 SV Azimuth angle
5 SV Elevation angle
6 C/N0 8 double dB-Hz H+16
7 Total S4 8 double dimensionless H+24
8 Correction to total S4 8 double dimensionless H+32
9 1-second phase sigma 8 double radians H+40
10 3-second phase sigma 8 double radians H+48
11 10-second phase sigma 8 double radians H+56
12 30-second phase sigma 8 double radians H+64
13 60-second phase sigma 8 double radians H+72
14 Average of Code/Carrier
divergence
15 Sigma of Code/Carrier Divergence 8 double meters H+88
16 TEC at TOW - 45 4 float TECU H+96
17
ΔTEC from TOW - 60 to TOW - 45
18 TEC at TOW - 30 4 float TECU H+104
19
ΔTEC from TOW - 45 to TOW - 30
20 TEC at TOW - 15 4 float TECU H+112
21
ΔTEC from TOW - 30 to TOW - 15
22 TEC at TOW 4 float TECU H+120
23
ΔTEC from TOW - 15 to TOW
24 L1 Lock time 8 double seconds H+128
25 Channel status 4 integer H+136
26 L2 Lock Time 8 double seconds H+140
27 L2 C/N0 8 double dB-Hz H+148
28... For Next SV Observation
Note 1: Data may also be included for SVs that are unhealthy. However, the Azimuth and Elevation may be set
to 0. All scintillation data will still be valid. The TEC values may be set to 0 because of the
unavailability of the Tau_GD value.
is the nominal L1/L2 receiver delay (converted to TECU) hard-coded as a data base parameter, and
TEC
RX
TEC
is an input parameter supplied by the user, since the receiver differential delay may change slightly with
CAL
time, and will be different from unit-to-unit. The units are calibrated against WAAS prior to shipment and the
TEC
value is indicated on the bottom of the unit and on its shipping carton (for shipments after 1 July 2002).
CAL
The TEC is also corrected for satellite inter-frequency biases (Tau_GD – see ICD-GPS-200D), but not for the
SV C/A-to-P biases. These biases are available on a JPL website (see a later section in this document) and
can be input to the GSV4004B during initialization (see below). As an alternative, the values of these biases
can be converted to TECU and added to the logged TEC values.
ΔTEC is based upon carrier phase measurements at L1 and L2. For an ionospheric delay measured in L1
carrier cycles, the total electron content becomes
1
1
Bytes Format Units Offset
4 float degrees H+8
4 float degrees H+12
8 double meters H+80
4 float TECU H+100
4 float TECU H+108
4 float TECU H+116
4 float TECU H+124
1 August 2007
6

GSVGPS Silicon Valley
ΔTEC = (1.1723 ΔPR
over the 1-second interval, where
ΔPR
measured over the 1-second interval (RAWSINB and DETRSINB) or over a 15-second interval (ISMRB).
= 1.54573 (ΔADRL1 – ΔADRL2) cycles
L1,carrier
L1,carrier
) TECU
Phase. As mentioned above for the RAWSINB data log, the receiver collects 50 raw phase measurements a
second. The raw phase measurements are first detrended with a 6th-order Butterworth high-pass filter (with a
user-specified cutoff frequency). Then, for every minute on the minute, the statistics of the residuals (of the
previous 3,000 detrended phase measurements) are computed over periods of 1 second, 3 seconds, 10
seconds, 30 seconds and 60 seconds. Thus, for every 60 seconds, 5 values (1-sec, 3-sec, 10-sec, 30-sec
and 60-sec phase sigma’s) are stored in ISMRB data log along with the time tag (in w eek number and time
of week).
Amplitude. The raw amplitude measurements are detrended (by normalization), either with a 6th-order
Butterworth low-pass filter output (with a user-specified cutoff frequency), or with the measurement average
over the 60-second interval (if the user-specified cutoff frequency is 0). The latter method is the default method
if no cutoff frequency is specified. Then, the total S4, which includes S4 due to the effects of ambient noise
(and multipath), is computed over the same 60-second interval as the phase parameters. The receiver also
computes the correction to the total S4, which is the effect of ambient noise, based upon the average of the
raw 1-Hz C/N
values over the same 60-second intervals.
0
Code/Carrier Divergence. The receiver also collects raw code/carrier divergence (difference between
code and carrier pseudorange) every second. The average and standard deviation of the code/carrier
divergence are then computed every minute on the minute. These values are indicative of multipath (and noise)
activity and can be used to distinguish between S4 due to multipath (and noise) and S4 due to scintillation,
since there is no code/carrier divergence due to scintillation. A method for using the code/carrier divergence
standard deviation is provided below.
L1 Lock Time. The L1 Lock Time indicates how long the receiver has been locked to the carrier phase on
the L1 signal. Since the phase-detrending high-pass filter has to be reinitialized whenever lock is lost, all phase
parameters (sigmas) should be discarded for any Lock Time less than 180-240 seconds (for a 0.1 Hz
bandwidth) to allow the detrending filter to re-settle. For other bandwidths, this time may vary inverseproportionally to the bandwidth. For the S4 parameters, it suffices to only discard data for any Lock Time less
than 60 seconds. S4 may also be valid for Lock Time less than 60 seconds since the power measurements are
non-coherent measurements that do not require phase lock. However, on rare occasions, total signal lock could
have been lost, so the use of S4 for Lock Time less than 60 seconds should be used with caution. However, in
those cases, the code/carrier divergence measurements could be used to discard the data.
L2 Lock Time. The Lock Time indicates how long the receiver has been locked to the carrier phase on the
L2 signal. It is an indicator of the validity of the TEC measurements. As with the L1 phase data, short Lock
Time data should be discarded.
1 August 2007
7

GSVGPS Silicon Valley
GSV4004B SPECIFIC COMMANDS
COMMANDS
The following commands are those in addition to standard NovAtel OEM4 commands:
Filter Bandwidth
This command is used in defining the bandwidths of the phase and amplitude de-trending filters, with default
values of 0.1 Hz and 0 Hz for phase and amplitude data, respectively. These default values may be changed
using the command:
SinBandWidth <PhaseFilterBW> <AmplitudeFilterBW>
This command allows the user to modify the bandwidths of the 6th-order Butterworth filters: a high-pass filter for
detrending raw phase measurements and a low-pass filter for detrending raw amplitude measurements. The
bandwidths may be individually varied between 0.01 to 1.0 Hz (phase) and 0 to 1.0 Hz (amplitude). A 0 Hz
value for the phase filter bandwidth is not valid. If 0 Hz (default value) is input for the amplitude filter bandwidth,
the amplitude detrending is accomplished using a straight 60-second average of the amplitude. This is the most
desirable method with long-fade amplitude scintillation is present, since the Butterworth detrending of amplitude
tends to become unstable and provides excessively large S4 values. However, the straight averaging method is
more susceptible to multipath fading. There is no substitute for a near multipath-free environment.
TEC Calibration Value
This command allows the user to input a TEC Calibration (TEC
An input of zero can be used, in which case measurements may be corrected during post-processing.
SinTECCalibration <CalibrationValue>
As an purchased option, a value calibrated against WAAS provided TEC data is indicated on a sticker under the
unit and on its shipping carton. Typically, with the default value of 0, the units provide TEC values that are on
the order of up to 80 TECU (for the GSV4004B – the values for the GSV4004 and GSV4004A are smaller and
sometimes negative). The value entered should be the value given on the sticker. Antennas can have an effect
on these values. Of course, the user can perform calibration as well and enter a user-determined value.
) value. The use of this value is defined below.
cal
C/A-to-P Biases
As described below, the SVs generally have a time-bias between the C/A and P code chip transitions. In order
to make the TEC values collected from the GSV4004B more accurate, the user may enter these known biases
into the GSV4004B to correct for the biases as TEC data is collected. A specific command has been
implemented. The command is
CPOffset <32 offset values>
The 32 offset values (one for each PRN, in meters) are added to the C/A code pseudorange measurements
prior to forming the TEC values.
PLL Loop Bandwidths
1 August 2007
8

GSVGPS Silicon Valley
Depending upon the environment, it may be necessary to change the L1 and L2 Phase-Lock-Loop bandwidths,
as the loops may have problems acquiring the signal. This is because the default bandwidths are set as narrow
as possible to provide the best tracking performance at lower signal-to-noise ratios. The default bandwidths are
as follows:
L1: 6 Hz
L2 0.2 Hz
The acquisition problem will cause the receiver to “give-up” on a specific signal and never track it, either on L2
alone or on both L1 and L2. If this occurs rarely, nothing should be done. However, if this occurs regularly, the
bandwidths should be increased using the LOOPSBANDWIDTH command as follows:
LOOPSBANDWIDTH [L1 PLL Bandwidth] [L2 PLL Bandwidth]
Care should be exercised using this command. It is an undocumented NovAtel command.
Command Procedure
The procedure for entering commands is given in the NovAtel OEM4 manual, Volume 2. They can either be
entered using GPSolution4 or be entered using SLOG.
TRACKING SBAS (WAAS, EGNOS, MSAS) SVs
COMMANDS
The 11a
even if not visible. To utilize this capability, use the standard Assign Command as follows:
where “10”, “11” and “12” denotes the 11a
required for each SBAS GEO. The current set of PRNs for the SBAS satellites are given in Appendix E.
In all cases, the “b” side of the 12
compute scintillation parameters for the specified SBAS GEO.
In both versions of the SLOG script described below, only one Assign command is included. Add one or two
more commands if additional SBAS GEOs are to be assigned. However, it is advisable to comment out (using ;
at the beginning of the line) commands dealing with the SBAS GEO if no SBAS GEO is visible so that the
receiver is not continually trying to acquire it. This is the Assign command described here. Also, if not within
an SBAS network, collection and copying of the WAAS18B and WAAS26B logs should be commented out as
the data would be useless for the local region where the GSV4004B is located. These logs are collected by
GPS Silicon Valley during GSV4004B testing for the purpose of TEC calibration. Software used to process
these logs is provided on the Utilities CD, but a manual is not. These logs can be converted to ASCII logs using
Convert4. The user may process this data to obtain the SBAS networks estimate of TEC by using procedures
given in RTCA DO-229C. For a nominal fee, GPS Silicon Valley can provide informal instructions (with some
manual manipulation) for using the supplied software (waasiono.exe and VertDelay.exe).
th
, 11bth and 12th channels of the GISTM are to be used to search for and track specified SBAS GEOs,
Assign 10, 11 or 12 <PRN> 0 500
th
channel is used to compute the “Noise Power.” The GISTM will measure or
th
, 11ath and 12th channels, respectively. A separate command is
C/A-TO-P SV BIASES
1 August 2007
9

GSVGPS Silicon Valley
The GSV4004B measures TEC using pseudorange measurements on the L1 and L2 frequencies. On L1, C/A
code measurements are used, while on L2, semi-codeless P code measurements are used. Unfortunately, the
satellite Tau_GD values used for correcting TEC are corrections for P code L1/L2 biases in the SV. There can
also be a bias in the SV between the C/A code phase and the P code phase. This bias will cause a bias in the
TEC output values that is different for each SV. GPS Users involved with the International GPS Service (IGS)
recognized this and have been estimating these C/A-to-P code biases. These biases are available in a file on
the following University of Berne -- http://www.aiub-download.unibe.ch/CODE/P1C1.DCB. The list will be given
in ns as a function of GPS PRN. An example of this file is included on the CDROM provided with the
GSV4004B. This information is periodically updated and may not be available, for a period of time, for new
PRNs, and may be invalid, for a period of time, for PRNs that have had redundant hardware paths changed.
Table IV provides the set of SV biases collected from the site on December 4, 2006, converted to meters. The
number 0 must be inserted for PRNs that do not exist at the time.
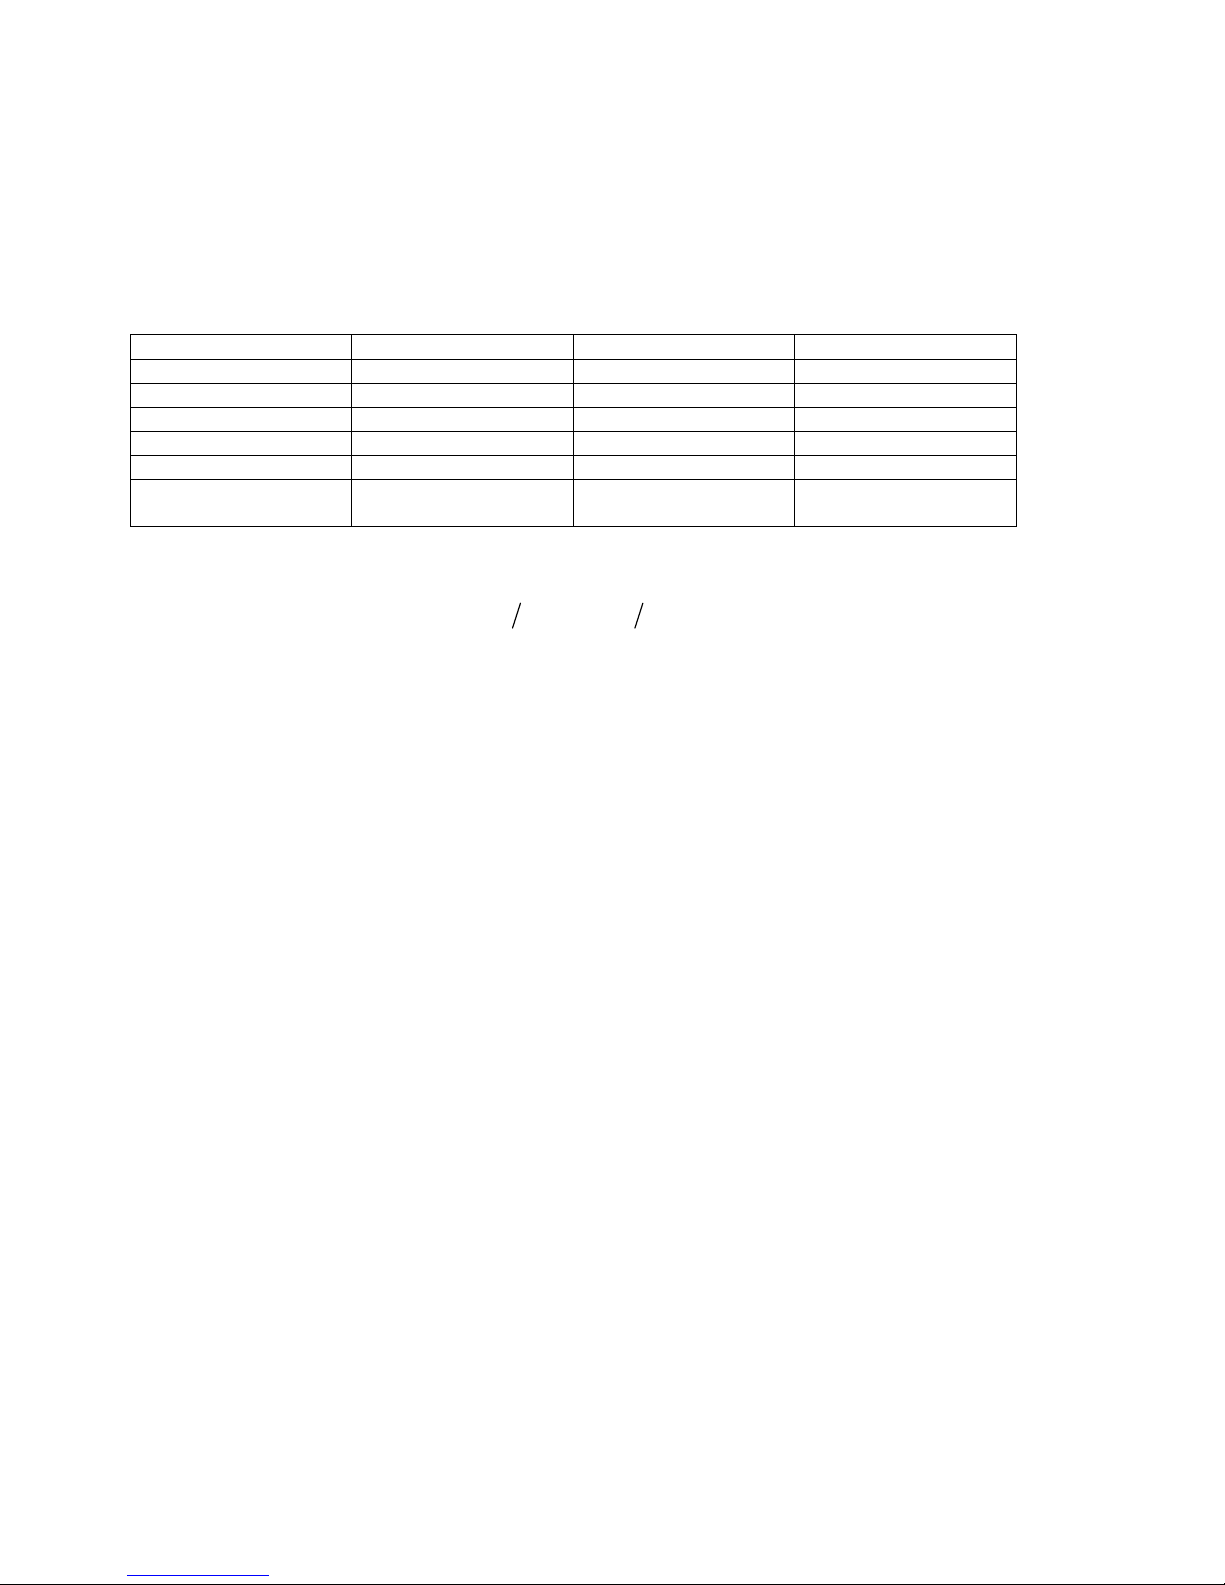
Table IV. C/A-to-P SV Biases in Meters (December 4, 2006)
CPOffset -0.0996 -0.0144 -0.132 0.3336 -0.3258 0.0813 -0.3921 -0.1647 0.0459 -0.561 0.1701
0.4803 0.4569 0.0342 -0.5022 -0.2163 0.4176 -0.1068 -0.6057 -0.4053 -0.1239 0.1566
0.0756 -0.0714 0.1404 0.2901 -0.1149 -0.081 0.165 0.5586 0.5112 0
These biases can be removed by using the CPOffset Command upon GSV4004B initialization to enter the
biases, in meters, for each PRN, such as follows:
1 August 2007
10

GSVGPS Silicon Valley
SLOG DETAILS
SLOG
SLOG can be programmed, via script, to generate new files on a periodic basis (such as a new file every day).
Example scripts to do this are given in Appendix B (for recording 60-second data) and Appendix C (for
recording 50-Hz data). The following describes these two sets of script – Scint60sec.slg and ScintRaw.slg.
SLOG revision 6n is required to operate these scripts. Older versions of SLOG will not.
SLOG accepts command line options for Com Port number (integer), file logging period in minutes (double) and
Site Name (string). That is, the command line is:
SLOG scintXXX.slg [iport] [iperiod] [ssite]
where XXX denotes the script name. If the variables are not specified, the default options are 1, 60 and blank
for COM1, 60 minutes, and no site name. The Site Name is the only control the user has over the file names
using the script in Appendix B and C. The file name for each period is as follows: Site Name_GPS Week
No._Day of Week_Hour of Day.gps, relative to GMT.
Scint60sec.slg
This version of script is designed for recording only the 60-second logs, as opposed to the high-rate 50 Hz data.
Either version of script could be used for recording only the 60-second logs. However, ScintRaw.slg always
records temporary 50 Hz data logs, even though it only saves them if parameters exceed thresholds. Saving
the logs can be controlled with appropriate definition of thresholds, however, temporary data logs are always
stored. If the PC serial port cannot handle the high-rate data, this could be a problem. Thus, if the 50-Hz data
is not desired, it is better to use a script that only records 60-second logs. An example of such script is given in
Appendix B.
ScintRaw.slg
Two of the GSV4004B logs (RAWSINB and DETRSINB) consist of a tremendous amount of data, although they
would never be logged simultaneously. Usually, however, these logs do not contain any useful information
when there is not any ionospheric scintillation activity. Thus, it is desired that the logging be selective based
upon information contained in a much lower rate (once per minute) log (ISMRB), which would be logged at the
same time. Unfortunately, this log indicates what had occurred over the previous interval, so some buffering is
required.
The following describes suggestions/requirements for logging either RAWSINB or DETRSINB based upon
information contained in ISMRB.
ScintRaw Requirements
“L” key is pressed. This same information can be used to determine if either the RAWSINB or DETRSINB log
should be recorded. The parameters of interest are SV Elevation angle, C/N
sigma, and L1 Lock time. The idea is to compare each of these (for each SV) against a threshold. If either of
the Total S4 or 60-second phase sigma thresholds are exceeded for any SV, the RAWSINB or DETRSINB log
are recorded for the current period and for N
are exceeded. The thresholds, and the value of N
in Table V.
The counter N is reset to 0 whenever either S4
for any SV, so that the current and the next N
SLOG extracts information from the ISMRB logs and displays the information when the
, Total S4, 60-second phase
0
60-second periods to follow, provided all of the other thresholds
Max
, must be specified in the ScintRaw.slg Script file as given
Max
or Sigma_Phi_60
Min
logs are recorded. It is also be reset when N
Max
and all the other thresholds are exceeded
Min
is reached. An
Max
1 August 2007
11
GSVGPS Silicon Valley
exception to this is applied to data collected from an SBAS GEO – exceeding S60
is not checked for reasons
Min
described below.
Default thresholds (and value of N
) are all 0, which means that all records would be logged. Default values
Max
are used if no values are defined in the ScintRaw.slg Script file.
Table V. Threshold Parameters Specified in ScintRaw Script
Parameter Threshold Range Units
Log Counter N N
SV Elevation Angle El
C/N0 C/N
Total S4 S4
60-Sec Phase Sigma S60
L1 Lock Time Lock
Lock
Logic for recording raw scintillation logs is as follows:
___
save raw Elev Th El C N Th C N
=≥ • ≥
()()
1_44_4
L Lock ThLock S TotalS Th S
()()
•
⎢⎥
+≥ • ≥ •<
()()(
⎢⎥
⎣⎦
≥•≥⎡⎤
1 _ 60 60 _ 60 33
L Lock ThLock S SigPhi Th S PRN
The last term of the logic prevents saving raw data when the Sigma_Phi_60 exceeds the threshold for the SBAS
satellite. This is because the SBAS network is controlling the phase of the SBAS signal and that control could
easily cause the threshold to always be exceeded.
No raw scintillation logs would be recorded if all the thresholds (not including N
(or large) value. However, temporary raw scintillation logs would continue to be recorded.
In order to prevent logging high-rate data on non-scintillation events (low C/N
suggested minimum thresholds are as follows: C/N
sec and Lock
Sig60 = 240 sec. The C/N
Min
SBAS GEO is at a higher elevation angle. The S4
Example ScintRaw.slg script is presented in Appendix C.
0 - 100 Unit-less
Max
0 - 90 Degrees
Min
0 - 60 dB-Hz
0,Min
0 – 1.5 Unit-less
Min
0 - 2 Radians
Min
Min
Min
S4 or
Sig60
0 – 600 Seconds
00
) were set to their maximum
Max
, cycle slips or multipath), the
0
= 30 dB-Hz, S4
0,Min
value could be raised if no SBAS signal is being tracked, or if the
0,Min
value is set to minimize triggering on GPS signal multipath.
Min
= 0.35, S60
Min
)
= 0.2, Lock
Min
S4 = 60
Min
1 August 2007
12

GSVGPS Silicon Valley
OFF-LINE UTILITY PROGRAMS
The following are a few useful off-line utility programs that extract binary scintillation and TEC data logs into an
ASCII format:
Parseismr.exe, Version 1.4.1.0 dated 01/14/04, extracts ISMR records from a binary file and
converts them to comma-delimited ASCII records for a specified PRN
Parseismr <PRN> <inputfile> <outputfile>
If the PRN is specified as “all” (without the quotes), records for all the PRNs will be extracted, but in
time-sequence. The output format, preceded by a comma-delimited header defining the fields, is
given in Table VI. A program such as EXCEL can be used to sort versus PRN. ASCII Azimuth and
Elevation Angle records for all PRNs can also be extracted without the other data with “azel” in the
PRN field. These directions can also be obtained by simply typing the program name. Example
parsed ISMR files are included on the GSV Utilities CDROM as *.XLD files.
Table VI. PARSEISMR Extracted Data Fields
Input
Field #
1 Week Number (WN) N/A
2 Time of Week (TOW) seconds
3 PRN N/A
4 Receiver Status (See NovAtel Manual) N/A
5 SV Azimuth angle degrees
6 SV Elevation angle degrees
7 C/No dB-Hz
8 Total S4 dimensionless
9 Correction to total S4 dimensionless
10 1-second phase sigma radians
11 3-second phase sigma radians
12 10-second phase sigma radians
13 30-second phase sigma radians
14 60-second phase sigma radians
15 Average of Code/Carrier divergence meters
16 Sigma of Code/Carrier Divergence meters
17 TEC at TOW - 45 TECU
18
19 TEC at TOW - 30 TECU
20
21 TEC at TOW - 15 TECU
22
23 TEC at TOW TECU
24
25 L1 Lock time seconds
26 Channel status N/A
27 L2 Lock Time seconds
28 L2 C/N0 dB-Hz
Data Units
ΔTEC from TOW - 60 to TOW - 45
ΔTEC from TOW - 45 to TOW - 30
ΔTEC from TOW - 30 to TOW - 15
ΔTEC from TOW - 15 to TOW
TECU
TECU
TECU
TECU
1 August 2007
13
 Loading...