

Page 1

MANUALNO.APS(GL220820)-UM-151
GL220_820APS
USER’ S MANUAL
Page 2

Contents
1. Main Features .......................................................................................................................................................4
1-1. A Variety of Display Formats ...........................................................................................................................4
1-2. Simple and Easy to Use ..................................................................................................................................5
1-3. Multichannel Measurement .............................................................................................................................5
1-4. Export to Direct Excel File Function ................................................................................................................6
1-5. Thumbnail Waveform Display .........................................................................................................................6
1-6. CSV File Batch Conversion .............................................................................................................................6
1-7. Calculation functions .......................................................................................................................................7
1-8. Printing Function, Screen Save Function ........................................................................................................7
1-9. Send Email when Alarm is Generated ............................................................................................................7
1-10. Help Function ................................................................................................................................................7
2. System Requirements ........................................................................................................................................... 8
3. Connecting to a PC (Personal Computer) .............................................................................................................9
3-1. Connecting via USB ........................................................................................................................................9
3-2. Connecting via LAN ......................................................................................................................................10
3-3. Setting USB ID or IP Address .......................................................................................................................11
3-3-1. USB Settings
3-3-2. TCP-IP Settings (GL820)
3-3-3. Example of TCP-IP Settings
4. Installing the USB Driver .....................................................................................................................................13
5. Installing the Application Software ......................................................................................................................14
6. Basic Operating Procedure .................................................................................................................................15
6-1. Controlling Device .........................................................................................................................................15
7. Launching and Exiting the Software ....................................................................................................................16
7-1. Launching the Software ................................................................................................................................16
7-2. Exiting the Software ......................................................................................................................................16
8. PC Connection Settings ......................................................................................................................................17
9. Display Screens ..................................................................................................................................................19
9-1. Y-T (Main Screen) .........................................................................................................................................20
9-2. Y-T Zoom ......................................................................................................................................................22
9-3. Digital ............................................................................................................................................................23
9-4. Report ...........................................................................................................................................................24
10. Settings Screens .................................................................................................................................................25
10-1. AMP Settings ..............................................................................................................................................25
10-1-1. Auto Zero Setting
10-1-2. Span Settings
10-1-3. Scaling Settings
10-2. Data Capture Settings .................................................................................................................................28
10-3. Trigger/Alarm Settings ................................................................................................................................31
10-3-1. Trigger Level Condition
10-3-2. Alarm Condition
10-3-3. Send Email when Alarm is Generated
.................................................................................................................................11
...............................................................................................................11
.........................................................................................................12
.........................................................................................................................27
..............................................................................................................................27
...........................................................................................................................28
................................................................................................................33
...........................................................................................................................35
.........................................................................................36
2
Page 3

10-4. Report Settings ...........................................................................................................................................37
10-5. Other Settings .............................................................................................................................................38
11. FILE menu ........................................................................................................................................................... 40
11-1. Open Data ...................................................................................................................................................40
11-2. CSV File Batch Conversion .........................................................................................................................41
11-3. Print Screen ................................................................................................................................................42
11-4. Save Screen ................................................................................................................................................43
11-5. CSV Config .................................................................................................................................................43
12. Replay Data .........................................................................................................................................................44
12-1. Y-T ..............................................................................................................................................................44
12-2. Digital ..........................................................................................................................................................45
12-3. XY ...............................................................................................................................................................46
12-4. Superimpose/Link .......................................................................................................................................47
12-5. Convert then Save ......................................................................................................................................48
12-6. Scale Operations .........................................................................................................................................48
12-7. Scroll bar .....................................................................................................................................................48
13. Other Functions ................................................................................................................................................... 49
13-1. Alarm ...........................................................................................................................................................49
13-2. Statistics/Log ...............................................................................................................................................49
13-3. About Icons .................................................................................................................................................50
13-3-1. Waveform Operation
13-3-2. Input Comments
13-3-3. Move/Search
................................................................................................................................52
....................................................................................................................50
..........................................................................................................................51
14. Operating Procedure ...........................................................................................................................................53
14-1. Capture Settings .........................................................................................................................................53
14-1-1. Settings related to AMP
14-1-2. Settings related to data capture
...............................................................................................................53
...................................................................................................54
14-2. Start .............................................................................................................................................................55
14-2-1. Displaying Past Data during a Data Capture Operation
..............................................................55
14-3. Stop .............................................................................................................................................................56
14-4. Replay Data ................................................................................................................................................56
14-4-1. Replaying File
14-4-2. Waveform display
14-4-3. Cursor Operations
14-4-4. Input Comments
14-4-5. Data Search
..............................................................................................................................56
........................................................................................................................57
.......................................................................................................................57
..........................................................................................................................58
.................................................................................................................................59
3
Page 4
Main Features1.
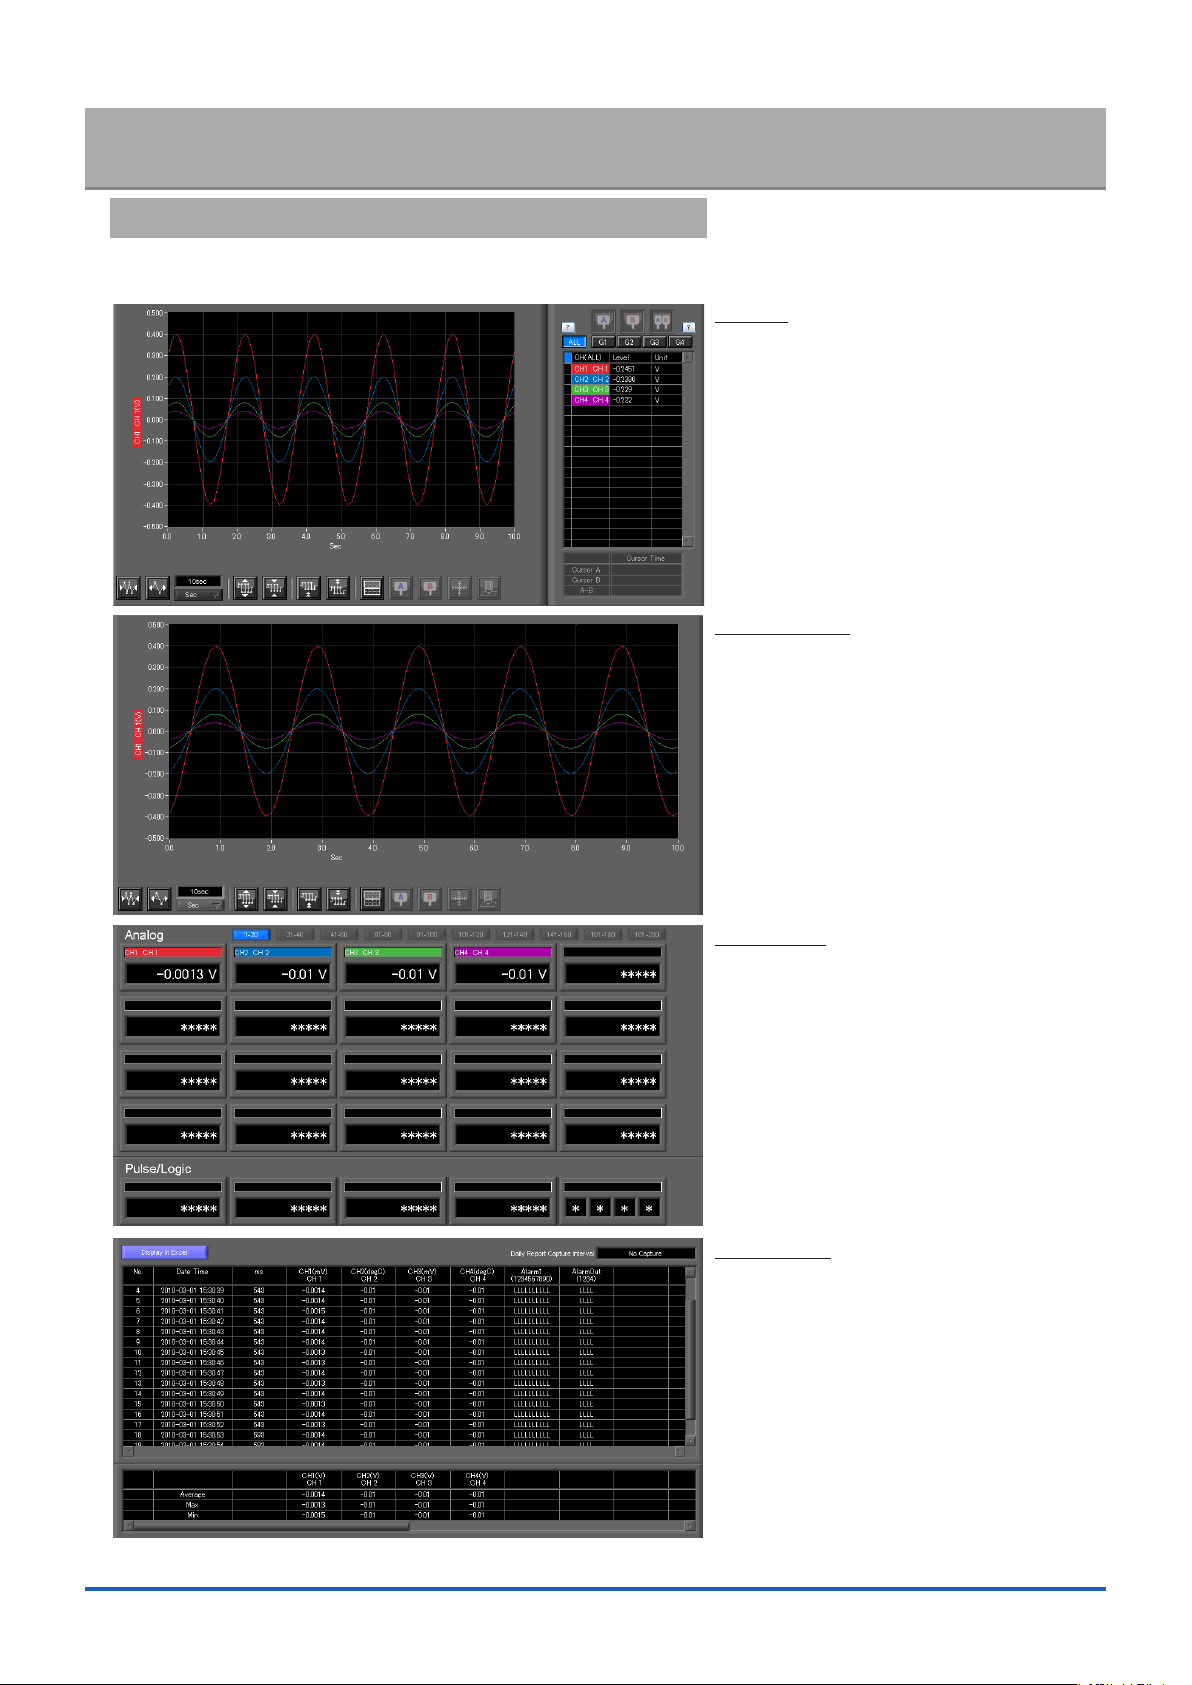
A Variety of Display Formats1-1.
Y-T View, Y-T Expanded View, Digital View, Report View are available. A large, easy-to-see screen is the characteristic
of this unit.
Y-T View
This graph shows data with the input
signal levels on the Y-axis and the time
on the X-axis. It can display a waveform
and digital values of each channel at the
same time. The control icons in the lower
part of the screen allow you to scale up
and down the time axis, X-axis, etc. This
graph can be displayed in two or ve split
screens, each showing different signals.
Y-T Zoom View
Displays waveforms along an expanded
time axis while hiding digital values.
Digital View
Displays digital values of each channel
in a large, easy-to-read numbers.
Report View
Displays the report results (daily report)
in real time when the report function is
enabled.
4
Page 5
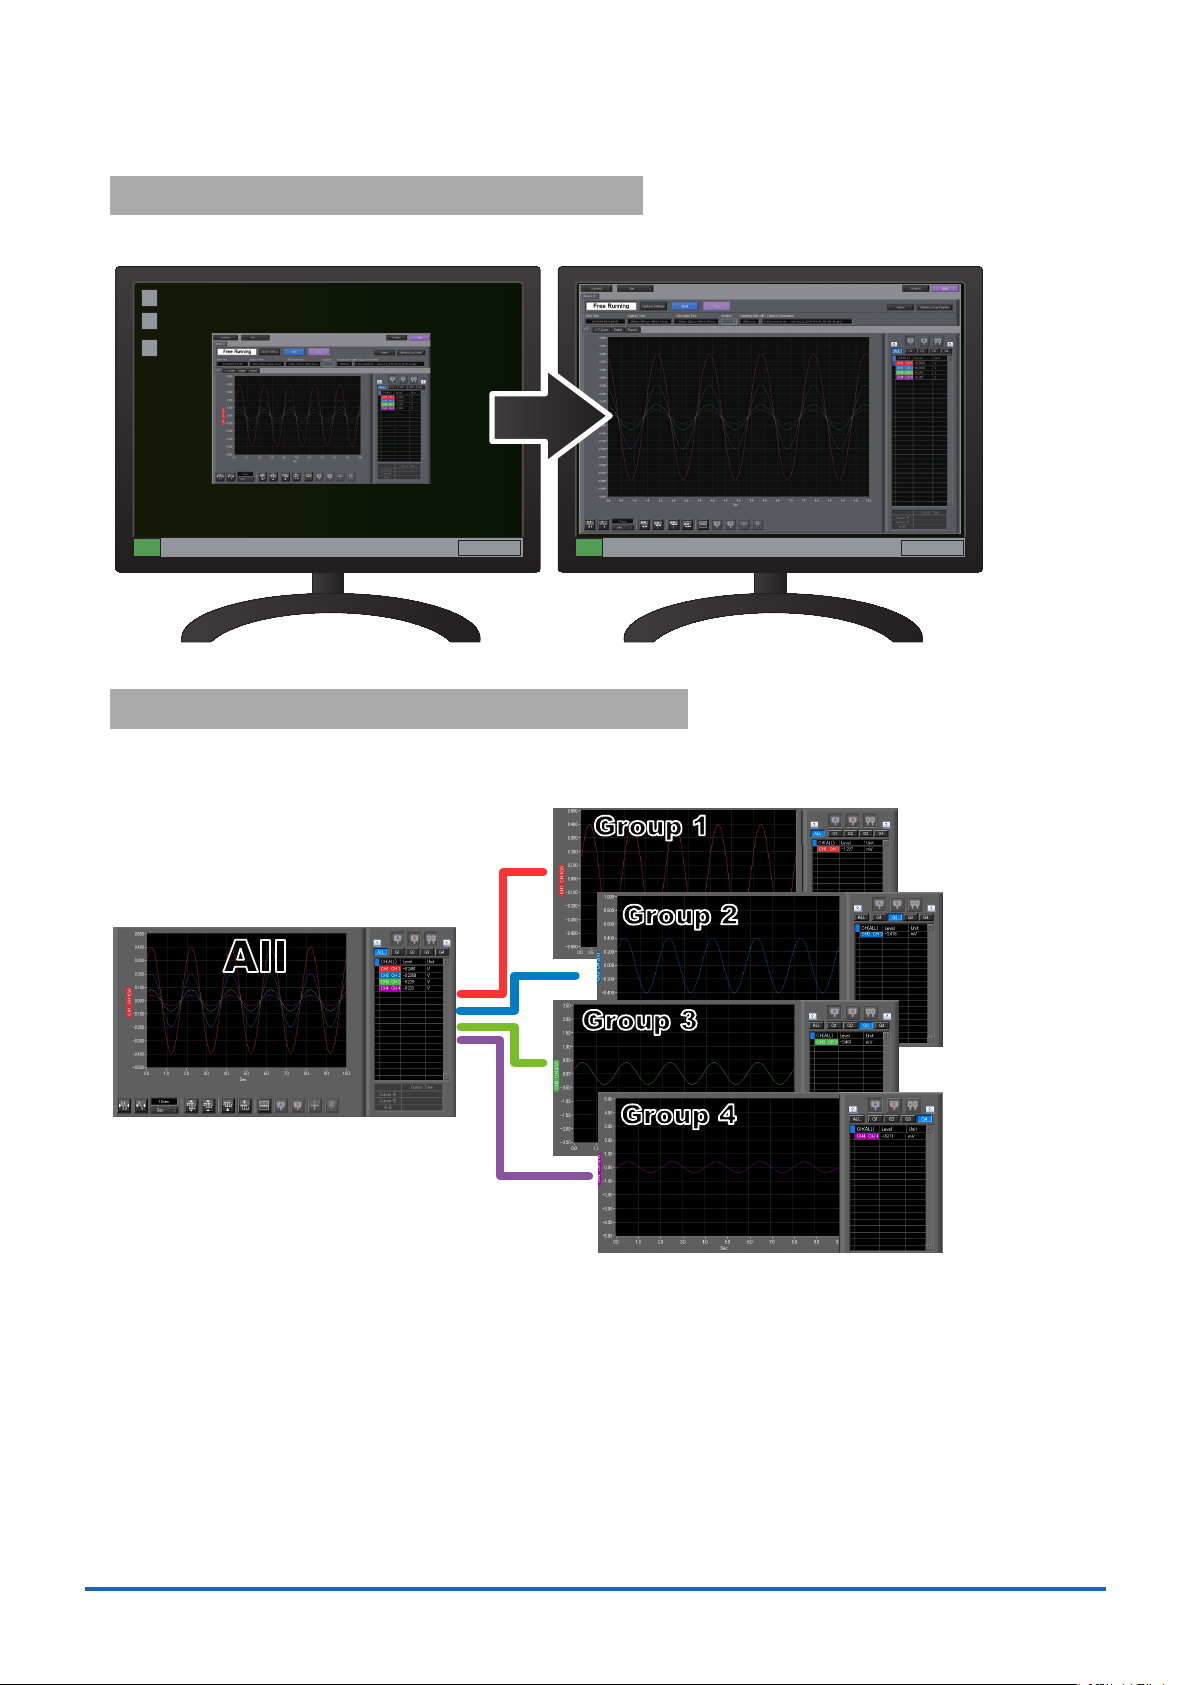
Simple and Easy to Use1-2.
Group 1
All
Group 2
Group 3
Group 4
Large icons make it simple and easy to control the waveforms. Time axes, spans, waveform positions can be changed
easily. Also, you can maximize a window to t the screen.
Multichannel Measurement1-3.
A maximum of ten device with multiple devices connected. (maximum of 500 channels)
Displayed waveforms can be grouped, and you can select and check a desired waveform among many of them
(up to four groups can be set per device).
5
Page 6
Export to Direct Excel File Function1-4.
Captured data can be exported directly to an Excel le and displayed as graphs.
Ready-to-use template les are provided as standard for your convenience.
(Note: The Microsoft Excel program must be installed.)
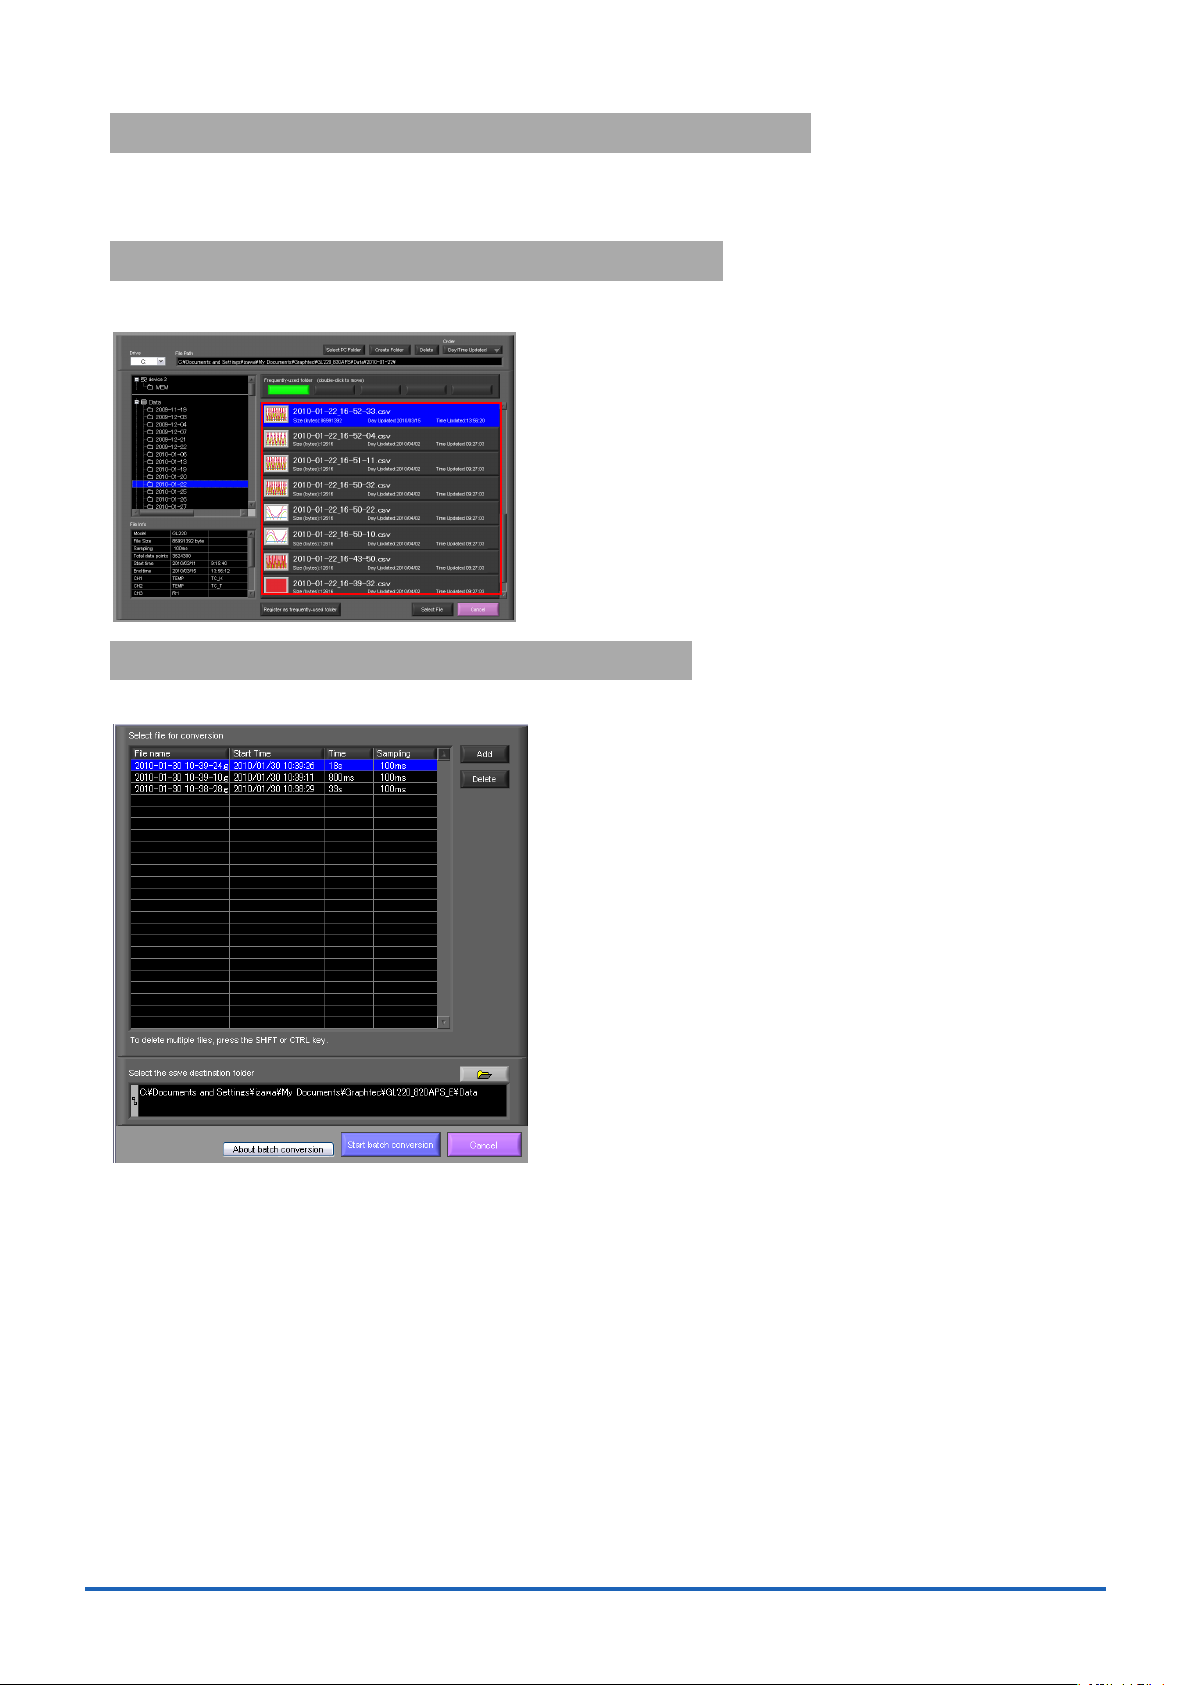
Thumbnail Waveform Display1-5.
Before replaying captured data, the waveforms can be checked by referring to the small images (thumbnails) provided
next to each le name. These thumbnails provide easy conrmation of the data before opening the le.
CSV File Batch Conversion1-6.
Data captured in binary les is converted in a batch to CSV les.
6
Page 7
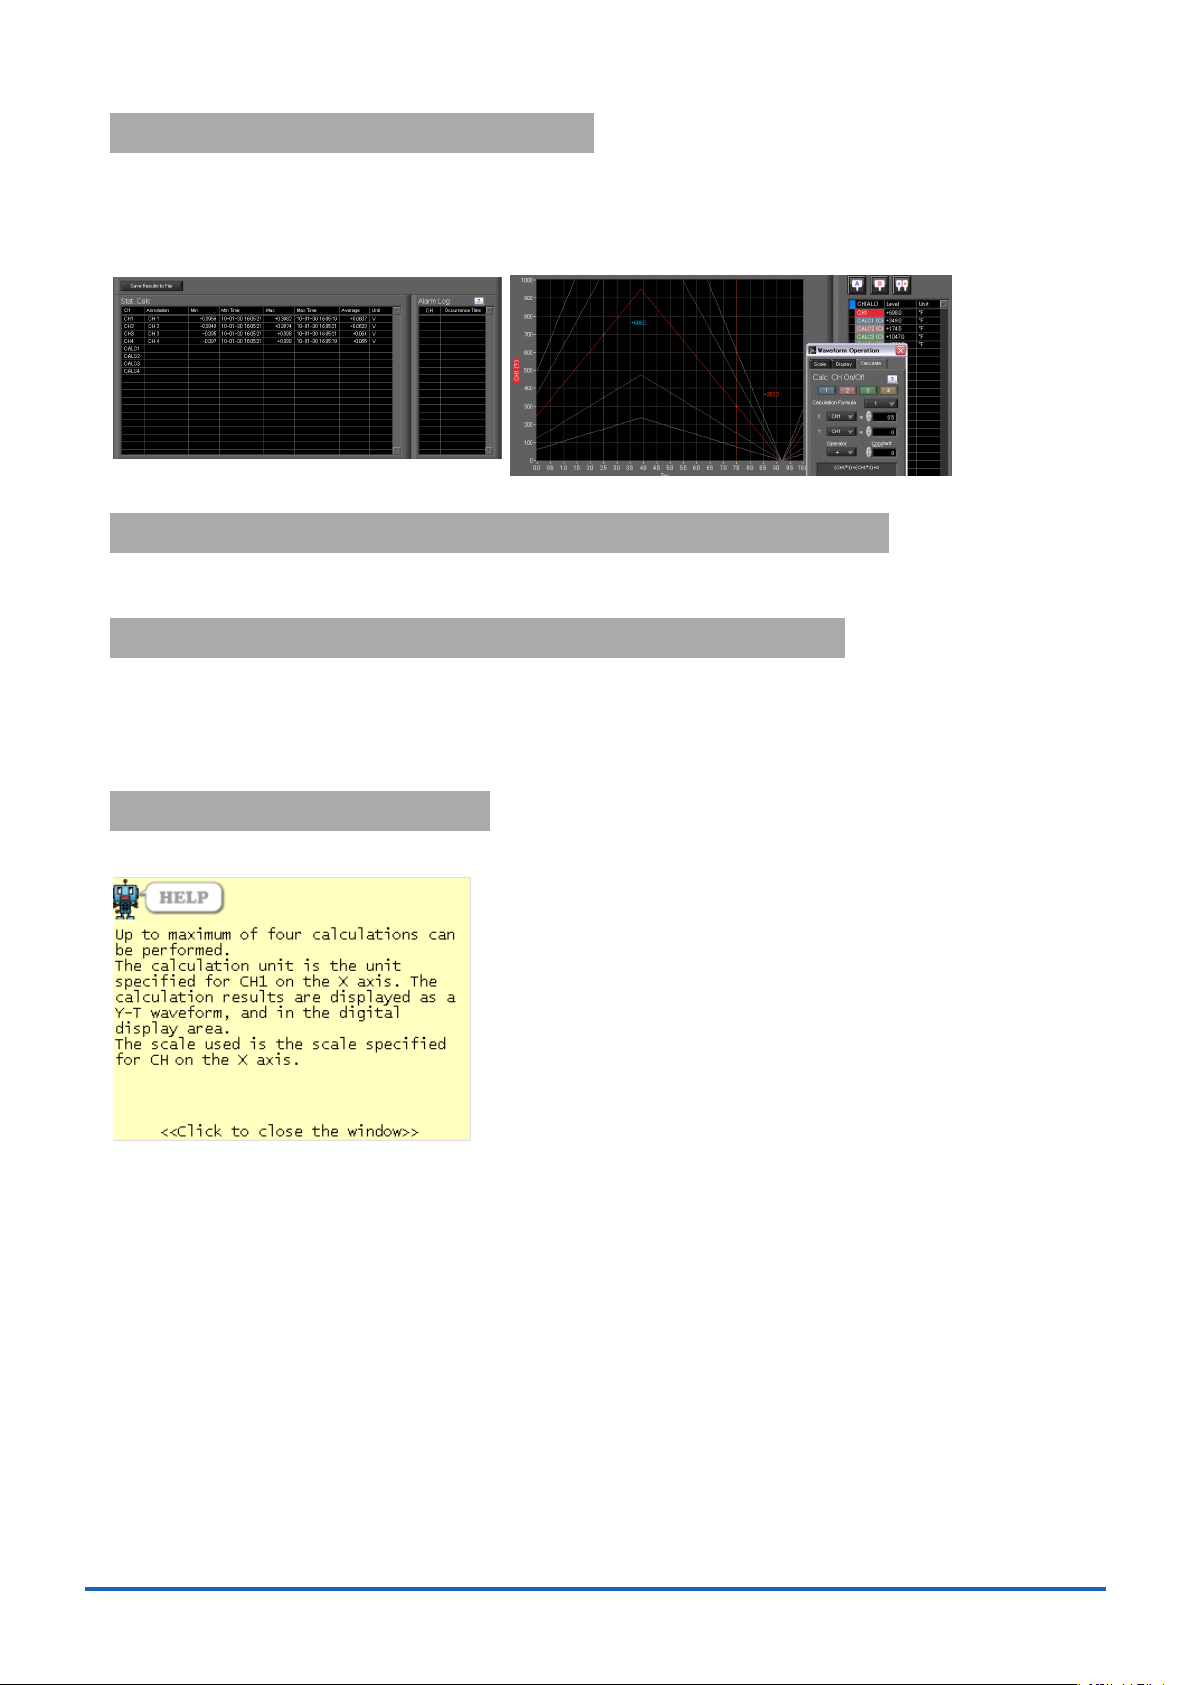
Calculation functions1-7.
The available calculation functions are Statistical Calculation and Calculation between Channels.
Statistical Calculation allows you to check the maximum, minimum, and average values of all the channels as numeric
values.
Calculation between Channels allows you to set four arithmetic operations between channels up to four at the
maximum and check the results as waveforms.
Printing Function, Screen Save Function1-8.
The waveform screen can be printed out on a printer, and screen copies saved to a le.
(Note: To use the printing function, the device must be connected to a printer.)
Send Email when Alarm is Generated1-9.
When an alarm is generated, this function enables a notication email to be sent to a mobile phone, for example,
thereby ensuring that a check can be performed if required.
(* You need an environment in which e-mail can be transmitted. The mail send function is available only during
capturing. No mail is sent even if an alarm is generated during the Free Running status.)
Help Function1-10.
Help buttons that provide simple descriptions of the various functions are assigned to each of the menu setting items
to provide ease of use.
7
Page 8

System Requirements2.
Make sure that the computer on which you plan to install the software meets the following requirements.
Item System requirements
OS Windows XP Windows Vista 32Bit/64Bit
Windows 7 32Bit/64Bit
CPU Pentium 4 : 1.7GHz or higher
Memory 256MB or more (512 MB or more is recommended.)
HDD 200 MB additional space is required for installing software.
(1GB or more free space is recommended.)
Display 1024 x 768 resolution or higher, 65535 colors or more (16-bit or more)
Other USB port, TCP-IP port, CD-ROM drive (for installing from CD) Microsoft Excel software (for
the Export to Direct Excel File and Display in Excel functions)
CHECKPOINT
ە
• Even when using a PC that meets the system requirements, measurement data may not be
captured correctly depending on the PC status
(e.g. running other applications or insufcient memory capacity in the storage media used).
Exit all other applications before capturing data to the internal hard disk.
• While you are using this software, do not activate any other software. Whenever possible,
avoid manipulations or processing of other software than this one (e.g., screen saver, virus
check, le copy and transfer, and le search processing, etc.).
Note: Supported edition (Ultimate Enterprise Professional HomePremium)
8
Page 9

Connecting to a PC (Personal Computer)3.
A
connector
B
connector
Connecting via USB3-1.
The GL is connected to a PC via a USB cable.
GL820 GL220
CHECKPOINT
ە
• When using a USB cable, a USB driver must be installed in the PC.
Refer to the "USB Driver Installation Manual" for the installation procedure.
• LAN connector. Make sure the cable is inserted into the correct connector.
Use an A-B type USB cable to connect the GL to a PC.
9
Page 10
10
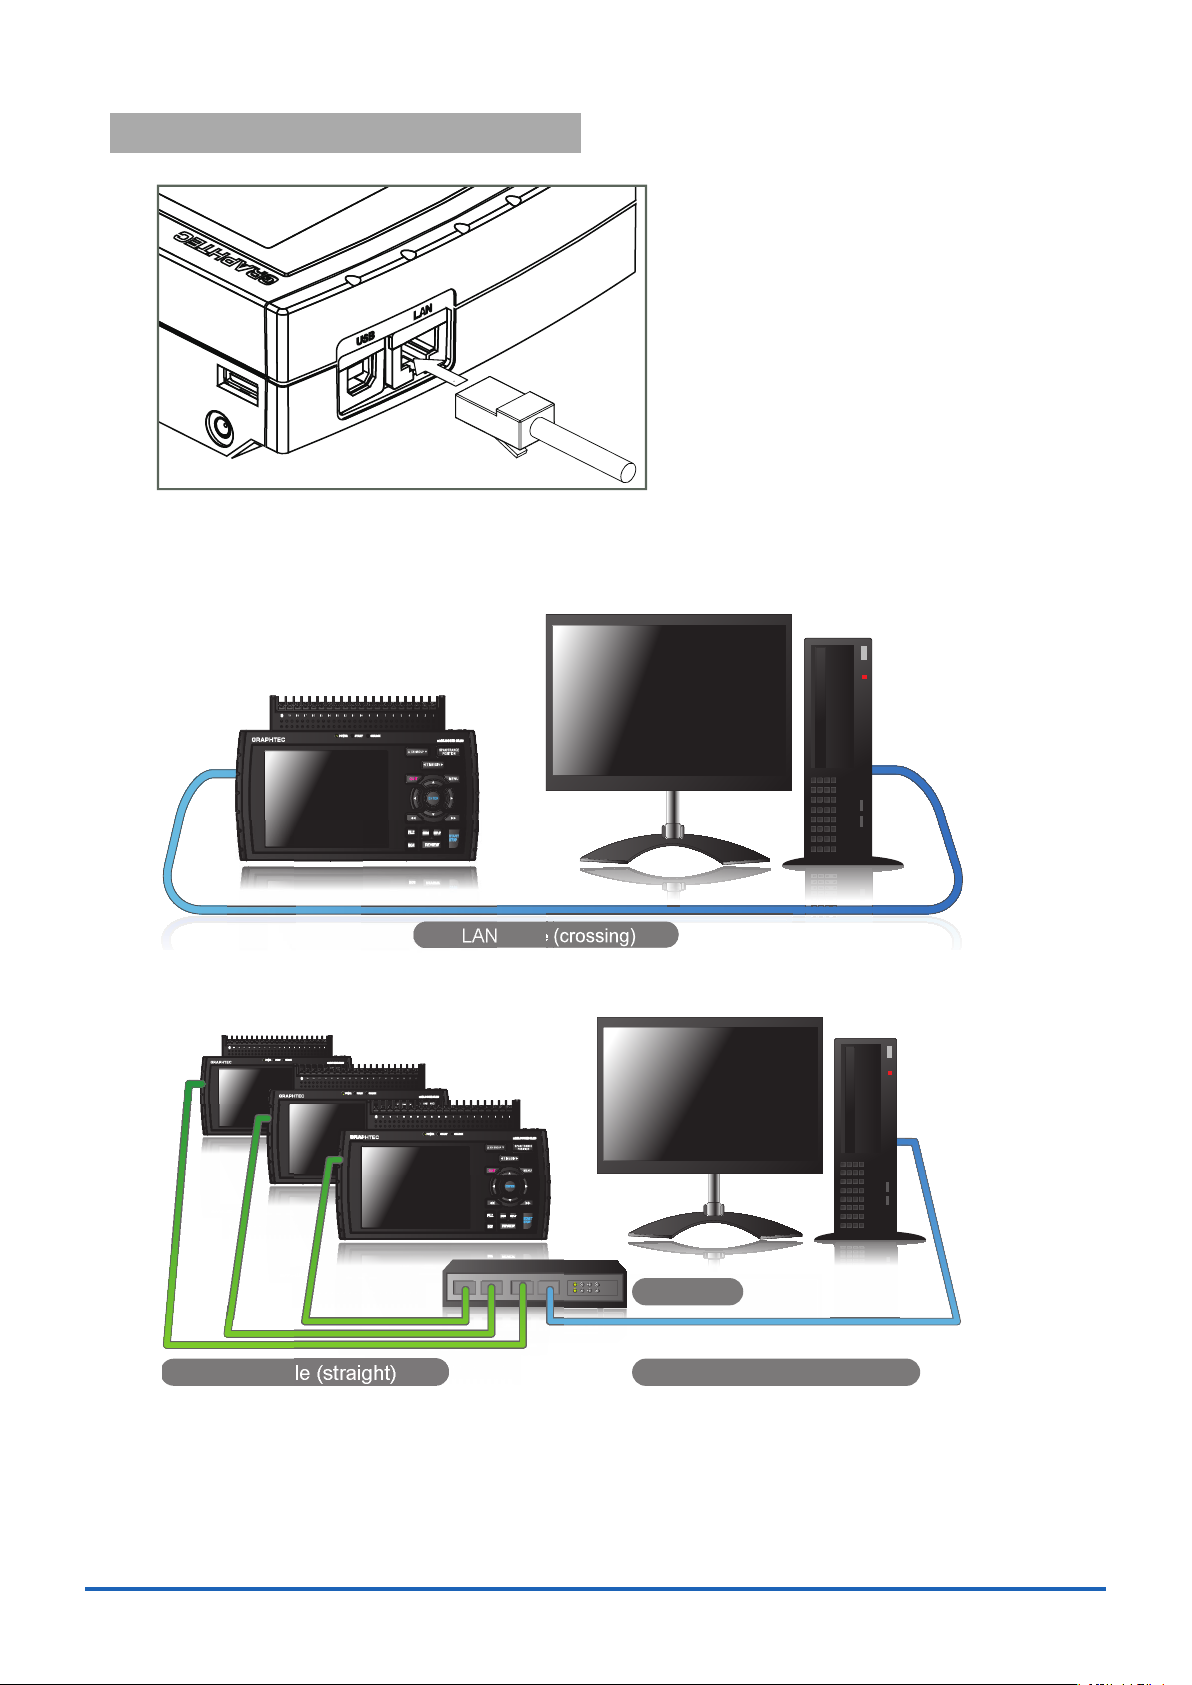
Connecting via LAN3-2.
It can also be connected via a LAN cable. (only for the GL820 and GL800)
Depending on your usage, use one of the following types of LAN cables.
●LAN Cable Types
Use a crossing cable when connecting directly to a PC, without using a hub.
LAN cable (crossing)
Use a straight cable to connect to a PC through a hub.
LAN cable (straight) LAN cable (straight)
HUB
Page 11
Setting USB ID or IP Address3-3.
To connect to a PC, congure the device's interface settings.
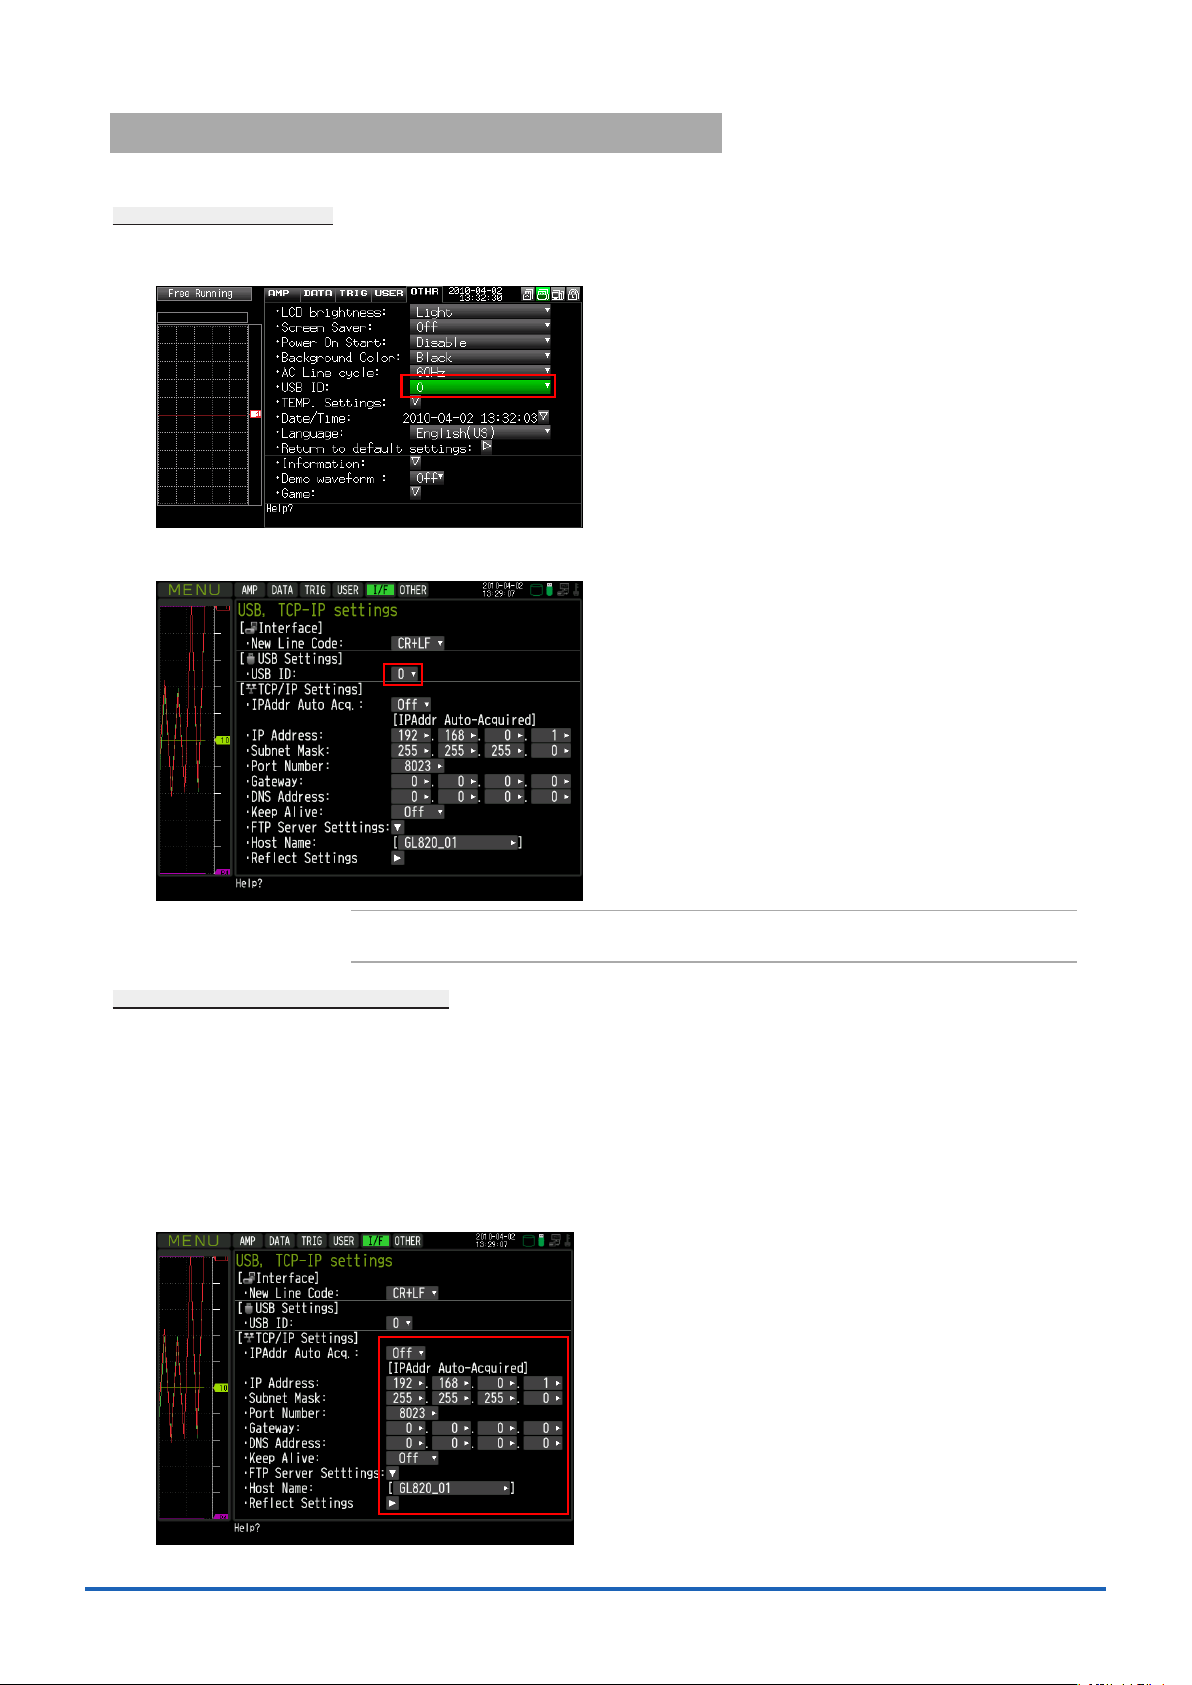
USB Settings
3-3-1.
For GL220: Press the MENU key ve times to open “OTHR Settings". Input the “USB ID".
The settings will be in effect when the power of the device is turned off and restarted.
For GL820: Press the "MENU" key ve times to open "I/F Settings". Input the “USB ID".
The settings will be in effect when the power of the device is turned off and restarted.
CHECKPOINT
ە
After changing the USB ID setting of this unit, turn off and on the power of this unit.
TCP-IP Settings (GL820)
3-3-2.
Press the [MENU] key ve times to open the [I/F] menu.
Set the [IP Address], [Subnet Mask], [Port Number], [DNS Address]
and select [Reect Settings] to accept the changes.
• Using Auto IP Address Acquisition
If there is a DHCP server in the same segment of the connected network, Auto IP Address Acquisition
is available.
Refer to chapter 3 (5), "I/F Settings" in User's Manual for details.
11
Page 12
Example of TCP-IP Settings
3-3-3.
Connecting one PC and one GL820
Refer to the following settings if you are not connecting to a corporate LAN or other networks.
Connect GL820 to a PC with a crossover cable.
PC's IP Address 192.168.1.1
GL820's IP Address 192.168.1.2
CHECKPOINT
ە
• In this case, always set the subnet mask to "255.255.255.0".
• In this case, always set the port number to "8023".
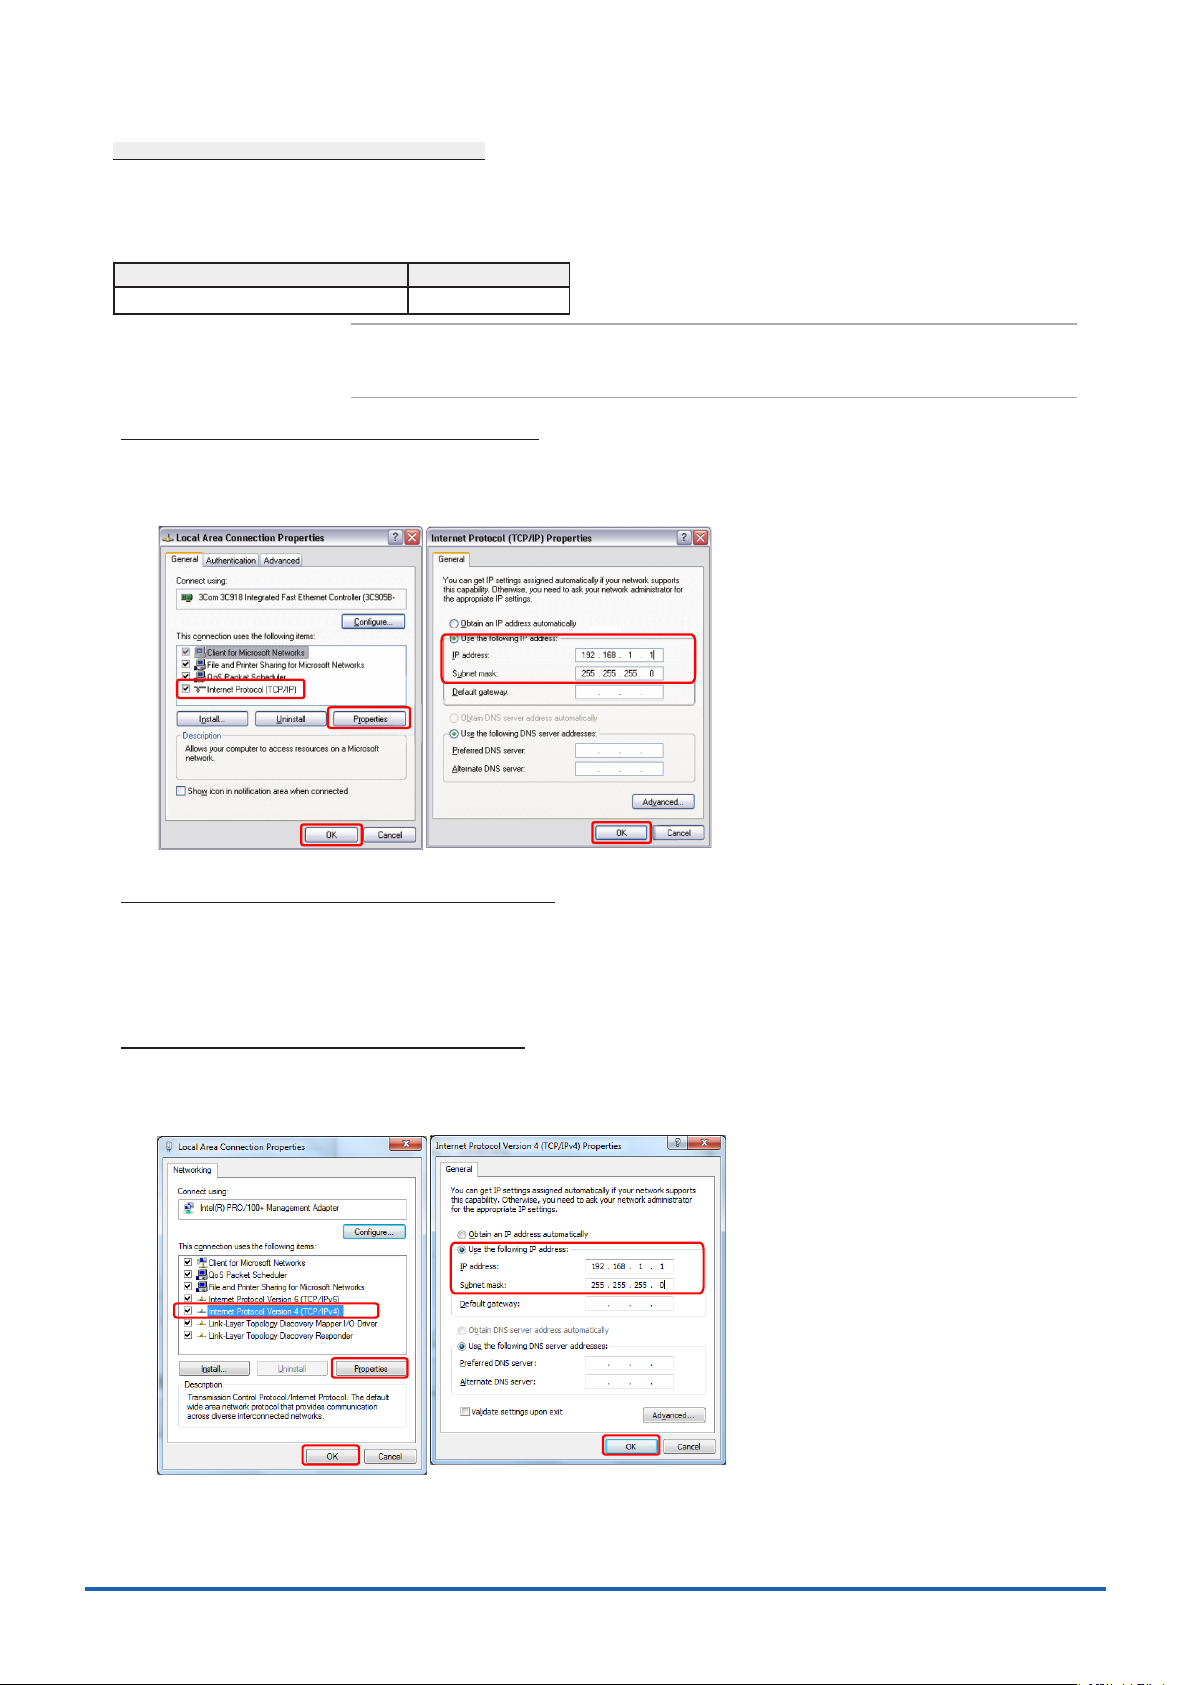
Setting PC's IP Address (Windows XP)3-3-3-1.
Select "Start" button → "Control Panel" → "Network Connections" → "Local Area Connection" →
"Properties" → "Internet Protocol (TCP/IP)" → "Properties", click to select "Use the following IP address "
check box, set "IP address" and "Subnet mask", and then click "OK".
Setting PC's IP Address (Windows Vista)3-3-3-2.
[Start menu] → [Control Panel] → [Network and Sharing Center] → [Local Area Connection] →
[Status Display] → [Properties] → [Select Internet Protocol (TCP/IP)] → [Properties] →
Check "Use the following IP Address" →
Set [IP Address] and [Subnet Mask] → [OK]
Setting PC's IP Address (Windows 7)3-3-3-3.
[Start menu] → [Control Panel] → [Network and Sharing Center] → [Local Area Connection] → [Properties]
[Select Internet Protocol (TCP/IP)] → [Properties] → Check "Use the following IP Address" →
Set [IP Address] and [Subnet Mask] → [OK]
12
Page 13

Installing the USB Driver4.
To connect this unit to a PC with the USB interface, a USB driver must be installed in the PC. A USB driver and the
USB driver installation manual are included in the supplied CD-ROM. Install the USB driver according to this manual.
(The manual location: D:\USB Driver\English\GL-USB-UM152.PDF)
* The drive letter D: represents a CD-ROM drive. It should be read as that of the CD-ROM drive of your PC.
13
Page 14

Installing the Application Software5.
This chapter describes how to install the application software.
Insert the User's Guide CD-ROM provided into the PC's CD-ROM drive.
1.
Click the Taskbar's Start button, and then click the Run... icon to open the "Run" window.
2.
Enter the CD-ROM drive name and \English\English\GL220_820-APS\Setup.exe as the name of the le you wish
3.
to open.
If the disk is in drive D, for example, enter "D\English\GL220_820-APS\Setup.exe" in the box
and then click "OK" to launch the installer.
Follow the instructions on the screen to continue with the installation.
4.
When a message to restart your PC appears after the installation, be sure to restart it and then start this software.
5.
CHECKPOINT
ە
Be sure to observe the following points when connecting the GL to a PC.
• Do not connect any devices apart from a mouse or a keyboard to any of the other USB
terminals on your PC.
• Set the PC's power-saving functions to Off.
• Set the Screen Saver to Off.
• Set the anti-virus software auto update and scan scheduler functions to Off. Also, set the
Windows auto update and scheduler functions to Off.
• When using the note PC, if you close the display, the PC may be in stand-by mode. Please
do not close the display during using the software.
Trademarkes
• Windows, Windows Vista and Windows 7 are registered trademarks of Microsoft Corporation in the US and other countries.
• The company names, logos and product names mentioned herein are the trademarks or registered trademarks of their respective companies.
14
Page 15

Basic Operating Procedure6.
The basic operating procedure of this software consists of the following four operations:
Operation Description
Controlling the GL220/GL820/
GL200A/GL800 Device
Checking Input Data With the GL220/GL820/GL200A/GL800 connected to a PC, you can display signals
Data Capture When the GL220/GL820/GL200A/GL800 is connected to a PC, data can be exported
Replaying Captured Data Data les captured and saved in a PC can be replayed. When the GL220/GL820/
Controlling Device6-1.
This software can perform the following operations:
• Start/Stop Data Capture
• AMP Settings (Input, Range, Filter, etc.)
• Data Capture Settings (Sampling Interval, Device Data Capture Destination, External Sampling, etc.)
• Trigger, Alarm Settings (Trigger Settings, Alarm Settings, etc.)
• Other Settings (Temperature Unit, Factory Default Settings, etc.)
With the GL220/GL820/GL200A/GL800 connected to a PC, you can load the setting
information of this unit to this software and make settings and control operations of
this unit. The setting conditions can be saved as a conguration le in a PC. This le
can be read to reect the setting conditions.
entered to this unit in a graph on this software and check them in real time.
to a PC and saved. Data can be also saved in the GL. Either of the saved data can
be used as a backup.
GL200A/GL800 is connected to a PC, data saved in the GL can be also replayed.
You can clip the desired parts from the replayed data or convert it to a different le
format and save it.
15
Page 16
Launching and Exiting the Software7.
Exit
Launching the Software7-1.
Click the Taskbar's "Start" button → "Programs" → "Graphtec"→"GL220_820APS" → "GL220_820APS" to launch the
application software. Once the program has started up, the following screen is displayed.
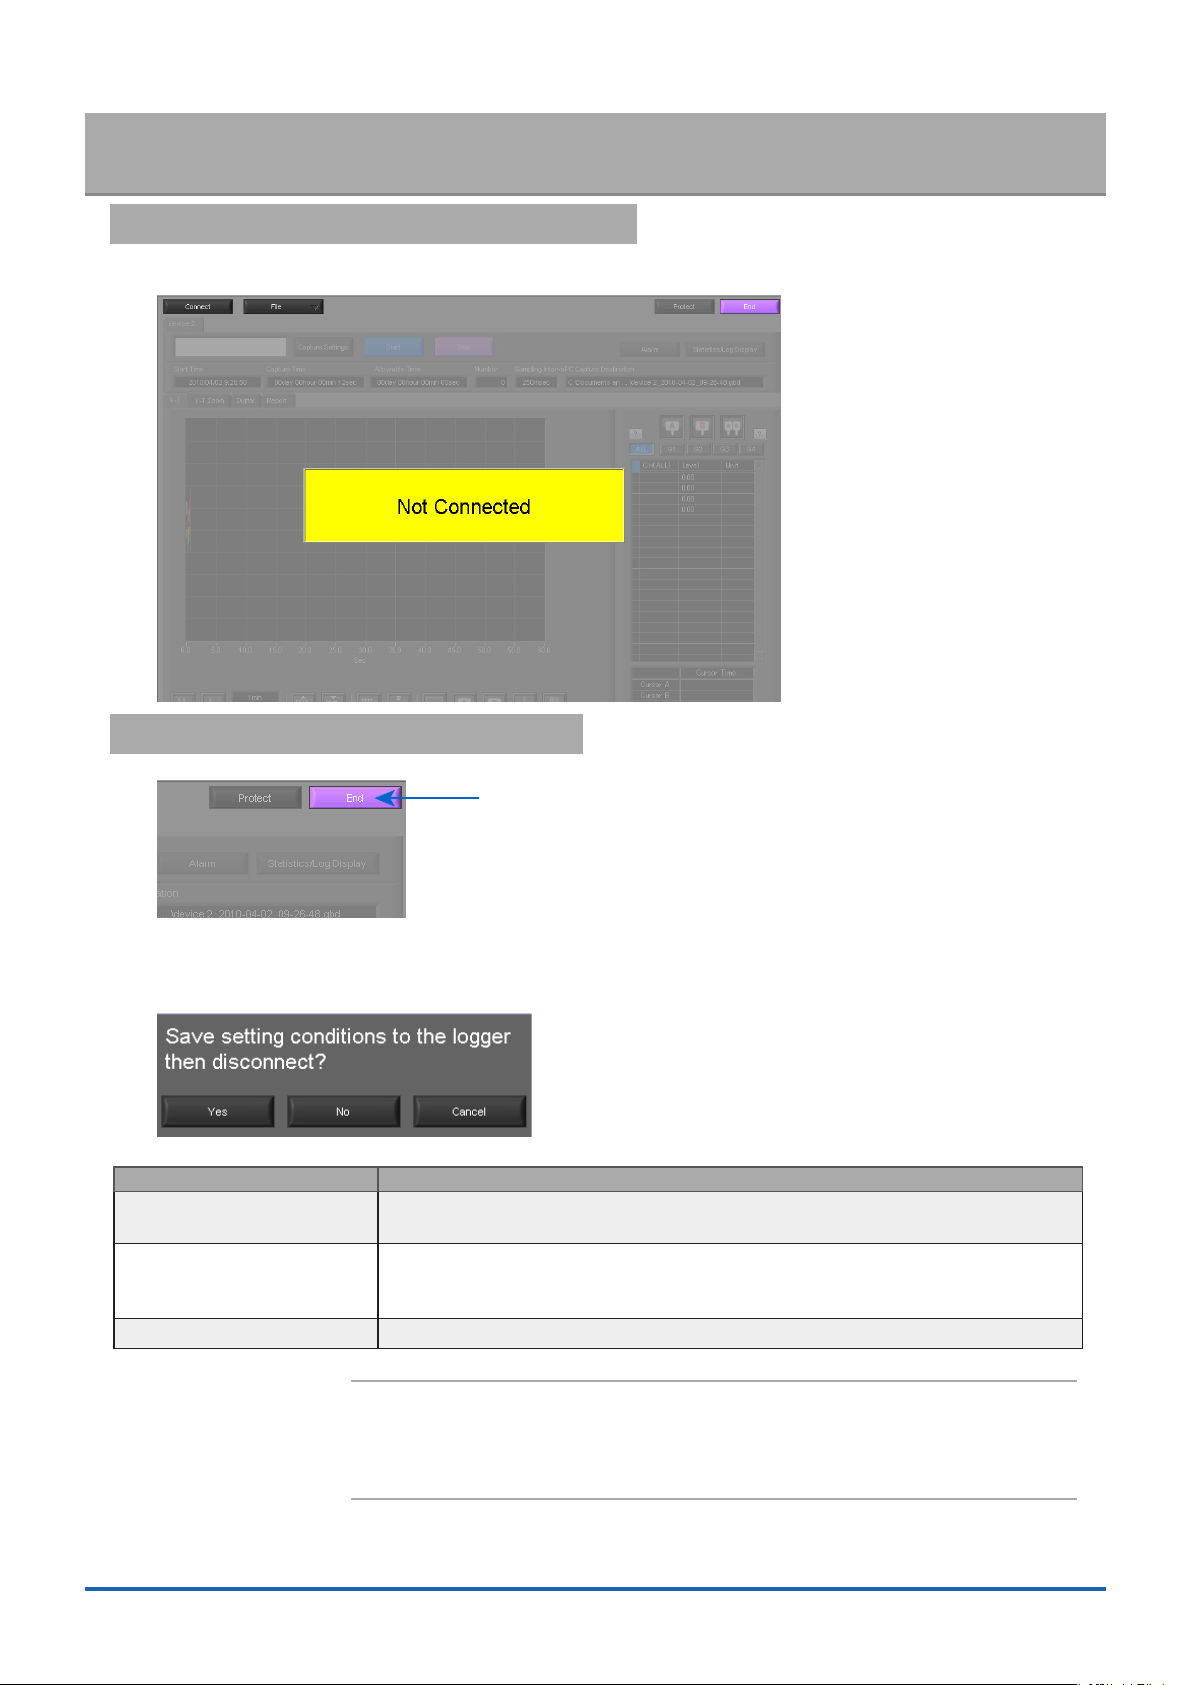
Exiting the Software7-2.
To exit the software, click the "End" button in the upper right corner of the main screen.
When you try to exit the software in the connected status, a message appears to conrm if the setting conditions are
saved to the device.
Operation Description
Yes Click this button to save the setting conditions on this software in the GL device and
exit. Next time connecting to the device, the last setting conditions are reected.
No Click this button to exit without saving the setting conditions on this software in the
GL device. After the power is turned on, the setting conditions on GL device returns
to the state before connecting to the software.
Cancel This software is not disconnected and it remains active.
CHECKPOINT
ە
The following settings are not saved to this unit.
• Setting items not available on the GL unit
• Line color settings
• Trigger time, duration, and repeated capture settings
16
Page 17
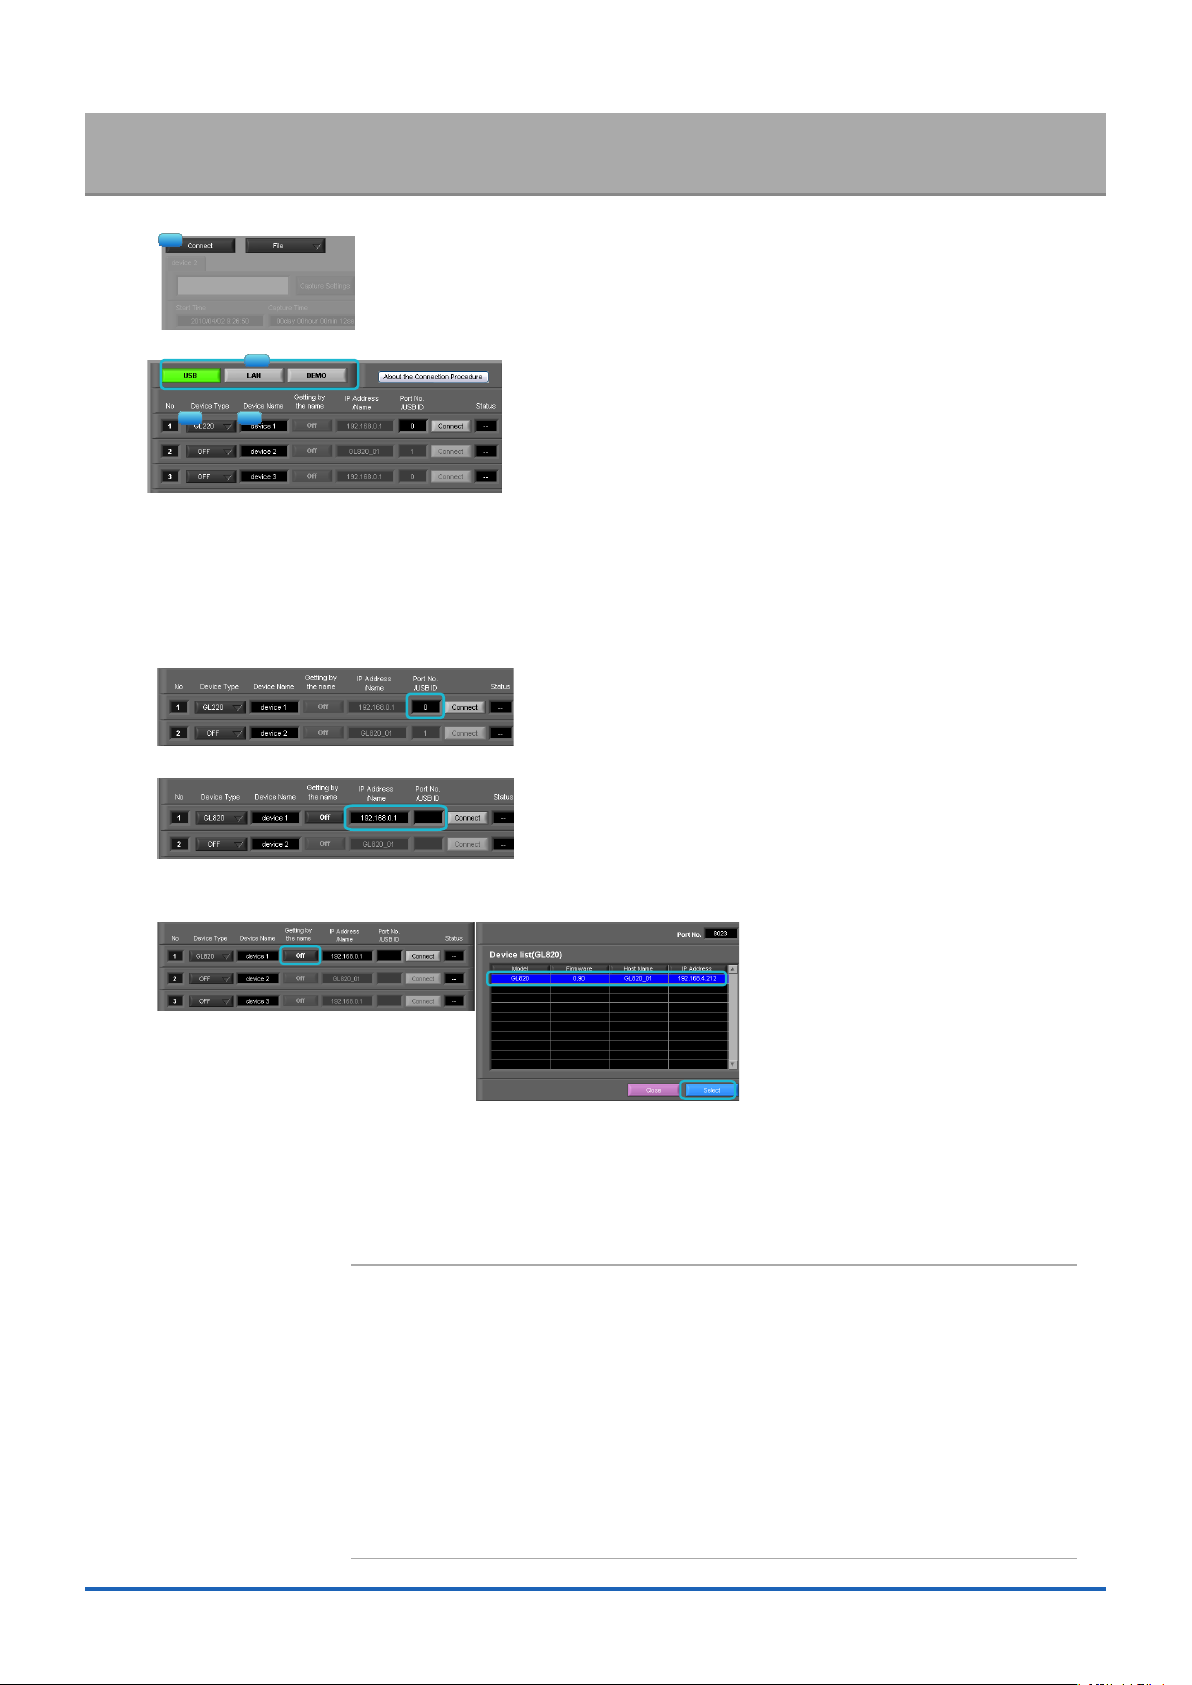
PC Connection Settings8.
1
2
3 4
8023
Congure the communication settings between GL and a PC.
Click the "Connect" in the Main screen, and the Connection screen will be displayed.
1.
Select an interface to be used for connection (USB connection, LAN connection, or Demo).
2.
From "OFF" in the unit registration, select a device type to be connected.
3.
At "Device Name" enter a desired name. (\ / : * ? " < > | characters can not use the name of the device.)
4.
At "3. Connecting to a PC" enter the settings that have been made on this unit.
5.
Use the same settings as in Sections 3-3-1 and 3-3-2.
- For USB connection: Enter a "USB ID."
- For TCP/IP connection: Enter an "IP address" and a "Port No.".
- To use Retrieve by Name on TCP/IP (GL820 only)
Click the Retrieve by Name button to display a list of devices. When the LAN-connected GL820 is automatically
detected, select a model to be connected and click the "Select" button.
Click the "Connect" button to perform the connection to enable communication between the devices.
6.
Click the "Close" button to close the Connect screen.
7.
* Demo Connection
Demo Connection does not actually connect to the GL unit but makes a pseudo-connection. This connection is
available only if the registered device is the GL220 or GL820.
A supplied demo waveform will be displayed.
CHECKPOINT
ە
• A mixture of USB and LAN connections cannot be used.
• Before making a connection, check that this unit is either in a "Free Running" or "Capturing"
status.
• When they are connected, the software works with the setting conditions read from the GL
unit.When you want to use the PC's settings, press the "Read Setting Conditions" button to
read the saved conguration le. To do this, you should save the setting conditions.
The following settings are not saved to this unit.
• Setting items not available on the GL unit
• Line color settings
• Trigger time, duration, and repeated capture settings
• After a connection is established, the time on the PC is transferred to this unit. Note that the
time of this unit will be changed.
17
Page 18
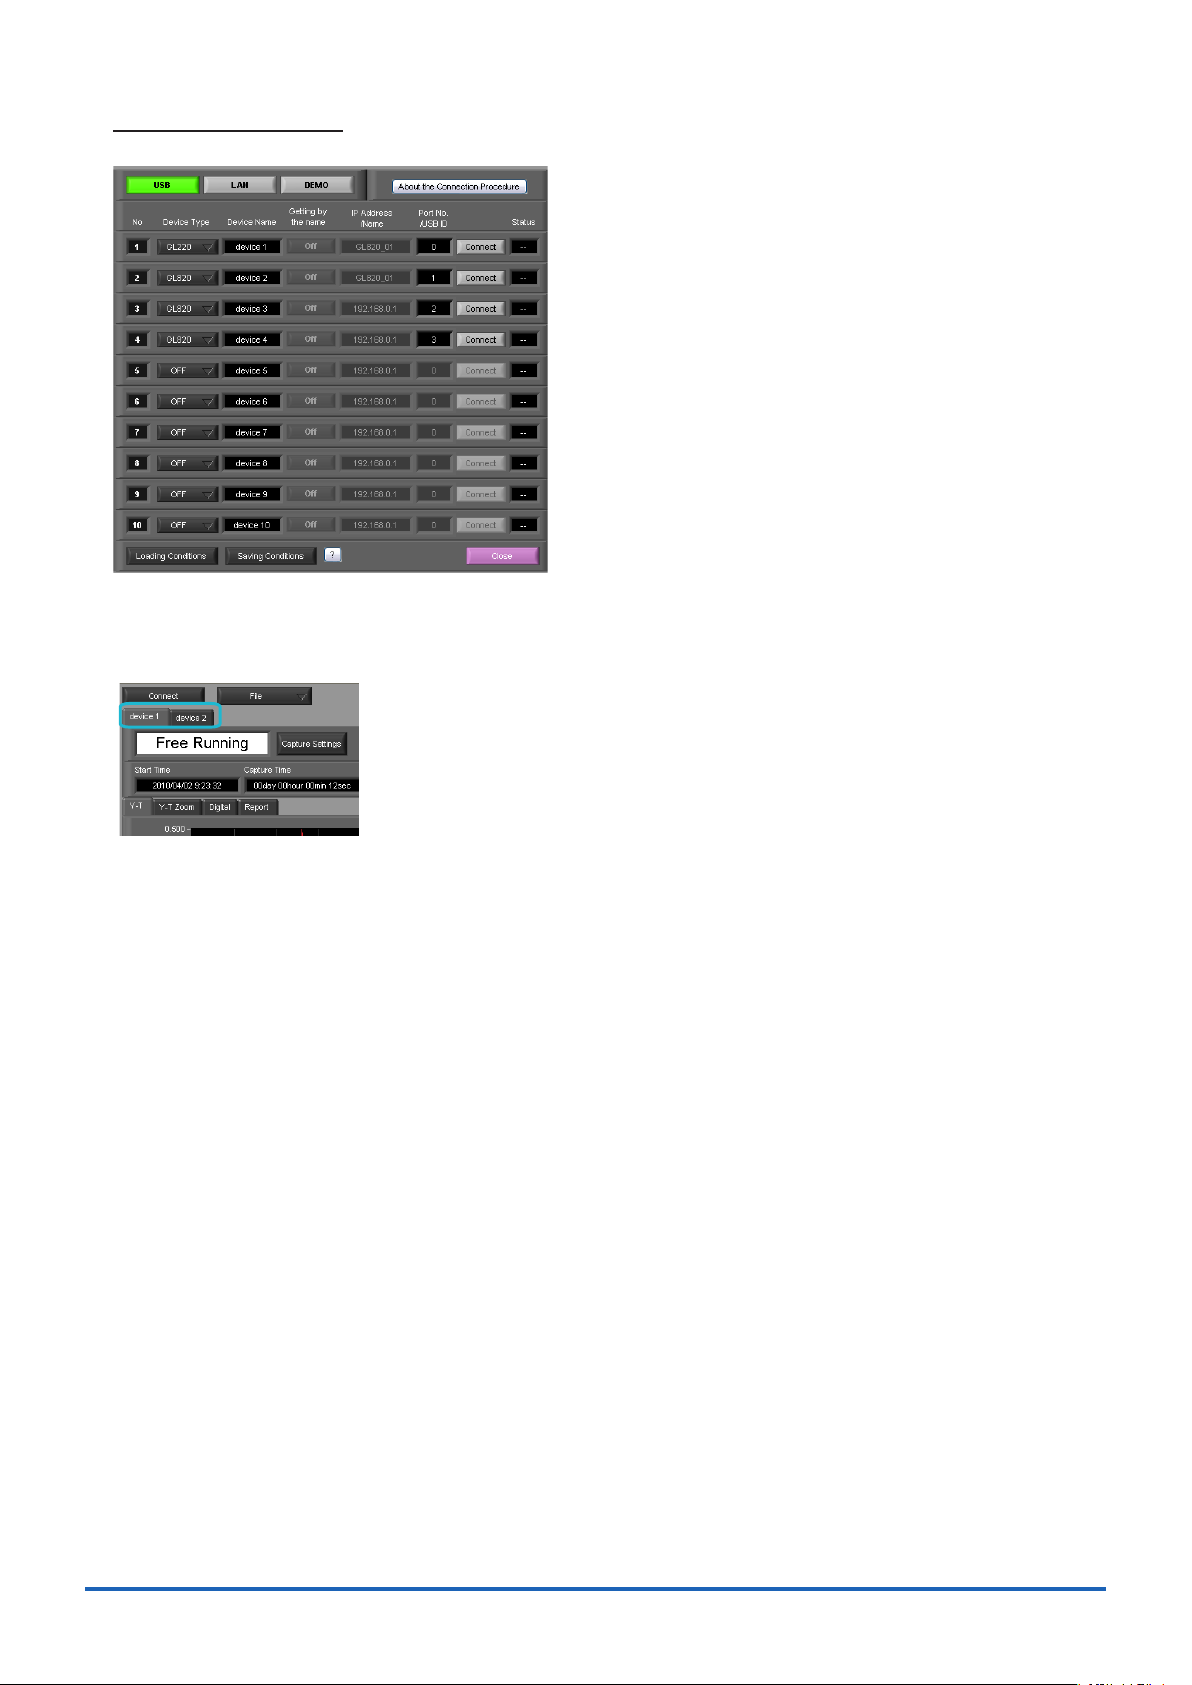
Connecting multiple devices
GL220_820APS can connect up to 10 GL devices (maximum 500 channels).
Make settings for each of the devices to be connected.
* Refer to the previous page for details on the settings.
The connected tabs are displayed. Select each device to make desired settings.
18
Page 19

Display Screens9.
This section explains the display screens in Free Running or Capturing status in this software.
• Y-T
• Y-T Zoom
• Digital
• Report
19
Page 20
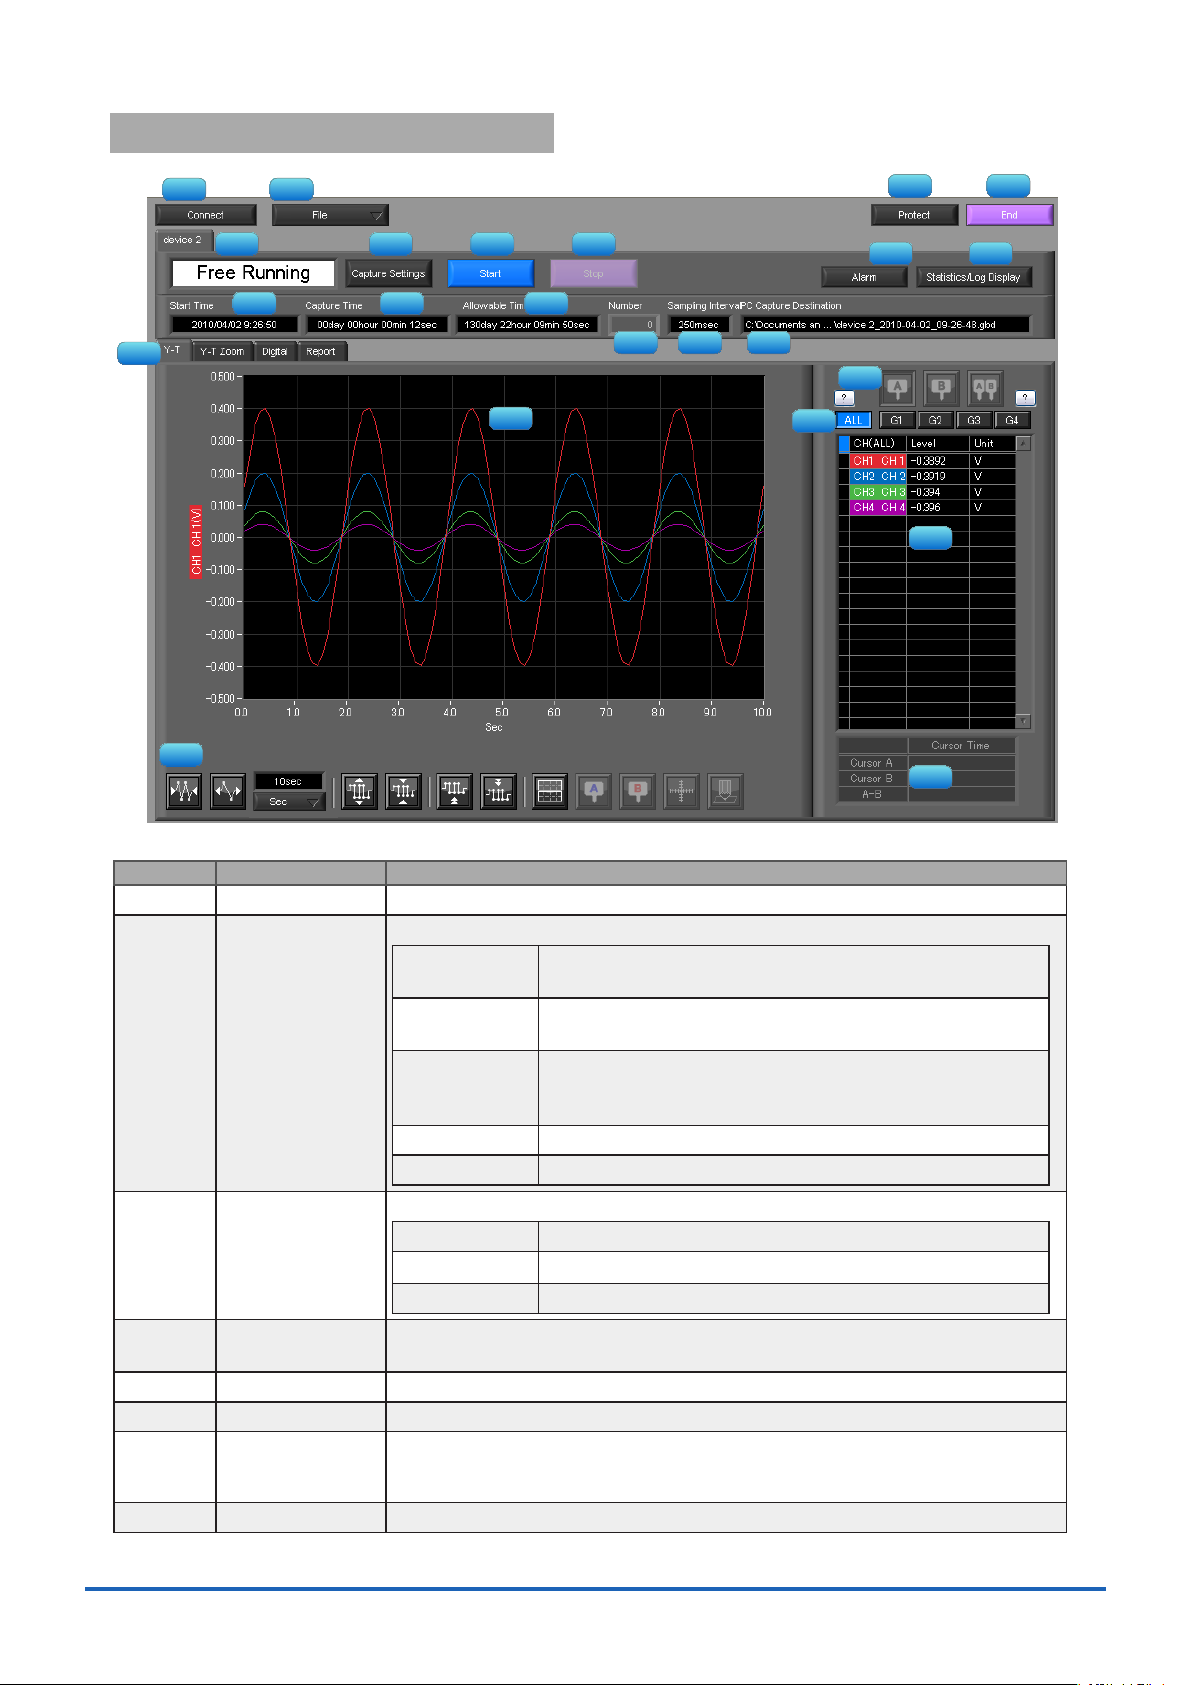
Y-T (Main Screen)9-1.
1 2
3 4 5 6
7
9 10
11 12 13
14 15 16
17
18
19
20
21
22
23
8
No. Name Description
1
2
Connect Opens a screen for connecting to this unit.
File Conducts le-related operations.
3
4
5
6
7
8
Simplied message
area
Capture Settings Click this button to open the data capture settings screen. Refer to "10. Setting
Start Click this button to start data capture.
Stop Click this button to stop data capture.
Protect Click this button to set the password to protect the software.
End Click this button to exit the application.
Open Data Displays the data in les stored on the PC or les stored on
this unit as waveforms.
CSV le batch
conversion
Print Screen Click this button to print out a copy of the screen. Printing is
Save Screen Click this button to save the displayed screen as a BMP le.
CSV Cong Set decimal point and delimiter according to the OS using.
The operating status is displayed here.
Free Running Stopped status (not capturing data)
Armed Awaiting trigger activation; data has not been captured.
Recording Data capture status
Screen" for details.
Click this button to convert multiple GBD (binary data) les
captured to the PC to CSV les.
performed at the printer that has been selected as the default
printer. If you change the printer, relaunch the software.
* Protection operations occur only in this software. Be careful that this software can be exited via Windows
operations.
20
Page 21

10
11
12
13
14
15
16
17
18
19
20
21
22
23
9
Alarm Click this button to display the alarm output port status. If "Alarm Hold" has been
selected, the alarm can be cleared by clicking the "Alarm Clear" button.
Statistics/Log
Display
Click this button to display the results of statistical calculation performed during
data capture, and a log of the alarms generated.
Start Time Data capture start time.
Capture Time The amount of time that has elapsed since the start of data capture.
Allowable Time The amount of time available for data capture. When the remaining time is up,
data capture stops at both the device and the PC.
Number The number of data capture operations when Repeat Capture has been specied.
Sampling Interval The sampling interval.
PC Capture
The data capture destination at the PC.
* EXT is displayed during external sampling.
Destination
Screen switching Switches between screens (Y-T/Y-T Zoom/Digital/Report Views).
Waveform Graph The waveforms are displayed here.
Cursors Selects which of the cursor values should be displayed in the digital display area
when scroll is stopped during capture. Up to three values (Cursor A, Cursor B,
Cursor A-B) can be displayed at the same time.
This function is available when the scroll is Off during capture, or during replay.
Switch displayed
groups
Click one of these buttons to select a group whose waveform and digital values
are displayed.
Digital The digital values are displayed in this area. Clicking on any of the CH numbers
enables the waveform for that channel to be hidden/displayed. The channels for
which an alarm has been generated are shown in red.
The waveform display On/Off setting is cleared when the capture settings are changed and is reset to On.
Cursor Time The cursor times are displayed during data capture when Scroll Off has been
selected.
Waveform Op. Click this button to perform various settings for the waveform display. Refer to
section 13-3 for details.
21
Page 22

Y-T Zoom9-2.
Switches to full-screen Y-T View. The operation is the same as in Y-T View.
22
Page 23

Digital9-3.
1
2
3
4
The captured data is displayed as digital values. Instantaneous values are displayed in large characters to enable
easy conrmation.
No. Name Description
1
2
3
4
Analog 20 analog channels' digital values are displayed here.
Set displayed CH Click one of these buttons to select 20 analog channels to display the digital
values.
It is not displayed for GL220 or GL200A.
Pulse Pulse signals' digital values are displayed here. (when the Logic/Pulse setting is
"Pulse")
Logic Logic signals' digital values are displayed here. (when the Logic/Pulse setting is
"Logic")
23
Page 24

Report9-4.
1
2
3
4
Displays daily report data during capture when the daily report function is enabled. The displayed data can be
displayed on EXCEL in the Free Running status.
If Off has been specied for the Report setting, report data is not displayed.
No. Name Description
1
2
3
4
Display in Excel The data is displayed in Excel format when the device is in the Free Running
status.The Microsoft Excel program must be installed in order for the Export to
Direct Excel File function to be used.
* Data displayed on EXCEL is only data displayed in the report.
Daily Report
Capture Interval
Daily report data The daily report data is displayed here. If the number of points exceeds 100, data
Calc. resultsThe The calculated results for the average, maximum and minimum values are
The daily report capture interval is displayed here.
is deleted starting from the oldest data (the actual data is not affected).
displayed here.
24
Page 25

Settings Screens10.
1
2 3
4 5 6 7
8 9
10 11 12
13
14
15 16 17 18 19 20
21 22 23 24 25
26 27 28
This chapter describes the screens used to perform settings related to data capture.
AMP Settings10-1.
This screen is used to make the analog input, logic input, and pulse input settings.
No. Name Description
1
2
3
4
Settings tabs These tabs are used to change the settings screen.
AMP Settings This tab is used to make input-related settings.
Data Capture Settings This tab used to make settings related to data capture.
Trigger/Alarm Settings This tab is used to make settings related to the trigger
CH These are the channel numbers for analog input.
Color The color used for the waveform for each channel can be specied here.
Annotation Each channel can be freely annotated (input the signal name, etc.). The maximum
Report Settings This tab is used to make settings related to the daily
Other Settings This tab is used to make various other settings, to
* The line color settings are not stored in captured data. Since the setting values of this software are used,
the line colors may be different during capture and replay.
number of characters is 31 (in single-byte).
and alarm functions.
report, monthly report, and Export to Direct Excel File
functions
display information, and so forth.
25
Page 26

No. Name Description
5
Input Select the input type for each channel.
Off No input is made to that channel.
DC Select DC to perform voltage measurement.
TEMP Select TEMP to perform temperature measurement.
RH Select RH to perform humidity measurement.
6
Range These buttons are used to select the input range for each channel.
DC 20/50/100/200/500(mV)/1/2/5/10/20/50(V)/1-5V
TEMP TC-K/TC-J/TC-T/TC-R/TC-E/TC-B/TC-S/TC-N/TC-W
*
Pt100
/JPt100*/PT1000
* (* is only GL820 or GL800)
RH Fixed to 1 V; the unit is converted internally.
0V → 0%, 1V → 100%
7
Filter Use these buttons to set the lter for each channel. Moving average processing
is used in the lter. It captures the data for congured number of times at the
congured sampling rate and performs average processing.
(Off/2/5/10/20/40)
8
9
Unit The selected unit is displayed here.
Auto Zero Adjusts the current input value as the zero points for each channel (voltage and
humidity only). Refer to section 10-1-1 for details.
10
Span Use these buttons to set the upper limit and lower limit values for the waveforms
displayed in the waveform graph. Refer to section 10-1-2 for details
11
12
Scaling Use these buttons to convert the unit. Refer to section 10-1-3 for details
CH Group Use these buttons to set the display group for each channel. Only the groups set
here can be viewed in Y-T display screen.
13
Graph Display The waveforms for which settings have been made can be checked here. Click
the "Apply" button to apply the settings that have been made.
14
Logic/Pulse
switching
Use this button to switch the digital input. Logic, Pulse, or OFF can be set here.
This setting is not available for GL200A.
(Off/Pulse/Logic)
15
16
17
Logic CH number The channel numbers for logic input.
Logic Line Color Make the logic waveform color setting here.
Logic Filter Make the logic lter setting here. The lter is about -3dB at about 30Hz.
(Off/On)
18
19
20
Pulse CH number The channel numbers for pulse input.
Pulse Line Color Make the pulse line color setting here.
Pulse Input Use the Input button to select the pulse input type. *
sample is 50k.
Revolutions The number of pulses generated in one second is counted,
multiplied by 60, and displayed as the number of revolutions
(RPM).
Counts A cumulative count is made of the number of pulses
generated in one sample.
Inst. The number of pulses generated in one sample is counted.
21
Pulse Range Use these buttons to set the pulse range.
Revolutions 50/500/5000/50k/500k/5M/50M/500M (RPM/F.S.)
Counts 50/500/5000/50k/500k/5M/50M/500M (C/F.S.)
Inst. 50/500/5000/50k/500k/5M/50M/500M (C/F.S.)
22
Pulse Filter Make the pulse lter setting here. The lter is about -3dB at about 30Hz.
(Off/On)
The upper limit of the count in one
26
Page 27

No. Name Description
2
1
3
4
Upper Value Input
Lower Value Input
Upper Cursor
Waveform
Lower Cursor
Settings CH
23
Pulse Slope Use this button to select the pulse detection slope.
H Rising signals are counted.
L Falling signals are counted.
24
Pulse Span Use this button to set the upper limit and lower limit values for the waveforms
displayed in the waveform graph.
25
26
27
28
10-1-1.
Pulse Scaling Use this button to convert the unit.
OK Click this button to register your settings and close the screen.
Cancel Click this button to close the screen without registering your settings.
Apply Click this button to apply the settings mode.
Auto Zero Setting
Performs zero adjustment.
The adjustable range is ±10% of the setting range.
(Example: For a range of 1V, the full scale is ±1 V, and the adjustable range is ±100 mV.)
No. Name Description
1
2
3
CH Displays a channel for which Auto Zero ADJ. should be performed.
Perform Auto Zero
ADJ.
Reset Auto Zero
Performs Auto Zero ADJ.
"Apply" in the capture setting screen.
Resets the zero adjustment to the initial state.
* If you have changed the input or range just before this step, rst click
* Changing the range will reset this setting.
ADJ.
4
Zero position
Displays the adjusted value after Zero ADJ.
voltage value
10-1-2.
Span Settings
Span settings are made at this screen.
To make the settings, input numerical values directly or use a cursor to adjust values.
27
Page 28

10-1-3.
Input
Upper Value Input
Scaling
Upper Value Input
Input
Lower Value Input
Scaling
Lower Value Input
Reference value Value for the adjustment
Setting CH
Setting CH Take temperature measurements
Scaling Unit
<Voltage> <Temperature>
1
2
3
4
5
6
7
8
9
10
11
12
13
14
15
16
Sets the scaling (unit conversion). Enter the upper and lower limits of the input and converted values. For the
temperature channel, the offset setting with two points is used.
before retrieving the temperature measurement values, rst click "Apply" in the capture setting screen.
Scaling Settings
* If you have changed the input from the temperature or voltage just
Data Capture Settings10-2.
Settings such as the Sampling Interval, Device Capture Settings and PC Capture Settings are made at this screen.
No. Name Description
1
Sampling Interval Species the sampling interval for data capture.
The sampling interval that can be specied depends on the number of measured
channels.
10/20/50/100/125/200/250/500(ms)/1/2/5/10/20/30(s)/1/2/5/10/20/30(min)/1(h)
* Allowable settings vary with the input setting and the number of measurement channels.
28
Page 29

No. Name Description
2
External sampling Sets the external sampling function to On or Off.
If set to On, data is captured using signals entered from the external input
terminal.
Signals that can be entered from the external input terminal must be slower than
the "fastest interval" display.
* This function is available only for the GL220 and GL820.
3
AC Line Filter Sets the AC line lter function to On or Off in the external sampling settings.
Refer to the User's Manual for details.
The On or Off setting will change the fastest interval of the external sampling.
Refer to the User's Manual for details.
* This function is available only for the GL220 and GL820.
4
Fastest interval Displays the fastest interval of external sampling when the external sampling
function is used. The fastest interval varies with the AC line lter setting and the
number of measurement channels. Refer to the User's Manual for details.
* This function is available only for the GL220 and GL820.
5
Device Capture
Destination
Settings button
Use this button to specify the On/Off of data capture of the GL device.
On Data capture operation is also performed on the GL device.
Data capture cannot be started when there is no space in
the data capture destination of the device.Data is captured to
both the device and the PC.
Off Data capture operation is not performed on the GL device.
Data capture can be started when there is no space in the
data capture destination of the device.Data is captured only
to the PC.
* A setting of capturing data in CSV format to this unit is not available.
6
Device Capture
Settings
The length of time available for data capture to the selected device storage
medium (internal memory or USB device) is displayed here.
Allowable capture
time
7
Device Capture
Settings
Name Type
Use this button to select the method for appending the le name.
Auto Create a date folder in the specied folder, and then create a
date and time le in it.. (Example: 2010-04-01_12-34-56.GBD)
User The le name can be freely specied by the user.
10
11
12
8
Device Capture
The save destination at the device for the captured data is selected here.
Settings
Save Path
9
Ring Capture Ring Capture is a function that captures data while deleting old data when a
specied number of capture points is exceeded. This function sets the Ring
Capture function to On or Off on the GL220 or GL820 unit.
Refer to the User's Manual for details.
* Ring Capture is supported only on this unit. Only normal capture is available on the PC.
* This function is not available for the GL200A and GL800.
Ring Capt. Pts. Sets the number of capture points when Ring Capture is performed.
Refer to the User's Manual for details.
Ring Allowable
Capture Time
PC Capture
Settings
Format
Displays the time available for capture in Ring Capture.
Refer to the User's Manual for details.
Use this button to select the format of the data saved to the PC (personal
computer).
Binary format (GBD) The data is saved as binary data. When compared
with a CSV le, the le size is somewhat small.
Text format (CSV) The data is saved as text data in a format that can be
displayed in Excel.
29
Page 30

No. Name Description
13
PC Capture
Settings
Name Type
Use this button to select the method for appending the le name.
Auto A folder with the date as the le name is created within the
specied folder, and then a le with the date and time as the
le name is created within the newly-created folder. (Example:
Device1_2010-04-01_12-34-56.GBD)
User The le name can be freely specied by the user.
14
PC Capture
Settings
The save destination at the PC (personal computer) for the captured data is
selected here.
Save Path
15
16
PC Capture
Settings
Create Backup File
PC Capture
Settings
Backup Interval
To enable this function, click the checkbox to display the check mark. The backup
le is created at the same location as that specied in Item 14 "Save Path" above.
The "_bk" le extension is appended to the le name.
Use this button to select the backup interval. During data capture, a backup data
le is created at the specied intervals. If all the backup les are linked, the data
will be same as that of the original data. (1/2/6/12/24(h))
* A uctuation of about 10 seconds will be generated in the backup interval.
Therefore, the data size of a backup le uctuates to some degree.
Since there is no loss of data, however, you can concatenate backup les to obtain data equivalent to that
of one backup le that you would obtain from continuous capture.
30
Page 31
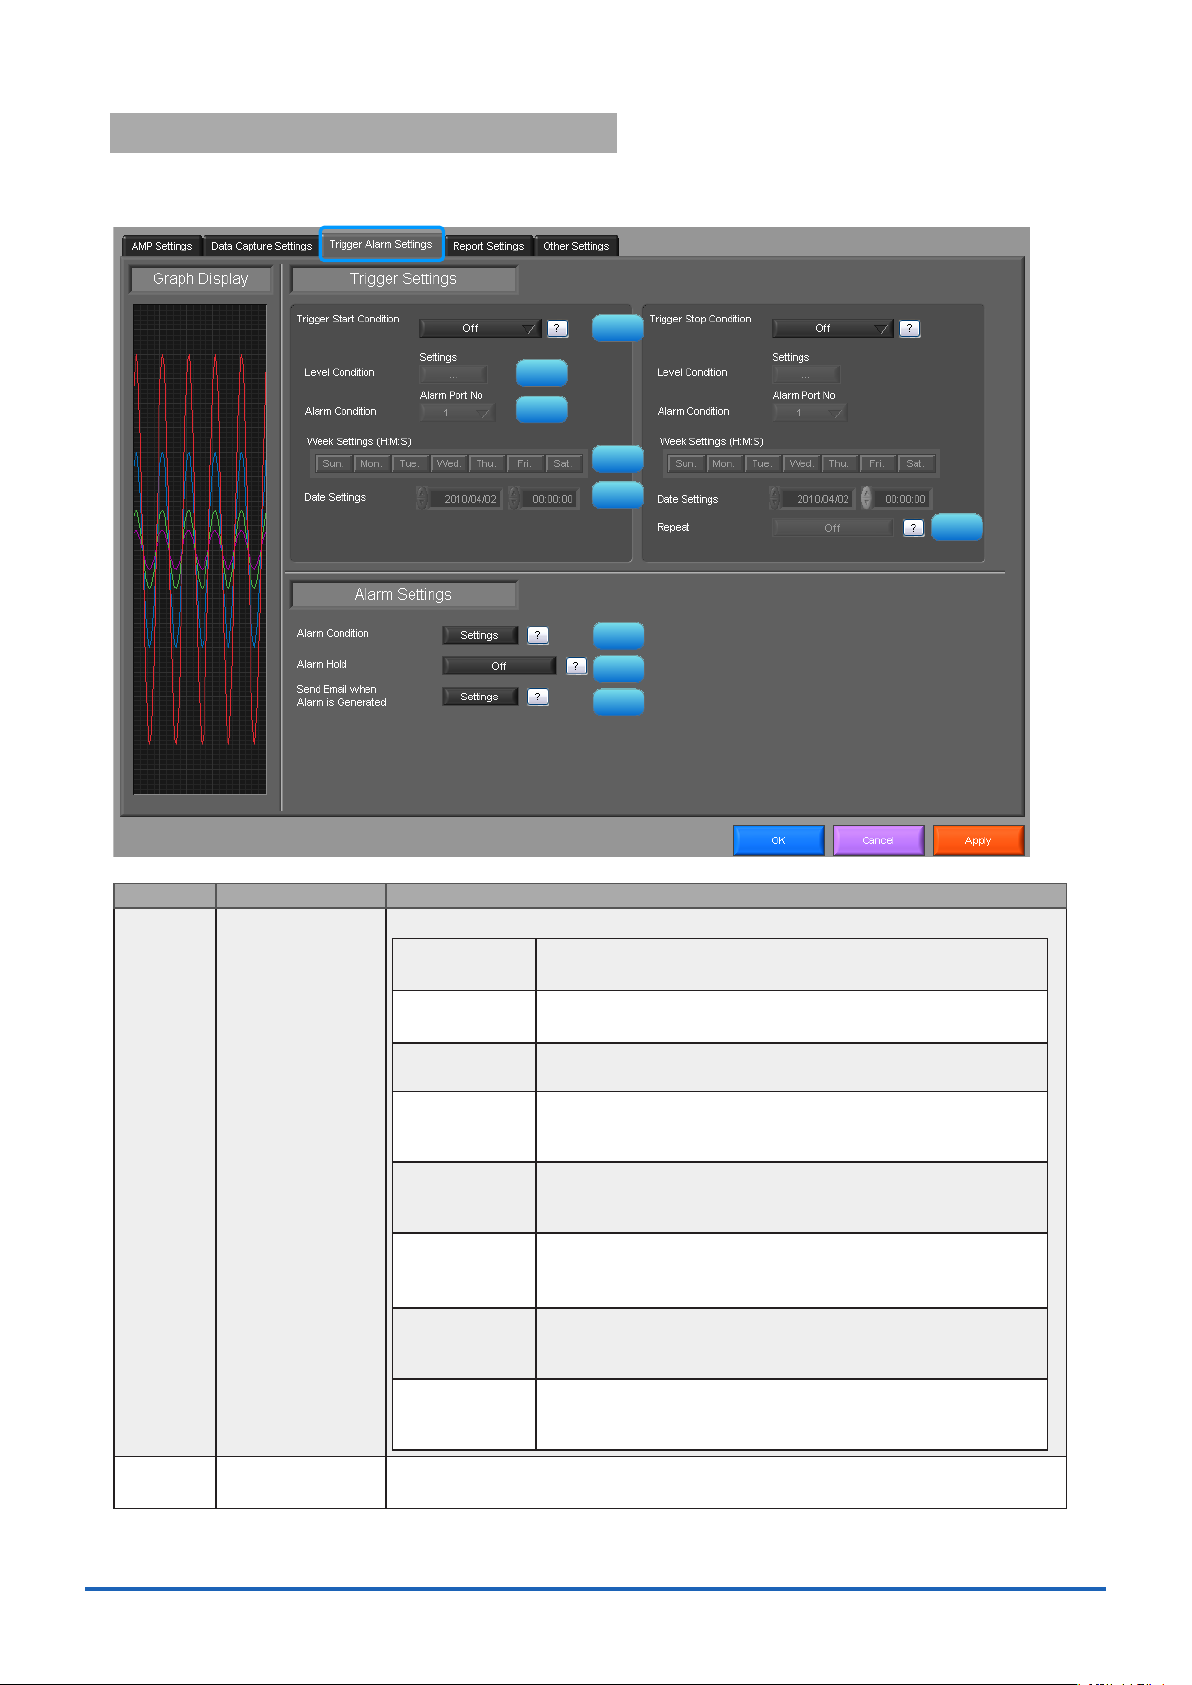
Trigger/Alarm Settings10-3.
1
2
3
4
5
6
7
8
9
Settings such as the trigger start condition, stop condition, alarm settings, and those for sending email are made at
this screen.
No. Name Description
1 Trigger Start/Stop
Condition
2 Level Condition If "Level" has been selected for the start(stop) condition, make the required level
Use this button to select the trigger start(stop) condition.
Off There is no data capture start condition.
(There is no stop condition.)
Level Data capture starts(stops) when the desired channel reaches
the specied level value.
Alarm Data capture starts(stops) when the specied alarm occurs.
Date Data capture starts(stops) at the specied date and time.
Time Data capture starts(stops) at the specied time.
External Data capture starts(stops) with the external terminal signal.
Week Starts (stops) capture when the specied day of the week
Dened Time Starts (stops) capture when a specied length of time
* Available only for the GL220, GL820, and GL800.
* Settings are available only if Repeated Capture is Off.
* Settings are not transmitted to or received from this unit.
* Settings are available only if Repeated Capture is On.
* Settings are not transmitted to or received from this unit.
Data capture starts when the external trigger signal detects a
falling of about 2.5V or less.
arrives.
* Available only for the GL220 and GL820.
elapses.
* The starting function is available only for the GL220 and GL820.
settings here. Refer to section 10-3-1 for details.
31
Page 32
No. Name Description
3 Alarm Condition If "Alarm" has been selected for the trigger start(stop) condition, set the alarm
number here. Select an alarm number between 1 and 4. This setting is not
available for GL200A.
4 Week Settings Sets the day of the week when the trigger start (stop) condition is "Week."
5 Date Settings Sets the Date for starting (stopping) the capture on a specied day of the week
when the trigger start (stop) condition is "Date", "Time" and "Week".
6 Repeat If On has been selected, the device proceeds to perform the next data capture
operation after a start(stop) trigger has been generated.
* Does not transmit or receive the settings to or from this unit. This unit is always Off and the le name
does not include "REP."
7 Alarm Condition Use this button to make the alarm level settings for each input.
8 Alarm Hold This parameter species whether to maintain or clear the alarm status.
On Once an alarm has been generated, the alarm status is maintained.
The alarm generated on each channel is retained together with the
alarm output status. To clear the alarm status, click the "Alarm Clear"
button displayed in the "Alarm Screen".
Off The alarm generated status is not maintained. If the alarm status is
canceled, the alarm status and alarm output for each channel are
canceled.
9 Send Email when
Alarm is Generated
This button to set the conditions for sending an email. An email can be sent when
an alarm has been generated. (However, an email sending environment must be
enabled.)
* Sends mail only during capture.
CHECKPOINT
ە
When the sampling is set to the External, the start trigger and the stop trigger cannot be set
to the external at the same time. Also when the start trigger or the stop trigger is set to the
External, if the sampling is set to the External, the start trigger or the stop trigger is force set to
Off.
32
Page 33

10-3-1.
1 2 3 4 5
6
7 8 9 10 11
12 13
14
15
If "Level" has been selected for the Trigger setting, the "Trigger Start/Stop Condition" settings must be made.
Trigger Level Condition
No. Name Description
1 CH The channel numbers are displayed here.
2 Function Use this button to select the trigger level detection mode.
Off Disabled
Hi A trigger is generated if the input signal is above the specied level.
Lo A trigger is generated if the input signal is below the specied level.
WinIn A trigger is generated if the input signal comes between the specied
levels.
WinOut A trigger is generated if the input signal goes outside the specied
levels.
3 Upper/Lower The level settings are displayed here.
4 Unit The unit is displayed here.
5 Setting Click this button to make the level settings.
6 Switch CH Use this slider to select 10 channels to perform the settings.
7 Pulse CH The channel numbers for pulses are displayed here.
8 Pulse Function Use this button to select the pulse level detection mode. (Same as Analog)
9 Pulse Upper/Lower The level settings are displayed here.
10 Pulse Unit The unit is displayed here.
11 Pulse Settings Click this button to make the pulse settings.
12 Logic CH The channel numbers for logics are displayed here.
13 Logic Function Use this button to select the logic setting.
14 Combination Use this button to set the combination of congured triggers.
* Not available for the GL200A and GL220.
Off Disabled
H Detection is performed when the signal is rising.
L Detection is performed when the signal is falling.
OR Data capture starts (stops) when one of the congured trigger
conditions is true.
AND Data capture starts (stops) when all of the congured trigger
conditions are true.
15 Detection methods Sets the detection method of a trigger.
33
Level Each condition is Level operation.
Edge Each condition is Edge operation.
Refer to section 10-3-1-2 for details.
* Available only for the GL220 and GL820.
Page 34

Trigger Level Settings Screen10-3-1-1.
Upper Value Input
Lower Value Input
Upper Cursor
Waveform
Lower Cursor
Settings CH
Level: Hi
Trigger Area
Trigger Level
トリガ発生エリア
Level: WinIn
Trigger Area
Trigger Level
Edge: Hi Edge: WinIn
This screen is used to make the level settings to detect a trigger.
To make the settings, you input numerical values directly or use a cursor.
Level Detection and Edge Detection10-3-1-2.
To detect a trigger, you can select level detection or edge detection.
• Level Detection:
In the level detection, a trigger is detected when an input signal is above/below the specied level.
• Edge Detection:
In the edge detection, a trigger is detected when an input signal is above/below the specied level.
Even if an input signal reached the detection level before, a trigger is not detected unless it reaches the level
again after it is outside.
34
Page 35

10-3-2.
1 2 3 4 5
6
7
8 9 10 11 12 13
14
15 16
17
The alarm level settings for each input are made at this screen.
Alarm Condition
No. Name Description
1 CH The channel numbers are displayed.
2 Function Select the alarm level detection mode.
Off Disabled.
Hi An alarm is generated if the input signal is above the specied level.
Lo An alarm is generated if the input signal is below the specied level.
WinIn An alarm is generated if the input signal comes between the
specied levels.
WinOut An alarm is generated if the input signal goes outside the specied
levels.
3 Upper/Lower The level settings are displayed here.
4 Unit The unit is displayed here.
5 Setting Click this button to make the level settings.
6 Output Set the terminal that outputs an alarm. It is selected out of the device's four alarm
7 Switch CH Use this slider to select 10 channels to perform the settings.
8 Pulse CH The channel numbers for pulses are displayed here.
9 Pulse Function Use this button to select the pulse level detection mode. (Same as Analog)
10 Pulse Upper/Lower The level settings are displayed here.
11 Pulse Unit The unit is displayed here.
12 Pulse Settings Click this button to make the pulse settings.
13 Pulse Output Set the terminal that outputs an alarm. It is selected out of the device's four alarm
14 Logic CH The channel numbers for logics are displayed here.
15 Logic Function Use this button to select the logic setting.
16 Logic Output Set the terminal that outputs an alarm. It is selected out of the device's four alarm
output terminals.
OR is applied to output of the terminal for each channel.
* Not available for the GL200A and GL220.
output terminals.
OR is applied to output of the terminal for each channel.
Off Disabled
H Detection is performed when the signal is rising.
L Detection is performed when the signal is falling.
Refer to section 10-3-1 for details.
output terminals.
OR is applied to output of the terminal for each channel.
35
Page 36

No. Name Description
1
2
3
4
5
17 Detection methods Sets the detection method of a alarm.
Level Each condition is Level operation.
Edge Each condition is Edge operation.
Refer to section 10-3-1-2 for details.
* Available only for the GL220 and GL820.
10-3-3.
An email can be sent to a specied email address (or addresses) when an alarm is generated.
(An email sending environment must be enabled.)
Send Email when Alarm is Generated
No. Name Description
1 Send Email when
Alarm is Generated
2 Address(s) Enter the email address.
3 Comment Enter the Comment.
4 SMTP Server Enter the SMTP server name or address.
5 Sender address Enter the sender email address.
To send an email when an alarm has been generated, click the checkbox to insert
a check
CHECKPOINT
ە
The mail send function is available only during capture. No mail is sent even if an alarm is
generated during the Free Running status.
36
Page 37

Report Settings10-4.
1
2
3
4
5
6 8
9
11
10
7
The daily report and monthly report settings, as well as the Direct to Excel settings, are made at this screen.
The daily report and monthly report are created as separate CSV les at capture intervals that are separate from those
of the captured data.
The Export to Direct Excel File function transfers data in real time to an Excel le as it is being captured.
If a template is used for the Excel le, waveforms can also be drawn in Excel in real time.
No. Name Description
1 Daily report
2 Monthly report Click this checkbox to enter a check and enable the Monthly report function.
3 Daily report
Capture Interval
4 Monthly report
Capture Interval
5 Output Format Use this button to select the output format for the report(s).
6 Congure CSV le:
7 Congure CSV le:
8 Template le The template le settings for the Export to Direct Excel File function are made
9 Destination sheet This parameter is used to specify the name of the specied template sheet.
10 Start cell This parameter is used to specify the start position on the sheet from which to
Daily report
Monthly report
Click this checkbox to enter a check and enable the Daily report function.
Use this button to select the daily capture interval. 100/200/500msec/1/5/10/30s
ec/1/5/10/30min. Data is captured at the sampling interval when the settings are
faster than the sampling interval.
Use this button to select the monthly capture interval. Available settings are
1/5/10/30min/1/2/6/12/24hours. Data is captured at the sampling interval when the
settings are faster than the sampling interval.
Save as CSV
batch les
Export to direct
Excel le
This parameter is used to specify the save destination for the Daily report.
The data is saved as CSV batch les.
The captured data is exported directly to Excel. If a template
le that was created in Excel is used, an original report can
be created in real time. The template les that were provided
as standard accessories can also be used.
* EXCEL must be installed to use this function.
* Transfer of 32000 points or more is disabled if a graph is used in the template.
This parameter is used to specify the save destination for the Monthly report.
here. Files with the "xlt" and "xls" extensions can be used. Template les are
provided as standard in the "Temp" folder that is installed with this software.
transfer data.
37
Page 38

No. Name Description
1
2
3
4
5
6
8
9
10
11
7
11 Switch sheet When the specied number of points is reached, data is transferred to a different
sheet.
* When data is transferred to a different sheet, the graph or other element may not work correctly.
* EXCEL versions before 2007: Supports display up to Row 65536.
* EXCEL 2007 and later versions: Supports display up to Row 1048576.
* Transfer of 32000 points or more is disabled if a graph is used in the template.
Other Settings10-5.
This screen is used to make various other settings and to display information.
No. Name Description
1 Synchronous
control
2 Room Temp.
Compensation
3 Burnout Set to On to regularly check a thermocouple sensor line break. If a thermocouple
4 Output alarm at
burnout
5 Temp. Unit The display unit can be switched between Celsius and Fahrenheit.
6 Power On Start Data capture starts automatically as soon as the power to the device is turned on.
7 AC Line Frequency Set the voltage frequency to suit the area where the device will be used. Be sure
When multiple GL devices are connected, measurement starts on all GL with the
synchronous control settings ON once measurement is started on one device. The
same is true for nishing a measurement. Trigger and capture settings operate at
their own congured values. (Triggers or samplings cannot be synchronized.)
This parameter is used when thermocouples are used to perform temperature
measurement. When using this device for room temperature compensation, select
Internal.(Always select Internal for this setting.)
is connected parallel with other measurement devices, please set this to Off as it
may affect the other devices. When a sensor line break is detected, "BURNOUT"
message appears.
When set to On, an alarm is output when a burnout has occurred.
This setting can only be specied for data capture to the device. If On has been
selected, select "Save the settings to the device" when exiting this software.
to select the correct frequency, as an incorrect setting affects the noise reduction
capability. The noise on the power source can be eliminated at the following
sampling rates:
10 channels or less : 500ms or slower
20 channels or less : 1s or slower
50 channels or less : 2s or slower
100 channels or less : 5s or slower
200 channels or less : 10s or slower
38
Page 39

No. Name Description
8 Return to Factory
Default Settings
9 Software Version The software version is displayed here.
10 Device Information Information relating to the connected device is displayed here.
11 Graphtec Web site Click this button to access the Graphtec web site.
Click this button to return the settings to the default values.
39
Page 40

FILE menu11.
1 2
3 4 5 6
7
8
9
10
11 12 13
The FILE menu provides replay, CSV conversion, printing, and screen saving of captured data.
Open Data11-1.
Replays data captured to the PC or GL device unit. Select "Open Data" to open the le selection screen (See gure
below). Select a le to be replayed.
Refer to "12. Replay Screen" for details on data replay.
No. Name Description
1
2
3
4
5
6
7
8
9
10
11
12
13
Drive Use this button to select the appropriate PC drive.
File Path The le location is displayed here.
Select Folder Click this button to select the folder that has data les.
Create Folder Click this button to create a new folder.
Delete Click this button to delete the selected le.
Order Use this button to select the le arrangement order.
File Tree The hierarchies of the device are displayed in a tree format.
Frequently-used
folder
File List Files/folders in the current hierarchy are displayed.
File Information When you select binary or text data in the current hierarchy, le information is
Register as
frequently-used
folder
Select File Click this button to select a le (display the le).
Cancel Click this button to cancel the selected le.
The "Data" is the default location to save les in this application.
This is the GL220_820APS folder in the user document folder.
Use these buttons to select a frequently-used folder and move the le to that
folder.Single click : SelectDouble click : Move.
displayed.
Click this button to register the currently displayed folder as one of the frequentlyused folders. After registering, it is added to Item 5 "Frequently-used folder".
40
Page 41
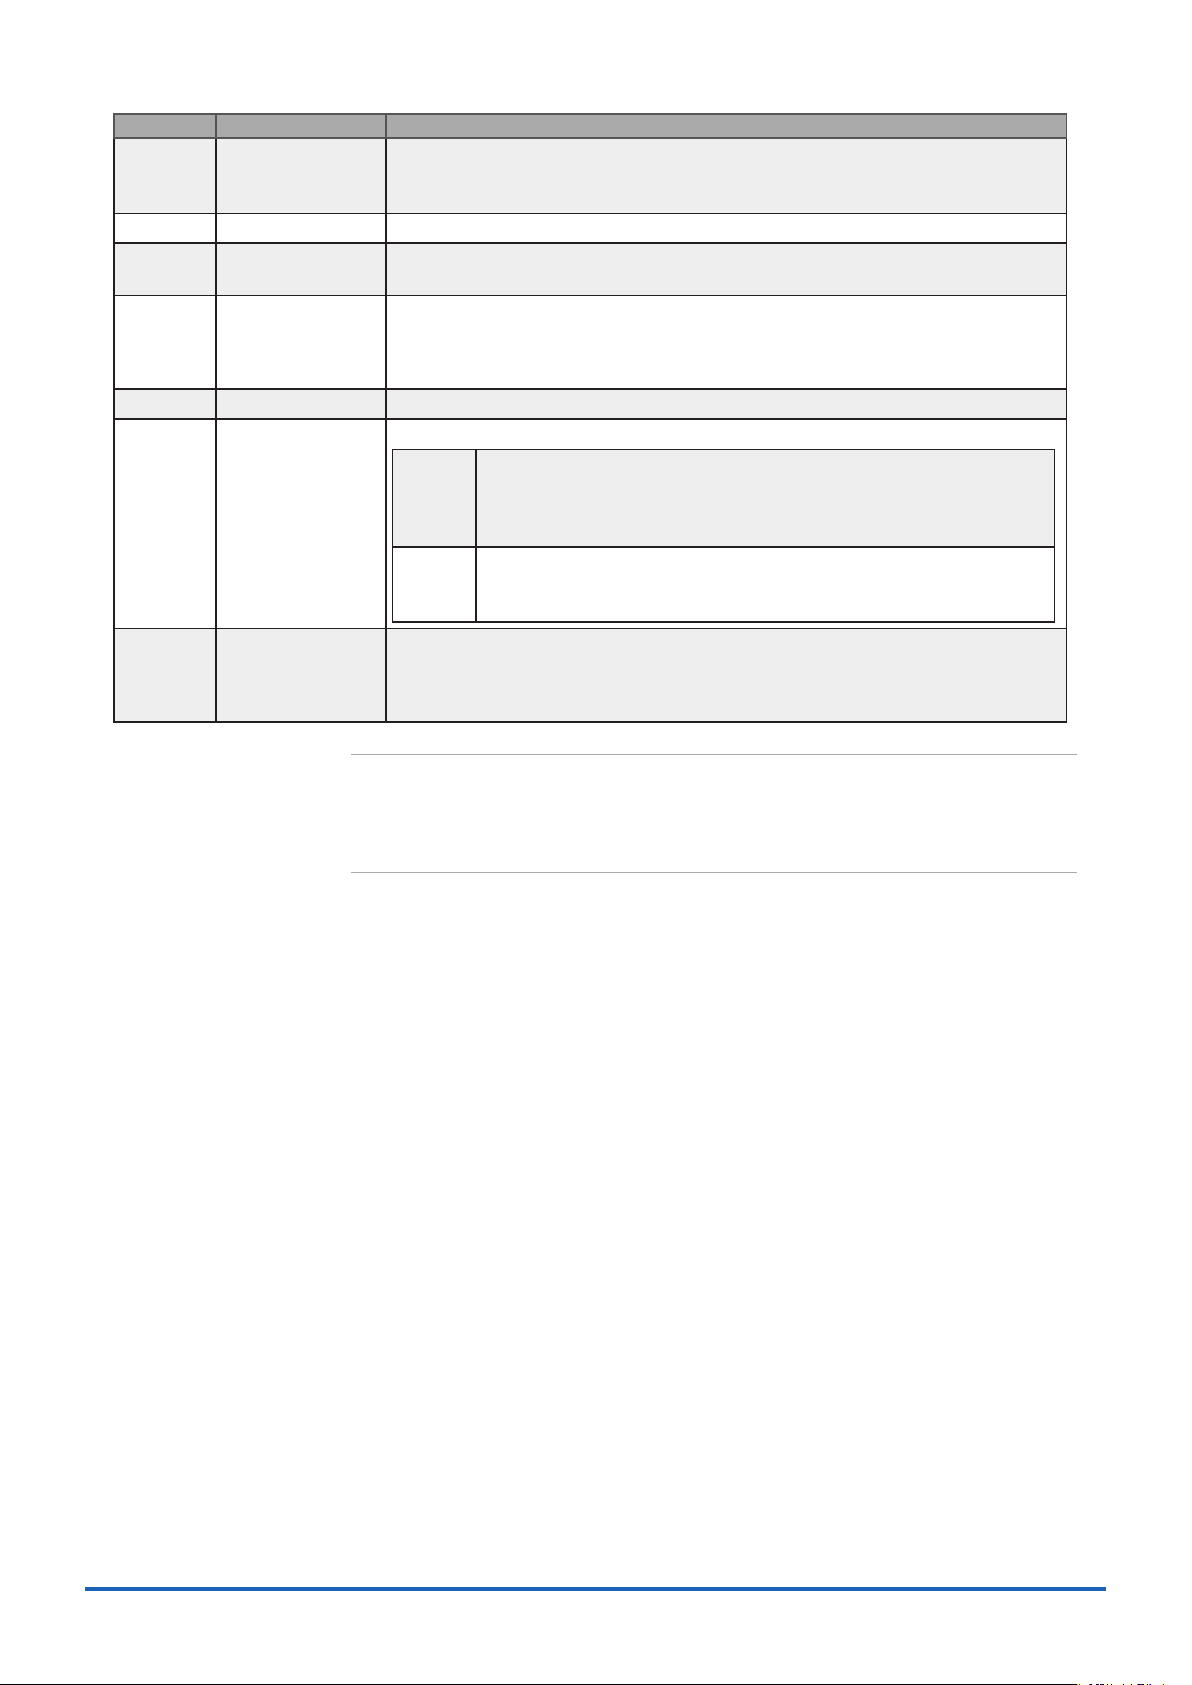
CSV File Batch Conversion11-2.
1
2
3
4
5
6 7
This function enables multiple GBD (binary data) les to be converted in a batch to CSV format les.
No. Name Description
1
2
3
4
5
6
7
List of converted
les
Add Click this button to add a le to the batch to be converted.
Delete Click this button to remove a le from the batch to be converted. With the SHIFT
Save destination
folder
Save folder path Displays the path of the save folder.
Start batch
conversion
Cancel Click this button to cancel the batch conversion operation and close the screen.
The batch-converted les are displayed in a list.
or CTRL key pressed, you can select more than one le.
Select the save destination for the batch-converted les here.
Click this button to start batch le conversion.
41
Page 42

Print Screen11-3.
1
2
3
4
5 6
Prints the display screen on the printer. Printing is performed at the printer that has been selected as the default
printer. If you change the printer, relaunch the software.
No. Name Description
1
2
3
4
5
6
Screen range Select a screen range to be printed.
Entire screen Prints all of the displayed screen.
Waveform only Prints only the waveform graph.
Print range Selects a range to be printed.
during data replay.
Current view
area
Between the
cursor A and B
White background
chart
Print information Prints the graph with information in it. The information to be printed is the span,
Print Starts printing.
Cancel Cancels printing.
Prints the waveform graph against a white background.
Time/DIV, and sampling interval.
Not all the channel information may be included depending on the number of channels to be displayed.
Prints the current view area.
Prints data between Cursors A and B in the time scale in
which it is displayed. If the range is too large, data is printed
on more than one sheet.
* Selection is available when the scroll is Off during capture, or
42
Page 43
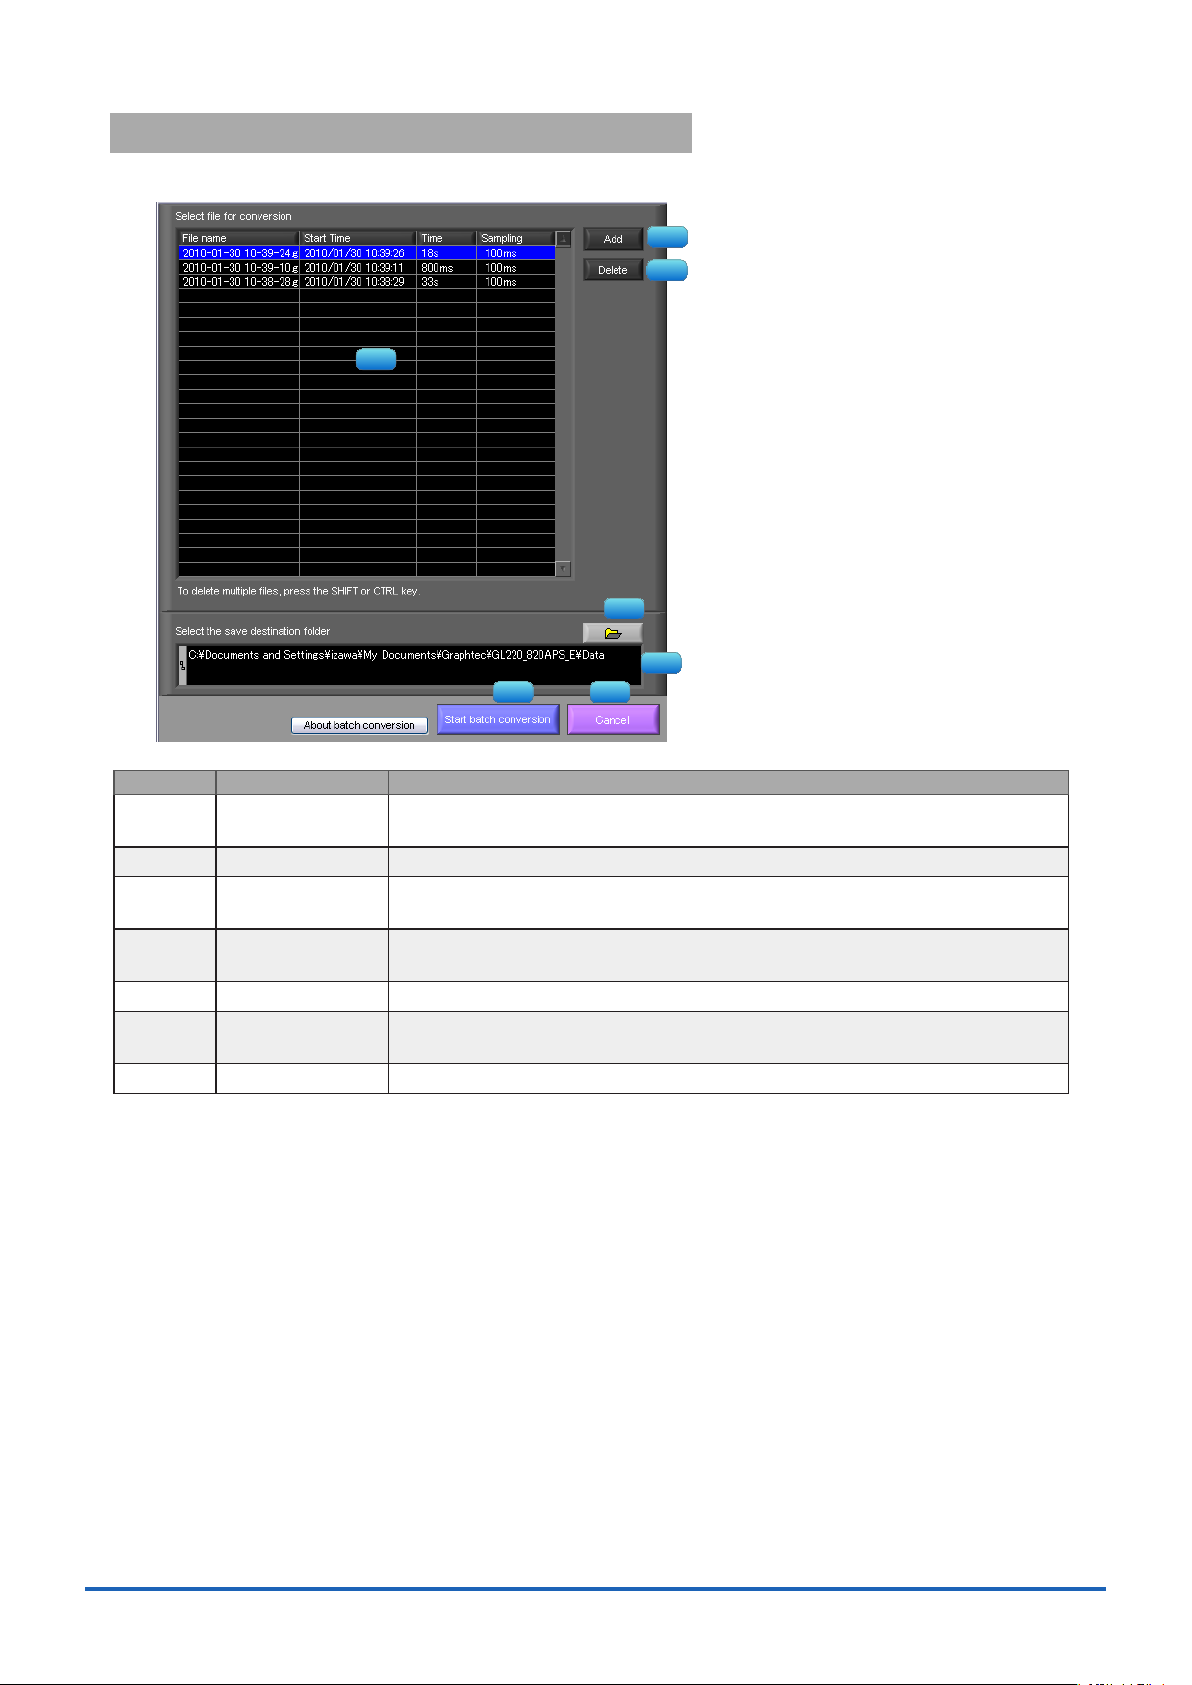
Save Screen11-4.
1
2
3
4
5
To save the displayed screen as a BMP le.
No. Name Description
1
Screen range Selects a range of the screen to be saved in BMP.
Entire screen Saves all the displayed screen in BMP.
Waveform only Saves only the waveform graph in BMP.
2
3
4
5
White background
chart
Print information Saves the graph with information displayed in it in BMP. The information to be
Save Starts saving the screen in BMP.
Cancel Cancels saving the screen.
Saves the waveform graph against a white background in BMP.
displayed is the span, Time/DIV, and sampling interval.
* Not all the channel information may be included depending on the number of channels to be displayed.
CSV Config11-5.
This setting is for the decimal point and the delimiter that are used in the CSV le for output.
Please set according to the setting of OS that actually used.
The CSV le which uses different decimal point and delimiter cannot be opened.
43
NOTE
ە
Please set to the delimiter other than the comma (,) if the comma (,) is set to the decimal point.
Do not set comma (,) to both the decimal point and the delimiter at same time.
Page 44

Replay Data12.
1
2
3
4
5
6
8
9
10
11
12
13 14
7
This section explains how to replay data that has been captured.
Y-T12-1.
No. Name Description
1
2
3
File Operations related to les are performed.
Open Data Click this button to open the screen for opening les captured
to a PC or to the device.
Open in new
window
Superimpose/
Link
Convert then
Save
Print Screen Click this button to print out a copy of the displayed screen.
Save Screen Click this button to save the displayed screen as a BMP le.
Capture File Name The name of the data capture le that is being replayed.
Start Time The time at which data capture was started.
Opens a le in a new window.
This function is useful when you compare captured
waveforms.
For the reviewing data, you can overwrite the waveform of
other captured data or link and display the waveform. Refer
to section 12-4 for details.
Click this button to convert data being replayed into GBD or
CSV les and save them. Data cannot be saved during Free
Running.
Refer to section 12-5 for details.
Printing is performed at the printer that has been selected as
the default printer. If you change the printer, set the printer
and then restart the software.
Refer to section 11-3 for details.
44
Page 45

4
1
2
3
4
5
6
7
8
9
10
11
12
13
14
Capture Time The data capture time
Sampling Interval The sampling interval
Close Click this button to close the replay screen.
Alarm Displays the status of the alarm port on Cursor A. Refer to section 13-1 for details.
Display switch Switches display modes. Refer to the page on each of the display modes for
details.
Waveform Graph The waveforms are displayed here.
Cursors Selects which of the cursor values should be displayed in the digital display area.
Up to three values (Cursor A, Cursor B, Cursor A-B) can be displayed at the same
time.
Digital The digital values are displayed in this area. Clicking on any of the CH numbers
enables the waveform for that channel to be hidden/displayed. The channels for
which an alarm has been generated are shown in red.
Cursor Time The cursor times are displayed during data capture when Scroll Off has been
selected.
Scale operations Click this button to perform various settings for the waveform display. Refer to
section 12-6 for details.
Scroll bar Moves waveform. Can also move Cursors A and B. Refer to section 12-7 for
details.
* EXT is displayed during external sampling.
Digital12-2.
You can select "Digital" tab to switch to the digital display.
The Digital screen is used mainly to perform operations such as statistical calculation using the A and B cursors.
No. Name Description
1
2
3
4
45
Waveform Graph The waveforms are displayed here.
Digital display The cursor A and B levels, calculation results, and so forth are displayed here.
Execute Stat. Calc Click this button to perform statistical calculation of the data between Cursors A
and B.
Cursor Time The cursor A and B times are displayed here.
Page 46

XY12-3.
1
2
3
4 5 6
7
This function is used to display the data between the A and B cursors in an XY format. (Max 10000 points)
No. Name Description
1
2
3
4
5
6
7
X-Y Waveform
Graph
Waveform
operation icons
Range These buttons specify display of the scale values for the channels selected for the
On/Off Click these buttons to specify the display as ON or OFF.
X Axis Use these buttons to select the channels for the X axes.
Y Axis Use these buttons to select the channels for the Y axes.
Cursor Information The cursor levels of the channels for which Range has been specied are shown
The X-Y waveform graph is displayed here.
Use these buttons to expand, shrink, or move X and Y axes.
X and Y axes.
here.
46
Page 47

Superimpose/Link12-4.
1
2
3
4 5 6 7
This function enables multiple les to be superimposed on the display, or to be linked.
The data must be captured under the same conditions to be linked.
No. Name Description
1
2
3
4
5
6
7
Add Click this button to add a le to those selected for the superimposing or linking
operation.
Delete Click this button to delete the added le from the list. With the SHIFT or CTRL key
pressed, you can select more than one le.
File List The les added to those selected for superimposing or linking are listed here.
Superimpose Click this button to superimpose les.
Link Click this button to link les.
* Data with different capture conditions cannot be concatenated. When chain the les, the date and time
for chained le is displayed based on the date and time of No. 1 le. Therefore the date and time which are
for No. 2 and later les may not be same as actual measurement date and time.
Normal Click this button to open the original le without performing any superimposing or
linking operations.
Calcel Click this button to close the screen.
(* Overlapped data cannot be saved.)
47
Page 48

Convert then Save12-5.
1
2
3
4
5
6 7
Display all the data in one screen
Expand x-axis range specification
Ordinary Cursor
Drag in X-axis direction
All Data
Cursor AMove waveform to left Move waveform to rightCursor B
X-axis display area
This function is used to convert replayed data to a different format (GBD, CSV), and to clip and save only the data
between the cursors.
No. Name Description
1
2
3
4
5
6
7
Save format Select a format to convert and save data.
GBD binary data
CSV text data. This is a le format that can be opened with Microsoft's
Path Select a location to which you want to save data.
Open with
EXCEL after the
conversion
Select data to be
converted
Spot Samples Spot samples are extracted when saving data.
Save Executes conversion and saving.
Cancel Click to close the screen.
If this setting is selected, a le converted into CSV format is opened with EXCEL.
* This setting cannot be selected if data is saved in binary format.
* EXCEL must be installed to use this function.
* This function is not available with EXCEL 2000 or any previous versions.
All Data All of the data being replayed is saved.
Between Cursor Data between cursors A and B is saved.
Ex) 1 → 1 :Spot samples are not extracted.
Ex) 2 → 1 :One of two data points is extracted.
* CSV data cannot be converted to binary data.
EXCEL and other software.
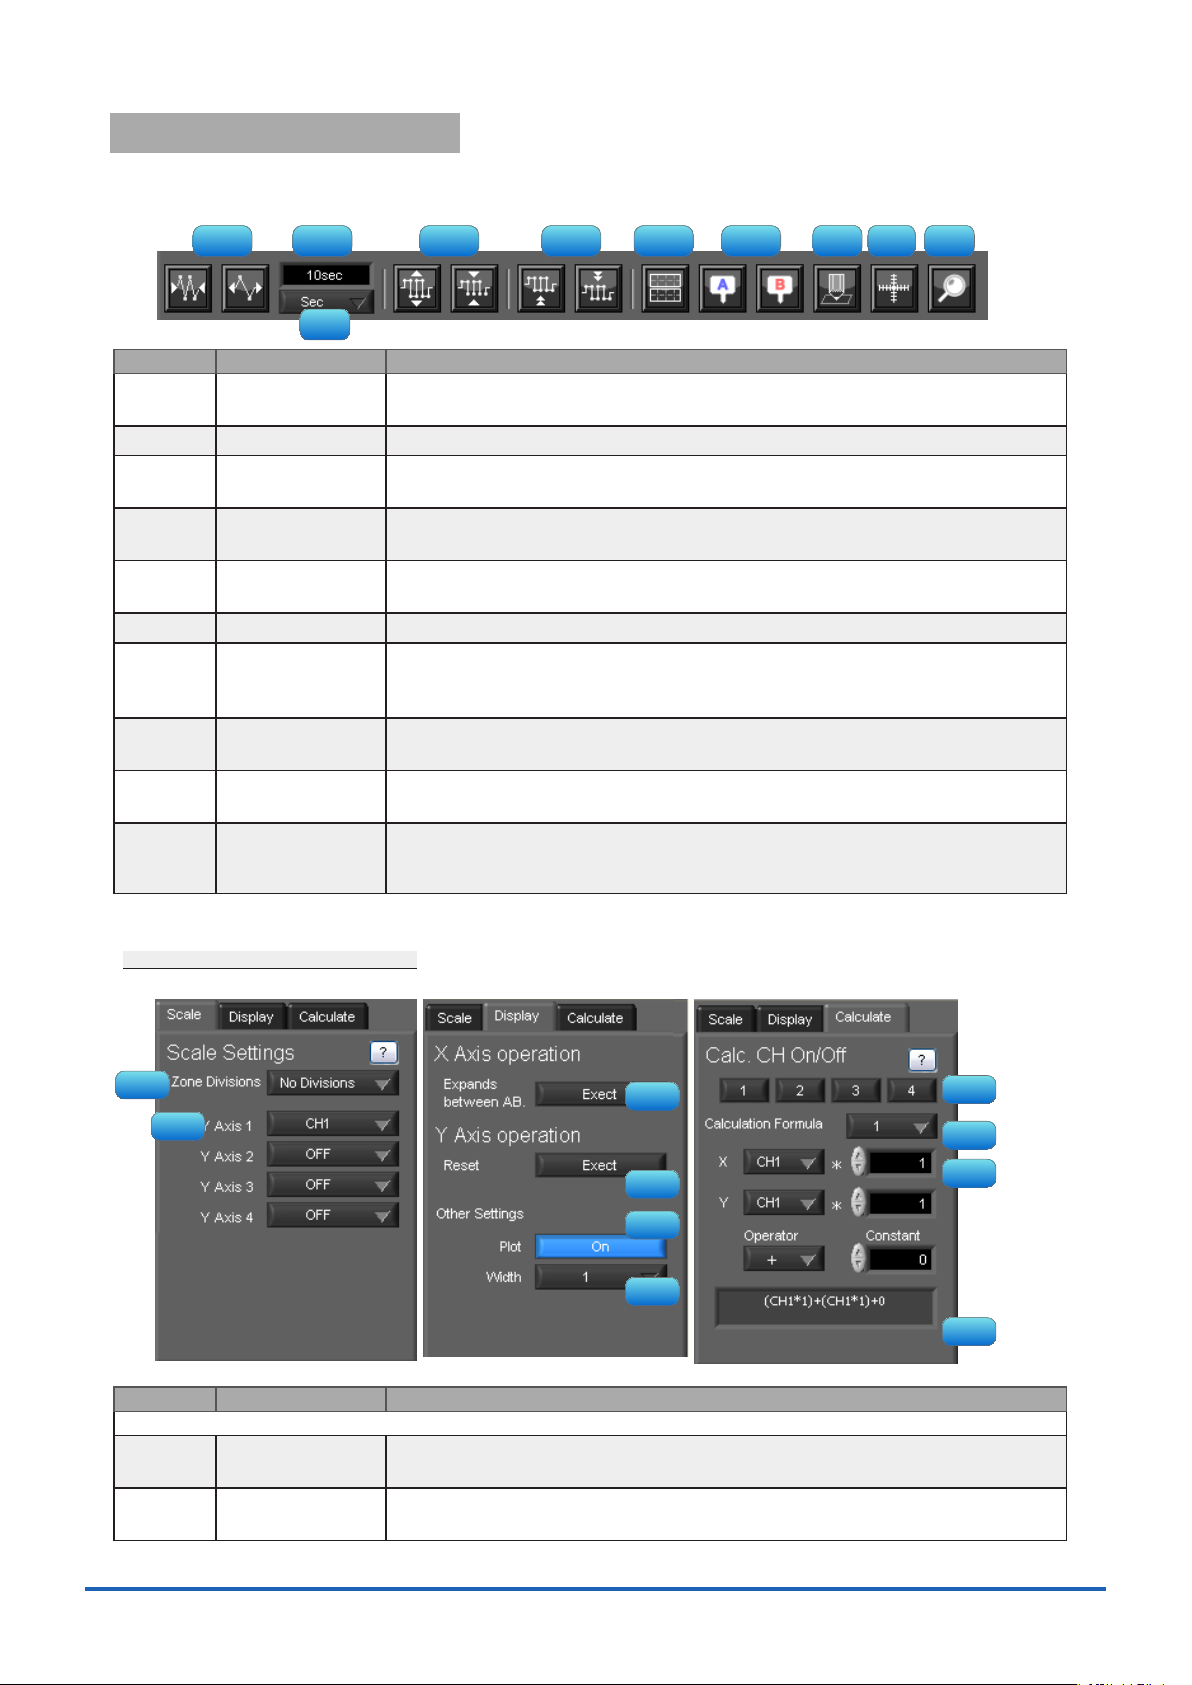
Scale Operations12-6.
Use this area to perform scale operations, enlarge the selected area, etc.
Scroll bar12-7.
Allows you to move waveforms and cursors.
48
Page 49

Other Functions13.
Alarm detected
1
2
3
Alarm13-1.
The alarm output port status is displayed in this screen, together with the Alarm Clear button.
During replay, it shows the alarm output port status at the cursor point selected in the digital value display.
The Alarm Clear button is disabled during replay.
Statistics/Log13-2.
The statistical calculation and alarm log results are displayed in this screen.
No. Name Description
1
2
3
Save results to a
CSV
Stat. Calc The statistical calculation results are display here.
Alarm Log The alarm log is displayed here. The alarm log shows only the most recent 100
Saves the results of displayed statistical calculation and alarm history to a le.
alarms.
When the number of alarms exceeds 100, the records will be erased from the
oldest one.
49
Page 50
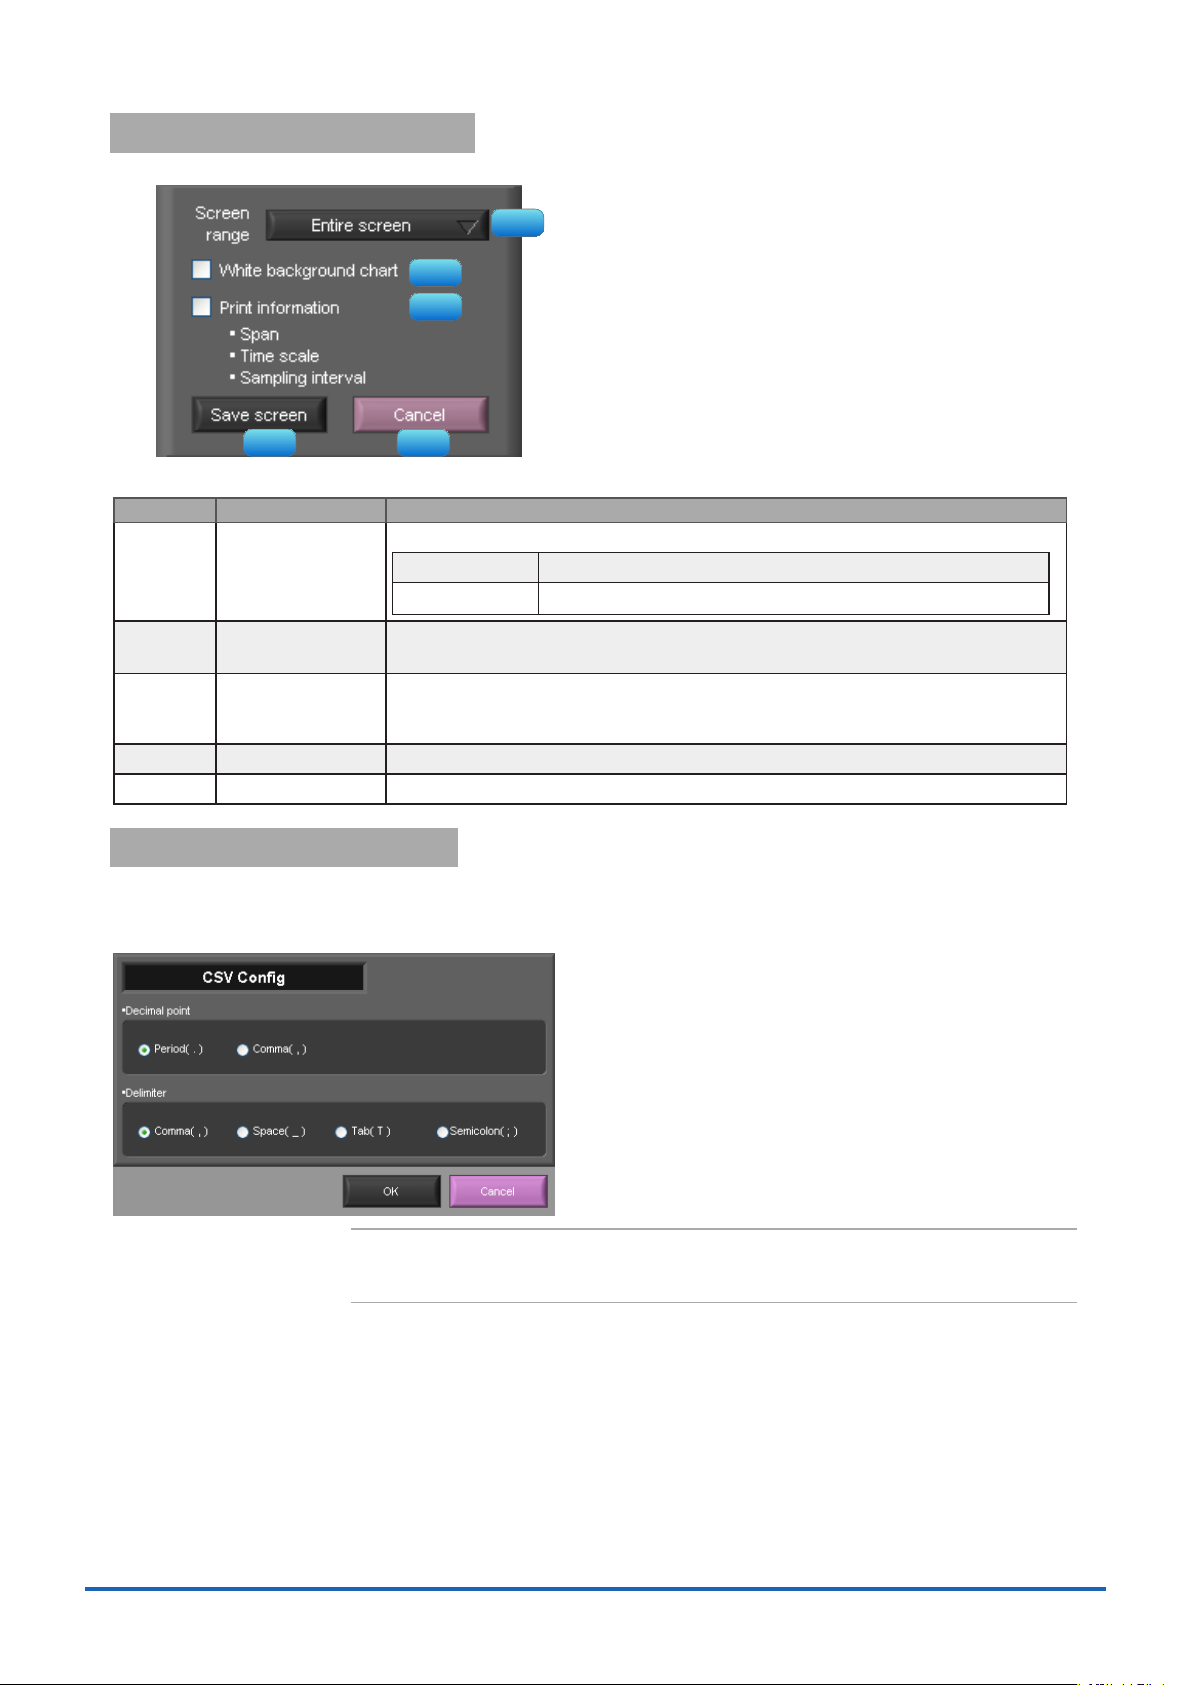
About Icons13-3.
1 2 3 4 5 6
7
8
9
10
1
2
3
4
5
6
7
8
9
10
Y-T View (Y-T Zoom) provides control icons that allow you to perform intuitive operations.
Each of the icons has the following functions:
No. Name Description
1
2
3
4
5
6
7
8
9
10
Expand/Shrink
Time axis
Display Uses the display width of one screen to display time.
Expand/Shrink Y
axis span
Move Y axis
position
Waveform Operation
Displays Cursor Displays Cursor A/B in the waveform display.
Comment Allows you to enter a comment on a waveform of a desired channel during capture
Cursor direction
switching
Move/Search During replay, click this icon to open the screen to move to the desired time or
Switch Scale Click this icon to switch between a relative time and an absolute time.
Expands/Shrinks the time axis.
Expands/Shrinks the Y axis of the selected channel.
Click this icon to move up and move down the Y axis position for the selected
channel.
Click this icon to open the screen to edit graph waveforms. Refer to section 13-31 for details.
or replay. The entered comment will be redisplayed when the le is opened again.
Refer to section 13-3-2 for details.
Switches the vertical and horizontal sides of a cursor.
points and to search at any level. Refer to section 13-3-3 for details.
Fixed to a point while external sampling setting is used.
* Disables selection of absolute time in Free Running status.
13-3-1.
Various types of waveform operations can be performed.
Scale
Waveform Operation
No. Name Description
1
2
Zone Divisions Divide the Y-T waveform graph into the upper side and the lower side. (No
Divisions/2 Divisions/5 Divisions/10 Divisions)
Y Axis When "Zone Divisions" is set to "No Divisions", up to four Y axis ranges can be
displayed.
50
Page 51

Display
1
2
3 4
3
4
5
6
Calculation
7
8
9
10
Expands between
A-B
Y Axis Operation
Reset
Expands data between Cursors A and B when the scroll is stopped during capture,
or during replay.
* The expansion in the Y-axis direction is not available.
Click this button to revert the values set in the Y axis span and position to the
default values. The default values are the same values as those of when switching
the ranges.
Plot Click this button to display plot marks at the actual sample points on the
waveforms.
Line Width Change the line width of the waveforms.(1/2/3/4/5)
* The line may be thicker than the selected number of dots due to circumstances regarding input signals.
Calculation CH On/
Off
Use these buttons to set calculations 1-4 to On/Off. On : Calculation results are
shown as waveforms and digital values. Off : Do not perform calculations.The
calculation results are only shown in Y-T display, and do not affect the captured
data.
Calculation channel
X/Y
Calculation
Formula
Sets the calculation channel for which calculation is to be set
X.)
Use this button to set the variable for a linear expression between channels.
A • CH X * B • CH Y + C
(* The unit conforms to CH
The expression you set appears at the bottom of this window.
(A and B are arbitrary coefcients. * is an arithmetic operation (+-x÷). X and Y are arbitrary channels, and
C is an arbitrary constant.)
Expression Displays the calculation specied in the Expression setting.
13-3-2.
Input Comments
Click this icon to input a comment above the waveform of the desired channel during a data capture (replay) operation.
If the scroll is ON, the input position is at the "Comment Input" in the upper part of a waveform. If the scroll is OFF, it is
the position of Cursor A.
No. Name Description
1
2
CH Select a channel for entering a comment.
Comment input/
select
Enters a comment. Up to 20 comments can be entered. If you change a position
where a comment has already been entered, the entered comment will also be
changed.
3
4
Input Click this button to input the comment..
Delete Click this button to delete the comment that was input
CHECKPOINT
ە
Comments will be displayed based on the scale specied at the start of the data capture
operation.If the Y-axis scale is changed during data capture, the input comments will be
off positioned when displayed on the replay screen. To display the comments above the
waveform, change the Y-axis scale after the replay.
51
Page 52

13-3-3.
1
2 3
4
5
6
7
8
9
10
11
During replay, cursor A and the waveforms can be moved to the desired position.
You select how to move them and perform the operation with the "Move" tab.
Search
Move
Move/Search
No. Name Description
1
2
3
4
5
6
7
8
9
10
11
CH Use this button to select the CH to be searched.
Slope Use this button to select the slope to use for performing the search.
H : Search for a rising signal.
L : Search for a falling signal.
Level Use this button to set the search level.
Prev./Next Search Performs analog search.
The judgment criteria of search is an edge.
• Find Previous: Search in the past direction
• Find Next: Search in the future direction
Alarm This parameter is used to specify the alarm port number. This setting is not
available for GL200A.
Generated/Cleared Use this button to set the alarm status in which searches are performed.
Generated : Performs search when an alarm is generated.
Cleared : Performs search when an alarm is cleared.
Prev./Next Search Performs alarm search.
The judgment criteria of search is an edge.
• Find Previous: Search in the past direction
• Find Next: Search in the future direction
CH Use this button to select the CH to be moved.
Search Max/Min Searches for the maximum and minimum values of the specied channel.
• Find Maximum: Searches for the maximum value.
• Find Minimum: Searches for the minimum value.
Serch in absolute
time
Search in relative
time
Search the specied time/date.
* This function is not available for external sampling data.
Search the specied time. The searched time is the relative time from when data
capture was started.
* This function is not available for external sampling data.
52
Page 53

Operating Procedure14.
This chapter describes the basic operating procedure.
The operating procedure starts with the software and the device in the connected status.
For the connection procedure, see Section 9, "Connecting to a PC (Personal Computer)".
The settings that are not addressed in the following sections are the factory default settings.
Capture Settings14-1.
Description
1 Settings related to
AMP
2 Settings related to
data capture
After connecting to the device, press the "Capture Settings" button on the main screen.
CH1: Input = TEMP, Range = TC-K, Filter = Off, Scaling = Off
CH2: Input = DC, Range = 1V, Filter = Off
Set to other channels to Off.
Sampling Interval = 1sec
Device Capture Destination: Internal Memory
PC Capture Format: Binary Data
14-1-1.
The settings for CH1 and CH2 are made according to the setting options. Set other channels to "Off".
Settings related to AMP
53
Page 54

14-1-2.
The settings related to data capture are made according to the setting options.
• Select the "Data Capture Settings" tab.
• Set "Sampling Interval" to 1sec.
• Sets the device capture setting of this unit to On.
• Set "Format" of "PC Capture Settings" to "Binary Data(GBD)".
Settings related to data capture
With the above setting, data is saved to the internal memory and PC at the sampling interval of 1 second.
54
Page 55

Start14-2.
Click the "Start" button to start capturing actual data.
14-2-1.
If Off is selected for the waveform "Scroll" button during a data capture operation, past data can be viewed.
The scrolling operation will be halted, enabling past data to be displayed in the scroll bar.
Moreover, moving the cursors enables the cursor level values to be viewed.
To return to the waveform scrolling operation, click the "Scroll" button once again.
Displaying Past Data during a Data Capture Operation
55
Page 56

Stop14-3.
Click the "Stop" button. Data capture stops, and the device returns to the Free Running status.
When capture ends, the screen automatically switches to the replay status.
Replay Data14-4.
Replays data captured to the PC or this unit. Data captured using either this software or this unit can be replayed. The
formats supported for replay are binary data (GBD) and text data (CSV).
This section describes replaying binary data captured to the PC and performing basic operations.
14-4-1.
In the "File" on the main screen, select the "Open Data".
The screen to select a le opens. Select a le from the location where it is saved, and press the "Select".
Replaying File
56
Page 57

14-4-2.
The selected le is read, and the waveforms are displayed.
Waveform display
14-4-3.
During replay, two cursors A and B are provided and can be moved to any position in the waveforms.
You can drug the cursors on the waveforms to move them.
Also, you can use the icon of the scroll bar to move them.
Also, if the rectangle shaped button which is located at left/right edge of the scroll bar, the scroll is done in 1 div step.
Cursor Operations
57
Page 58

14-4-4.
A comment can be input at the position above the desired channel of cursor A.
The input comment will be saved even after a le is closed. Next time the le is open, it is displayed in the same
location.
(Only when the data is captured to the PC).
Select the "Comment" icon.
Here, we will input a comment "Check" above the waveform for CH1.
After you input the string, press the "Input" button.
Now, the comment is input.
Input Comments
58
Page 59
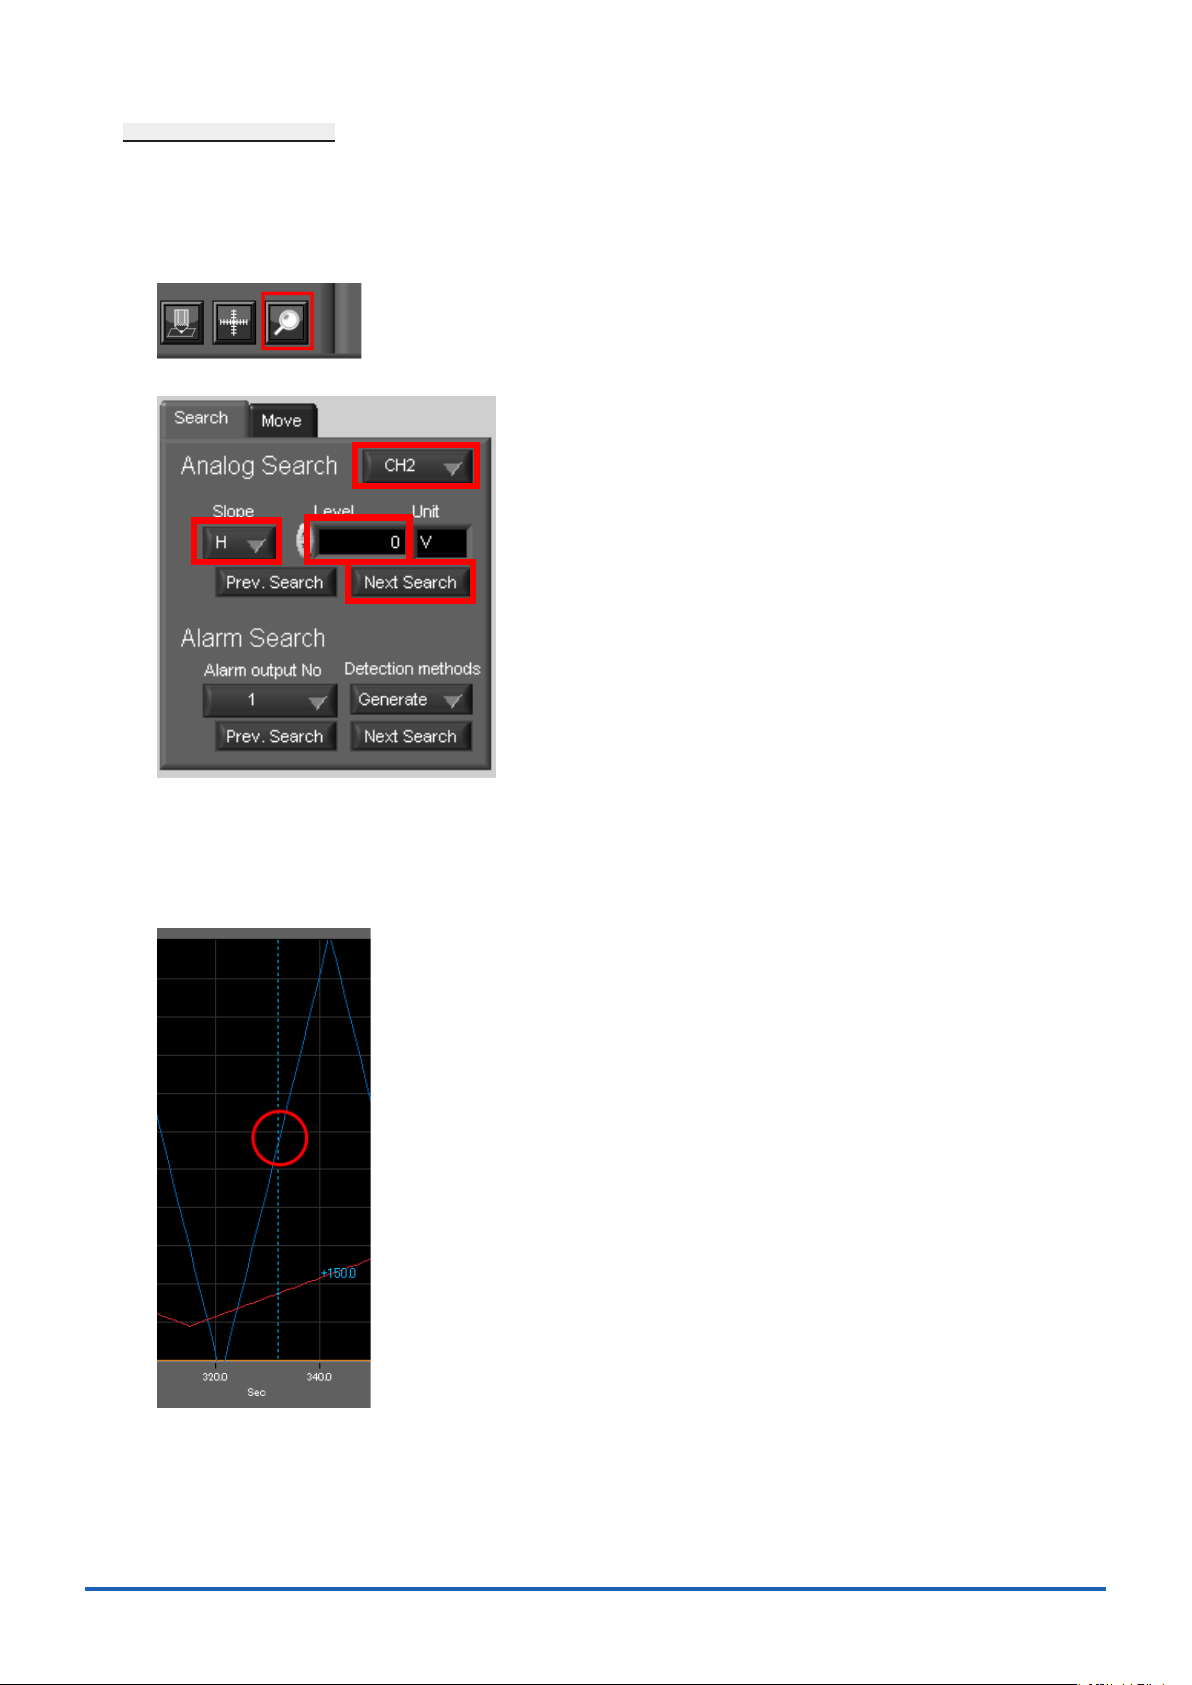
14-4-5.
1
2 3
4
Search is performed to check the location where data is above/below the specied value. Then, a cursor and
waveforms are moved to the location.
Here, we will search for a rising signal and the location above 0V for CH2.
Select "Move/Search" icon.
Data Search
1. Set CH to CH 2.
2. Set the search conditions to "Hi" (rising signal).
3. Input 0V.
4. Press the "Next Search" to search the current cursor in the forward direction.
The location above 0 V is located, and cursor A and the waveform are moved.
59
Page 60

●Specications are subject to change without notice.
GL220_820 Application Software User's Manual
APS (GL220_820) -UM-151
May. 1, 2010
GRAPHTEC CORPORATION
60
 Loading...