

Page 1
SAVE THESE INSTRUCTIONS
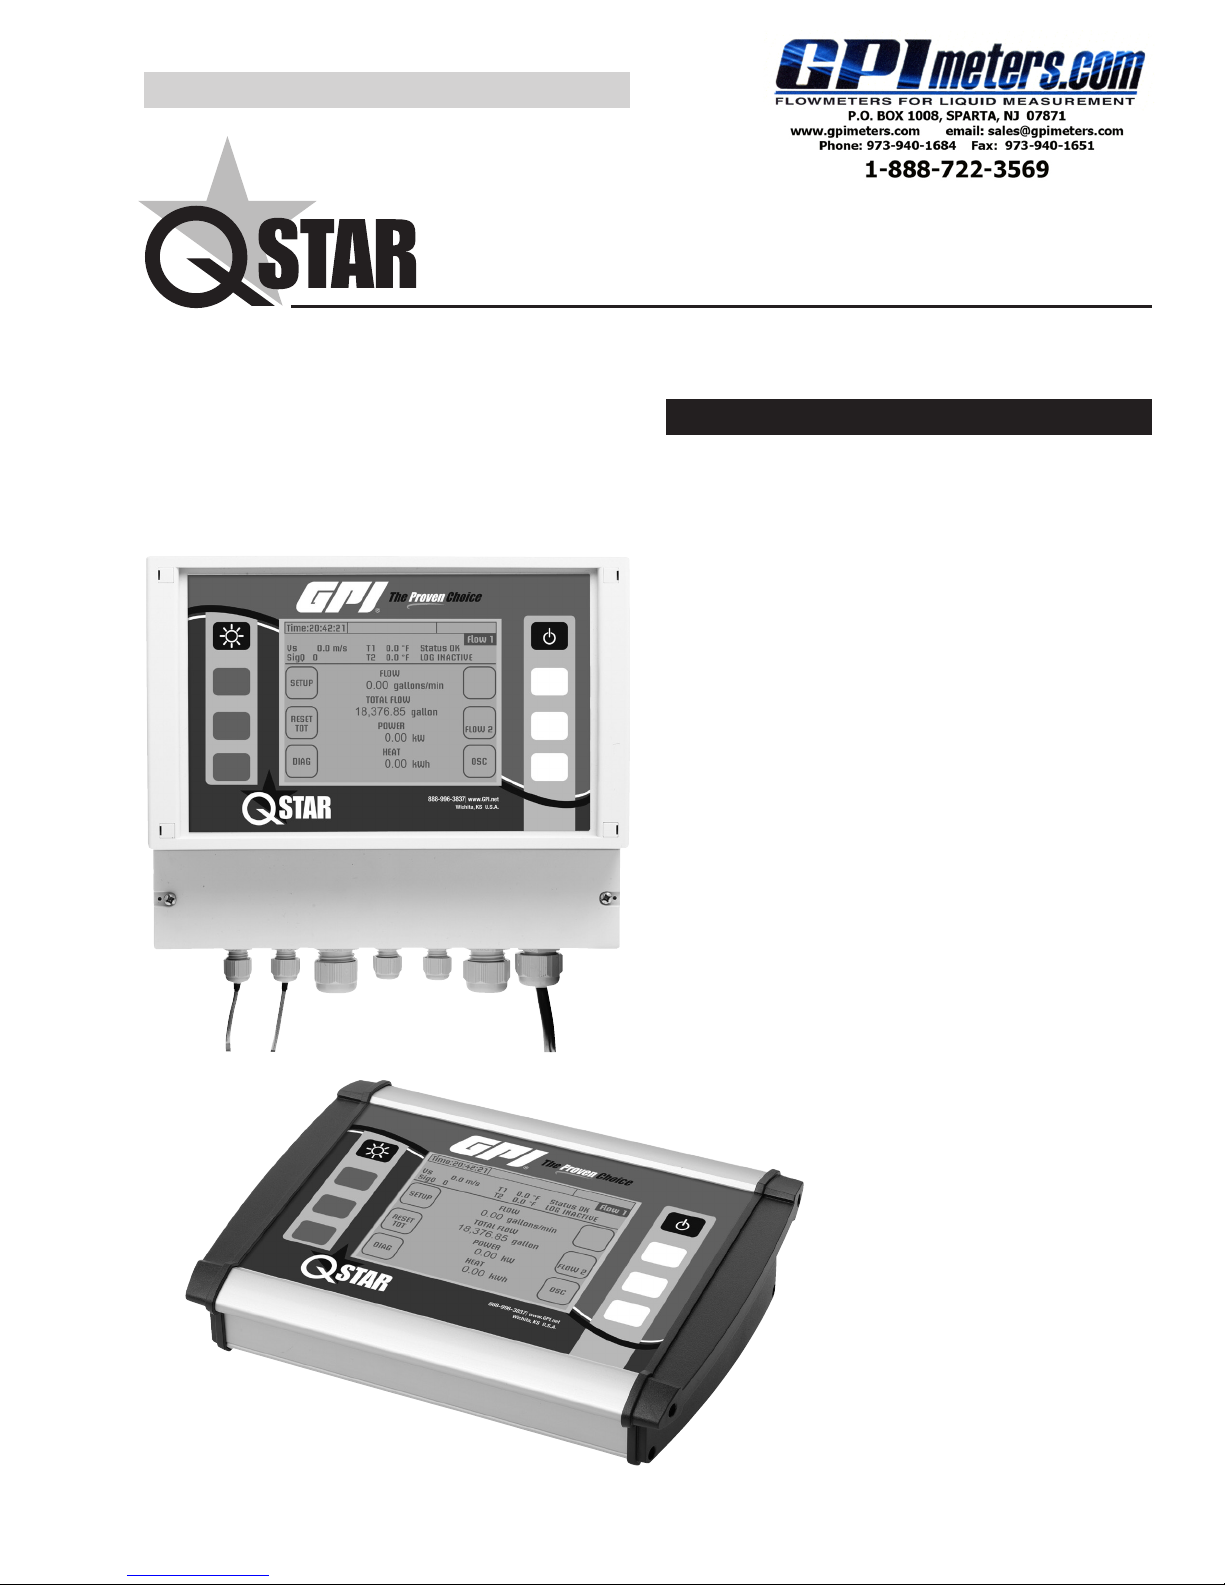
Fixed and Portable
Ultrasonic Flowmeter (UFM)
Owner’s Manual
TABLE OF CONTENTS
Key Aspects of QStar UFM..........................................3
Fixed
Approvals/CE...............................................................3
Measuring Principle ..................................................... 3
QStar Fixed UFM and Components ............................ 4
QStar Portable UFM and Components........................ 8
Operating ................................................................... 10
Getting Started .......................................................... 10
Preparing for Measurement ....................................... 13
Measuring with UFM.................................................. 15
Setup Parameters......................................................15
Measuring Windows .................................................. 31
Calibration ................................................................. 44
System Settings.........................................................44
Troubleshooting ......................................................... 46
Software Update ........................................................ 53
Fluid Properties ......................................................... 54
Specications ............................................................ 56
Portable
920222-0105/13
Page 2
QSTAR FIXED AND PORTABLE UFM OWNER’S MANUAL
Text identied with an exclamation mark contains important information that relates to the basic data
and operation of the device.
Text identied with the letter “i” contain supplementary and helpful information.
i
FIXED UFM
Text contained within this box applies specically
to the QStar FIXED UFM. If you have a PORTABLE
UFM, skip this section and go to the text with no
border, or the text in the PORTABLE UFM box.
FIXED UFM
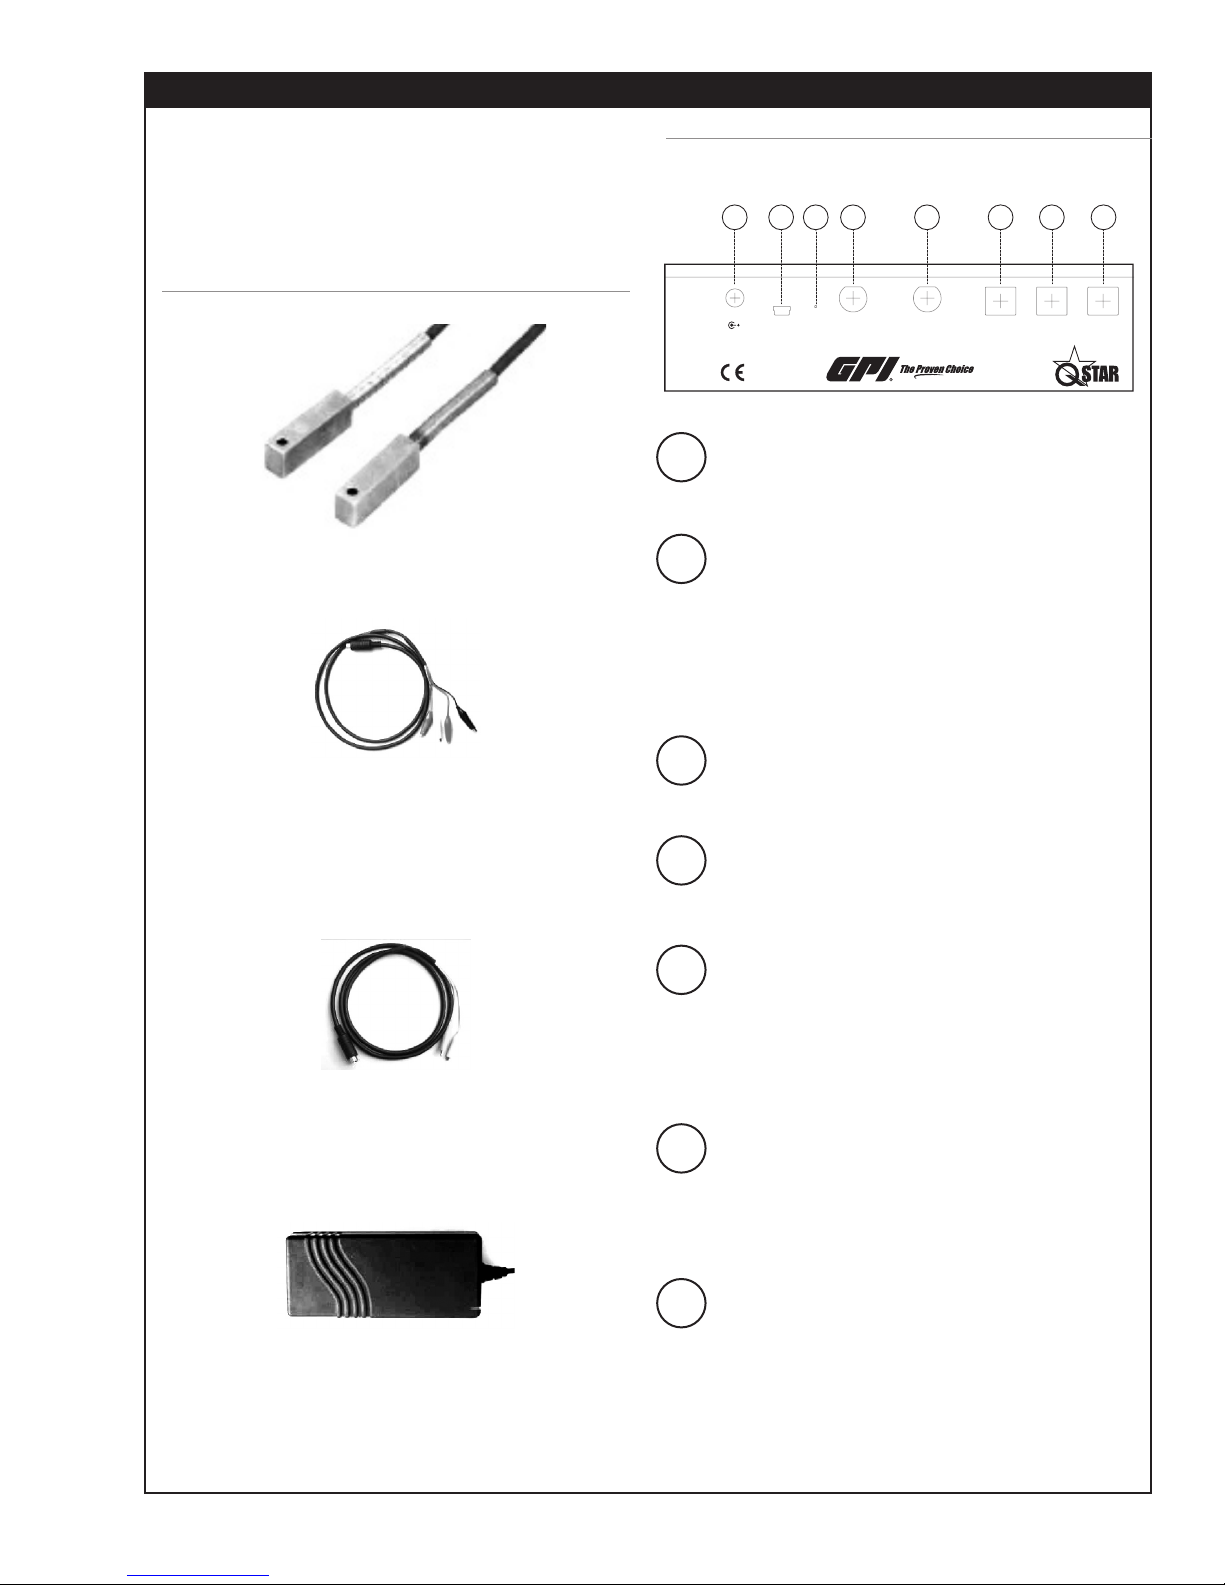
PACKAGE INCLUDES:
• Transmitter
• Ultrasonic transducers
• Spacer bar for the ultrasonic transducers
(for types F10/F21)
• Stainless steel mounting belts
• Getting Started (“Quick-start”) manual
• USB drive with Owner’s Manual
• Ultrasonic coupling grease
Other ultrasonic transducers for smaller or larger pipe
dimensions, as well as clamp-on temperature sensors, are available on separate order. Contact GPI at
www.GPImeters.net or toll-free (888) 996-3837.
PORTABLE UFM
Text contained within this box applies specically
to the QStar PORTABLE UFM. For a FIXED
UFM, skip this section and go to the text with
no border, or the text in the FIXED UFM box.
PORTABLE UFM
PACKAGE INCLUDES:
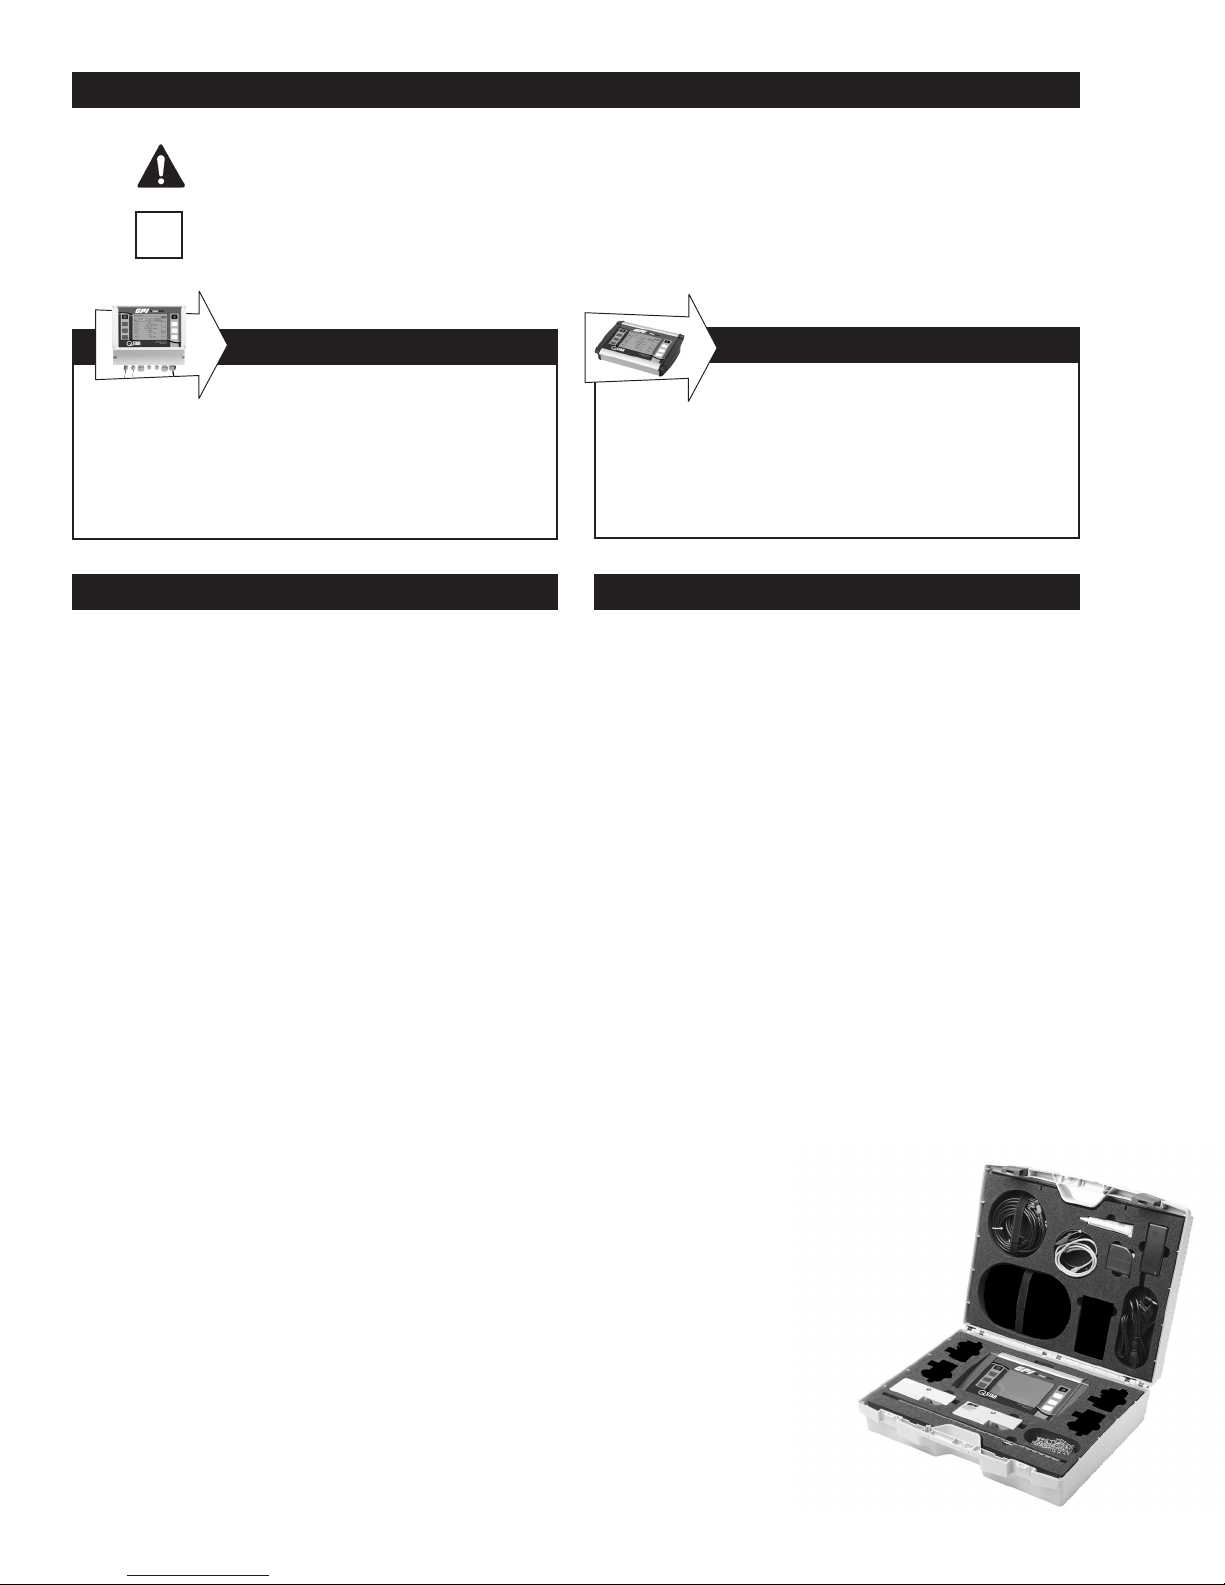
• Hard-shell case
• QStar Portable ow transmitter
• Plug-in power adapter, plus IEC appliance power
cable
• Transducer cables
• Ultrasonic transducers
• Spacer bar for the ultrasonic transducers
• Cable for the 4 mA to 20 mA analog output (Mini
DIN, alligator clips)
• Digital output cable for the relay/pulse output
(Mini DIN, alligator clips)
2
TEL: 888-722-3569 • 973-940-1684 • FAX: 1-973-940-1651 • www.GPImeters.com
• USB cable
• Stainless steel mounting chains (up to 16 in.)
• Getting Started (“Quick-start”) manual
• USB drive with operating instructions
• Ultrasonic coupling grease
• Measuring tape
Other ultrasonic transducers for smaller
or larger pipe dimensions and clamp-on
temperature sensors, are available
on separate order. Contact GPI
at www.GPImeters.net or
toll-free (888) 996-3837.
Page 3
KEY ASPECTS OF QSTAR UFM:
APPROVALS/CE
• Fixed or Portable system for measuring liquids in lled
piping systems.
• Uses the ultrasonic transit-time differential method.
• Heat measurement is included as standard application.
Clamp-on Fixed and Portable temperature sensors
are optional.
• Portable UFM can be operated in battery-powered
mode and on a power adapter for operation with 100%
duty cycle. Fixed UFM can be operated on a power
adapter.
• Supports measurements on piping with diameters
from 1/2" to 240" (depending on the sensor used).
• The uid to measure may have a temperature range
from -40° F to +300° F (depending on the transducer
used).
• You can save the measuring data to the internal
SD card, read the data via USB port and export this
data using Microsoft® ofce software such as Excel
(Portable UFM only).
• The device is equipped with an electrically isolated
relay output and two 4mA to 20mA current outputs
that can be operated in active and passive mode.
QStar UFM is compliant with the following
European Directives and Standards
Test Specications
DIN EN 55011 B (11/2007)
DIN EN 61000-4-2 (09/2008)
DIN EN 61000-4-3 (06/2008)
DIN EN 61000-4-4 (07/2005)
DIN EN 61000-4-5 (06/2007)
DIN EN 61000-4-6 (10/2008)
DIN EN 61000-4-8 (12/2001)
DIN EN 61000-4-11 (02/2005)
Test Requirements
DIN EN 61000-6-1 (10/2007)
DIN EN 61000-6-3 (09/2007)
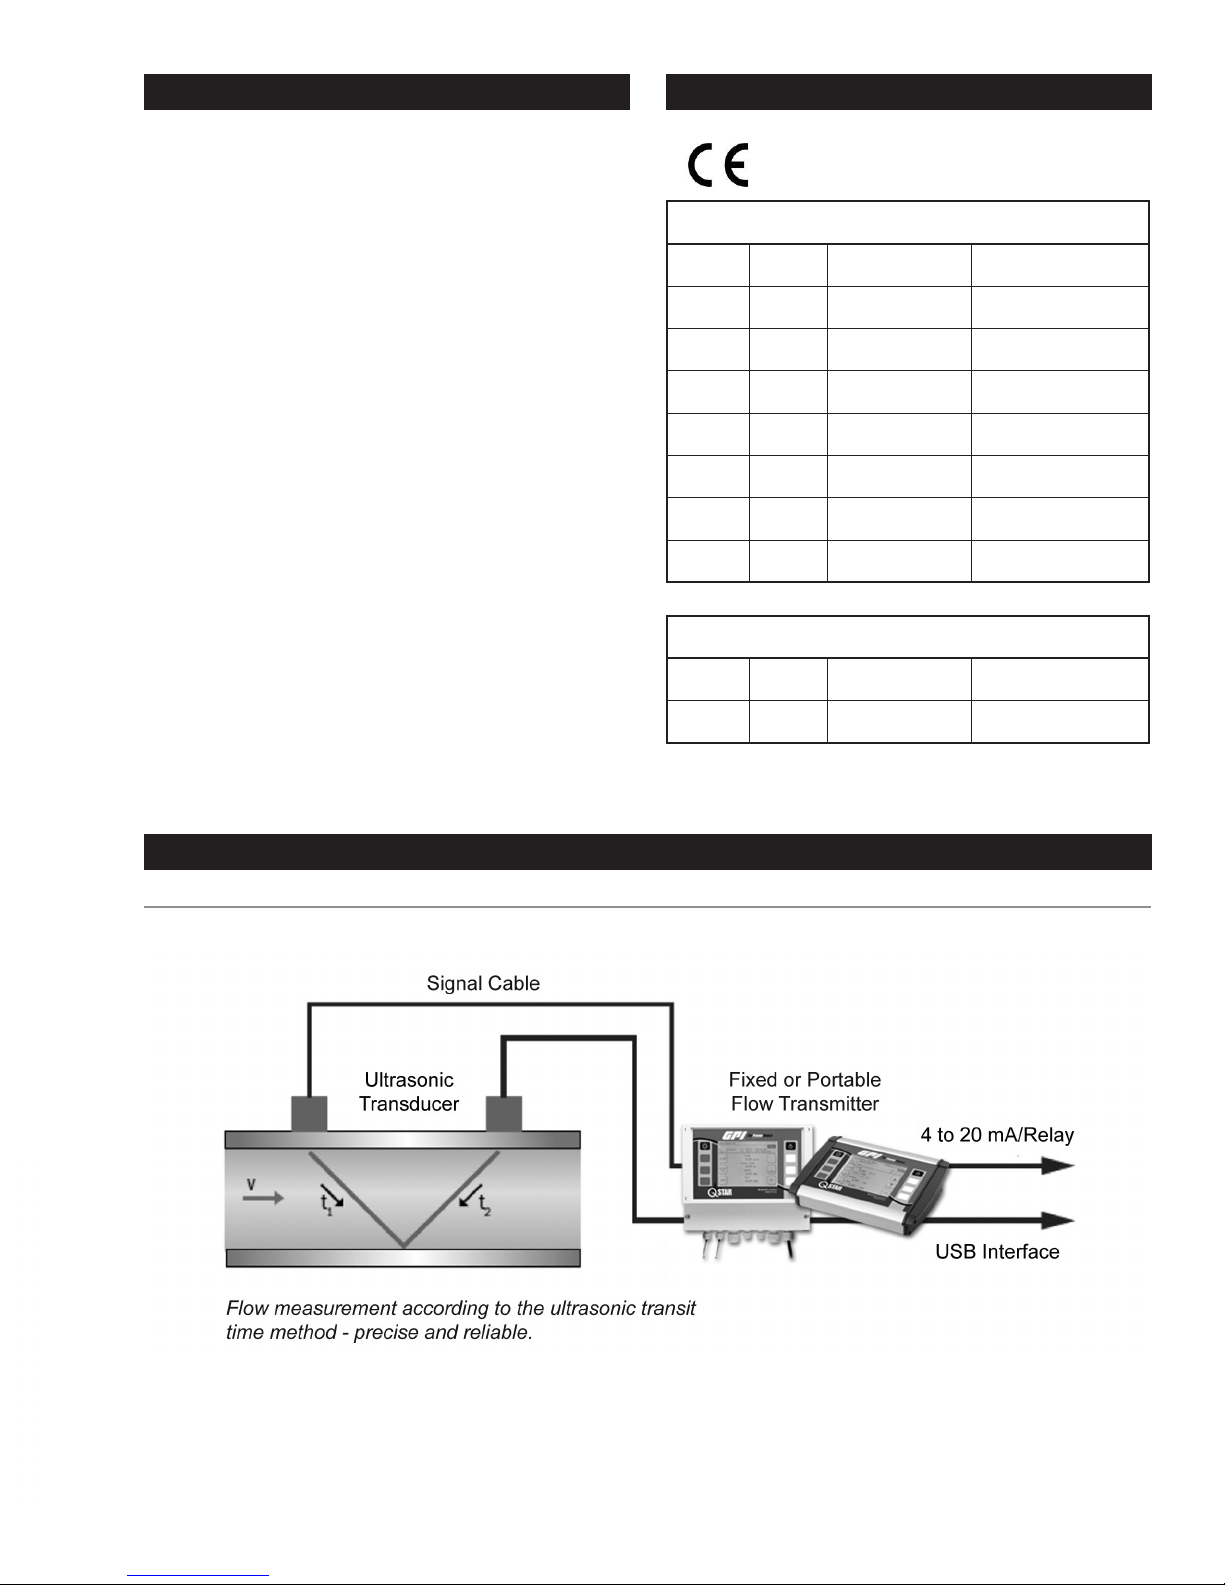
FIGURE 1: Measuring Principle
ULTRASONIC MEASURING PRINCIPAL
TEL: 888-722-3569 • 973-940-1684 • FAX: 1-973-940-1651 • www.GPImeters.com
3
Page 4
The UFM employs precise, ultrasonic transit-time dif-
cos221
)12(
−
TT
TT
π
4cos221
TT
ferential method. This method involves installation of
two ultrasonic transducers on the surface of the piping
and their interconnection with the electronic evaluation
system. The ultrasonic transducers operate in alternating
mode as transmitter and receiver with cyclic exchange of
ultrasonic signals. Measurements cover the transit times
of the upstream and downstream signals (t1, t2). The UFM
measures the transit-time differential of the ultrasonic
signals t1 and t2 that travel upstream and downstream.
These signals are accelerated (t1) or retarded (t2). The
difference that develops between both signal transit times
is proportional to ow velocity and is used in combination
with the piping geometry data for precise calculation of
the volumetric owrate.
FIXED UFM AND COMPONENTS
=
Lv
α
α
D
2
⋅⋅
⋅⋅
Calculation of ow velocity [m/s]
)12(
TT
−
LQ
=
⋅⋅
Calculation of owrate [m3/s]
The ow transmitter uses a sophisticated cross-correlation
to detect signals. This ensures a reliable detection of
signals even in case of harsh circumstances like gas
and/or particle load.
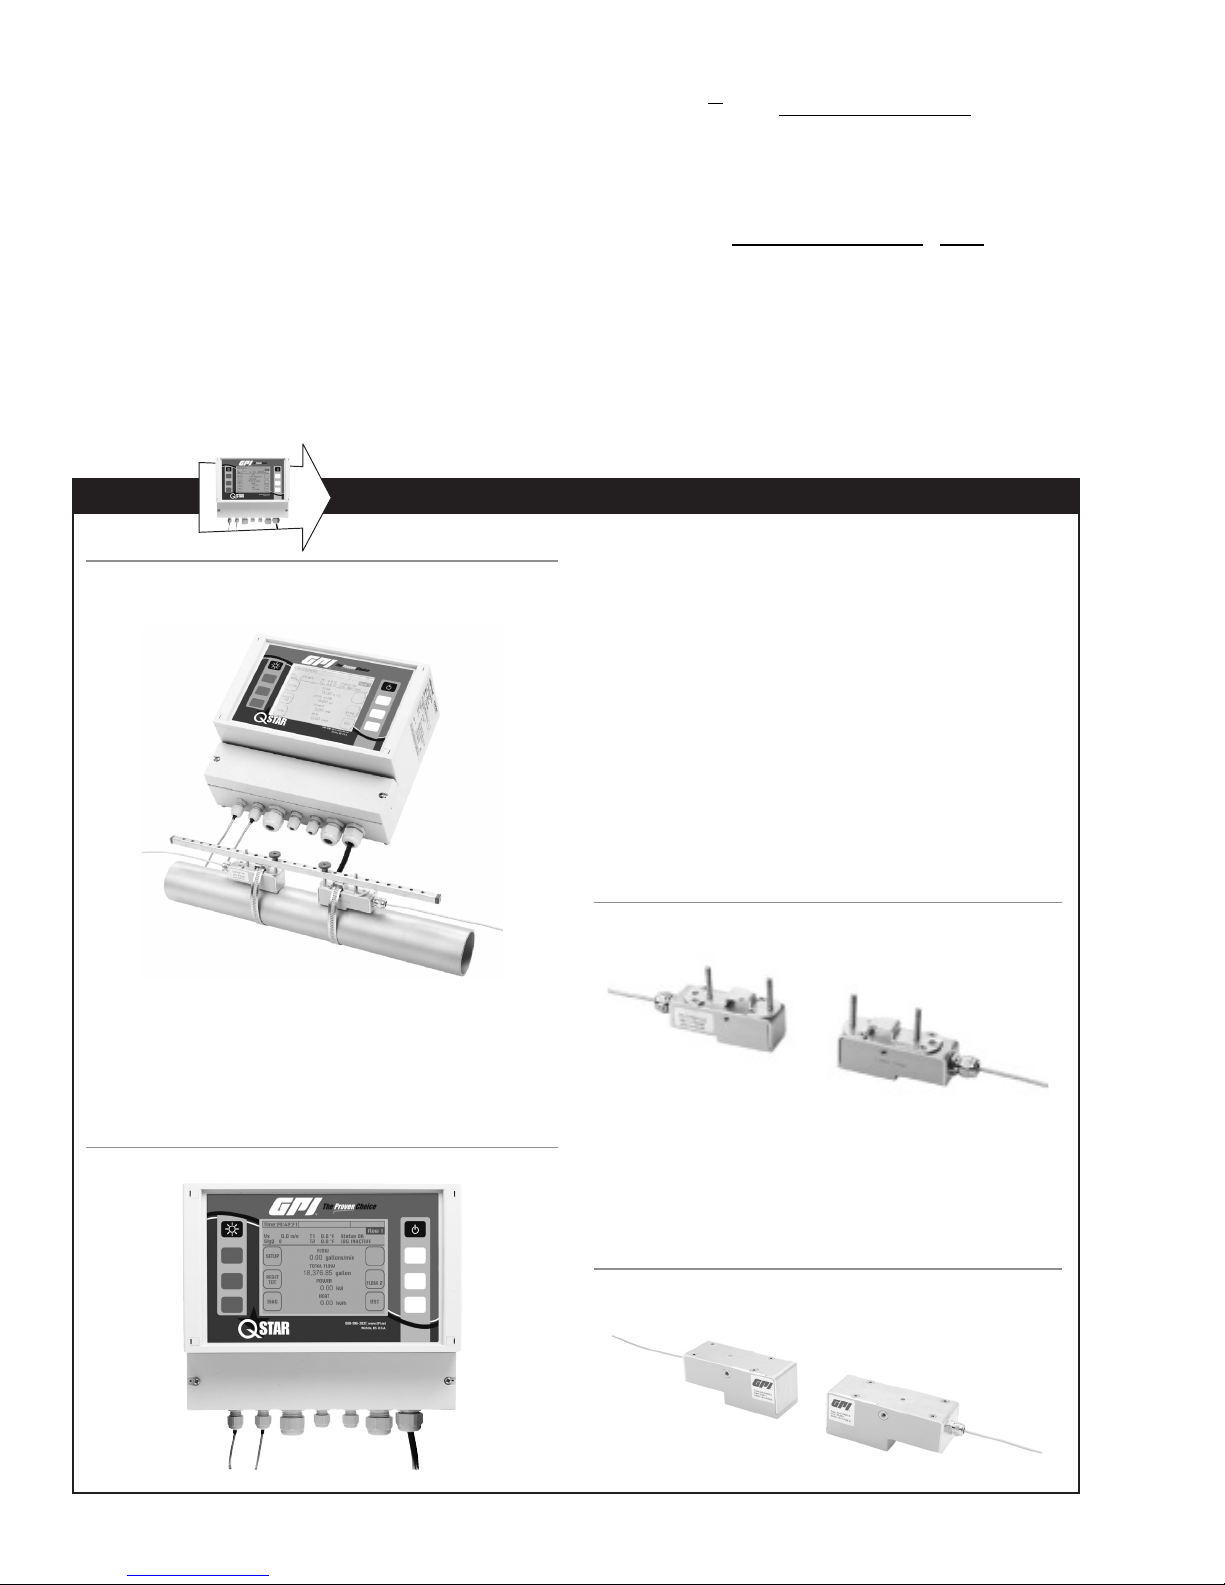
FIGURE 2: UFM – with Mounted Ultrasonic Transducers (Bottom)
and Flow Transmitters
The UFM consists of the ultrasonic transducers and the
ow transmitter that are mounted onto piping.
FLOW TRANSMITTER
The ow transmitter processes the signals and makes
the measurement results available to the user.
ULTRASONIC TRANSDUCERS
The ultrasonic transducers are mounted onto the piping and transmit and receive the ultrasonic signals
that are used in the ow transmitter to calculate the
volumetric owrate.
Ultrasonic transducers:
QMF-F10 (1 MHz) for pipe diameters 1.25" to 16"
QMF-F21 (2 MHz) for pipe diameters 3/8" to 4"
Operating temperatures: -40° F to 300° F
FIGURE 4: Ultrasonic Transducers (F10/F21) typically
used with Spacer Bar (not shown)
FIGURE 3: Flow Transmitter
4
TEL: 888-722-3569 • 973-940-1684 • FAX: 1-973-940-1651 • www.GPImeters.com
Ultrasonic transducer:
QMF-F05 (0.5 MHz) for pipe diameters 8" to 240"
Operating temperatures: -40° F to 180° F
(300° F optional on request)
FIGURE 5: Ultrasonic Transducers (Type F05)
Page 5
FIXED UFM AND COMPONENTS (Continued)
MOUNTING MATERIAL AND
ACCESSORIES
Signal cables
Signal cables are a part of the ultrasonic transducers
and cannot be separated from transducers.
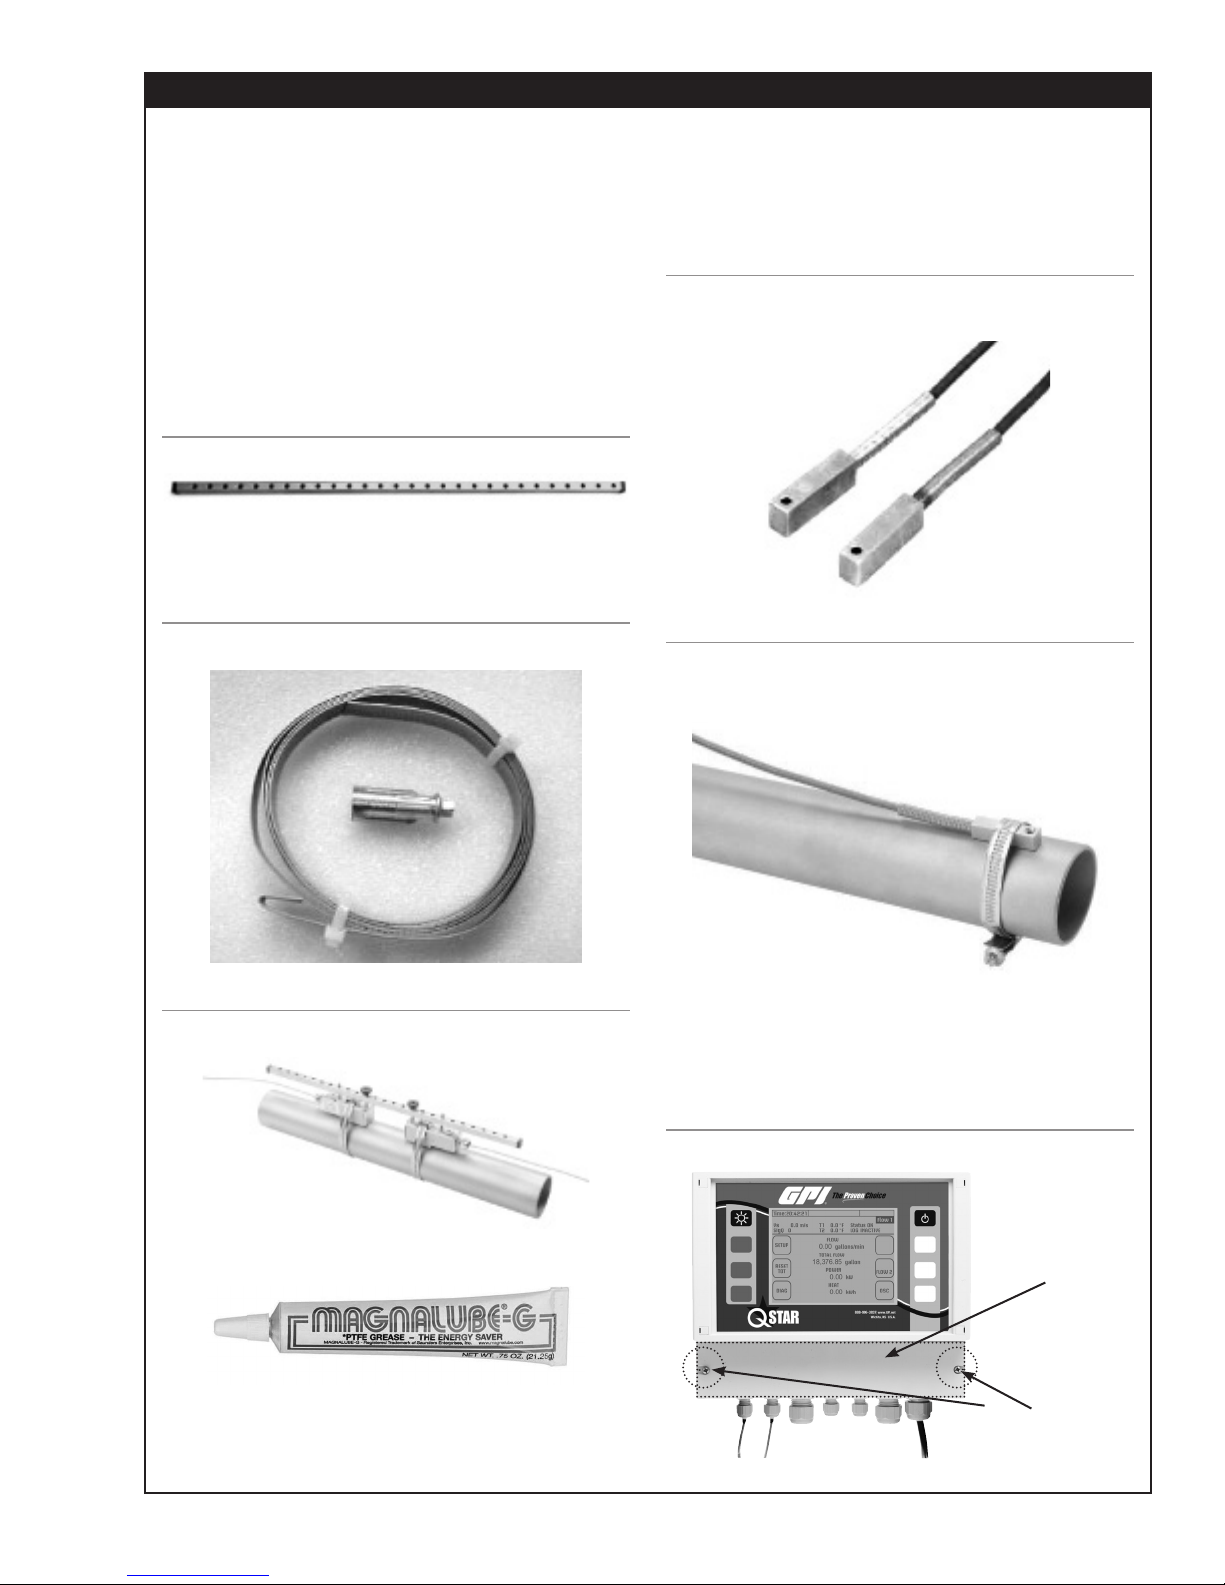
Spacer bar for transducer mounting
For transducers F10 and F21 (Transducer QMF-F05
is mounted on pipes using textile tape rather than
spacer bar).
FIGURE 6: Spacer bar
Metal Mounting Belt for Transducer
Mounting
FIGURE 7: Mounting Belt (Stainless Steel)
QMF-PT100 Temperature sensors
The clamp-on temperature sensors collect temperature data in heating and cooling circuits.
This data is then used to calculate heating and cooling
quantities.
FIGURE 9: Clamp-on temperature sensors, QMF-PT100
(optional)
FIGURE 10: QMF-PT100 (optional) Temperature Sensor
Mounted with Metal Belt
FIGURE 8: Transducers Mounted with Spacer Bar and
Mounting Belts
Coupling grease
Apply the ultrasonic coupling gel between the ultra-
sonic transducer and the piping in order to optimize
signal input.
TEL: 888-722-3569 • 973-940-1684 • FAX: 1-973-940-1651 • www.GPImeters.com
Interfaces of UFM
Open the cover to access the connecting terminals.
FIGURE 11: Front view of transmitter showing cover
Cover
Remove
Screws
5
Page 6
FIXED UFM AND COMPONENTS (Continued)
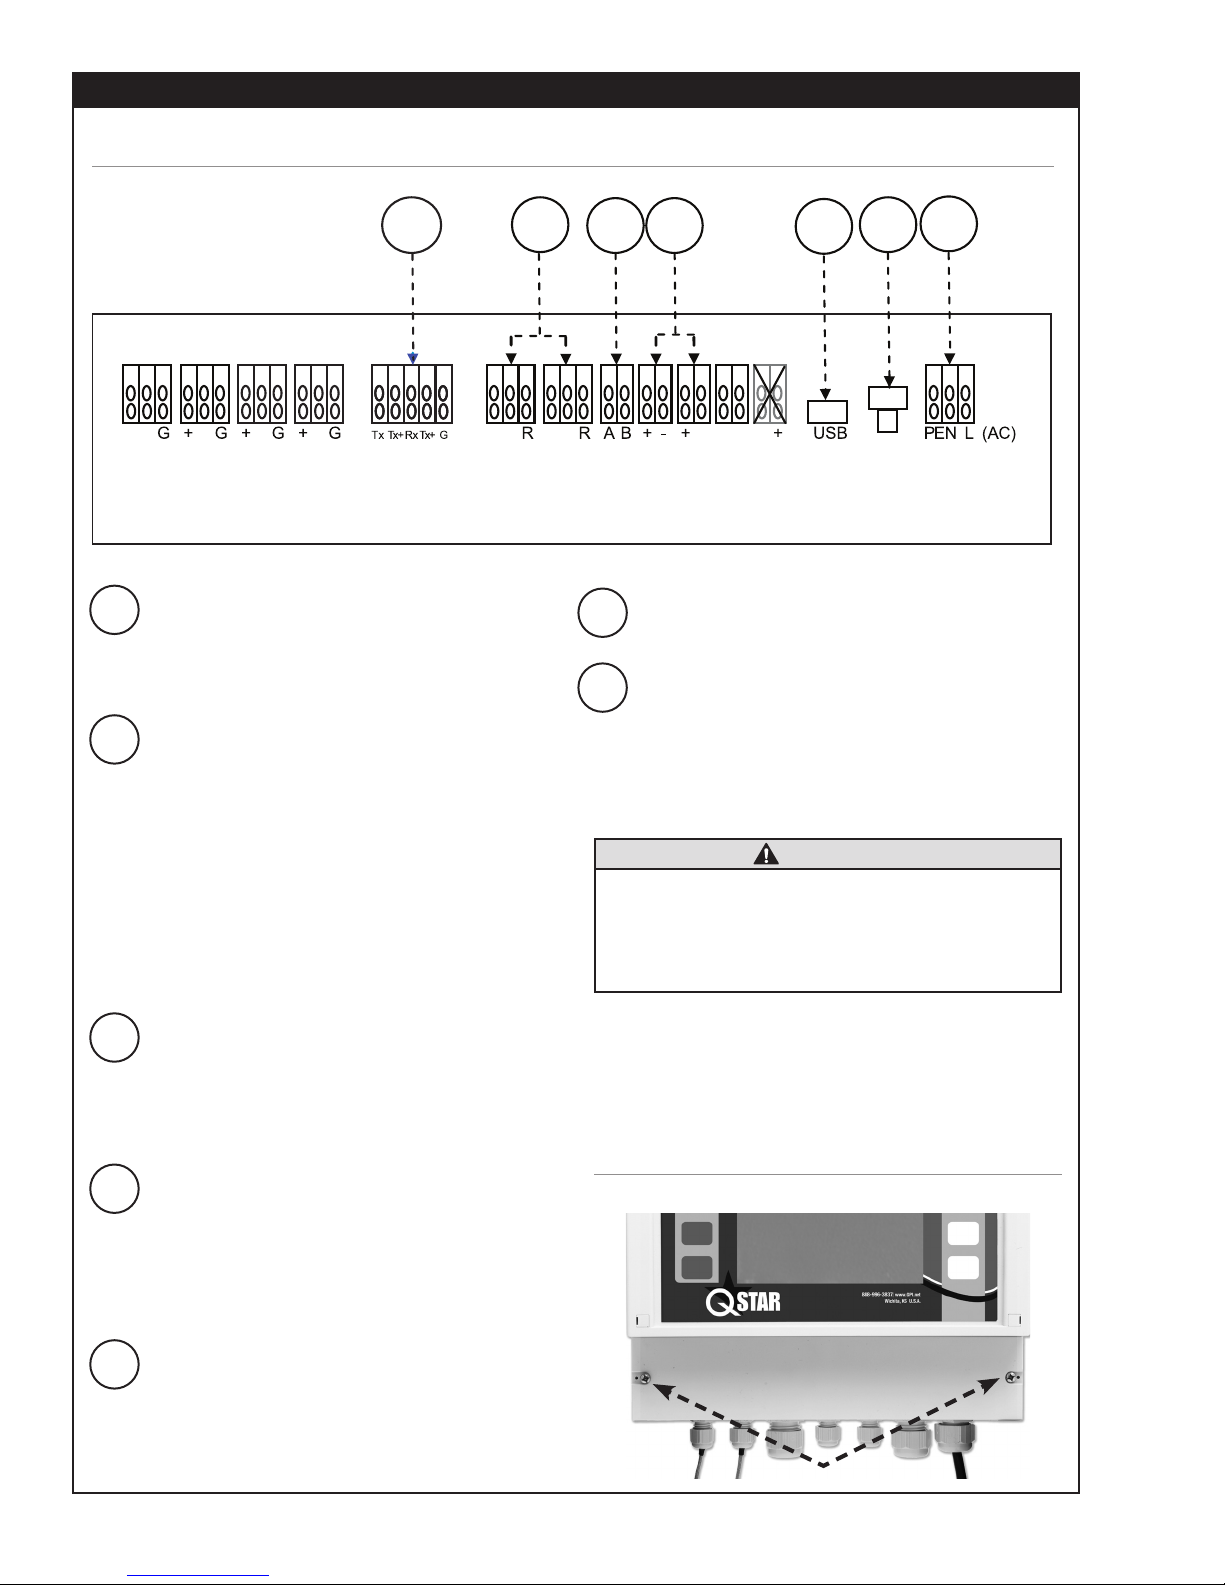
CONNECTOR BOARD
FIGURE 12: Connecting Terminals
1 2 3 4 5 6 7
+ - - - - - + --
UP1 DN1 UP2 DN2 RS232/ 485
1 RS232/RS485 Interface boards
Digital Interface boards RS232 or RS485 are
available as an option to provide digital communication via ASCI strings.
2 Input for temperature sensors
QMF-PT100 (3-wire)
The two temperature sensors (feed and return
pipe) can be connected in order to measure
heat/thermal output. The ow transmitter always
includes the capability for heat/thermal output
measurement. Note that (if required by customer)
the QMF-PT100 inputs can also be used to reset
the counters. If you use this reset function you
cannot measure heat/thermal output at same
time.
WW WW
QMF-
QMF-
PT100
PT100
Relay OUT2 OUT1 DO1 DO2 Reset Power
6 Hardware Reset
Used to reset unit (for hang-ups).
7 Power Supply
Location for connecting the supply voltage. QStar
UFM is available as AC (90-240VAC) and DC
(18-36VDC) version.
Always use the correct voltage for the UFM.
Improper supply voltage might seriously
damage the ow transmitter. Check the type
of power supply on the name plate (printed
on right side of enclosure of ow transmitter.
CAUTION
+ - (DC)
3 Relay output (potential-free)
This output is potential-free NO (normally open)
relay output. Use this output to establish an
alarm (for example, when exceeding a certain
ow speed).
4 Analog output 4-20mA (active)
The 4-20mA outputs can be used to submit
measurement data like ow, thermal output and
velocity to the Programmable Logic Controller
(PLC). These outputs are in active mode (supply
voltage provided internally by ow transmitter).
5 USB- Interface
Used for rmware updates. Standard USB (micro
USB)- cable required to connect to a PC.
6
Wiring
The connection terminals are located under the lower
cover. Remove the two screws and plastic cover to
gain access to the connection terminals.
FIGURE 13: Accessing the Connection Terminals
Page 7
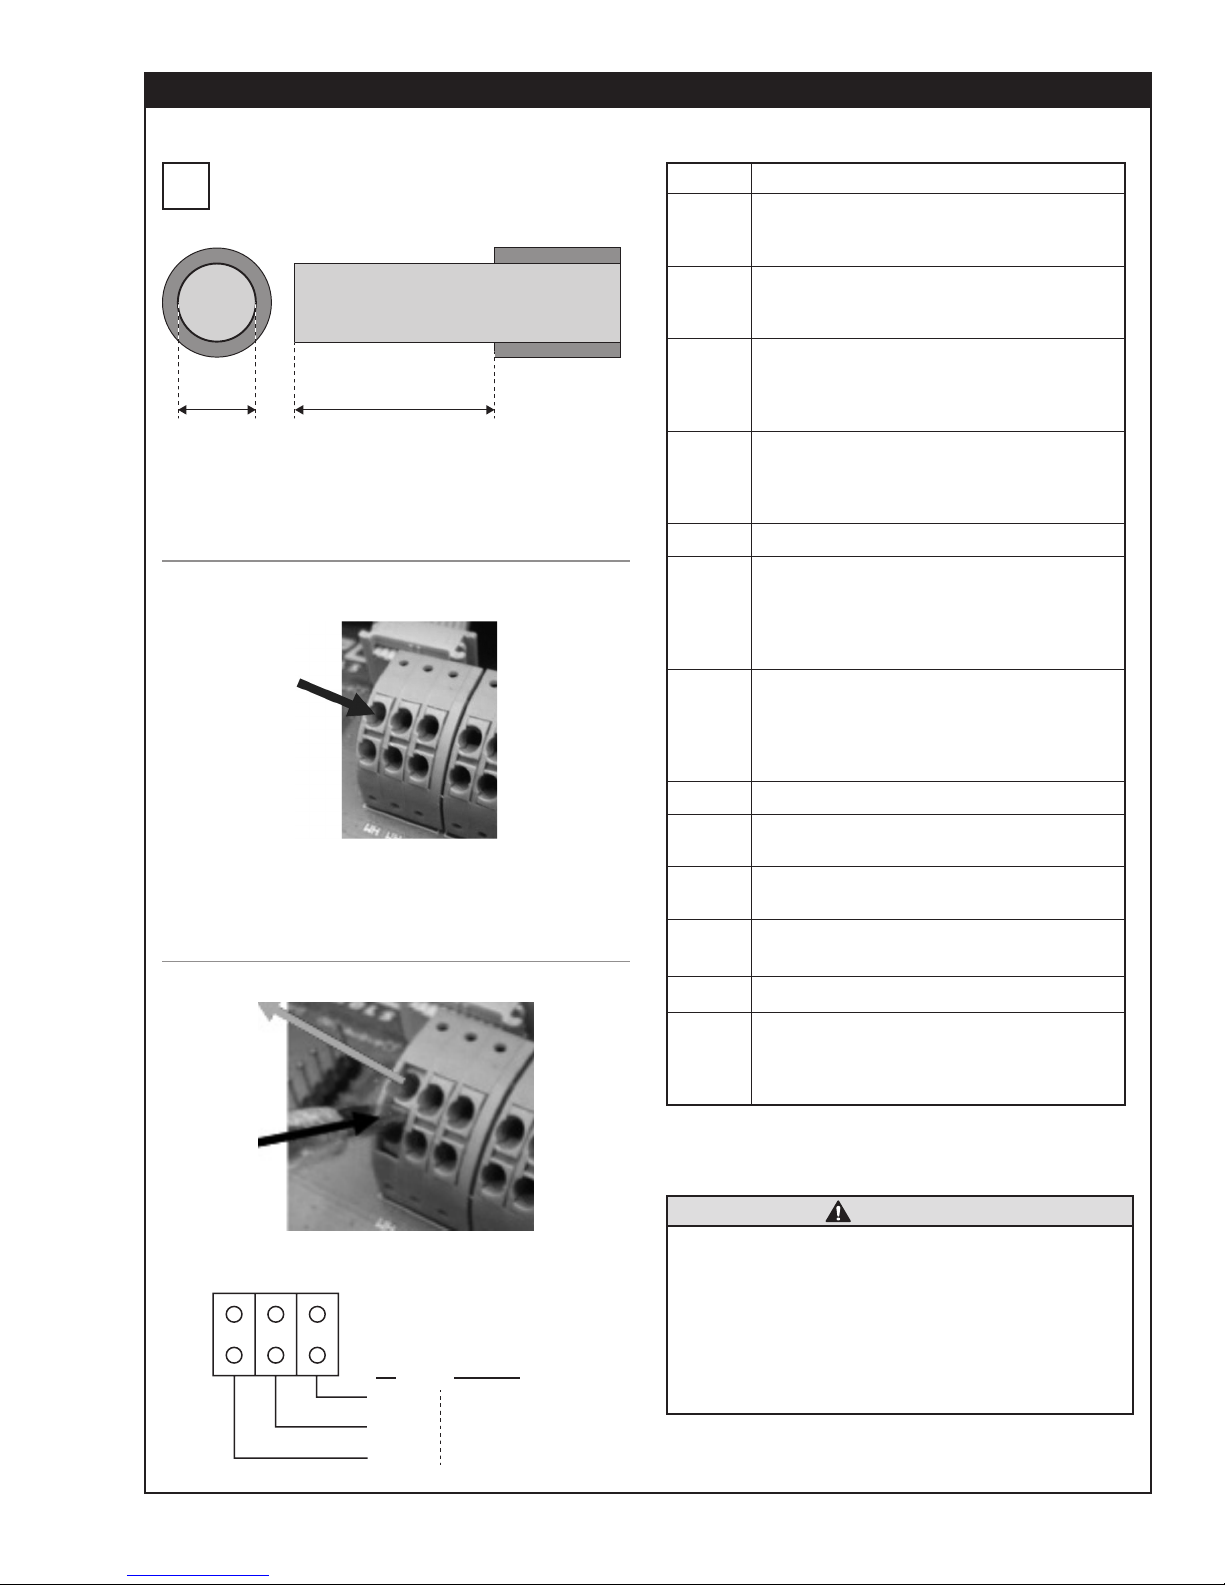
FIXED UFM AND COMPONENTS (Continued)
.5".015" - .030"
AC TERMINAL BLOCK WIRING
Use cables with 16-26 AWG wires. Wires should
be stripped about .5 in. to allow proper contact
i
to terminals.
Put the stripped end of the related wire into the
related hole. Wires will be held by spring. It might
be helpful to use end sleeves or tin the wire ends.
FIGURE 14: Connection Terminals – Fasten Cables
Use a slotted screwdriver to unfasten wires, then press
middle part between the two holes as shown to loosen
the spring and remove the wires.
FIGURE 15: Connection Terminals - Unfasten Wires
Terminal Diagram
Terminals
UP1
DN1
UP2
DN2
RS485 Optional Interface board
QMF-
PT100
QMF-
PT100
Relay Relay output, external voltage required
OUT1
OUT2
DO1
DO2 Optional, Digital output 2
Designation
Connection of upstream transducer
Red wire to be connected to +
Black wire to be connected to -
Connection of downstream transducer
Red wire to be connected to +
Black wire to be connected to -
Connection of upstream transducer
(path2)
Red wire to be connected to +
Black wire to be connected to -
Connection of downstream transducer
(path2)
Red wire to be connected to +
Black wire to be connected to -
Connect temperature sensors
(measuring colder temperature) to left
QMF-PT100 terminal
WH = White wire from QMF-PT100
RD = Red wire from QMF-PT100
Connect temperature sensors
(measuring warmer temperature) to
right QMF-PT100 terminal
WH = White wire from QMF-PT100
RD = Red wire from QMF-PT100
Analog output1, 4…20mA, active, voltage provided internally
Analog output2, 4…20mA, active, voltage provided internally
Digital output (Transistor), passive
mode, external voltage required.
PE NL1
US EUROPE
BLACK
WHITE
GREEN
BROWN
BLUE
GREEN/YELLOW
Power
Supply
Either DC (18-36VDC) or AC (90-
240VAC). Check order conrmation
or name plate on ow transmitter for
operating voltage.
CAUTION
• The 4-20mA outputs are set in active mode.
That means the required voltage is provided
by ow transmitter internally. DO NOT USE
additional external voltage.
• The digital output is set in passive mode and
requires external voltage to be operated.
• Relay is rated to max. 45V, 0.25mA. These
values must not be exceeded.
7
Page 8
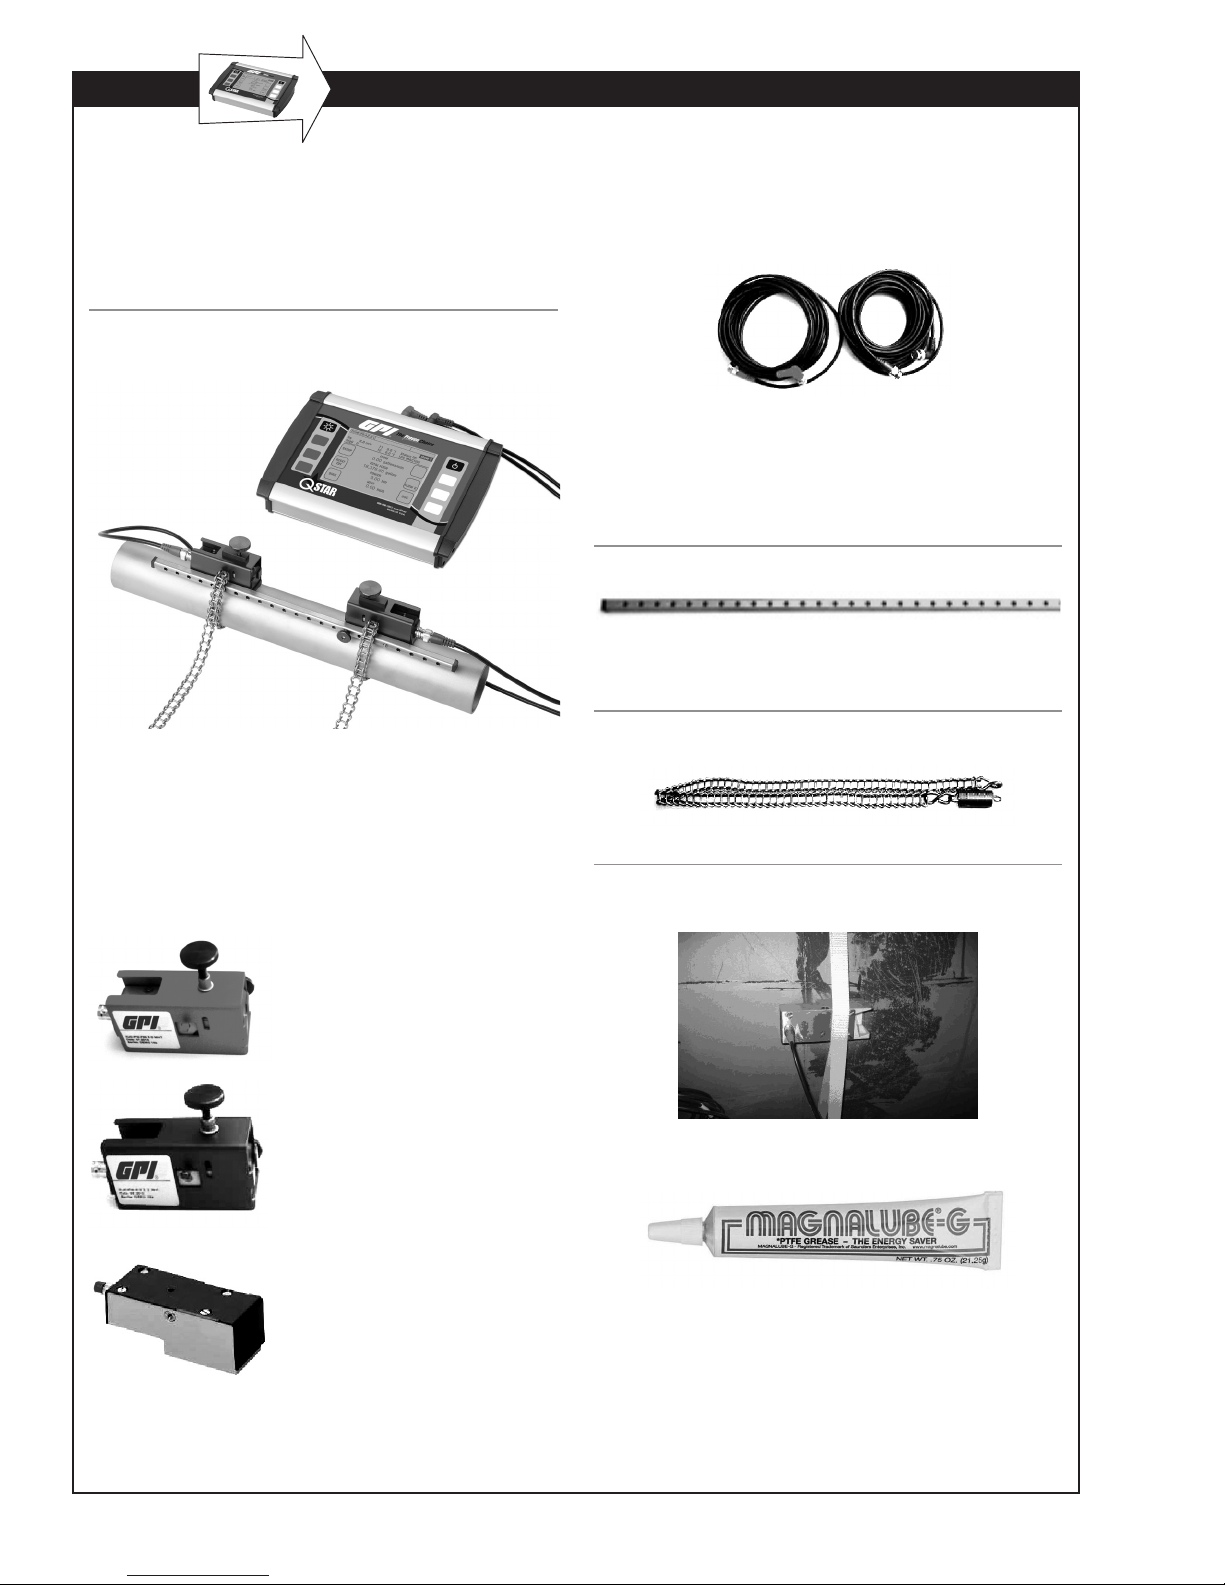
PORTABLE UFM AND COMPONENTS
PORTABLE FLOW TRANSMITTER
Your UFM consists of the ultrasonic transducers and
the ow transmitter that are mounted onto your piping.
The ow transmitter processes the signals and provides
the measurement results.
FIGURE 16: PORTABLE Flow Transmitter (Top) and
Mounted Ultrasonic Transducers (Bottom)
MOUNTING MATERIAL AND
ACCESSORIES
Signal cables
Spacer bar for transducer mounting
For QMP-F10 and QMP-F21 (QMP-F05 is mounted
on pipes using textile tape rather than spacer bar).
FIGURE 17: Spacer bar
Chains for Transducer Mounting
FIGURE 18: Mounting Chain (Stainless Steel)
ULTRASONIC TRANSDUCERS
The ultrasonic transducers mount onto the piping to
transmit and receive the ultrasonic signals used in the
ow transmitter to calculate the volumetric owrate.
Ultrasonic transducer QMP-F21
(2 MHz), RED housing, for pipe
diameters from 0.5 to 4.0 inches.
Operating temperatures: -40° F to
300° F
Ultrasonic transducer QMP-F10
(1 MHz), BLUE housing. Pipe diameters: 1.5 to 16 inches. Operating
temperatures: -40° F to 300° F
Ultrasonic transducer QMP-F05
(0.5 MHz), GREEN housing. For
pipe diameters from 8 to 240
inches. Operating temperatures:
-40° F to 176° F (300° F optional
on request)
FIGURE 19: Transducer QMP-F05 (500 kHZ) for large
pipes – Mounting with textile tape.
Coupling grease
Apply the ultrasonic coupling gel between the ultrasonic
transducer and the piping to optimize signal input.
8
Page 9
PORTABLE UFM AND COMPONENTS (Continued)
78
QMP-PT100 Temperature sensors
(Optional)
The clamp-on temperature sensors collect temperature data in heating and cooling circuits.
Use this data to calculate heating and cooling quantities.
FIGURE 20: QMP-PT100 clamp-on temperature sensors
4-20mA analog output cable
FIGURE 21: Back view of Portable UFM connections
1234 56
Reset Down Up Relays/ T1/T2Analog OutUSBPower
Impulse OUT
1 Power Input
This jack is used to connect the plug-in power
adapter that is included with the UFM package.
2 USB Interface (Mini.USB Type B)
Enables access to the integrated SD memory
card from a PC. This card is used to store data
logging information and measurement data (LOG
les). Windows XP or later versions detect the
internal SD Card as mass storage medium. No
need to install additional drivers.
QMP-001
The analog output cables can be used to connect an
external data logger or recorder to the ow transmitter for the transmission of measured values such as
owrates, or thermal output.
Cable for Relay/Pulse
The relay connecting cable can be used to trigger
alerts. For example, when exceeding a certain owrate.
Power adapter 100-240V, 47-63Hz, 1A
The power adapter is normally used to charge the
battery. Your UFM supports permanent operation by
using the power adapter.
3 Hardware Reset
Use a small screwdriver (or paper clip) to
press the reset button.
4/5 BNC Inputs for Ultrasonic
Transducers
Jacks for the ultrasonic transducers.
6 Relay/Pulse Output (4-Pol Mini DIN)
Electrically isolated output with NO (normally
open) contact. This internal NO contact is open
unless an actuating signal is generated. Allows
user to assign alarm or threshold limit functions
to this output.
7 Input for Temperature Sensors
QMP-PT100 (6-Pole Mini DIN)
Receptacle for the optional temperature sen-
sors that enable the use of the internal heat
measurement function of the UFM.
8 4-20mA Analog Output
(5-Pol Mini DIN)
These outputs can be assigned variables such
as the owrate and return a current that is
proportional to the value of the variables. The
outputs operate in active (power provided by
ow transmitter) 2-wire mode.
9
Page 10
SAFETY INSTRUCTIONS
HOW TO NAVIGATE
• The ow transmitter cannot be operated outside the
temperature range from -4° F to 140° F.
• The ultrasonic transducers are sensitive to mechanical
stress such as impact and vibration. Always safeguard
the transducers against strong vibration or impact to
avoid damage or destruction.
• The plug-in power supply is suitable for in-door use
only.
• The plug-in power adapter or the power cable must
be replaced completely in the case of mechanical or
electrical damage.
• The ow transmitter is not approved for operation in
hazardous locations. The standard ultrasonic transducers are not approved for operation in hazardous
locations.
• The ultrasonic transducers may not be operated
outside their specied uid temperatures.
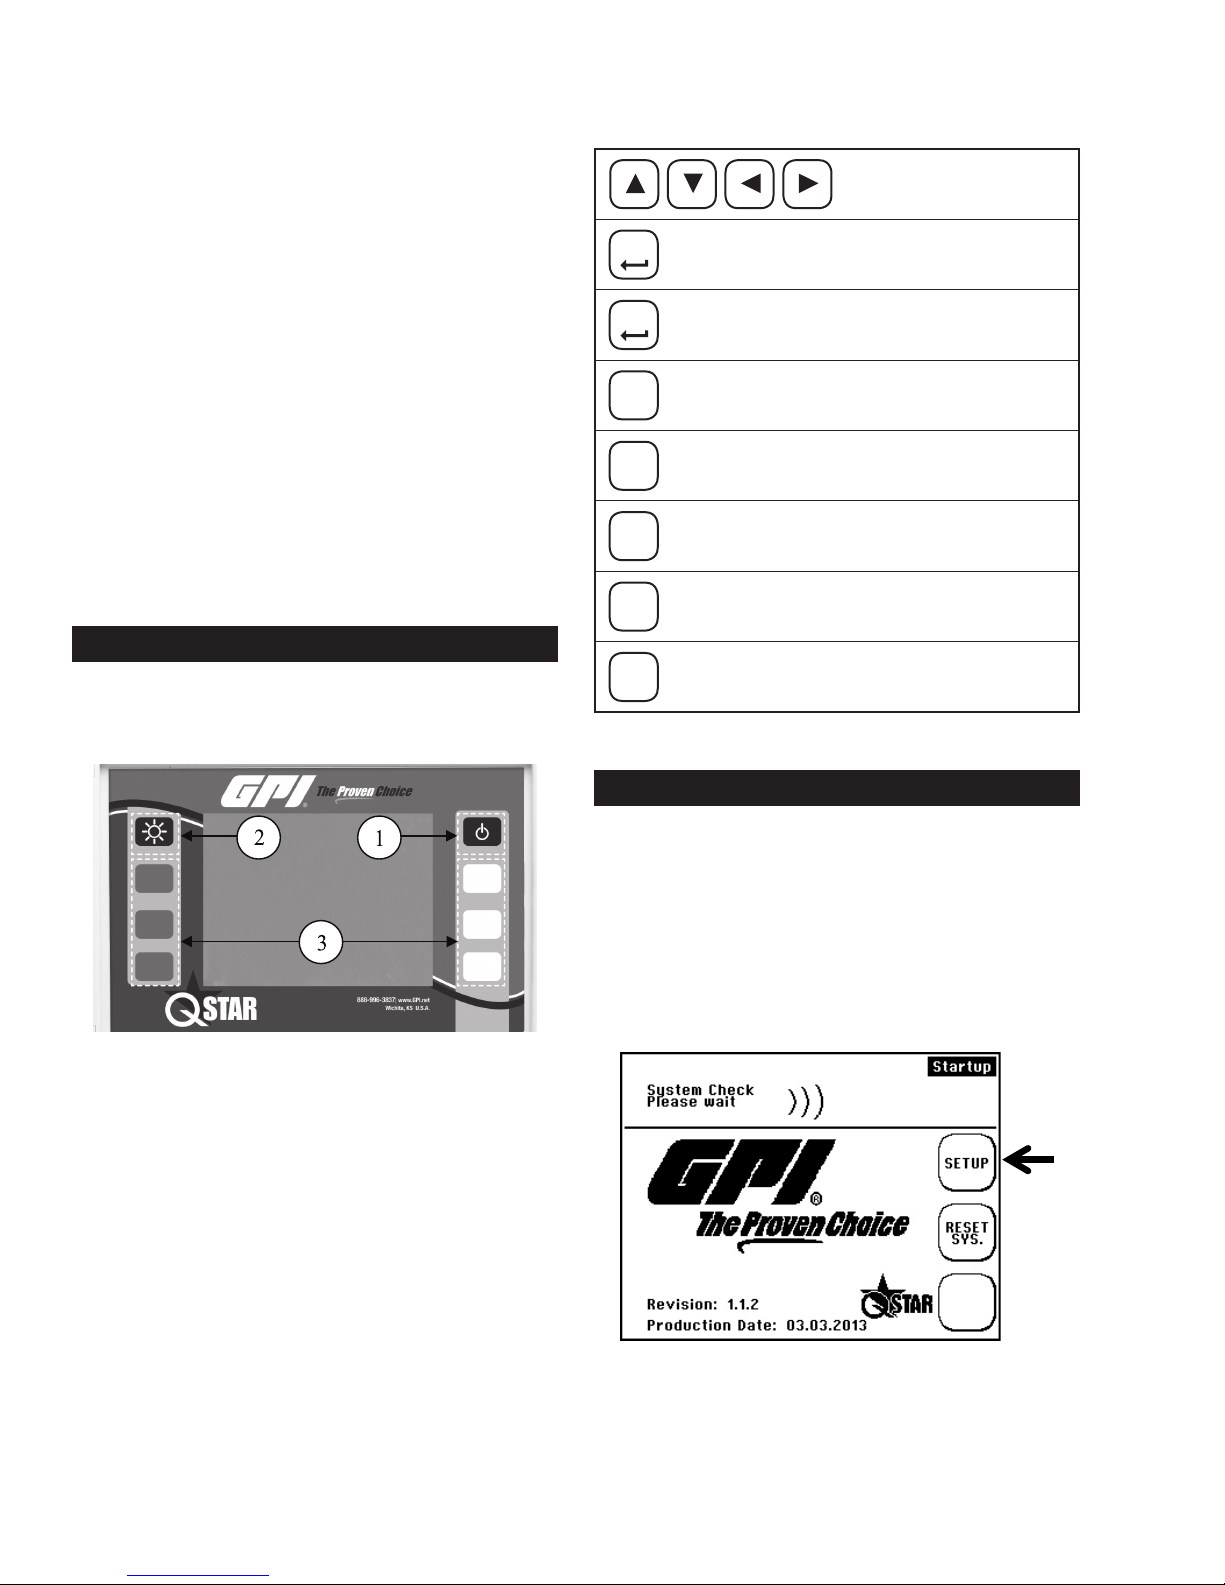
OPERATING
Use the corresponding multifunctional buttons:
Arrow buttons for
navigation
ENTER
NEXT
BACK
XYZ
Conrms entry
Conrms entries and opens the next window
Returns to the previous window
Increases the value
+
–
Reduces the value
Activates a certain function (depending on
chosen menu)
No function
CONTROL BUTTONS
1. Turns on Portable transmitter. Fixed transmitter will
automatically start when connected to voltage supply.
2. Switches the backlight On and Off.
3. Multifunctional buttons: Use this button to select the
function that is displayed next to it on the screen.
GETTING STARTED
BASIC SETTINGS, MAIN MENU,
NAVIGATION
Setting Language
1. Switch on the device. During the start sequence, press
the multifunctional button that is located next to the
“SETUP” eld.
10
Page 11

2. Conrm the “SETUP LANG.” button
2. Select “COMPL Setup” when window appears.
3. Use the arrows in the next window to select the dialog
language. Conrm entry with “Enter”. Exit the menu
with “SETUP.”
CAUTION
The language setting selects the language used
in the menus. The language in the elds next to
the multifunctional button remains unchanged.
Navigation in Main Menu “Flow 1”
The “Flow 1” measuring window is automatically opened
with a delay of a few seconds after turning on the power.
The “Flow 1” measuring window provides an overview
of all data that is necessary for ow and optional heat
measurements.
You are now in the main menu. Select all necessary
functions of the device in this menu.
To return to the measuring window, proceed as follows:
Select “ESC” -> “MEAS” in the next window.
To accelerate access to the main menu after
power on, select the start sequence “SETUP.”
i
Select “COMPL SETUP” in the next window.
Setting the Time and Date
After selecting the dialog language, the setup menu opens.
1. Scroll the “System Setup” menu command using the
arrow keys.
1. Select “Setup”
11
Page 12
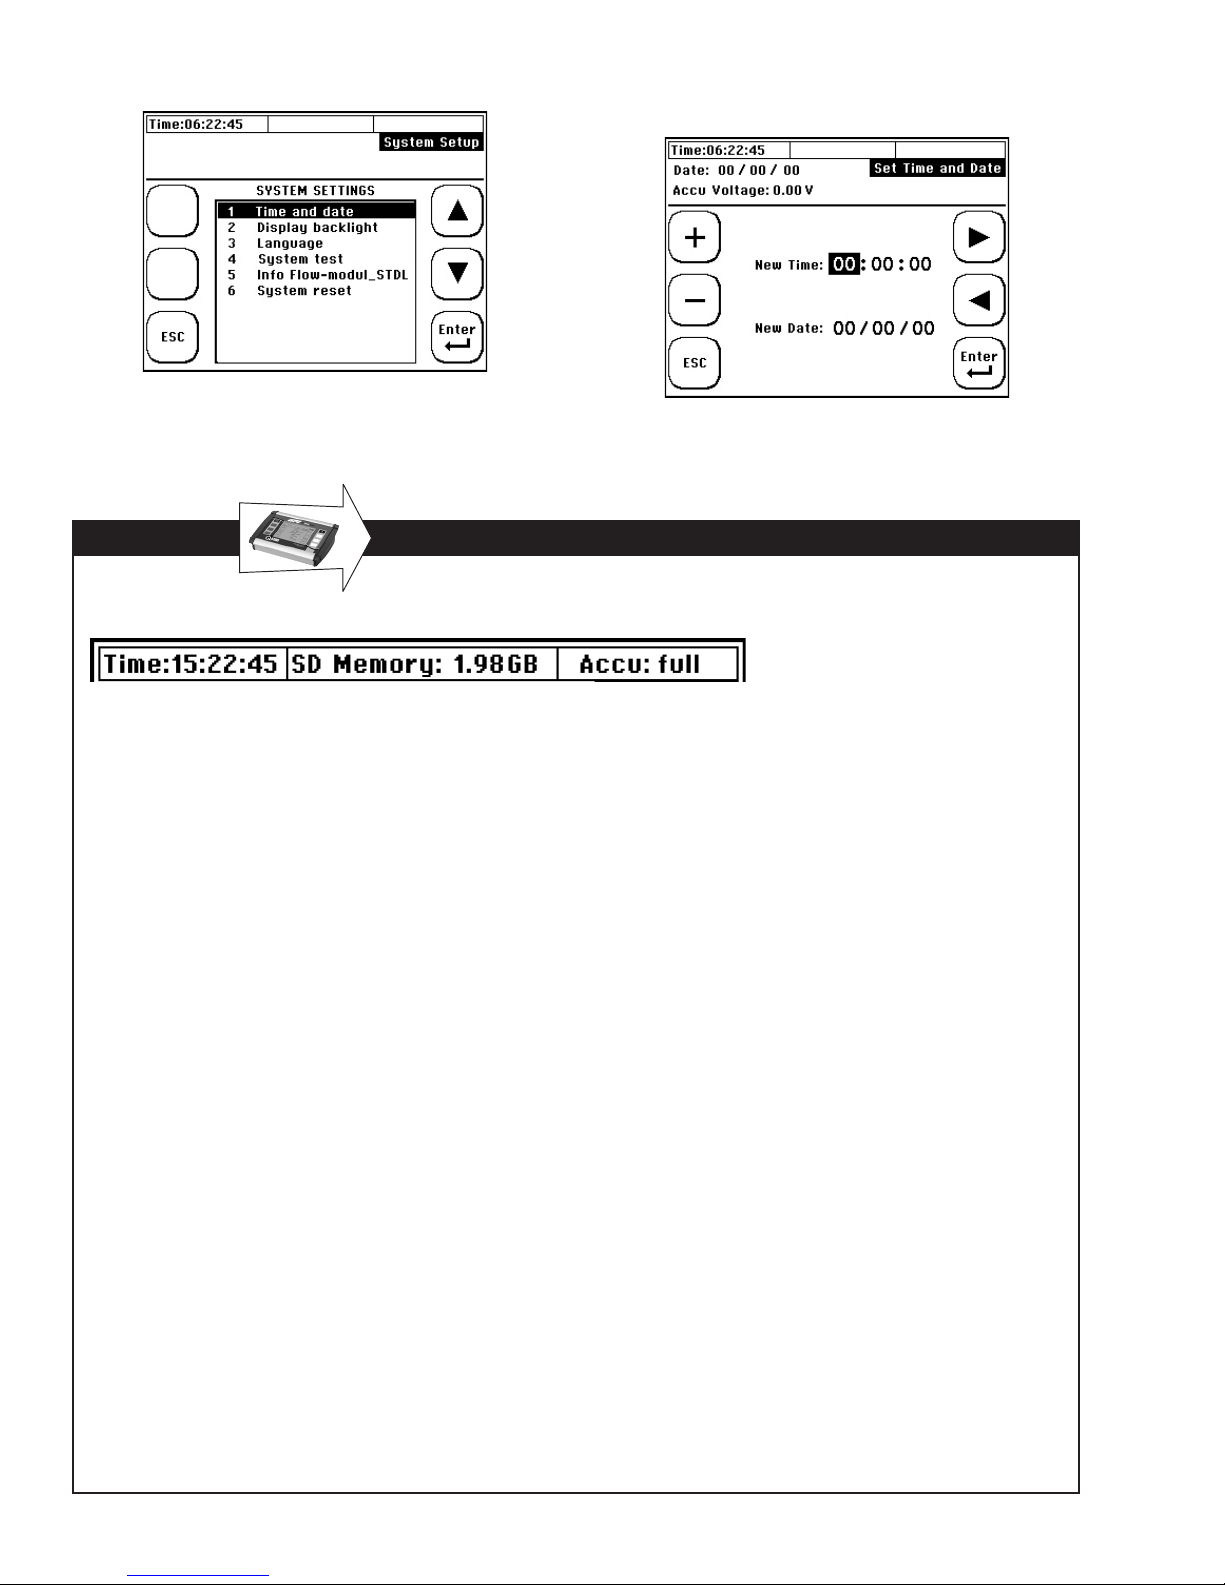
2. Select the “Time and Date” menu command
APPLIES TO PORTABLE QSTAR
The status bar is located in the uppermost row of the display.
3. Enter the time as: Hour (hh): Minute (mm): Second (ss).
Enter the date as: Month (mm): Day (dd): Year (yy).
Time
Displays the current time (system time). The time stamp
that is derived from the system time will be applied to
the measurement data.
SD memory
Displays the free space on the internal SD memory
card of the device (standard is 2 GB).
Backup battery
Provides information about the status of the rechargeable battery.
• Load: The device is powered using the power
adapter while the battery is charged. The empty
battery needs a charging time of approximately ve
hours.
• Full: The battery is in a charged state. The device
may be operated for approximately ve hours when
the display backlight is switched off or for approxi-
mately three hours when it is switched on.
Percentage display
Displays the charging state of the battery.
The times specied applies to a new battery. The factual
operating/load cycles may deviate from the specied
time values.
12
Page 13
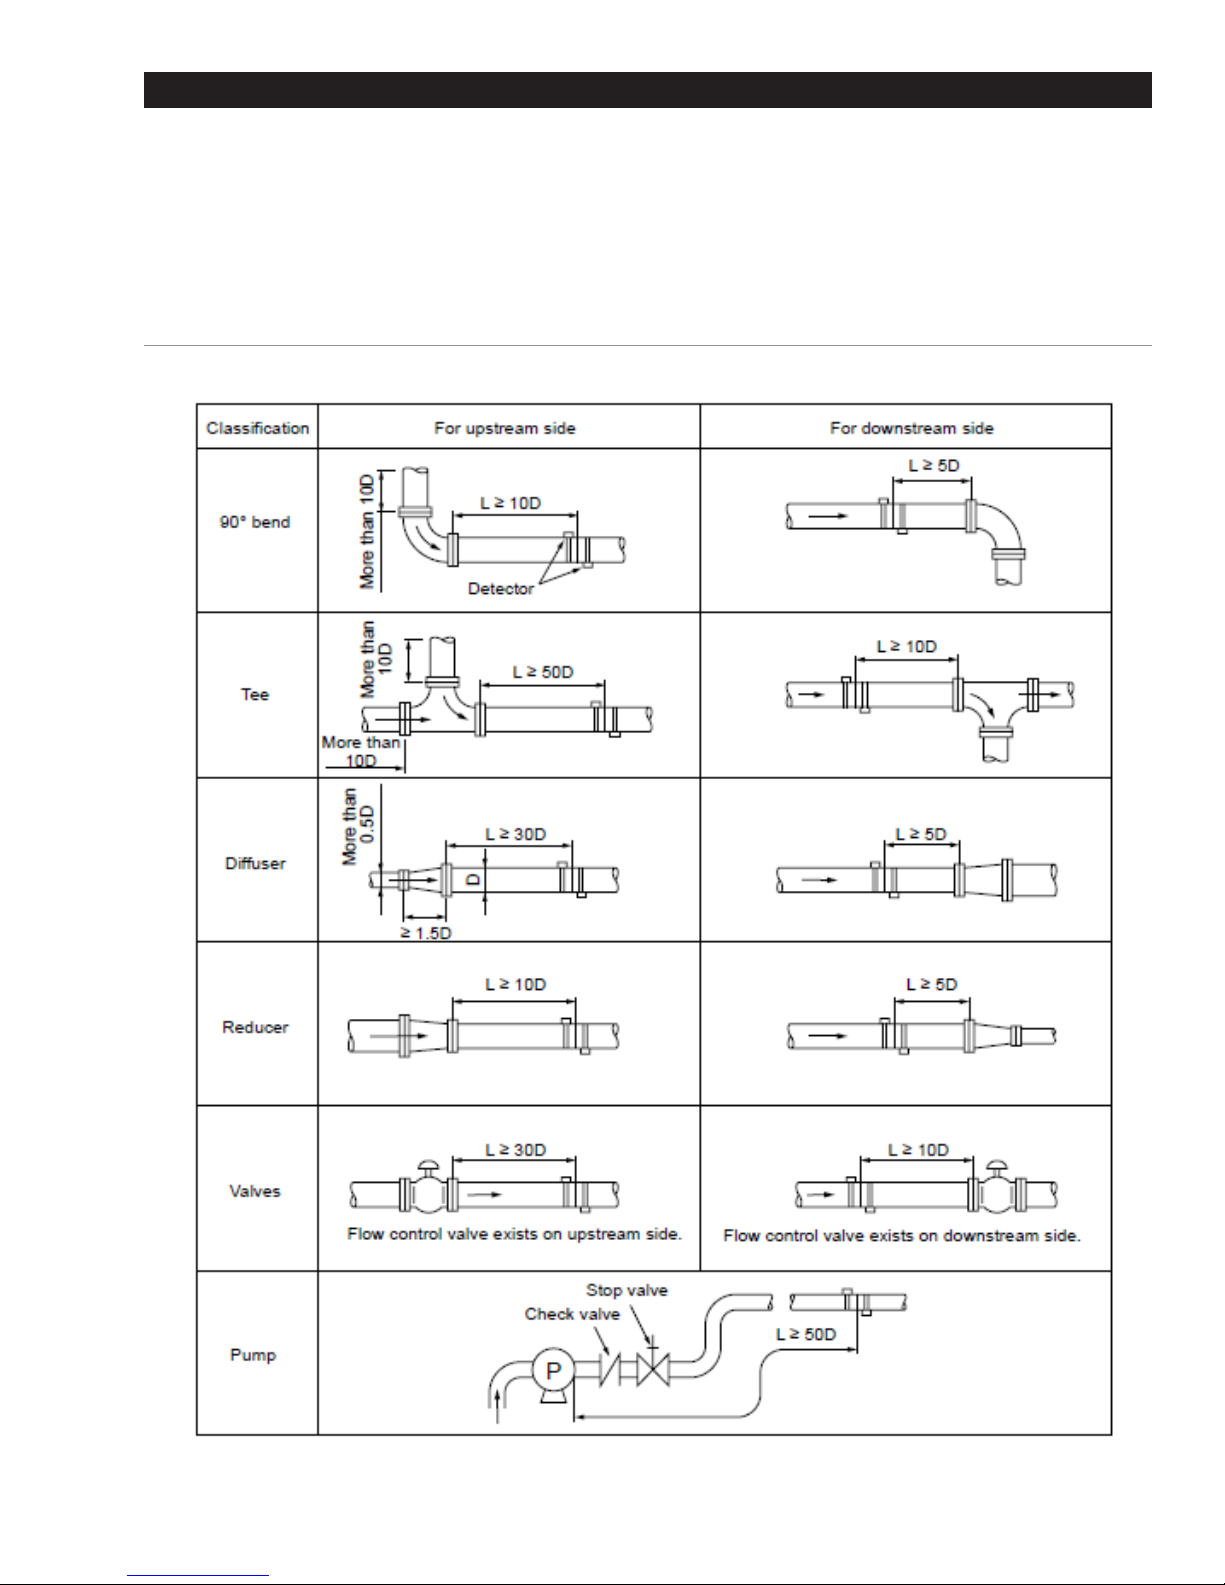
PREPARING FOR MEASUREMENT
The following section elaborates on essential aspects that must be taken into account for successful
owrate measurements.
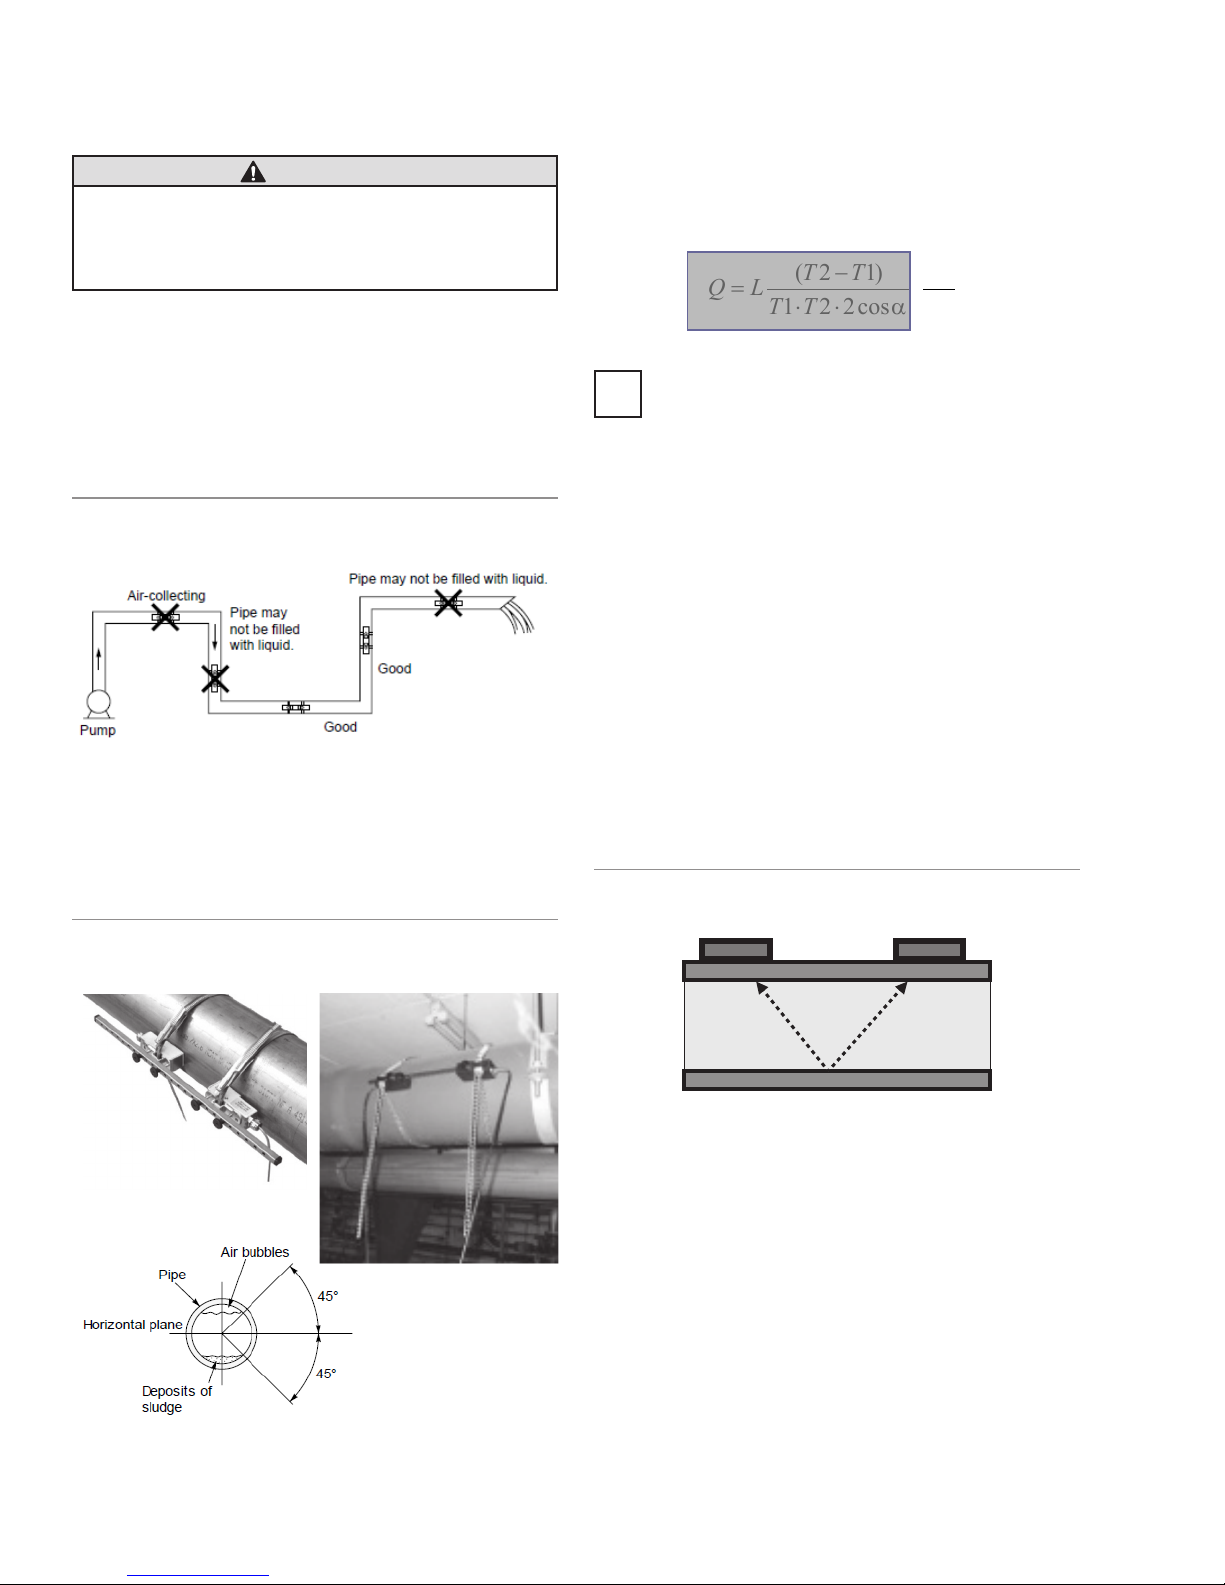
STRAIGHT RUN REQUIREMENTS
The selection of the mounting location has a signicant impact on measurement quality. The
charge and discharge areas listed in the following table should be taken into account.
FIGURE 22: Straight run requirements
13
Page 14
TRANSDUCER MOUNTING POSITIONS
4cos221
TT
Mounting Ultrasonic Transducers
CAUTION
The pipe must always be lled completely
at the mounting positions of the ultrasonic
transducers. It is not possible to take
measurements on partially lled pipe.
The ultrasonic transducer can be operated in any mount-
ing position. However, conforming with the mounting
positions shown below is mandatory. The drawing shows
the side view of the piping.
Mounting Ultrasonic Transducers On
Horizontal Pipe
FIGURE 23: Preferable mounting positions for ultrasonic
transducers (1)
UFM uses the cross section of the pipe to calculate
the ow. The cross section is calculated from the inner
diameter setup (user setting). If there is sedimentation
in the pipe, which decreases the real inner diameter, a
small amount of uncertainty may result. The same hap-
pens when the inner diameter is not known/estimated.
D
2
πα⋅⋅
)12(
TT
LQ
=
−
⋅⋅
To measure pipes with unknown wall thicknesses
a wall thickness gauge is avaiable from GPI. Ask
i
GPI Customer Service Representative for more
information or visit www.GPImeters.net.
Ultrasonic Transducers On Non-Planar
Surface
Never mount the transducers on non-planar surfaces such
as welding seams or deformations. Always try to remove
thick and uneven protective paint coating from the piping
area where the ultrasonic transducers will be mounted.
On horizontal piping, mount the transducer with an offset
of about +/-45% to the horizontal plane. Otherwise, there
is a risk of the accumulation of bubbles in the upper sec-
tion and sedimentation in the lower section of the pipe.
FIGURE 24: Preferred mounting positions for ultrasonic
transducers (2)
Mounting Ultrasonic Transducers
Following are the options for mounting the ultrasonic transducers. The V-mode is standard for most applications.
V-Mode
FIGURE 25: Mounting of transducers in V-mode
Transducer 1 Transducer 2
In the V-mode, both ultrasonic transducers are mounted
onto the same side of the pipe. This mode is the standard
for small and medium pipe dimensions. The ultrasonic
signals are reected from the pipe wall.
14
Page 15
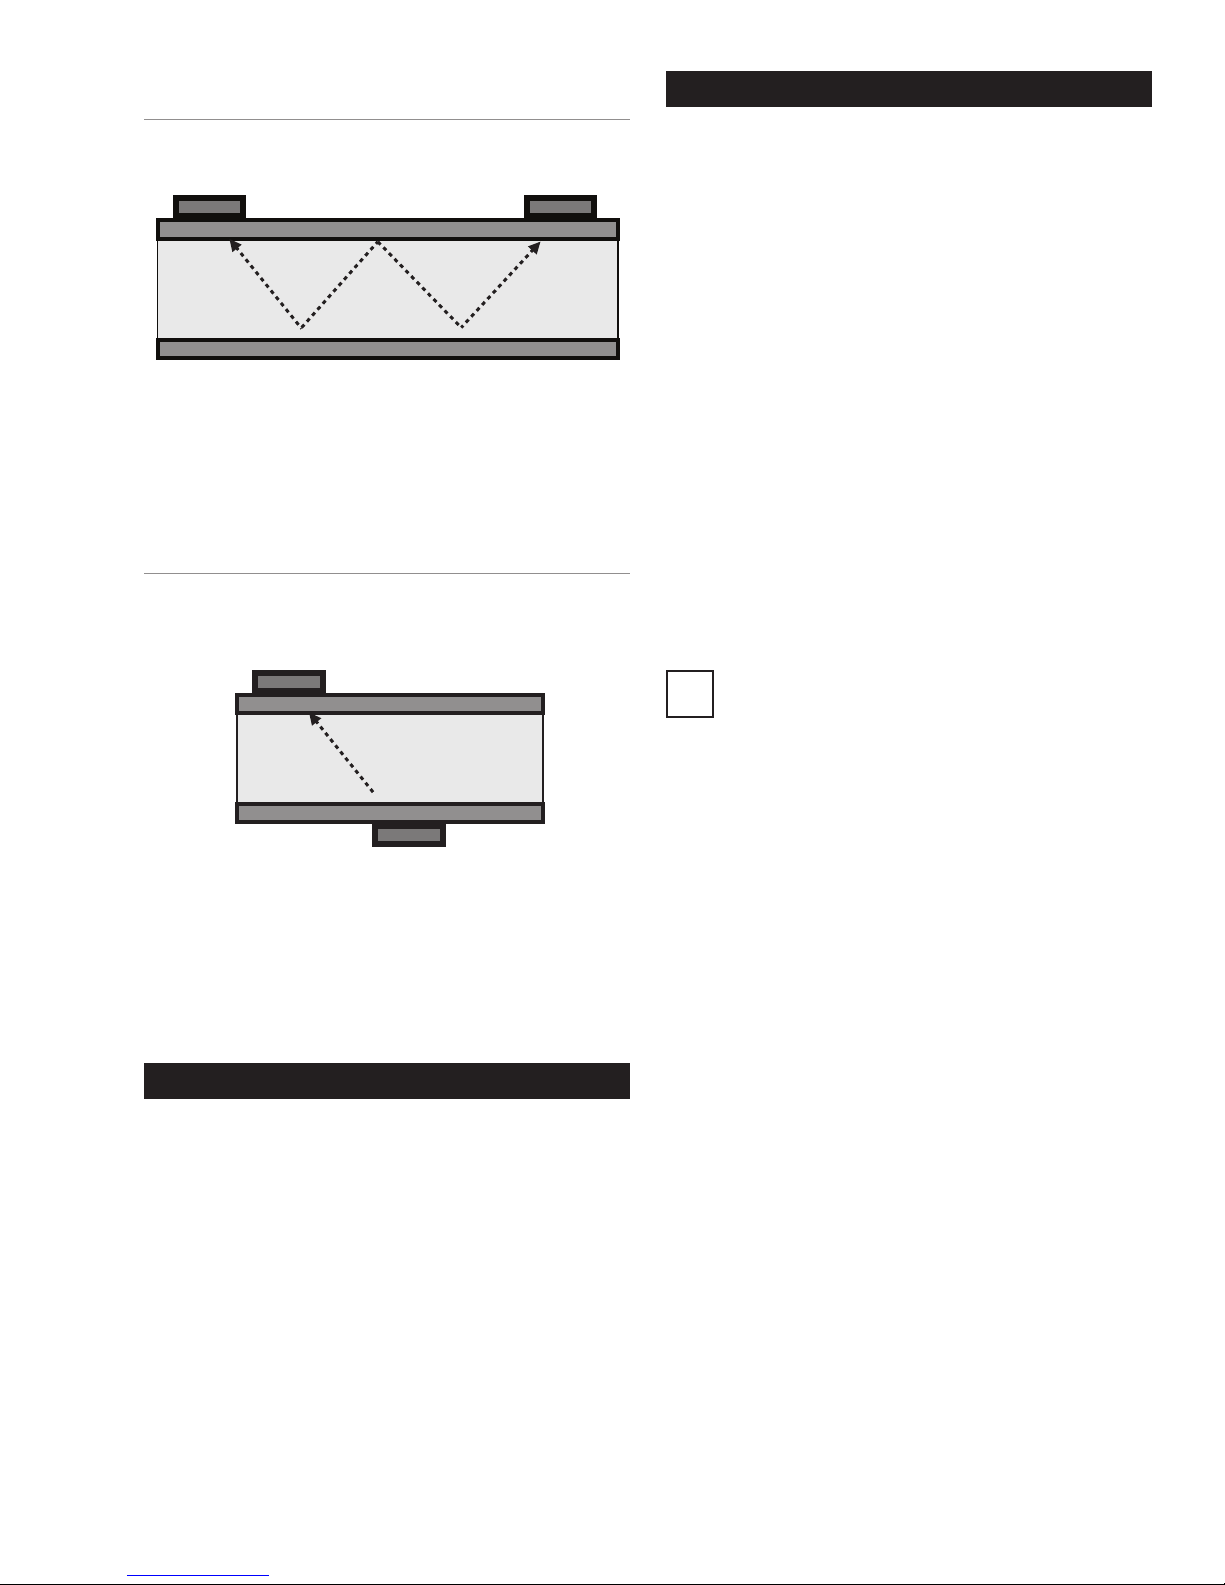
W-Mode
Transducer 1
SETUP PARAMETERS
FIGURE 26: Mounting of Transducers in W-Mode
Transducer 1 Transducer 2
The W-mode is a special method for mounting the ultrasonic transducers. This method is usually employed on
very small pipes.
Z-Mode
FIGURE 27: Mounting of Transducers in Z-Mode
Transducer 2
The Z-mode is a special method for mounting the ultrasonic transducers. The signal is transmitted across
a shorter distance with this installation method. Use for
measuring large-scale piping systems, or where the sys-
tem is lled with heavily contaminated or gas-loaded uid.
Ths section denes the input of all data that is necessary
for ow measurement.
• “QUICK SETUP”: The Quick Setup guide offers stepby-step instructions on the essential tasks required to
setup parameters.
• “COMPL SETUP”: The complete setup function
enables access to all options and expert settings.
WHAT NEEDS TO BE SETUP
• The pipe’s outer diameter or circumference.
• The wall thickness of the pipe. The material and thick-
ness of the pipe lining, if such lining exists.
• The pipe material
• The uid
• The type of ultrasonic transducers
• The mounting mode for the ultrasonic transducers
Ultrasonic measurement is based on the signal
transit time process. The ultrasonic signals
i
penetrate the piping and the uid. In order to
calculate the signal transit time, each uid, pip-
ing material and existing lining will be assigned a
sonic speed value, as well as the pipe diameter
or circumference value. The tabular database
species the sonic speed values for the materials
and uid. The sonic speed for materials not listed
in the tables must be entered manually. Tables
that list additional sonic speed parameters for
different materials are available in the back of
these operating instructions.
MEASURING WITH UFM
5 Steps to Flow Measurement:
• Select a suitable location for mounting the ultrasonic
transducers
• Setup the UFM pipe parameters
• Mount the ultrasonic transducers onto the piping
• Perform a zero calibration
• Start the ow measurement
15
Page 16
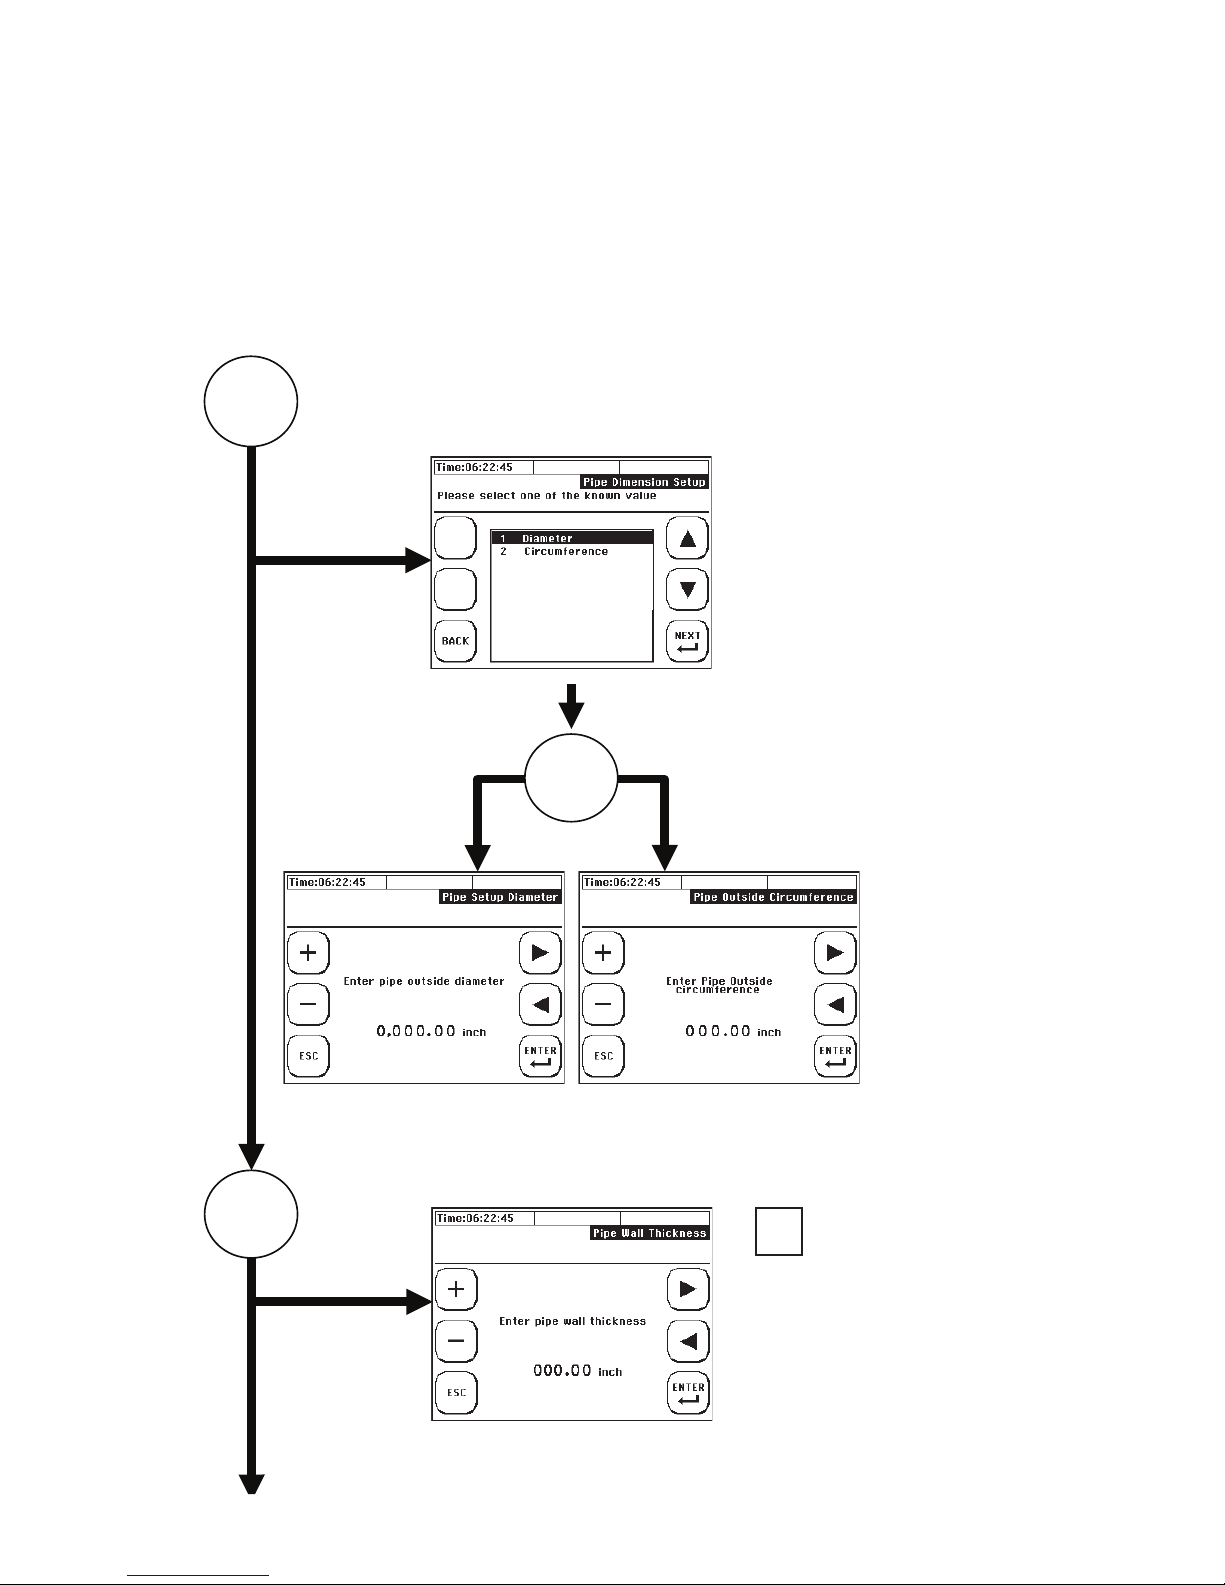
USING QUICK SETUP
START
Accessing the setup dialog:
After power on: Select “Setup” -> “Quick Setup” within the start sequence.
In the primary measuring window “Flow 1”: Select “Setup” -> “Quick “Setup.”
Enter the kinematic viscosity of the uid:
Specify whether to enter
the pipe circumference
or outer diameter.
1
2
Enter the outer diameter
OR
Enter the outside
circumference
i
Use a wall thickness
meter if wall thickness
is unknown, or
consult published
pipe standards.
16
Enter the pipe’s wall thickness
Page 17
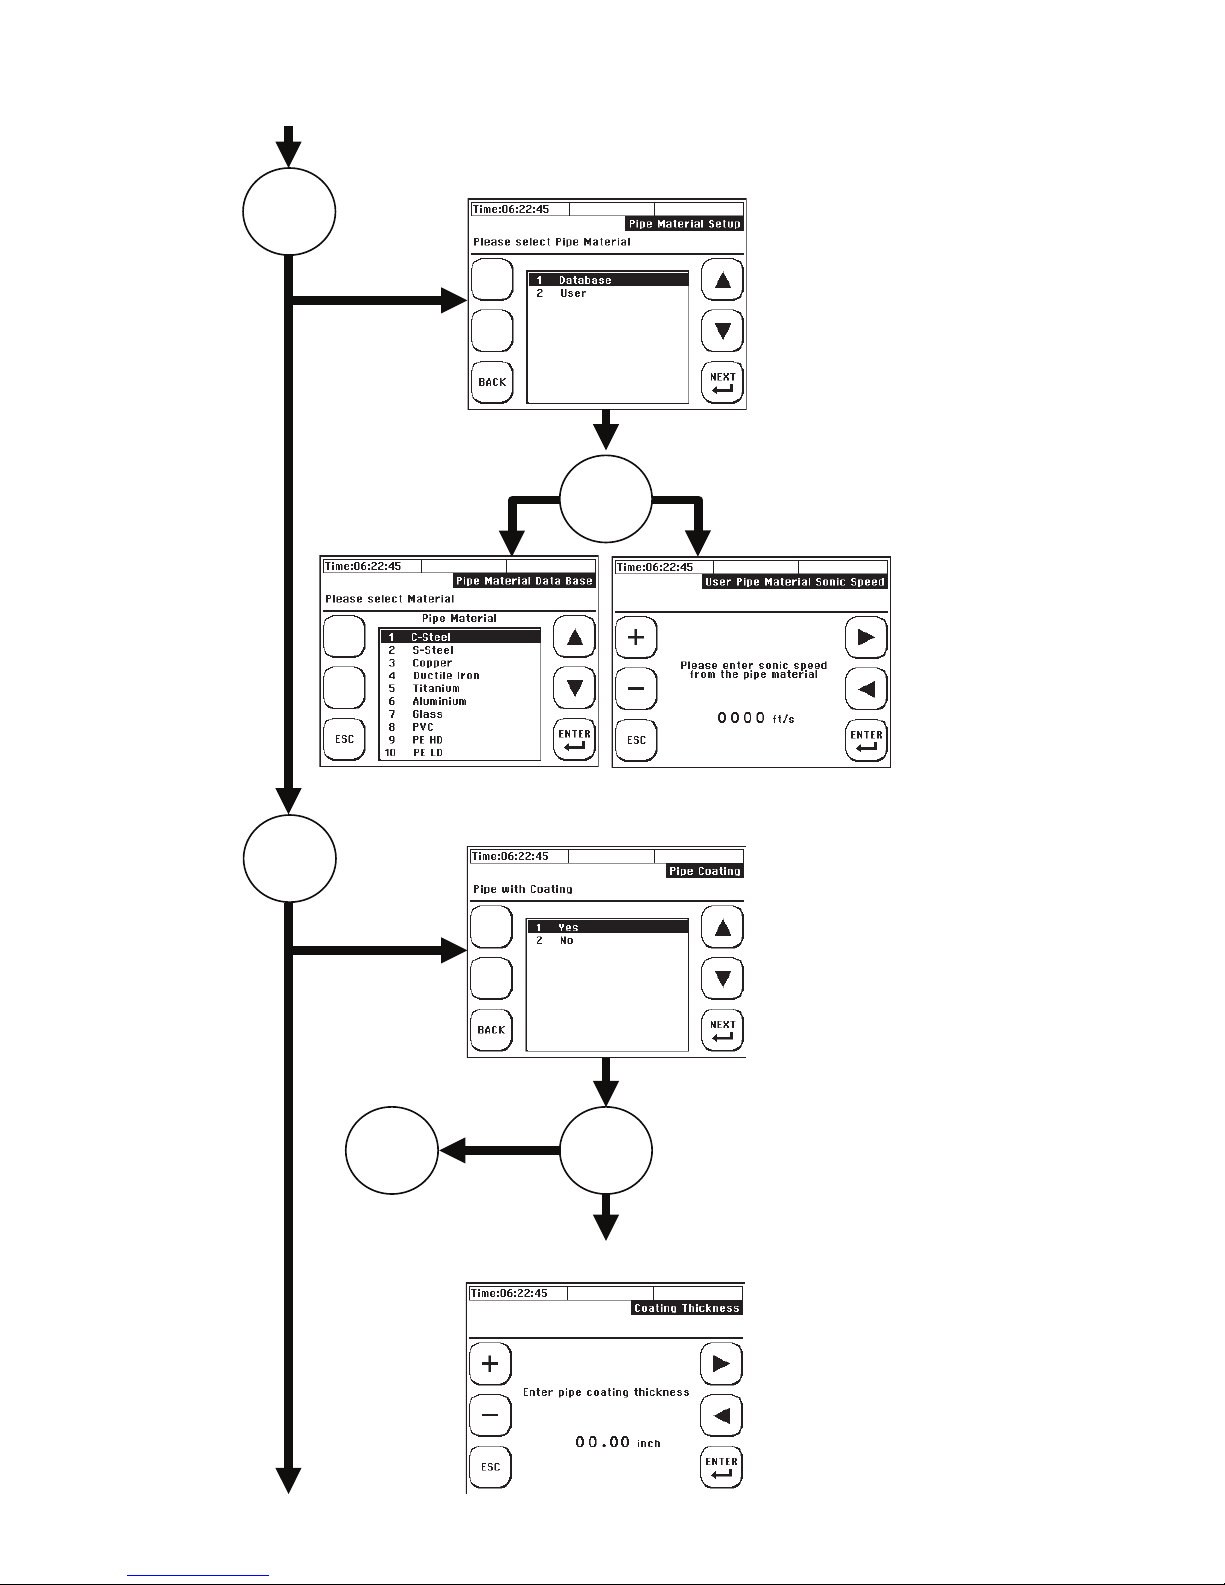
USING QUICK SETUP (CONTINUED)
Choose pipe material
3
OR
4
Does the pipe have a lining YES/NO?
NO
OR5
YES. Enter the thickness of the lining.
Select the database,
or user input if a
material is not listed
in the database.
17
Page 18

USING QUICK SETUP (CONTINUED)
OR
Choose lining material from
the database.
5
Enter speed of sound of
user-dened coating.
Select the uid:
OR
18
Enter the kinematic
viscosity of the
medium:
Page 19

USING QUICK SETUP (CONTINUED)
Enter the thermal
capacity of the uid:
Enter the density
of the uid:
6
7
8
END
Select a suitable ultrasonic transducer:
For information on suitable
transducers for specific
pipe dimensions, refer to
section “QStar UFM and
Components.”
Select a suitable mounting mode:
For information on suitable
transducers for specific
pipe dimensions, refer to
section “QStar UFM and
Components.”
Output of the distance between the
ultrasonic transducers:
i
i
The distance between
transducers is specified in
i
inches and always measured
between the faces of
transducers 1 and 2. These
dimensions are not the same
for each mounting mode.
19
Page 20

MOUNTING DISTANCE
Distance
V-mode and W-mode
The distance between the ultrasonic transducers is always
measured between their opposing surfaces in all mounting
modes. After setting up the measuring point, the ow transmitter displays the distances that have to be set up using a
measuring tape. When using a spacer bar in the V-mode,
position the transducers conveniently using the spacer bar.
APPLIES TO FIXED UFM
FIGURE 29: V-Mode or W-Mode with Spacer Bar
FIGURE 28: Mounting of ultrasonic transducers V-mode
Mounting
Distance
Ultrasonic Transducer
V
t
1
FIGURE 31: Mounting of ultrasonic transducers (Z-mode)
t
2
FIGURE 30: V-Mode Mount with Fabric-Reinforced
Tensioning Tapes for Large Pipe Diameters
Installation at Z-Mode
Transducer 1
Transducer 2
FIGURE 32: Mounting of ultrasonic transducers in Z-mode
using mounting belts
20
Page 21

APPLIES TO FIXED UFM
Grease coupling
U
ltrasonic Transducer
Cable
Sheath
FIGURE 33: Z-mode installation with fabric-reinforced
tensioning tapes for large pipe diameters
ULTRASONIC TRANSDUCER
MOUNTING
The ultrasonic transducer (F10 and F21) is made of
plastic (PEEK) that has a beige color and is protected
by means of a metal sheath. The sheath has two
threaded bars on top that prepares the transducer for
use of spacer bar.
The ultrasonic transducer type F05 consists only of the
sensor sheath and the ultrasonic transducer.
FIGURE 34: View of the back side of the transducer.
Some coupling grease (approximately the size of a
peanut) has to be applied where the part touches the
pipe wall after installation.
FIGURE 35: Lower side of ultrasonic transducer (touching
pipe wall)
before mounting
Mounting in V-mode or W-mode
After setting up the parameters of the measuring point,
the ow transmitter displays the distance between
the transducers in inches (face-to-face, see Figure
36) and as number of grid holes for use of the spacer
bar (ultrasonic transducers type F10 and F21). Bar
index number 4, for example, shows three free grid
holes between the ultrasonic transducers. Install the
transducers on the spacer bar as shown in the gure.
Secure the transducers on the spacer bar using the
knurled screws .
FIGURE 36: Using spacer bar – bar index holes
numbering, Example number of holes = 4
21
Page 22

APPLIES TO FIXED UFM
Fix Transducers on Pipe
Using Mounting Belts
The transducers are mounted by using the metal tension belts. The length of the belts are related to the
maximum pipe size of the corresponding transducer (for
example, when using –F10 (1 1/4" to 16") size of belt
is suited for max. 16"). If using the same transducer for
smaller pipes, shorten the belts. The belts are fastened
by a tightener (Figure 37) which can be tightened by
using a screwdriver (Figure 38).
FIGURE 37: Tightener for Metal Tension Belts
FIGURE 38: Tighten metal belts with screwdriver
Z-mode Mounting of Ultrasonic
APPLIES TO PORTABLE UFM
FIGURE 39: V-mode or W-mode without spacer bar
FIGURE 40: V-mode or W-mode with spacer bar
FIGURE 41: V-Mode Mount with Fabric-Reinforced
Tensioning Tapes for Large Pipe Diameters
22
Page 23

APPLIES TO PORTABLE UFM
Distance
Z-Mode Installation
FIGURE 42: Z-mode mounting of ultrasonic transducers
Transducer 1
Transducer 2
FIGURE 43: Z-mode mounting of ultrasonic transducers
using mounting chains
ULTRASONIC TRANSDUCER
MOUNTING
Basic structure of the ultrasonic transducer:
The ultrasonic transducer (F10 and F21) is made of
plastic (PEEK) that has a beige color and is protected
by means of a metal sheath. The transducer is secured
by means of a knurled screw that is passed through the
transducer support. This support can be shifted in axial
direction (arrow) with the help of the knurled screw (A).
The ultrasonic transducer type F05 consists only of the
sensor sheath and the actual ultrasonic transducer.
Sheath
Ultrasonic Transducer
Layout of ultrasonic transducer
FIGURE 44: Z-mode installation with fabric-reinforced
tensioning tapes for large pipe diameters
Knurled screw (A)
Transducer face
Transducer support
Before mounting the ultrasonic transducer onto the
piping, the beige transducer surface must be brought
into the position underneath the bottom edge of the
transducer support (screw transducer into support).
Apply acoustic gel on the
sensing face of the ultrasonic
transducer.
23
Page 24

APPLIES TO PORTABLE UFM
MountingDistance
Mounting in V-mode or W-mode
After setting up the parameters of the measuring point,
the ow transmitter displays the distance between the
transducers in inches (Figure 45) and as number of grid
holes for use of the spacer bar (ultrasonic transducers
type F10 and F21). Bar index number 5, for example,
is equivalent to the number of grid holes between the
ultrasonic transducers, plus the position at which the
knurled screw of the opposing transducer has to be
mounted. Install the transducers on the spacer bar as
shown in the gure. Secure the transducers on the
spacer bar using the knurled screws (B).
FIGURE 45: Positioning the ultrasonic transducers by
means of spacer bar index
Transducers
The mounting of transducers in Z-Mode might be useful for bigger pipes and/or applications with low signals
strengths (high particle/gas load). When using Z-mode,
the spacer bar cannot be used since the two transducers are located on the opposite sides of the pipe. The
distance between the transducers (“mounting distance”)
depends on application (mainly pipe size). In Figure 47
the principle is illustrated. The following sections show
how to place the transducers correctly.
FIGURE 47: Transducers mounted in Z-Mode
Bar index number 5 example
Fix Transducers on Pipe
Using Mounting Chains
FIGURE 46: Secure the ultrasonic transducers (types F10
and F21) by means of stainless steel tensioning chain.
Fix the ultrasonic transducers using the stainless steel
chains (with or without spacer bar).
Attach the chains to the hooks on the transducers while
keeping them under slight tension. Attach the ultrasonic
transducers to the pipe by adjusting the knurled screw
(A) until the transducer is pressed slightly onto the pipe.
Use a plastic or paper template (not supplied) to mark
the mounting positions. The example shows how to mark
the positions using a plastic template.
1. Wrap the plastic template once around the pipe at the
mounting position of the rst ultrasonic transducer
(transducers face has to be in line with the line to be
drawn).
2. Using a felt tip pen, draw a line on the pipe along the
template (corresponds with the pipe circumference)
24
TEL: 888-722-3569 • 973-940-1684 • FAX: 1-973-940-1651 • www.GPImeters.com
Page 25

FIGURES 48 AND 49: Attaching Plastic Template
Draw Line
FIGURE 51: Measure Required Distance (Given by Flow
Transmitter)
FIGURE 52: Set Up the Template to Mark the Mounting
Position of the Second Transducer
FIGURE 50: Pipe with First Mounting Line for First
Transducer
3. After setting up parameters,the UFM displays the axial
distance between the ultrasonic transducers (transducer distance) is displayed. Measure the transducer
distance based on the value displayed on the UFM,
starting from the rst line drawn to the position at which
the second line is to be drawn (mounting position for
face of the second transducer).
4. Draw two cross hairs on the same axis, centered on
the lines drawn with the help of the template.
FIGURE 53: Auxiliary marks
2
1
5. Mount the rst transducer. Its face is positioned on the
axis of the rst line drawn. The transducer face (not
the transducer) is centered onto the rst cross hair.
Now calculate half of the pipe’s outer circumference.
25
Page 26

r = Radius of pipe including wall thickness
(“outer radius”)
Example: Radius (outer) = 250mm -> U =
2*3.1415*250mm/2 = 785.4mm
6. Position the zero line of the measuring tape onto the
center of the second cross hair drawn on the pipe (at
same level as rst transducer). Measure the previously
calculated distance (half circumference). You should
now have located the precise position opposite to the
rst transducer. Draw a third line at this position.
FIGURE 54: Determining the Mounting Position for
Transducer
EDIT PARAMETERS
Edit system parameters using the complete setup menu.
However, this method is less convenient, as it does not
offer a step-by-step guide to setting up the parameters. It
is therefore recommended to use the main menu only in
situations that require editing of an individual parameter.
Editing the parameters includes access to piping, uid
and dialogs for selecting the ultrasonic transducer and
mounting mode.
If you only want to change the mounting mode from V to
Z, simply select “Transducer parameters” and change it
without having to run a complete “Quick Setup” session.
This document provides only a brief overview of how
to setup the parameters and main menu in the form of
structure diagrams that help identify the functions grouped
in the respective menu.
7. Mount the second transducer. Its face is positioned
on the axis of the second line drawn. The transducer
face is centered onto the third cross hair. The transducers are now mounted precisely opposite to each
other and are prepared for measuring in Z-mode.
FIGURE 55: Right Mounting of Transducers in Z-mode
Navigate to the main menu:
In the primary measuring window “Flow 1”: Select “Setup”
-> “CMPL. SETUP”
Select the parameters to edit, for example, “Pipe Setup,”
“Fluid Setup,” or “Transducer Setup.”
26
Page 27

Direct access to the pipe parameters:
PIPE SETUP
Outer Diameter Outer Circumference
OR
Enter outer diameter Enter outer circumference
Enter wall thickness
Pipe material
from database
Select from database:
1 Steel
2 Stainless steel...
OR
Does pipe have internal coating?
User-dened pipe material
Enter speed of sound
of your pipe material
YES NO
Enter thickness
of coating
Choose from
database
Select:
1 Rubber
2 ...
Material of coating
OR
OR
Enter
customized
coating
Enter speed of
sound of your
coating
END
27
Page 28

Setup Fluid Data
FLUID SETUP
Choose from database Set user-dened uid
OR
Enter outer diameter Enter outer circumference
Select from database:
1 Water 20 Degrees
2 ...
END
Enter speed of sound
of user-dened uid
Enter kinematic viscosity
Enter heat capacity
Enter density
Direct access to selection of ultrasonic transducer and mounting mode:
TRANSDUCER SETUP
Choose transducer
Choose mounting mode
END
28
Page 29

ZERO SETTING
Zero Calibration Using the Main Menu:
It is advisable to run a zero calibration before starting
measurements, if possible.
CAUTION
Prerequisite for error-free zero calibration is the
complete setup of the device, proper installation of
both ultrasonic transducers on the pipe, and their
electrical interconnection with the ow transmitter.
Zero-ow is required for error free calibration. Wait
two minutes after stopping process/shut-off pipe
to allow the ow to calm down.
Zero Calibration Starting in “Flow 1” Menu
1. Close the valves of the piping.
2. Navigate to the “Setup” window as follows, using one
of three options:
3. After power-on: Select “Setup” within the start sequence
4. In the primary measuring window “Flow 1”: Select
“Setup” and “Zero Setup”
5. Select “Set Zero”
In the main menu, select “damping/cutOff/Zero” -> “Zero
calibration”
• Stop ow of uid (close a valve)
• Choose Set Zero
Deleting the zero value
In the main menu, select “Zero Setup” - “Zero” - “Delete
zero”. This action deletes the zero calibration and resets
the meter to factory settings.
CAUTION
Once the zero offset has been set, it will remain in
the system until it is deleted or a new zero offset
has been set. We recommend to make new zero
setting at each new measurement when possible.
The following window opens on completion of zero
calibration:
The UFM displays the calculated correction value for
the signal transit-time on completion of zero calibration.
In the course of zero calibration with closed
pipe valves, the UFM calculates the transit-time
i
differential that may develop between the trans-
ducers and any residual ow. This calculated
time (including zero) is automatically included for subsequent calculations during ow measurement. This method
enhances the precision of the ow measurements. If it is
not possible to close the pipe valves, delete the zero value
that may have been set previously. If anything prevents
performing a zero calibration, take the corresponding
imperfection into account in your measurements. The
zero setpoint is retained in device memory until it is
overwritten with a new zero setpoint. If it was possible
to close the pipe valves, check the “Flow” column in one
of the three measuring windows to determine whether
or not the owrate is going down. Do not perform a zero
calibration until a settled value is output to the ow display.
A stop valve is not available at all positions of the piping.
The tolerances that develop during installation, including
tolerances of the ultrasonic transducers and pipe data,
will lead to a certain zero offset error in the measuring
equipment. Provided care was taken during installation,
the ow velocity error should stay within the range from
0.00 ft./s to 0.09 ft./s. The zero offset error is reduced in
proportion with increasing pipe size.
29
Page 30

HEAT MEASUREMENT
The integrated heat measurement function enables you
to determine the heat and cooling ow in your application
using QMF-PT100 or QMP-PT100 temperature sensors.
Introduction
The temperature sensor no.1 is installed in the warmer
section, while temperature sensor no. 2 is installed in
the cooler section of the circuit (The QMF-PT100 are
numbered on the cable). You can position the ultrasonic
transducers at the warmer or cooler section. GPI recommends installing the transducers in the cooler section,
as it is unlikely that they will be operated beyond their
permissible temperature limit in these sections.
QStar UFM displays the thermal output and the accu-
mulated heat quantity.
INSTALLING THE TEMPERATURE
SENSOR
Temperature sensors can be mounted on piping using
a metal belt (photo) or fabric-reinforced tape. Install the
temperture sensor on the pipe as follows.
FIGURE 57: Mounted Temperature Sensor
FIGURE 56: Block Diagram of Heat Measurement
Thermal Output
/ Heat quantity
Volume Flow /
Ultrasonic
Transducers
Quantity
Consumed
Thermal Output /
Heat quantity
Thermal Input /
Heat Quantity
Feed temperature
Temperature
Sensor T1
Return
temperatur
Temperature
Sensor T2
e
Q Flow Rate
QStar UFM shows heat (kWh) and thermal output (kW)
Calculating Thermal Output
The measuring method used is a relative
measurement. This means that the measured
i
temperature values with absolute reference may
deviate from this measuring equipment (for example, compared to submersion thermometers).
It is important to set up a relation between both
sensors. The ideal differential temperature between the temperature sensors should amount
to zero degrees prior to installation on the piping.
Zero Setup of Temperature Sensors
From main menu “Flow 1”: Press button SETUP ->
COMPL SETUP -> à CALIBRATION SETUP -> Select
“QMF-PT100 T2-T1”
The cross-sectional area of the pipe’s inner diameter [A]
is multiplied by the ow velocity [v] and specic thermal
capacity of the medium [c], as well as the differential
temperature of both sensors, [T_hot- T_cold]. The product
denes thermal output [Q] in W units.
Calculating heat (quantity)
The heat quantity is derived as a function of thermal
output over time.
30
The differential temperature between both
temperature sensors should amount to approxi-
i
mately zero degrees prior to installation of the
transducers on the piping. Avoid touching the
transducers in the preliminary phases. To equal
both temperature sensors put them in a glass
of water for a couple of minutes. To check the
temperature of both sensors, use the values
displayed in the “Heat quantity” measuring window that is described in the following section.
Page 31

Select “READ OFFSET”. QStar UFM automatically
calculates the T2 to T1 offset. On completion of this
calculation, the differential temperature T1 to T2 should
amount to approximately zero degrees. Use the “Reset
Offset” command to reset the calculated differential
temperature to zero.
Absolute thermal output measurements
(absolute measurement)
Same procedure is applicable for second temperature
sensor. In this case please choose PT100 T2 in calibration menu.
MEASURING WINDOWS
THE MAIN DISPLAY “FLOW 1”
The device supports the alignment of the displayed
temperature with a reference thermometer for each temperature sensor used. This functionality can be useful,
for example, for heat measurements.
Example: The resistance thermometer installed in
the pipe displays 348° F. However, the tempera-
i
ture sensors of your QStar UFM displays only 343°
F. QStar UFM also supports manual adjustment of
the offset. In this case, specify a setpoint of 348° F.
The setpoint is an absolute value and not an offset.
Proceed as follows:
In the primary measuring window “Flow 1”: Select
“SETUP” -> “CMPL SETUP” -> CALIBRATION SETUP
-> “PT100 T1”
The “Flow 1” menu is the main menu that shows the
current measured values like ow and thermal output.
Opening the central measuring window “Flow 1”
After power on: Wait approximately ve seconds for the
display of the start screen. The QStar UFM automatically
opens the central measuring window “Flow 1”.
Starting in the main menu: Select “ESC” > “MEAS.”
The “Flow 1” measuring window provides concise information that is important for ow and heat.
DATA IN MAIN MENU “FLOW 1”
PARAMETER DESIGNATION
Enter the absolute setpoint for T1. Caution: The setpoint
is an absolute value and not an offset in terms of the tem-
perature displayed. You can select “RESET” to delete the
setpoint for the PT100 T1. In this case the temperature
sensor will indicate the actual temperature.
Displays the current owrate
Totalizer = owrate counter. Displays the actual owrate value.
Displays the actual thermal output
Displays the actual heat quantity
Returns the sonic speed of the
uid
31
Page 32

DATA IN MAIN MENU “FLOW 1”
PARAMETER DESIGNATION
Species the signal quality in [%]
Outputs the actual temperature
of the connected QMF-PT100
temperature sensors. Signals the
measurement status
Indicates the status of the
measurement
Indicates deactivated data logging
Indicates ongoing data logging
Indicates USB-connection to PC
RESET
Resets the Totalizer (owrate counter) to zero
TOT
MEASURING WINDOW “HEAT”
Starting in the primary measuring window “Flow 1: Select
‘Flow 2’ -> Heat”
The “Heat” measuring window outputs concise informa-
tion that is important for heat measurements.
Change to the diagnostics windows. Only neces-
DIAG
sary for information or if you do not receive any
measurement results
Change to measuring window “Flow 2” providing
FLOW 2
further information
Change to oscilloscope menu to watch signals
OSC
MEASURING WINDOW “FLOW 2”
How to open the central measuring window “Flow 2.”
Starting in the primary measuring window “Flow 1”:
Select “Flow 2.”
Flow measuring window 2 provides concise information
that is important for ow measurements (without heat
measurement). The window also provides additional
ow velocity data.
DATA IN MENU “HEAT”
PARAMETER DESIGNATION
Displays the actual thermal output.
Displays the actual heat quantity.
Displays the differential temperature
between the connected PT100 T1
and PT100 T2 temperature sensors.
FLOW 2
Change to measuring window “Flow 2.”
SELECTING THE PHYSICAL UNITS
How to access the “Units Setup” menu:
In the primary measuring window “Flow 1”: Select
“SETUP” -> “CMPL SETUP” -> Navigate to “Units Setup”
in the main menu.
Select the variable to change the physical unit:
ADDITIONAL CONTENT OF MENU “FLOW 2”
FUNCTION DESIGNATION
Displays the actual ow
velocity
FLOW 1
Change to the primary measuring window”
“Flow 1”.
HEAT
Change to measuring window “Heat”
32
Page 33

SELECTING THE FLOW UNIT
To access the physical unit from submenu “Flow 1”
In the primary measuring window “Flow 1”: Select
“SETUP” -> “CMPL SETUP” -> Navigate to “Units Setup”
in the main menu and then select “Flow.”
Select the parameter to change the unit:
SELECTING THE PHYSICAL UNIT
FOR THERMAL OUTPUT
To access the physical unit submenu “Thermal
output”
In the primary measuring window “Flow 1”: Select
“SETUP” ->”CMPL SETUP”. In the main menu, select
“Units Setup”-> “Power.”
Select the physical unit:
SELECTING THE PHYSICAL UNIT
FOR HEAT QUANTITY
Now select the desired unit.
SELECTING THE PHYSICAL UNIT
FOR THE TOTALIZER
To access the physical unit submenu “Totalizer”
In the primary measuring window “Flow 1”: Select
“SETUP” -> “CMPL SETUP” -> Navigate to “Units Setup”
in the main menu and then select “Total Flow”
Select the physical unit:
To access the physical unit submenu “Heat quantity”
In the primary measuring window “Flow 1”: Select
“SETUP” -> “CMPL SETUP” — In the main menu, select
“Units Setup” -> “Heat.”
Select the physical unit:
33
Page 34

APPLIES TO FIXED QSTAR UFM
SETUP THE I/O
To access the I/O setup menu:
In the primary measuring window “Flow 1”: Select
“SETUP” -> “CMPL SETUP”. In the “complete setup”
menu, select “I/O Setup.”
SETUP THE 4 mA TO 20 mA
CURRENT OUTPUTS
CAUTION
Any connection of an active 4 mA to 20
mA analog output of QStar UFM with an
external device that also provides a voltage
at its inputs will cause fatal damage to your
QStar UFM and external device. Before you
interconnect both devices, always verify that
your external recording (PCS) system is set
to passive state.
The outputs of QStar UFM are working in active mode
in factory state. That means that the ow transmitter
provides the required voltage to run the outputs.
Output passive
Passive 1
QStar UFM 24VDC
Passive 2
QStar UFM 24VDC
The mode (passive or active) of the outputs can be
changed inside the QStar UFM. Always use the factory
setting (active mode). If you need to change the mode,
contact your GPI Customer Service Representative.
To access the “Analog output” menu:
In the primary measuring window “Flow 1”: Select
“SETUP” -> “CMPL SETUP”. In the main menu, select
-> “I/O Setup” -> Analog outputs”.
The inputs of the external device are connected directly
to QStar UFM.
Outputs are activated (factory setting)
Active 1:
QStar UFM 24VDC
34
Select the analog output to be used:
Page 35

APPLIES TO FIXED QSTAR UFM (Continued)
Specify the variable to be output at the analog output:
Select the value to be assigned to the 4 mA output
(Example Flow).
SETUP RELAY PARAMETERS
QStar UFM is equipped with a relay output.
This output can be assigned a function or a range.
Example of an external circuitry:
CAUTION
The relay has a NO (normally open) contact.
The contact is only closed when triggered by
a setup parameter function. The contact will
retain its open state on power failure. You do
not have to observe the polarity of the wiring
since it is potential free.
Select the value to be assigned to the 20mA output.
The analog outputs only support unidirectional ow.
QStar UFM can only provide positive ows to the
outputs. The ow display must return positive
i
values. What happens if the value exceeds the
setup high or low limits? Example: You expect
a owrate of 100m3/h and assigned this rate
a value of 20 mA. However, the owrate may
reach 130 m³/h. This means that a value of 20
mA will also be output for owrates higher than
100 m3/h.
To access the “Relay” menu:
In the primary measuring window “Flow 1”: Select
“SETUP” -> “CMPL SETUP”. In the main menu, select
-> “I/O Setup” -> “Relay:
Choose value (lower limit) for activation of relay. Relay
will be activated when measured value fall below the
limit.
35
Page 36

APPLIES TO FIXED QSTAR UFM (Continued)
In addition to setup variables such as ow,
QStar UFM applies the corresponding unit
i
that is selected in the “Units Setup” setting
and appended to the respective variable that
is displayed in a measuring window. Example:
If you selected the physical unit m³ for ow
variables, the values of the switching points
are also the parameters set in cubic meter.
Select the upper limit value for the relay. Relay will be
activated when measured value exceeds the maximum
limit.
Example: A pump is operated in an application and the discharge volume of this pump
i
is measured. The pump has a maximum
discharge volume of 6000 m3 /h and there is
a risk of damage to the pump when the discharge volume drops to less than 150 m3/h.
The objective is for QStar UFM to shut down
the pump as soon as the value drops below
a point at which damage to the pump can be
expected. So in that case lower limit has to be
set to 150m3/h, upper limit to 6000m3/h. Relay
will be activated if ow falls below 150m3/h or
exceeds 6000m3/h.
Connecting Digital Output
Example 1:
Connect the plus terminal of evaluation unit (for example, PCS) to the plus terminal of voltage supply.
Connect the negative terminal of evaluation unit to
the plus terminal of the DO. The negative terminal of
the DO has to be connected to the negative terminal
of external voltage supply.
QStar UFM
Example 2:
Connect a PNP transistor’s emitter to the positive
terminal of the external voltage supply. The basis of
the transistor should be connected (via a resistance)
to the positive terminal of the DO. The collector of the
transistor should be connected to the positive terminal
of evaluating unit (PCS). The negative terminal of the
evaluating unit has to be connected to the negative
terminals of the DO and the voltage supply.
QStar UFM
The physical unit cubic meter must have been
assigned to the ow variables in the physical
unit settings. The minimum activation point
must have the parameters setup.
Setup the Digital Output (transistor)
QStar UFM provides one digital output (DO). The DO
is a transistor output (open collector) and is typically
used as a counter for volume (m3) or heat (kWh). The
DO is operated in passive mode. That means a supply
voltage (10…30VDC) has to be provided externally.
CAUTION
Be careful not to confuse the positive (+) and
negative (-) voltage in order to avoid damage
to the ow transmitter.
36
To enter the menu for Digital outputs:
Starting from main menu “Flow 1”: Choose SETUP
-> COMPL SETUP -> I/O SETUP -> Digital Output.
Page 37

APPLIES TO FIXED QSTAR UFM (Continued)
Choose related data (heat or volume) to use with DO.
Choose the value (totalizer or heat) that represents
one pulse.
Example: To get a pulse at the DO each 10m3 enter 10
here. Units can be changed in units setup.
UPGRADE QSTAR UFM
Disconnect transmitter from power supply. Plug the
RS232 board (QMF-RS232) into the two plugs in the
region of the connection terminals (see QStar UFM and
Components: Interfaces of QStar UFM” to access
the connection terminals).
RS232 Board (QMF-RS232)
Now reconnect the power supply.
The unit in the digital output menu (for example,
m3) is related to the chosen unit of the counter
i
(totalizer). Example: Choosing unit l (litres)
for the totalizer in the units setup menu also
provides litres in the DO.
Choosing kWh as unit of the totalizer when
using it for heat measurement also provides
kWh in the DO.
SETUP THE SERIAL INTERFACE
RS232
Using a separate RS232 interface board is an option.
QStar UFM upgrades by simply plugging in the separate
RS232 board. The RS232 sends ASCI strings including
measurement data.
CONNECT RS232 BOARD TO A
RECEIVER (PC OR PCS)
Requires a cable to be connected at the RS232 board
and –typically- to a SubD (others possible due to customers demands).
RS232 Interface board
TAG Designation
TX Transmit Data 3
Pin 9 Pol. Sub
D
RX Receive Data 2
GND Ground 5
37
Page 38

APPLIES TO FIXED QSTAR UFM (Continued)
Pin assignment of standard Sub-D 9 pols
ACTIVATE THE RS232 INTERFACE
To activate the RS232 go to menu “Flow 1”
From main menu “Flow 1”: Choose SETUP -> COMPL
SETUP -> SERIAL INTERFACE (6)
To activate RS232 interface press YES
CONFIGURE RECEIVER
(for example, PC) TO RECEIVE
RS232 DATA
Choose interface where the RS232 is connected (for
example, COM4).
Congure input according to Figure 58. Note: Bit rate
cannot be changed (115200 bits/sec).
FIGURE 58: Congure Input for RS232 Communication
Then choose some parameters:
Start Date: Set date where RS232 communication
should start.
Start Time: Set time where RS232 communication
should start.
Duration: Set duration of RS232 communication.
Interval: Set interval (for example, 5 means that a data
package is sent each ve seconds).
After successful conguration you should receive data
as shown in Figure 59.
FIGURE 59: Receiving Data via RS232 Interface
To receive data use the Hyper Terminal provided
by Windows. If serial interface is not available
i
on the PC, use standard RS232 (Sub D-9) to
USB converter.
If you do not set a start time and date the
communication starts immediately after setting
i
duration and interval.
38
Page 39

APPLIES TO PORTABLE QSTAR UFM
SAVE, LOAD AND MANAGE DATA
Logging Data
The term data logging denotes the recording (saving)
of measured value data on the internal SD Memory
Card. All measurement data like time and date, ow,
velocity, totalizer and thermal output, heat quantity and
temperatures (when using temperature sensors). If
temperature sensors should not be in use these values
are shown as “0” in the log les. The data is stored in a
text le (*.txt) which allows easy and quick export into
ofce software like Microsoft® Excel or similar.
Time-Controlled Data Logging
Your UFM supports time controlled data logging to the
internal SD memory card.
The time controlled data logging uses the in-
ternal system time which is set by user. Make
i
sure the system time is correct.
In the primary measuring window “Flow 1”: Select
“SETUP” -> “CMPL SETUP” -> “Data logger”
Navigate to the Data logger parameters eld and conrm your entry with “NEXT”. Assign a le name (min.
4 characters). Use the arrow keys to select the letters,
or delete a letter by means of “DEL”. Accept the letter
with “ENTER”. Select “DONE” and press “ENTER” to
conclude data input
• Enter the start date May 25, 20YY
• Enter the start time 3:00 PM
• Enter the duration in 001:01:00:00 format
• Enter the interval in 00:00:60 format
The data logger does not average values
over the cycling period. The current values
i
are always stored. If you choose interval of 10
seconds the current values each 10 seconds
are stored (not the average over last 10 sec).
To delete or to rename existing log les please connect your UFM to your PC using the USB cable. Then
access the log les directly at the SD card.
Message “LOG ACTIVE” is being shown at the display
while data logging is going on. If there is no data log-
ging display shows “LOG INACTIVE.”
Continuous Data Logging:
Example: You want to log the data generated from
May 25, 20YY, 3:00 PM to May 26, 20YY, 4:00 PM.
The data is logged at cyclic intervals of 60 seconds to
the SD Card.
Start 15:00 Stop 16:00
25.05.20YY 26.05.20YY
27.05.20YY
39
Page 40

APPLIES TO PORTABLE QSTAR UFM (Continued)
Cancel active data logging
If you want to quit an ongoing data logging before the
dened stop time please go to main window “Flow”:
Choose “SETUP” -> COMPL SETUP -> DATA LOGGER
The following window appears:
To cancel data logging press YES. The stored data will
be still available on the SD card.
Save/load/edit parameters
The primary measuring window “Flow 1”: Select
“SETUP” -> “CMPL SETUP” -> “Save/load parameters”.
Your UFM provides functions for saving and loading
the parameter data. This saves time if you are taking
measurements at different locations.
To save the parameters, use the arrow keys to select
the memory space and conrm your entry with “NEXT“:
Select “SAVE” to save the parameter data.
Select “LOAD” to load a parameter set from memory.
Select “RENAME” to rename the stored le. Select
Delete to delete the choosen parameter le.
Use the button to scroll through the details of the
stored parameter le.
The parameter les are stored into an internal
data logger and not in the SD card. The SD
i
card is reserved for data log les only. If you
perform software reset stored parameter les
will be deleted.
READING DATA ON THE COMPUTER
Connect via USB port to a computer using the USB cable
supplied by GPI. Your UFM is automatically detected
as mass storage medium (like a USB drive). Compat-
ible operating systems include: XP, WIN2000, Vista,
Windows 7, or MAC OS X.x. Your UFM is equipped
with a USB 2.0 interface.
When succesfully connected to a PC display will show
message USB ON in the main menu “Flow 1”.
Your current data setup is displayed:
Enter a le name. Use the arrow keys to select the letters, or delete a letter by means of “DEL”. Accept the
letter with “ENTER”. Select “DONE” and press “ENTER”
to exit data input.
40
FIGURE 60: Display when connected to a PC
QStar`s SD card will be detected from Windows/Linux
and can be accessed in order to rename/delete or
copy les.
Page 41

APPLIES TO PORTABLE QSTAR UFM (Continued)
Exporting data in Microsoft® Excel
Data logs are saved to a le with *.txt extension on the
SD Card. The data can be imported directly to a standard
data processing software such as Microsoft® Excel.
Copy the desired le to your PC. This guide shows
basics of exporting the les into Microsoft
course working with the data logs is not restricted to
Excel and is possible with comparable software.
Free ofce software similar to Microsoft® Ofce
can be found at www.openofce.org.
i
The log le will look like this: Each line represents the
data from one measuring point. The different values
are separated by semicolon.
FIGURE 61: Log le opened by text editor
®
Excel. Of
SETUP THE 4 mA TO 20 mA
CURRENT OUTPUTS
QStar UFM provides two 4 mA to 20 mA current outputs.
These outputs can be assigned different measured
values. The outputs are set actively by default. This
means that your QStar UFM always provides a voltage
at these outputs.
CAUTION
Any connection of an active 4 mA to 20 mA analog
output of QStar UFM with an external device that
also provides a voltage at its inputs will cause
fatal damage to your QStar UFM and external
device. Before you interconnect both devices,
always verify that your external recording (PCS)
system is set to passive state.
FIGURE 62: Data imported into Microsoft® Excel
SETTING THE PARAMETERS
How to access the I/O setup menu
In the primary measuring window “Flow 1”: Select
“SETUP” -> “CMPL SETUP.” In the “complete setup”
menu, select “I/O Setup.”
The outputs of your UFM are working in active mode
in factory state. That means that the ow transmitter
provides the required voltage to run the outputs.
The inputs of the external device are connected directly
to your UFM.
Outputs are activated (factory setting).
Activ 1:
QStar UFM 24VDC
41
Page 42

APPLIES TO PORTABLE QSTAR UFM (Continued)
Current output 1 (I1A/B): Current ow is directed
from I1B to I1A.
Current output 2 (I2A/B): Direction of the current ow
is directed from I2B to I2A
Select the value to be assigned to the 20mA output.
The analog outputs at your UFM only support unidi-
rectional ow.
How to access the “Analog output” menu:
In the primary measuring window “Flow 1”: Select
“SETUP” -> “CMPL SETUP”. In the main menu, select
-> “I/O Setup” -> Analog outputs.
Select the analog output to be used:
Specify the variable to be output at the analog output:
Select the value to be assigned to the 4mA output
(Example Flow)
QStar UFM can only provide positive ows to
the outputs. The ow display must return posi-
i
tive values. What happens if the value exceeds
the setup high or low limits? Example: You
expect a owrate of 100m3/h and assigned this
rate a value of 20 mA. However, the owrate
may reach 130 m³. This means that a value of
20mA will also be output for owrates higher
than 100 m3/s.
When do you have an error situation?
i
• If limits of the values previously assigned
to the 4mA and 20mA outputs were ex-
ceeded on expiration of a specic time
(burnout)
• Signal loss
Example: You expect a maximum owrate of
100 m3 in your application and assigned this
rate the 20mA value. You also set the following
defaults for the error mode.
If an error is pending, the 4mA to 20mA output
enters the error mode and outputs 4mA on expiration of a delay time of 20 seconds. In practical
operation you may have a owrate of 130 m³
in the piping for a duration up to two minutes.
In this case, QStar UFM would output 20mA
for the duration of 20 seconds and then enter
the error mode and output 4mA on expiration
of a timeout of 20 seconds. After the owrate
has dropped again to a value less than 100
m³ (on expiration of 100 seconds),the QStar
UFM will automatically exit the error mode and
output the setup current for the ow.
42
Page 43

APPLIES TO PORTABLE QSTAR UFM (Continued)
SETUP THE RELAY
Your QStar UFM is equipped with a relay output.
This output can be assigned a function or a range.
Example of an external circuitry:
You link an alarm beacon with the output to signal that
the owrate has undershot the lower threshold limit.
Color coding of the relay output cable:
In addition to setup variables such as ow,
QStar UFM applies the corresponding unit
i
that is selected in the “Units Setup” setting
and appended to the respective variable that
is displayed in a measuring window. Example:
If you selected the physical unit m³ for ow
variables, the values of the switching points
are also setup in cubic meter.
Select the upper limit value for the relay. Relay will be
activated when measured value exceeds the maximum
limit.
CAUTION
The relay has a NO (normally open) contact.
The contact is only closed when triggered by a
setup function. The contact will retain its open
state on power failure and with low rechargeable
battery. You do not have to observe the polarity
of the wiring since it is potential free.
To access the “Analog output” menu:
In the primary measuring window “Flow 1”: Select
“SETUP” -> “CMPL SETUP”. In the main menu, select
-> “I/O Setup” -> “Relay:
Choose value (lower limit) for activation of relay. Relay
will be activated when measured value fall below the
limit.
Example: A pump is operated in an applica-
tion and the discharge volume of this pump
i
is measured. The pump has a maximum
discharge volume of 6000 m3 /h and there is
a risk of damage to the pump when the dis-
charge volume drops to less than 150 m3/h.
The objective is for QStar UFM to shut down
the pump as soon as the value drops below
a point at which damage to the pump can be
expected. So in that case, lower limit has to be
set to 150m3/h, upper limit to 6000m3/h. Relay
will be activated if ow falls below 150m3/h or
exceeds 6000m3/h.
The physical unit cubic meter must have been
assigned to the ow variables in the physical
unit settings. The minimum activation point
must have been setup.
43
Page 44

CALIBRATION
SYSTEM SETTINGS
QStar UFM provides a calibrating function that can be
used to calibrate the ow. It may also be used to calibrate
the analog outputs and temperature sensors.
To access the “Calibration” menu:
In the primary measuring window “Flow 1”: Select
“SETUP” -> “CMPL SETUP” -> Navigate to “Calibration
Setup” in the main menu”.
CALIBRATING FLOW
Select “Flow” from the calibration menu”.
To access the “System settings” menu:
In the primary measuring window “Flow 1”: Select
“SETUP” -> “CMPL SETUP” -> Navigate to “System
Setup” in the main menu
Editing the Time and Date
To access the “Time and date” menu:
In the primary measuring window “Flow 1”: Select
“SETUP” -> “CMPL SETUP”. In the main menu, select
“System Setup “ -> “Time and date
Enter an offset percentage that is relative to calibration
reference.
To calibrate QStar UFM, we recommend you
take measurements at different ow velocities
i
then calculate the mean value of the results. GPI
calculates the mean value based on ve different ow velocities. The ow offset is retained in
device memory until it is overwritten with a new
value word.
CALIBRATING THE TEMPERATURE
SENSOR
For more information on temperature sensor calibration,
refer to the section Measuring with QStar UFM: Heat
measurement.
Enter the time with the format hh(hour):mm(minutes):ss
(seconds). Enter the date with the format: mm(month).
dd(day).yy(year).
Modifying the Display Backlight
To access the “Backlight” menu:
In the primary measuring window “Flow 1”: Select
“SETUP” -> “CMPL SETUP” — In the main menu, select
“System Setup” -> “Backlight”
Adjust the display brightness by setting value (0% = no
backlight, 100% maximum brightness).
44
Page 45

Change Language
MISCELLANEOUS
1. Switch on the UFM — Within the start sequence, press
the multifunctional key next to the “SETUP” eld.
2. Conrm the “SETUP LANG.” button.
To access the “Miscellaneous” menu:
In the primary measuring window “Flow 1”: Select
“SETUP” -> “CMPL SETUP” — In the main menu, navigate to “Damping/CutOff/Zero” menu.
Flow Damping
In the primary measuring window “Flow 1”: Select
“SETUP” -> “CMPL SETUP”. In the main menu, navigate
to “Damping/CutOff/Zero” -> “Damping Flow”
Specify an attenuation of signal output in this dialog.
Enter a damping time. It is a T63 damping. That means
after damping time the displayed value has reached 63%
of real change.
3. Use the arrows in the next window to select the dialog
language. Conrm entry with “Enter” and exit the menu
with “SETUP”.
CAUTION
The language setting changes the language used
in the menus. The language in the elds next to
the multifunctional button remain unchanged.
Example: Damping time 5 seconds, Flow change from
1 m3/h to 2 m3/h.
Display: Shows 1.63m3/h after 5 seconds, 2.00 m3/h
after another 5 seconds (10 seconds in total).
Typical values are 5-30 seconds. The higher the damp-
ing the slower the measurement but the “smoother” the
measurement curve.
Flow Cut off
In the primary measuring window “Flow 1”: Select
“SETUP” -> “CMPL SETUP”. In the main menu, navigate
to “System Setup” -> “Damping/Cut off/ Zero” -> “Cut
off Flow”.
Only the ow velocities that are greater than the setup
“Cut off” will be displayed. Lower velocities will be dis-
played as 0.
45
Page 46

Zero Setting
Impulse OUT
nUpRelays/ T1/T2 Analog Out
QMP-001
Software Reset
In the primary measuring window “Flow 1”: Select
“SETUP” -> “CMPL SETUP”. In the main menu, navigate
to “System Setup” -> “ Damping/CutOff/Zero “ -> “Zero”.
System Setup-> “System information”
In the primary measuring window “Flow 1”: Select
“SETUP” -> “CMPL SETUP” — In the main menu, navigate
to “System Setup” -> “Info Flow Module”. Check version
of software to see if an update is available.
RESETTING QSTAR UFM
Two different types of resets:
• Hardware Reset
Use software reset in all other cases like getting an
implausible measurement or reading on the display.
Data stored on SD card will not be deleted. Data stored
internally (parameter les) will be deleted.
There are different possibilities to make a software reset
• Immediately after switching on, press “RESET
SYS” at the starting screen.
• From the main menu “Flow 1” choose SETUP
-> COMPL SETUP -> SYSTEM -> RESET SYS.
CAUTION
Reset the date and time after each software
reset.
• Software Reset
Hardware Reset
Hardware reset is only necessary when QStar UFM
hangs up and cannot be operated any longer by using
the buttons. Data stored internally or on the SD card will
not be deleted.
Fixed QStar UFM: The hardware reset can be activated
by pressing the reset button located behind the cover.
Portable QStar UFM: The hardware can be reset by
putting a small screwdriver or a paper clip into the hole
on the backside of the transmitter.
ResetDow
USBPower
TROUBLESHOOTING
Use the following check lists for troubleshooting and check
all items listed. If an error prevents you from taking proper
measurements after you completed the check, contact
GPI Customer Service Representative at: (888) 996-3837.
Make sure to have the following information available:
• Pipe material
• Pipe outer diameter
• Wall thickness
• Medium type and temperature
• Type/length of the intake/discharge circuits
• Type of transducer used
Use the “QStar UFM troubleshooting” information
for troubleshooting by means of step-by-step
i
elimination of items. This procedure helps when
troubleshooting complex issues and in locating
the fault systematically.
46
Page 47

TROUBLESHOOTING
A: NO MEASURE AT ALL
1. Are you absolutely certain that the piping is
completely lled?
2. Can you exclude gas load on the medium?
Is a pump close by?
If there is gas load:
• Are the transducers installed at the 10 AM
or 2 PM position on the horizontal pipe?
• If there is gas load on the medium, is there
an option of mounting the transducers to a
vertical pipe? If yes, mount the transducers
to a vertical pipe.
3. What is the solid particle content of the uid? □
4. Are you absolutely certain of the wall thick-
ness? Check the piping for the presence
of engraved information that may be of
relevance. Hot water piping is subject to the
formation of lime deposits that may propagate
the deposit of solid particles of uid with high
content. Use a wall thickness meter. You can
purchase a wall thickness meter from GPI.
Check the wall thickness entry on the device.
5. Did you enter the outer diameter of the pipe,
or its circumference? Check the correspond-
ing values once again.
6. Have you selected the correct piping material? Are you certain the piping is not lined?
When taking measurements on a pipe made
of concrete you must presume that this piping
does not have sound conducting properties.
Check the setup values once again.
7. Does the ultrasonic transducer match the
application with regard to pipe dimensions
and medium temperature? Is the temperature
of the uid within permitted limits? Did you
select a suitable ultrasonic transducers for
the application with regard to the pipe dimensions? Once again, verify that you selected
the correct ultrasonic transducer and that it
is setup.
8. Which transducer mounting mode did you select? Standard is the V-mode. If you selected
the W-mode, you should rst try the V-mode.
9. Verify the proper transducer distance. Take
the measurements at the transducer faces.
When using a spacer bar, check the number
of holes between the transducer mounting
positions.
TROUBLESHOOTING
A: NO MEASURE AT ALL
□
□
□
□
□
□
□
□
10. Does the piping have a thick paint coating?
If yes, try to remove the paint at the position
where you are planning to install the ultrasonic
transducers using sand paper. Never take any
measurements on piping insulation, no matter
what type of material is involved.
11. Did you apply an appropriate lm of acoustic
coupling gel (Magnalube) to the transducer
faces? Small transducers (types QMP-F10 and
F21) need approximately 1.2 inches, whereas
the large transducer (QMP-F05) requires approximately 2.4 inches of coupling gel.
12. Do the transducers apply adequate pressure
on the piping?
13. Are the transducers that are mounted without
spacer bar precisely aligned along a common
axis on the piping?
14. Are there sources of strong disturbance such
as transformers,electrical drives, or sources of
vibration in the immediate area of measurement?
15. Use the Z-mode for installation if all of your
efforts did not yield a satisfactory result. Setup
your device accordingly. You might also try to
test your equipment on a different piping section that is close by in order to nd out whether
or not you can perform a measurement. Check
all measuring leads for damage.
B: IMPRECISE MEASUREMENT RESULTS
1. Did you observe the corresponding upstream
and downstream distances? The quality of
measurements will deteriorate in proportion to shorter upstream and downstream
distances.
2 . Did you perform a zero calibration after
having closed a stop valve on piping?
3 . Check the setup values with regard to the:
• Pipe outer diameter
• Wall thickness
• Piping material
• Transducer distance
□
□
□
□
□
□
□
□
□
47
Page 48

Measures to take if the piping is not lled
Amplitude
Amplitude
Amplitude
Amplitude
completely.
siphon
Sensor 1Sensor 2
If you cannot separate the piping, because it is plastic
piping, for example, or if the application is in the planning
or installation phase, it is recommended to use a siphon to
compensate for partially lled piping. The gradient of the
siphon is calculated based on the expected ow velocity
and contamination load. Contact GPI for support if it is
necessary to install a siphon for your application.
The time the signals needs from one transducer to the
corresponding transducer (run time) depends on path
length (distance), speed of sound of materials, uid and
ow velocity.
Depending on mounting mode the signals might look as
shown in Figure 64.
FIGURE 64: Signal Images
t1w
t1v
Pipe Signal
Pipe Signal
t1v
Signal
Signal
Mode-
Mode-
-
-
V
V
tp
tp
signal
signal
Send
Send
t1w
Signal
Signal
Mode-
Mode-
-
-
W
W
time
time
DIAGNOSTIC MENU
Oscilloscope/Auto-Window
Signal propagation
QStar UFM offers sophisticated diagnostic menus allow-
ing users to optimize challenging measurements in harsh
conditions. To use the diagnostic menu for troubleshoot-
ing, a background in signal propagation is provided.
Figure 63 illustrates which signals occur and how they
progagate at the pipe.
FIGURE 63: Signal propagation
UP-Transd. V-Mode W-Mode
UP-Transd. V-Mode W-Mode
UP-Transd. V-Mode W-Mode
Signal
Desired
Desired
Desired
-
Mode
Mode
Mode
-
-
-
Z
Z
Z
Signal
Signal
Signal
-
-
V
-
Mode
Signal
Signal
Signal
Z-Mode
Z-Mode
Z-Mode
Pipe Signal
Pipe Signal
Pipe Signal
W
-
W
W
Mode
-
-
Mode
Mode
Signal
Signal
Signal
-
-
V
V
-
-
Mode
Mode
-
At t=0 the UP-transducer starts signal transmission.
After time T=tp you can see the pipe wall signal which
reaches the corresponding transducer rst because of
shorter distance and (usually) faster propagation caused
by higher speed of sound of pipe material.
After that, at time T=t1v, the V-mode signal reaches the
transducer (single reection at opposite pipe wall). After
t1w (approximately 2x t1p) the W-mode signal is being
detected. Usually, when having pipe materials highly
conductible for ultrasonic signals (metals) and small
pipes, the pipe wall signal has high amplitude which
is similar to amplitude of V-mode signal. When having
sound-absorbing materials (plastic, concrete) and/or
coating the pipe wall signal is usually weak indicated by
low amplitude. The V-mode signal is usually stronger
than the W-mode signal.
The time between the different signals might be signicantly higher or lower depending on pipe sizes and speed
of sound of involved materials.
A different situation occurs when measuring in Z-mode.
FIGURE 65: Signals in Z-mode
The UP-transducer mounted at upstream position emits
the send (or desired) signal. This signal propagates within
the pipe wall (“pipe signal”) as well as in the uid. The
signal propagating in the uid is reected a couple of
times at the pipe walls (Z-Mode signal, V-mode signal,
W-mode signal). The signal which represents the desired
signal depends on mounting mode. For example, when
mounted in V-mode the V-mode signal is the desired
signal. The other signals (Z-mode, W-mode, pipe wall)
may also disturb this signal. The corresponding transducer
is mounted in V-mode as standard but Z-mode and W-
modes are possible. This transducer receives the signals
and returns another signal to UP transducer.
48
t1z
t1z
tp
tp
Send Signal
Send Signal
time
time
Beside the send signal, only the desired signal (Z-signal)
is visible. The Z-signal reaches the receiving transducer
after T=t1z.
Page 49

Oscilloscope Menu
Amplitude
Amplitude
With the oscilloscope menu you can analyze signals and
even manipulate them in order to handle challenging
applications.
QStar UFM sets all necessary parameters for the
signal processing. When manipulating signals
i
these settings will change. This might result in
a loss of signals and/or failure in measurement.
The changes done in the oscilloscope menu
might remain valid even when leaving the menu.
To get settings from QStar UFM the site should
be setup again.
QStar UFM only works with the signals within the measuring window. The measuring window represents a certain
period of time which is analyzed by QStar UFM about
signals. The measuring window can be moved back and
forth by using the arrow buttons.
FIGURE 66: Measuring Window
t1w
t1v
tp
tp
signal
signal
Send
Send
t1v
Signal
Signal
-
signal
signal
Pipe
Pipe
-
Mode
Mode
-
-
V
V
t1w
Signal
Signal
Mode-
Mode-
-
-
W
W
Time
Time
window displays (Figure 50). In this picture, window
starts at 154 µSec. Use arrow buttons to change this
starting time.
Signal Analysis Using Oscilloscope
The oscilloscope allows quick check of signal quality.
This helps to get accurate measurements. Good signal
to noise ratio and “sharpness” of signals are important
for best results.
Signal-to-noise ratio (SN)
SN indicates the difference of amplitudes between the
desired signal and the noise. The higher the SN the better the signal processing. Figure 68 shows good signals
with very good SN.
FIGURE 68: Oscilloscope Menu Showing Good Signals
Delay
Delay
Window
Window
Window
Zoom +
Zoom +
Zoom +
Zoom -Zoom -
Zoom -Zoom -
Zoom -Zoom -
There is almost no noise at all and a clear and distin-
guished signal.
QStar UFM tries to set the measuring window so that
only the desired signal (for example, V-mode) is visible.
FIGURE 67: Oscilloscope Menu Showing Desired Signals
Figure 69 shows a noisy signal with lower SN. Screen
shows noise around the signal which reaches 20-40%
of signal.
FIGURE 69: Oscilloscope Menu Showing Noisy Signal
Use ZOOM-/ZOOM+ buttons, to scale-up/scale-down
the measuring window (decrease/increase the time the
window is open). Use arrow buttons to move window left
or right (opens earlier/later).
QStar UFM only uses signals within the window. If you
move the window, the signal will disappear and you might
get wrong/no measurement.
QStar UFM is able to handle noisy signals thanks
to its sophisticated signal processing. However,
i
if a high SN is encountered, the user should use
caution in case of additional interferences.
Information about starting point (“delay”) of measuring
49
Page 50

If there are problems with your measurement SN can
be improved by:
Figure 71 shows diffused signals. There is basically no
phase shift. This might result in undetected signals.
• Surface of pipe: Remove paint or rust
• Coupling grease: Use sufcient coupling grease
(Magnalube).
• Alignment of transducers: Make sure the transducers are mounted as suggested by QStar UFM.
Make sure that center of transducers touches the
pipe sufciently (might be a problem with very
small pipes). You can check the oscilloscope
while mounting the transducers.
• Make sure the transducers are not mounted on
welding seams.
• Make sure to remove air from liquid.
• Choose another mounting position (for example,
vertical pipe).
• Make sure to provide sufcient straight run.
• Make sure that signal cables are not disturbed
by power cables.
• Pumps and motors (with frequency inverters)
generate electric noise and should be avoided.
• Use Z-mode rather than V-mode to reduce path
length and therefore to increase signal strength.
• Try V-mode rather than W-mode.
• Use stronger transducers, for example, –F05
instead of –F10 or –F10 instead of –F21.
Sharpness of Signals
QStar UFM uses coded signals to make sure to detect
signals in case of noise. Coded means QStar UFM makes
phase shifts within a signal package.
Figure 70 shows a sharp signal. You can see approxi-
mately 5 waves followed by a phase shift and other waves.
FIGURE 71: Diffuse Signals
QStar UFM is able to handle diffused signals
until a certain limit. Nevertheless sharp signals
i
should be the goal.
If there are problems, the sharpness can be increased by:
• Choosing different signal sequence
• Using other mounting mode
• Using different transducer
• Improving pipe surface: Removing paint and/
or rust
• Making sure to use sufcient amount of coupling
grease (Magnalube)
• Aligning of transducers: Make sure that transducers are mounted as suggested and that the center
of transducers touches the pipe sufciently (might
be problem at very small pipes). You can check
the oscilloscope while mounting the transducers.
• Making sure that transducers are not blocked by
welding seams
• Choosing a different location for measurement
FIGURE 70: Sharpness of signals
50
To select a different signal sequence, enter the diagnostic
menu (Diag) and press button on the right of parameter
SendCode. Usually the signal sequences 3-Barker 5 or
4-Barker 7 are expected to bring best performance. You
can try different sequences and check inuence in diag-
Page 51

nostic data (SigQ, see Troubleshooting: Oscilloscope
Amplitude
Amplitude
Amplitude
Menu of QStar UFM) as well as visually in oscilloscope.
Separating Signals (small pipes)
When measuring at small pipes (<1.9 in.) the distances
between the received signals become smaller. In the
worst case, signals might interfere as shown in Figure
72 Interfering signals.
FIGURE 72: Interfering Signals
FIGURE 73: Separated Signals
Signal
Signal
Mode-
Mode-
-
t1v
Pipe Signal
Pipe Signal
-
V
V
t1w
Signal
Signal
-
-
Mode
Mode
-
-
W
W
Send Signal
Send Signal
tp
time
time
tp
signal
Send
t1v
Zoom -
signal
Pipe
-
Mode
-
V
Window
Zoom +
Signal
-
t1w
Mode
-
W
Zoom
Signal
-
Time
-
---
In this case, there are not only the desired signal within
the measuring window but also the interfering pipe wall
signal and also a part of the W-mode signal.
QStar UFM uses sophisticated algorithms to
separate desired signals from interfering signals.
i
These algorithms are mainly applied when having
the auto window function activated. But especially
when measuring at very small pipes interference
might occur anyway. In that case the user can
separate signals (in order to lter out the desired
signal) manually in the oscilloscope mode.
Window
Window
Window
Zoom +
Zoom +
Zoom +
Zoom -Zoom -
Zoom -Zoom -
Zoom -Zoom -
Deactivate the auto-window in order to separate signals
manually. Always check the measured speed of sound
of the separated signal. When the (separated) desired
signal is within the measuring window, the speed of sound
(parameter vS in diagnostic menu) should be within
+/- 20% of the expected speed of sound (for example,
when measuring water at 68° F speed of sound should
be within 1400-1500 ft/s). If vS exceeds the expected
values you most likely have separated the wrong signal
(example, pipe wall signal, then vS is showing speed of
sound of pipe material).
Activate/Deactivate Auto-Window
When in main menu “Flow 1”, choose OSZ to enter the
oscilloscope menu.
Determine whether to use auto window or not. In case
of problems with measurement we recommend to try
without auto window rst.
Choose “NO”
If interference does occur:
• Use W-Mode rather than V-mode (rst counter-
measure)
• Use Z-Mode rather than V-mode (when W-mode
does not work)
• Deactivate Auto-Window and use ZOOM function/
shift function (arrow buttons) to kick out disturbing
signals of the measuring window.
• Use different signal sequence, for example,
3-Barker5 or 1Puls rather than 4-Barker 7
• Use transducer working at higher frequency
(F21 rather than F10) to get sharper signals.
When using F21 (2MHz) instead of F10 (1MHz)
the signals become half as wide (half of time)
which makes it easier to separate signals.
Display shows distinguished signals (UP and DOWN) in
the oscilloscope.
Press DIAG and OSZ again to activate auto window.
Answer with YES. Check if position of ultrasonic signals
have been changed. Check if value for delay has been
changed. If yes, use auto window for your measurement.
Auto window is activated when you say YES and when
you leave oscilloscope mode. To deactivate auto window
enter oscilloscope mode again and answer with NO).
51
Page 52

DIAGNOSTIC MENU
CAUTION
The diagnostic menu shows a lot of parameters
that are mainly readable for experienced
users. The diagnostic data are also suited for
troubleshooting.
Diagnostic Window 1:
MENU 1: Diagnostic Data
Frequency: Shows the signal frequency which depends
on the selected transducer.
There are three different transducers using different
frequencies (500kHz, 1000kHz, 2000kHz).
Signal: Shows the type of signal code. Coded signals
allow reliable detection of signals.
T1: Signal run time signal 1 (Upstream signal or downstream signal depending on connection of cables).
T2: Signal run time of back signal 2 (Upstream signal or
downstream signal depending on connection of cables).
dT: Measured difference between T1 and T2 (minus
zero offset if applicable). dT is proportional to ow.
vF: Measured velocity
vS: Measured speed of sound of uid. Depends on
temperature.
SigQ: Number of valid signals (in percentage). QStar
UFM makes numerous measurements per second and
automatically lters out unreliable signals. The number of
measurements in relation to valid measurements is SigQ.
The achievable number is related to the chosen quality
(see Menu 2). The higher the quality the lower usually
the SigQ. When setting quality to 0 there is basically no
ltering of signals and all signals are used for measurement (with the risk of using bad signals.
K-Factor: Factor which compensates the inuence
when measuring laminar ow (Re <8000). When
measuring in that area a (small) additional uncertainty
might occur.
Reynolds: The number of Reynolds automatically
affects the chosen compensation factor.
Send Code (=signal sequence): The used signal
sequence.
Diagnostic Menu 2:
MENU 2: Diagnostic Data
Theta: Angle between ultrasonic path and ow vector.
Path length: Length of acoustic path. Depends on pipe
size and on chosen installation mode of transducers.
(Delay): Represents the time when the measuring
window starts.
Sensor distance: Distance between the two transducers.
Bar index: Mounting positions when using spacer bar.
Gain: The required amplication (gain) of the signals
is automatically set continuously. 0 represents no
amplication (not applicable) while 255 represents the
maximum amplication. The lower the gain the better
the signal transmission. Very high gain might indicate
a disturbed signal (gas, particles, wrong mounting).
dT Corr: Time shift of signals created by zero setting.
Quality: The quality parameter represents the “thor-
oughness” of the internal lter. Filter means that QStar
UFM checks each signal if plausible or not using the
quality parameter. When choosing quality 0, there will
be no ltering. That means that each signal is used for
measurement even the bad (and maybe wrong) ones.
Filtering of 100 would mean that ltering is very strict.
Both values ( 0/100) are not recommended. Typical
values are 50-75. When not getting measurement it
might be useful to set quality lower (for example, set
to 20).
Diagnostic Menu 3:
52
Page 53

Menu 3: Diagnostic Data
T1/T2 (raw): Signal run times along complete signal
path including pipe wall and transducer enclosure.
dt (raw): Measured time difference of T1/T2 (raw).
XDCR (DCR=Transducer): Signal run time within
transducer.
Pipe delay: Signal run time within pipe wall.
qp: Compensation factor considering changes in
temperature (and therefore changes in speed of sound
of uid).
Coating delay: Delay in signal run time generated by
coating (if applicable).
Lambda Corr.: Delay can be manually edited (not
recommended, only for maintenance) by multiples of
wave length of signal.
Delay Corr: Shows Lambda Corr in seconds.
SOFTWARE UPDATE
Check software version
Before making any software update, check version of
software.
Switch off transmitter and restart it. During “start” locate
the version at the bottom of start screen (see arrow).
Note this value.
Consult GPI/website for latest revision levels. If you are
using an earlier version, contact GPI for updates and
procedures.
53
Page 54

FLUID PROPERTIES
SPEED OF WATER
° C V in/s
0 1403
1 1408
2 1413
3 1417
4 1422
5 1427
6 1431
7 1435
8 1439
9 1444
10 1448
11 1452
12 1455
13 1459
14 1463
15 1466
16 1470
17 1473
18 1476
19 1480
20 1483
° C V in/s
21 1486
22 1489
23 1492
24 1494
25 1497
26 1500
27 1502
28 1505
29 1507
30 1509
31 1512
32 1514
33 1516
34 1518
35 1520
36 1522
37 1524
38 1526
39 1527
40 1529
41 1531
° C V in/s
42 1532
43 1534
44 1535
45 1537
46 1538
47 1539
48 1541
49 1542
50 1543
51 1544
52 1545
53 1546
54 1547
55 1548
56 1549
57 1549
58 1550
59 1551
60 1551
61 1552
62 1552
° C V in/s
63 1553
64 1553
65 1554
66 1554
67 1554
68 1555
69 1555
70 1555
71 1555
72 1555
73 1555
74 1555
75 1555
76 1555
77 1555
78 1555
79 1555
80 1555
81 1555
82 1554
83 1554
° C V in/s
84 1554
85 1553
86 1553
87 1552
88 1552
89 1551
90 1551
91 1550
92 154958
93 1549
94 1548
95 1548
96 1547
97 1546
98 1545
99 1544
100 1543
° F V in/s
32 55226
33.8 55422
35.6 55613
37.4 55800
39.2 55983
41 56161
42.8 56335
44.6 56506
46.4 56672
48.2 56834
50 56992
51.8 57146
53.6 57297
55.4 57444
57.2 57587
59 57726
60.8 57862
62.6 57995
64.4 58124
66.2 58250
68 58372
° F V in/s
69.8 58492
71.6 58607
73.4 58720
75.2 58830
77 58937
78.8 59041
80.6 59142
82.4 59239
84.2 59335
86 59427
87.8 59516
89.6 59603
91.4 59687
93.2 59769
95 59847
96.8 59924
98.6 59997
100.4 60069
102.2 60137
104 60204
105.8 60268
° F V in/s
107.6 60330
109.4 60389
111. 2 60446
113 60501
114.8 60554
116.6 60604
118.4 60652
120.2 60698
122 60743
123.8 60785
125.6 60825
127.4 60863
129.2 60899
131 60933
132.8 60965
134.6 60995
136.4 61024
138.2 61050
140 61075
141.8 61098
143.6 61119
° F V in/s
145.4 61138
147.2 61156
149 61172
150.8 61185
152.6 61198
154.4 61209
156.2 61218
158 61225
159.8 61231
161.6 61235
163.4 61238
165.2 61239
167 61238
168.8 61236
170.6 61233
172.4 61228
174.2 61221
176 61213
177.8 61204
179.6 61193
181.4 61180
° F V in/s
183.2 61167
185 61152
186.8 61135
188.6 61117
190.4 61098
192.2 61077
194 61055
195.8 61031
197.6 6100709
199.4 60981
201.2 60954
203 60925
204.8 60896
206.6 60865
208.4 60832
210.2 60799
212 60764
54
Page 55

FLUID PROPERTIES (Continued)
DYNAMIC VISCOSITY
LIQUID ° F V in/s ° C pg/cm³ V m/s V (x10-6m2/s)
Acetone 68.00 46850 20 0.7905 1190 0.407
Aniline 68.00 65315 20 1.0216 1659 1762
Ether 68.00 39606 20 0.7135 1006 0.336
Ethylene glycol 68.00 65591 20 1.1131 1666 21.112
Chloroform 68.00 39409 20 1.4870 1001 0.383
Glycerin 68.00 75709 20 1.2613 1923 1188.5
Acetic acid 68.00 45630 20 1.0495 1159 1.162
Methyl acetate 68.00 46496 20 0.928 1181 0.411
Ethyl acetate 68.00 45827 20 0.900 1164 0.499
Heavy water 68.00 54646 20 1.1053 1388 1.129
Carbon tetrachloride 68.00 36929 20 1.5942 938 0.608
Mercury 68.00 57126 20 13.5955 1451 0.114
Nitrobenzene 68.00 57992 20 1.207 1473 1.665
Carbon disulde 68.00 45591 20 1.2634 1158 0.290
n-pentane 68.00 40630 20 0.6260 1032 0.366
n-hexane 68.00 42638 20 0.654 1083 0.489
Spindle oil 89.60 52126 32 0.905 1324 15.7
Gasoline 93.20 49213 34 0.803 1250 0.4 to 0.5
Water 56.30 57480 13,5 1. 1460 1.004(20°C)
SPEED OF SOUND OF
PIPE MATERIALS
Material V m/s V in/s
Iron 3230 127165
Steel 3206 126220
Ductile cast
iron
Cast iron 2460 96850
Stainless
steel
Copper 2260 88976
Lead 2170 85433
Aluminum 3080 121260
Brass 2050 80709
VinyIchIoride 2640 103937
Acrylics 2644 104094
FRP 2505 98622
Mortar 2500 98425
Tar epoxy 2505 98622
Potyethylene 1900 74803
Teon 1240 48819
3000 118110
3206 126220
SPEED OF SOUND SUBJECT TO CHANGE OF TEMPERATURE IN WATER
LIQUID ° C ° F pg/cm³ V m/s V in/s
Acetone 20 68 0.7905 1190 46850
Aniline 20 68 1.0216 1659 65315
Alcohol 20 68 0.7893 1168 45984
Ether 20 68 0.7135 1006 39606
Ethylene glycol 20 68 1.1131 1666 65591
n-octane 20 68 0.7021 1192 46929
o-xylene 20 68 0.871 1360 53543
Chloroform 20 68 1.4870 1001 39409
Chlorobenzene 20 68 1.1042 1289 50748
Glycerin 20 68 1.2613 1923 75709
Acetic acid 20 68 1.0495 1159 45630
Methyl acetate 20 68 0.928 1181 46496
Ethyl acetate 20 68 0.900 1164 45827
Cyclohexane 20 68 0.779 1284 50551
Dithionic acid 20 68 1.033 1389 54685
Heavy water 20 68 1.1053 1388 54646
LIQUID ° C ° F pg/cm³ V m/s V in/s
Carbon tetrachloride 20 68 1.5942 938 36929
Mercury 20 68 13.5955 1451 57126
Nitrobenzene 20 68 1.207 1473 57992
Carbon disulde 20 68 1.2634 1158 45591
Chloroform 20 68 2.8904 931 36654
n-propyl alcohol 20 68 0.8045 1225 48228
n-pentane 20 68 0.6260 1032 40630
n-hexane 20 68 0.654 1083 42638
Light oil 25 77 0.81 1324 52126
Transformer oil 32.5 91 0.859 1425 56102
Spindle oil 32 90 0.905 1342 52835
Petroleum 34 93 0.825 1295 50984
Gasoline 34 93 0.803 1250 49213
Water 13.5 56 1. 1460 57480
Sea water
(salinity: 3.5%)
16 61 1. 1510 59449
55
Page 56

SPECIFICATIONS QSTAR PORTABLE QSTAR FIXED
Operation: Intuitive via 8 main keys (Soft Keys), plain text display
Languages: English, Spanish and French
Units: Metric/US
Outputs:
Inputs: 2x PT100
Integrated Data Logger: 2 GB N/A
Data Logged: Measurement and totalizers N/A
Data Format: Can be exported into standard ofce programs N/A
Memory Cycle: Adjustable, 1 second to 24 hours N/A
Power Supply:
Protection Class: IP40 IP65, Ex
Housing: Aluminium, PVC PVC, wall-mounted
Dimensions: 10.4 x 7.5 x 2.7 in. 10.2 x 9.4 x 4.7 in.
Operating Temp: -4° F to 140° F
Transducer Temp: -40° F to 300° F
Weight: 3.3 lbs 2.9 lbs
Display: QVGA (320x240), black and white, adjustable backlighting
Carrying Case 20 x 16 x 16 N/A
2x 4-20 mA, 1x Relay, 1x MicroUSB
1x Pulse
Integrated rechargeable battery and 110V AC adapter 85-264VAC, 18-36VDC (opt.)
Battery Duration: Approximately 5 hours Power Consumption: 10 W
2x 4-20 mA, 1x Pulse, 1x MicroUSB
1x Relay, RS232 (opt.)
MEASUREMENT
Principle: Ultrasonic transit time difference with AFC technology
Values Meas: Flow, ow speed, heat ow
Totalizers: Heat quantity, volume
Meas. Range: +/- 98 ft/s
Signal Damping: 0 - 100 sec (adjustable)
Acoustic velocity, signal strength, SNR, signal quality,
Diagnostic Functions:
MODEL
NO. DESCRIPTION
QME05 Ultrasonic Flowmeter (ENERGY-FIXED, .5 MHz) 8" to 240"
QME10 Ultrasonic Flowmeter (ENERGY-FIXED, 1 MHz) 1.5" to 16"
QME20 Ultrasonic Flowmeter (ENERGY-FIXED, 2 MHz) .5" to 4"
QMF05 Ultrasonic Flowmeter (FIXED, .5 MHz) 8" to 240"
QMF10 Ultrasonic Flowmeter (FIXED, 1 MHz) 1.5" to 16"
QMF20 Ultrasonic Flowmeter (FIXED, 2 MHz) .5" to 4"
amplitude, energy
Oscilloscope function allows graphical display and
analysis of signals.
PIPE
SIZES
(Above include temperature sensors)
MEASUREMENT ACCURACY
Inner Diameter Ø
.39 - .98 in.
.98-1.97 in.
1.97-11.81 in.
11.81-236.22 in.
Repeatability for majority of applications is <0.2%
MODEL
NO. DESCRIPTION
QMP05 Ultrasonic Flowmeter (PORTABLE, .5 MHz) 8" to 240"
QMP10 Ultrasonic Flowmeter (PORTABLE, 1 MHz) 1.5" to 16"
QMP20 Ultrasonic Flowmeter (PORTABLE, 2 MHz) .5" to 4"
QMF-PT100 Temperature Sensor Kit, FIXED (16 FT)
QMP-PT100 Temperature Sensor Kit, PORTABLE (16 FT)
Pipe Wall Thickness Gauge
Range Deviation
6.56-98.42 ft/s 2.5% of reading
0-6.56 ft/s ± 0.16 ft/s
6.56-98.42 ft/s 1.5% of reading
0-6.56 ft/s ± 0.10 ft/s
6.56-98.42 ft/s 1% of reading
0-6.56 ft/s ± 0.07 ft/s
3.28-98.42 ft/s 1% of reading
0-3.28 ft/s ± 0.03 ft/s
PIPE
SIZES
56
Page 57

Page 58

Page 59

Page 60

Limited Warranty Policy
Great Plains Industries, Inc. 5252 E. 36th Street North, Wichita, KS USA 67220-3205, hereby provides a limited warranty against
defects in material and workmanship on all products manufactured by Great Plains Industries, Inc. This product includes a 1 year
warranty. Manufacturer’s sole obligation under the foregoing warranties will be limited to either, at Manufacturer’s option, replacing or
repairing defective Goods (subject to limitations hereinafter provided) or refunding the purchase price for such Goods theretofore paid
by the Buyer, and Buyer’s exclusive remedy for breach of any such warranties will be enforcement of such obligations of Manufacturer.
The warranty shall extend to the purchaser of this product and to any person to whom such product is transferred during the warranty
period.
The warranty period shall begin on the date of manufacture or on the date of purchase with an original sales receipt. This warranty
shall not apply if:
A. the product has been altered or modied outside the warrantor’s duly appointed representative;
B. the product has been subjected to neglect, misuse, abuse or damage or has been installed or operated other than in accor-
dance with the manufacturer’s operating instructions.
To make a claim against this warranty, contact the GPI Customer Service Department at 316-686-7361 or 888-996-3837. Or by mail at:
The company shall, notify the customer to either send the product, transportation prepaid, to the company at its ofce in Wichita,
Kansas, or to a duly authorized service center. The company shall perform all obligations imposed on it by the terms of this warranty
within 60 days of receipt of the defective product.
GREAT PLAINS INDUSTRIES, INC., EXCLUDES LIABILITY UNDER THIS WARRANTY FOR DIRECT, INDIRECT, INCIDENTAL
AND CONSEQUENTIAL DAMAGES INCURRED IN THE USE OR LOSS OF USE OF THE PRODUCT WARRANTED HEREUNDER.
The company herewith expressly disclaims any warranty of merchantability or tness for any particular purpose other than for which
it was designed.
This warranty gives you specic rights and you may also have other rights which vary from U.S. state to U.S. state.
Note: In compliance with MAGNUSON MOSS CONSUMER WARRANTY ACT – Part 702 (governs the resale availability of the war-
ranty terms).
Great Plains Industries, Inc.
5252 E. 36
Wichita, KS, USA 67220-3205
th
St. North
©2013 by GREAT PLAINS INDUSTRIES, INC., Wichita, KS
Printed in U.S.A.
5252 East 36th Street North
Wichita, KS USA 67220-3205
316-686-7361 | FAX: 316-686-6746
888-996-3837 |
www.GPImeters.net
920222-0105/13
 Loading...