

Page 1

2.7GHz Spectrum Analyzer
Model: GSP-827
Operation Manual
GW Part No. 82SP-82700MA
Page 2
EC Declaration of Conformity
We
GOOD WILL INSTRUMENT CO., LTD.
No. 95-11, Pao-Chung Rd., Hsin-Tien City, Taipei Hsien, Taiwan
GOOD WILL INSTRUMENT (SUZHOU) CO., LTD.
No. 69, Lushan Road, Suzhou New District Jiangsu, China
declares that the below mentioned product
GSP-827
is herewith confirmed to comply with the requirements set out in the Council
Directive on the Approximation of the Law of Member States relating to
Electromagnetic Compatibility (89/336/EEC, 92/31/EEC, 93/68/EEC) and Low
Voltage Equipment Directive (73/23/EEC, 93/68/EEC). For the evaluation
regarding the Electromagnetic Compatibility and Low Voltage Equipment
Directive, the following standards were applied:
◎ EMC
EN 61326-1: Electrical equipment for measurement, control and laboratory
use –– EMC requirements (1997+A1: 1998+A2: 2001)
Conducted and Radiated
Emissions
EN 55011: 1998 class A
Current Harmonic
EN 61000-3-2: 2000
Voltage Fluctuation
EN 61000-3-3: 1995
-------------------------
-------------------------
-------------------------
-------------------------
◎ Safety
Low Voltage Equipment Directive 73/23/EEC & amended by 93/68/EEC
Safety Requirements
EN 61010-1: 2001
IEC 61010-1: 2001
Electrostatic Discharge
EN 61000-4-2: 1995+A1:1998
Radiated Immunity
EN 61000-4-3: 1996+A1:1998
Electrical Fast Transients
EN 61000-4-4: 1995
Surge Immunity
EN 61000-4-5: 1995
Conducted Susceptibility
EN 61000-4-6: 1996
Power Frequency Magnetic Field
EN 61000-4-8 : 1993
Voltage Dips/ Interrupts
EN 61000-4-11: 1994
Page 3

2.7GHz Spectrum Analyzer Operation Manual
Table of Contents Pages
1.0 GENERAL DESCRIPTION AND FEATURES ........................................................................................................ 3
2.0 USAGE PRECAUTIONS AND RECOMMENDATIONS .......................................................................................4
3.0 PRODUCT OPTION INFORMATION ...................................................................................................................... 8
4.0 FIRST TIME USE.......................................................................................................................................................... 9
4.1 INTERNAL CALIBRATION SIGNAL .................................................................................................................9
4.2 INSTALL AND UNINSTALL THE BATTERY .................................................................................................10
5.0 PANEL DESCRIPTION ............................................................................................................................................. 11
5.1 FRONT PANEL DESCRIPTION ...................................................................................................................................11
5.2 REAR PANEL DESCRIPTIONS ...................................................................................................................................13
6.0 QUICK USE GUIDE ................................................................................................................................................... 15
6.1 GENERAL DESCRIPTION ..........................................................................................................................................15
6.2 GUIDE .....................................................................................................................................................................15
6.2.1 FIND THE SIGNAL .................................................................................................................................................15
6.2.2 FIND PEAK SIGNAL............................................................................................................................................... 15
6.2.3 TRACK PEAK SIGNAL ........................................................................................................................................... 16
6.2.4 MAKE CORRECT AMPLITUDE MEASUREMENT .......................................................................................................16
6.2.5 75Ω SYSTEM MEASUREMENT ...............................................................................................................................16
6.2.6 MULTI-MARKER OPERATION ................................................................................................................................16
6.2.7 DELTA-MARKER OPERATION ............................................................................................................................... 17
6.2.8 PEAK HOLD, AVERAGE AND FREEZE THE MEASUREMENT .................................................................................... 17
6.2.9 ACPR MEASUREMENT.........................................................................................................................................17
6.2.10 OCBW MEASUREMENT .....................................................................................................................................18
6.2.11 PASS/FAIL TEST BY LIMIT LINE ..........................................................................................................................18
6.2.12 EDIT THE LIMIT LINE, ........................................................................................................................................ 19
6.2.13 CHANGE RBW, VBW AND SWEEP TIME ............................................................................................................ 19
6.2.14 TRIGGER BY INPUT SIGNAL LEVEL ......................................................................................................................19
6.2.15 TRIGGER BY EXTERNALLY STIMULUS SIGNAL ....................................................................................................20
6.2.16 OBSERVE TWO SWEEPS (EX, 2
6.2.17 CONFIGURE DISPLAY SETTING ...........................................................................................................................20
6.2.18 SAVE MEASUREMENT/SETUP TO MEMORY .........................................................................................................21
6.2.19 RECALL TRACE/SETUP TO MEMORY ...................................................................................................................21
6.2.20 TURN ON/OFF THE INTERNAL CALIBRATION SIGNAL ........................................................................................21
ND
HARMONIC) BY DUAL WINDOWS......................................................................20
1
Page 4

2.7GHz Spectrum Analyzer Operation Manual
6.2.21 CALENDAR/CLOCK SETTING ..............................................................................................................................21
6.2.22 PRESET SYSTEM .................................................................................................................................................22
6.2.23 SYSTEM INFORMATION....................................................................................................................................... 22
6.2.24 SYNCHRONIZED BY EXTERNAL REFERENCE SIGNAL ..........................................................................................23
6.2.25 SYNCHRONIZE OTHER EQUIPMENTS.................................................................................................................... 23
6.2.26 TRACKING GENERATOR OPERATION (OPTION)...................................................................................................23
7.0 MENU TREE................................................................................................................................................................24
7.1 MAIN FUNCTION .....................................................................................................................................................24
7.2 MEASUREMENT FUNCTION ..................................................................................................................................... 25
7.3 CONTROL FUNCTION...............................................................................................................................................27
7.4 STATE FUNCTION .................................................................................................................................................... 28
8.0 OPERATION................................................................................................................................................................ 31
8.1 MAIN FUNCTIONS ...................................................................................................................................................31
8.1.1 FREQUENCY FUNCTIONS ......................................................................................................................................31
8.1.2 SPAN FUNCTIONS .................................................................................................................................................36
8.1.3 AMPLITUDE.......................................................................................................................................................... 39
8.2 MEASUREMENT FUNCTIONS....................................................................................................................................43
8.2.1 MARKER .............................................................................................................................................................. 43
8.2.2 PEAK SEARCH ...................................................................................................................................................... 52
8.2.3 TRACE.................................................................................................................................................................. 57
8.2.4 PWR MEASUREMENT............................................................................................................................................61
8.2.5 LIMIT LINE...........................................................................................................................................................68
8.3 CONTROL FUNCTIONS .............................................................................................................................................72
8.3.1 BW ...................................................................................................................................................................... 72
8.3.2 TRIGGER .............................................................................................................................................................. 74
8.3.3 DISPLAY FUNCTIONS ...........................................................................................................................................77
8.3.3 DISPLAY FUNCTIONS ...........................................................................................................................................78
8.3.4 SAVE/RECALL ...................................................................................................................................................... 80
8.4 STATE FUNCTIONS .................................................................................................................................................. 82
8.4.1 CALIBRATION ...................................................................................................................................................... 82
8.4.2 SYSTEM................................................................................................................................................................ 83
8.4.3 OPTION ................................................................................................................................................................ 87
8.4 POWER CONTROL.................................................................................................................................................... 92
8.5 DIAGNOSIS INFORMATION ON THE DISPLAY............................................................................................................92
9.0 SPECIFICATION…………………………………………………………………………………………………...
94
2
Page 5

2.7GHz Spectrum Analyzer Operation Manual
1.0 General Description and Features
The GSP-827 is designed with the features as follows.
Synthesized-based design covering the frequency from 9kHz to 2.7GHz.
Low noise design: -140dBm/Hz noise floor.
4.5kg light weight and compact size.
100 traces and setup memories.
ACPR, OCBW, CHBW of power measurement.
11 ranges of external reference clock (64k~19.2M).
10 Markers with Peak, Peak Track, ΔMarker, Marker to Center functions.
External and Video Level Trigger with single and continuous modes.
Limit Line and Pass/Fail functions for quickly qualification test.
Spilt Windows extend the measurement flexibility.
Trace functions including Peak Hold, Average and Freeze.
Optional Tracking Generator provides frequency response measurement in one sweep.
Optional filters and Quasi- Peak detection provide EMI test.
GPIB and RS232 interface for ATE applications.
AC/DC dual modes power supply and Battery Operations.
The fully synthesized-based and low noise designs offer the high RF performance in
measurement. The plentiful measurement functions like 10 markers, traces, power
measurement, limit line, dual display and trigger make measurement more easily and quickly.
The 100 memories, real time calendar and battery operation realize the true portability. 11
ranges of external reference clock offer the synchronization capability to many telecom
standards. The optional Tracking Generator offers the frequency response test with the same
frequency band. The GPIB and RS232 interfaces allow the connection between the unit and
PC. Users can develop their own applications software. DC 12V power supply allows user to
carry this unit to drive around for frequency monitoring. Chargeable battery pack can support
the operation without power cord for 4 hours. With the carrying case, this unit is easy to carry
and operate in the filed service. 9k and 120k EMI filter and quasi-peak detector can perform
the EMC test. AM/FM Demodulation provides the demodulated outputs through both
headphone and speaker. Kit sets of connector adaptor offers the convenience under different
measurement conditions.
This unit offers the right combination of highly RF performance, plentiful function, easily
operated user interface and complete options to facilitate measurement in a wide range of
application in laboratory as well as in field service usage. This is another example of our
dedication to engineering excellence.
3
Page 6
2.7GHz Spectrum Analyzer Operation Manual
2.0 Usage Precautions and Recommendations
The following precautions are recommended to insure your safety and provide the best
condition of GSP-827.
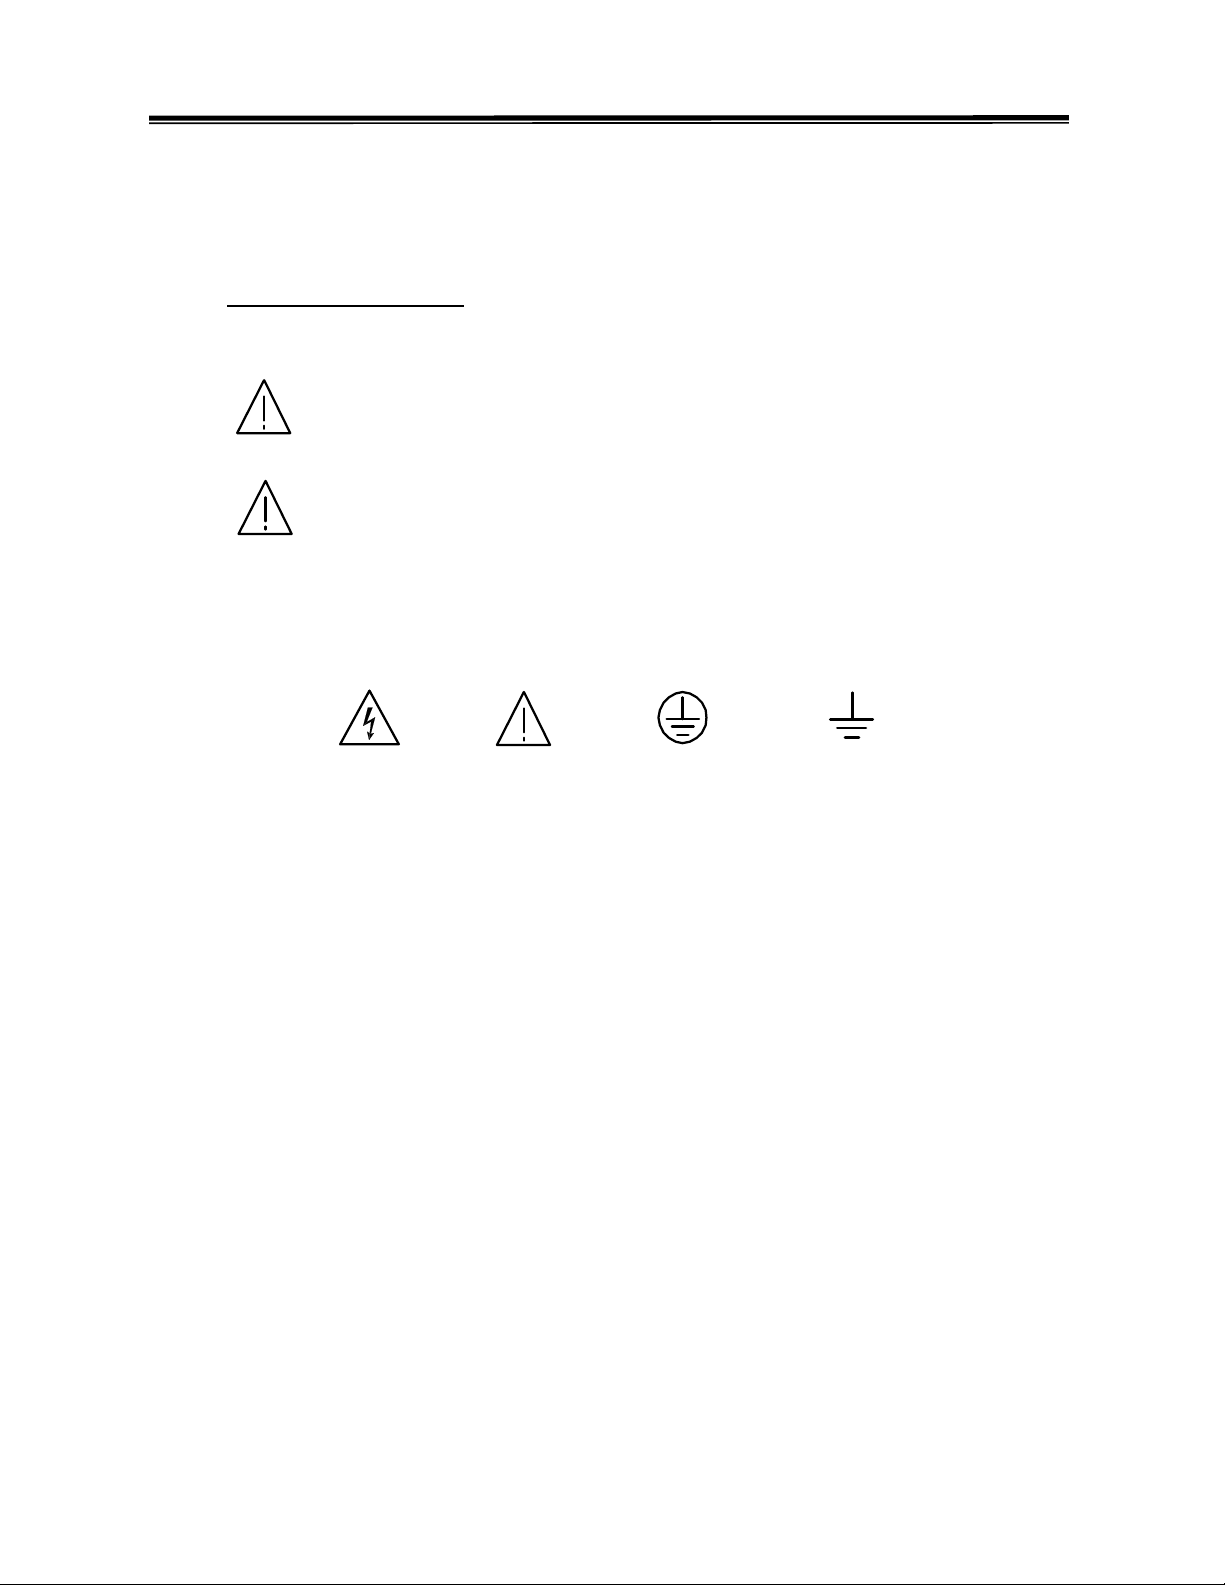
Safety Term and System
These terms may appear in this manual or on the product:
WARNING: Warning statements identify condition or practices that could result
in injury or loss of life
CAUTION: Caution statements identify conditions or practices that could
result in damage to this product or other property.
The following symbols may appear in this manual or on the product:
DANGER
ATTENTION
High Voltage refer to
Manual
Protective Earth (ground)
Conductor
Terminal
Terminal
4
Page 7
2.7GHz Spectrum Analyzer Operation Manual
FOR UNITED KINGDOM ONLY
NOTE: This lead / appliance must only be wired by competent persons
WARNING: THIS APPLIANCE MUST BE EARTHED
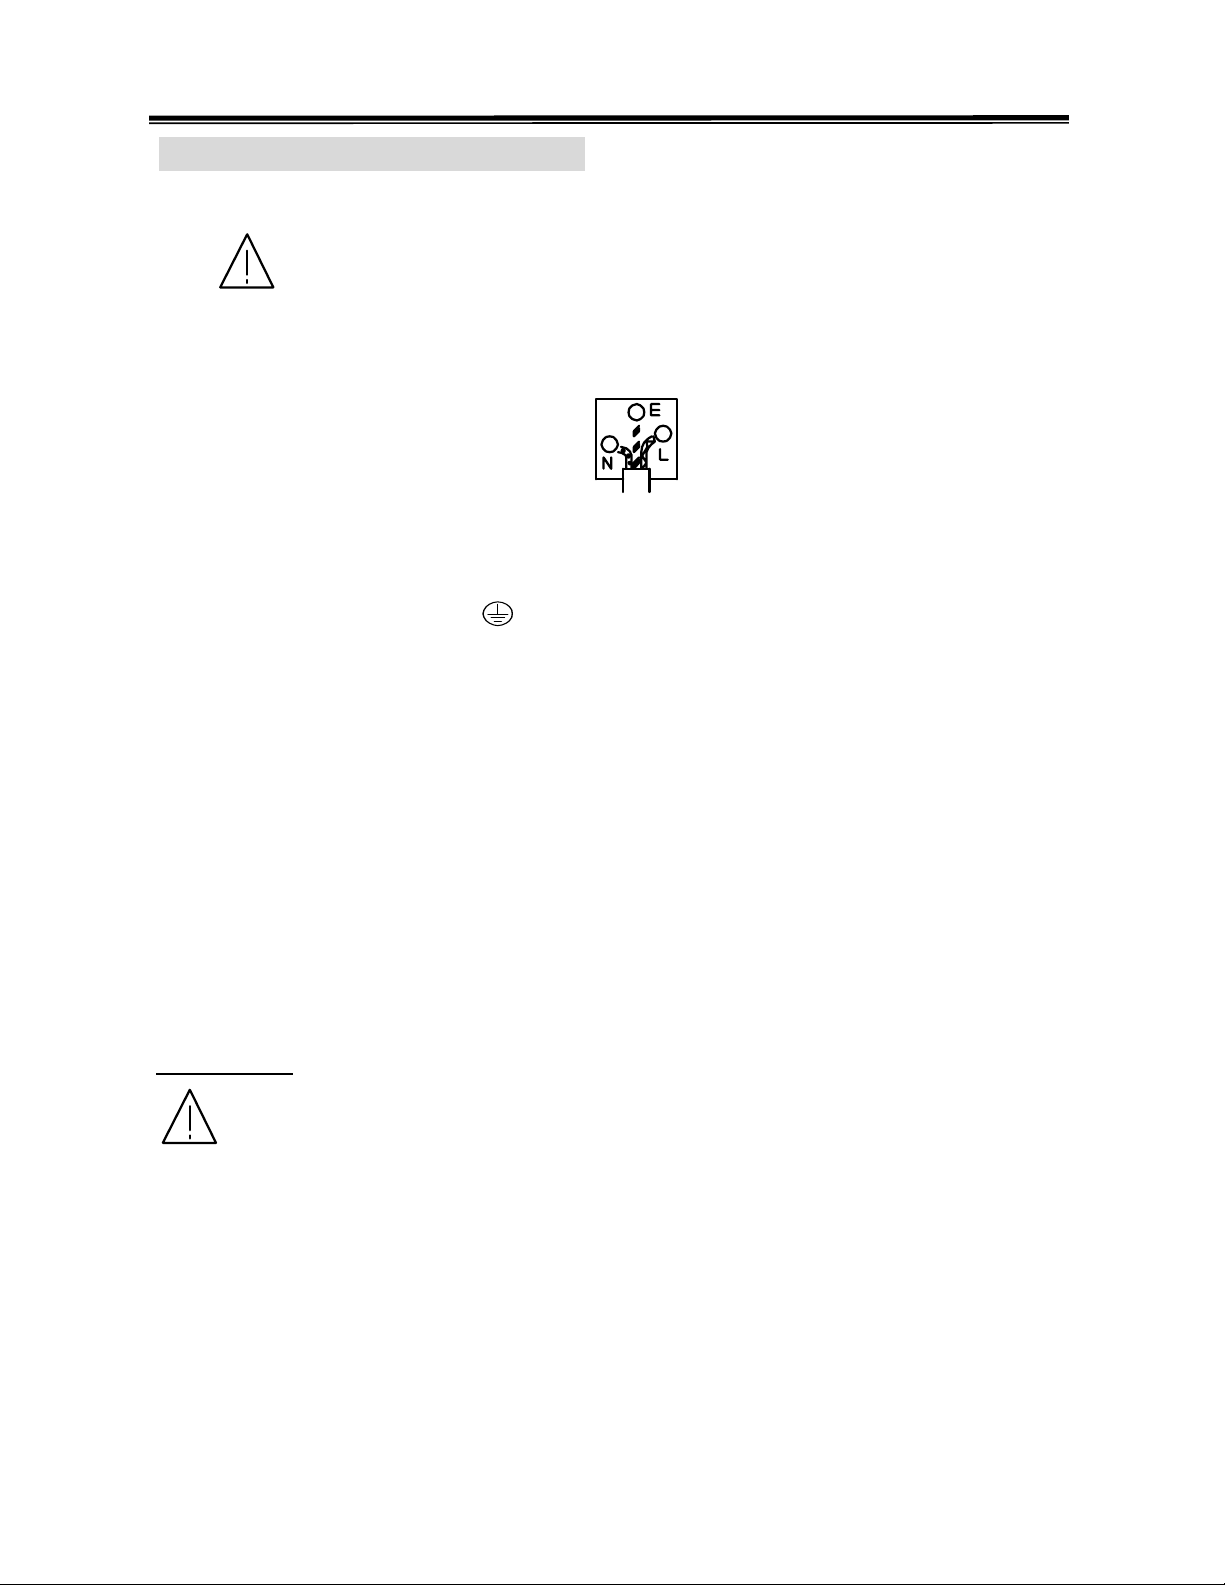
IMPORTANT: The wires in this lead are coloured in accordance with the following code:
Green/ Yellow: Earth
Blue: Neutral
Brown: Live (Phase)
As the colours of the wires in main leads may not correspond with the colours marking identified in
your plug/appliance, proceed as follows:
The wire which is coloured Green & Yellow must be connected to the Earth terminal marked with
the letter E or by the earth symbol
The wire which is coloured Blue must be connected to the terminal which is marked with the letter
N or coloured Blue or Black.
The wire which is coloured Brown must be connected to the terminal marked with the letter L or P
or coloured Brown or Red.
If in doubt, consult the instructions provided with the equipment or contact the supplier.
This cable/appliance should be protected by a suitably rated and approved HBC mains fuse: refer to
the rating information on the equipment and/or user instructions for details. As a guide, cable of
0.75mm
2
should be protected by a 3A or 5A fuse. Larger conductors would normally require 13A
types, depending on the connection method used.
Any moulded mains connector that requires removal /replacement must be destroyed by removal of
any fuse & fuse carrier and disposed of immediately, as a plug with bared wires is hazardous if a
engaged in live socket. Any re-wiring must be carried out in accordance with the information
detailed on this lable.
Use and Wear
or coloured Green or Green & Yellow.
CAUTION
• Do not exceed +30 dBm into the RF INPUT or +30 dBm reverse power into the TG OUTPUT.
• Do not place any heavy object on the instrument.
• Avoid severe impacts or rough handling that could damage the GSP-827.
• Use electrostatic discharge precautions while handling and making connections to the GSP-827.
• Do not place wires into the connectors of the GSP-827, only mating connectors and adapters.
• Do not block or obstruct cooling fan vent opening on side panels or on the rear panel of unit.
• This equipment is not for measurements performed for CAT II, III, and IV.
5
Page 8
2.7GHz Spectrum Analyzer Operation Manual
1) Disassembly of the Instrument
• Do not disassemble the instrument; refer the instrument to a factory approved service facility
only.
2) AC Power Input
CAUTION
• AC input should be within the range of selected line voltage ± 10%.
• Insure the correct fuse is installed prior to applying voltage for the first time:
90 V ~ 132 VAC input : T 1A / 250V
198 ~ 250 VAC input : T0.5A / 250V
• Check the line voltage setting on the rear panel. If the line voltage does not match input voltage,
change as follows:
a) Remove AC Power Cord;
b) Open cover of AC socket with flat blade screwdriver;
c) Remove selector Cam Drum and rotate to the correct voltage selection
d) Replace Cam Drum.
3) Grounding
WARNING
• To avoid electrical shock, the power cord protective grounding conductor must be connected to
earth ground.
4) Fuse Replacement
WARNING
• For continued fire protection, replace the fuse with the specified type and rating only.
• Disconnect power cord before replacing fuse.
• If the fuse is blown, there is something wrong with the instrument. Repair the cause of fault
before replacing fuse.
5) Cleaning
• Disconnect AC Power Cord from the instrument before cleaning.
• Use a soft cloth dampened in a solution of mild detergent and water. Do not spray any liquid
into the unit.
• Do not use chemicals or cleaners containing benzene, toluene, xylene, acetone or other harsh
chemicals.
6
Page 9

2.7GHz Spectrum Analyzer Operation Manual
6) Operating Environment
• The following conditions are recommended for optimum use of the instrument:
Indoor Use Altitude < 2000 m Temperature 18° to 28° C Relative Humidity < 90%
Dust Free No direct sunlight No strong magnetic fields
• Installation Category: II
• Pollution degree: 2
7) Storage Environment
• The following conditions are recommended for optimum storage of the instrument -
Indoor Temperature 0° to 40° C Relative Humidity < 85%
7
Page 10

2.7GHz Spectrum Analyzer Operation Manual
3.0 Product Option information
Ordering
information
Description
GSP-827 Spectrum Analyzer, 9k~2.7GHz
Option 01 Tracking Generator, 9k ~ 2.7GHz
AC/DC/Battery operation power supply with battery pack
Option 02
Option 03
90 ~ 260 VAC, 12VDC and Battery operation triple mode Power supply.
Battery : Li-Ion x 2. Chargeable with AC line.
(1)
Medium stability Time base
Temperature: ±1ppm
Aging: ±1ppm/yr
Option 06 GPIB Interface
Option 07 GSC-001: Soft Carrying case
General kit Set
Option 08
Option 09
Option 10
Option 11
ADP-002: SMA (J/F) to N (P/M) adaptor
ATN-100: 10dB Attenuator
GTL-303: RF Cable assembly ( RD316 + SMA (P)
GSC-002: Kit box
CATV kit set
ADP-001: BNC (J/F) to N (P/M) adaptor
ADP-101: BNC (P/M) 50Ω to BNC (J/F) 75Ω adaptor
GTL-302: RF Cable assembly ( RG223 + N(P) x2, 30cm )
GSC-003: Kit box
RLB kit set
GAK-001: Cal. Kit, termination, N, 50Ω
GAK-002: Cap with chain
GTL-302: RF Cable assembly ( RG223 + N (P)
GSC-004: Kit box
×1
×1
×1
× 1
× 1
GTL-401: DC Power line
× 2
×2, 60m ) ×2
× 2
× 2
×2
× 1
×2, 30cm ) ×2
Note (1): The Battery Pack works and be charged with AC line only the DC/AC dual mode power
supply is installed. It is not charged at DC operation. It is charged under both power ON
and Standby modes.
8
Page 11
2.7GHz Spectrum Analyzer Operation Manual
4.0 First Time Use
The following text assumes that the SAFETY section of this manual has been read carefully
and understood.
Each time before the instrument is operated, make sure that it is connected to protective earth.
Before establish the connection and measurement, check if the device under test is connected
to protective earth as well.
Since the RF measurement is very sensitive, clean connectors on the front panel is very
important for the accurate measurement. Regularly cleaning up the connector is strongly
recommended.
The main power switch is located on the rear side. Switch it on to activate the Standby mode
and the power indicator on the front panel is on with red light. Push and hold the “STBY”
button for 2~3 seconds to turn on the unit. The power indicator will turn into green. Pushing
and holding the same button turns the unit to standby mode. When the unit is turned into
standby or off, the last setting is stored and recalled when it is turned on again.
4.1 Internal calibration signal
A 100MHz -30dBm calibration signal is built-in for internal calibration. Turn it on and off by
the following function keys.
Sysetm : Push System key.
F3 : Push F1 key to switch the internal calibration signal ON/OFF
.
It is not a well-filtered signal. When the unit is turned on, if 100MHz and harmonics appear on
the display, check this signal is ON or OFF first.
9
Page 12
(2)
(3)
(1)
2.7GHz Spectrum Analyzer Operation Manual
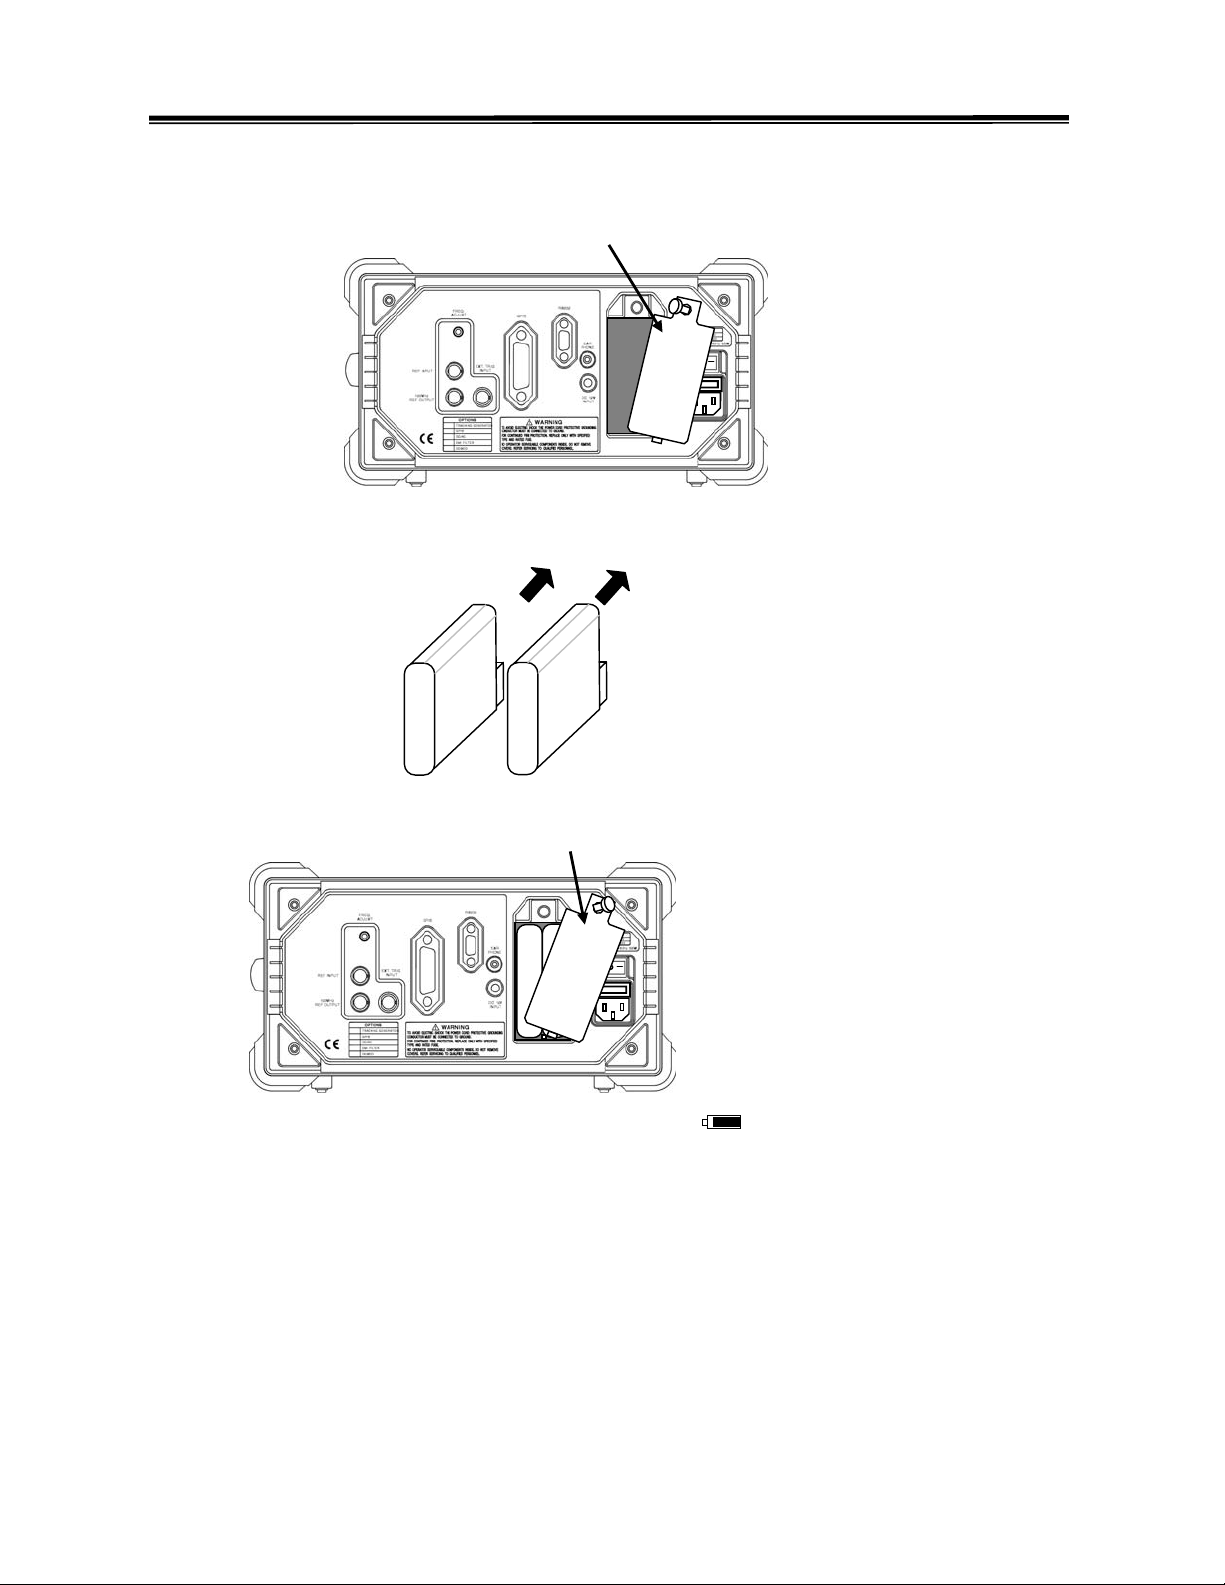
4.2 Install and Uninstall the Battery
Remove the cover
Slide in the batteries
Lock up the cover back
When the battery pack is correctly installed and in use, a symbol will show up at the top of display.
10
Page 13
2.7GHz Spectrum Analyzer Operation Manual
5.0 Panel Description
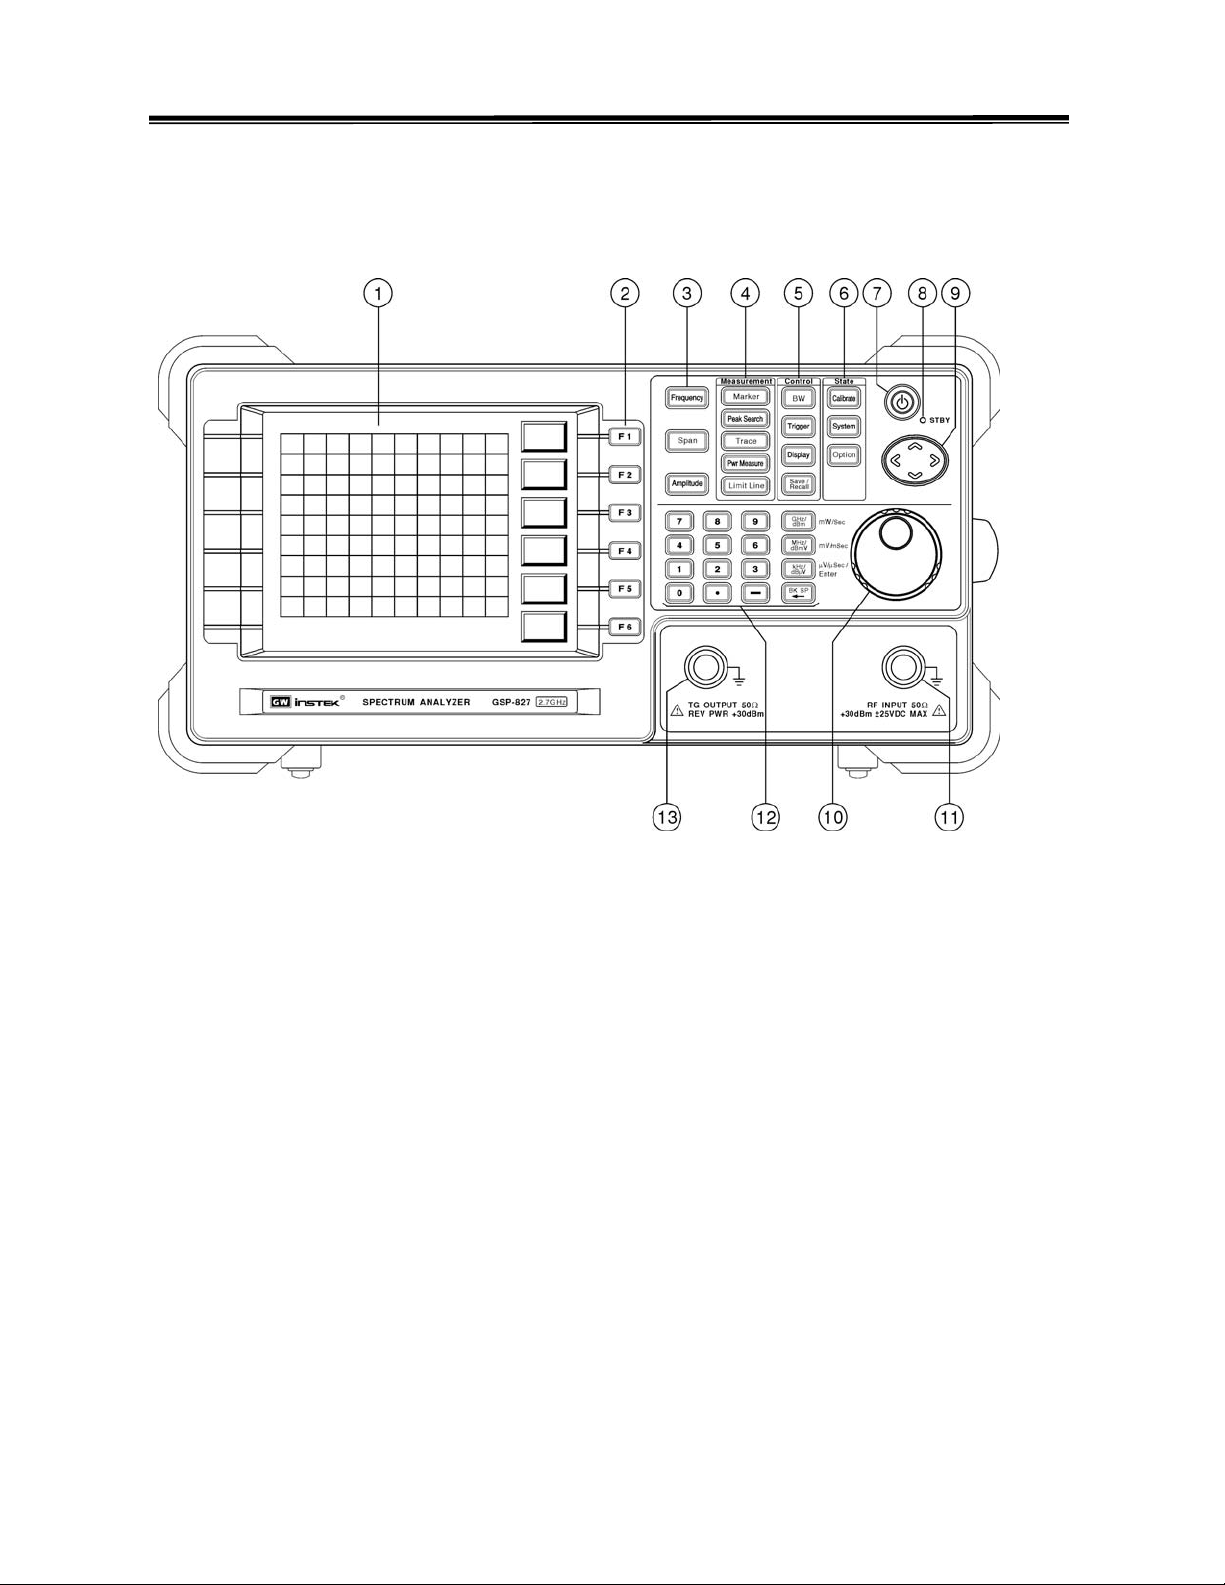
5.1 Front Panel Description
11
Page 14
2.7GHz Spectrum Analyzer Operation Manual
Item Description
1 LCD A 640×480 resolution and monochrome LCD. The Backlight
can be switched ON/OFF and Contract is adjustable. See
Display function.
2 F1-F6 Soft key linked to the other function keys on the panel.
3 Main
Functions
4 Measurement
Keys
Including Frequency, Span and Amplitude the most popular
keys.
Measurement groups including Marker, Peak Search, Trace,
Power Measurement and Limit Line.
5 Control Keys Control function groups including BW, Trigger, Display and
Save/Recall, the BW including RBW, VBW and Sweep Time.
6 State Keys State function groups including Calibrate, System and Option.
The Calibration function is only for manufacture setting. The
Option defines the state of all options.
7 Power Key Pushing and holding the key for 2~3 seconds to turn ON/
Standby. The main power switch on rear side has to be
switched to ON to activate this power key.
8 Power
It is green when power is ON and red at Standby.
Indicator
9 Arrow key UP and DOWN arrows make step changes in Frequency, Span
and Amplitude. In Frequency change, the frequency step is
defined for Frequency step (Frequency >> Step (F4)). In Span,
the steps are in 1-2-5 sequence. In Amplitude, the steps are
equal to Amplitude scale (Amplitude >> Scale (F3)). The
Right and Left keys are mainly used for Calibration.
10 Scroll Key Changing the setting in fine step.
11 RF Input N type connector for RF measurement input.
12 Editing keys Including number, unit, minus sign, back space and enter keys.
13 TG Output N type connector for TG synchronized output.
12
Page 15
2.7GHz Spectrum Analyzer Operation Manual
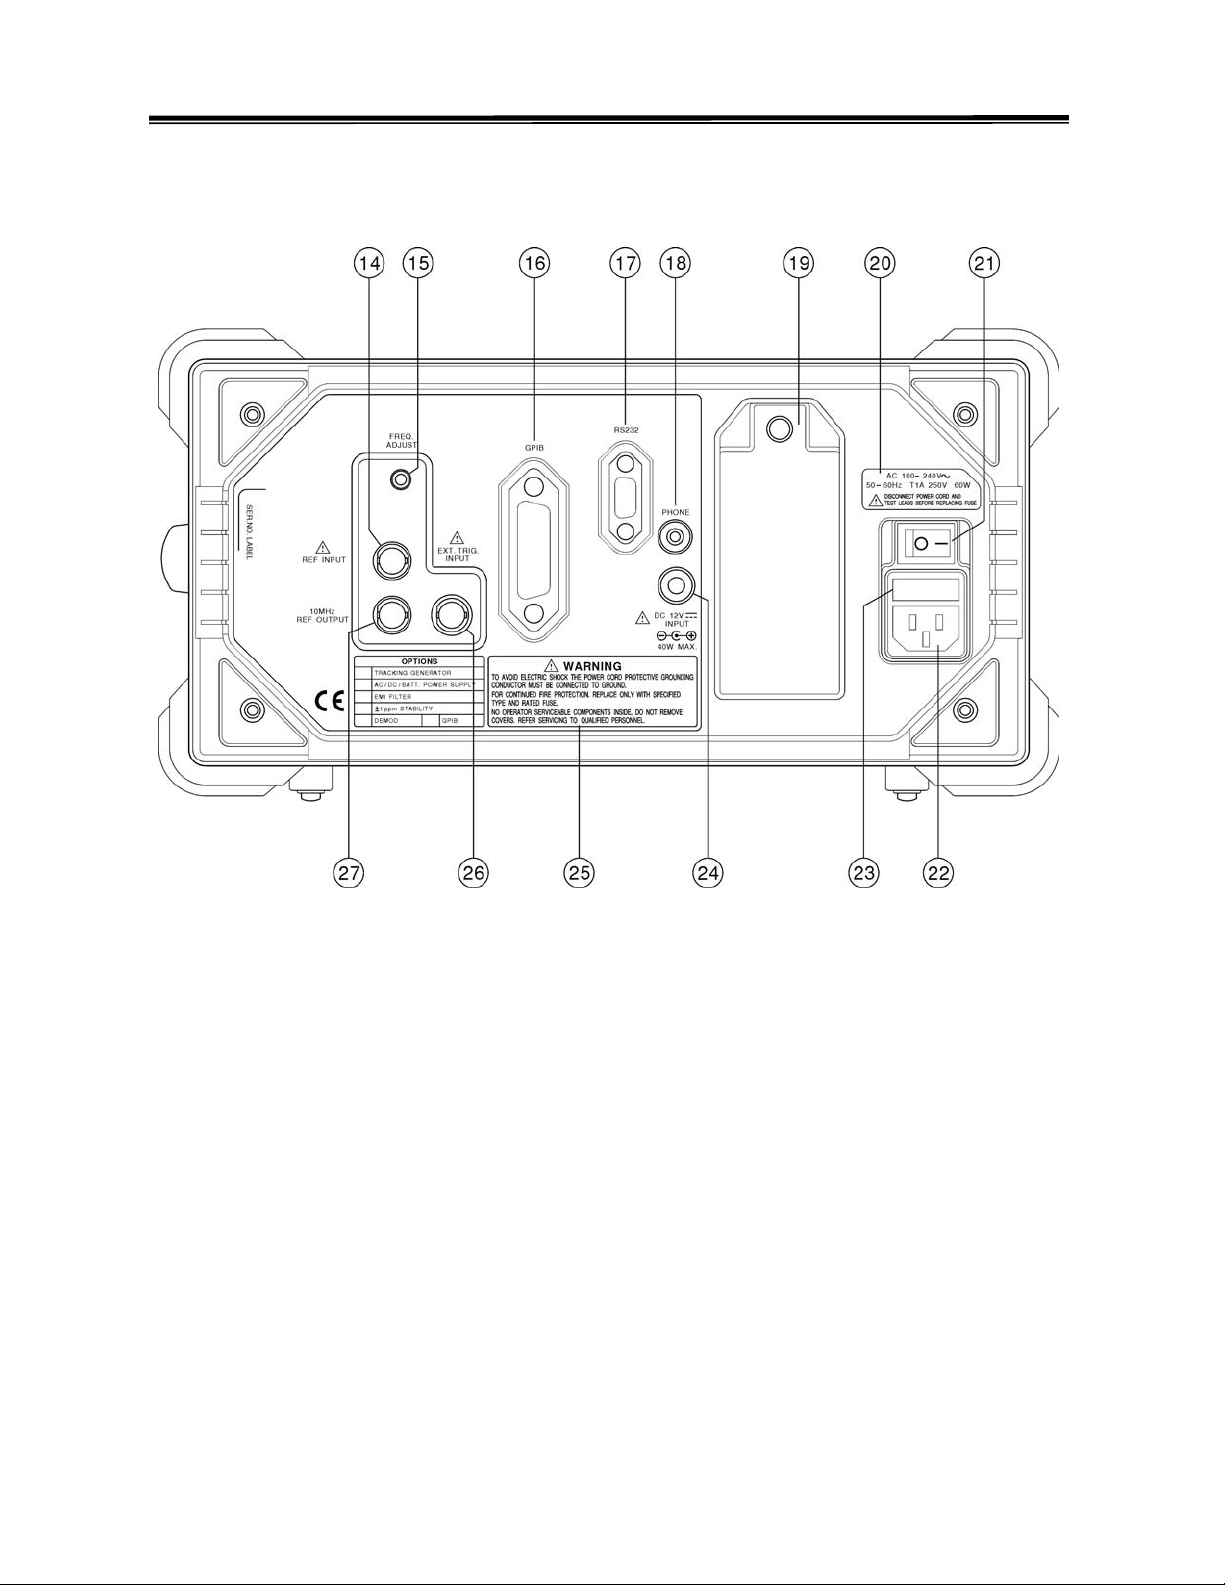
5.2 Rear Panel Descriptions
13
Page 16
2.7GHz Spectrum Analyzer Operation Manual
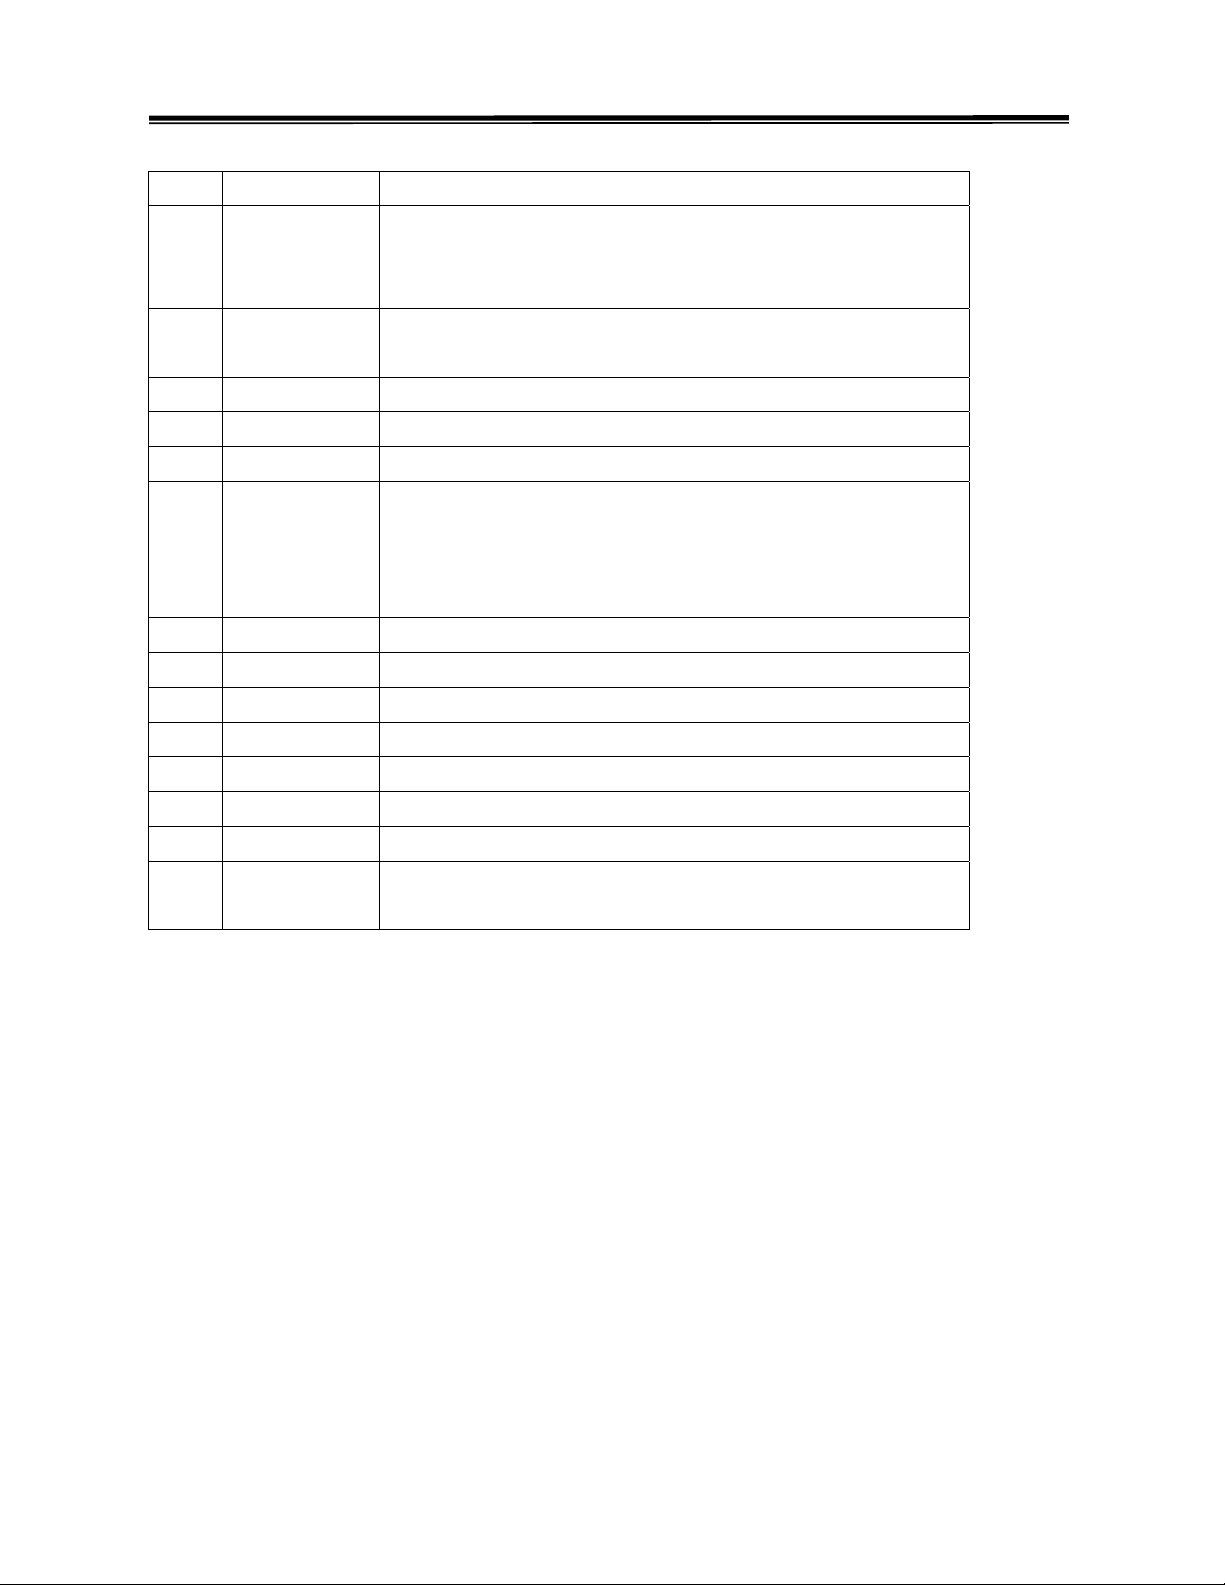
Item Description
14 Ref Input External reference signal input. When this terminal is fed with
an external reference signal, the system frequency is
synchronized to it. See Option >> ExtRefFreq function.
15 Freq. Adjust Adjustment for internal frequency reference, which allows
aligning frequency with the other equipments.
16 GBIP GBIP terminal
17 RS232 RS232 terminal.
18 Headphone Headphone output when the demodulation option is built-in.
19 Battery Pack
Slot
Slot for plugging the battery pack. Rotating the screw on the
top of battery cover counterclockwise to move the cover.
Installation is easily done by sliding batteries in and locking
up the cover.
20 Panel label Fuse selection guide.
21 Power Switch Main AC Power switch.
22 AC Input AC Input.
23 Fuse Socket Fuse socket.
24 DC Input DC 12V input.
25 Panel Label Usage warning.
26 Trigger Input External Trigger input. See Trigger >> External function.
27 10MHz Ref
10MHz output allows synchronizing with the other equipment.
Output
14
Page 17

2.7GHz Spectrum Analyzer Operation Manual
6.0 Quick use guide
6.1 General Description
The quick use guide provides the information of measurement-oriented operation. Every
operation is titled with a measurement demand and followed by the corresponding operation
sequence of the keys on the front panel and terminals on the rear panel.
6.2 Guide
6.2.1 Find the signal
(1) The frequency is unknown: Use Full Span to scan entire frequency range.
Function key Description
Span Select the Span functions.
F4<Full Span> Select the Full Span to scan the entire measuring band.
(2) The frequency is known: Specify the frequency directly.
Function key Description
Frequency Select the Frequency functions.
F1<Center> Specify the Center Frequency.
N, … , MHz
Span Activate the Span to set the frequency range.
M, … , MHz Key in the frequency range or
Spinner Rotate Spinner to change the Span in 1-2-5 sequence.
Or set the start/ stop frequency.
Function key Description
Frequency Select the Frequency functions.
F2
<Start>
N, … , MHz
F3<Stop> Activate the Span to set the frequency range.
M, … , MHz Key in the frequency range.
6.2.2 Find Peak signal
(1) In Frequency function
Function key Description
Key in the specific frequency by using numerical and
unit keys.
Specify the Center Frequency.
Key in the specific frequency by using numerical and
unit keys.
F5 <Peak to
Center>
Set the Center frequency to the peak signal frequency,
so that the peak signal will be shown at up right of the
central display.
15
Page 18
2.7GHz Spectrum Analyzer Operation Manual
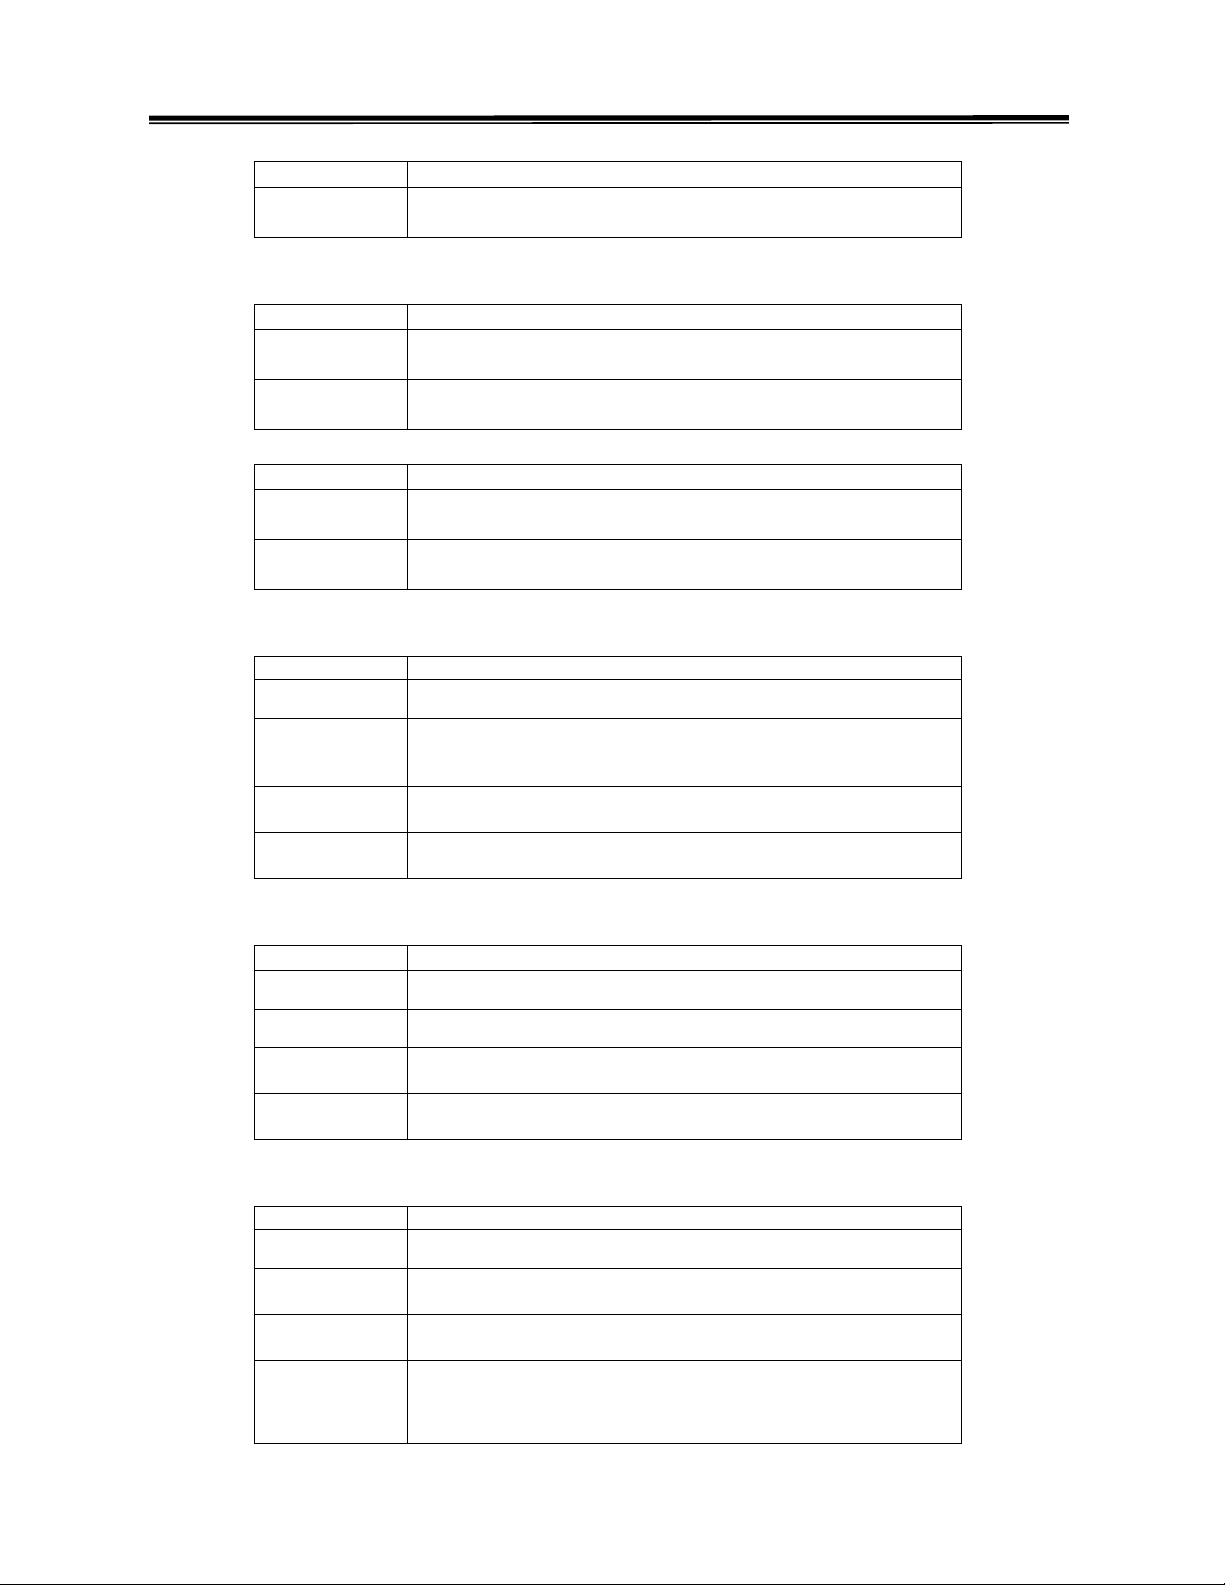
(2) In Peak Search function with Marker
Function key Description
Peak
Search
One marker will automatically find the peak signal and
show the frequency and amplitude.
6.2.3 Track Peak signal
Function key Description
Peak
Search
F6<Track
ON/OFF>
One marker will automatically find the peak signal and
show the frequency and amplitude.
The marker will continuously find the peak signal and
move to the center when the track is on.
Or manually operate one step a time.
Function key Description
Peak
Search
F2<Marker
to Center>
One marker will automatically find the peak signal and
show the frequency and amplitude.
The marker will move frequency marked to the center.
6.2.4 Make correct amplitude measurement
Function key Description
Amplitude Select the amplitude relative functions.
F1
<Ref Level>
F3
<Scale>
F4
<Unit>
Set the top level of display.
Note: The input signal exceeding the reference level will
cause error in the harmonic related measurement.
Select the scale to zoom in/out the amplitude for
observation.
Select the unit as wanted. The scaling between the units is
automatically done.
6.2.5 75Ω system measurement
Function key
Amplitude Select the amplitude relative functions.
Description
F6<More> Look for more functions.
F1
<Input Z>
F2 <Input Z
CAL>
Switch the input impedance to 75 ohm.
Calibrate the deviation caused by 75Ω impedance if
necessary.
6.2.6 Multi-marker operation
Function key Description
Marker Select the Marker relative functions.
F1
<Marker>
F2 <Marker
ON/OFF>
Select the active marker by keying in marker number.
Toggle the specified Marker ON/OFF.
Key in the specific marker frequency by using numerical
N, … , MHz
and unit keys.
Repeating the above procedure can turn on markers from 0
to 9.
16
Page 19
2.7GHz Spectrum Analyzer Operation Manual
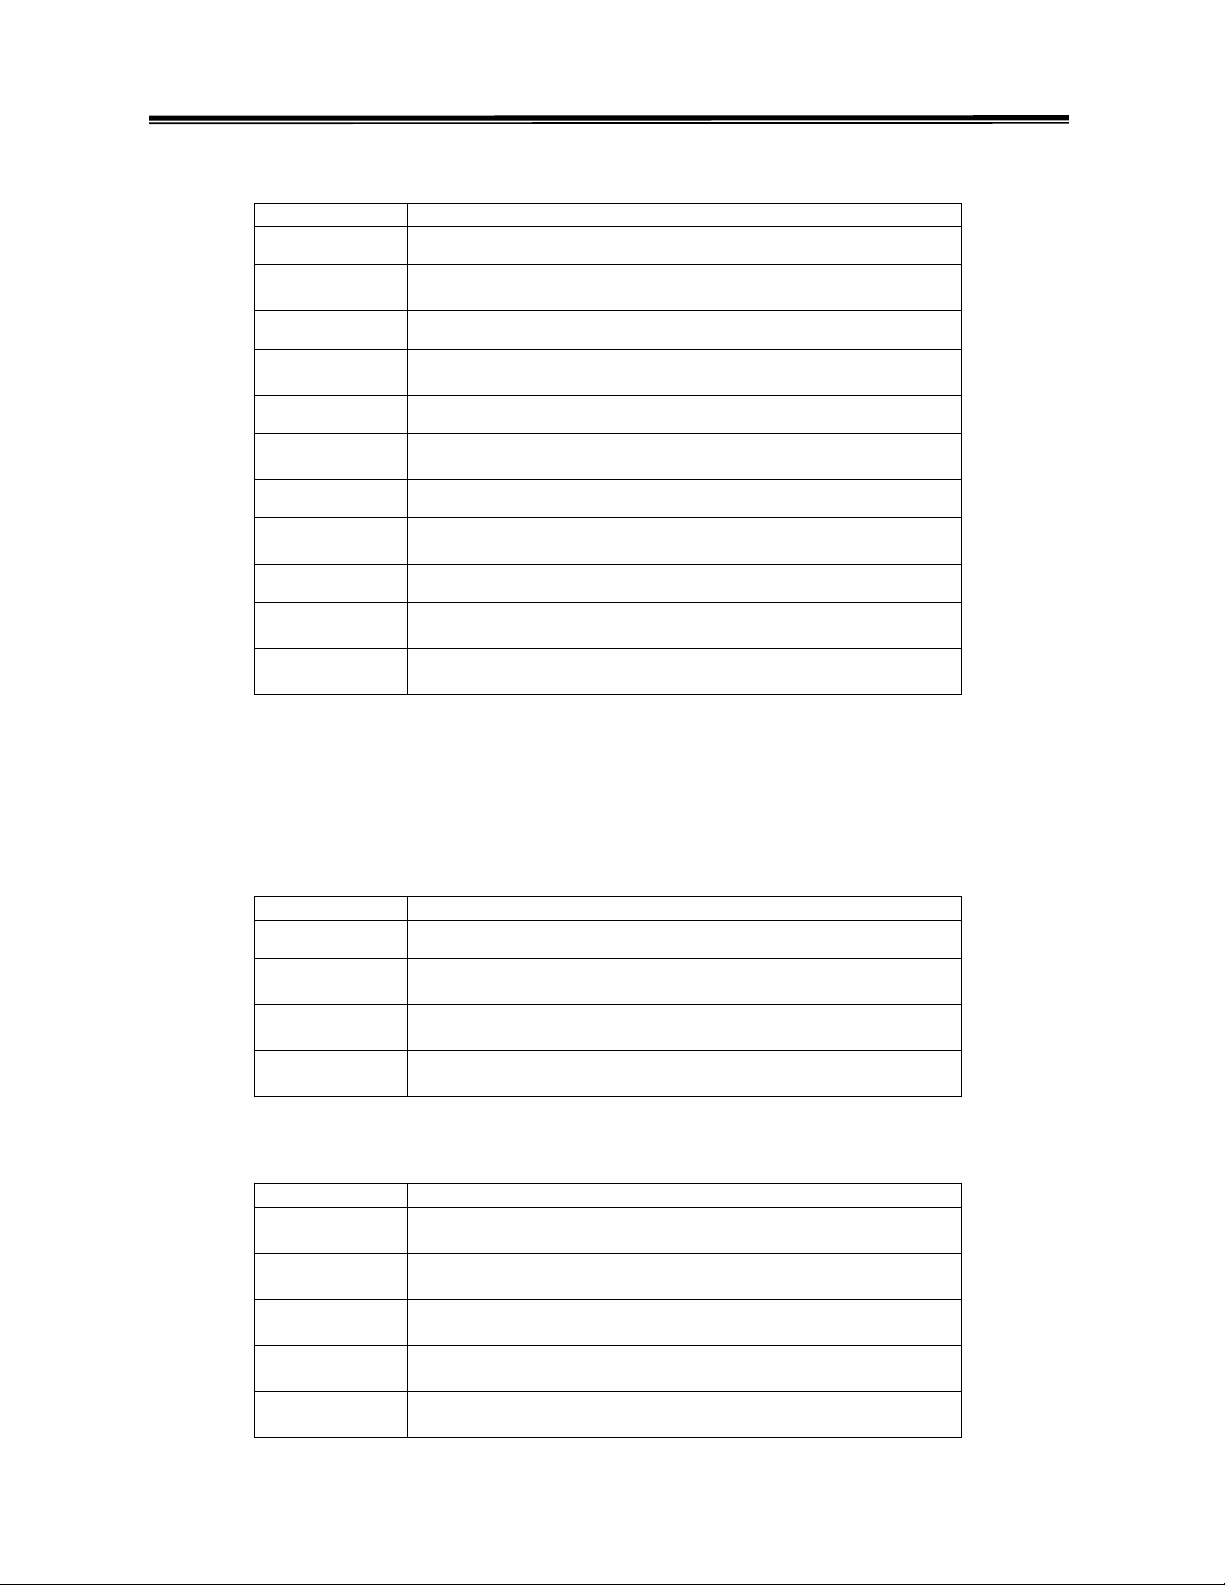
6.2.7 Delta-Marker operation
Function key Description
Marker Select the Marker relative functions.
F1
<Marker>
Select the active marker by keying in marker number.
0 means marker 10.
1 Key in 1 to take marker 1 as example.
F2 <Marker
ON/OFF>
Set Marker 1 ON.
N, … , MHz Set frequency of marker 1.
F1
<Marker>
Select the second marker, marker 2 here for example.
2 Key in 2 to take marker 2 as example.
F2 <Marker
ON/OFF>
Set Marker 2 ON.
N, … , MHz Set frequency of marker 2.
F3 <Normal,
Δ
Mkr>
1
Set Marker2 as Δ marker.
Select the Reference Marker due to Mkr2. Key in 1 to take
marker 1 as reference marker.
Note: The table will show the level and frequency in delta reading. In this example, the
marker table will show as follows.
Marker Level Freq(MHz)
1 l1 f1
3
Δ
1 Δl13 Δf13
Which means marker 3 is the ΔMkr due to Mkr1.
6.2.8 Peak Hold, Average and Freeze the measurement
Function key Description
Trace Select the trace relative functions.
F3
<PkHold>
F4
<AVG >
F5
<Freeze>
Switch the peak hold function ON/OFF.
Switch the Average function ON/OFF. When it is ON, key
in the average times.
Switch the freeze function ON/OFF.
6.2.9 ACPR Measurement
Function key Description
Pwr
Measure
F4
<Setup>
F1
<CH BW>
F2
<CH SPC>
F4<ADJ CH
OFFSET>
Select the power measurement relative functions.
Setup the Power Measurement parameters.
Define the channel bandwidth.
Define the channel space.
Define the adjacent channel parameters.
17
Page 20
2.7GHz Spectrum Analyzer Operation Manual
F1<ADJ CH
BW1>
F2<ADJ CH
Offs 1>
F3<ADJ CH
BW2>
F4<ADJ CH
Offs 2>
F6
<Return>
F6
<Return>
F1
<ACPR ON>
Define the bandwidth of adjacent channel 1.
Define the offset from the adjacent channel 1.
Define the bandwidth of adjacent channel 2. Ignore this
step if only one adjacent channel is measured.
Define the offset from the adjacent channel 2. Ignore this
step if only one aadjacent channel is measured.
Exit the adjacent channel setup.
Exit the setup submenu.
Activate the ACPR measurement.
6.2.10 OCBW Measurement
Function key Description
Pwr
Measure
F4
<Setup>
F1
<CH BW>
F3
<OCBW>
F6
<Return>
F2 <OCBW
ON>
Select the power measurement relative functions.
Setup the OCBW measurement parameter.
Define the channel bandwidth.
Define the power percentage
Exit the setup submenu.
The OCBW measurement includes the total power in
channel and bandwidth occupied of the percentage power.
When the channel parameters are first set, there are some keys offering the convenient way
to measure the other channels.
Function key Description
Pwr
Measure
F5
<CH Up>
F6
<CH Dn>
F3
<CH BW>
Select the power measurement relative functions.
Measure the next channel. The Center frequency will
increase one channel space.
Measure the previous channel. The Center frequency will
decrease one channel space.
Define the channel bandwidth, same as the <CH BW> in
<Setup>
6.2.11 Pass/Fail test by Limit Line
Function key Description
Limit Line Select the Limit Line relative functions.
F1 <HLimit
ON/OFF>
F2 <LLimit
ON/OFF>
F4 <Pss/fl
ON/OFF>
Activate the high limit line.
Activate the low limit line.
Activate the Pass/Fail test. The “PASS” and “FAIL”
messages will automatically appear underneath the trace.
18
Page 21
2.7GHz Spectrum Analyzer Operation Manual
6.2.12 Edit the Limit Line,
Function key Description
Limit Line Select the Limit line relative functions.
F3
<Edit>
F1 <Limit
Upper>
Arrow Keys
F2
<Insert>
F3
<Delete>
F4
<Undo>
F6
<Return>
Select limit line editing.
Toggle the editing between high and low limit line.
Use ∧∨ > < arrow keys to mark and modify the existed
points.
Insert a point at where the point is marked.
Delete a point at where the point is marked.
Undo the previous edit step. Only one step is reserved.
Exit the limit line editing.
6.2.13 Change RBW, VBW and Sweep time
Function key Description
BW Activate the power measurement relative functions.
F1 <RBW
Auto>
F2 <VBW
Auto>
F3 <SwpTm
Auto>
F4
<All Auto>
Switch RBW between Auto and Manu mode. In auto
mode, RBW is coupled with Span; in manual mode, use ∧
and ∨ arrow keys to select RBW as wanted.
Switch VBW between Auto and Manu mode. Use ∧ and ∨
arrow keys to select VBW as wanted in manual mode.
Switch Sweep Time between Auto and Manu mode, key in
the sweep time as wanted in manual mode.
Set all RBW, VBW and sweep time to auto mode.
6.2.14 Trigger by input signal level
Function key Description
Trigger Select the trigger mode functions.
F2 <Video
Level>
Select level-on-display as trigger source. Key in the level
to trigger the sweep.
19
Page 22
2.7GHz Spectrum Analyzer Operation Manual
F6 <Trigger
Setup>
Set the frequency of trigger source. The default is Center
frequency.
N, … MHz Key in the frequency.
F6
<Return>
F4
<Singl>
F5 <Trigger
Delay>
F2 <Video
Level >
F1
<Free Run >
Exit the trigger setup submenu.
Select single trigger, there will be only one sweep..
Otherwise, it will have continuous sweeps.
Define delay between the trigger condition and sweep.
Exit the Single trigger mode.
Exit the trigger mode.
6.2.15 Trigger by Externally stimulus signal
Function key Description
Trigger Select the trigger mode functions.
F3
<Exter>
Select the external trigger input (on the rear panel) as the
trigger source.
Note: The Single trigger, trigger delay, trigger setup and exiting single trigger
operations are same as previous “Video Level” mode.
nd
6.2.16 Observe two sweeps (ex, 2
harmonic) by Dual Windows
Function key Description
Display
F4
<Split >
Select the Display relative functions.
Split the window in dual windows.
Select the upper window as active one. All the
F5
<Upper>
measurement configurations are due to upper one. In
harmonic measurement example, set the fundamental
frequency as the center frequency here.
Select the lower window as the active one. All the
F6
<Lower >
measurement configurations are due to lower one. In
harmonic measurement example, set the harmonic
frequency as the center frequency here.
6.2.17 Configure Display setting
Function key Description
Display
F1 <LCD
Cntrst >
F2
<Bklight>
F3 <Invert
screen>
Activate the power measurement relative functions.
Rotate Spinner to adjust LCD contrast.
Switch the backlight ON/OFF.
Invert the screen.
20
Page 23

2.7GHz Spectrum Analyzer Operation Manual
6.2.18 Save measurement/setup to Memory
Function key Description
Save/Recall Select the Save/Recall relative functions.
F1 <Save
Trace>
F5 <From
Live>
Up/Down
Arrows or
Spinner
Save the trace.
Select the measuring trace to save.
Select the memory to save. The memory list is on the LCD
display.
Right Arrow Move the cursor to the Name filed of memory.
Up/Down
Arrows or
Spinner
Use Up/Down arrow keys to select the alphabet to name
the stored data. Repeat these four arrow keys to complete
the name. Or
Enter Press Enter to complete the operation.
Note: The Setup is saved simultaneously when the trace is saved.
6.2.19 Recall trace/setup to Memory
Function key Description
Save/Recall Select the Save/Recall relative functions.
F2 <Recall
Trace>
Up/Down
Arrows or
Spinner
F5
<to Tr A>
F5
<Setup>
Activate the trace/setup recall function.
Select the memory to recall. The memory list is on the
LCD display.
Select trace A as recalling destination. Or
Select recalling the Setup.
Enter Press Enter to complete the operation.
6.2.20 Turn ON/OFF the Internal calibration signal
Function key Description
System Select the System functions.
F3
<RefSig >
Switch the internal calibration signal 100MHz -30dBm
ON/OFF.
6.2.21 Calendar/Clock setting
Date setting
Function key Description
System Select the System relative functions.
F5 <System
clock>
Select to set the real time clock inside.
21
Page 24
2.7GHz Spectrum Analyzer Operation Manual
F1
<Date>
F1
<Year>
F2
<Month>
F3
<Day>
F4 <Day of
week>
F6
<Return>
Set date information.
Key in the Number of year and
Key in the Number of month and
Key in the Number of day and Enter
Key in the Number of day of week and
Exit the Date setting.
Time setting
Function key Description
System Select the System relative functions.
press Enter key.
press Enter key.
press key.
press Enter key.
F5 <System
Select to set the real time clock inside.
clock>
F2
<Time>
F1
<Hour>
F2
<Minute>
F3
<Second>
F6
<Return>
Set time information.
Key in the Number of hour and press Enter key. The hour
is in 24 hour system.
Key in the Number of minute and press Enter key.
Key in the Number of second and press Enter key.
Exit the time setting.
6.2.22 Preset system
Function key Description
System Select the System relative functions.
F6
<More>
F2 <System
Preset>
F6
<Return>
Look for more functions.
Preset the system.
Exit the submenu.
6.2.23 System information
Function key Description
System Select the System relative functions.
F6
<More>
Look for more functions.
22
Page 25
2.7GHz Spectrum Analyzer Operation Manual
F3 <System
Config>
F6
<Return>
The system configuration will be shown up, including
serial number, S/W and F/W version number, Options, Los
status, reference signal source and status.
Exit the submenu.
6.2.24 Synchronized by External Reference Signal
Function key Description
Option Select the Option relative functions.
F3 <ExtRef
Freq>
Select the external reference signal source.
Up/Down
Arrows or
Select the reference signal frequency.
Spinner
-
Connect the reference signal source to the BNC terminal
“Ref Input” on the rear panel.
6.2.25 Synchronize other equipments
Connect the “10MHz Ref Output” terminal on the rear panel to the “External Ref. Input” of
following equipment directly.
6.2.26 Tracking Generator Operation (option)
Function key Description
Option
F1
<TG>
F2 <TG
Level >
F1
<TG ON>
F3
<Normal>
F5 <Ref
Value>
Select the Option relative functions.
Select the Tracking Generator.
Set the TG output Level.
Switch the TG ON.
Perform the Normalization function before connecting the
DUT if necessary.
This function allows normalization on the specific level
for extra gain or loss.
23
Page 26
2.7GHz Spectrum Analyzer Operation Manual
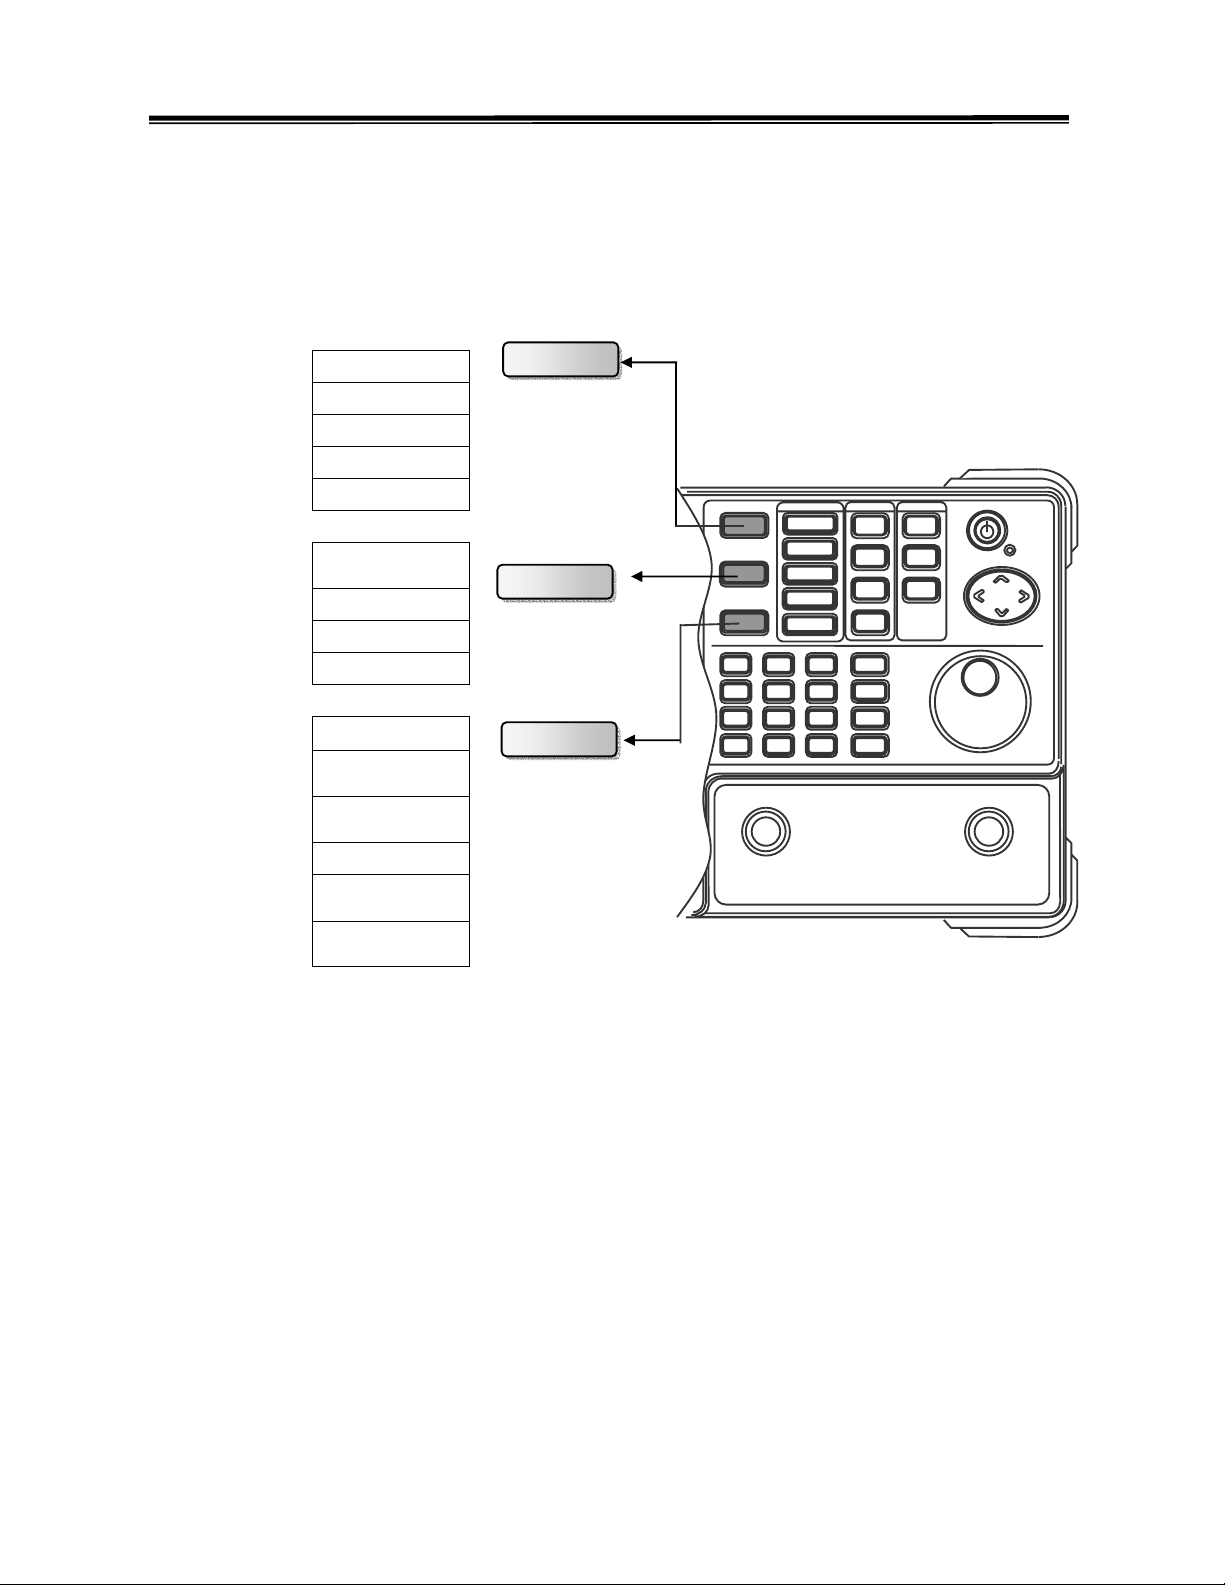
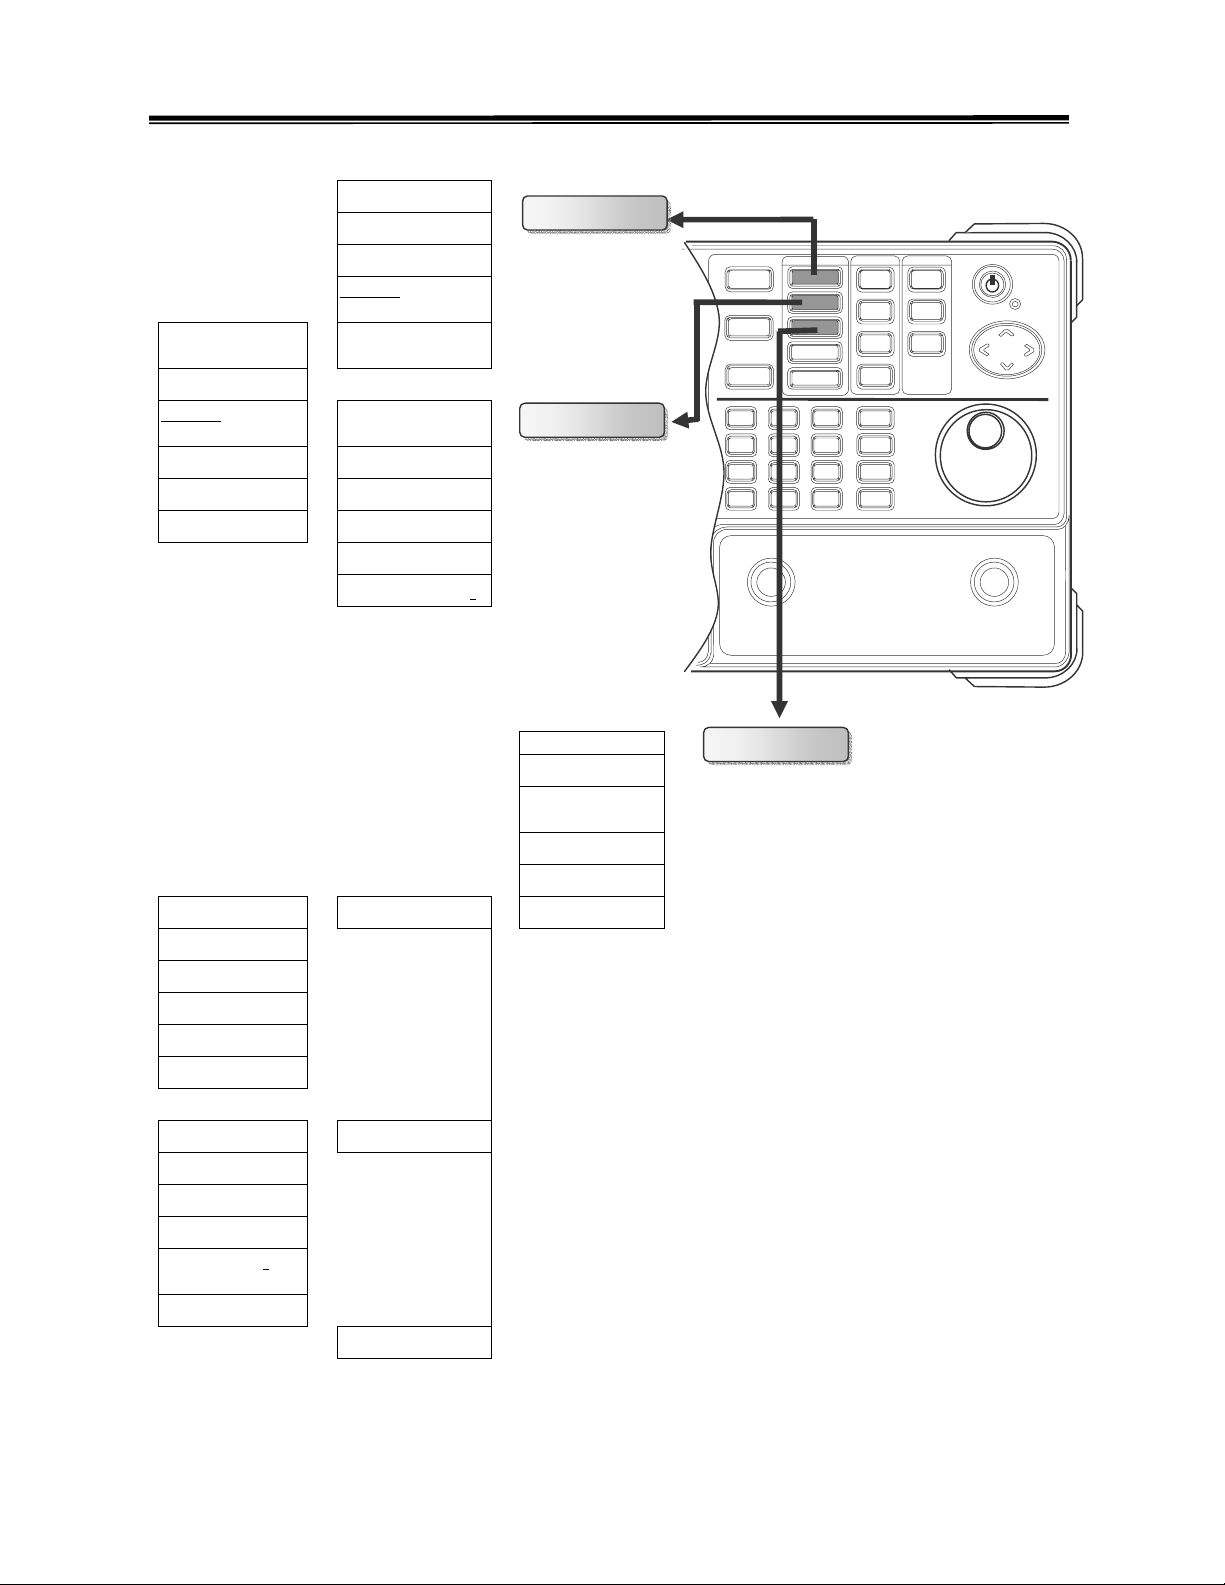
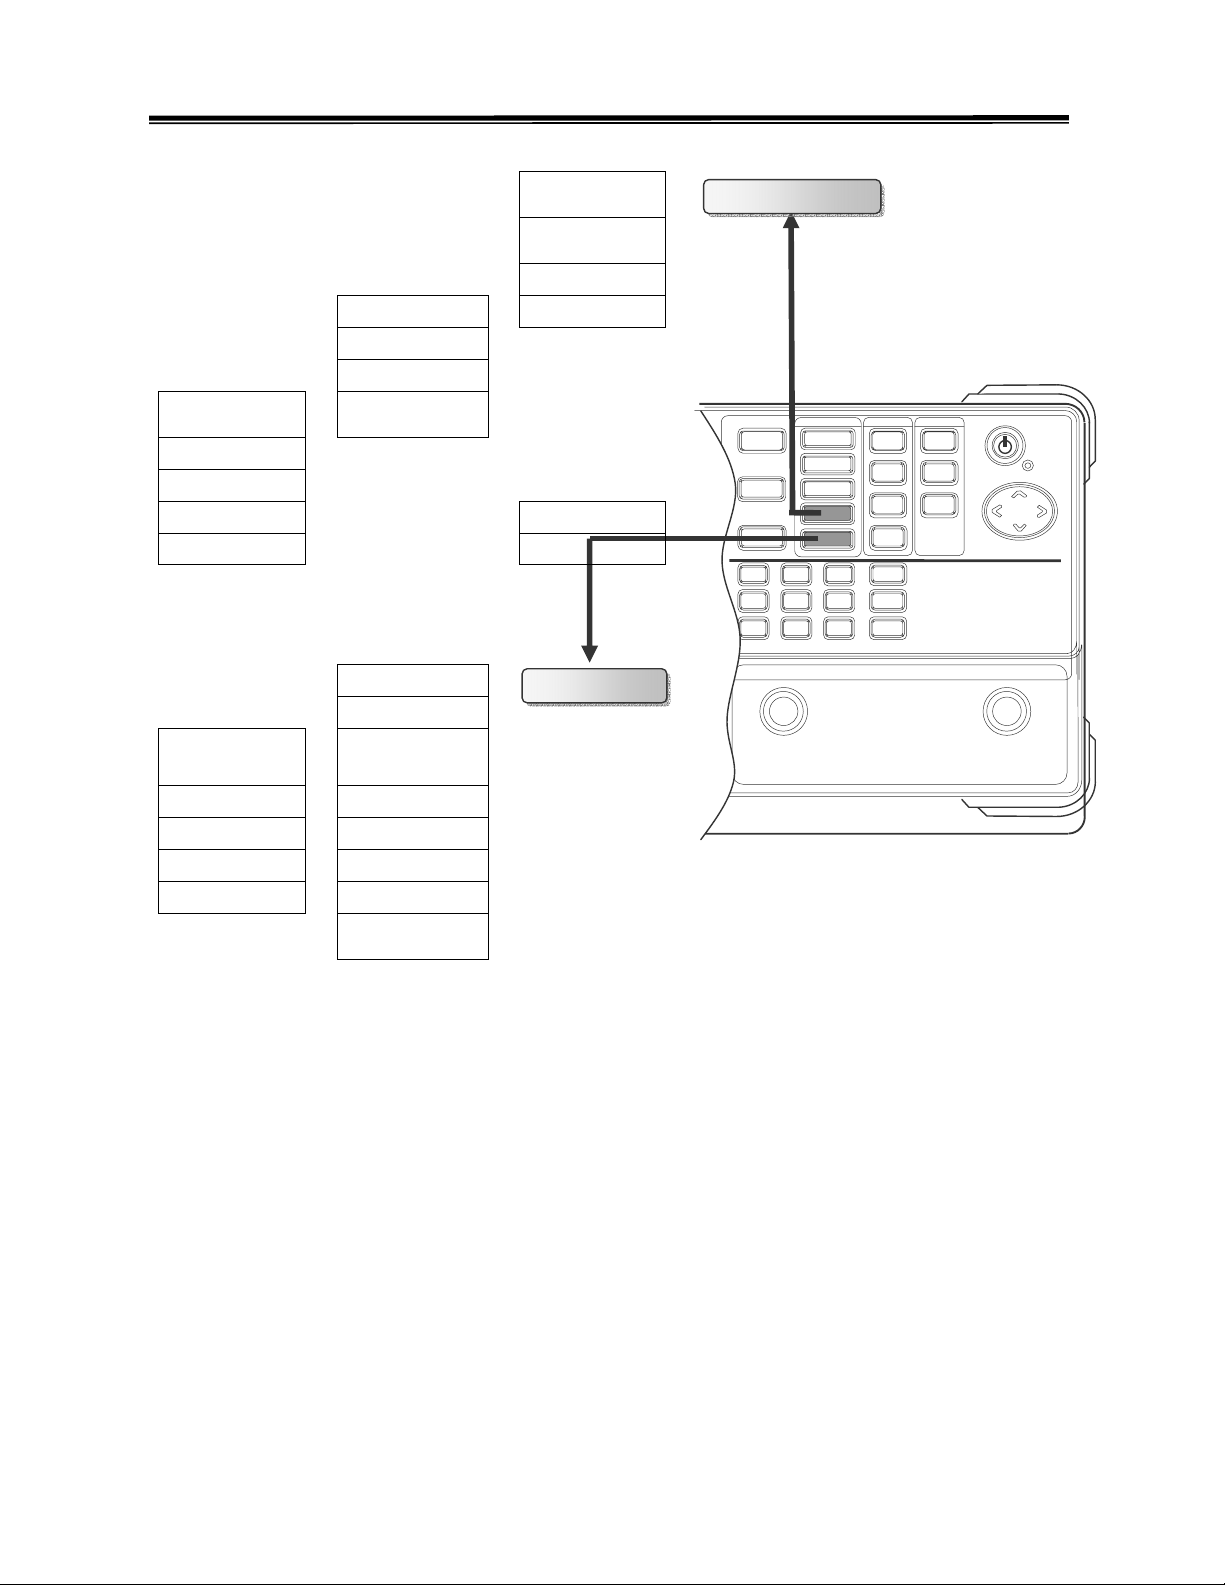
7.0 Menu Tree
The menu tree gives a brief overview of user interface structure. The more detailed explanation
for each function key is described in this Chapter 7.
7.1 Main Function
Center << Frequency
Start <
Stop
Step
Peak -> Center <
Span <<
Full Span <
Zero Span <
Last Span <
Ref Level <<
Ext Gain Loss <
InputZ CAL <
Scale (10/5/2/1)
dB
Unit (dBm/dBuV/
dBmV/dBm/Hz)
InputZ (50/75
ohm)
<
<
<
<
<
Span
Amplitude
24
Page 27
2.7GHz Spectrum Analyzer Operation Manual
7.2 Measurement Function
Marker (ON/Off) <<
To Peak <
Mkr->Center <
Marker(1…10) <<
Marker (ON/Off)
Normal /∆Mkr
(1…10)
Mkrs->Peaks Mkr->Center <
ALL ON/OFF Next Peak <
Return Peak Right <
Peak Left <
Track (ON/OFF) <
Trace (A/B/ No) <<
Clear <
AVG (ON /OFF) <
Freeze ON/OFF <
A<->B << Trace Math << More 1 of 2 <
A+B->A <
A-B->A <
A+const->A <
A*const->A <
Return <
Normal Detect << Detect <
Sample Detect <
Peak + <
Average (1/2/3) <
QPeak(Auto/
TC1/TC2/TC3)
Return <
Return <
Normal /∆Mkr
(1…10)
MM mode
ON/OFF
To Peak <<
<
<
<
Peak Search
PkHold
(ON/OFF)
Marker
<
Trace
25
Page 28
2.7GHz Spectrum Analyzer Operation Manual
ACPR (ON/OFF)
Ch BW <
CH BW << SETUP <
CH SPC <
OCBW % <
Adj CH BW 1 <<
Adj CH Offs 1 <
Adj CH BW 2 <
Adj CH Offs 2 < CH Up <
Return <
L Limit (ON/OFF) <
ADJ CH
OFFSET
H Limit (ON/OFF) <<
Limit High << Edit Limit <
Insert <
Delete <
Undo <
Return <
Pass/Fail
(ON/OFF)
OCBW
(ON/OFF)
<
CH Dn
Limit Line
<
<<
<
<
Pwr Measure
26
Page 29
2.7GHz Spectrum Analyzer Operation Manual
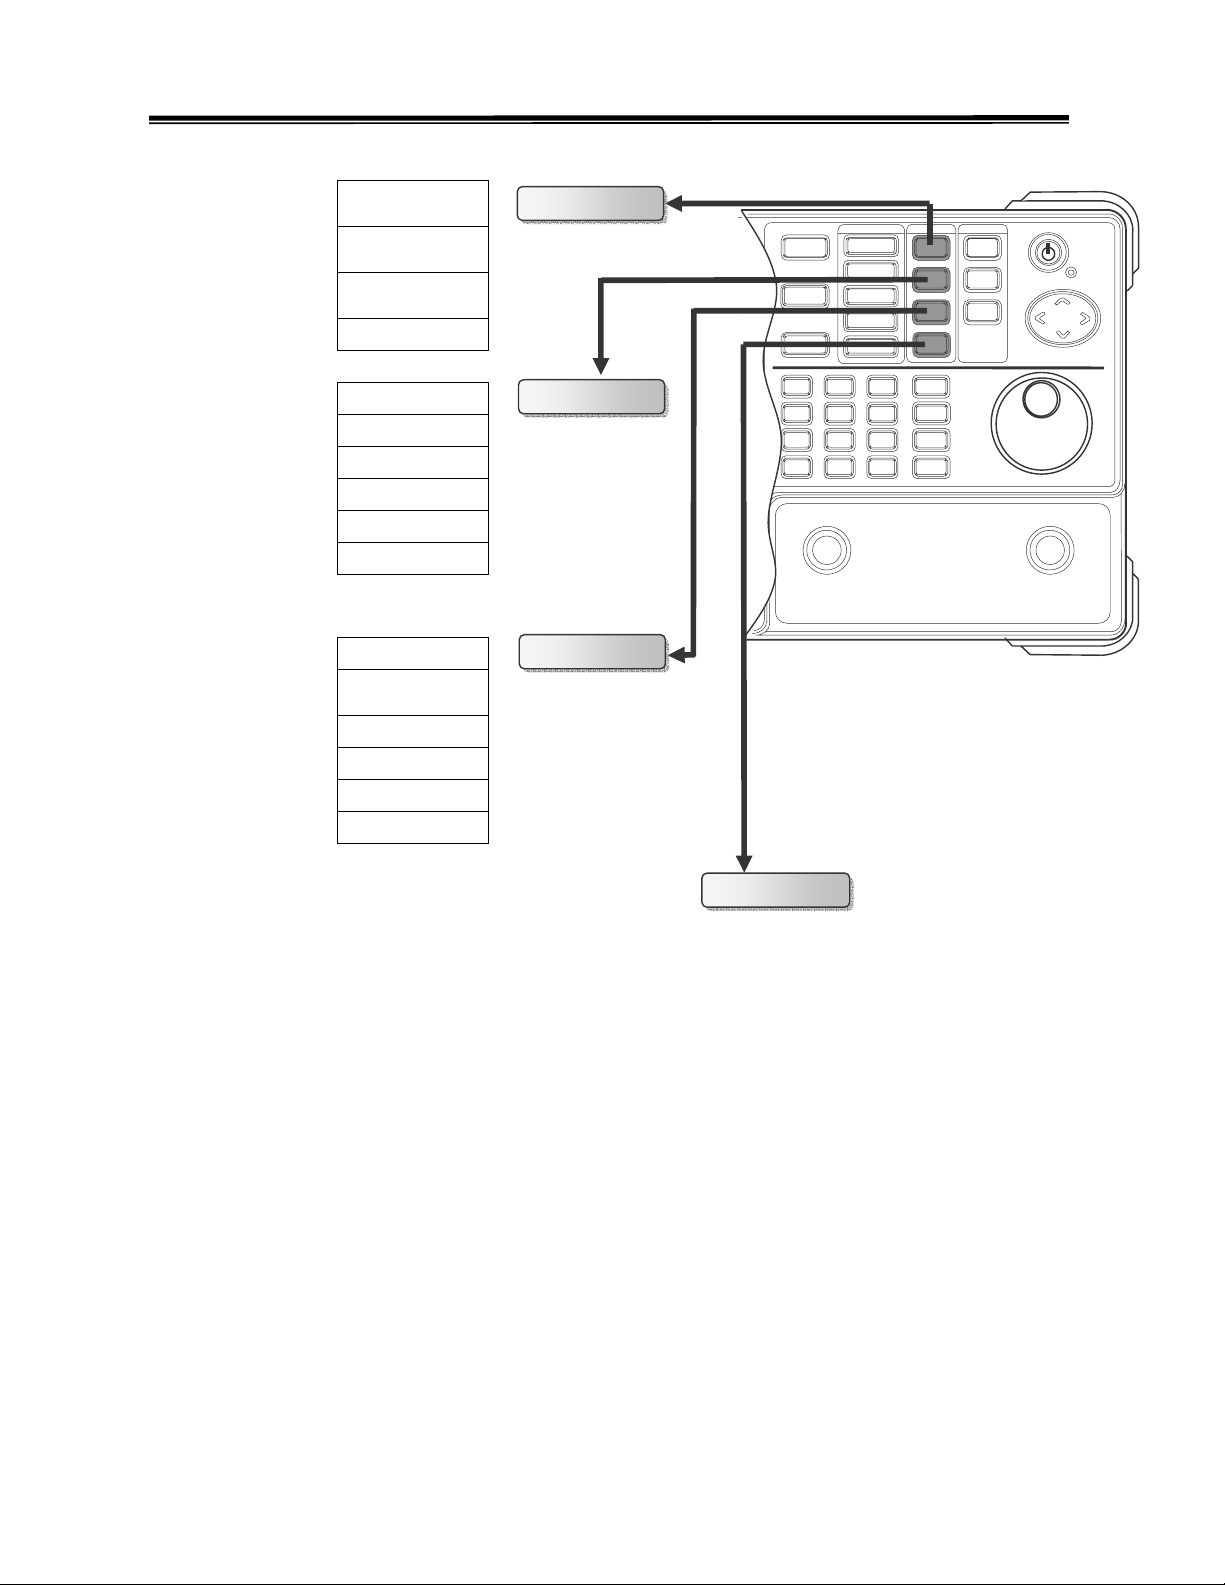
7.3 Control Function
ALL Auto <
Free Run << Trigger
Video Level <
Exter <
Singl <
Trigger Delay <
Trigger Freg. <
Invert Screen <
Split (ON/OFF) <
Upper (ON/OFF) <
Lower (ON/OFF) <
RBW
(Auto/Manu)
VBW
(Auto/Manu)
Swptm
(Auto/Manu)
LCD Cntrst << Display
BkLight
(ON/OFF)
<<
<
<
<
BW
27
Page 30
2.7GHz Spectrum Analyzer Operation Manual
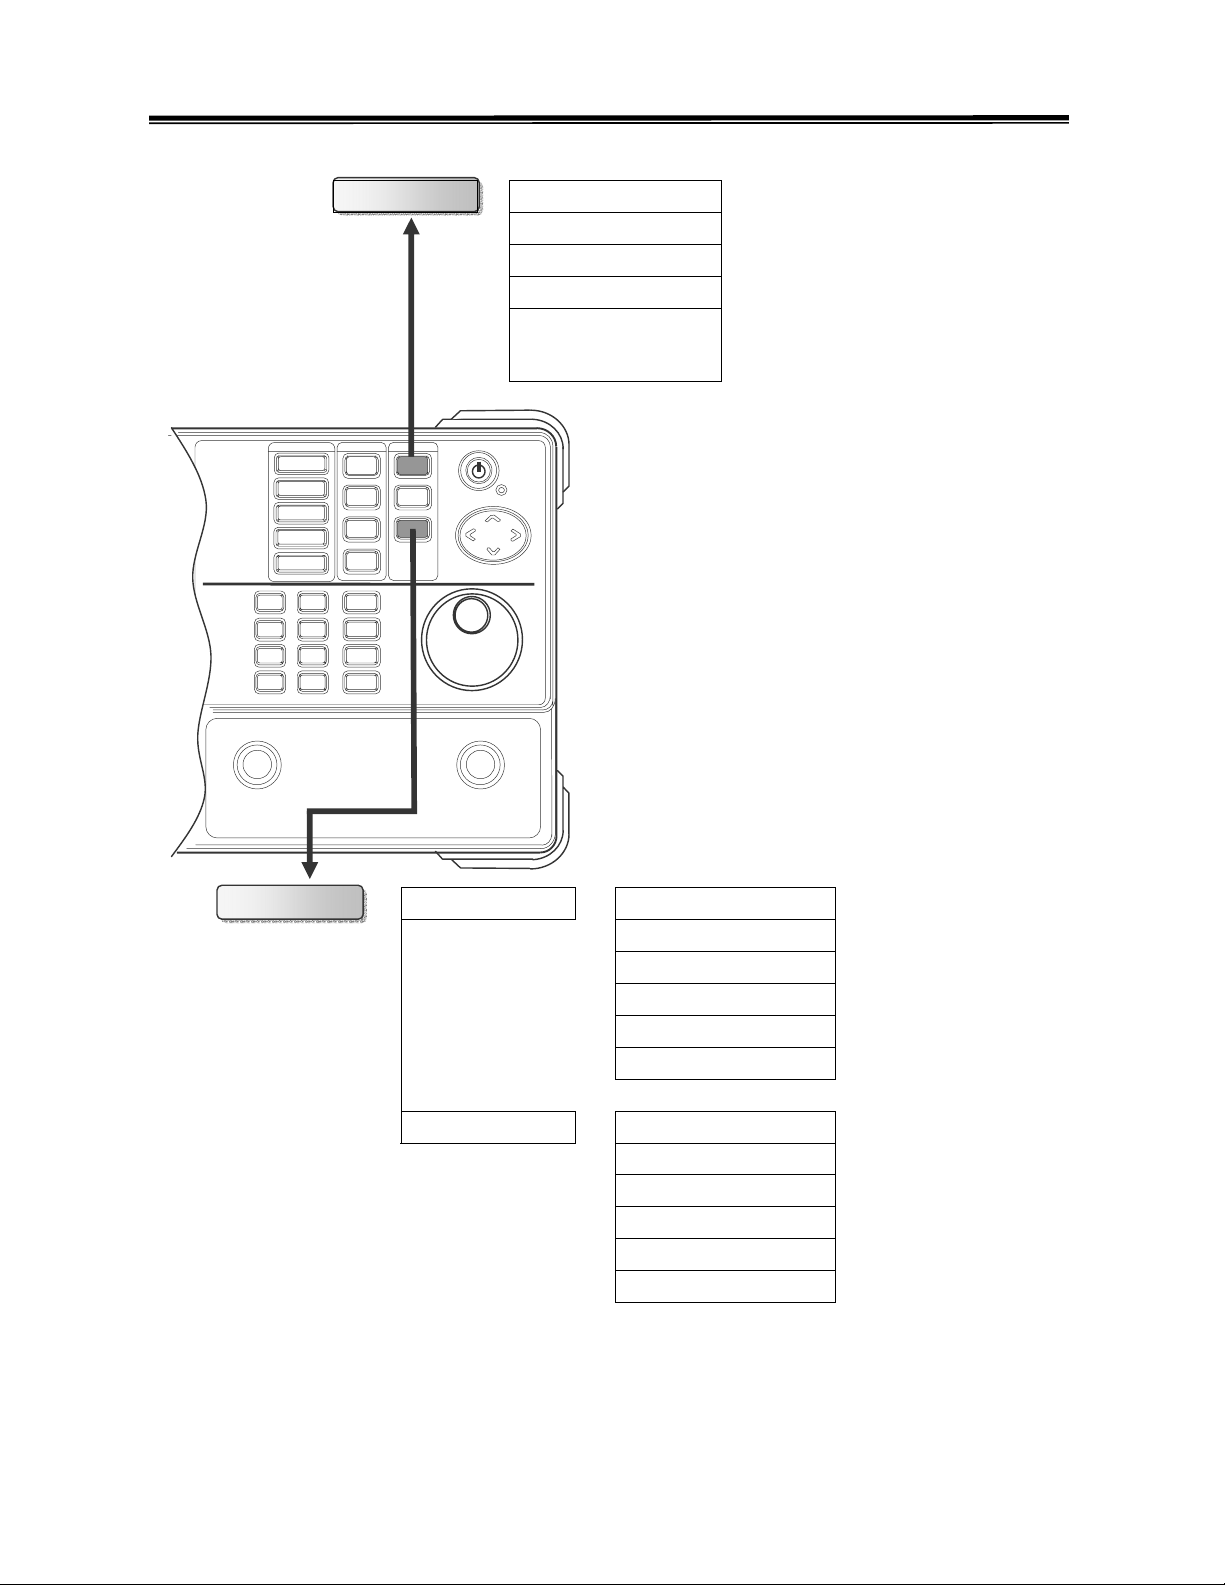
7.4 State Function
Save/Recall
>> Save Trace
> Recall Trace
> Erase Trace
> Erase All
>
Option >> TG
> TG Level
> Rcvr
> Volume
(blank) / (From Tr A/From
Tr B/ From Live ) / (To Tr
A/To Tr B/To Setup)
>> TG (ON/OFF)
> Normal (ON/OFF)
> Offset
> Ref Value
> Return
>> FM (OFF/WB/NB)
> AM (ON/OFF)
> Tone
> Squelch
> FM Det (AC/DC)
28
Page 31
2.7GHz Spectrum Analyzer Operation Manual
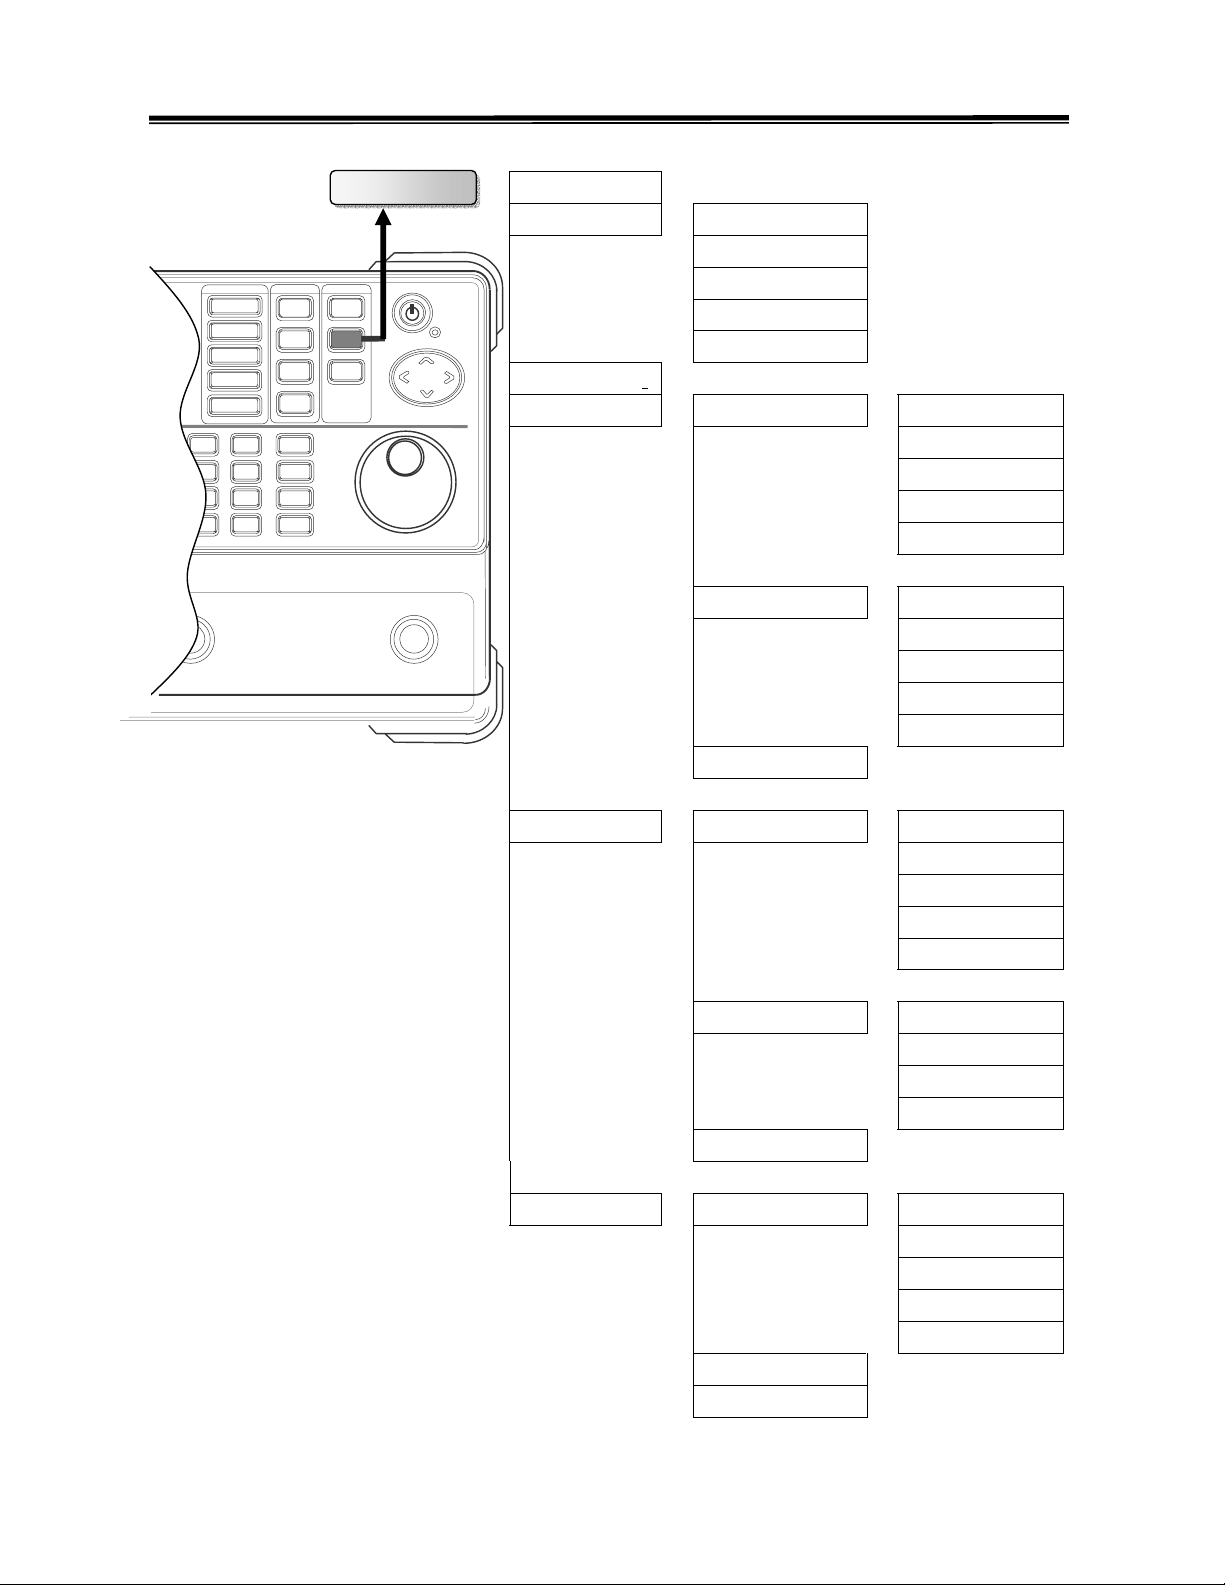
System >> GPIB
> Data 8
> LO1 F
>REF
> System Clock
> Day of Week
>Time
> More >> Self Test
> RTC pass
> Serial Port >> BAUD 57600
> RefSig (ON/OFF)
> RF diagno >> LO1 >> LEDLO1 (ON/OFF)
> HS NONE
> STOP NO
> Return
> LO1 N
> LO1 R
> Return
>> LEDREF (ON/OFF)
> REF F
> REF N
> REF R
> Return
> Return
>> Date >> Year
> Month
> Day
> Return
>> Hour
> Minute
> Second
> Return
> Return
>> GPIB Pass
> Flash Pass
> NVRAM Pass
> Return
> System Preset
> System Config
29
Page 32
2.7GHz Spectrum Analyzer Operation Manual
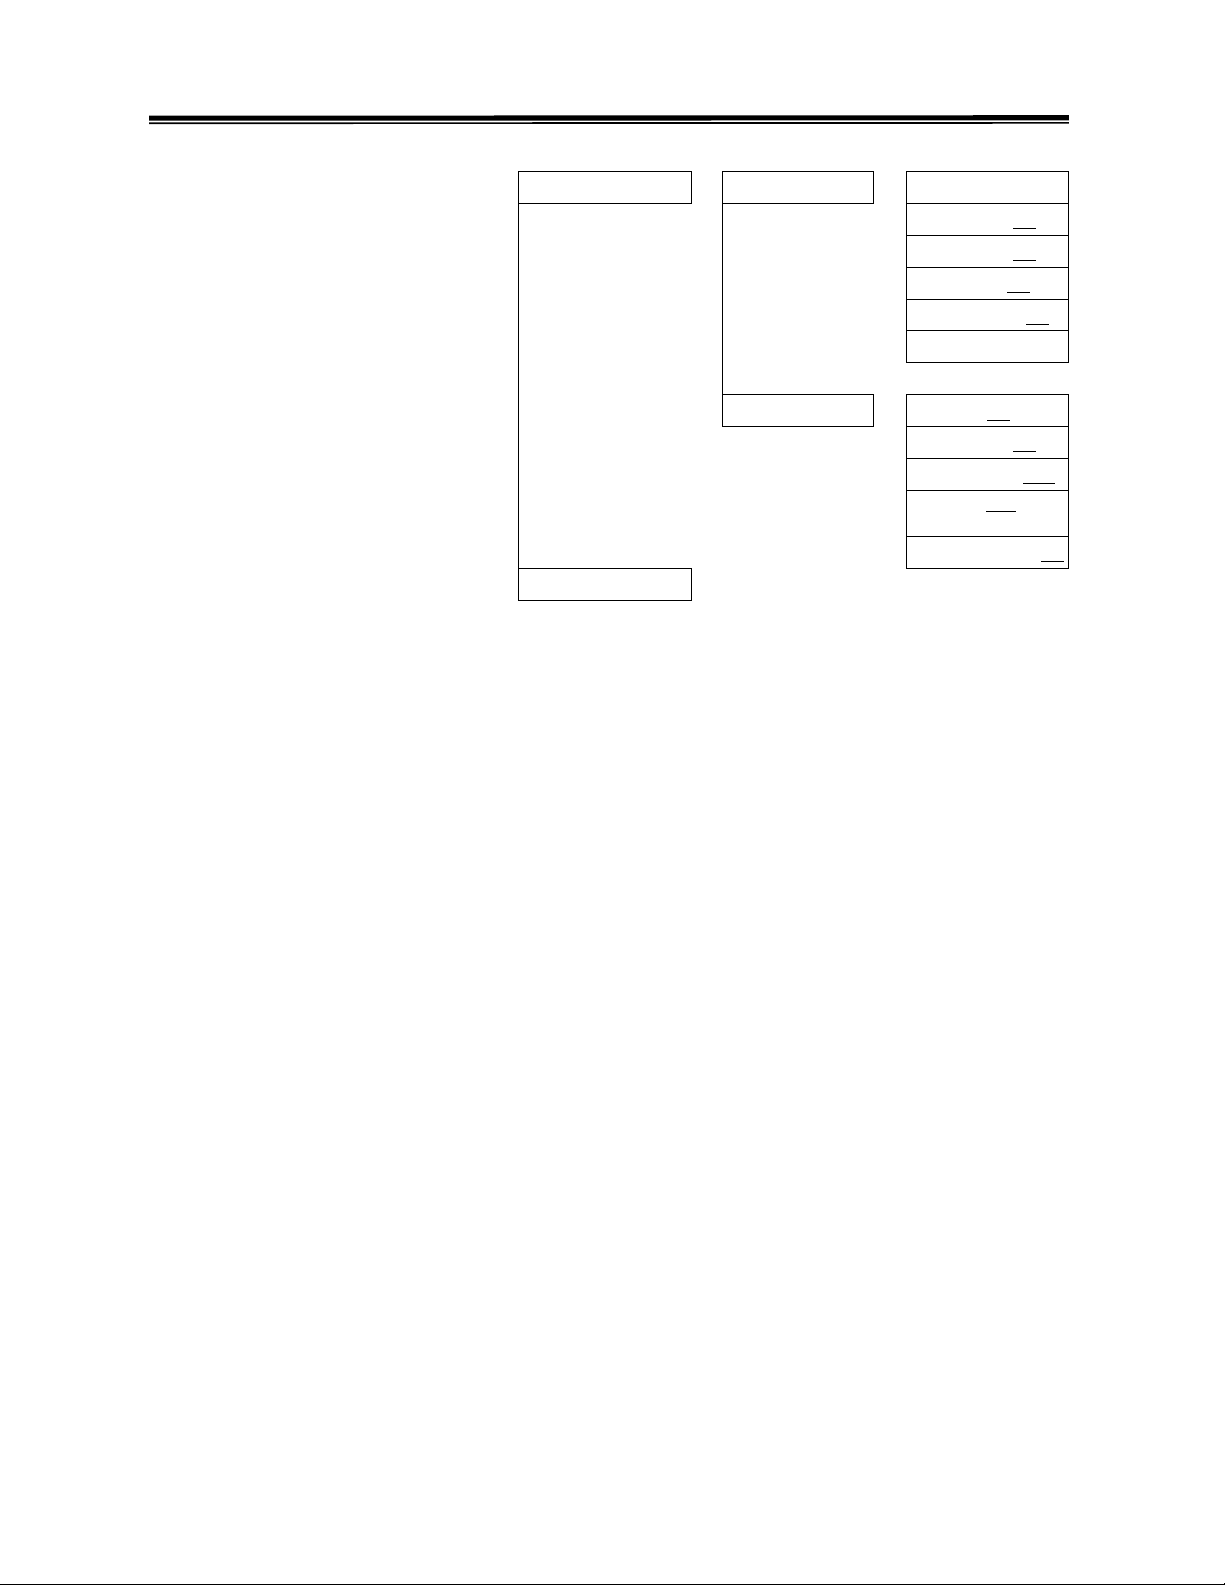
> Maintenance >> RBW >> RBW Std
> 120KHz Yes No
> OPTION
> Rcvr Yes No
> Return
> 200Hz Yes No
> 300Hz Yes No
> 9KHz Yes No
> Return
>> TG Yes No
> QP Det Yes No
Reference Std Med
>
Hi
> Phase Noise Yes No
30
Page 33
2.7GHz Spectrum Analyzer Operation Manual
8.0 Operation
In this chapter the detailed information of operation is introduced.
8.1 Main Functions
8.1.1 Frequency Functions
Frequency
Center
Center
Start
Start
Stop
stop
Step
Step
Peak->
Peak->
Center
Center
F1
F2
F3
F4
F5
F6
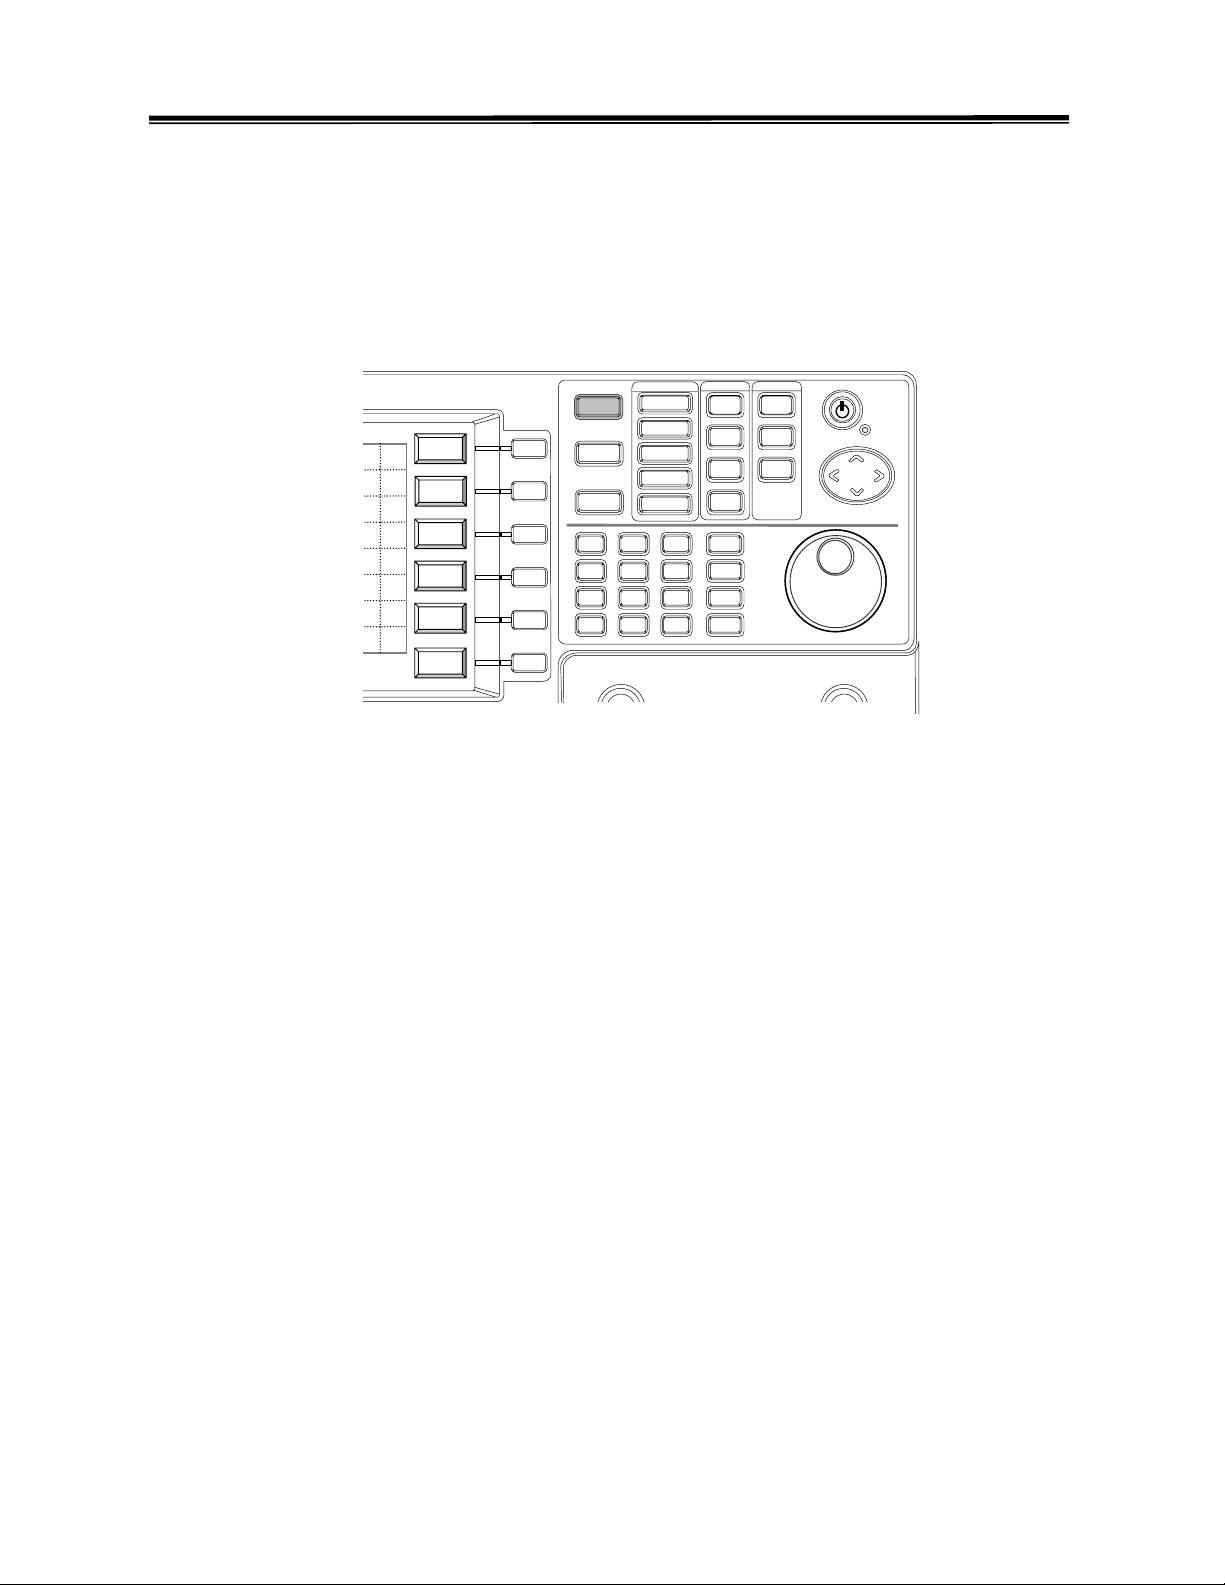
There are two methods to set the measuring frequency, Center/Span and Start/Stop. Span
means the measuring bandwidth. Center and Span are usually used in the situation that the
frequency under test is known. Start and Stop are used for the measured frequency of a specific
range.
Step and Peak to Center are functions to make easy operation in some case. When the step is
defined, the frequency entry will change for the step number. Peak to Center will find the peak
signal on display and then change the center frequency to the frequency of peak signal. Peak to
Center will not activate the marker.
8
7
4
1
0
9
5
6
3
2
.
-
31
Page 34
p
,
2.7GHz Spectrum Analyzer Operation Manual
Center Frequency
☛
Frequency
Center
8
7
4
5
2
1
.
0
GHz
9
dBm
MHz
6
dBmV
kHz
3
dBuV
BK SP
-
SAT JAN 28
2003
Ref Lvl: -30.0 dBm
-30.0
-40.0
-50.0
Center:100.0MHz
-60.0
-70.0
-80.0
-90.0
-100.0
-110.0
Start:99.5MHz
RBW:30 kHz
VBW:100 kHz
14:30:25
INT:REF
AMPL CAL
Center:100.0MHz
Span:1.0MHz
Stop:100.5MHz
Swee
:100.0ms
Center
Start
Stop
Step
Peak->
Center
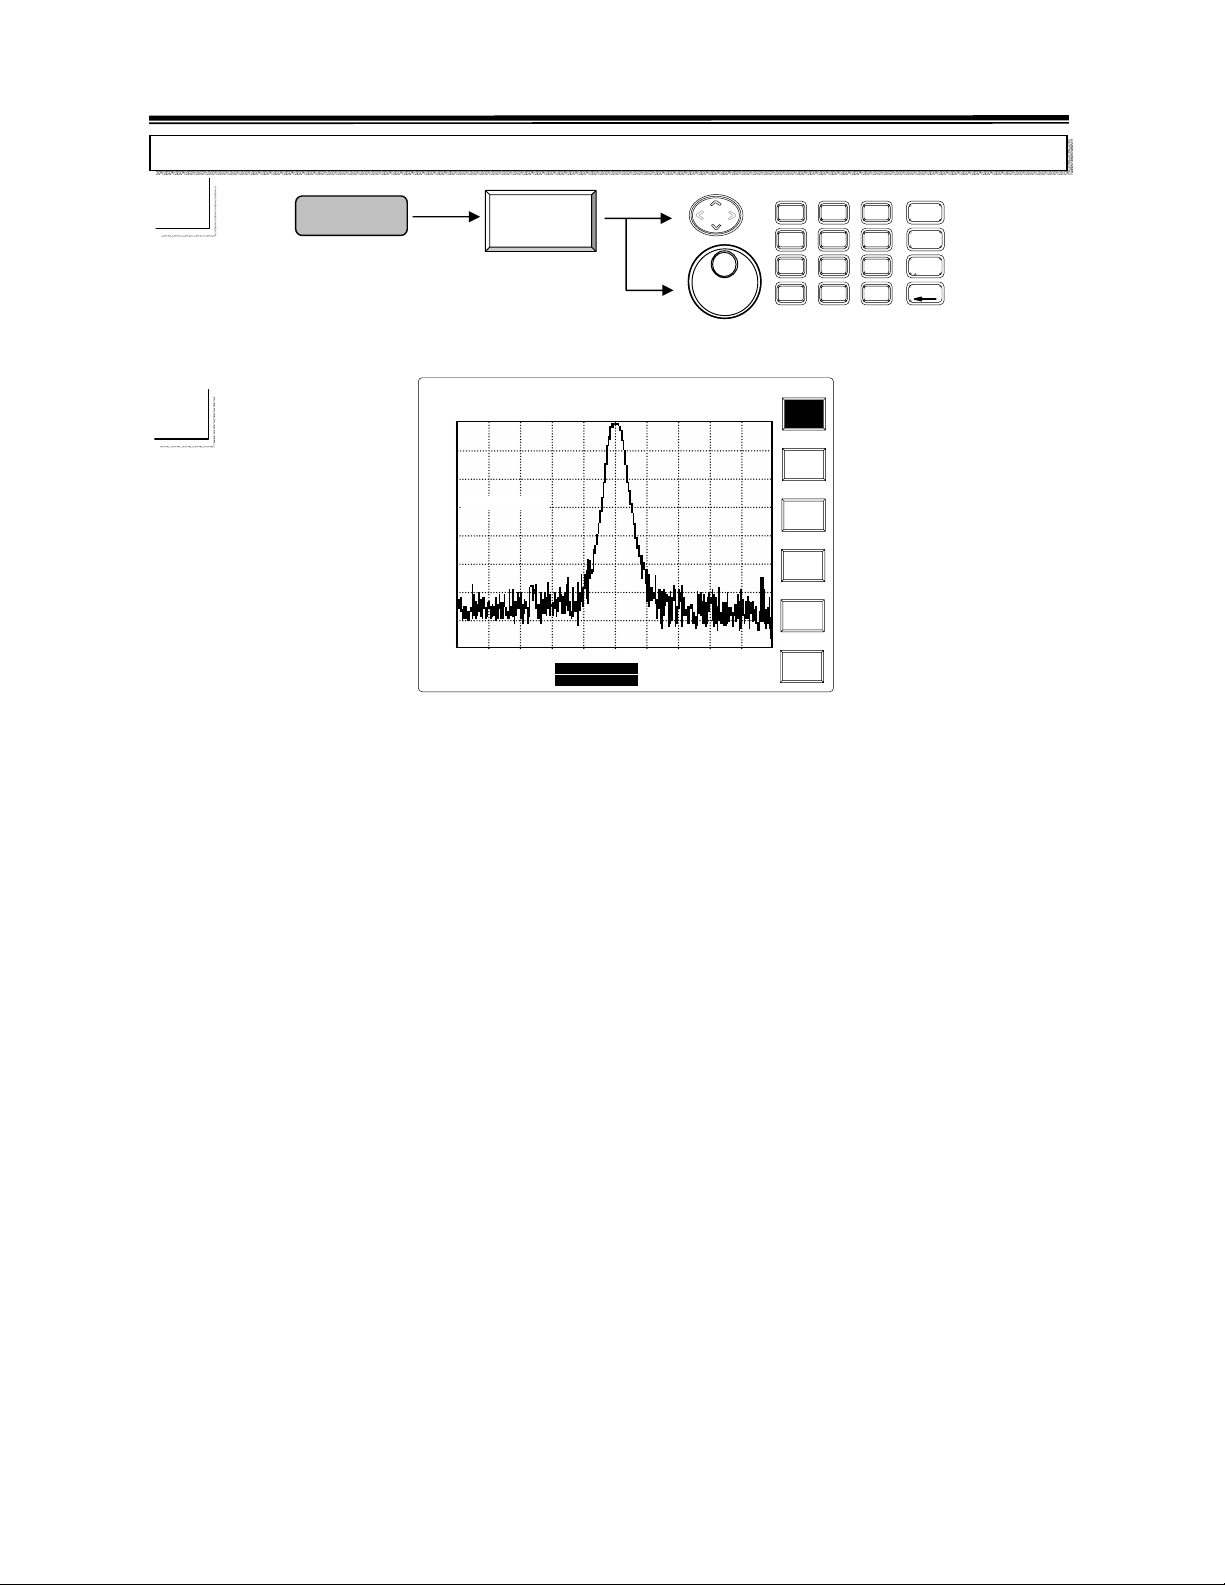
UP/ DOWN: To change frequency for one step size which is defined in Step function.
Scroll: To change the Center frequency 1/500 span for every movement.
For example, center frequency is 100MHz, span is 10MHz. Every movement of scroll key
will change 20kHz. Clockwise rotation increases the setting and counterclockwise rotation
decreases the setting.
Editing: Directly specify the center frequency. The back space key BK SP can erase the last
number.
Note: Refer to Span function to see the operation.
32
Page 35
,
2.7GHz Spectrum Analyzer Operation Manual
Start/ Stop Entry
☛
Frequency
Start
Stop
8
7
4
5
2
1
.
0
GHz
9
dBm
MHz
6
dBmV
kHz
3
dBuV
BK SP
-
SAT JAN 28
2003
Ref Lvl: -30.0 dBm
-30.0
-40.0
-50.0
-60.0
-70.0
-80.0
-90.0
-100.0
-110.0
Start:99.5MHz
RBW:30 kHz
VBW:100 kHz
14:30:25
INT:REF
AMPL CAL
Center:100.0MHz
Span:1.0MHz
Stop:100.5MHz
Sweep:100.0ms
Center
Start
Stop
Step
Peak->
Center
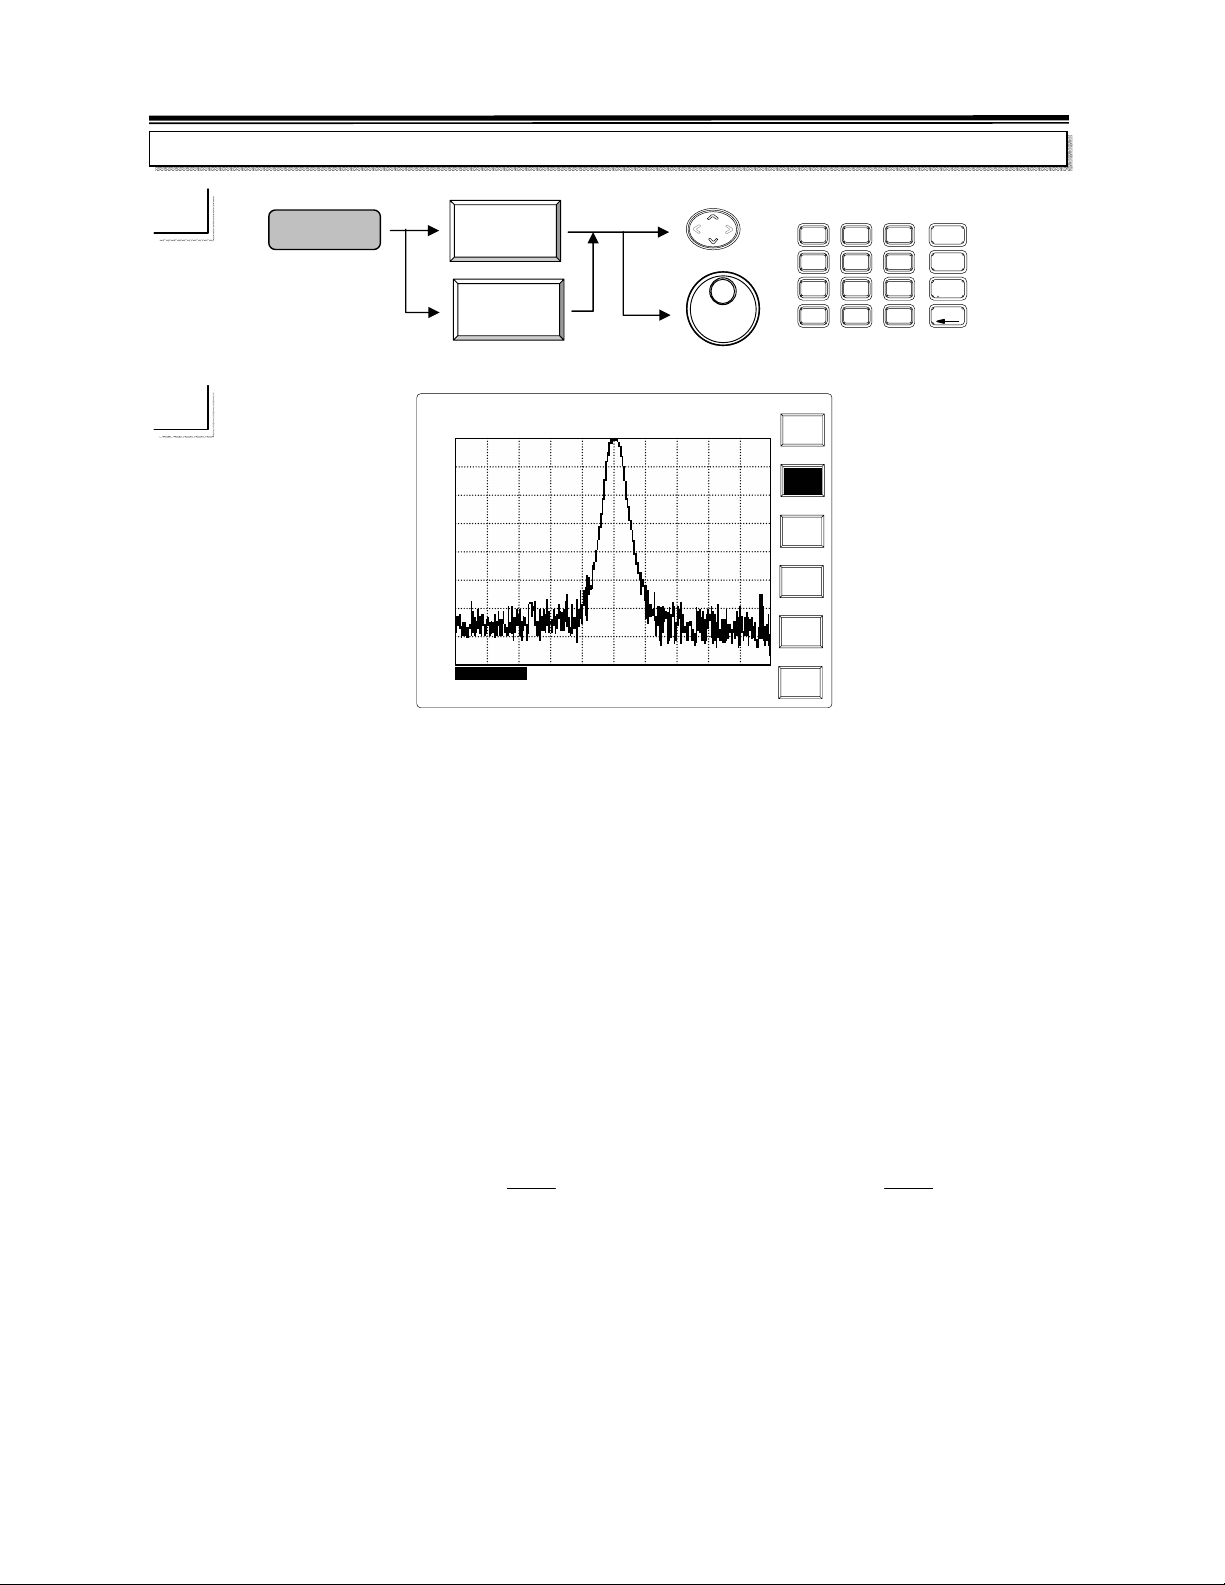
UP/ DOWN: To change frequency for one step size which is defined in Step function.
Scroll: To change the frequency 1/500 Span for every single movement. Clockwise rotation
increases the setting while counterclockwise rotation decreases the setting.
For example, the start frequency is at 95.0MHz and stop frequency is at 105.0MHz, the
span is at 10MHz, the first clockwise movement of scroll key will change Start Frequency
to 99.52MHz. The second movement will change the start frequency to 95.03996MHz since
the span was changed to 9.98MHz (105.0-95.02).
Editing: Directly specify the center frequency.
The relation between Center/Span and Start/Stop are as follows.
Sapn
CenterencyStartFrequ
−=
and
2
CenterncyStopFreque
Sapn
+=
2
33
Page 36
,
2.7GHz Spectrum Analyzer Operation Manual
Step
☛
Frequency
Step
8
7
4
5
2
1
.
0
GHz
9
dBm
MHz
6
dBmV
kHz
3
dBuV
BK SP
-
2003
SAT JAN 28
Ref Lvl: -30.0 dBm
-30.0
-40.0
-50.0
Step:1MHz
-60.0
-70.0
-80.0
-90.0
-100.0
-110.0
Start:99.5MHz
RBW:30 kHz
VBW:100 kHz
14:30:25
INT:REF
AMPL CAL
Center:100.0MHz
Span:1.0MHz
Stop:100.5MHz
Sweep:100.0ms
Center
Start
Stop
Step
Peak->
Center
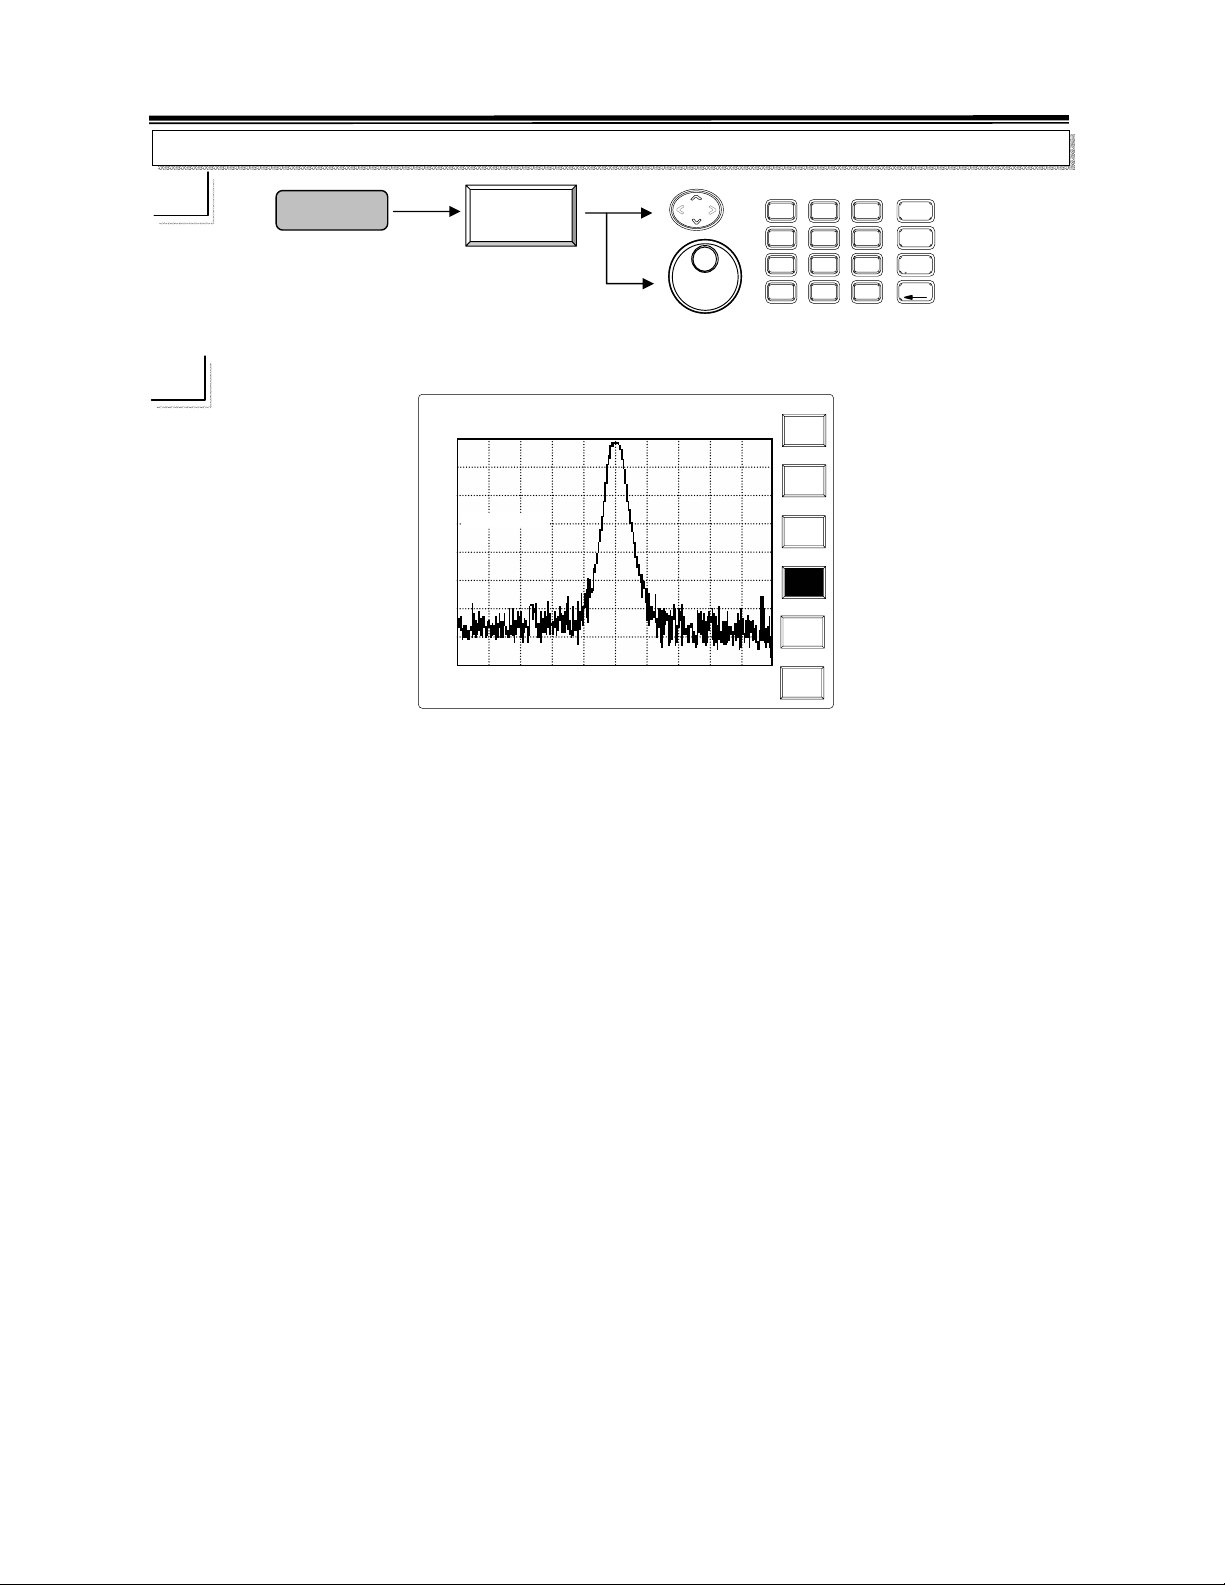
UP/DOWN: To change the Step by 1/10 of span each time.
Scroll: To change the Step by 1/10 Span for every key pushing. Clockwise rotation increases the
setting while counterclockwise rotation decreases the setting.
For example, if the span is 100MHz, UP/DOWN and Scroll keys will change the frequency
10MHz for every key pushing or scroll movement.
Editing: To specify the center frequency directly.
34
Page 37
,
,
2.7GHz Spectrum Analyzer Operation Manual
Peak->center
☛
Frequency
Peak->
Center
SAT JAN 28
2003
Ref Lvl: -30.0 dBm
-30.0
-40.0
-50.0
-60.0
-70.0
-80.0
-90.0
-100.0
-110.0
Start:99.6MHz
RBW:30 kHz
VBW:100 kHz
14:30:25
INT:REF
AMPL CAL
Center:100.1MHz
Span:1.0MHz
Stop:100.6MHz
Sweep:100.0ms
Center
Start
Stop
Step
Peak->
Center
2003
SAT JAN 28
Ref Lvl: -30.0 dBm
-30.0
-40.0
-50.0
-60.0
-70.0
-80.0
-90.0
-100.0
-110.0
Start:99.5MHz
RBW:30 kHz
VBW:100 kHz
14:30:25
INT:REF
AMPL CAL
Center:100.0MHz
Span:1.0M Hz
Stop:100.5MHz
Sweep:100.0ms
Center
Start
Stop
Step
Peak->
Center
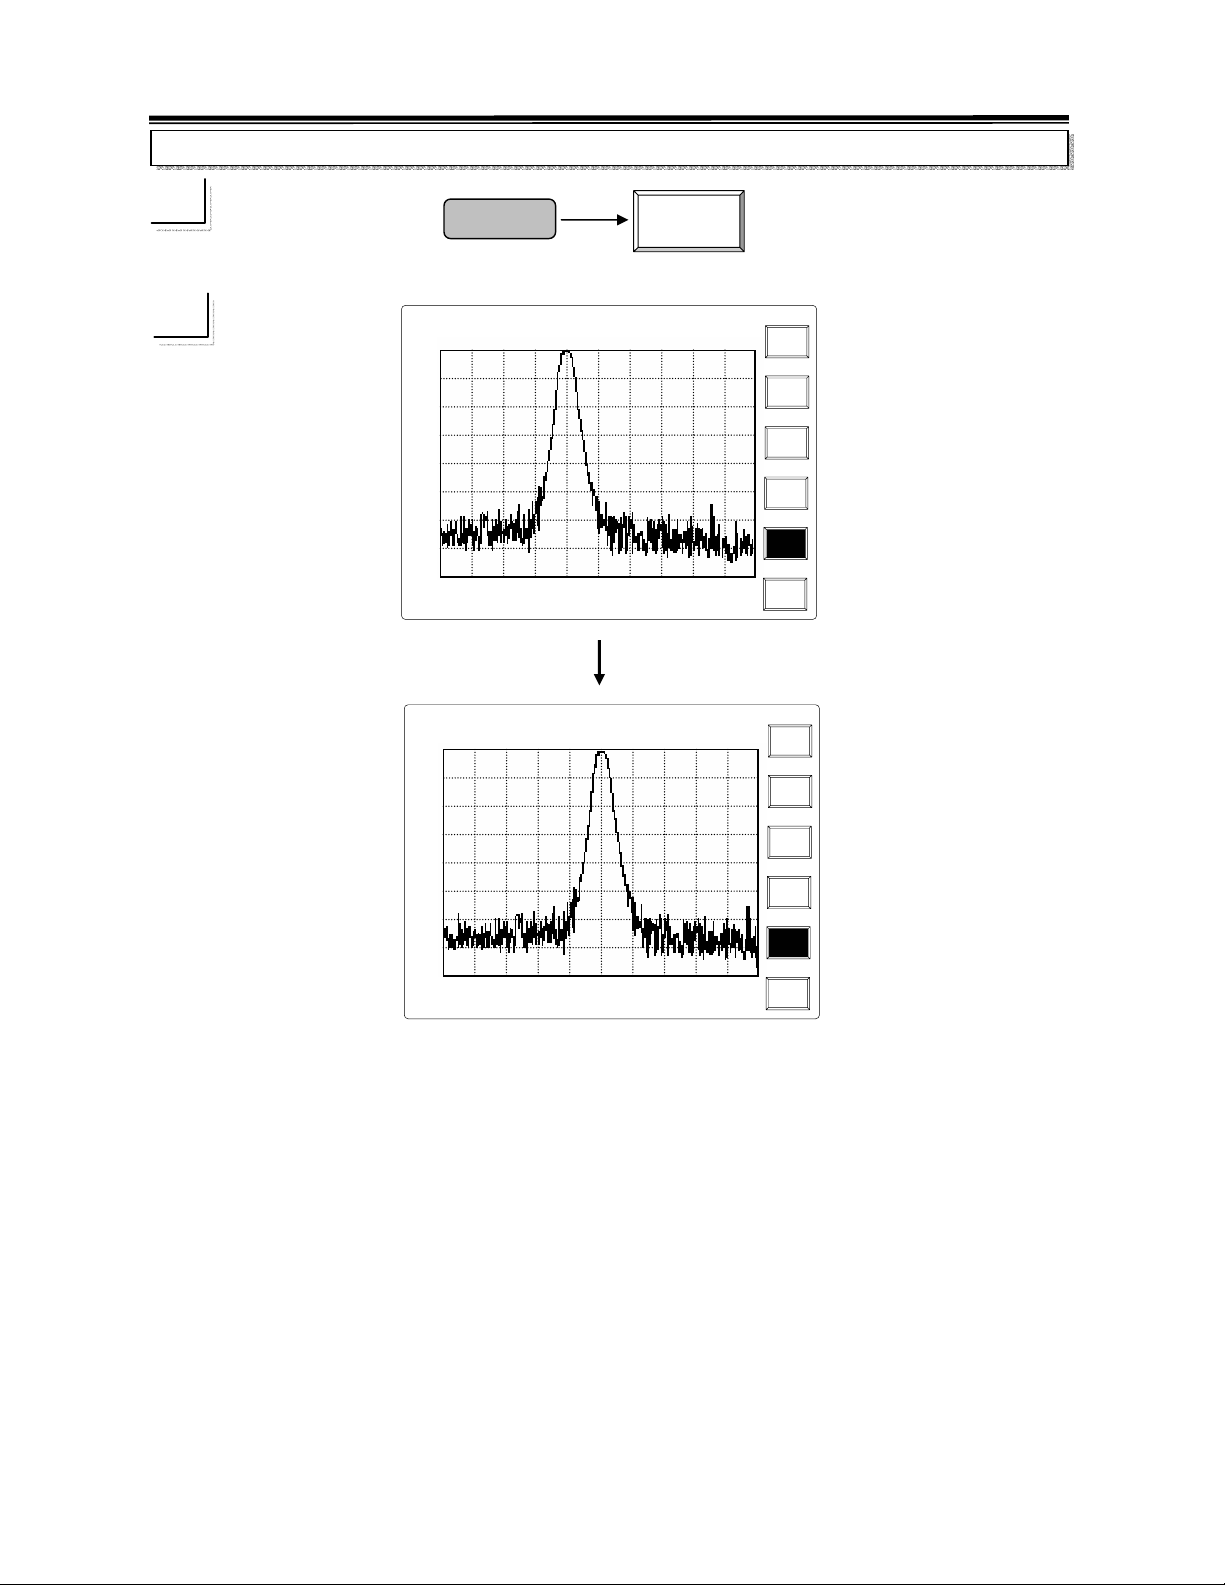
Peak to Center will find the frequency of peak signal first, and then change the Center
frequency to the peak frequency. Prforming this function will not enable all marks.
35
Page 38
2.7GHz Spectrum Analyzer Operation Manual
8.1.2 Span Functions
Span
Center
Full
Start
Span
Zero
stop
Span
Last
Step
Span
Peak->
F1
F2
F3
F4
F5
Span
7
4
1
0
8
9
5
6
3
2
.
-
F6
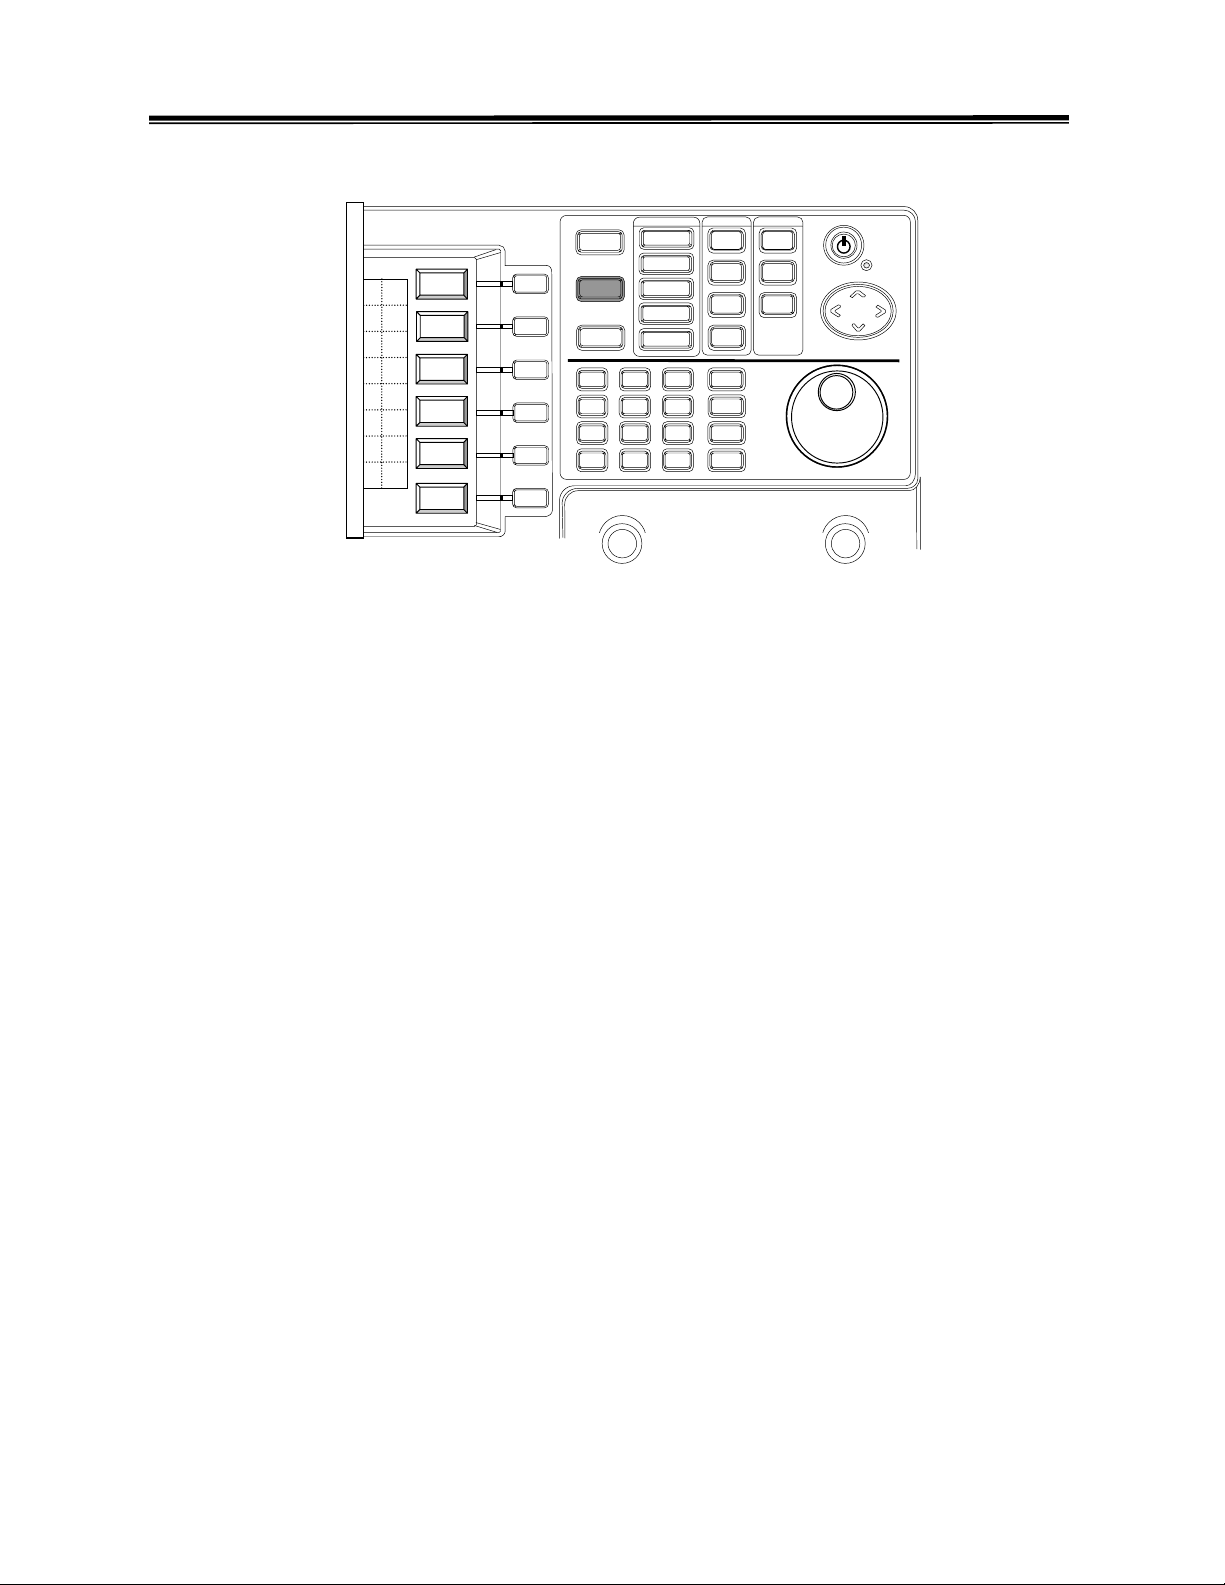
Span is to define the frequency range of measurement. When all the BW settings (RBW, VBW
and Sweep Time) are in
Auto mode, BW settings is changed following the change of the span.
Please refer to the BW function to see the details.
Full Span
2700MHz.
will set the Span at 2700MHz, in other words, the start frequency is at 0 and stop is at
Zero Span will stop the frequency sweep and stay at the Center frequency. In other
words, the unit only measures the center frequency. When the tracking generator is in use, it will
generate a fixed frequency signal not sweeping signal. Refer to
details.
Last Span will let Span return to the last setting. Note that only one last setting will be
TG (Option→TG) function for
kept.
36
Page 39
p
,
,
2.7GHz Spectrum Analyzer Operation Manual
SPAN
☛
Span
8
7
4
5
2
1
.
0
GHz
9
dBm
MHz
6
dBmV
kHz
3
dBuV
BK SP
-
SAT JAN 28
-30.0
-40.0
-50.0
-60.0
-70.0
-80.0
-90.0
-100.0
-110.0
2003
Span:1.0MHz
Start:99.5MHz
RBW:30 kHz
VBW:100 kHz
14:30:25
INT:REF
AMPL CAL
Center:100.0MHz
Span:1.0M Hz
Stop:100.5MHz
Swee
:100.0ms
Span Ref Lvl: -30.0 dBm
Full
Span
Zero
Span
Last
Span
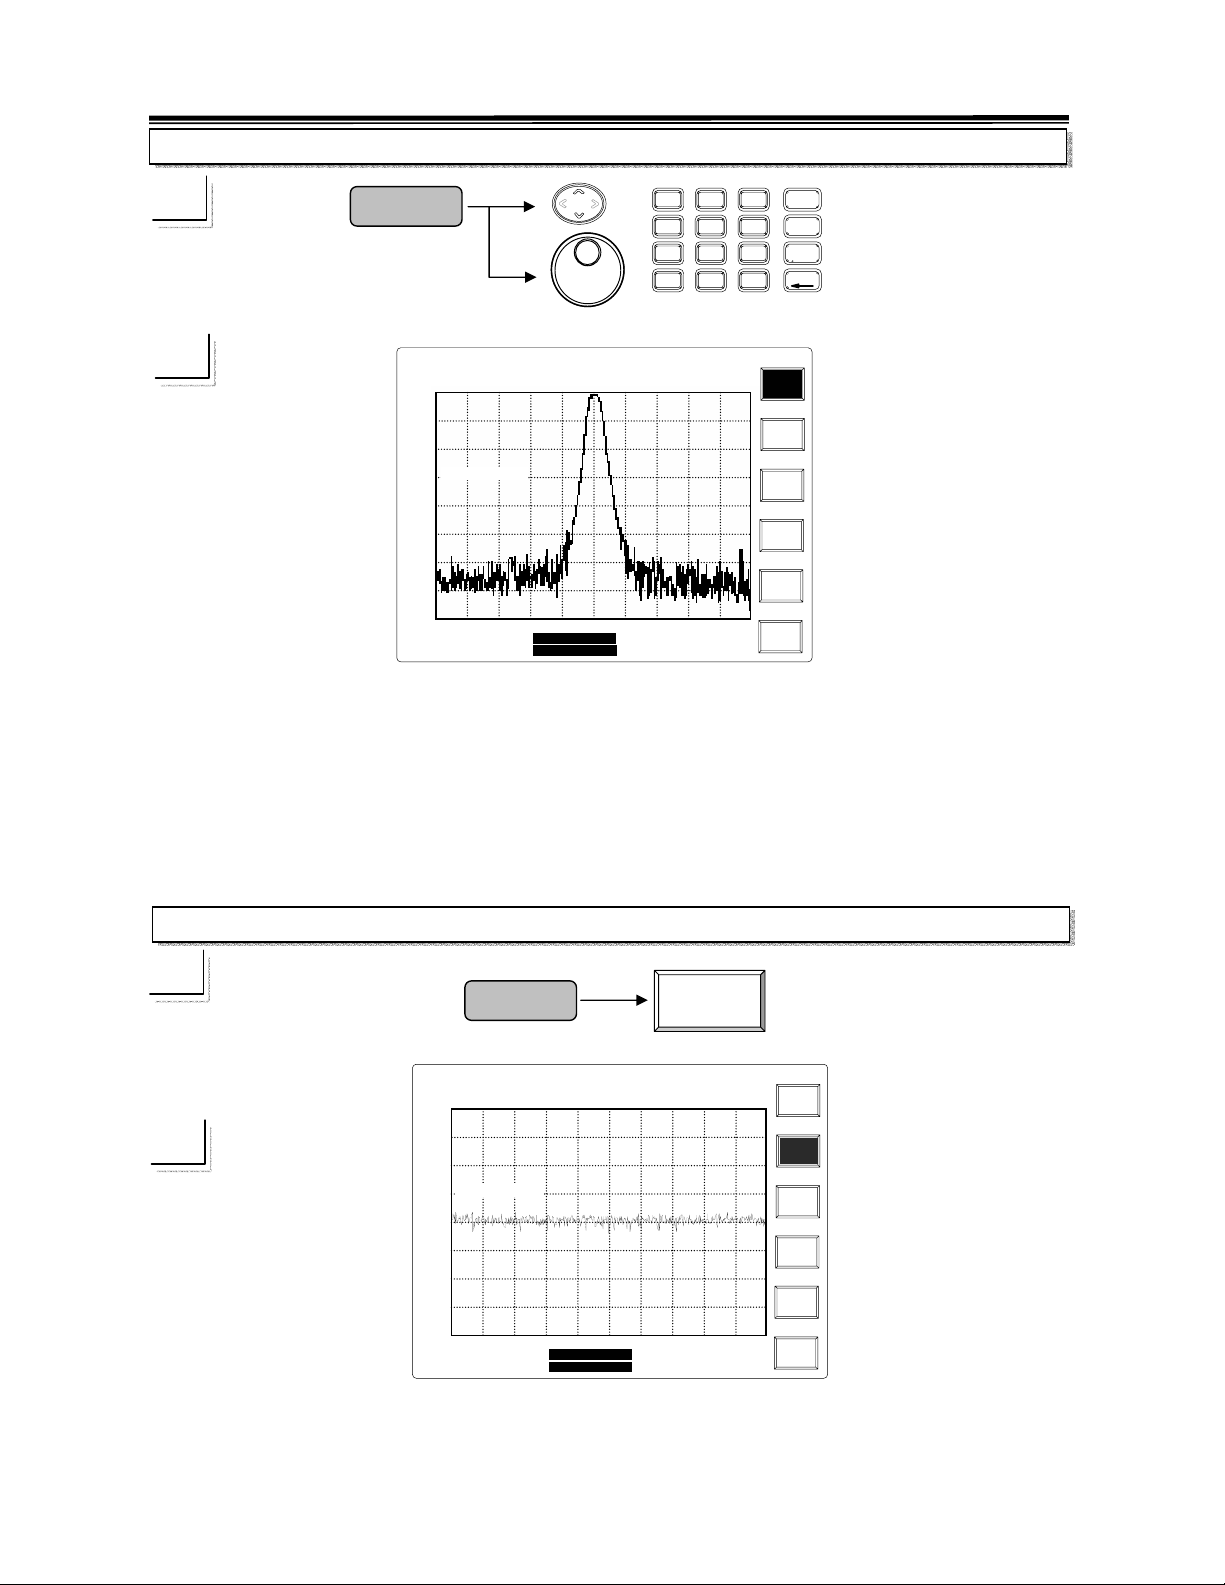
UP/DOWN and Scroll: To change the Span in 1-2-5 sequence. The example is like …1M, 2M, 5M,
10M, 20M, 50M,…, and so on. The Span selection prior to 1kHz is Zero,
and the last Span after 2.5GHz is at 2.7GHz.
Editing: Directly specify the center frequency. The back space key BK SP can erase the last
number.
Full Span
☛
Span
Full
Span
SAT JAN 28
2003
Ref Lvl: -30.0 dBm
-30.0
-40.0
-50.0
Span:2.7GHz
-60.0
-70.0
-80.0
-90.0
-100.0
-110.0
Start:0.0kHz
RBW:4 MHz
VBW:300 kHz
14:30:25
INT:REF
AMPL CAL
Center:1.35GHz
Span:2.7GHz
Stop:2.7GHz
Sweep:300.0ms
Span
Full
Span
Zero
Span
Last
Span
37
Page 40
p
,
,
2.7GHz Spectrum Analyzer Operation Manual
Zero Span
☛
InputZ
Cal
Zero
Span
SAT JAN 28
2003
-30.0
-40.0
-50.0
-60.0
-70.0
-80.0
-90.0
-100.0
-110.0
RBW:4MHz
VBW:10 kHz
14:30:25
INT:REF
AMPL CAL
Center:100.0MHz
Span:Zero Span
Swee
:100.0ms
Span Ref Lvl: -30.0 dBm
Full
Span
Zero
Span
Last
Span
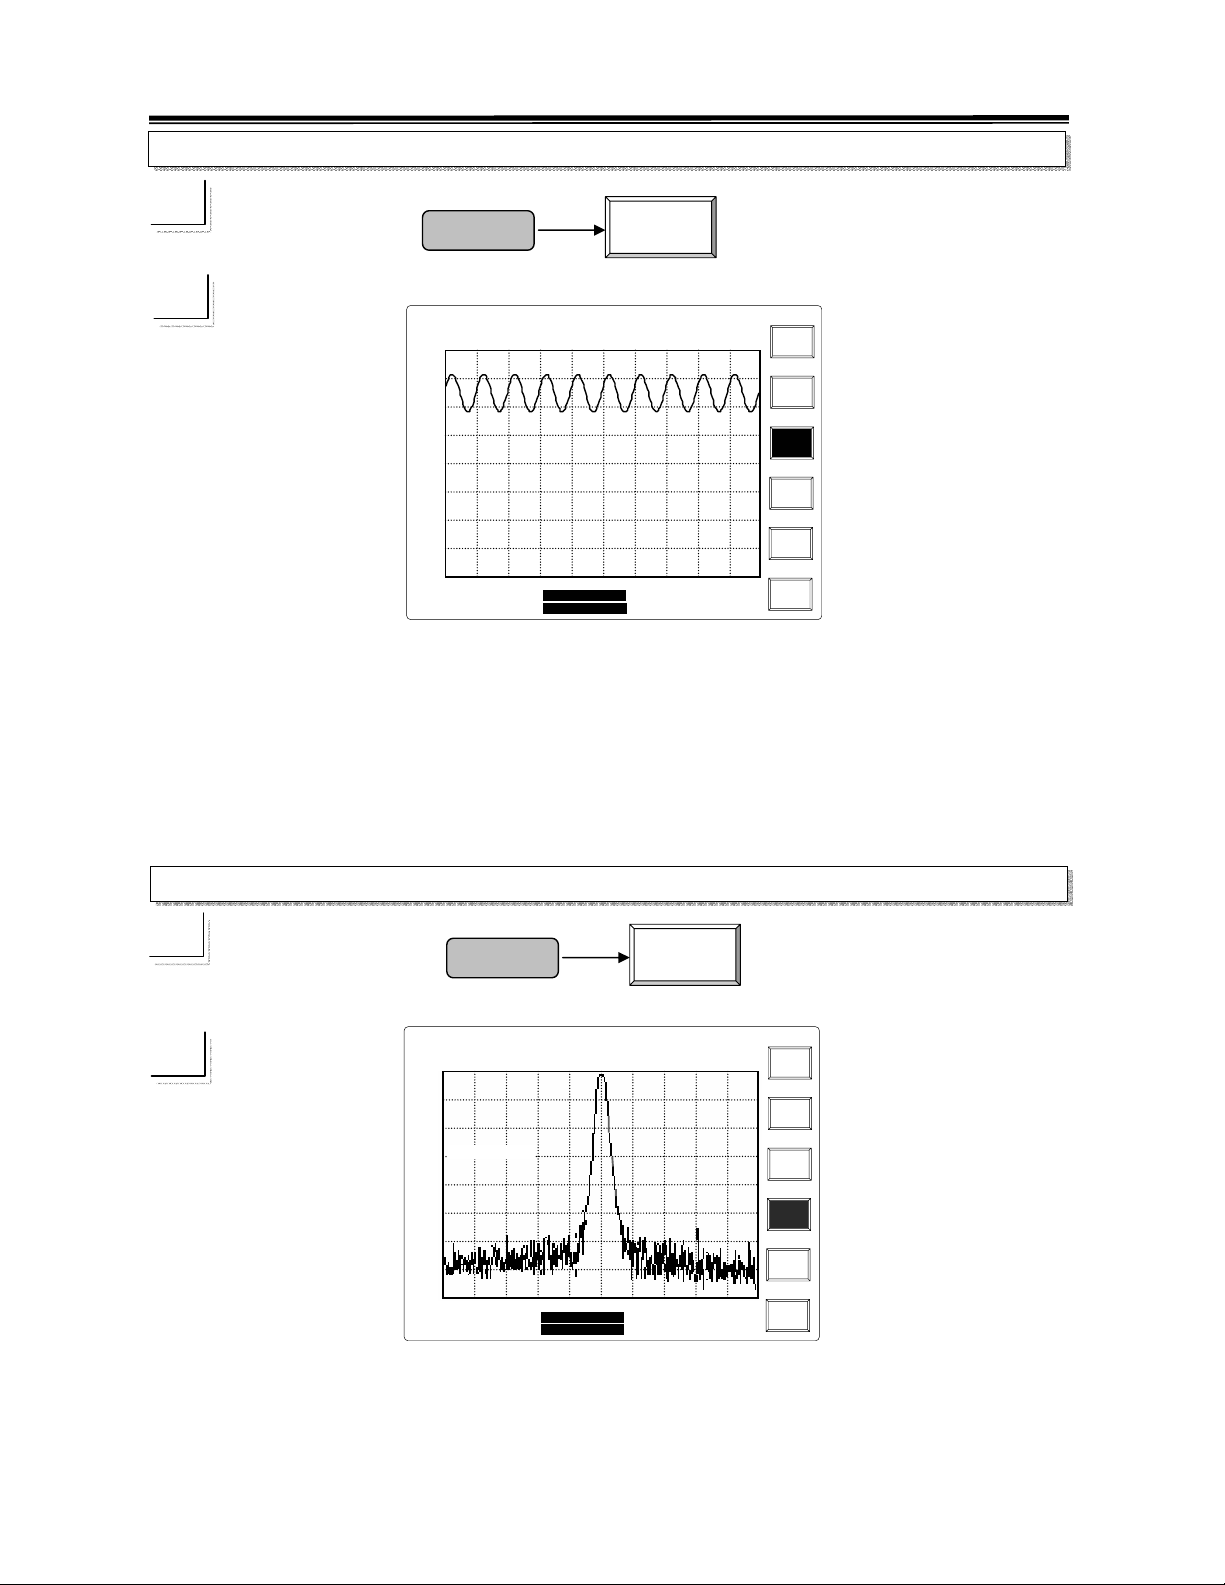
When Zero Span is performed, the measuring frequency will stop sweeping, and only fixes on
Center frequency. An example of AM (amplitude modulation) signal is described above. The
modulating signal is at 100Hz sine wave. Since the measuring frequency is fixed, the display
will present the amplitude variation of AM signal, which is at 100Hz in this case.
Last Span
☛
Span
Last
Span
2003
SAT JAN 28
Ref Lvl: -30.0 dBm
-30.0
-40.0
-50.0
Span:20.0MHz
-60.0
-70.0
-80.0
-90.0
-100.0
-110.0
Start:99.0MHz
RBW:300 kHz
VBW:100 kHz
14:30:25
INT:REF
AMPL CAL
Center:100.0MHz
Span:2.0MHz
Stop:101.0MH
Sweep:200.0ms
Span
Full
Span
Zero
Span
Last
Span
Return to the last span by using this key.
38
Page 41
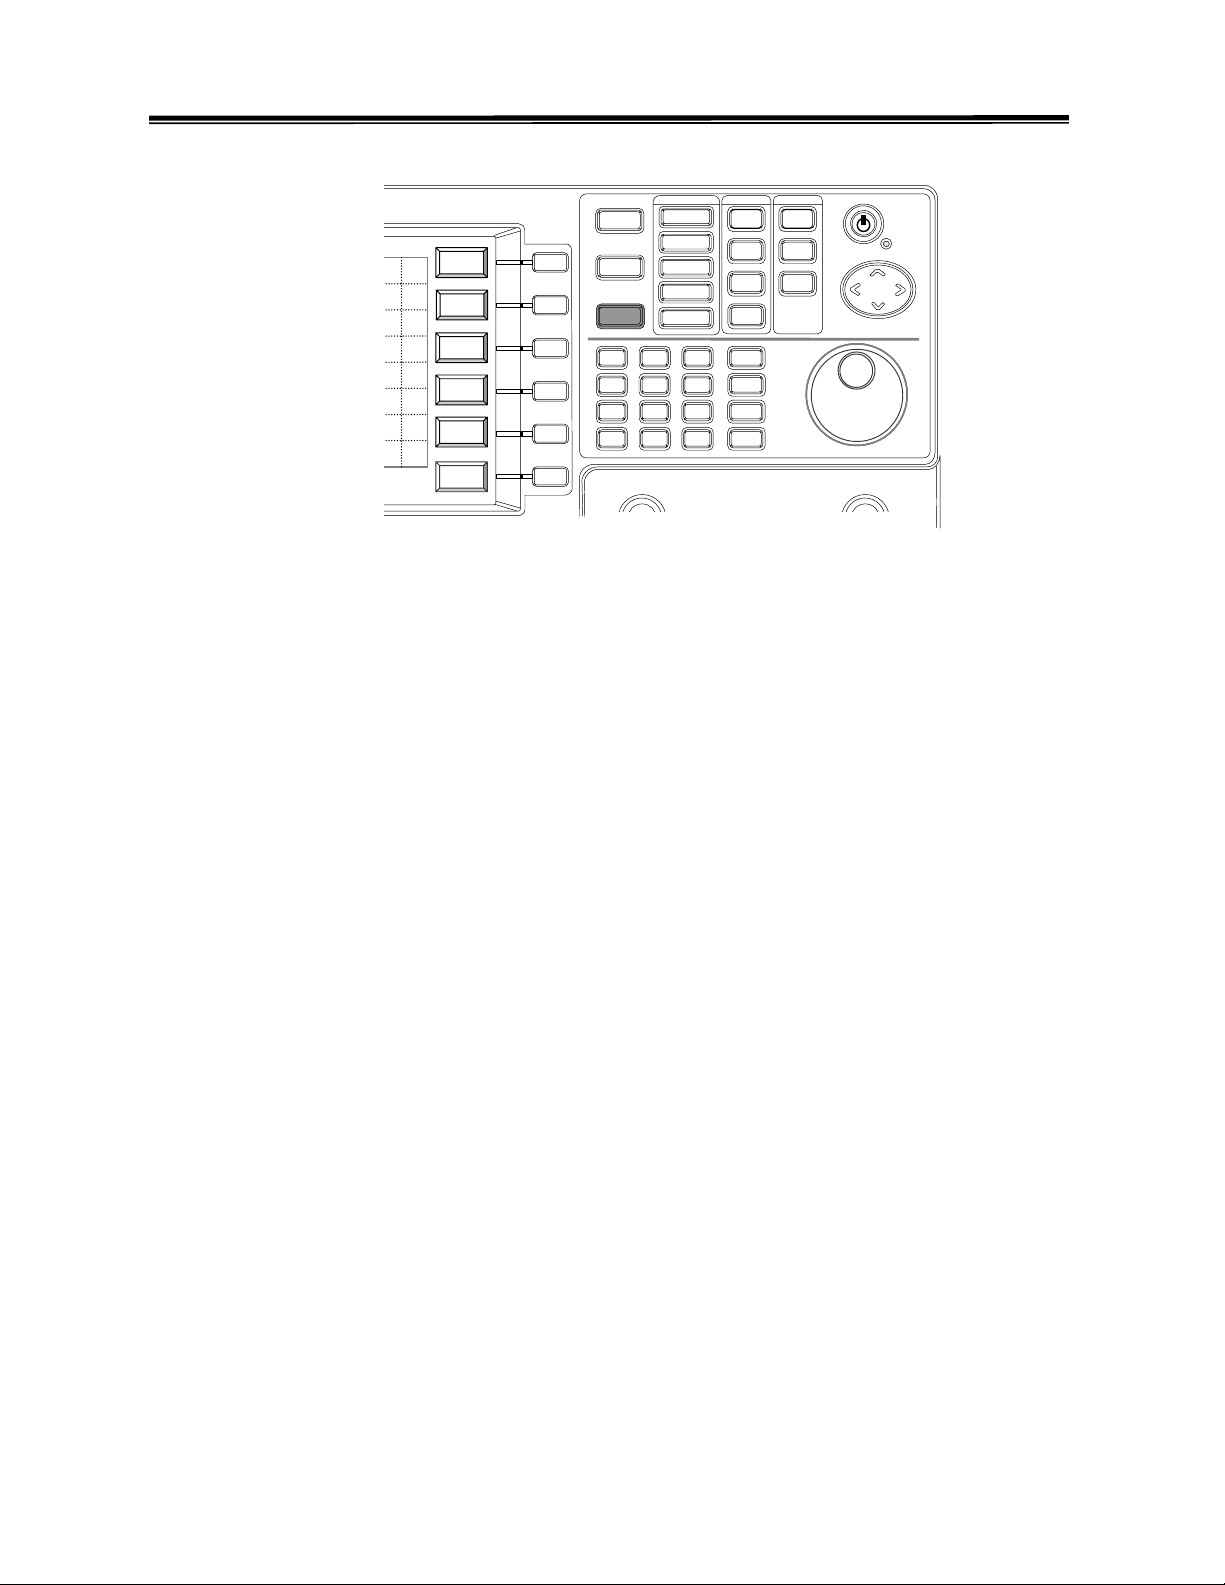
2.7GHz Spectrum Analyzer Operation Manual
8.1.3 Amplitude
Ref
Center
Level
Scale
Start
10 dB
Unit
stop
dBm
Ext Gain
Step
Loss
Peak->
Input Z
Center
50 Ω
Input Z
Cal
F1
F2
Amplitude
F3
F4
F5
F6
8
7
4
1
0
9
5
6
3
2
.
-
Reference Level is the top level on the display. The level of input signal is recommended to
be under the reference level to have accurate result.
The
Scale can be switched in 10-5-2-1 dB sequence. Note that the accuracy will not change
following the scale change. It is a graphical Zoom in function.
Unit includes dBm, dBuV, dBmv and dBm/Hz. There is a transformation factor 107 between
dBm and dBuV.under 50Ω system, and 47dB factor between dBm and dBmV. The dBm/Hz
is the so-called noisy marker which normalizes the reading into 1Hz bandwidth.
ExtGain/Loss allows the amplitude offset caused by user’s application.
InputZ
switch here is a software adjustment.
can toggle the input impedance between 50Ω and 75Ω. Note the 50Ω and 75Ω
Input Z Cal offers the compensation entry of the 75Ω
adaptor. The ideal number is at 5.9dB
39
Page 42
,
A
A
,
2.7GHz Spectrum Analyzer Operation Manual
Reference Level
☛
mplitude
SAT JAN 28
2003
Ref Lvl: -20.0 dBm
-20.0
-30.0
-40.0
Ref Lvl:-20dBm
-50.0
-60.0
-70.0
-80.0
-90.0
-100.0
Start:99.5MHz
RBW:30 kHz
VBW:100 kHz
Ref
Level
14:30:25
INT:REF
AMPL CAL
Center:100.0MHz
Span:1.0MHz
Stop:100.5MHz
Sweep:100.0ms
7
4
1
0
Rel
Level
Scale
10 dB
Unit
dBm
ExtGain
Loss
Input Z
50Ω
Input Z
Cal
8
5
2
.
GHz
9
dBm
MHz
6
dBmV
kHz
3
dBuV
-
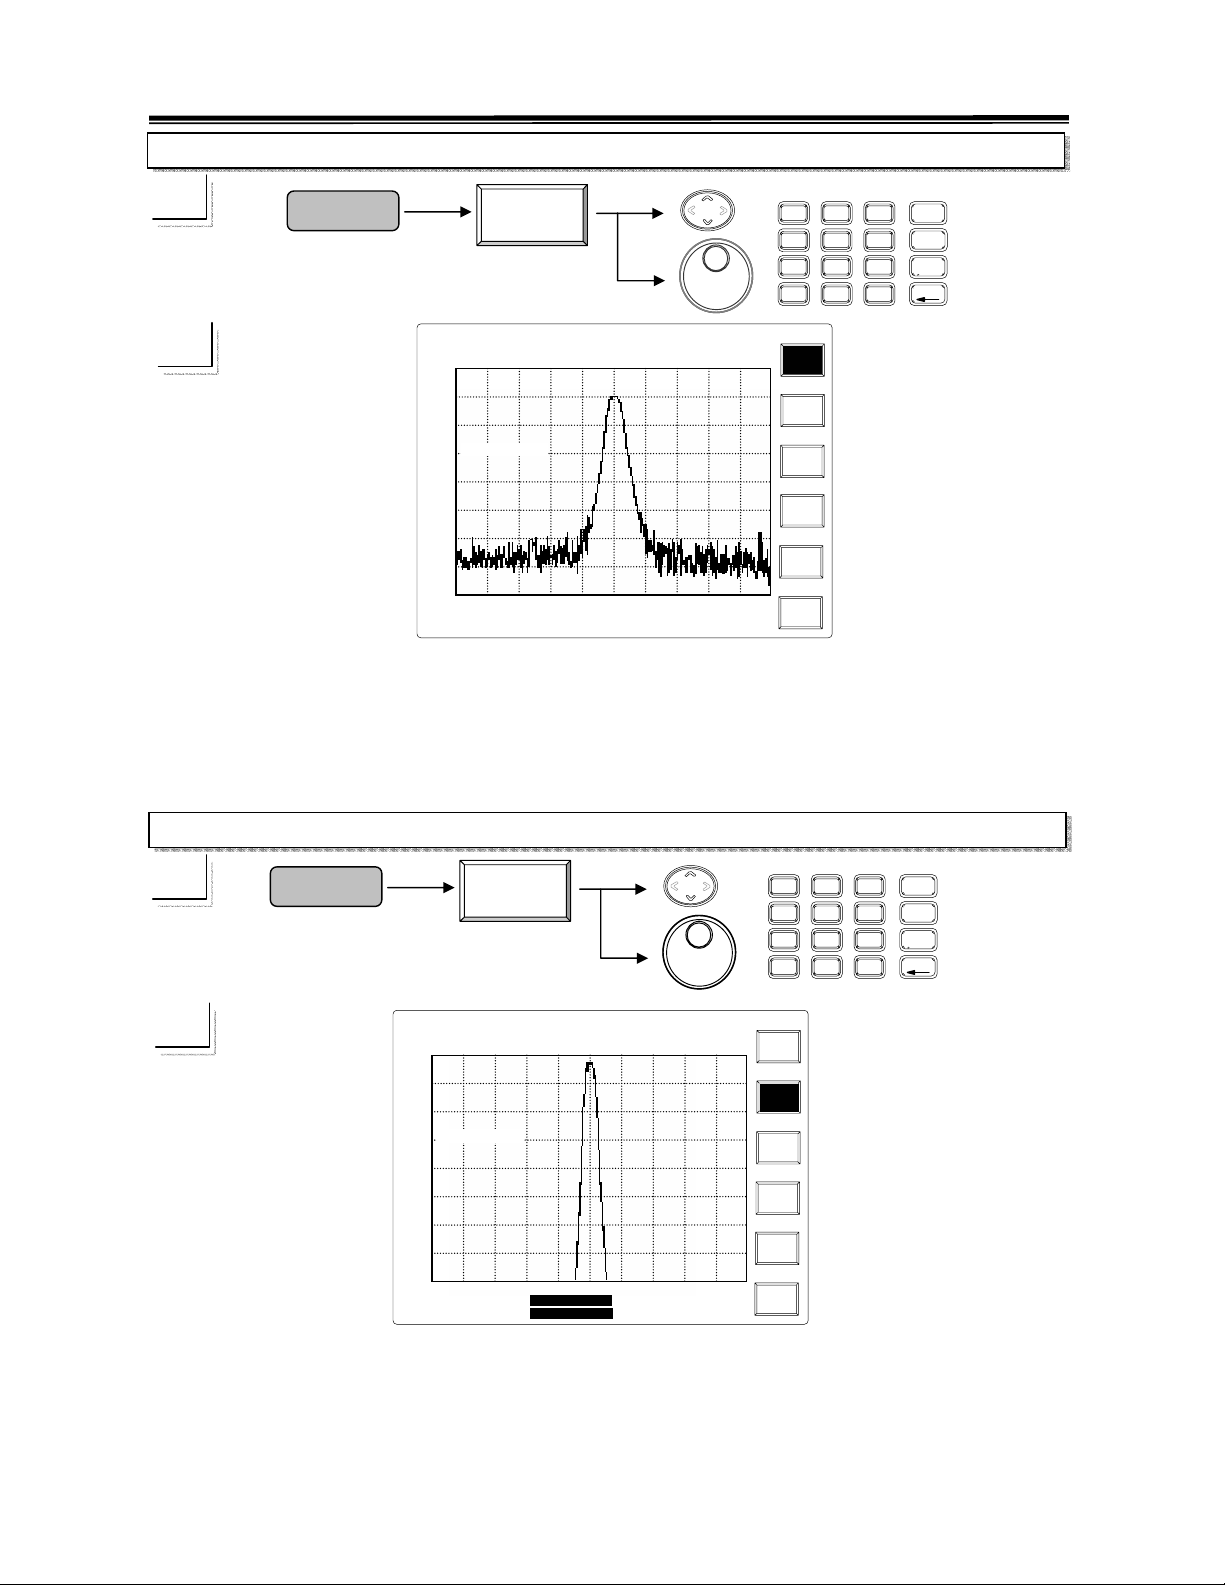
UP/DOWN and Scroll: To change the Reference Level one scale a time. If the scale is at 10dB,
the UP key will increase the RefLvl from –30dBm to –20dBm in the above case.
Numerical: Using the numerical and unit keys can specify the reference level from –50 dBm to
+20dBm in one dBm resolution.
Scale
☛
mplitude
Scale
5dB
7
4
1
0
2003
SAT JAN 28
Ref
Lvl: -30.0 dBm
-30.0
-35.0
-40.0
Scale:5 dB/Div
-45.0
-50.0
-55.0
-60.0
-65.0
-70.0
Start:99.5MHz
RBW:30 kHz
VBW:100 kHz
14:30:25
INT:REF
AMPL CAL
Center:100.0MHz
Span:1.0MHz
Stop:100.5MHz
Sweep:100.0ms
Ref
Level
Scale
5dB
Unit
dBm
ExtGain
Loss
InputZ
50Ω
UP/DOWN and Scroll keys switch the scale in 10-5-2-1 sequence.
Editing: The editing entry will select the closest scale to 10-5-2-1 one.
8
5
2
.
GHz
9
dBm
MHz
6
dBmV
kHz
3
dBuV
-
40
Page 43
A
,
A
,
2.7GHz Spectrum Analyzer Operation Manual
Unit
☛
mplitude
Unit
dBm
SAT JAN 28
Ref
Lvl: 77.0 dBuV
77.0
67.0
57.0
RefLvl:77.o dBuV
47.0
37.0
27.0
17.0
7.0
-3.0
Start:99.5MHz
RBW:30 kHz
VBW:100 kHz
2003
14:30:25
INT:REF
AMPL CAL
Center:100.0MHz
Span:1.0MHz
Stop:100.5MHz
Sweep:100.0ms
Ref
Level
Scale
5dB
Unit
dBuV
ExtGain
Loss
InputZ
50Ω
InputZ
Cal
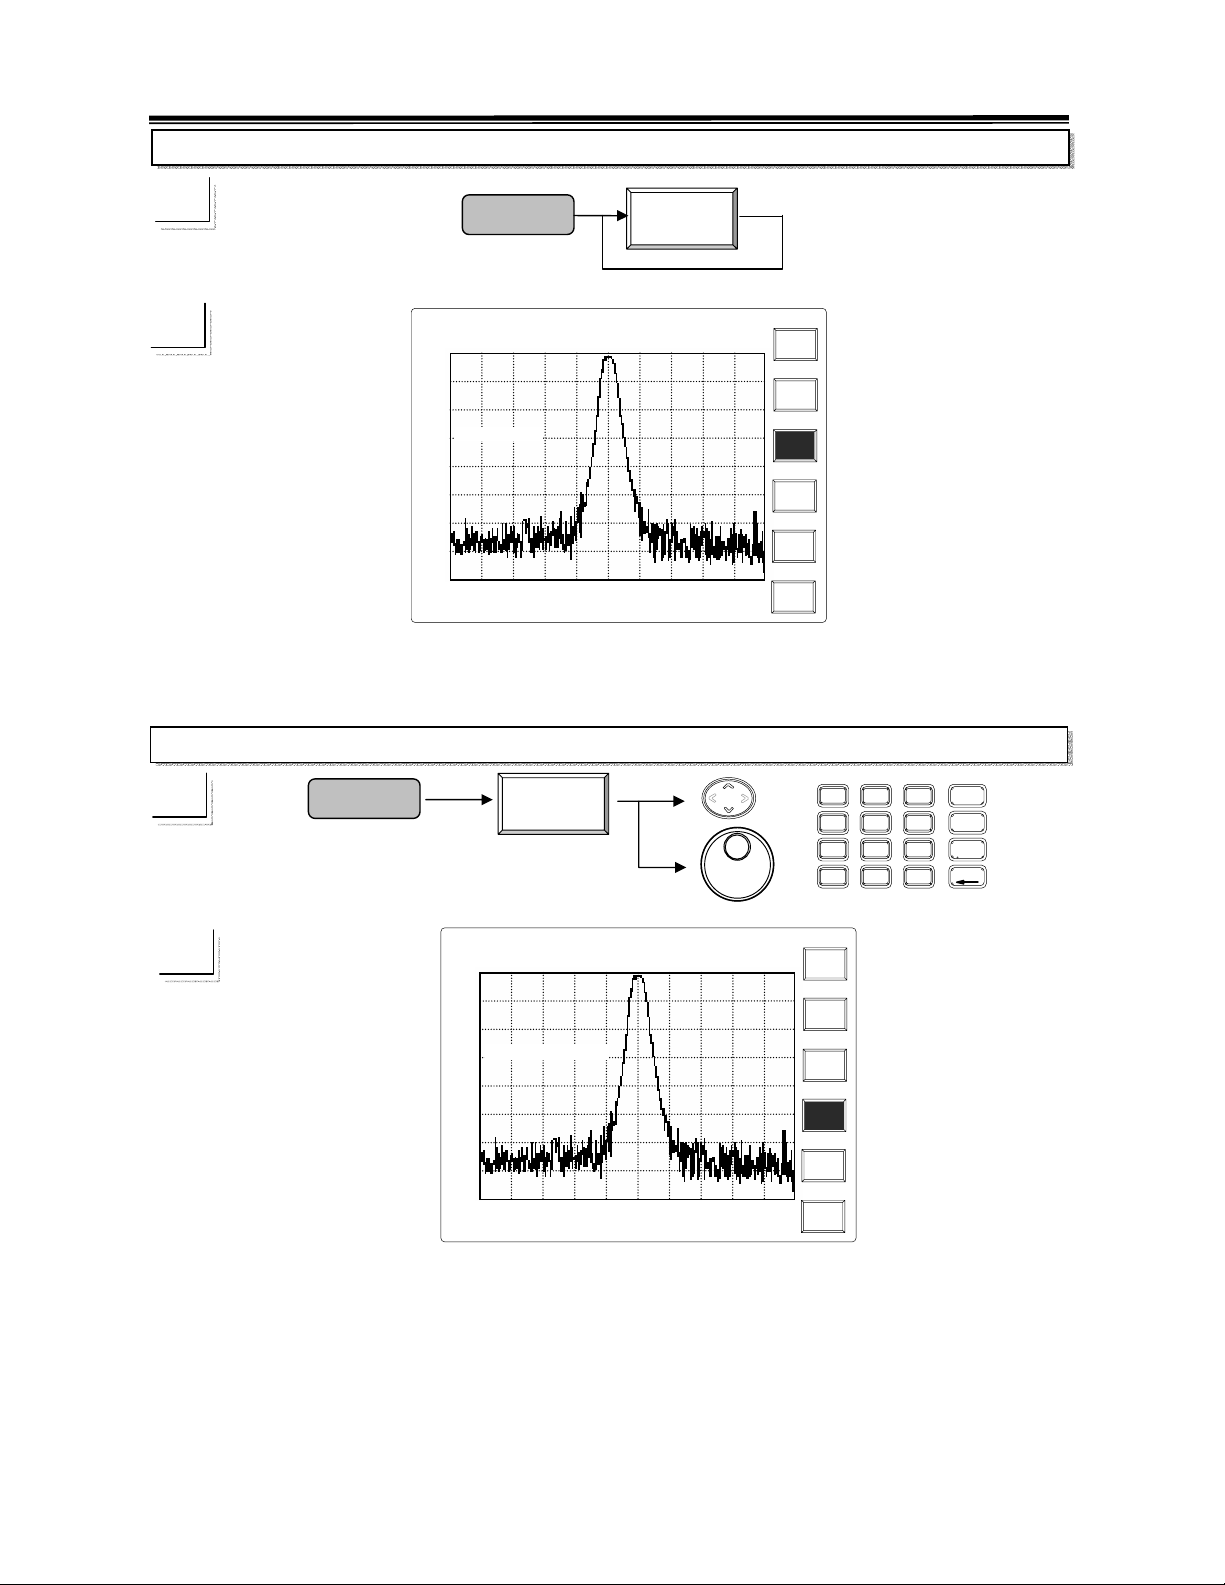
Repeat this key will switch the unit in dBm, dBuV, dBmV and dB/Hz sequence.
External Gain Loss offset
☛
mplitude
Ext Gain
Loss
7
4
1
0
1
SAT JAN 28
Ref
Lvl: 87.0 dBuV
87.0
77.0
67.0
Ext Gain /Loss: 10.0 dB
57.0
47.0
37.0
27.0
17.0
7.0
Start:99.5MHz
RBW:30 kHz
VBW:100 kHz
14:30:25
INT:REF
AMPL CAL
Center:100.0MHz
Span:1.0M Hz
Stop:100.5MH
Sweep:100.0ms
Ref
Level
Scale
5dB
Unit
dBuV
ExtGain
Loss
InputZ
75Ω
InputZ
Cal
2003
UP/DOWN and Scroll: To change offset by 0.1dB for every move.
Editing: To adjust the offset from -99.0 to 99.0dB in 0.1 dB resolution.
8
5
2
.
GHz
9
dBm
MHz
6
dBmV
kHz
3
dBuV
-
41
Page 44
A
p
,
A
,
2.7GHz Spectrum Analyzer Operation Manual
Input Z 50Ω/ 75Ω
☛
Keep pushing
mplitude
2003
SAT JAN 28
Ref
Lvl: 77.0 dBuV
77.0
67.0
57.0
75 Ohm adaptor
47.0
37.0
27.0
17.0
7.0
-3.0
Start:99.5MHz
RBW:30 kHz
VBW:100 kHz
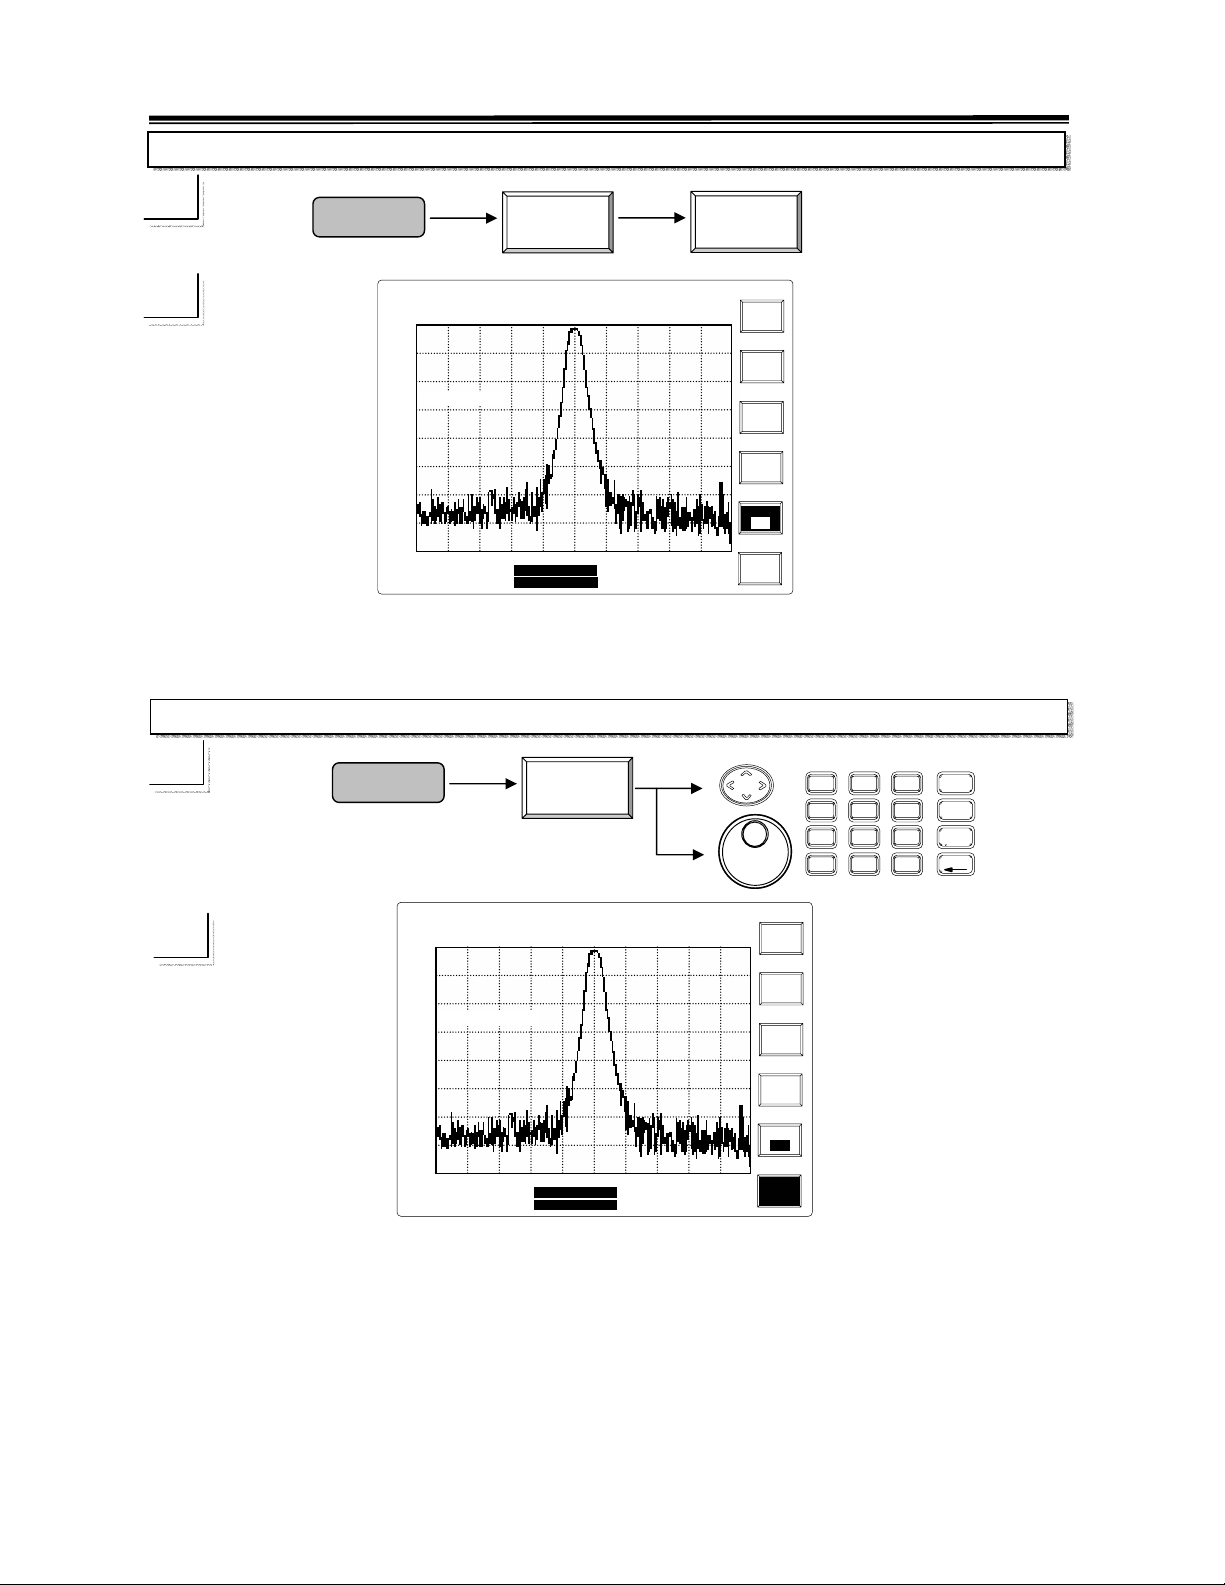
Input Z key will switch the input impedance between 50 and 75Ω. The prompted
Input Z
50
14:30:25
INT:REF
AMPL CAL
Center:100.0MHz
Span:1.0M Hz
Ω
Stop:100.5MHz
Swee
:100.0ms
message will appear that the “zz adaptor” should be connected.
Input Z Cal
Input Z
75
Ω
Ref
Level
Scale
5dB
Unit
dBuV
ExtGain
Loss
InputZ
75Ω
InputZ
Cal
☛
mplitude
Input Z
Cal
8
7
4
5
2
1
.
0
SAT JAN 28
2003
14:30:25
Ref
Lvl: 82.0 dBuV
82.0
72.0
62.0
Input Z Loss:5.0 dB
52.0
42.0
32.0
22.0
12.
2.0
Start:99.5MHz
RBW:30 kHz
VBW:100 kHz
-95.0
INT:REF
AMPL CAL
Center:100.0MHz
Span:1.0M Hz
Stop:100.5MHz
Sweep:100.0ms
Ref
Level
Scale
5dB
Unit
dBuV
ExtGain
Loss
InputZ
75Ω
InputZ
Cal
UP/DOWN and Scroll: To change offset by 0.1dB for every move.
Editing: Editing keys can adjust the offset from -10.0 to 10.0dB in 0.1 dB resolution. The ideal
number is at 5.9dB
The “Input Z Cal” performs only when the input Z is at 75
switched to 50
Ω, the calibration value will return to 0.
Ω. In other words, when the input Z is
GHz
9
dBm
MHz
6
dBmV
kHz
3
dBuV
-
42
Page 45
2.7GHz Spectrum Analyzer Operation Manual
8.2 Measurement Functions
8.2.1 Marker
Center
Marker 1
Marker
Start
ON
stop
∆Mkr 2
Mkr->
Step
Center
Peak->
Multi-Mkr
Center
Mode ON
Marker
Center
ON OFF
To
Start
Peak
Normal
stop
∆Mkr
Mkr->
Step
Center
Peak->
Multi-Mkr
Center
Mode ON
F1
F2
F3
F4
F5
F6
7
4
Marker
8
9
5
6
3
2
1
.
0
-
All ON
/OFF
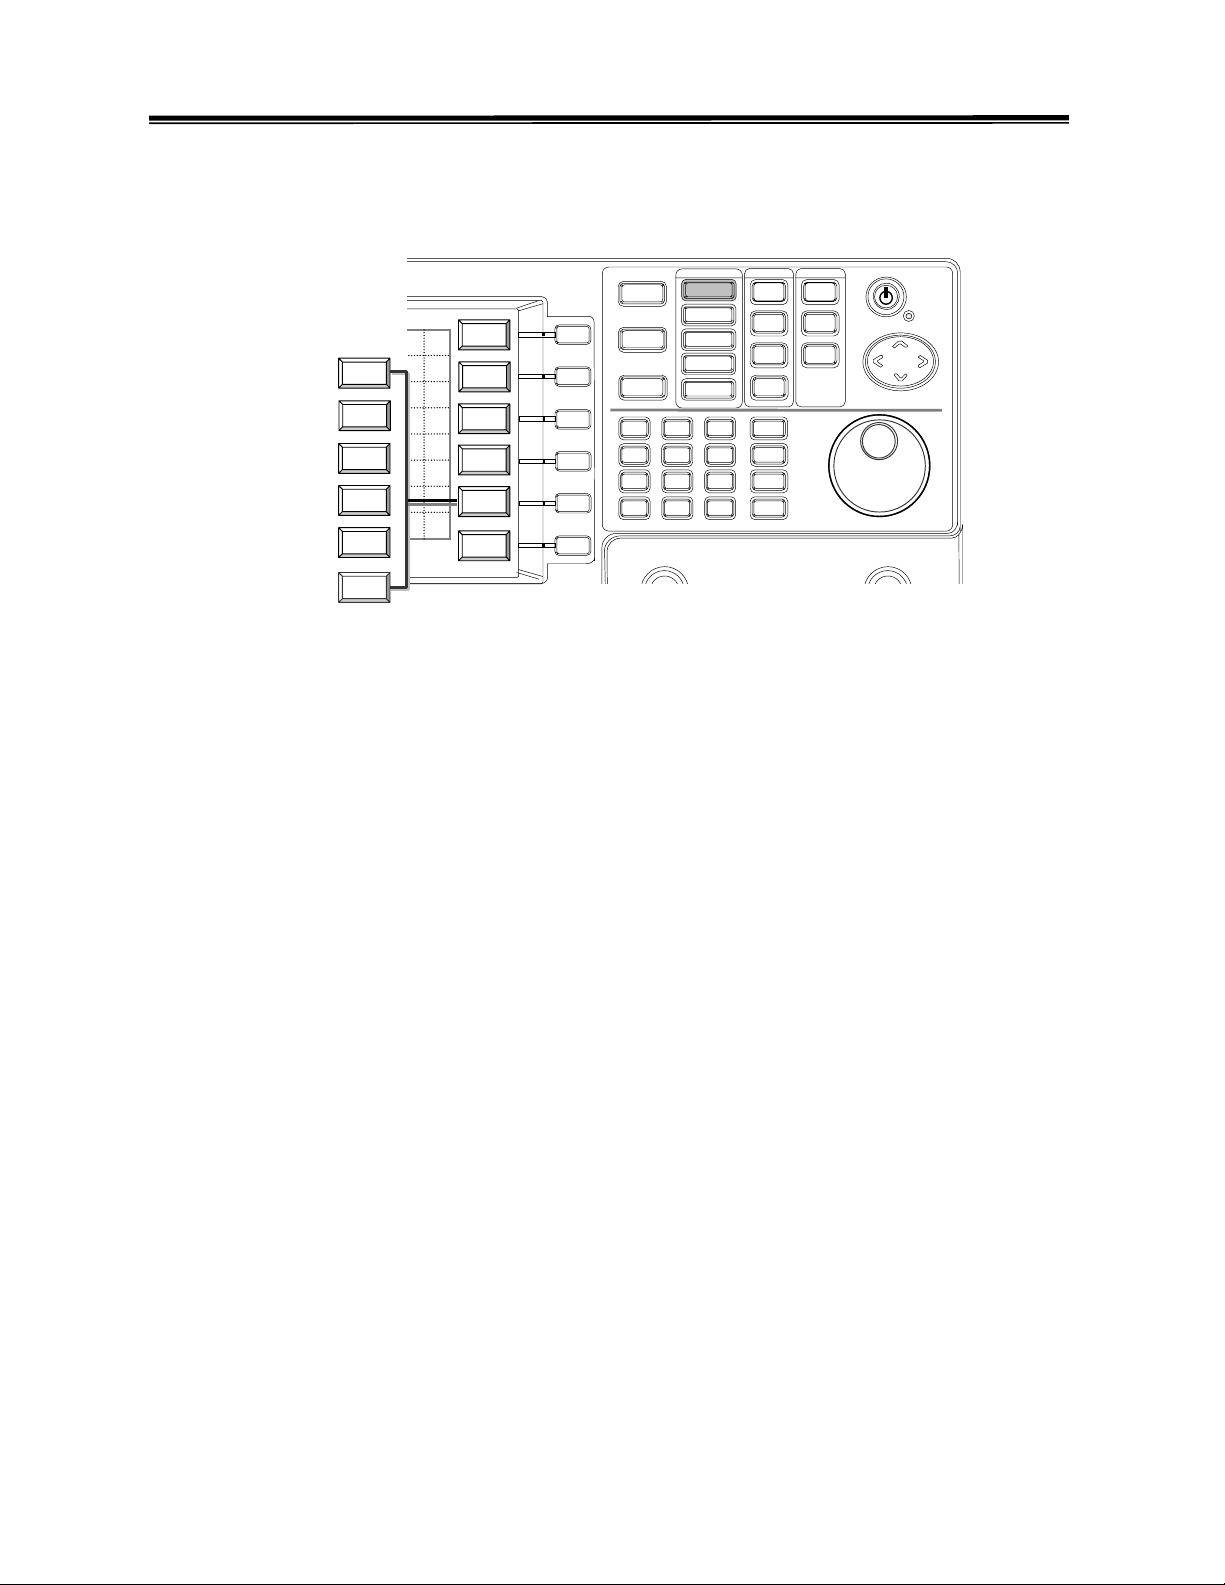
There are two operation modes of Markers due to Marker Number in operation. In single
Marker mode,
Marker is used to read the frequency and level readings of signal on the
display.
This unit offers two modes of marker operation, single marker and multi-marker modes. In
single marker mode, the
signal.
Marker to Center function will change the Center frequency to the marked
frequency by marker.
To Peak function will let the marker find and stand on the peak
Delta (∆) mode will activate the delta marker, which will present both
the frequency and level differences with the reference marker.
The
Multi-Marker mode can activate more markers up to ten. Under multi-marker mode,
the measurement readings are displayed on the marker table. Every marker can be specified
to be ∆Marker, and specify any other marker as its reference marker.
Markers to Peaks
function allows the markers to find the peak signals automatically. It is very useful to pick
the EMI signals.
43
Page 46
,
q(
,
2.7GHz Spectrum Analyzer Operation Manual
Marker ON/OFF
☛
Marker
Marker
ON OFF
8
7
4
5
2
1
.
0
GHz
9
dBm
MHz
6
dBmV
kHz
3
dBuV
-
Ref
-30.0
-40.0
-50.0
-60.0
-70.0
-80.0
-90.0
-100.0
-110.0
2003
SAT JAN 28
Lvl: 77.0 dBuV
Freq:100.1MHz
Start:99.5MHz
RBW:30 kHz
VBW:100 kHz
14:30:25
INT:REF
AMPL CAL
Center:100.0MHz
Span:1.0MHz
Marker Level Fre
-83.6 100.0
Stop:100.5MHz
Sweep:100.0ms
MHz)
Marker
ON OFF
Normal
∆Mkr
Mkr->
Center
Peak
Search
MM mode
Off
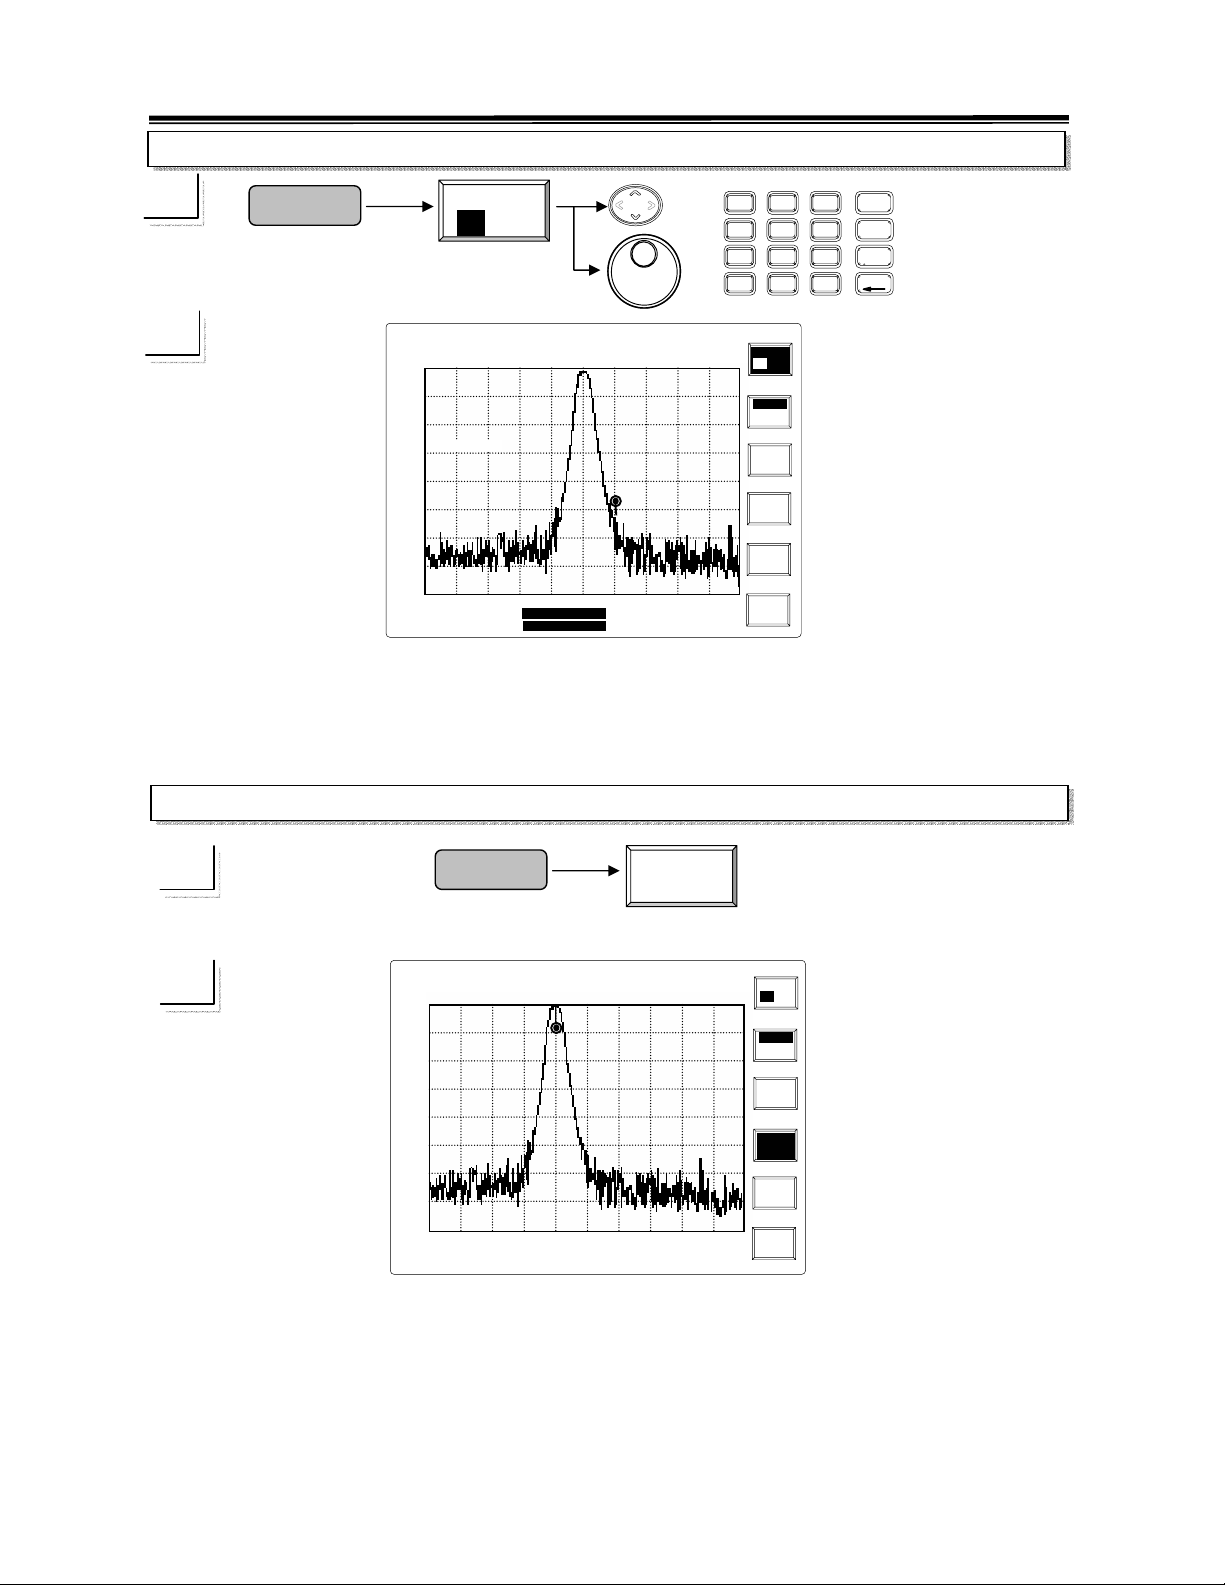
UP/DOWN and Scroll:
To change marker frequency by 1/500 span for every movement.
Editing: To specify the marker frequency directly.
Note: The marker should be in the normal mode but not in the ∆Marker mode.
To Peak
☛
Marker
To
Peak
Ref
-30.0
-40.0
-50.0
-60.0
-70.0
-80.0
-90.0
-100.0
-110.0
2003
SAT JAN 28
Lvl: -30.0 dBm
Start:99.6MHz
RBW:30 kHz
VBW:100 kHz
14:30:25
INT:REF
AMPL CAL
Center:100.1MHz
Span:1.0MHz
Marker Level Freq(MHz)
-30.7 100.0
Stop:100.6MHz
Sweep:100.0ms
Marker
ON OFF
Normal
∆Mkr
Mkr->
Center
Peak
Search
MM mode
Off
The marker will find the Maximum signal on the display and present the level reading in the
marker table which is on the upper-right corner of display.
44
Page 47
,
q(
p
,
q(
∆
∆
2.7GHz Spectrum Analyzer Operation Manual
Marker to Center
☛
Marker
Mkr->
Center
Ref
-30.0
-40.0
-50.0
-60.0
-70.0
-80.0
-90.0
-100.0
-110.0
2003
SAT JAN 28
Lvl: -30.0 dBm
Start:99.5MHz
RBW:30 kHz
VBW:100 kHz
14:30:25
INT:REF
AMPL CAL
Center:100.0MHz
Span:1.0MHz
Marker Level Fre
-30.7 100.0
Stop:100.5MHz
Sweep:100.0ms
MHz)
Marker
ON OFF
Normal
∆Mkr
Mkr->
Center
Peak
Search
MM mode
Off
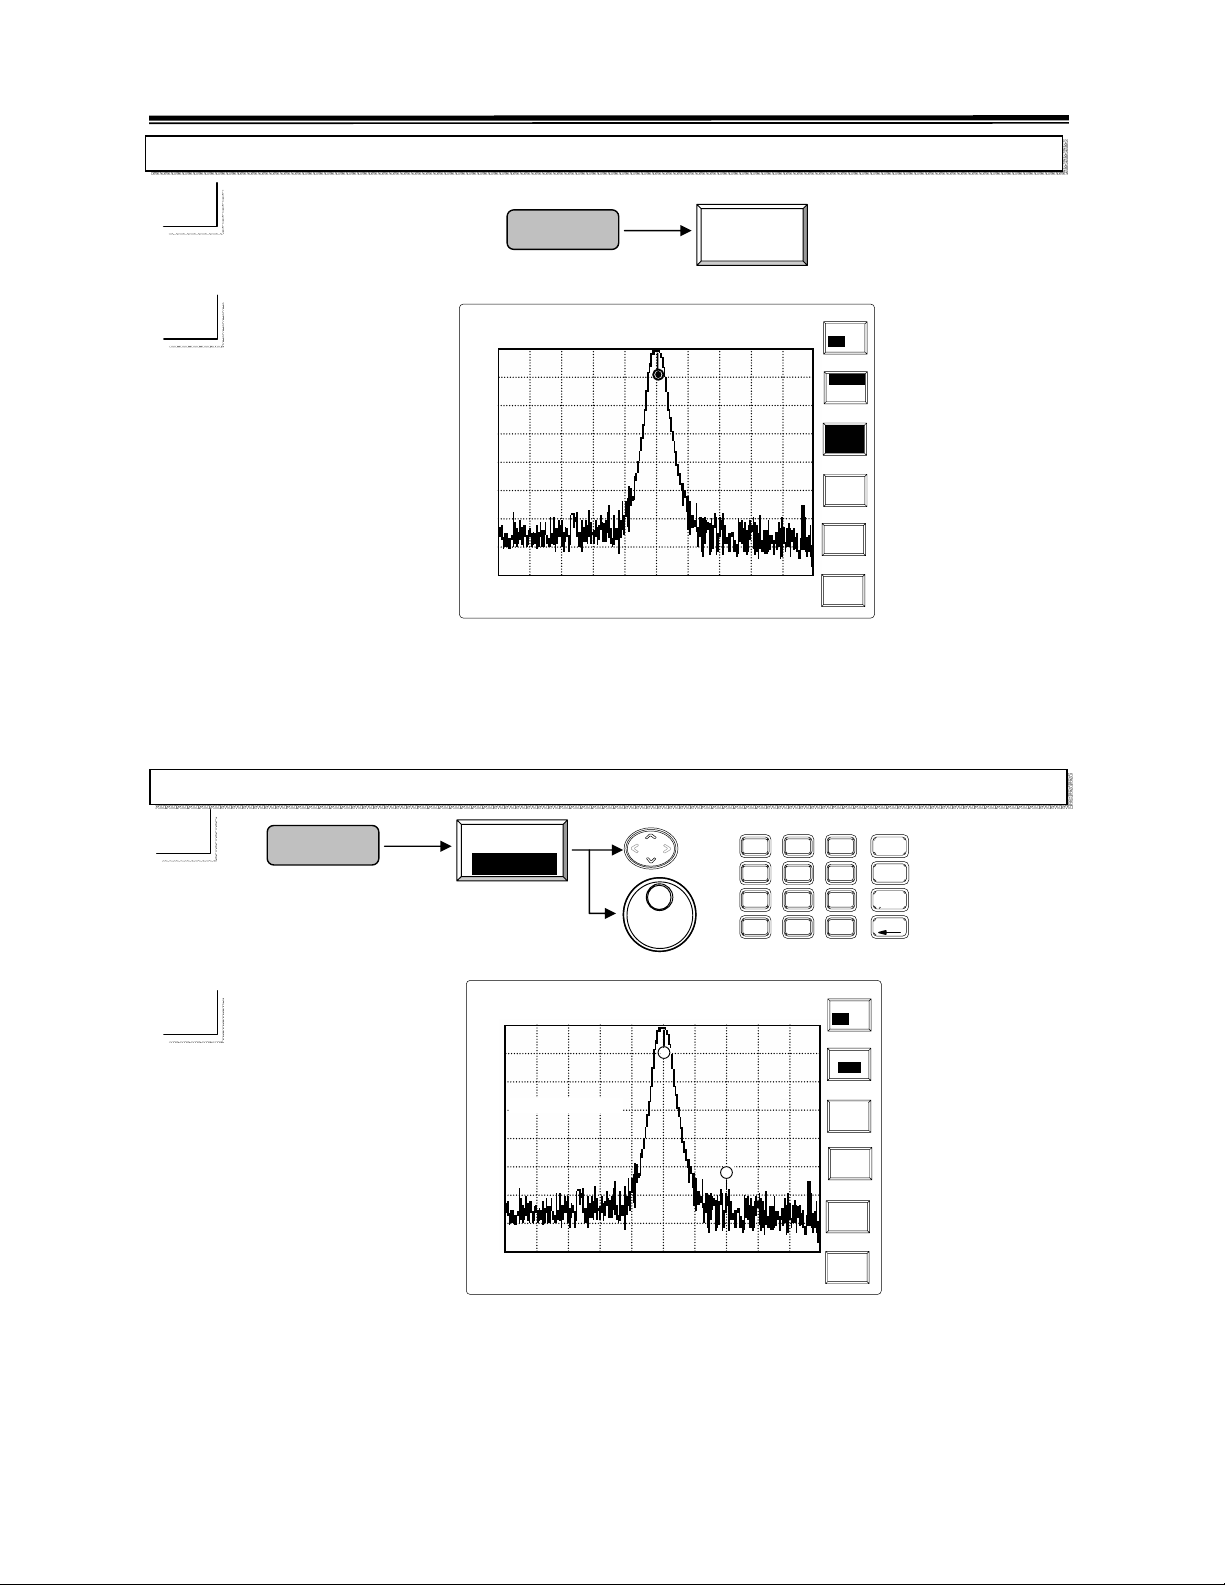
The Marker will find the maximum signal and present the amplitude reading in the marker
table which is on the upper right corner of the display.
Delta Marker
+
☛
Marker
Normal
Mkr
8
7
4
5
2
1
.
0
GHz
9
dBm
MHz
6
dBmV
kHz
3
dBuV
-
2003
SAT JAN 28
Ref
Lvl: -30.0 dBm
-30.0
-40.0
-50.0
Delta Freq : 200 kHz
-60.0
-70.0
-80.0
-90.0
-100.0
-110.0
Start:99.5MHz
RBW:30 kHz
VBW:100 kHz
14:30:25
INT:REF
AMPL CAL
Center:100.0MHz
an:1.0MHz
S
Marker Level Fre
-30.7 100.0
R
∆ ∆-59.1 ∆0.2
R
Stop:100.5MHz
MHz)
Sweep:100.0ms
Marker
ON OFF
Normal
∆Mkr
Mkr->
Center
Peak
Search
MM mode
Off
When operate with delta marker, enter the delta frequency rather than the absolute frequency.
45
Page 48
,
q(
2.7GHz Spectrum Analyzer Operation Manual
Activate Multi Marker Mode, MM Mode
☛
Marker
MM Mode
Off
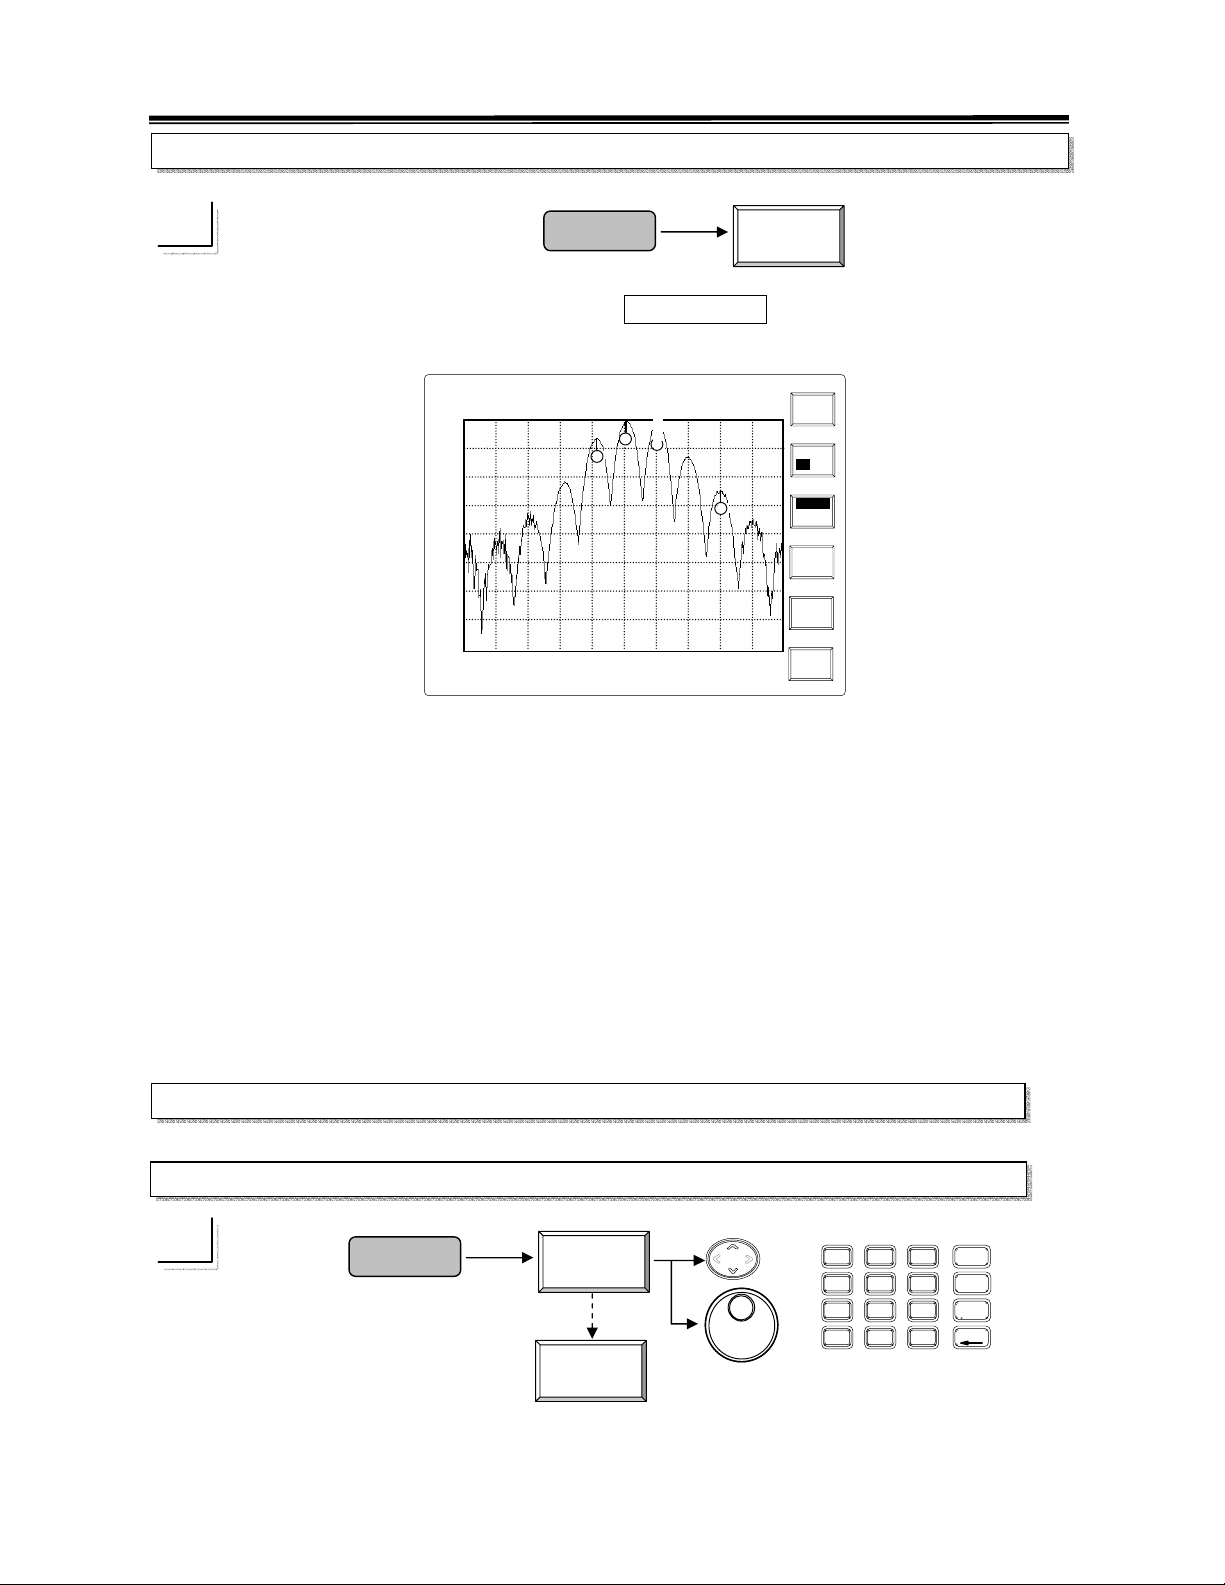
Switch the Multi-Marker Mode ON by pushing MM Mode Off , the related functions are as
the following figure:
SAT JAN 28
2003
Ref
Lvl: -30.0 dBm
-30.0
-40.0
-50.0
-60.0
-70.0
-80.0
-90.0
-100.0
-110.0
Start:99.5MHz
RBW:30 kHz
VBW:100 kHz
14:30:25
INT:REF
AMPL CAL
Center:100.0MHz
Span:1.0MHz
1
4
Marker Level Fre
1
-30.7 100.0
3 -31.5 100.1
4 -34.1 99.91
9 -65.1 100.3
3
9
Stop:100.5MHz
Sweep:100.0ms
MHz)
Marker
9
Marker
ON OFF
Normal
∆Mkr
Mkrs->
Peaks
All
ON OFF
Return
The steps for Multi-Marker Mode operation are as follows:
Normal mode:
Select Marker >> Turn ON marker >> Select Normal mode >> Enter the marker
frequency
Delta mode,
Select Marker >> Turn ON marker >> Select Delta Mode >> Select the Reference
Marker
>> Enter the Delta Frequency
The operation details of each function key is described as follows:
Multi Marker Mode Operation—Normal Mode
Marker Selection
☛
Marker
Marker
0
Marker
9
8
7
4
1
0
9
5
6
3
2
.
-
GHz
dBm
MHz
dBmV
kHz
dBuV
46
Page 49
,
q(
p
,
q(
2.7GHz Spectrum Analyzer Operation Manual
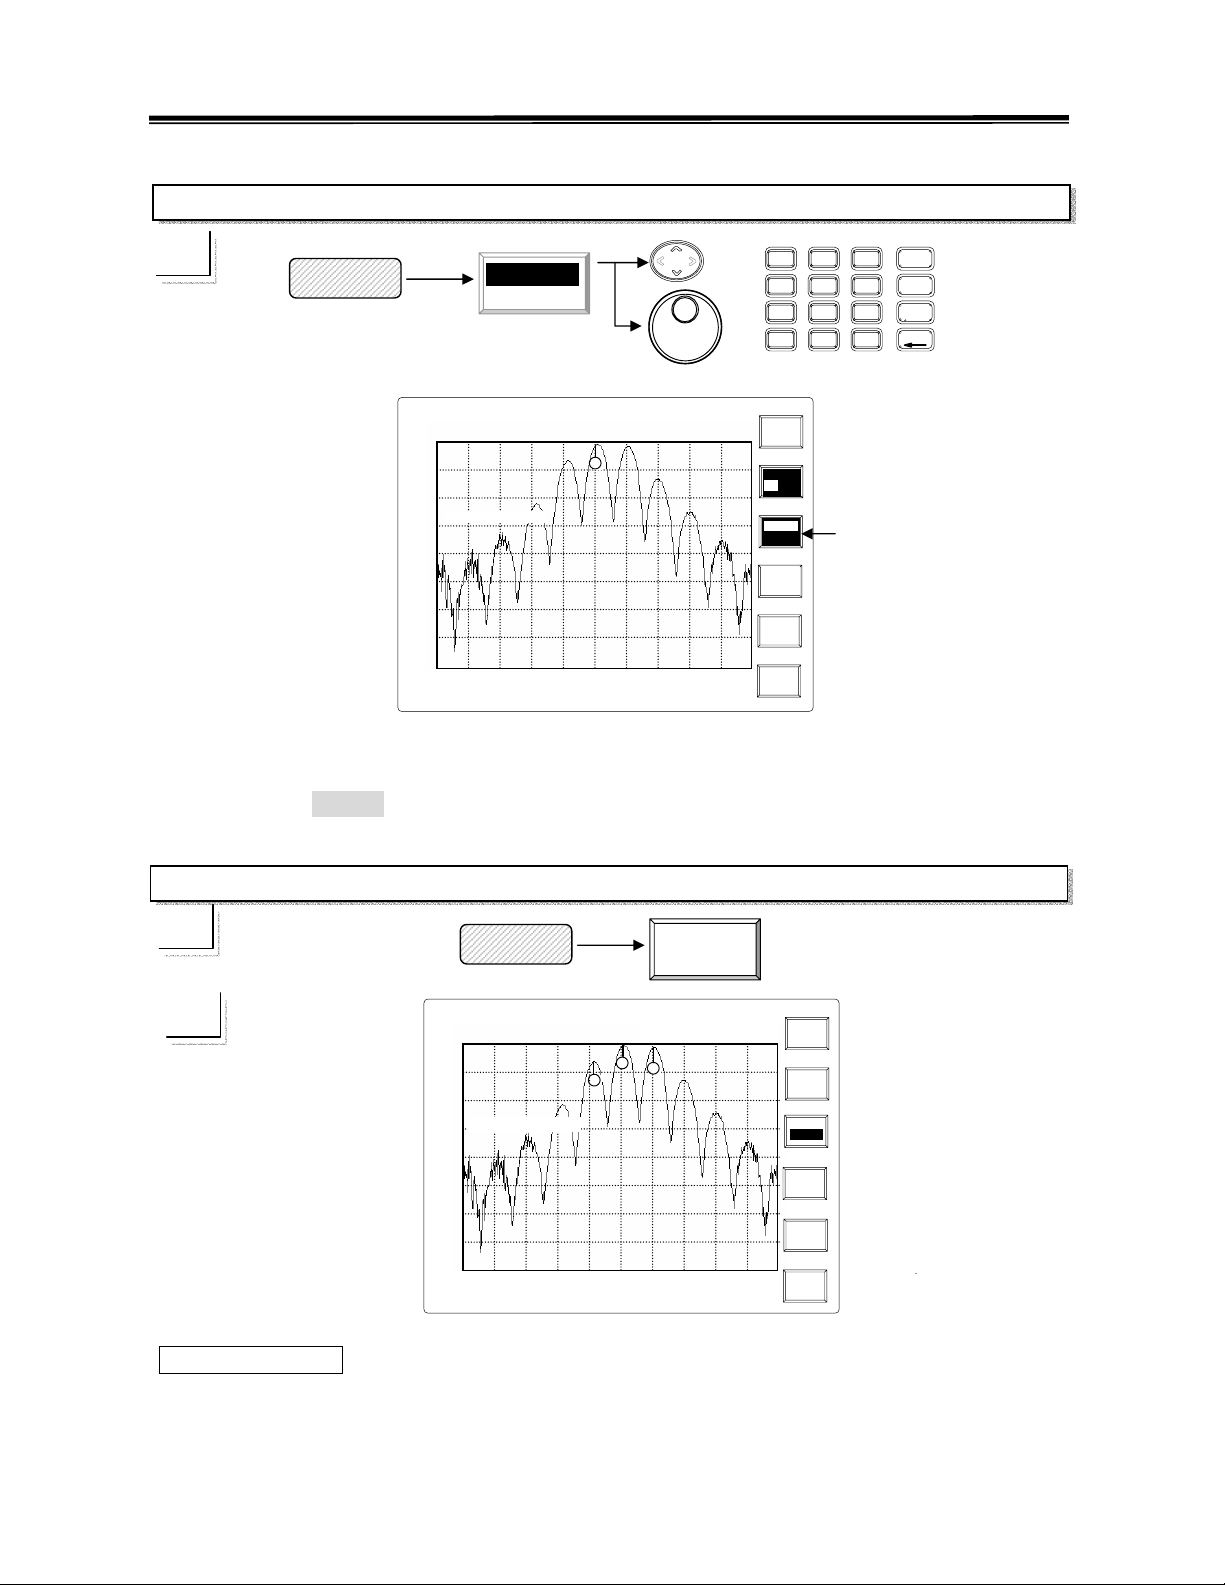
Marker m :
Pushing this Marker m (m from 0 to 9) key can select the Marker number in the
SAT JAN 28
Ref
Lvl: -30.0 dBm
-30.0
-40.0
-50.0
-60.0
-70.0
-80.0
-90.0
-100.0
-110.0
Start:99.5MHz
RBW:30 kHz
VBW:100 kHz
2003
14:30:25
INT:REF
AMPL CAL
Center:100.0MHz
Span:1.0MHz
Marker Level Fre
Stop:100.5MHz
Sweep:100.0ms
MHz)
Marker
1
Marker
ON OFF
Normal
∆Mkr
Mkrs->
Peaks
All
ON OFF
Return
Select
Marker
order from 0 to 9 and repeat from 0 after 9 is reached.
UP/DOWN and Scroll: To change the marker number in the order from 0 to 9.
Editing: To enter the marker number directly.
Turn Marker on and specify Marker frequency
☛
Marker
Marker
ON OFF
Ref
-30.0
-40.0
-50.0
-60.0
-70.0
-80.0
-90.0
-100.0
-110.0
2003
SAT JAN 28
Lvl: -30.0 dBm
Start:99.5MHz
RBW:30 kHz
VBW:100 kHz
14:30:25
INT:REF
AMPL CAL
Center:100.0MHz
an:1.0MHz
S
Marker Level Fre
Stop:100.5MHz
Sweep:100.0ms
MHz)
Marker
1
Marker
ON OFF
Normal
∆Mkr
Mkrs->
Peaks
All
ON OFF
Return
Turn
Marker ON
Enable the selected Marker ON to be ready for frequency entry first. Then specify the marker
frequency.
No need to push Marker again when the unit is already in Marker functions.
47
Page 50
,
T
,
q(
2.7GHz Spectrum Analyzer Operation Manual
Select Normal Mode and specify the Marker frequency
☛
Marker
Normal
∆Mkr
8
7
4
5
2
1
.
0
GHz
9
dBm
MHz
6
dBmV
kHz
3
dBuV
-
2003
SAT JAN 28
Ref
Lvl: -30.0 dBm
-30.0
-40.0
-50.0
Mkr Freq:100.0MHz
-60.0
-70.0
-80.0
-90.0
-100.0
-110.0
Start:99.5MHz
RBW:30 kHz
VBW:100 kHz
14:30:25
INT:REF
AMPL CAL
Center:100.0MHz
Span:1.0MHz
Marker Level Fre
1 -30.7 100.0
1
Stop:100.5MHz
MHz)
Sweep:100.0ms
Marker
1
Marker
ON OFF
Normal
∆Mkr
Mkrs->
Peaks
All
ON OFF
Return
Select Marker
mode and specify
Marker frequency
When the marker is in the normal mode, the characters “ Normal” is in the highlight situation.
No need to push Marker again when the unit is already in Marker functions.
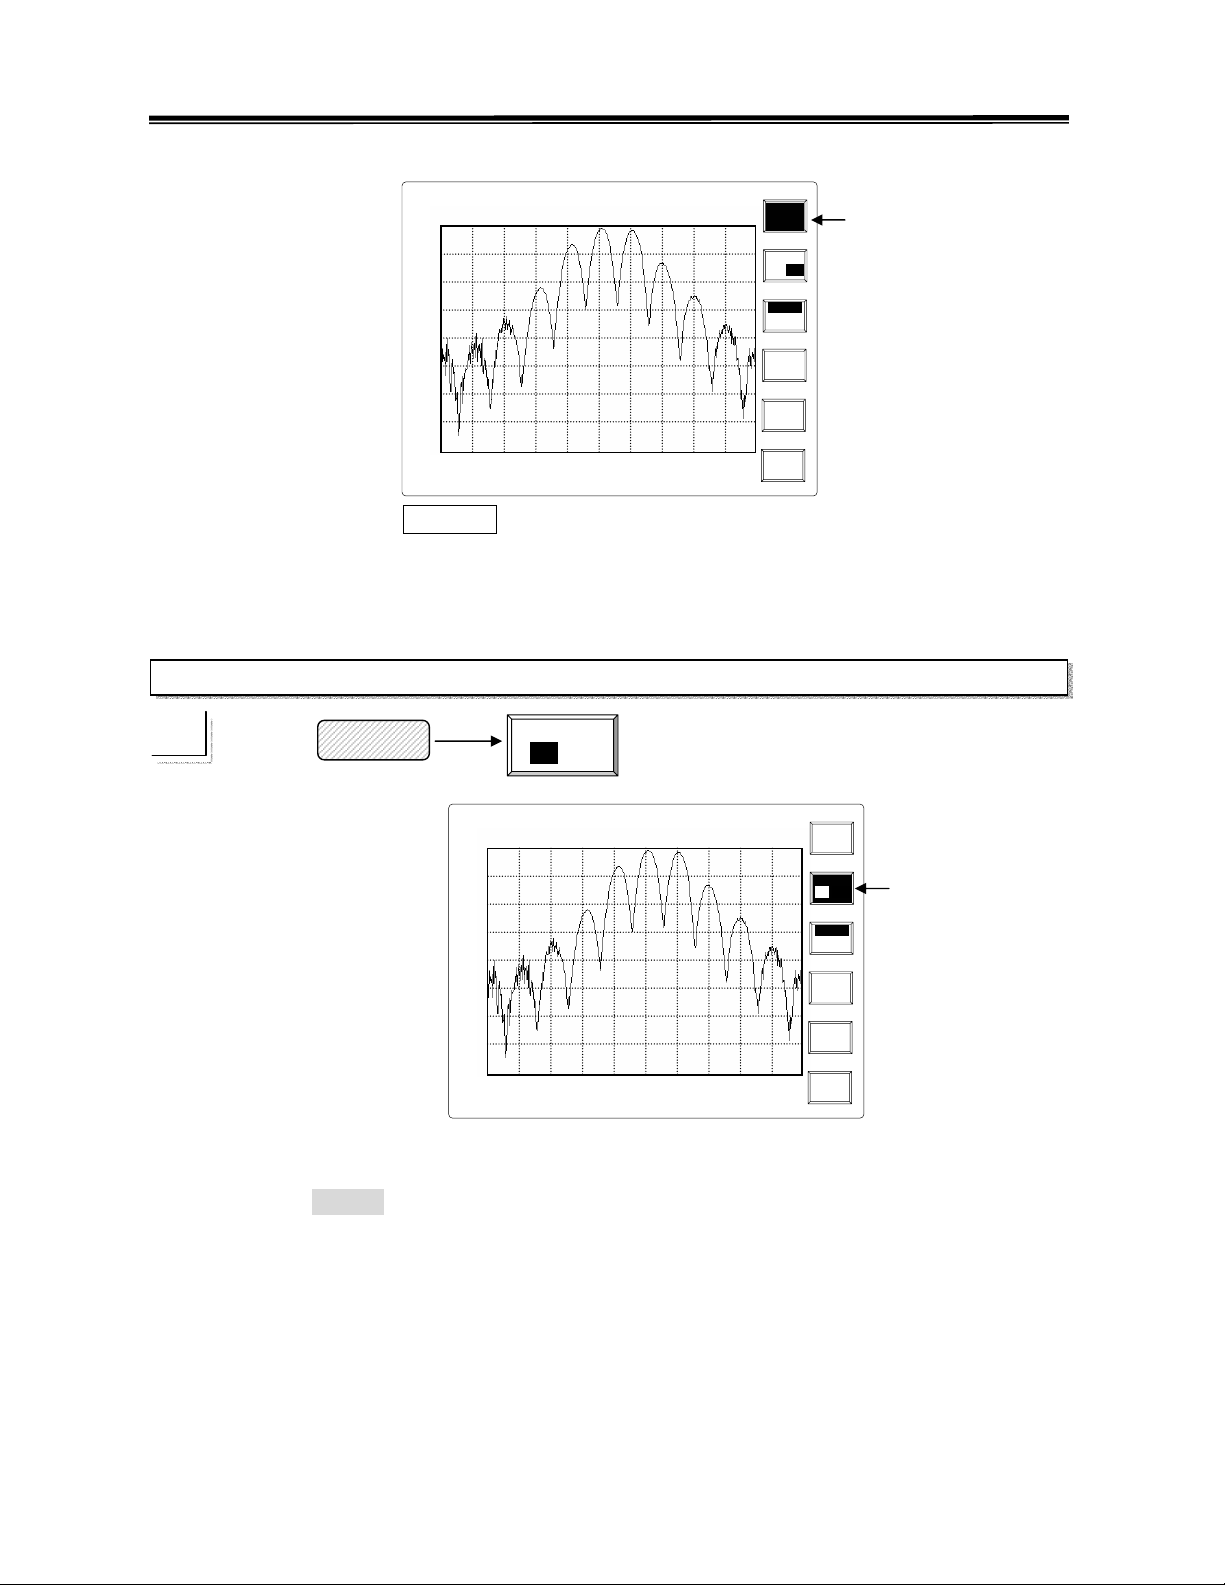
Markers to Peaks
☛
SAT JAN 28
Ref
Lvl: -30.0 dBm
-30.0
-40.0
-50.0
Delta Freq : 200 kHz
-60.0
-70.0
-80.0
-90.0
-100.0
-110.0
Start:99.5MHz
RBW:30 kHz
VBW:100 kHz
Marker
2003
14:30:25
IN
:REF
AMPL CAL
4
Center:100.0MHz
Span:1.0MHz
Markers
to Peaks
Marker Level Freq(MHz)
1 -30.7 100.0
3 -31.5 100.1
4 -34.1 99.91
1
3
Stop:100.5MHz
Sweep:100.0ms
Marker
3
Marker
ON/OFF
Normal
∆Mkr 1
Mkrs->
Peaks
ALL
ON/OFF
Return
Markers to Peaks
will have all activated markers find the peak signals. Three activated
markers will find the top 3 peak signals. If ten markers are all ON, the top 10 signals will be
discovered.
48
Page 51
A
A
2.7GHz Spectrum Analyzer Operation Manual
All ON/OFF
☛
Marker
ll
ON OFF
ll
ON OFF
All ON OFF
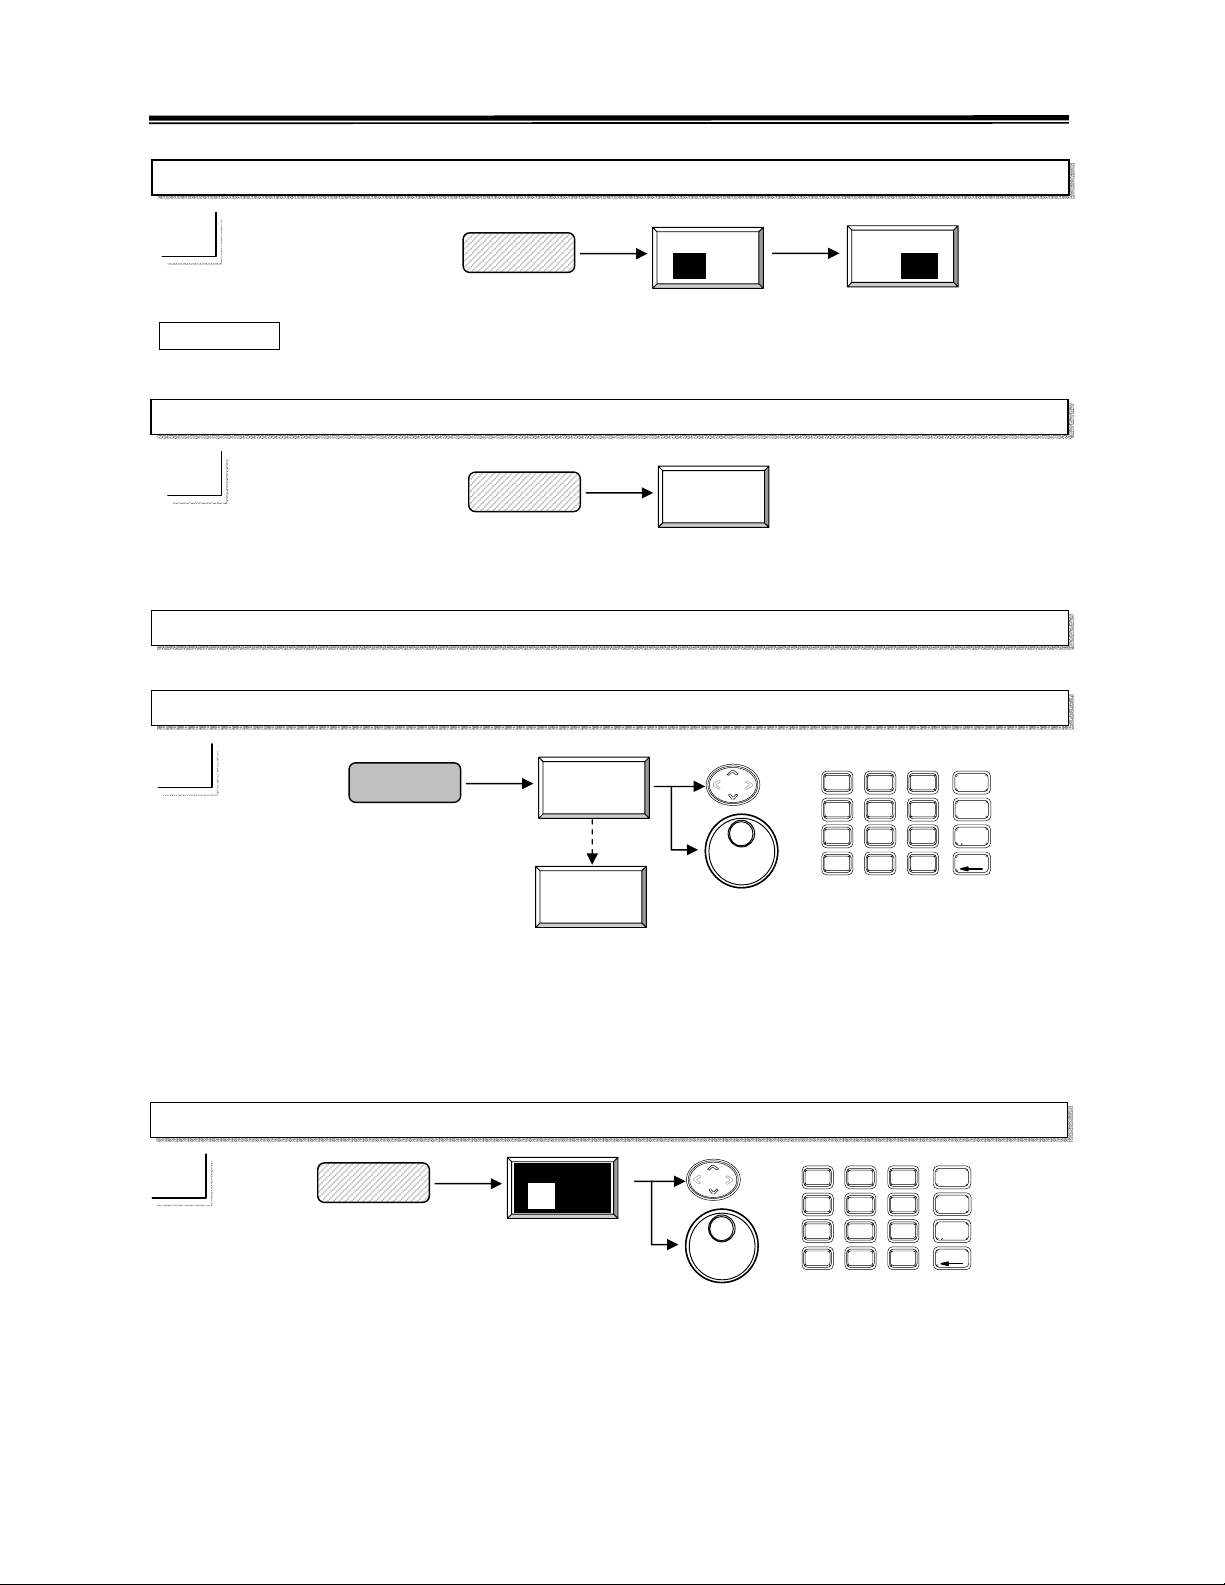
is a quick key to turn ON/OFF all 10 markers.
Return
☛
Marker
Return
To exit the Multi-Marker mode.
Multi Marker Mode Operation—Delta Mode
Marker Selection
☛
Marker
Marker
0
Marker
9
8
7
4
5
2
1
.
0
GHz
9
dBm
MHz
6
dBmV
kHz
3
dBuV
-
Marker d : Push this key (d: from 0 to 9) to select the Delta Marker number in the order of 0
to 9 and repeat from 0 after 9 is reached.
UP/DOWN and Scroll: To change the Delta Marker number in the order of 0 to 9.
Editing: To enter the Delta Marker number directly.
Turn Marker ON
☛
Marker
Marker
ON OFF
8
7
4
5
2
1
.
0
GHz
9
dBm
MHz
6
dBmV
kHz
3
dBuV
-
49
Page 52
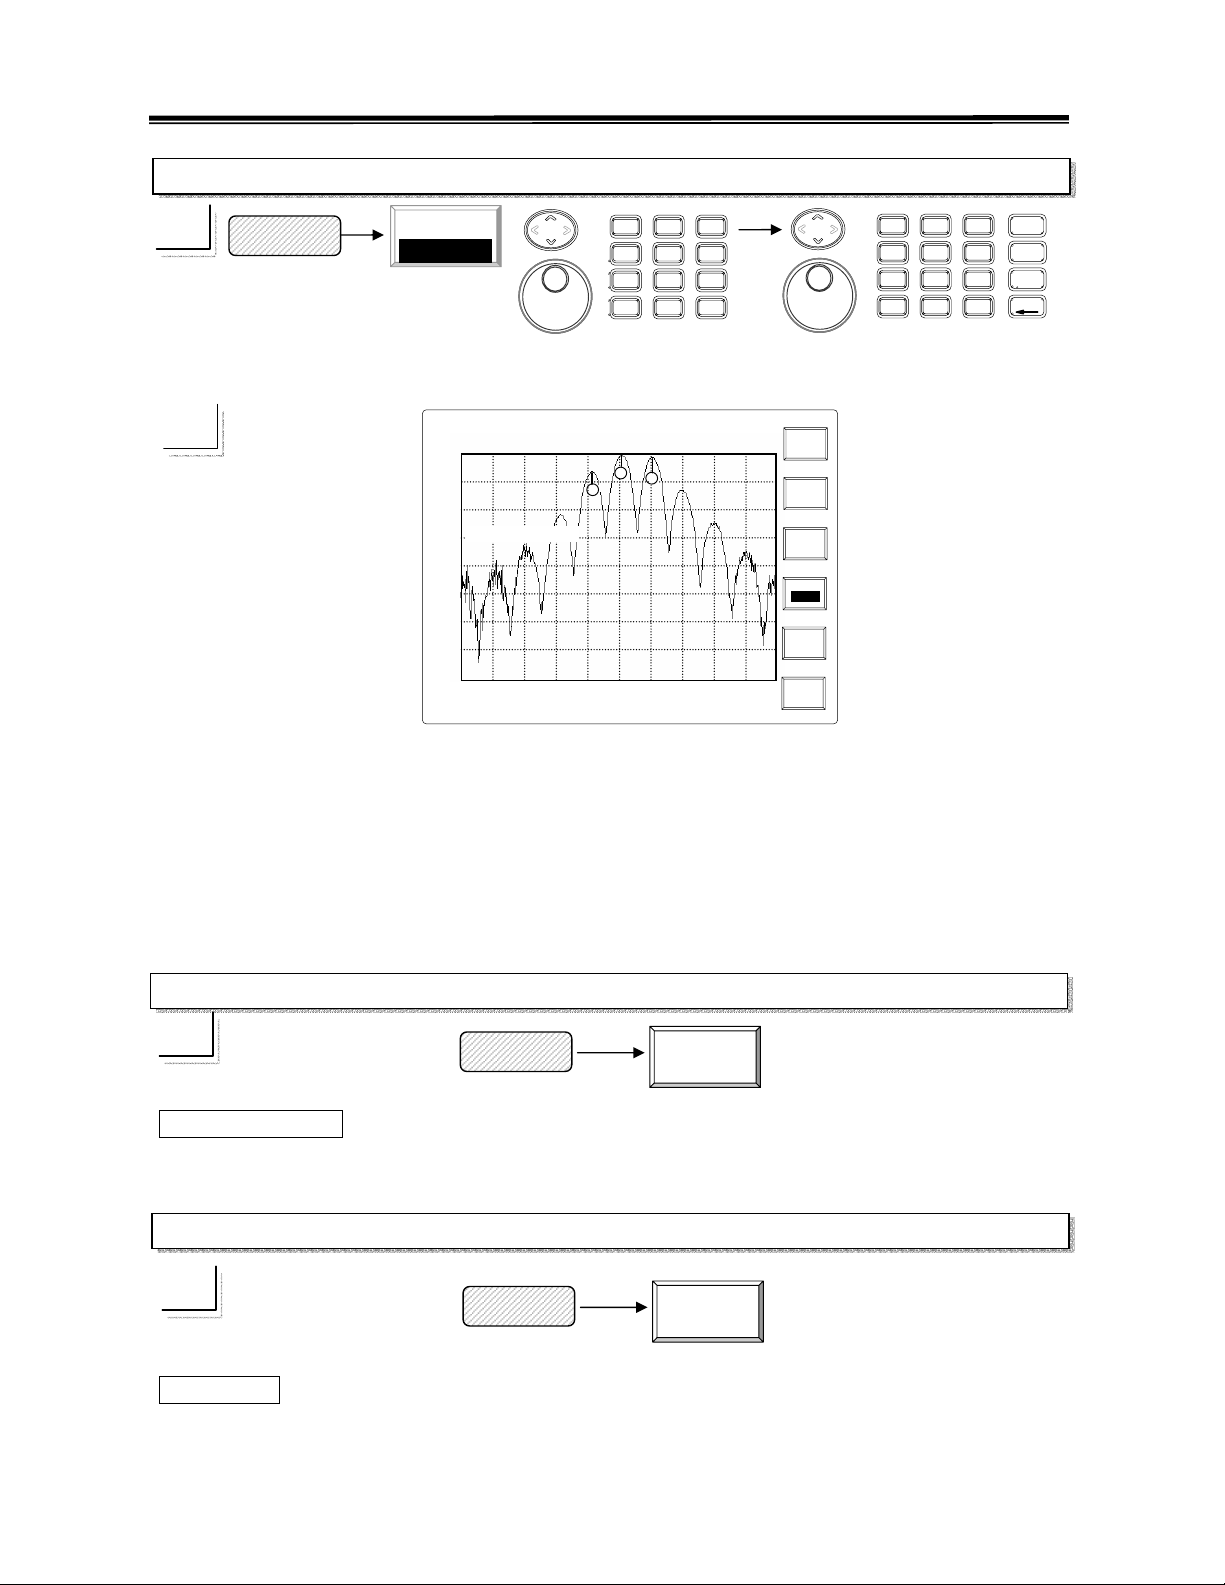
,
q(
T
A
2.7GHz Spectrum Analyzer Operation Manual
Select Delta Mode and specify the Reference Marker and delta frequency
☛
Marker
Normal
∆Mkr 1
8
8
7
4
1
0
9
5
6
3
2
.
-
7
4
5
2
1
.
0
GHz
9
dBm
MHz
6
dBmV
kHz
3
dBuV
-
Select Reference Marker
Enter the Delta Frequency
Ref
-30.0
-40.0
-50.0
-60.0
-70.0
-80.0
-90.0
-100.0
-110.0
2003
SAT JAN 28
Lvl: -30.0 dBm
Delta Freq : 100 kHz
Start:99.5MHz
RBW:30 kHz
VBW:100 kHz
14:30:25
INT:REF
AMPL CAL
4
Center:100.0MHz
Span:1.0MHz
Marker Level Fre
1
-30.7 100.0
3∆1 ∆-0.8.5 ∆0.1
4 -34.1 99.91
1
3
Stop:100.5MHz
MHz)
Sweep:100.0ms
Marker
3
Peak
Mkr->
Center
Normal
∆Mkr1
MM mode
Off
o
When the marker is in the delta mode, the characters “ ∆Mkr r” is in highlight situation. Select
Reference Marker first, then key in the delta frequency.
UP/DOWN and Scroll: To change the Delta Marker number in the order of 0 to 9
Editing: To enter the Delta Marker number directly.
Note: The Reference Marker and Delta Marker can not be the same one.
Markers to Peaks
☛
Marker
Markers
to Peaks
Markers to Peaks
will have all activated markers find the peak signals. Three activated
markers will find the top 3 peak signals. If ten markers are all ON, the top 10 signals will be
discovered. Please refer to the normal mode.
All ON/OFF
☛
Marker
ll
ON OFF
All ON OFF is a quick key to turn ON/OFF all selected markers. Please refer to the normal mode.
50
Page 53
2.7GHz Spectrum Analyzer Operation Manual
Return
☛
Marker
To exit the Multi-Marker mode.
Return
51
Page 54
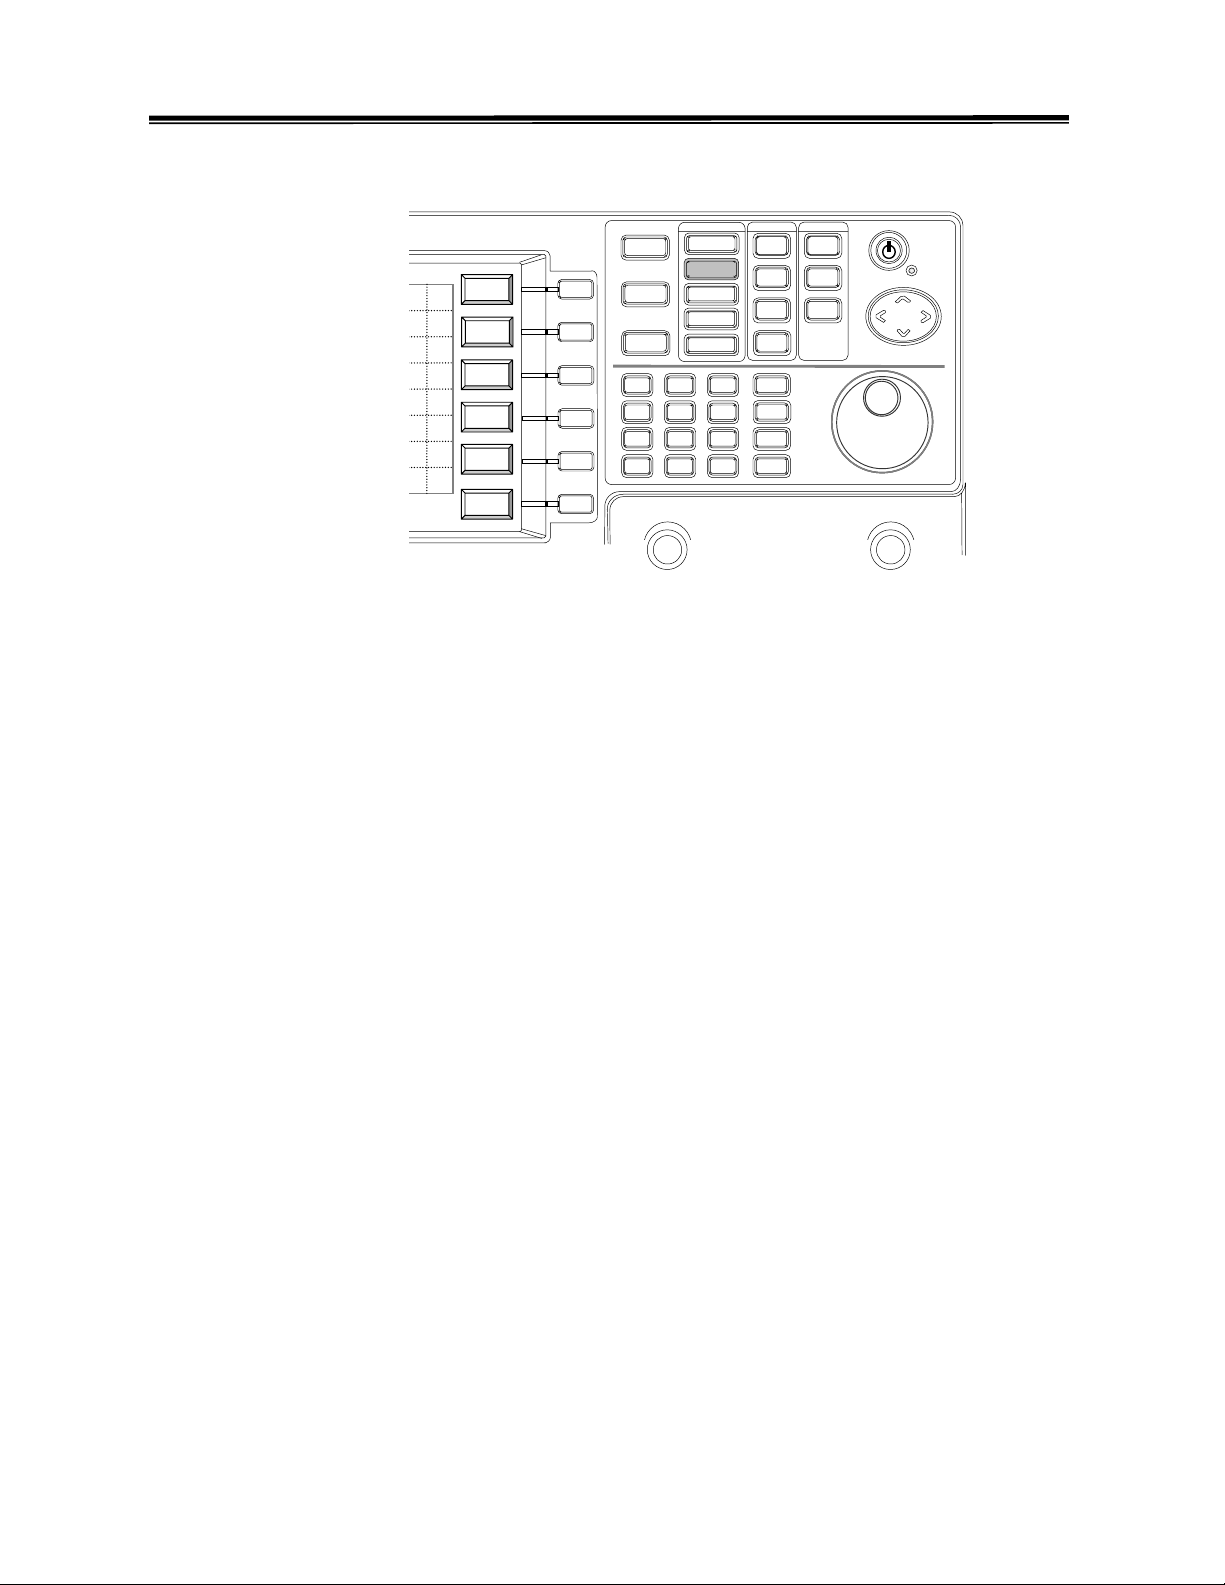
2.7GHz Spectrum Analyzer Operation Manual
8.2.2 Peak Search
To
Center
Peak
Mkr->
Start
Center
Next
stop
Peak
Peak
Step
Right
Peak
Peak->
Left
Center
Track
ON OFF
F1
F2
F3
F4
F5
F6
Peak Search
8
7
4
1
0
9
5
6
3
2
.
-
Peak Search is the functions to use marker to find the peak signals on the display. Mkr->Center
function will let center frequency change to frequency of where the marker is standing.
Next Peak is to let marker find the next peak signal on display. Peak Right is to let marker
rightward find the next peak signal;
Peak Left let marker find the next peak signal leftward.
Track
is to let marker continuously keep searching the peak signal and moving it to the center on
the display.
52
Page 55
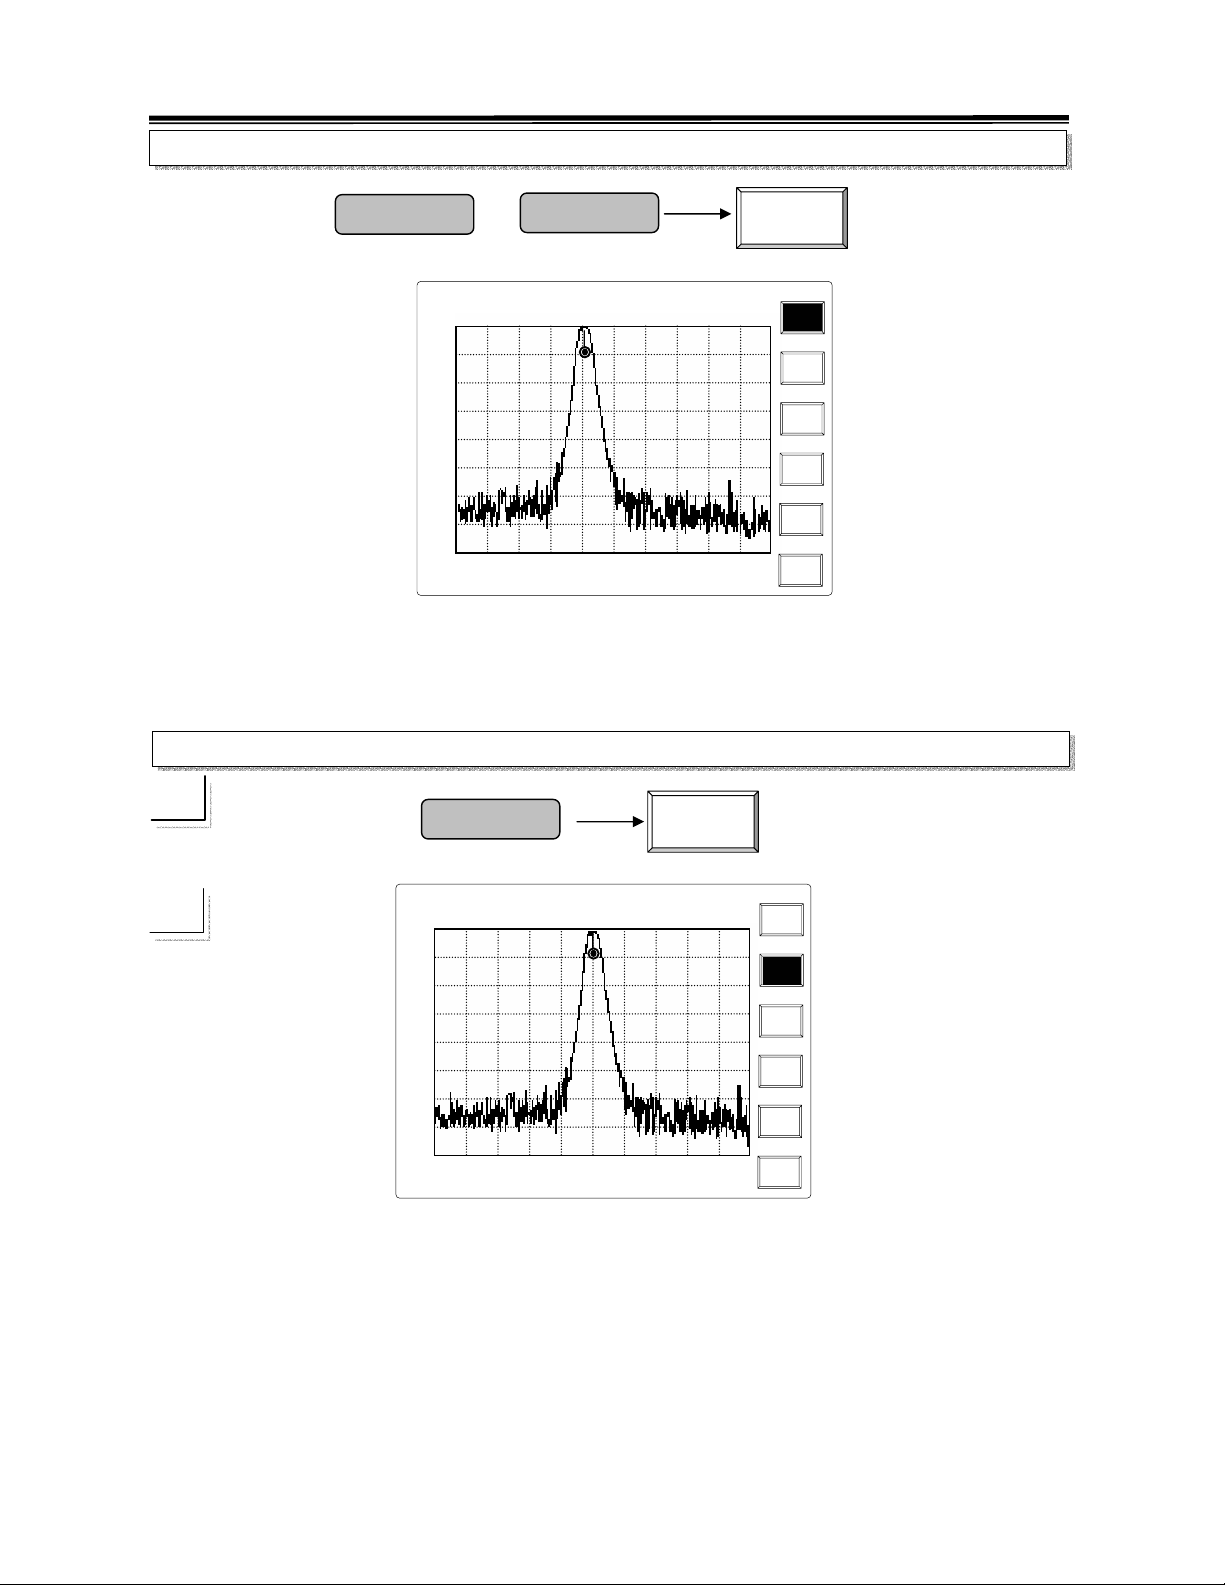
p
T
,
q(
r
,
q(
T
T
T
2.7GHz Spectrum Analyzer Operation Manual
To Peak
☛
Peak Search
,
Peak Search
To
Peak
Ref Lvl: -30.0 dBm
-30.0
-40.0
-50.0
-60.0
-70.0
-80.0
-90.0
-100.0
-110.0
SAT JAN 28
Start:99.6MHz
RBW:30 kHz
VBW:100 kHz
2003
14:30:25
INT:REF
AMPL CAL
Center:100.1MHz
Span:1.0MHz
Marker Level Fre
-30.7 100.0
1
Stop:100.6MHz
Swee
MHz)
:100.0ms
o
Peak
Mk
Center
Next
Peak
Peak
Right
Peak
Left
rack
ON OFF
->
The marker will find the peak signal on the display. In MM Mode, the currently activated
marker will find the peak.
Marker to Center
☛
Peak Search
Mkr->
Center
Ref
-30.0
-40.0
-50.0
-60.0
-70.0
-80.0
-90.0
-100.0
-110.0
2003
SAT JAN 28
Lvl: -30.0 dBm
Start:99.5MHz
RBW:30 kHz
VBW:100 kHz
14:30:25
INT:REF
AMPL CAL
Center:100.0MHz
Span:1.0MHz
Marker Level Fre
-30.7 100.0
1
Stop:100.5MHz
Sweep:100.0ms
MHz)
o
Peak
Mkr->
Center
Next
Peak
Peak
Right
Peak
Left
rack
ON OFF
Note: The difference from
activated in
Peak Search group.
Peak to Center in Frequency functions is that the Marker is
53
Page 56
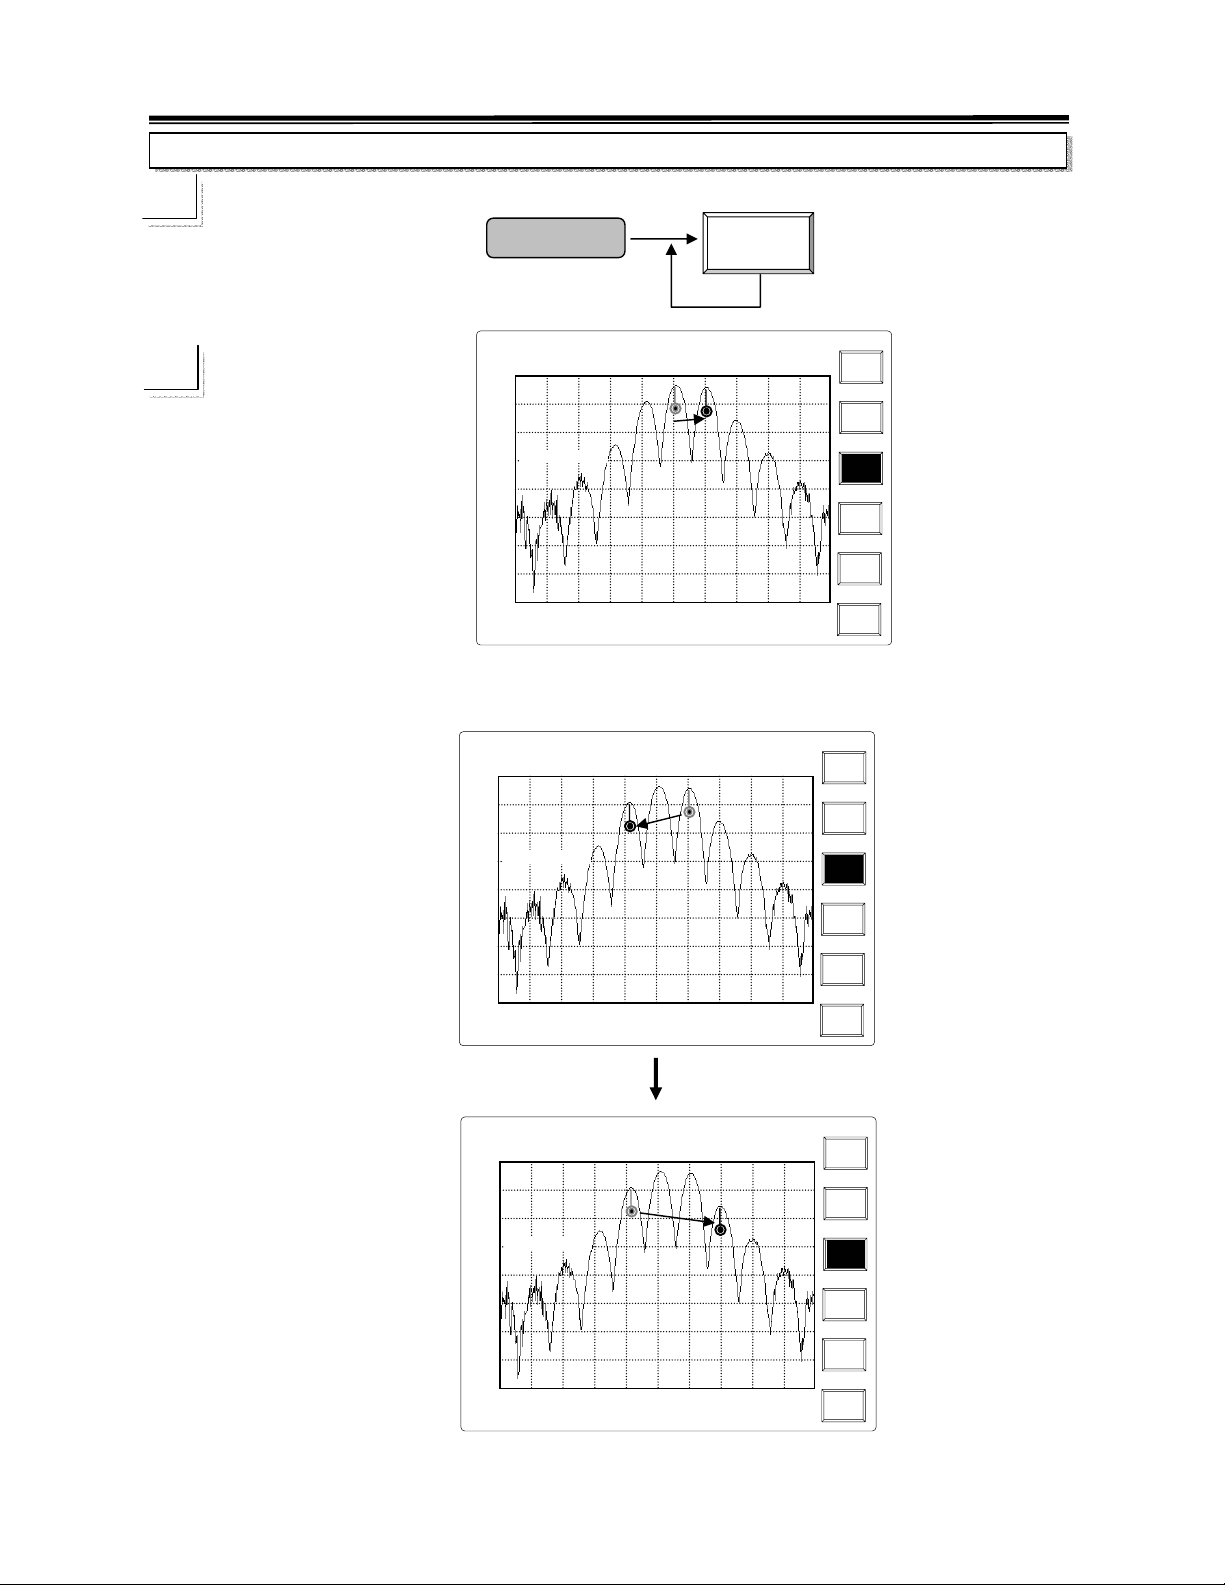
,
q(
T
T
p
,
q(
T
T
p
,
q(
T
T
2.7GHz Spectrum Analyzer Operation Manual
Next Peak
☛
Peak Search
Next
Peak
2003
SAT JAN 28
Ref
Lvl: -30.0 dBm
-30.0
-40.0
-50.0
Step:1MHz
-60.0
-70.0
-80.0
-90.0
-100.0
-110.0
Start:99.6MHz
RBW:30 kHz
VBW:100 kHz
14:30:25
INT:REF
AMPL CAL
Center:100.1MHz
Span:10MHz
Marker Level Fre
-35.7 101.0
1
Stop:100.6MHz
Sweep:100.0ms
MHz)
o
Peak
Mkr->
Center
Next
Peak
Peak
Right
Peak
Left
rack
ON OFF
Next Peak will have the marker find the signal which level is next to current marker. Keep
pushing the Next Peak will repeat the process as following figures.
Ref
-30.0
-40.0
-50.0
-60.0
-70.0
-80.0
-90.0
-100.0
-110.0
2003
SAT JAN 28
Lvl: -30.0 dBm
Step:1MHz
Start:99.6MHz
RBW:30 kHz
VBW:100 kHz
14:30:25
INT:REF
AMPL CAL
Center:100.1MHz
Span:10MHz
Marker Level Fre
1
-39.2 99.0
Stop:100.6MHz
Swee
MHz)
:100.0ms
o
Peak
Mkr->
Center
Next
Peak
Peak
Right
Peak
Left
rack
ON OFF
2003
SAT JAN 28
Ref
Lvl: -30.0 dBm
-30.0
-40.0
-50.0
Step:1MHz
-60.0
-70.0
-80.0
-90.0
-100.0
-110.0
Start:99.6MHz
RBW:30 kHz
VBW:100 kHz
14:30:25
INT:REF
AMPL CAL
Center:100.1MHz
an:10MHz
S
Marker Level Fre
1
-54.7 102.0
Stop:100.6MHz
Sweep:100.0ms
MHz)
o
Peak
Mkr->
Center
Next
Peak
Peak
Right
Peak
Left
rack
ON OFF
54
Page 57
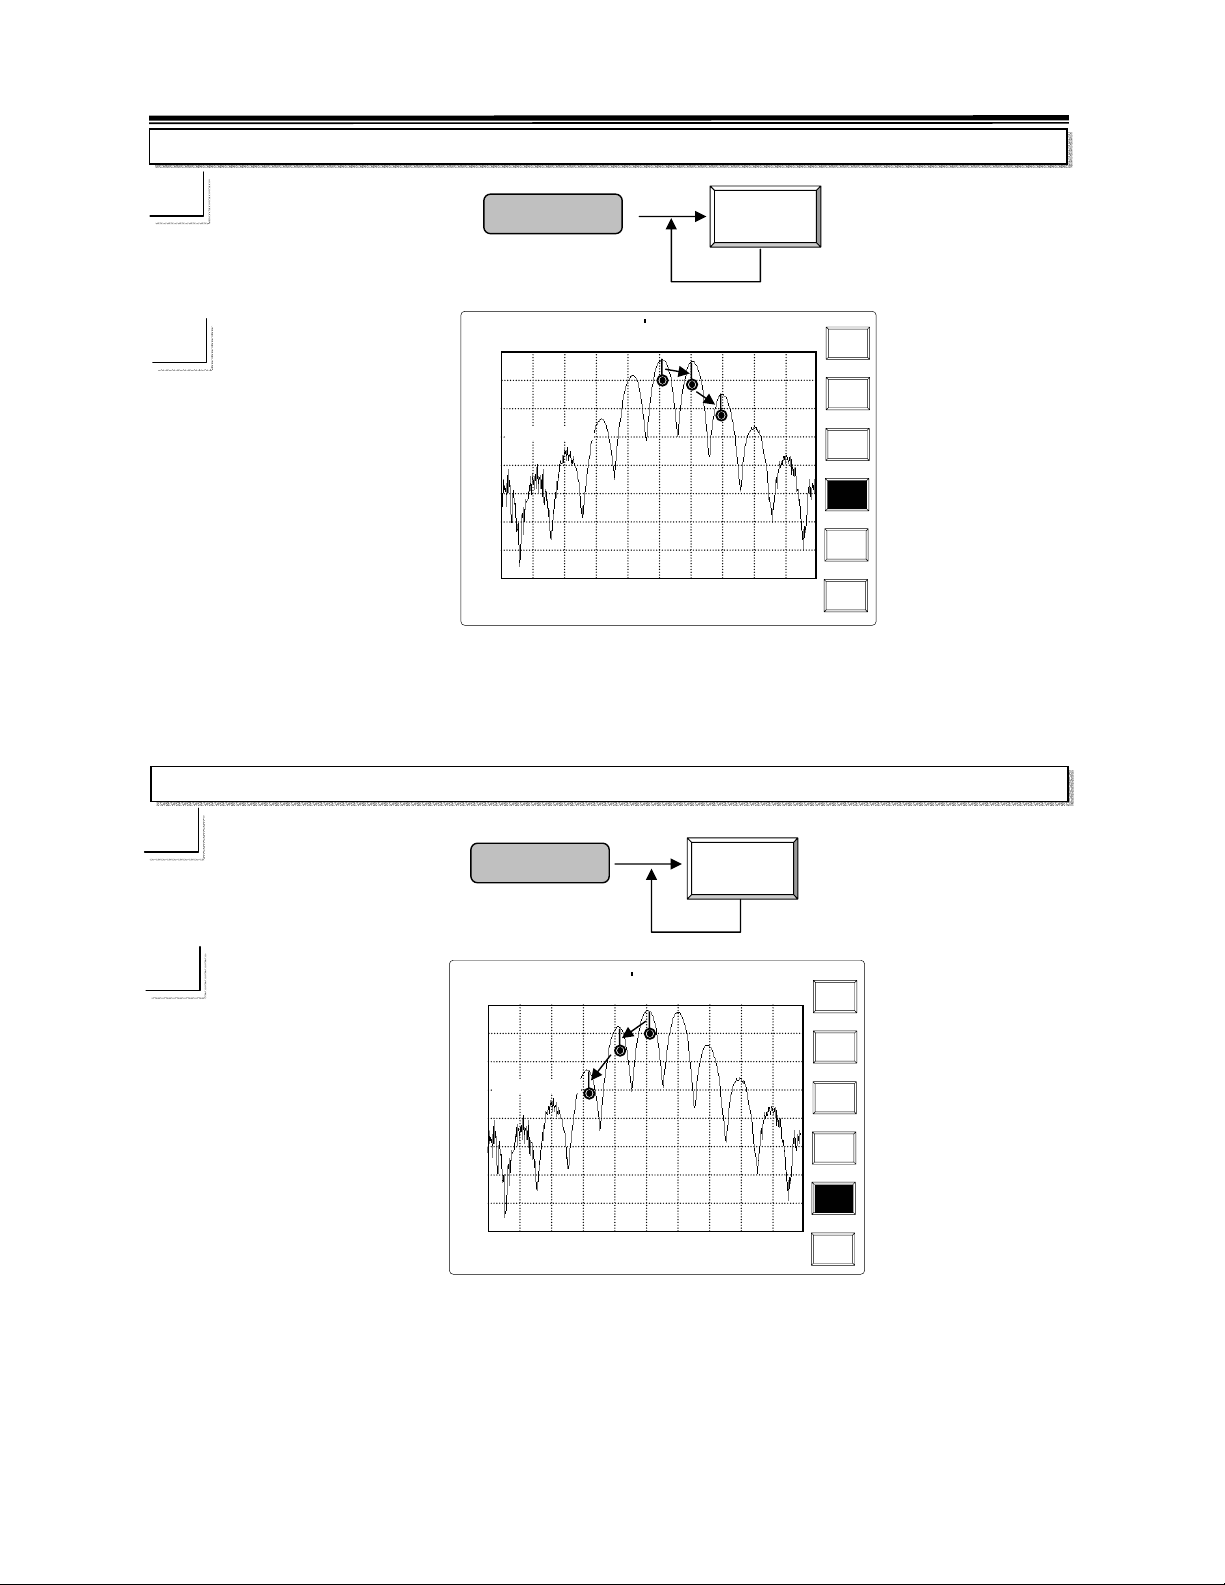
p
,
q(
g
p
p
,
q(
T
T
T
T
2.7GHz Spectrum Analyzer Operation Manual
Peak Right
☛
Ref
-30.0
-40.0
-50.0
-60.0
-70.0
-80.0
-90.0
-100.0
-110.0
Repeat
Peak Right key will have marker find the marker in the right side.
Peak Left
☛
SAT JAN 28
Ref
-30.0
-40.0
-50.0
-60.0
-70.0
-80.0
-90.0
-100.0
-110.0
Repeat
Peak Left key will have marker find the marker in the left side.
Peak Search
2003
SAT JAN 28
Lvl: -30.0 dBm
Step:1MHz
Start:99.5.0M
RBW:30 kHz
VBW:100 kHz
Peak Search
2003
Lvl: -30.0 dBm
Step:1MHz
Start:99.6MHz
RBW:30 kHz
VBW:100 kHz
14:30:25
INT:REF
AMPL CAL
Center:100.0MHz
an:1.0MHz
S
14:30:25
INT:REF
AMPL CAL
Center:100.1MHz
Span:1.0MHz
Marker Level Fre
-37.7 100.0
1
Stop:100.5MHz
Swee
Peak
Left
Marker Level Fre
1
-37.7 100.0
Stop:100.6MHz
Swee
Peak
Ri
ht
MHz)
:100.0ms
MHz)
:100.0ms
Peak
Mkr->
Center
Next
Peak
Peak
Right
Peak
Left
rack
ON OFF
o
Peak
Mkr->
Center
Next
Peak
Peak
Right
Peak
Left
rack
ON OFF
o
55
Page 58
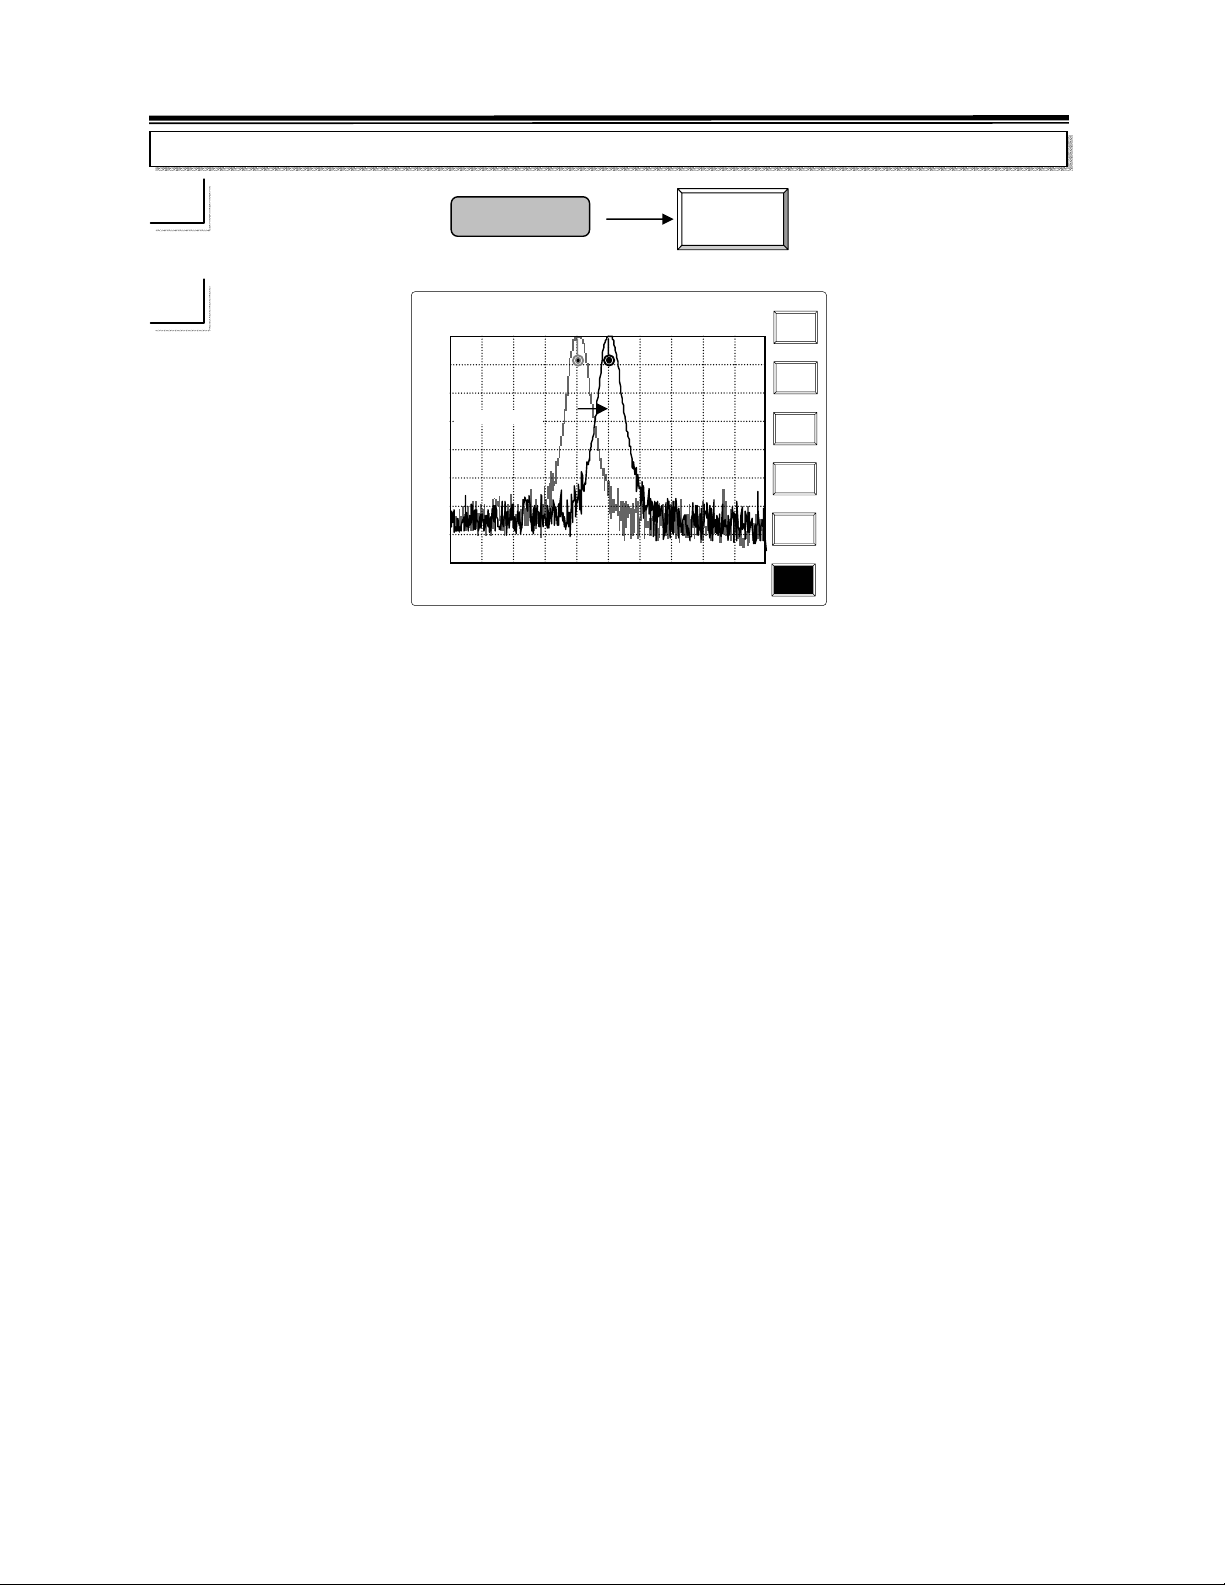
,
q(
T
T
2.7GHz Spectrum Analyzer Operation Manual
Track ON
☛
Peak Search
Track
ON OFF
SAT JAN 28
2003
14:30:25
Ref
Lvl: -30.0 dBm
-30.0
-40.0
-50.0
Step:1MHz
-60.0
-70.0
-80.0
-90.0
-100.0
-110.0
Start:99.5MHz
RBW:30 kHz
VBW:100 kHz
INT:REF
AMPL CAL
Center:100.0MHz
Span:1.0MHz
Marker Level Fre
Stop:100.5MHz
Sweep:100.0ms
MHz)
o
Peak
Mkr->
Center
Next
Peak
Peak
Right
Peak
Left
rack
ON OFF
Track function will dynamically track the Peak signal and move the signal to the center. In fact,
it equal to the combination of
Peak Search + Marker to Center which is performed all the
time.
Note: Because the marker continuously keeps searching the peak signal and moving it to the
center on the display, therefore the Center Frequency is changeable as long as the track
function is on.
56
Page 59
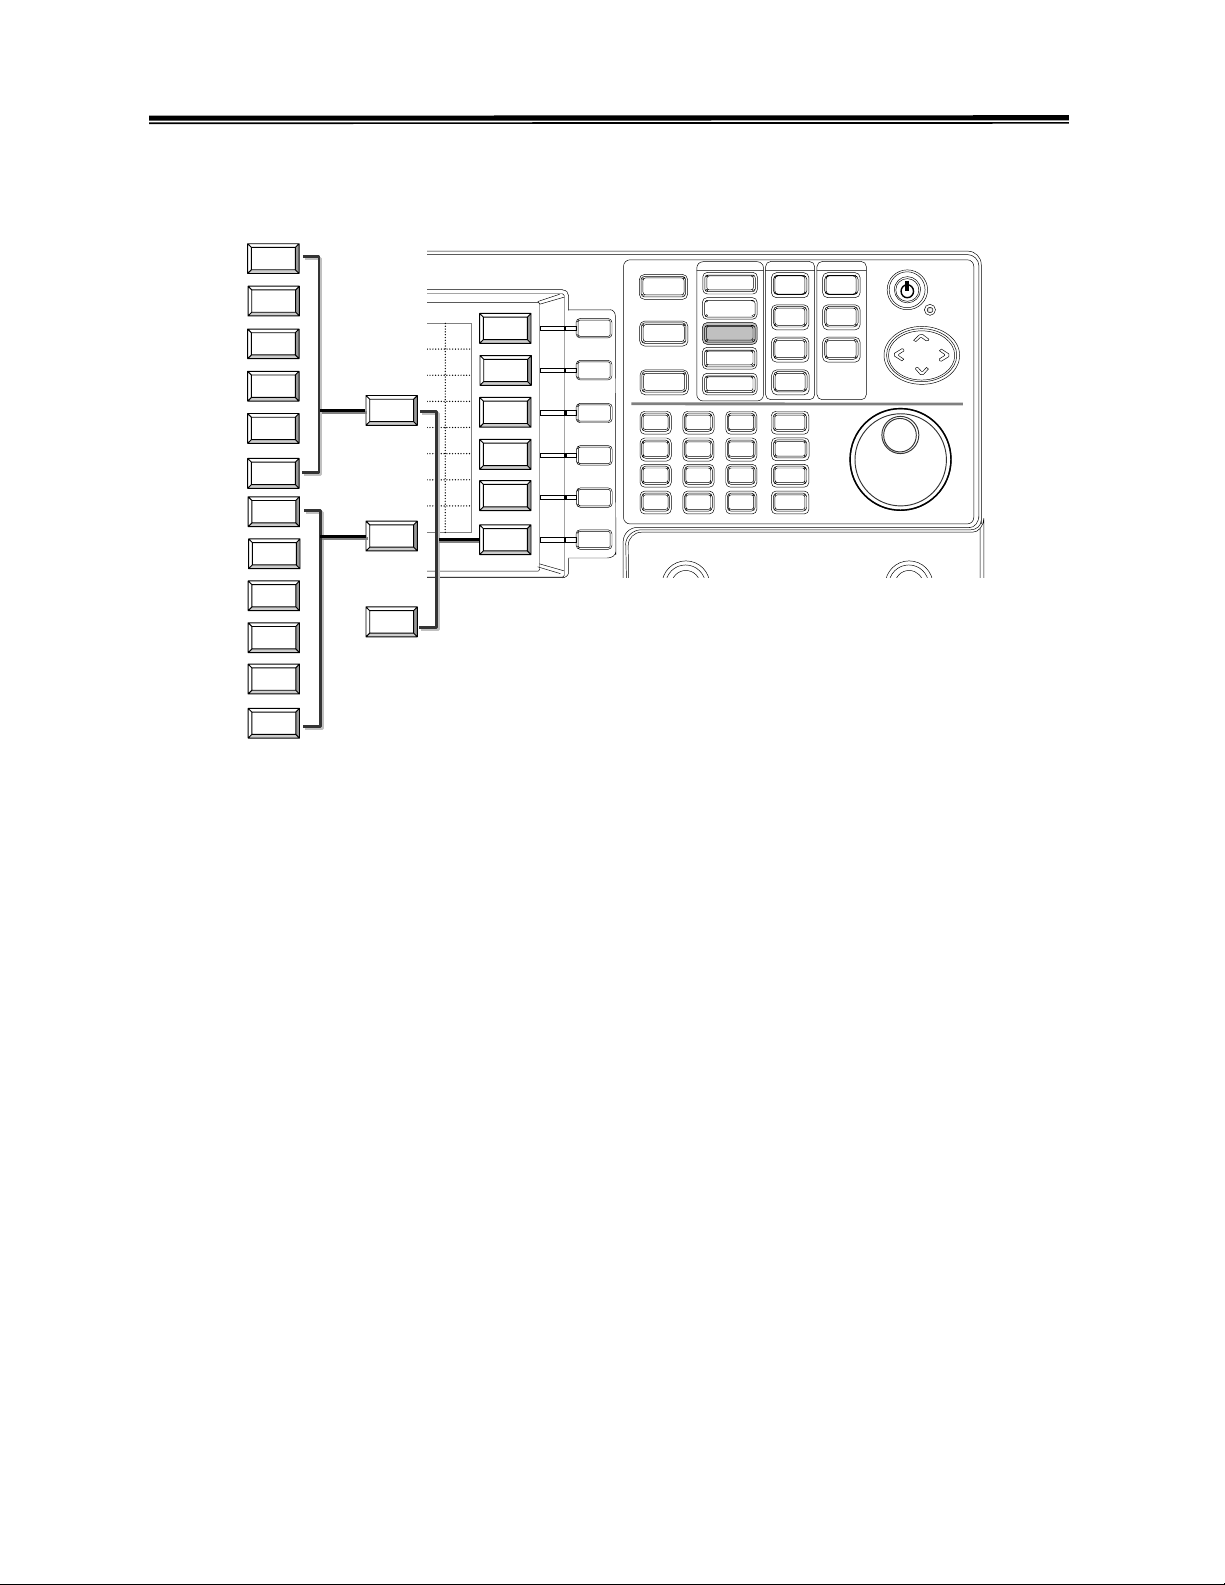
A
A
A
A
A
V
Q
2.7GHz Spectrum Analyzer Operation Manual
8.2.3 Trace
Center
↔B
Start
A+B- >
A-B->A
stop
A+Const
Step
->A
A*Const
Peak->
->
Center
Return
Normal
Center
Detect
Sample
Start
Detect
stop
Peak+
G
Step
1 2 3
Peak
Peak->
Center
TC1
Return
Trace
Center
Math
Step
Detect
Return
Trace
Center
A B No
Clear
Start
PkHold
stop
ON OFF
VG
Step
ON OFF
Freeze
Peak->
ON OFF
Center
More
F1
F2
F3
F4
F5
7
4
1
0
F6
Trace
8
9
5
6
3
2
.
-
There are three traces
Live, Tr. A and Tr. B. Live trace is always the one measuring the
signal. Trace A and Trace B are the traces for memory access. The Clear function is to clear the
Trace A and Trace B.
Live Trace has
Peak Hold, Average and Freeze functions. Peak hold function is to hold the
peak signal until the next higher level signal is appeared. When the next higher signal is coming,
it will update the signal. Average function will average the specific number of traces and
present the result of average on the display. Freeze function will stop sweeping and present the
last trace.
The
Trace Math directly uses the trace data to perform the math operation. In other words,
when trace A plus trace B in dB, the result is dB number pulsing other than transferring into
linear scale.
There are also several detection modes are provided. Basically the data of every point is
taken from several samples. How many samples are taken for one data will depend on the
setting of
RBW and SPAN. There are several ways to pick one to present the all taken samples.
Normal mode takes average, Sample mode will pick randomly, and Peak + mode will pick the
maximum one. It is so-called positive peak sometimes.
There are also two detection modes implemented by hardware.
filter. There are three time constants of
Quasi Peak detection, TC1, TC2 and TC3 for 600ms,
Average is done by low pass
550ms and 160ms respectively.
57
Page 60
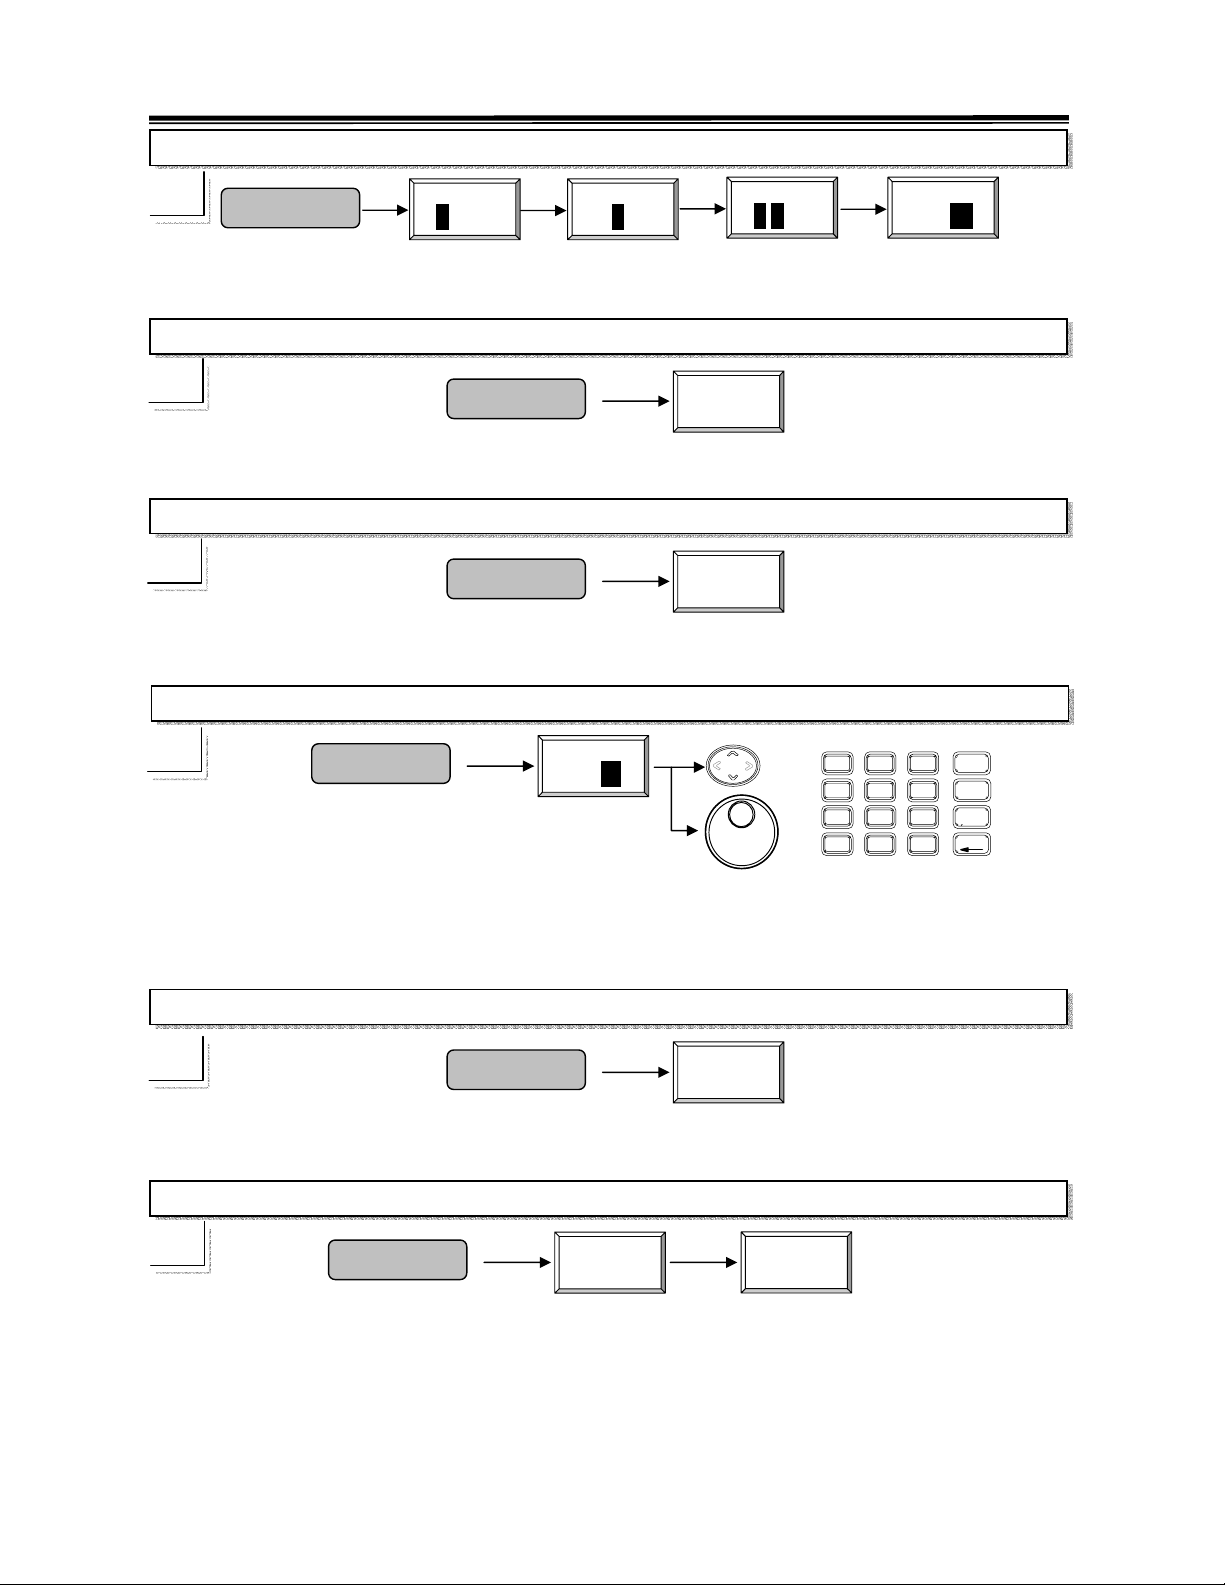
A
2.7GHz Spectrum Analyzer Operation Manual
Trace Selection
☛
Trace
Trace
A B No
Trace
A B No
Trace
A B No
Trace
A B No
Repeat this key to select trace A, B, both or none.
Clear Trace Data
☛
Trace
Clear
Push this key to clear data of selected trace.
Peak Hold
☛
Trace
Peak
Hold
Push this key to perform the Peak Hold function.
Average Trace
☛
Trace
verage
ON 10
8
7
4
1
0
9
5
6
3
2
.
-
Push this key and set the number to perform the average function. It is implemented by the
software.
Freeze
☛
Trace
Freeze
Pushing this key can freeze the trace on the display.
Trace Math Operation
☛
Trace
More
Trace
Math
Pushing this key will start the trace math operation.
GHz
dBm
MHz
dBmV
kHz
dBuV
58
Page 61
A
↔
A
A
A
A
A
A
2.7GHz Spectrum Analyzer Operation Manual
Exchange A and B
☛
Move A+B into A
☛
Move A-B into A
☛
Move A + Constant into A
☛
Move A - Constant into A
☛
Detection Mode
☛
Access this key can operate the following detection modes.
Trace
Trace
Trace
Trace
Trace
Trace
More
More
More
More
More
More
Trace
Math
Trace
Math
Trace
Math
Trace
Math
Trace
Math
Detect
B
+B→A
-B→A
+Const
→
+Const
→
Normal Detection
☛
Sample Detection Mode
☛
Trace
Trace
More
More
59
Detect
Detect
Normal
Detect
Sample
Detect
Page 62
A
A
A
2.7GHz Spectrum Analyzer Operation Manual
Positive Peak Detection Mode
☛
Average Detection Mode
☛
Quasi Peak Detection Mode
☛
Trace
Trace
Trace
More
More
More
Detect
Detect
Detect
QPeak
VG
1 2 3
TC1
Peak+
Detect
VG
1 2 3
QPeak
TC2
VG
1 2 3
QPeak
TC3
60
Page 63
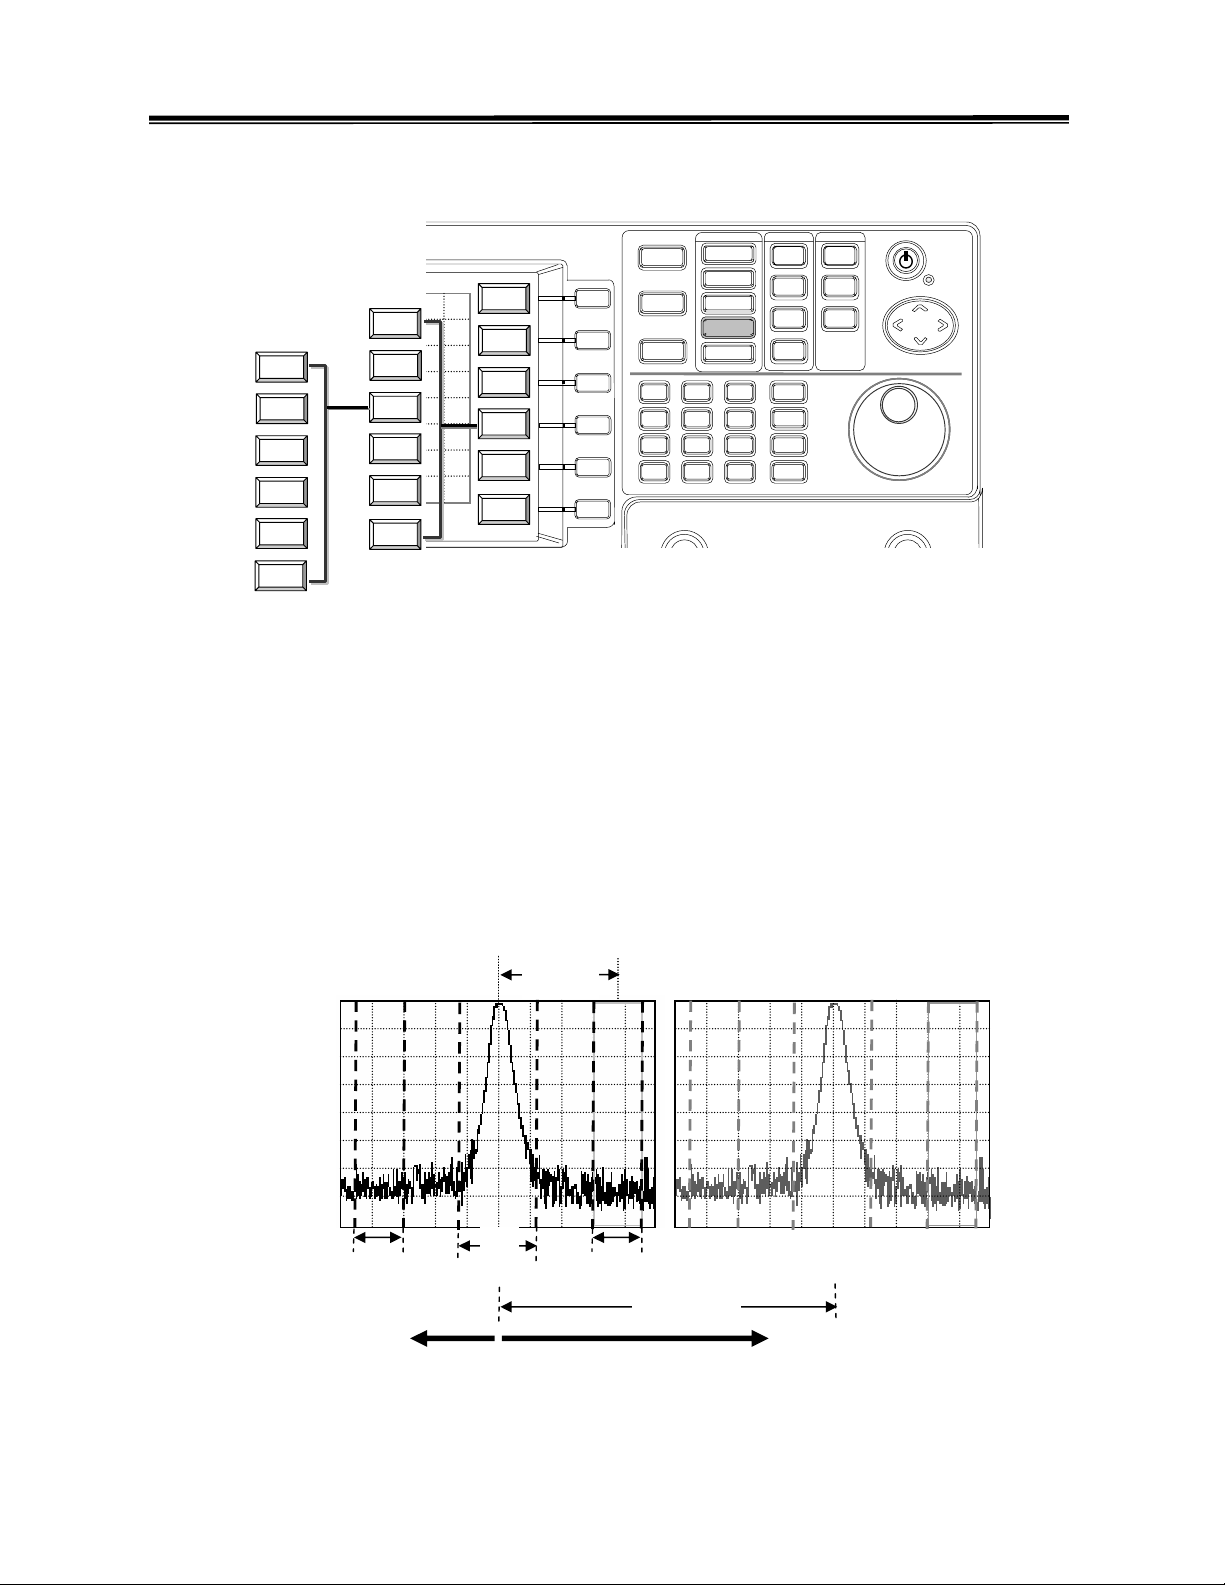
2.7GHz Spectrum Analyzer Operation Manual
8.2.4 Pwr Measurement
ADJ CH
Center
BW 1
ADJ CH
Start
Offs 1
ADJ CH
stop
BW 2
ADJ CH
Step
Offs 1
CH BW
Center
CH SPC
Start
OCBW%
stop
ADJ C H
Step
Offset
Return
ACPR
Center
ON/OFF
OCBW
Start
ON/OFF
CH BW
stop
Step
Setup
CH
UP
CH
DN
F1
F2
F3
F4
F5
F6
Pwr Measure
8
7
4
1
0
9
5
6
3
2
.
-
Return
Power measurement functions provide the
ACPR (Adjacent Channel Power Ratio),
OCBW (OCcupied BandWidth). For ACPR measurement, the CH BW (channel
bandwidth),
Adj CH SPC (adjacent channel bandwidth) and Adj CH Offs (adjacent
channel offset) have to be specified first. The ACPR measurement turns out the power
ratio of main channel and upper/lower adjacent channels in dB. The terminology ACLR
(Adjacent Channel Leakage Ratio) is sometimes used instead.
Adj CH BW and Adj CH Offs are defined in ADJ CH OFFSET functions. Two types
of
ACPR with different channel BW and offset can be measured simultaneously. They are
noted as
Adj CH 1 (LACPR 1/ UACPR1) and Adj CH 2 (LACPR 2/ UACPR 2) in the
P0wer measurement table.
Adj. CH
Offset
Channel Down
LAdj. CH
BW
CH
BW
UAdj. CH
BW
CH SPC
Channel Up
Definitions for ACPR measurement
61
Page 64
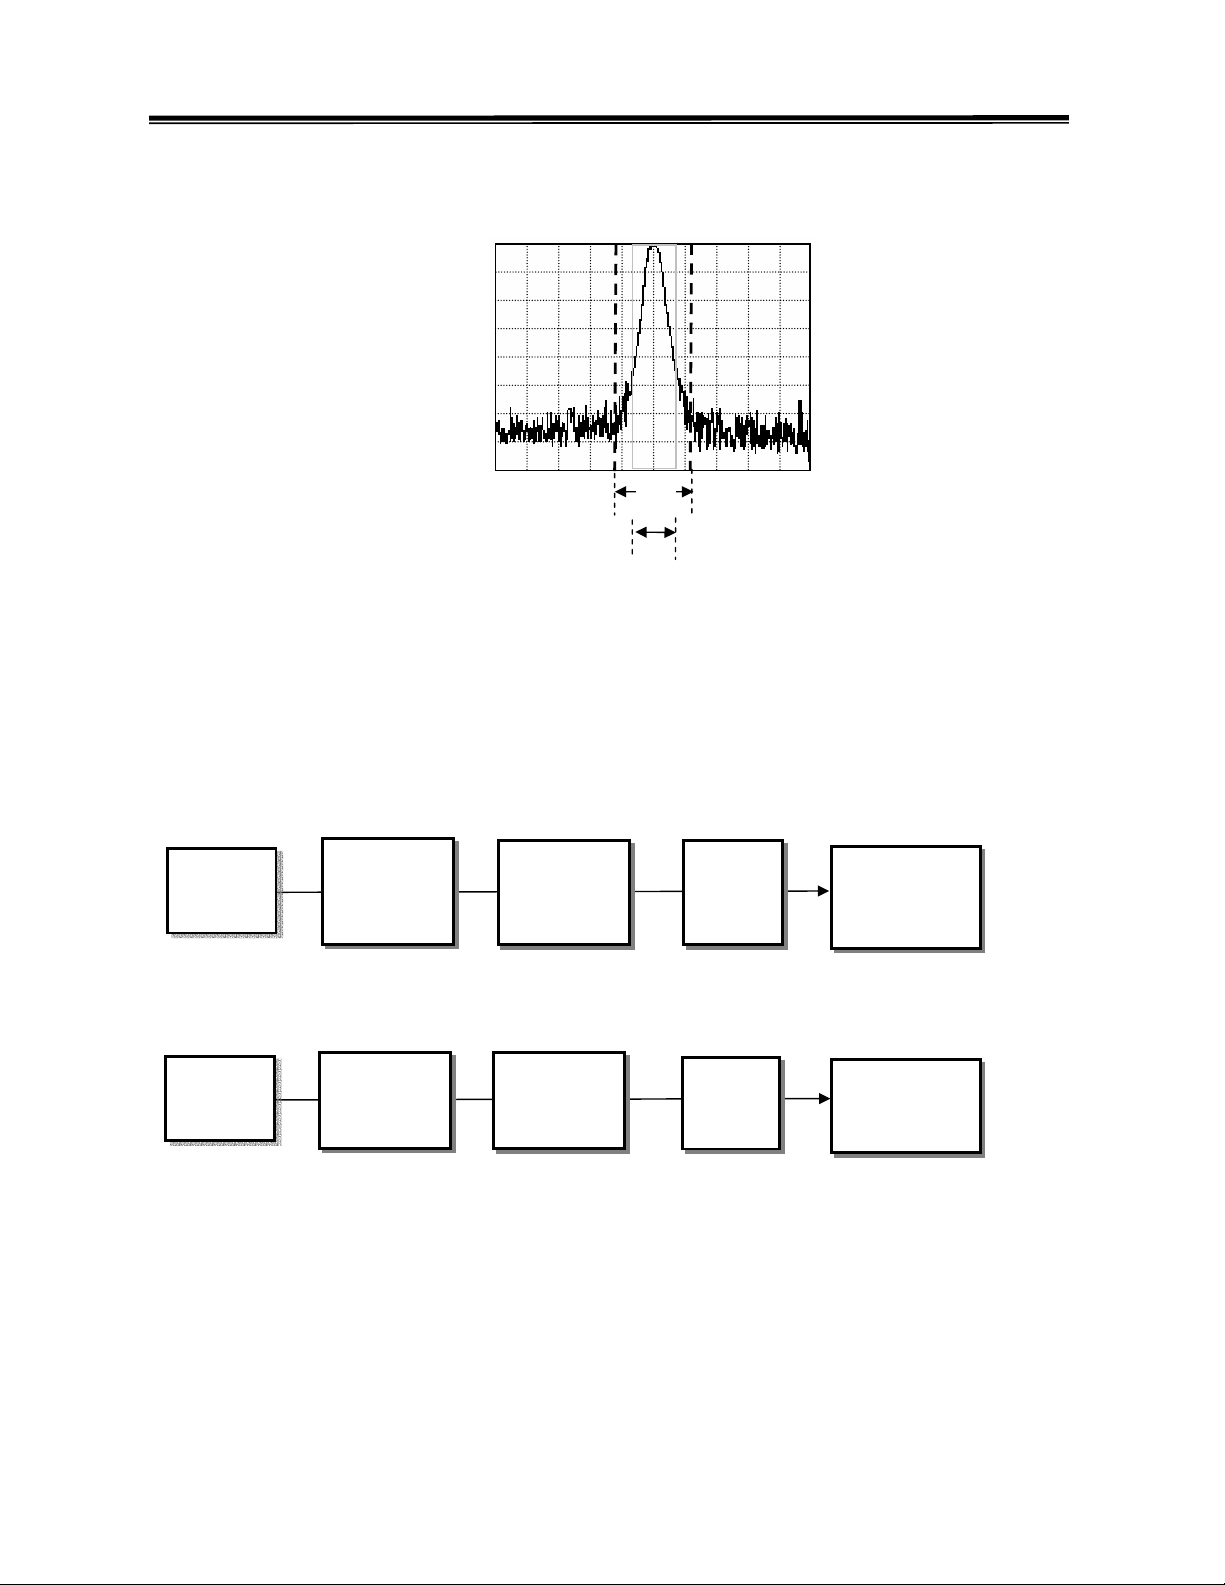
(1, 2)
2.7GHz Spectrum Analyzer Operation Manual
For
OCBW measurement, CH BW and OCBW % (percentage) need to be specified
first. The OCBW will measure the bandwidth that occupies the power percentage.
CH
BW
OCBW
Definitions for OCBW measurement
All CH BW, CH SPC and OCBW % are defined in
are set, by defining
CH Dn keys.
and
CH SPC (channel Spacing)it is easy to measure the next channels by CH UP
Setup function. When the channel parameters
Steps for ACPR Measurement are as follows.
Define
Channel
BW
Define Adj.
Channel BW
and Offset
Turn on
ACPR
measurement
Define
Channel
Space
Carry on the
measurement
of next channel
(For next channel measurement)
Steps for OCBW Measurement are as follows.
Define
Channel
BW
Define
OCBW %
Turn on
OCBW
measurement
Define
Channel
Space
Carry on the
measurement
of next channel
(For next channel measurement)
For the detailed information of each operation, please refer to the following paragraphs.
62
Page 65
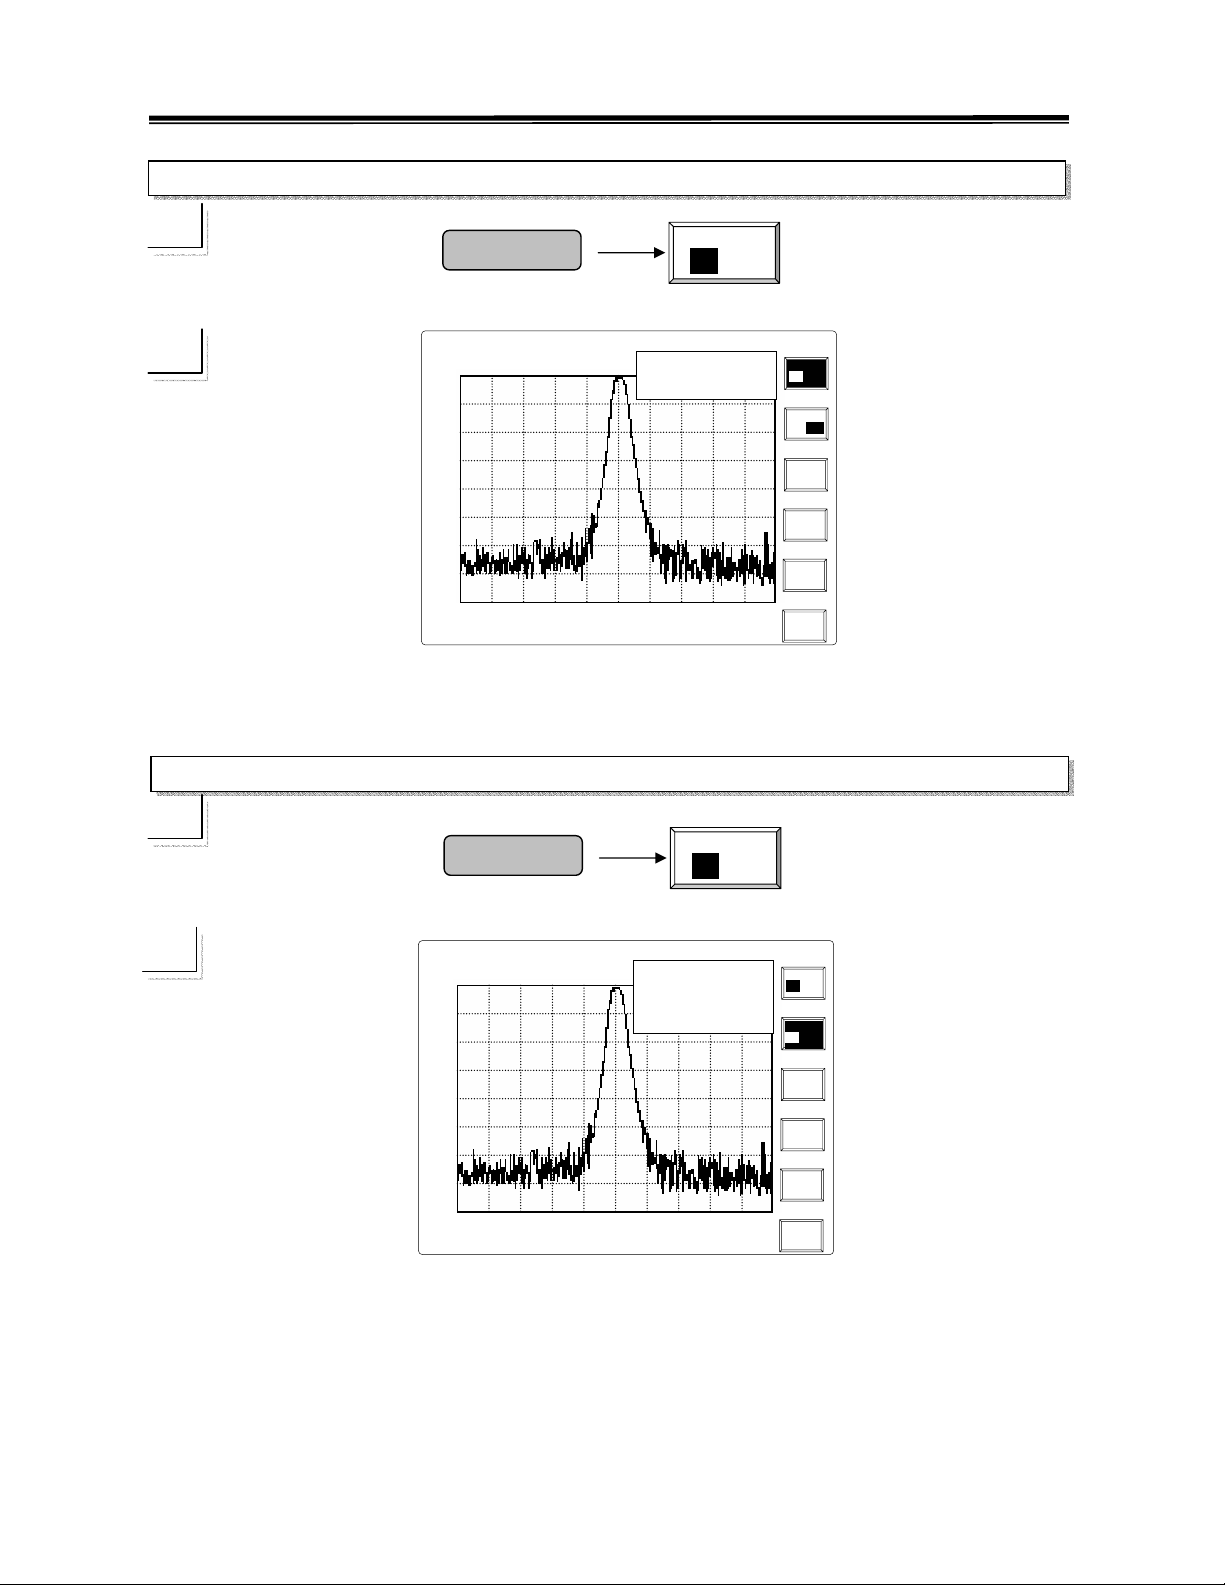
A
p
,
p
,
2.7GHz Spectrum Analyzer Operation Manual
ACPR Measurement
☛
Pwr Measure
SAT JAN 28
Ref
Lvl: -30.0 dBm
-30.0
-40.0
-50.0
-60.0
-70.0
-80.0
-90.0
-100.0
-110.0
Start:99.5MHz
RBW:30 kHz
VBW:100 kHz
Note: When
Adj CH BW 2 and Adj CH Offs 2 are also set, the ACPR 2 will present the
measurement results.
OCBW Measurement
☛
Pwr Measure
SAT JAN 28
Ref
Lvl: -30.0 dBm
-30.0
-40.0
-50.0
-60.0
-70.0
-80.0
-90.0
-100.0
-110.0
Start:99.5MHz
RBW:30 kHz
VBW:100 kHz
2003
2003
14:30:25
INT:REF
AMPL CAL
Center:100.0MHz
Span:1.0M Hz
14:30:25
INT:REF
AMPL CAL
Center:100.0MHz
Span:1.0MHz
CPR
ON OFF
Power Measure ACPR and OCBW
ACPR
LACPR UACPR
1: -41.42 -40.56 dB
2: --- ---
Stop:100.5MHz
:100.0ms
Swee
OCBW
ON OFF
Power Measure ACPR and OCBW
ACPR
LACPR UACPR
1: -41.42 -40.56 dB
2: --- ---
OCBW:205 kHz
Power:-30.2dBm
Stop:100.5MHz
:100.0ms
Swee
ACPR
ON OFF
OCBW
ON OFF
CH BW
Setup
CH
UP
CH
Dn
ACPR
ON OFF
OCBW
ON OFF
CH BW
Setup
CH
UP
CH
Dn
63
Page 66
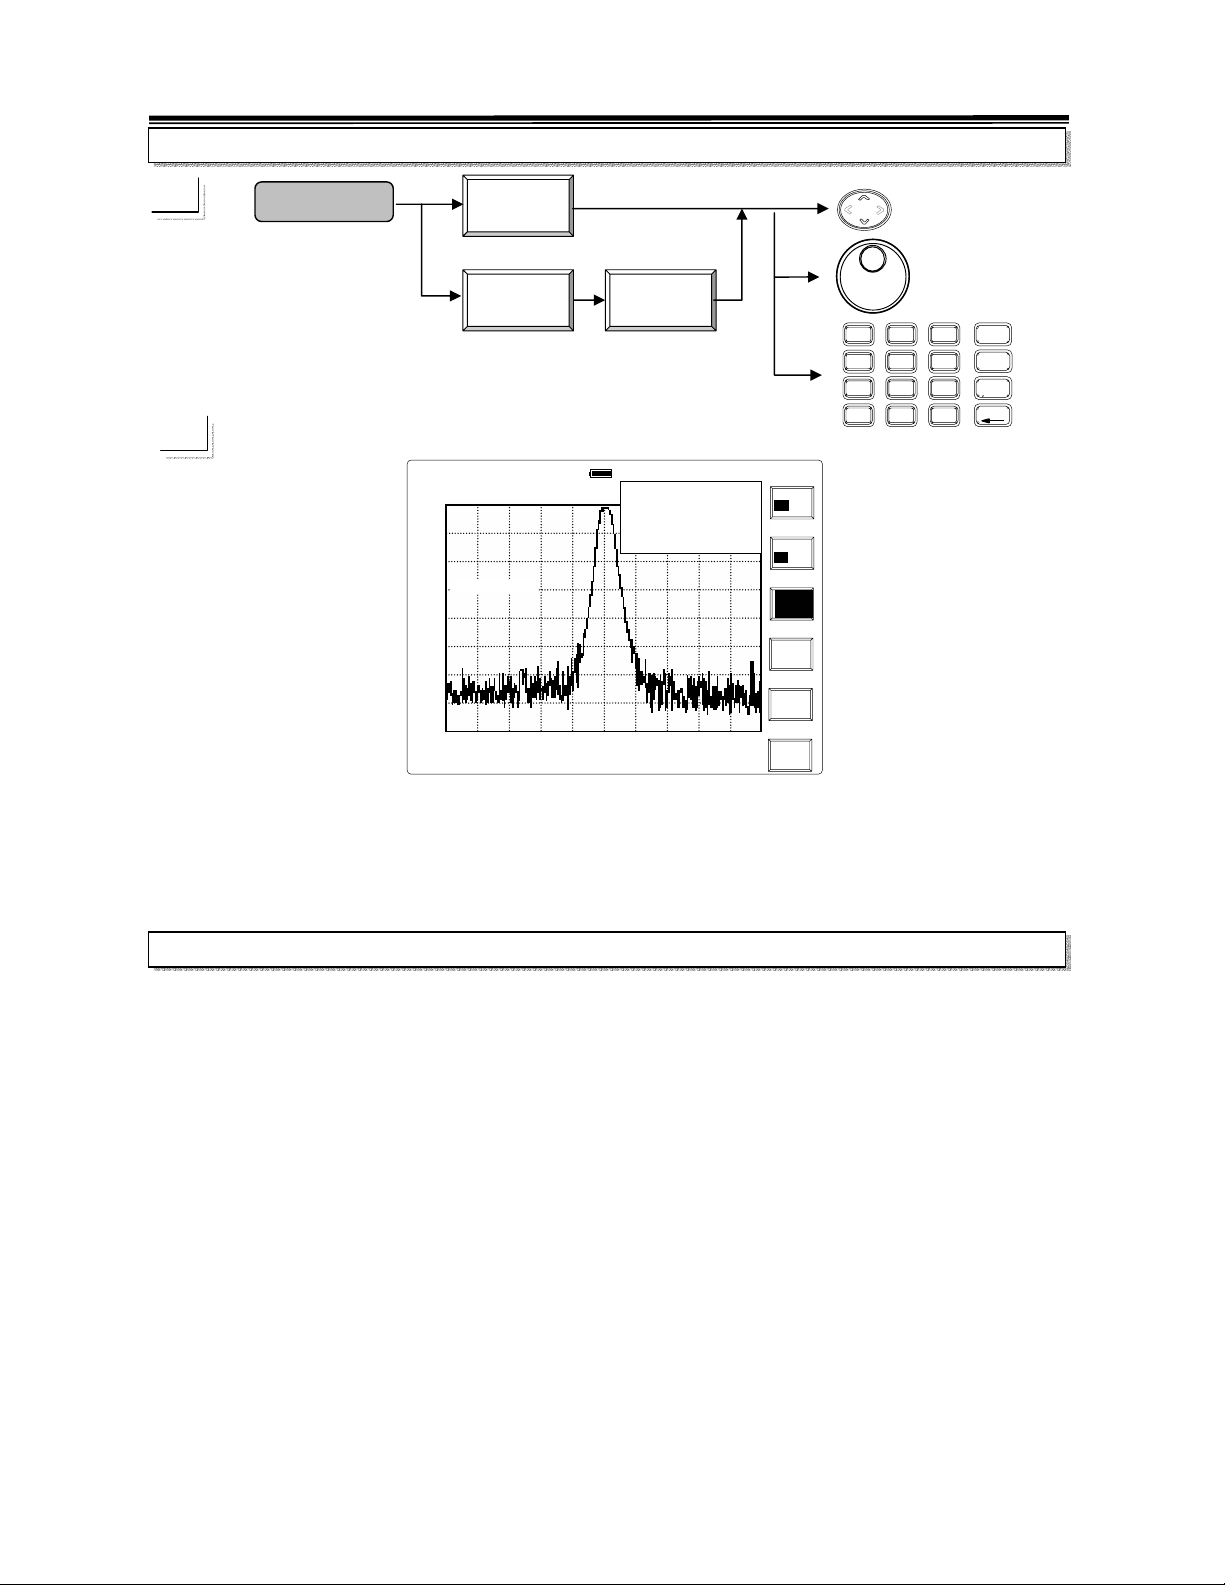
,
2.7GHz Spectrum Analyzer Operation Manual
CH BW
☛
Pwr Measure
CH BW
Setup
CH BW
8
7
4
5
2
1
.
0
GHz
9
dBm
MHz
6
dBmV
kHz
3
dBuV
-
2003
SAT JAN 28
Ref
Lvl: -30.0 dBm
-30.0
-40.0
-50.0
CH BW:100 kHz
-60.0
-70.0
-80.0
-90.0
-100.0
-110.0
Start:99.5MHz
RBW:30 kHz
VBW:100 kHz
14:30:25
INT:REF
AMPL CAL
Center:100.0MHz
Span:1.0MHz
Power Measure ACPR and OCBW
ACPR
LACPR UACPR
1: -41.42 -40.56 dB
2: --- ---
OCBW:205 kHz
Power:-30.2dBm
Stop:100.5MHz
Sweep:100.0ms
ACPR
ON OFF
OCBW
ON OFF
CH BW
Setup
CH
UP
CH
Dn
UP/DOWN and Scroll: To change the frequency by 0.1kHz for every adjustment.
Editing: Editing keys can adjust the channel bandwidth directly.
Channel Setup
Channel Setup is to define the channel parameters that include Channel Bandwidth, Channel
, OCBW Percentage and Adjacent Channel Offset.
Space
64
Page 67
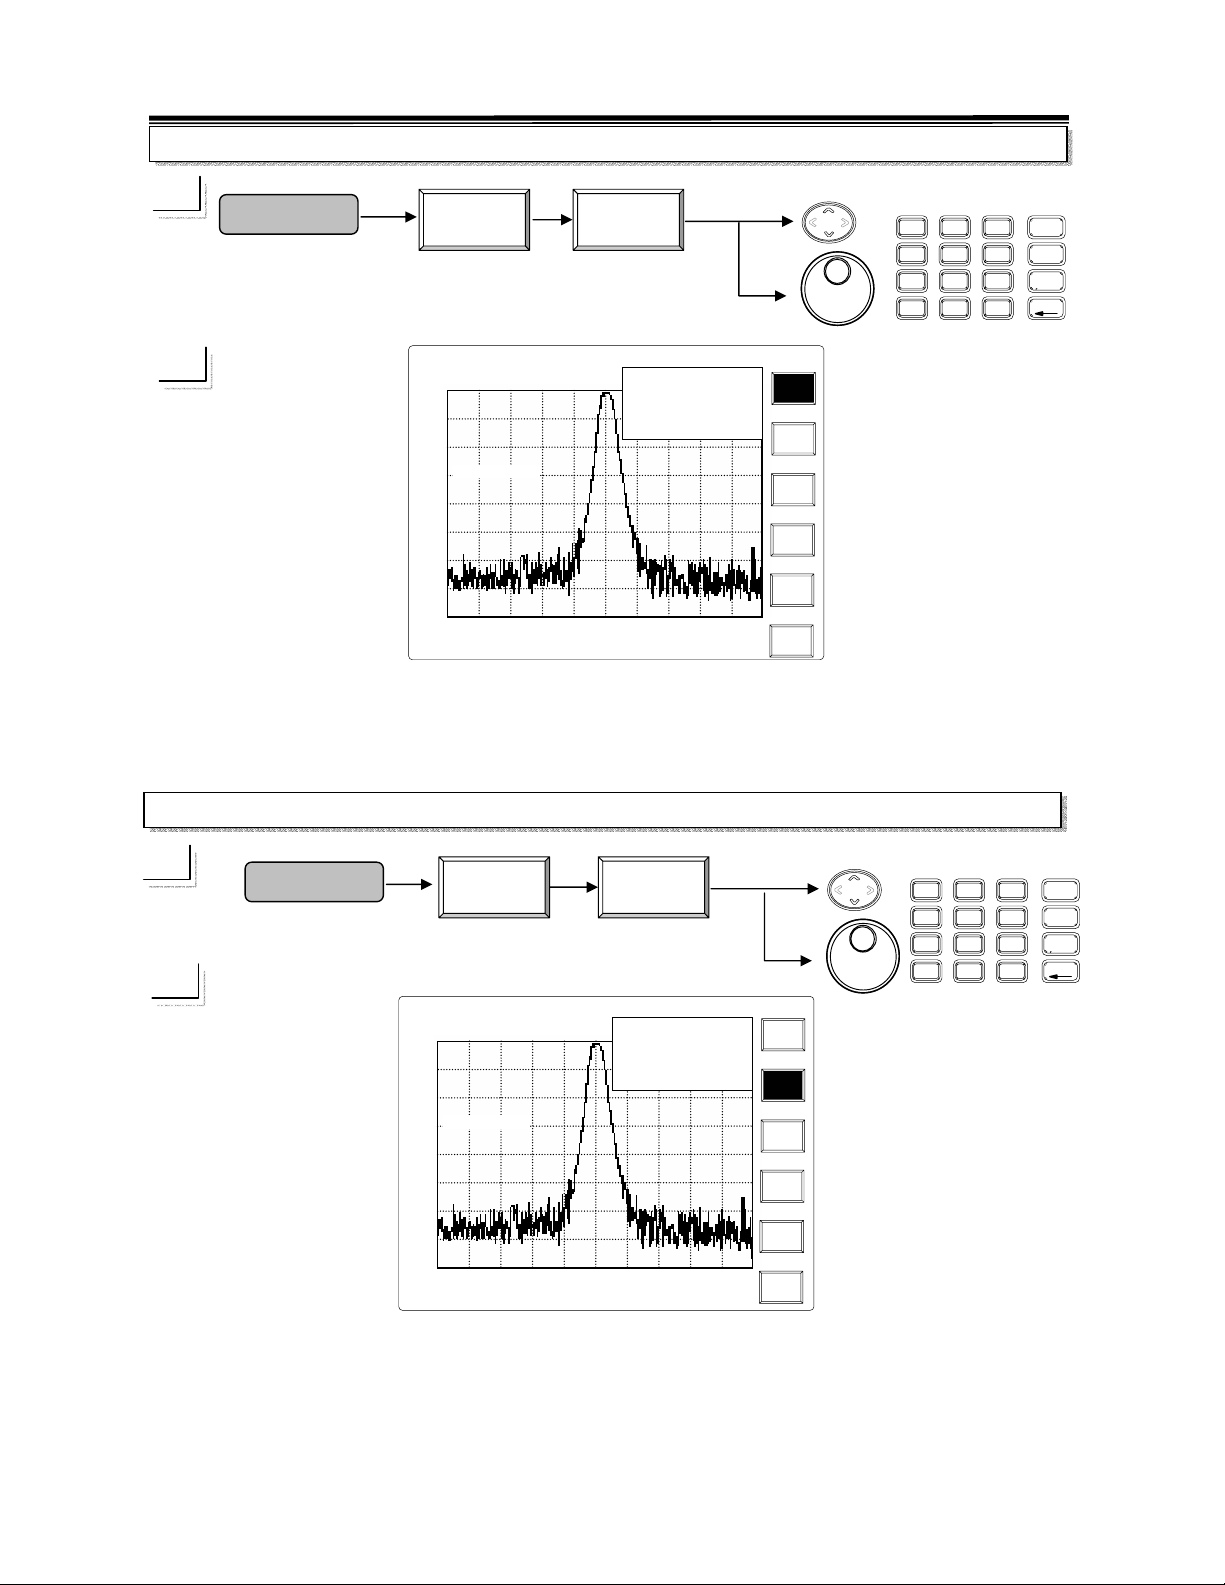
,
p
,
2.7GHz Spectrum Analyzer Operation Manual
Channel Bandwidth
☛
Pwr Measure
Setup
CH BW
Ref
-30.0
-40.0
-50.0
-60.0
-70.0
-80.0
-90.0
-100.0
-110.0
2003
SAT JAN 28
Lvl: -30.0 dBm
CH BW:100 kHz
Start:99.5MHz
RBW:30 kHz
VBW:100 kHz
14:30:25
INT:REF
AMPL CAL
Center:100.0MHz
Span:1.0MHz
Power Measure ACPR and OCBW
ACPR
LACPR UACPR
1: -41.42 -40.56 dB
2: --- ---
OCBW:205 kHz
Power:-30.2dBm
Stop:100.5MHz
Sweep:100.0ms
CH BW
CH SPC
OCBW %
ADJ CH
OFFSET
Return
UP/DOWN and Scroll: To change the frequency by 0.1kHz for every adjustment.
Editing: To adjust the channel bandwidth directly.
Channel Spacing
☛
Pwr Measure
Setup
CH SPC
SAT JAN 28
2003
Ref
Lvl: -30.0 dBm
-30.0
-40.0
-50.0
Spacing:100 kHz
-60.0
-70.0
-80.0
-90.0
-100.0
-110.0
Start:99.5MHz
RBW:30 kHz
VBW:100 kHz
14:30:25
INT:REF
AMPL CAL
Center:100.0MHz
Span:1.0M Hz
Power Measure ACPR and OCBW
ACPR
LACPR UACPR
1: -41.42 -40.56 dB
2: --- ---
OCBW:205 kHz
Power:-30.2dBm
Stop:100.5MHz
:100.0ms
Swee
CH BW
CH SPC
OCBW %
ADJ CH
OFFSET
Return
UP/DOWN and Scroll: To change the frequency by 100kHz for every adjustment.
Editing: To adjust the channel bandwidth directly.
8
7
4
5
2
1
.
0
8
7
4
5
2
1
.
0
GHz
9
dBm
MHz
6
dBmV
kHz
3
dBuV
-
GHz
9
dBm
MHz
6
dBmV
kHz
3
dBuV
-
65
Page 68
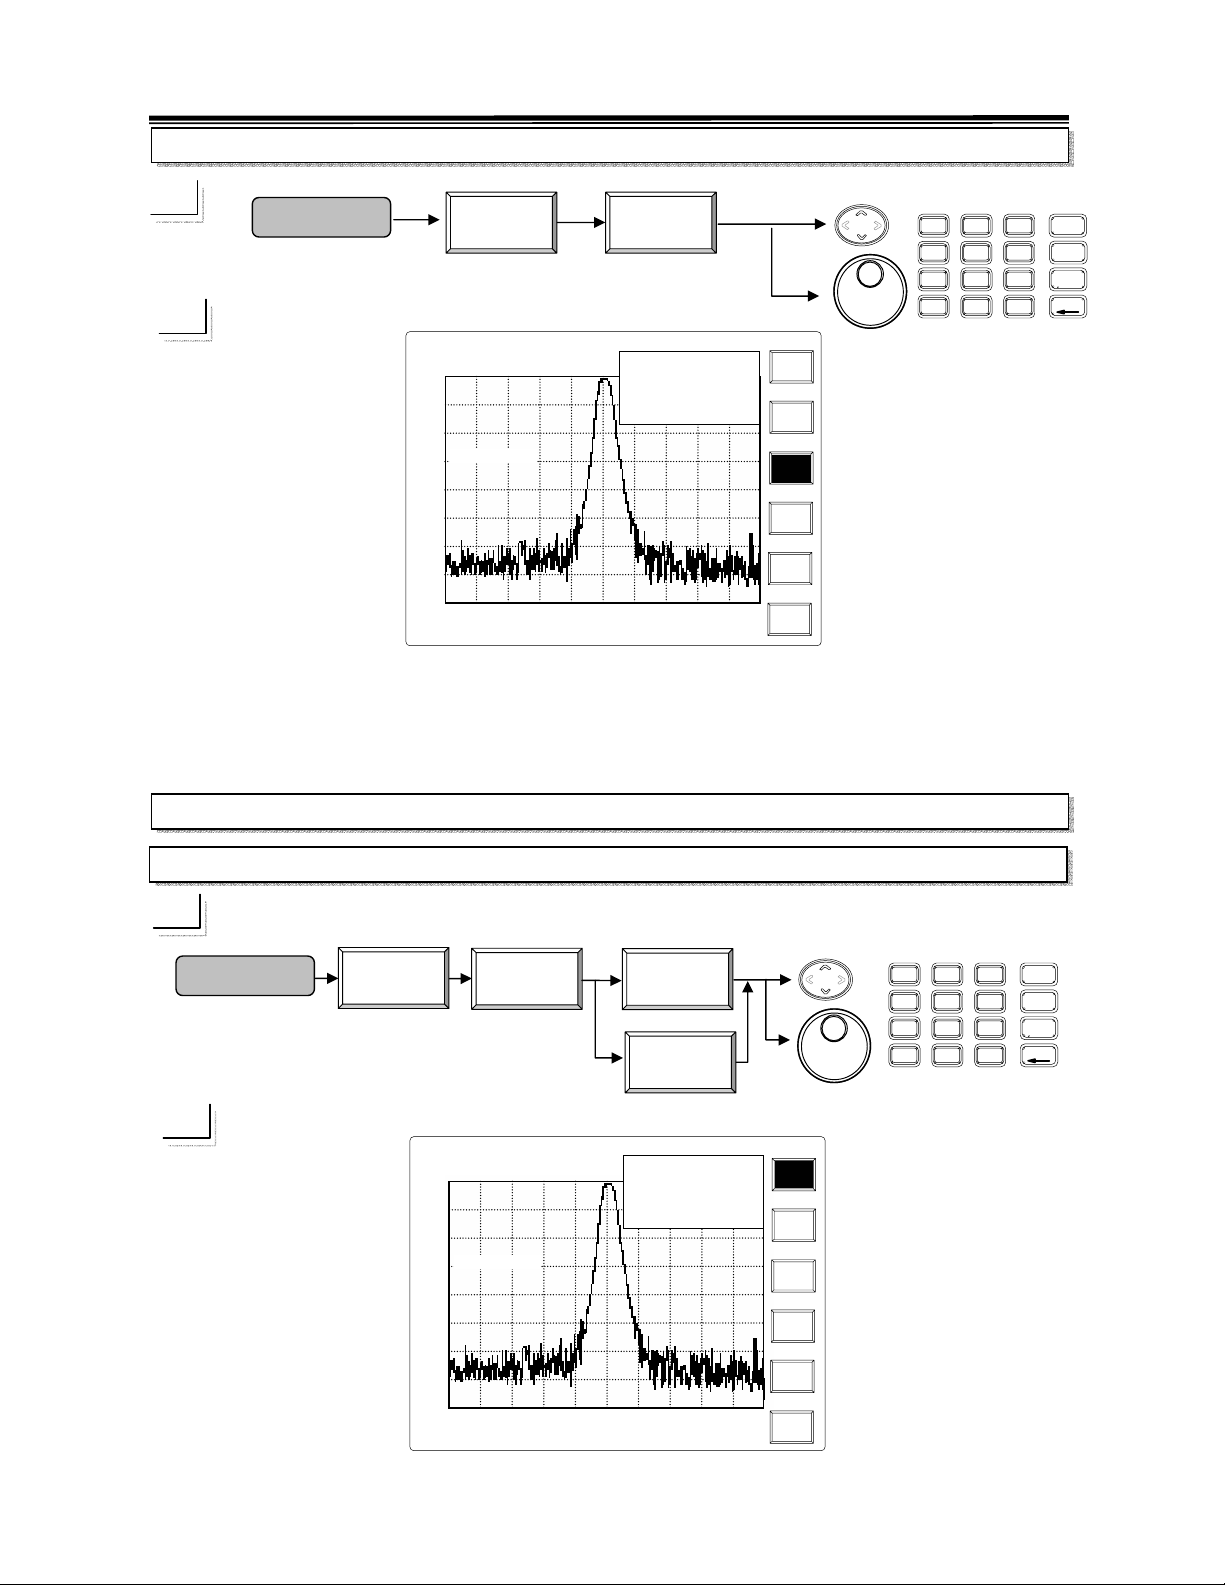
,
,
A
j
j
A
A
2.7GHz Spectrum Analyzer Operation Manual
OCBW %
☛
Pwr Measure
Setup
OCBW %
SAT JAN 28
2003
Ref
Lvl: -30.0 dBm
-30.0
-40.0
-50.0
Percent: 90 %
-60.0
-70.0
-80.0
-90.0
-100.0
-110.0
Start:99.5MHz
RBW:30 kHz
VBW:100 kHz
14:30:25
INT:REF
AMPL CAL
Center:100.0MHz
Span:1.0MHz
Power Measure ACPR and OCBW
ACPR
LACPR UACPR
1: -41.42 -40.56 dB
2: --- ---
OCBW:205 kHz
Power:-30.2dBm
Stop:100.5MHz
Sweep:100.0ms
CH BW
CH SPC
OCBW %
ADJ CH
OFFSET
Return
UP/DOWN and Scroll: To change the power ratio by 1 percent for every adjustment.
Editing: Numerical keys followed by Enter key can set from 0 to 100 % directly.
Adjacent Channel Offset
Adjacent Channel Bandwidth 1(2)
"
Pwr Measure
Setup
DJ CH
OFFSET
DJ CH
BW 1
DJ CH
BW 2
7
4
1
0
SAT JAN 28
Ref
Lvl: -30.0 dBm
-30.0
-40.0
-50.0
BW:100 kHz
-60.0
-70.0
-80.0
-90.0
-100.0
-110.0
Start:99.5MHz
RBW:30 kHz
VBW:100 kHz
2003
14:30:25
INT:REF
AMPL CAL
Center:100.0MHz
Span:1.0M Hz
Power Measure ACPR and OCBW
ACPR
LACPR UACPR
1: -41.42 -40.56 dB
2: --- ---
OCBW:205 kHz
Power:-30.2dBm
Stop:100.5MHz
Sweep:100.0ms
Adj CH
BW 1
Adj CH
Offs 1
CH
Ad
BW 2
Ad
CH
Offs 2
Return
9
3
6
-
GHz
dBm
MHz
dBmV
kHz
dBuV
GHz
dBm
MHz
dBmV
kHz
dBuV
8
7
4
5
2
1
.
0
8
9
5
6
3
2
.
-
66
Page 69
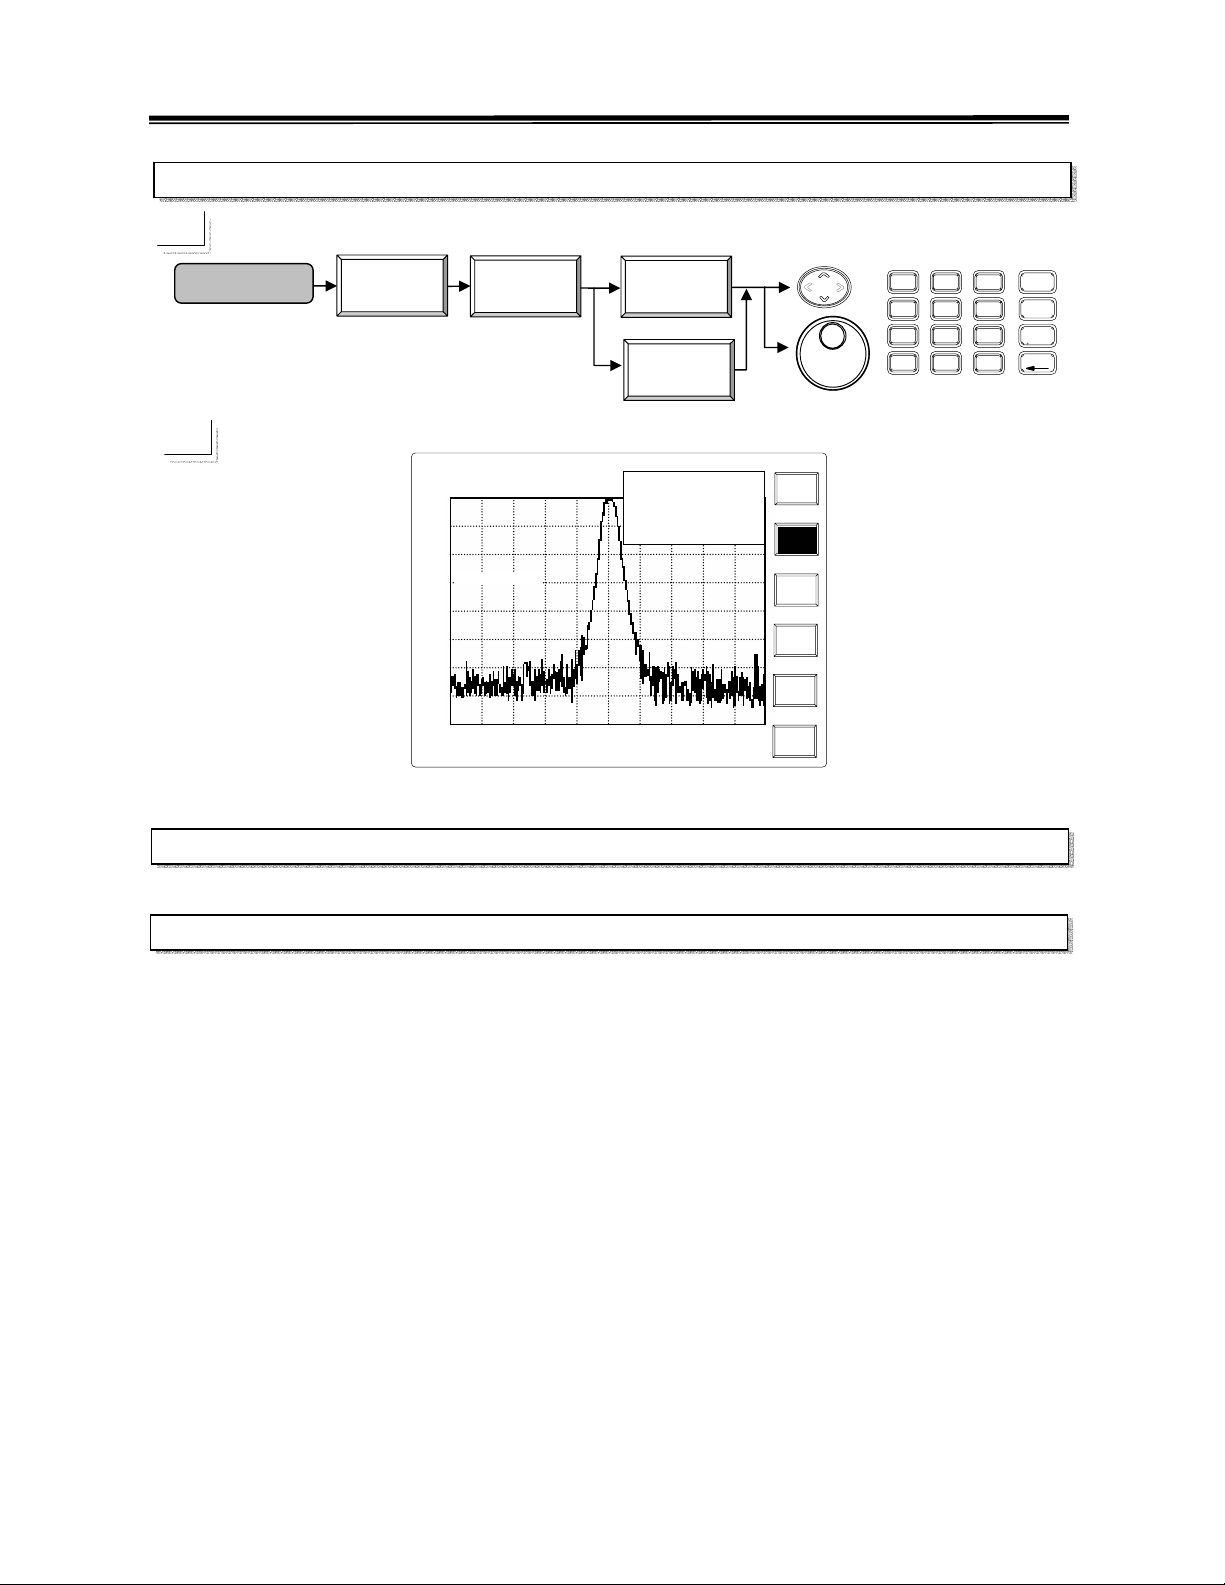
,
j
j
A
A
A
2.7GHz Spectrum Analyzer Operation Manual
Adjacent Channel Offset 1(2)
"
Pwr Measure
Setup
DJ CH
OFFSET
Ref
-30.0
-40.0
-50.0
-60.0
-70.0
-80.0
-90.0
-100.0
-110.0
2003
SAT JAN 28
Lvl: -30.0 dBm
OFFSET:100 kHz
Start:99.5MHz
RBW:30 kHz
VBW:100 kHz
14:30:25
INT:REF
AMPL CAL
Center:100.0MHz
Span:1.0MHz
Channel UP
The Power Measurement will measure the next higher channel.
Channel Down
DJ CH
Offs 1
DJ CH
Offs 2
Power Measure ACPR and OCBW
ACPR
LACPR UACPR
1: -41.42 -40.56 dB
2: -35.62 -34.58 dB
OCBW:205 kHz
Power:-30.2dBm
Stop:100.5MHz
Sweep:100.0ms
Adj CH
BW 1
Adj CH
Offs 1
CH
Ad
BW 2
Ad
CH
Offs 2
Return
8
7
4
5
2
1
.
0
GHz
9
dBm
MHz
6
dBmV
kHz
3
dBuV
-
The Power Measurement will measure the lower channel.
67
Page 70
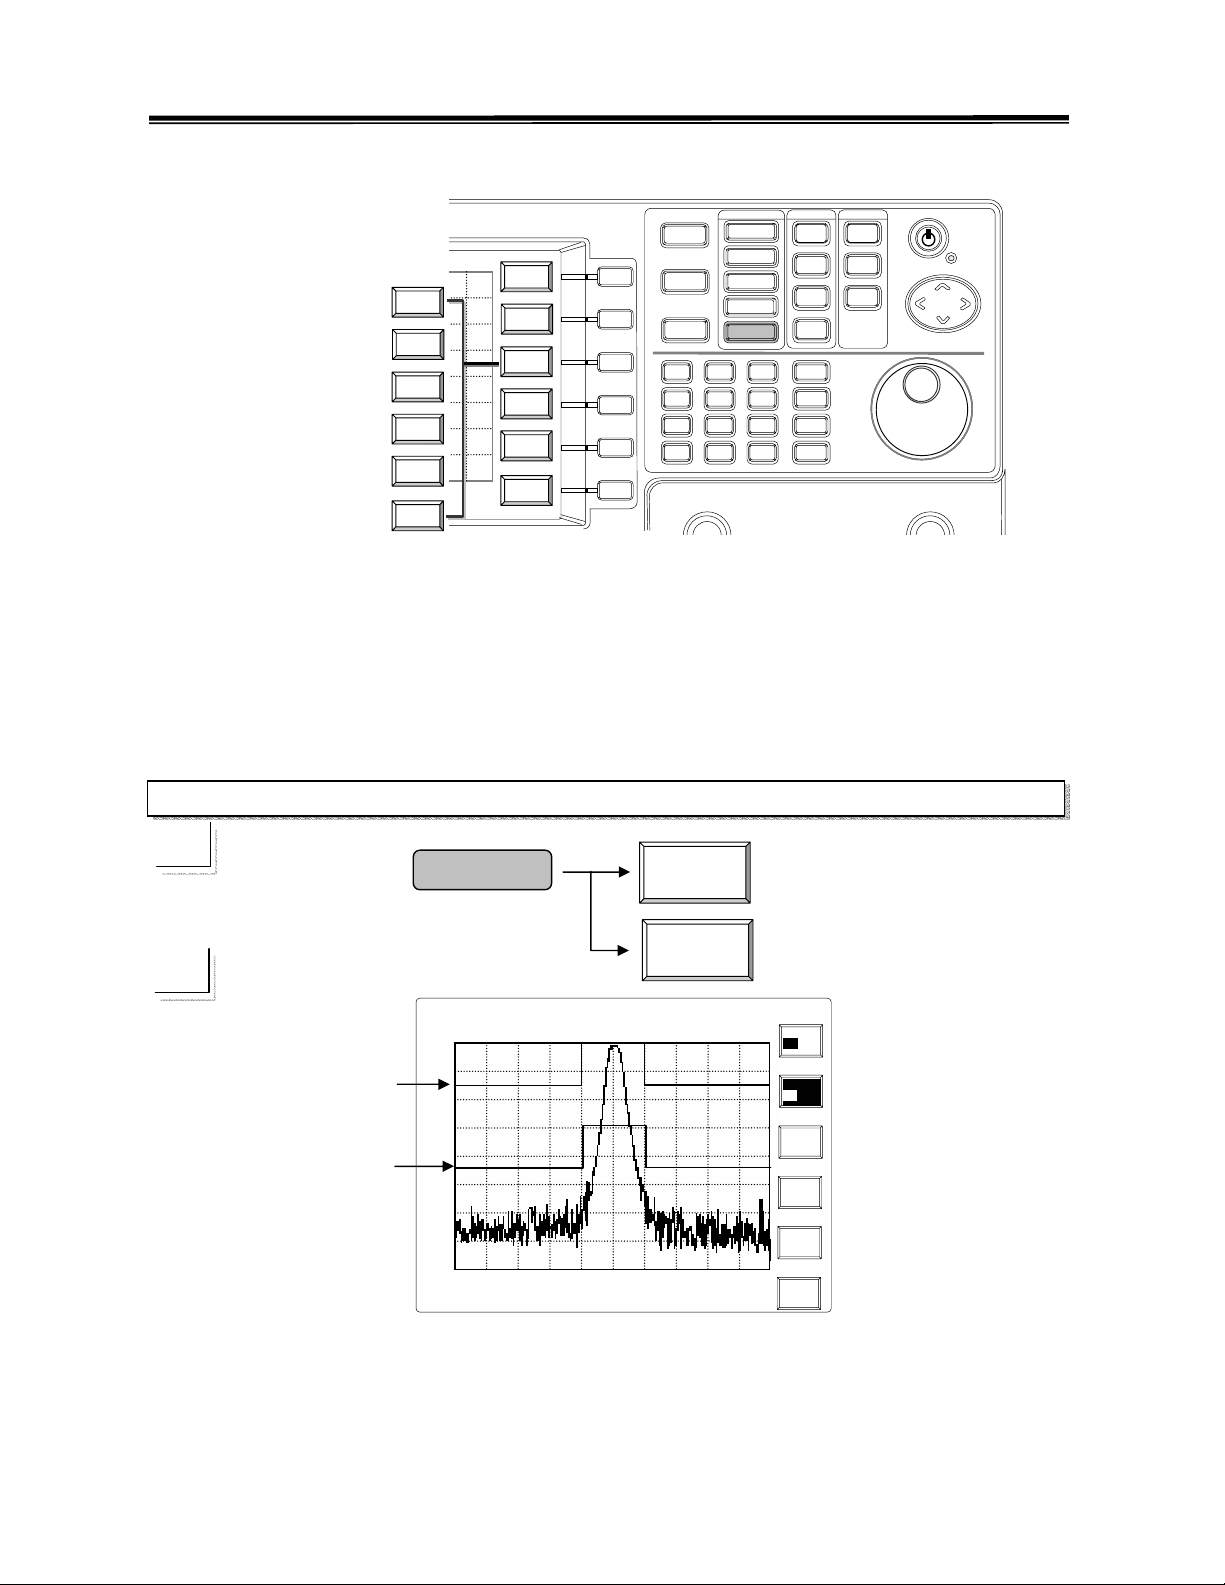
,
2.7GHz Spectrum Analyzer Operation Manual
8.2.5 Limit Line
HLimit
Limit
Center
High
Insert
Start
Delete
stop
Step
Undo
Center
ON OFF
LLimit
Start
ON OFF
Edit
stop
Pss/fl
Step
ON OFF
Return
F1
F2
F3
F4
F5
7
4
F6
Limit Line
8
9
5
6
3
2
1
.
0
-
Limit Line functions provide two limit lines, High Limit and Low Limit to perform the
Pass/Fail test. The Limit lines are easy to edit to fit the required threshold.
Limit Line ON/OFF
☛
Limit Line
HLimit
ON OFF
LLimit
ON OFF
High Limit Line
Low Limit Line
Ref
-30.0
-40.0
-50.0
-60.0
-70.0
-80.0
-90.0
-100.0
-110.0
2003
SAT JAN 28
Lvl: -30.0 dBm
Start:99.5MHz
RBW:30 kHz
VBW:100 kHz
14:30:25
INT:REF
AMPL CAL
Center:100.0MHz
Span:1.0M Hz
Stop:100.5MHz
Sweep:100.0ms
HLimit
ON OFF
LLimit
ON OFF
Edit
Pss/fl
ON OFF
68
Page 71
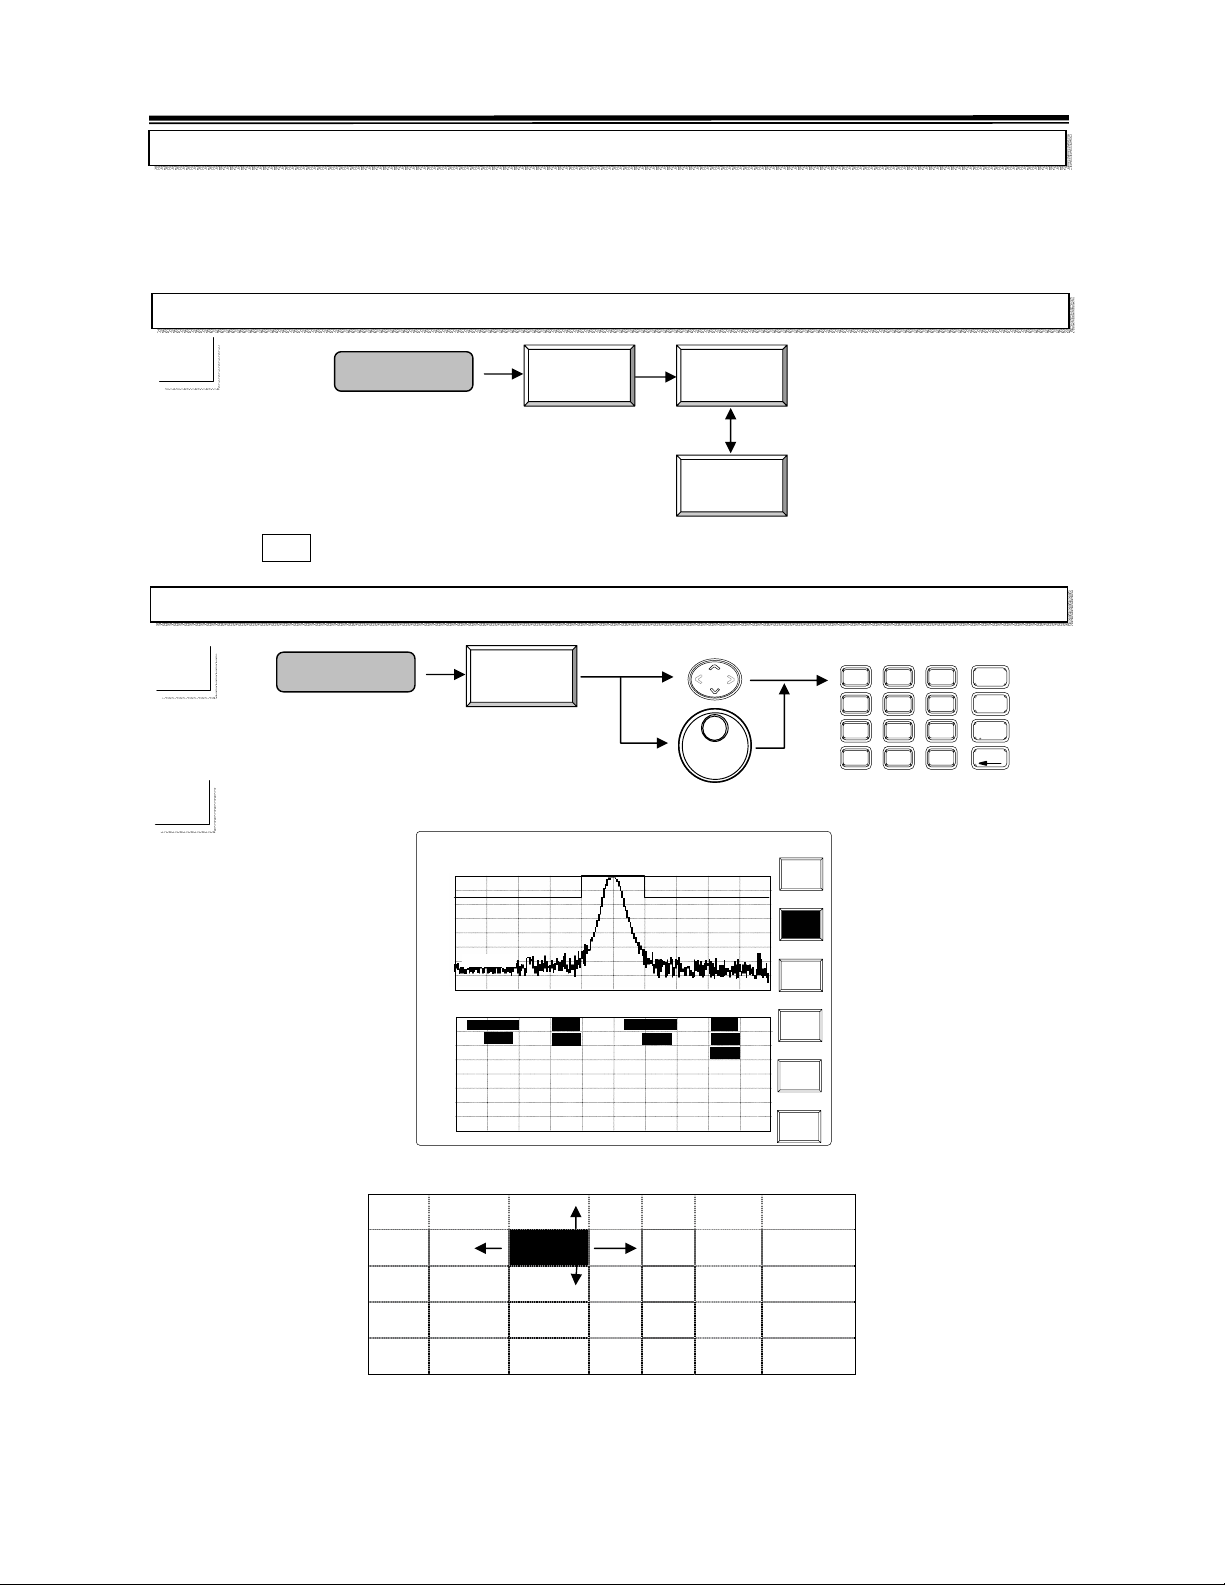
,
2.7GHz Spectrum Analyzer Operation Manual
Edit
The Limit Line is edited by mean of defining point by point. Each time a new point is inserted in
the table, the Limit Line is connected to the ahead and followed points immediately. More
details are described in the following paragraphs.
High Limit /Low Limit Selection
☛
Limit Line
Edit
Limit
High
Limit
Low
Repeating
F1 will toggle high limit and low limit to edit.
Limit Line Edit
☛
Limit Line
Edit
8
7
4
5
2
1
.
0
GHz
9
dBm
MHz
6
dBmV
kHz
3
dBuV
-
SAT JAN 28
2003
(MHz)
14:30:25
INT:REF
AMPL CAL
Center:100.0MHz
(dBm
Stop:100.5MHz
Span:1.0MHz
Frequency
(MHz)
5: 100.4
6: 100.5 -45.0
Level Level
(dBm
-45.0
Limit
Lower
Insert
Delete
Undo
Reutrn
Ref
Lvl: -30.0 dBm
-30.0
-50.0
-70.0
Level:-45
-90.0
-110.0
Start:99.5MHz
VBW:100 kHz
Frequency
0: 99.5 -45.0
1: 99.9 -45.0
2: 99.9 -30.0
3: 100.1 -30.0
4: 100.1 -45.0
UP/DOWN and Scroll: To move the cursor to the field to edit.
0 99.5 -45.0 5 100.4 -45.0
1 99.9 -45.0 6 100.5 -45.0
2 99.9 -30.0
3 100.1 -30.0
4 100.1 -45.0
Editing
: Enter the frequency (horizontal) or level( vertical) of the point.
69
Page 72
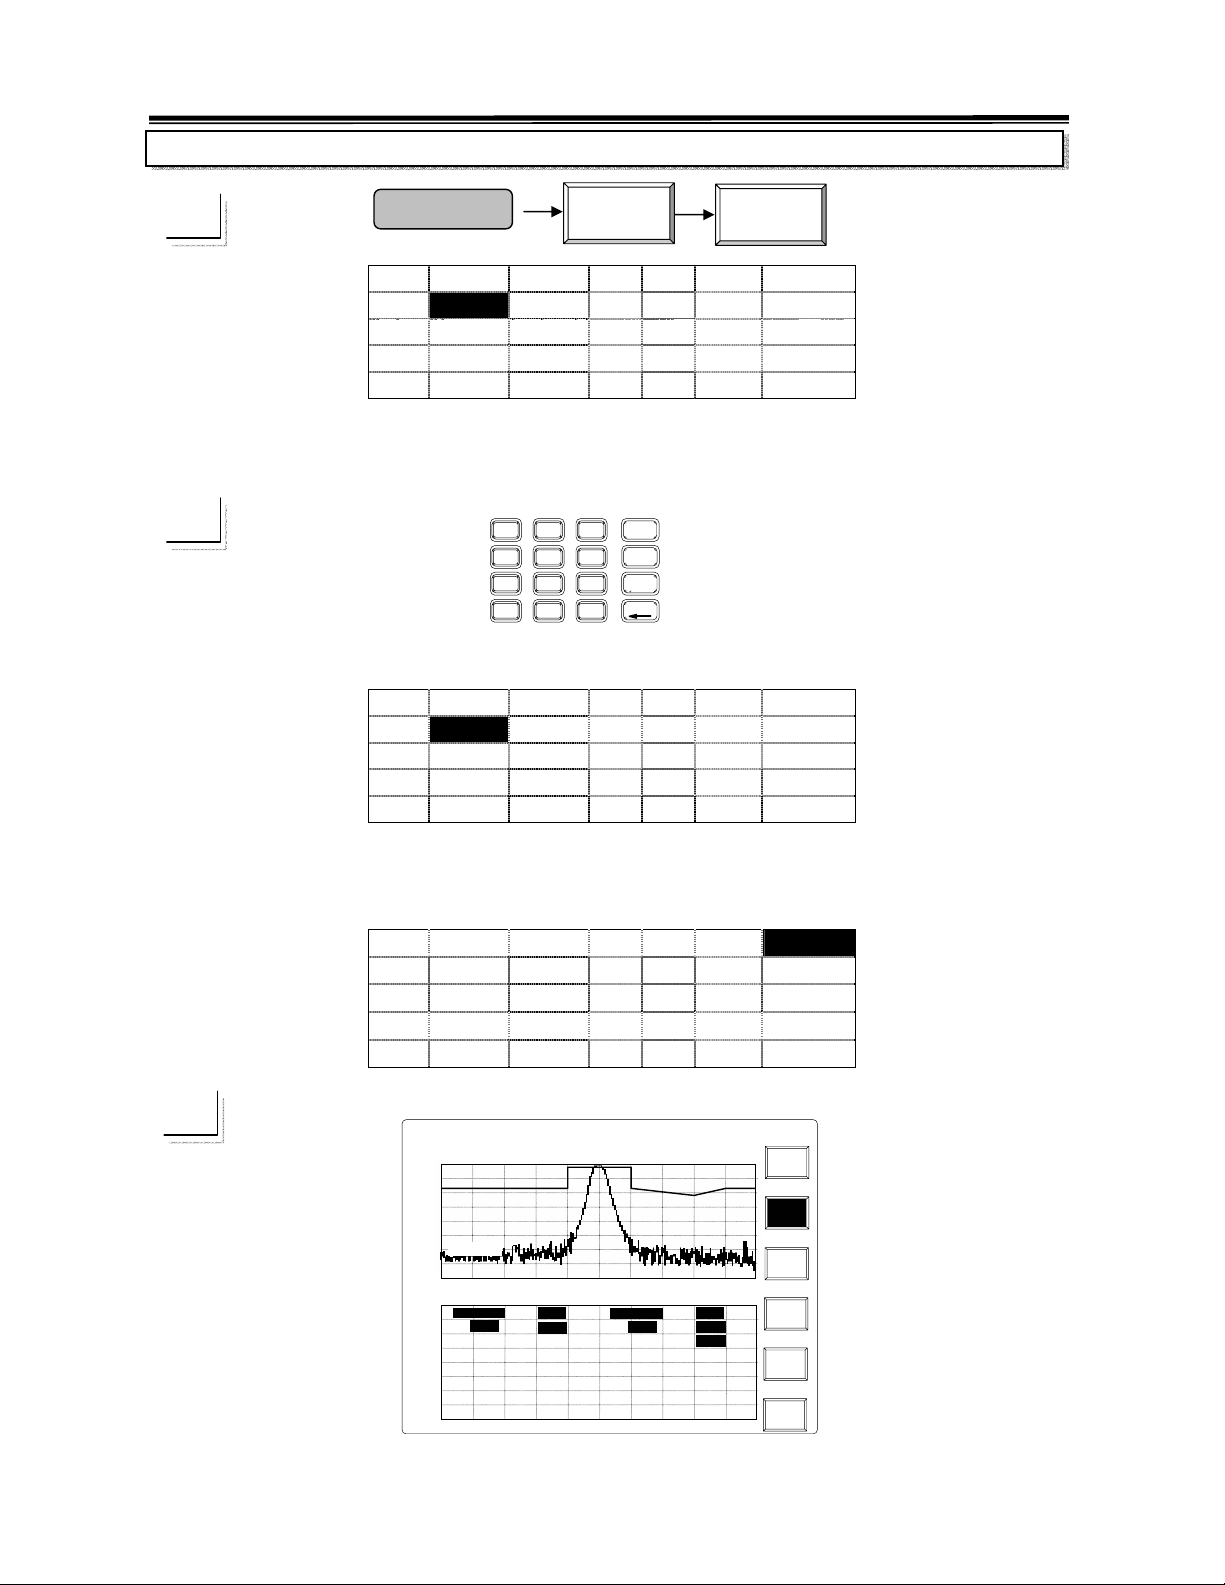
p
,
2.7GHz Spectrum Analyzer Operation Manual
Insert a point
☛
Limit Line
Edit
Insert
0 99.5 -45.0 5 100.1 -45.0
1 99.7 -45.0 6 100.4 -45.0
2 99.9 -45.0 7 100.5 -45.0
3 99.9 -30.0
4 100.1 -30.0
When a new point is inserted at its current field, the temporary values of frequency and level are
automatically generated. Both new values are the average of ahead and followed points.
☛
8
7
4
5
2
1
.
0
GHz
9
dBm
MHz
6
dBmV
kHz
3
dBuV
-
Enter the desired frequency. Take 100.3MHz as example here.
0 99.5 -45.0 5 100.1 -45.0
1 100.3 -45.0 6 100.4 -45.0
2 99.9 -45.0 7 100.5 -45.0
3 99.9 -30.0
4 100.1 -30.0
When the entry is completed, the table will sort itself immediately by the order of frequency. The
limit line is modified accordingly. Enter the Level value if it is necessary.
0 99.5 -45.0 5 100.3
-40.0
1 99.9 -45.0 6 100.4 -45.0
2 99.9 -30.0 7 100.5 -45.0
3 100.1 -30.0
4 100.1 -45.0
SAT JAN 28
2003
(MHz)
14:30:25
INT:REF
AMPL CAL
Center:100.0MHz
(dBm
Stop:100.5MHz
S
an:1.0MHz
Frequency
(MHz)
5: 100.3
6: 100.4 -45.0
7: 100.5 -45.0
Level Level
(dBm
-40.0
Limit
Lower
Insert
Delete
Undo
Reutrn
Ref
Lvl: -30.0 dBm
-30.0
-50.0
-70.0
Level:-45
-90.0
-110.0
Start:99.5MHz
VBW:100 kHz
Frequency
0: 99.5 -45.0
1: 99.9 -45.0
2: 99.9 -30.0
3: 100.1 -30.0
4: 100.1 -45.0
70
Page 73
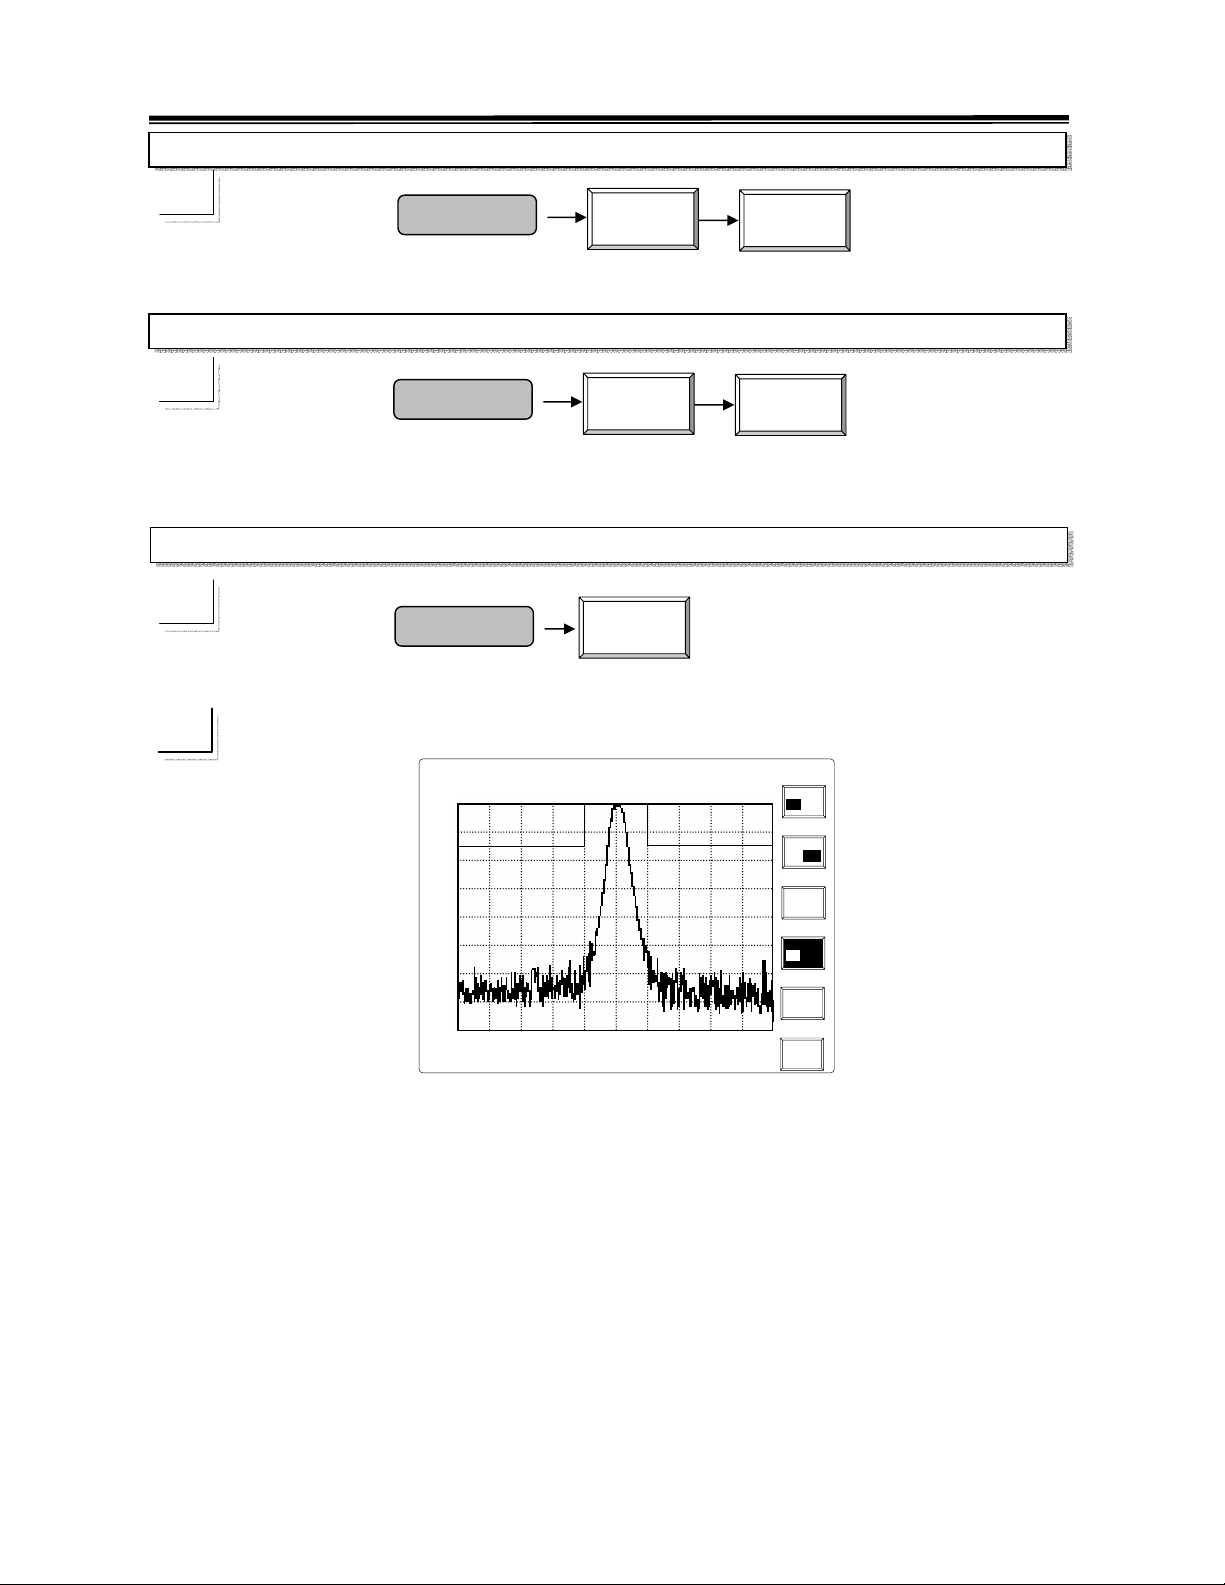
p
,
2.7GHz Spectrum Analyzer Operation Manual
Delete a Point
☛
Limit Line
Edit
Delete
Delete point will remove the point where the cursor is located.
Undo
☛
Limit Line
Edit
Undo
Undo function will recover the previous editing, it can be either Insert or Delete. Only one step is
reserved.
Pass/ Fail test
☛
Limit Line
Pss/fl
ON OFF
SAT JAN 28
2003
14:30:25
Ref
Lvl: -30.0 dBm
-30.0
-40.0
-50.0
-60.0
-70.0
-80.0
-90.0
-100.0
-110.0
Start:99.5MHz
RBW:30 kHz
VBW:100 kHz
INT:REF
AMPL CAL
PASS!
Center:100.0MHz
Span:1.0MHz
:100.5MHz
Sto
Sweep:100.0ms
HLimit
ON OFF
LLimit
ON OFF
Edit
Pss/fl
ON OFF
71
Page 74
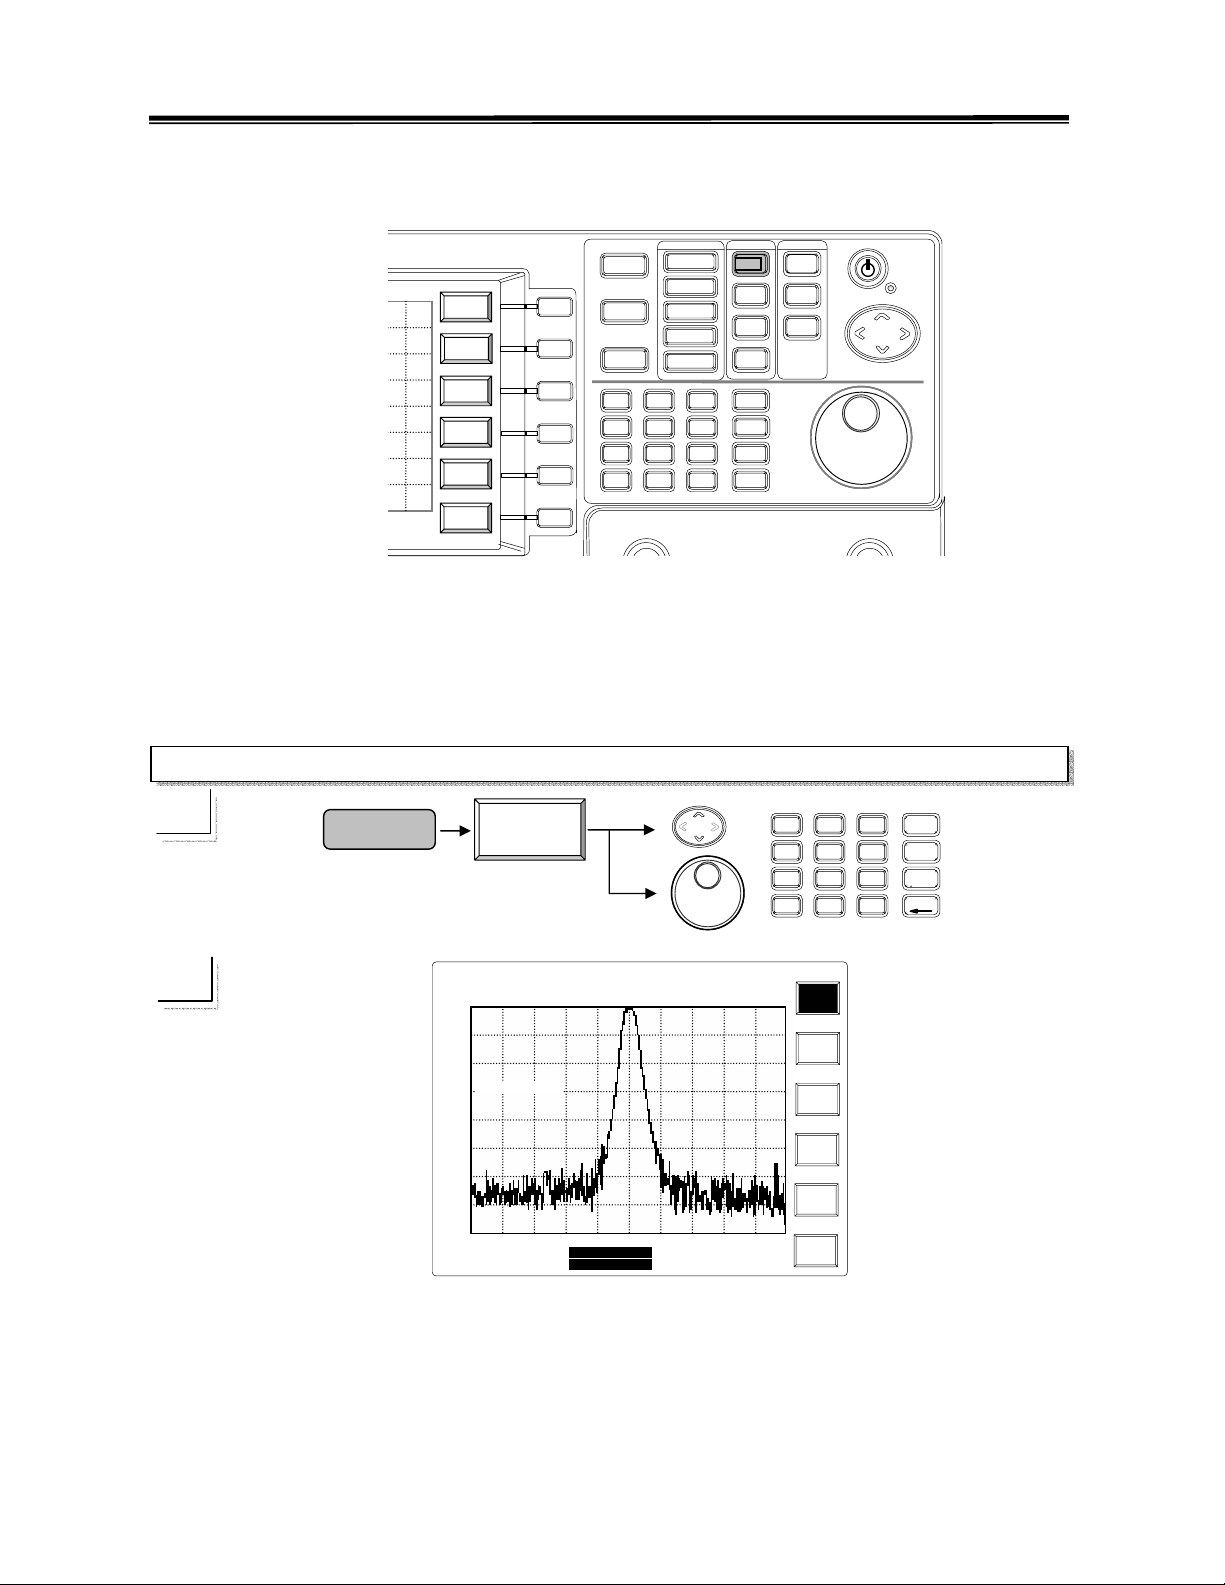
W
,
2.7GHz Spectrum Analyzer Operation Manual
8.3 Control Functions
8.3.1 BW
RBW
Center
Auto
VBW
Start
Auto
SwpTm
stop
Auto
ALL
Step
Auto
F1
F2
F3
F4
F5
F6
8
7
4
5
2
1
.
0
B
9
6
3
-
BW functions include RBW, VBW and Sweep Time. All of the functions have AUTO and
Manual mode. In
different
can be set
Span selection will choose its adaptive BW combination. Every parameter in BW
Manual mode separately.
ALL Auto mode, these parameters are coupled with Span. Which means
RBW
☛
BW
RBW
Auto
8
7
4
5
2
1
.
0
GHz
9
dBm
MHz
6
dBmV
kHz
3
dBuV
BK SP
-
SAT JAN 28
2003
1
Ref Lvl: -30.0 dBm
-30.0
-40.0
-50.0
RBW:300 kHz
-60.0
-70.0
-80.0
-90.0
-100.0
-110.0
Start:99.5MHz
RBW:30 kHz
VBW:100 kHz
14:30:25
INT:REF
AMPL CAL
Center:100.0MHz
Span:1.0MHz
Stop:100.5MHz
Sweep:100.0ms
RBW
AUTO
VBW
Auto
SwpTm
Auto
All
Auto
Repeating
RBW Auto key can switch the RBW between Auto and Manual mode.
UP/DOWN and Scroll: Select the RBW within 3k, 30k, 300k and 4MHz under Manu Mode.
Editing: The editing entry will select the closest RBW to 3k, 30k, 300k and 4MHz.
72
Page 75
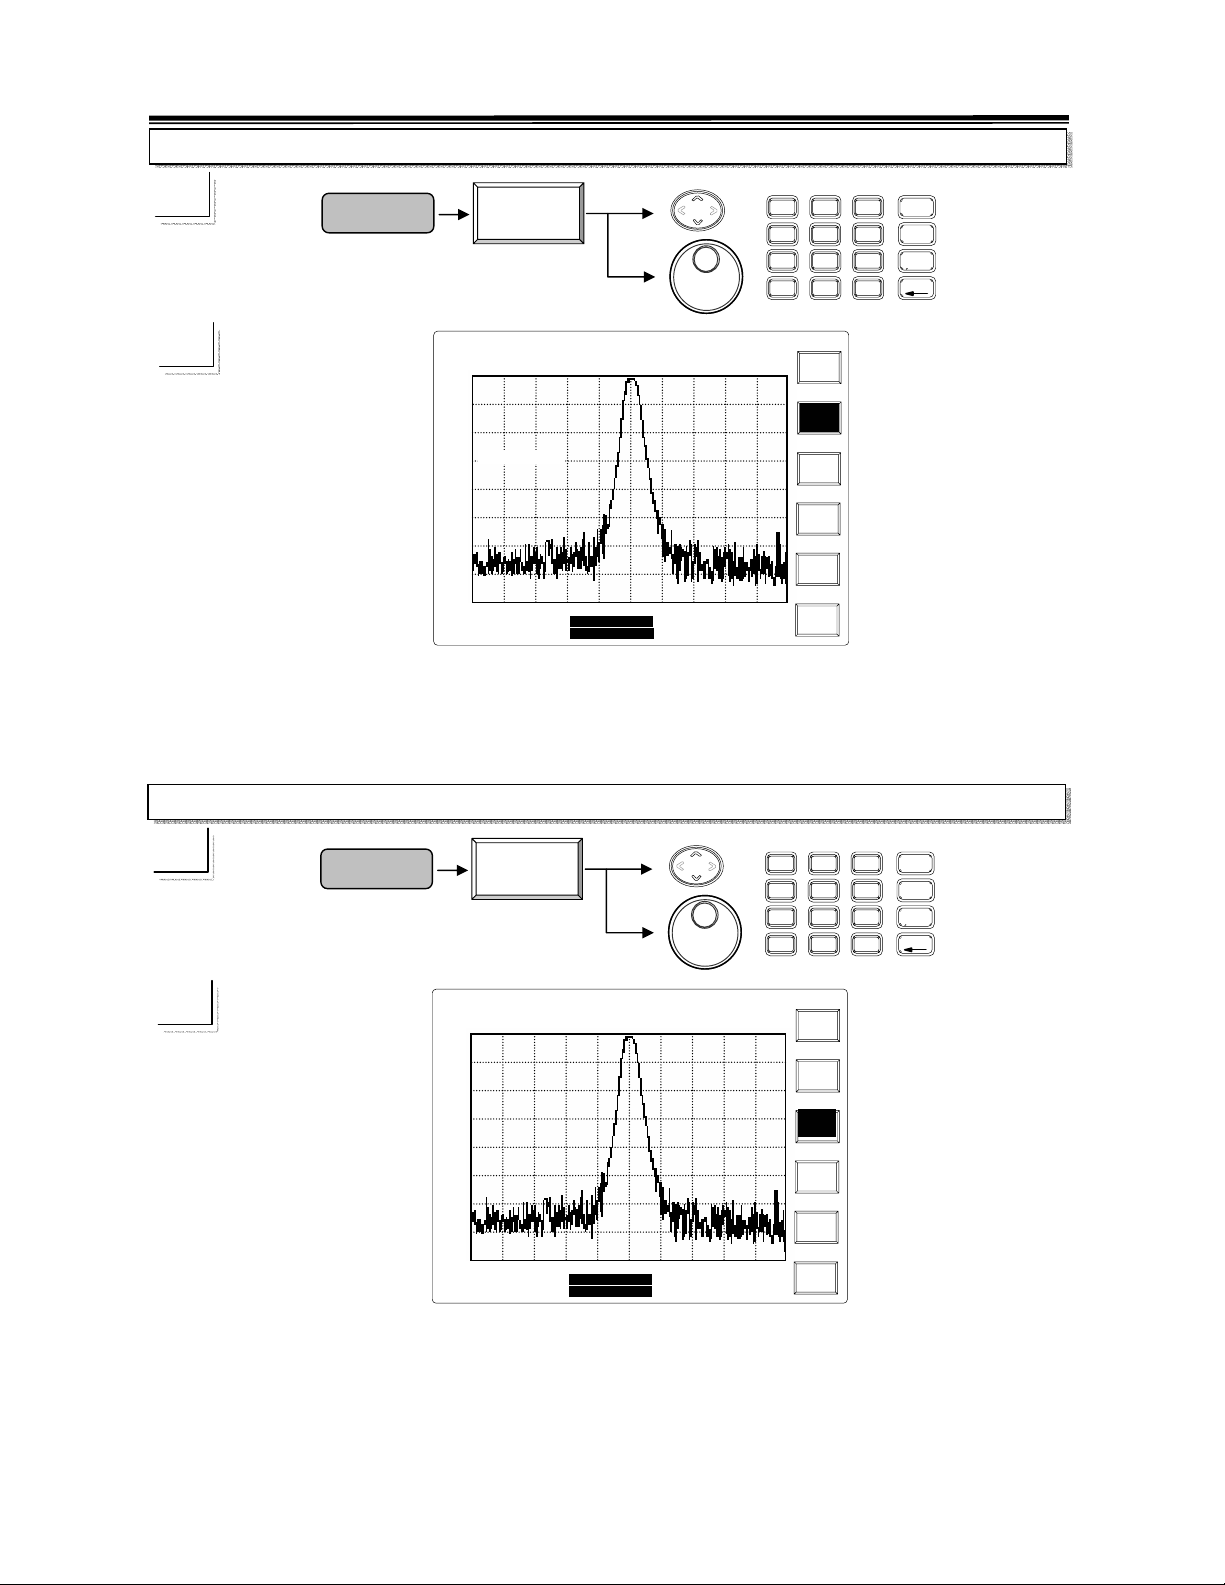
,
,
2.7GHz Spectrum Analyzer Operation Manual
VBW
☛
BW
VBW
Auto
8
7
4
5
2
1
.
0
GHz
9
dBm
MHz
6
dBmV
kHz
3
dBuV
BK SP
-
1
SAT JAN 28
2003
Ref Lvl: -30.0 dBm
-30.0
-40.0
-50.0
VBW:100 kHz
-60.0
-70.0
-80.0
-90.0
-100.0
-110.0
Start:99.5MHz
RBW:30 kHz
VBW:100 kHz
14:30:25
INT:REF
AMPL CAL
Center:100.0MHz
Span:1.0MHz
Stop:100.5MHz
Sweep:100.0ms
RBW
AUTO
VBW
Auto
SwpTm
Auto
All
Auto
Repeating
VBW Auto key can switch the VBW between Auto and Manual mode.
UP/DOWN and Scroll: Select the RBW within 10Hz to 1MHz in 1-3 sequence in Manu Mode.
Editing: The editing entry will select the closest VBW as described above.
Sweep Time
☛
BW
SwpTm
Auto
8
7
4
5
2
1
.
0
GHz
9
dBm
MHz
6
dBmV
kHz
3
dBuV
BK SP
-
1
Repeating
Ref Lvl: -30.0 dBm
-30.0
-40.0
-50.0
-60.0
-70.0
-80.0
-90.0
-100.0
-110.0
SwpTm Auto key can switch the Sweep Time between Auto and Manual mode.
SAT JAN 28
Start:99.5.MHz
RBW:30 kHz
VBW:100 kHz
2003
14:30:25
INT:REF
AMPL CAL
Center:100.0MHz
Span:1.0MHz
Stop:100.5MHz
Sweep:100.0ms
RBW
AUTO
VBW
Auto
SwpTm
Auto
All
Auto
UP/DOWN and Scroll: Change the Sweep Time to Manu Mode.
Editing: Enter the sweep time directly. The minimum is 100msec.
73
Page 76
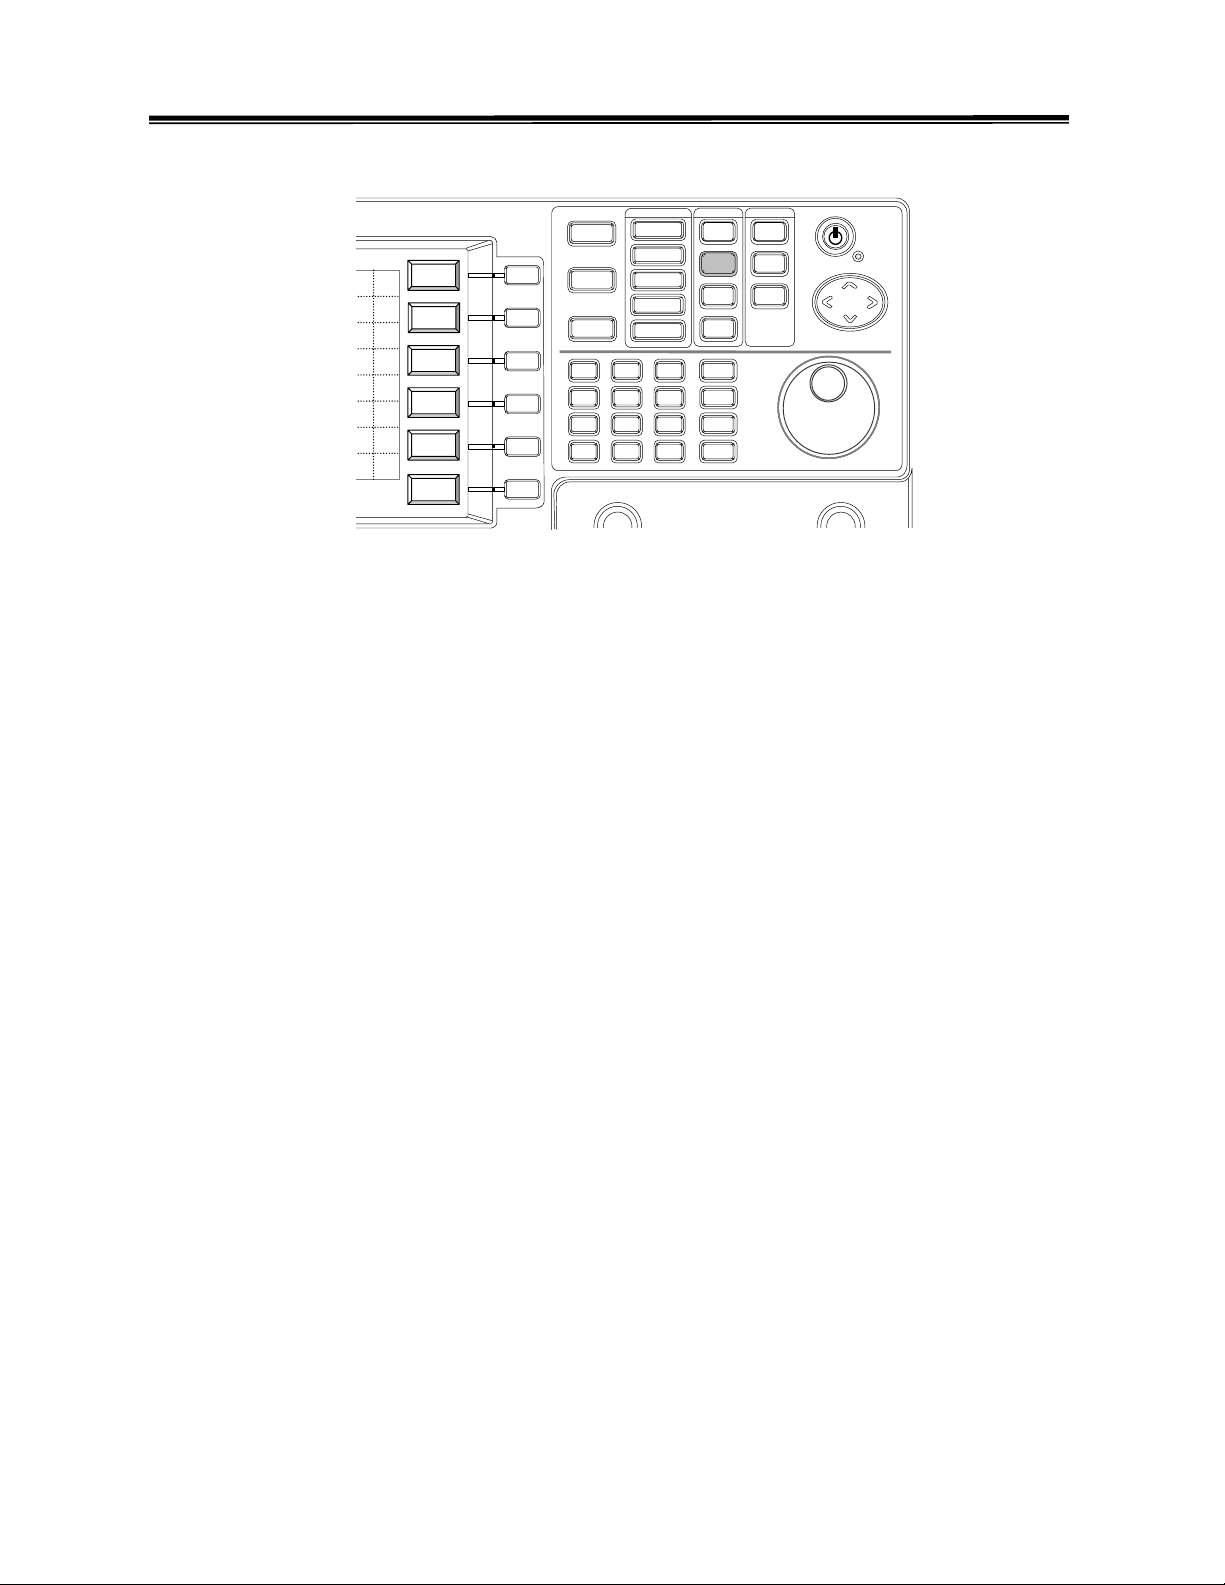
r
2.7GHz Spectrum Analyzer Operation Manual
8.3.2 Trigger
Free
Center
Run
Video
Start
Level
Exte
stop
Step
Singl
Trigger
Delay
Trigger
Freq
F1
F2
F3
F4
F5
F6
8
7
4
5
2
1
.
0
Trigger
9
6
3
-
Trigger is the feature that the measurement starts when the trigger condition is met. In other
words, even in the trigger mode, the measurement sweep will not start until the trigger
condition is match. There are two trigger modes,
trigger condition is met, the
Single mode only performs one measurement sweep while the
Single and Continuous. As long as the
Continuous mode performs the sweep continuously. Before the trigger condition is met, the
sweep will not work.
There are two sources of trigger condition,
Video Level and External trigger from rear
panel. Video Level means the level of display. The input signal has to reach the video level
to trigger the measurement sweep. The default of trigger frequency is
can be changed with
Trigger Freq setting.
Center Frequency. It
Another source of trigger is from
External Input on the rear panel. A 0 to 5V rising edge
will trigger the sweep in external trigger mode.
Trigger delay allows sweep happens later than the condition is match.
Activate
Free Run to stop trigger function.
74
Page 77
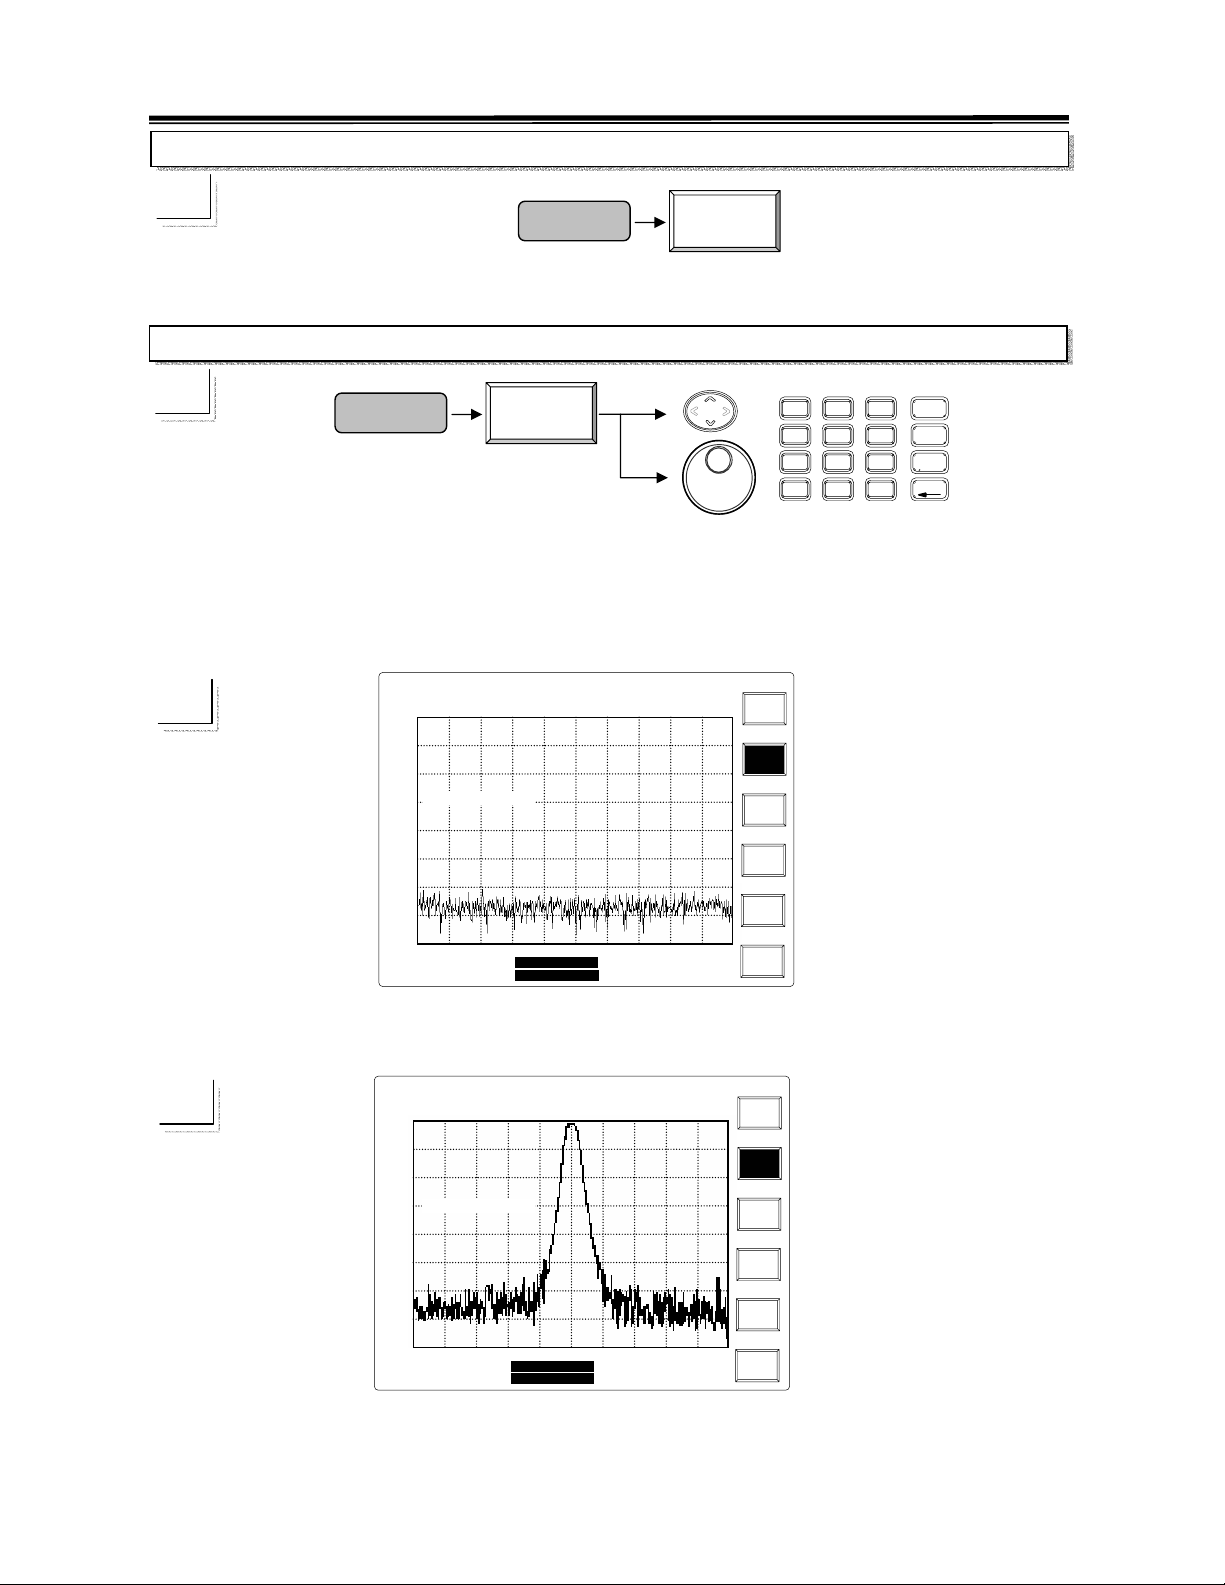
,
g
,
Trigg
Trigg
gl Trigg
Trigg
2.7GHz Spectrum Analyzer Operation Manual
Free Run
☛
Trigger
Free
Run
Free Run will stop trigger function and stay in normal sweep mode.
Video Level
☛
Trigger
Video
Level
8
7
4
5
2
1
.
0
GHz
9
dBm
MHz
6
dBmV
kHz
3
dBuV
BK SP
-
UP/DOWN and Scroll: To change the video level by 0.1dBm for every movement.
Editing: To enter the level on display as the trigger threshold.
Example: Video level is set at –40dBm. The trace freezes when the trigger condition is not met.
1
Ref Lvl: -30.0 dBm
-30.0
-40.0
-50.0
-60.0
-70.0
-80.0
-90.0
-100.0
-110.0
2003
SAT JAN 28
Video Level:-40 dBm
Start:99.5MHz
RBW:30 kHz
VBW:100 kHz
14:30:25
INT:REF
AMPL CAL
Center:100.0MHz
Span:1.0MHz
Stop:100.5MHz
Sweep:100.0ms
Free
Run
Video
Level
Exter
Sin
Delay
Freq
l
er
er
When the input signal level is over –40dBm, the sweep starts and captures the signal.
1
SAT JAN 28
Ref
Lvl: -30.0 dBm
-30.0
-40.0
-50.0
Video Level:-40 dBm
-60.0
-70.0
-80.0
-90.0
-100.0
-110.0
Start:99.5MHz
RBW:30 kHz
VBW:100 kHz
14:30:25
INT:REF
AMPL CAL
Center:100.0MHz
Span:1.0MHz
Stop:100.5MHz
Sweep:100.0ms
Free
Run
Video
Level
Exter
Sin
Delay
Freq
er
er
2003
75
Page 78
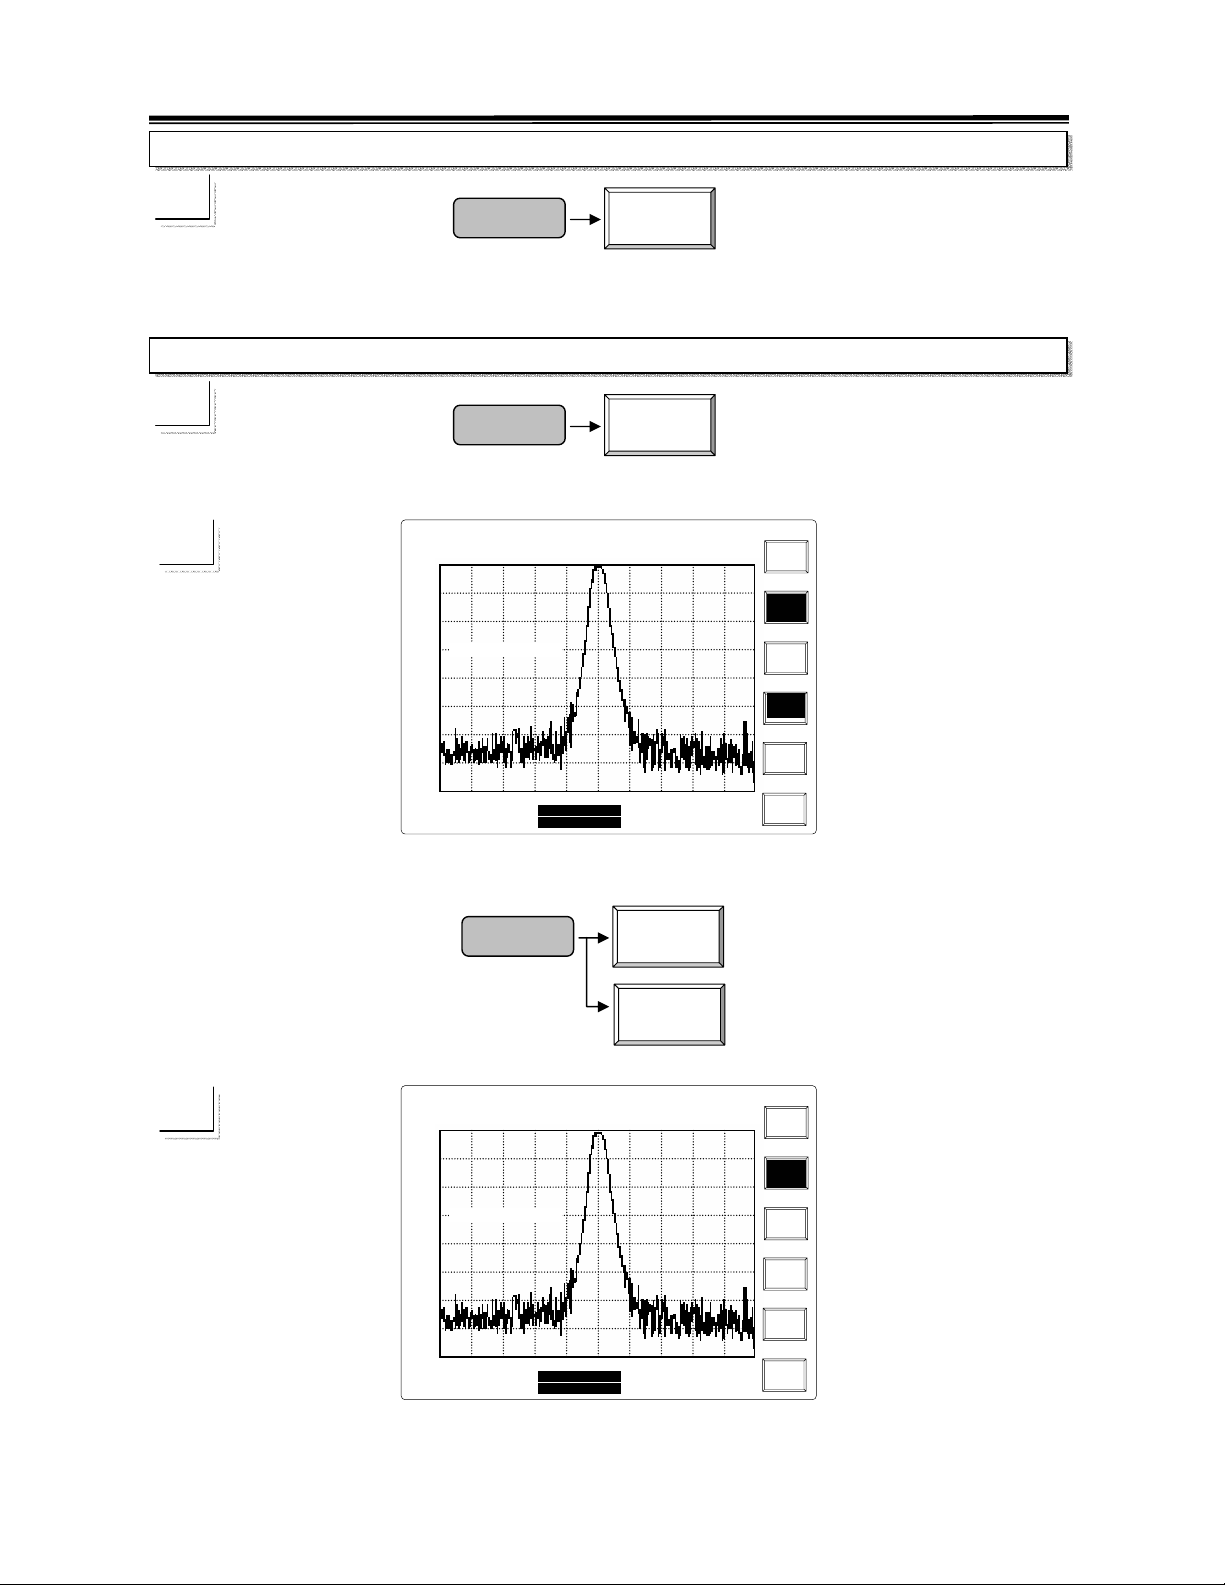
p
,
Trigg
Trigg
,
gl Trigg
Trigg
2.7GHz Spectrum Analyzer Operation Manual
External Trigger
☛
Trigger
Exter
A 0 to 5V rising edge appearance in the External Trigger Input on rear panel will start the
sweep in external trigger mode.
Single Trigger
☛
Trigger
Singl
In Single trigger mode, it will sweep once when the trigger condition is met.
SAT JAN 28
1
Ref
-30.0
-40.0
-50.0
-60.0
-70.0
-80.0
-90.0
-100.0
-110.0
2003 14:30:25
Lvl: -30.0 dBm
Video Level:-40 dBm
Start:99.5MHz
RBW:30 kHz
VBW:100 kHz
INT:REF
AMPL CAL
Center:100.0MHz
Span:1.0MHz
Stop:100.5MHz
Swee
:100.0ms
Free
Run
Video
Level
Exter
Singl
Delay
Freq
er
er
To quit Single mode by pushing the
Video Level or Exter key again.
Trigger
Exter
Singl
1
Ref
-30.0
-40.0
-50.0
-60.0
-70.0
-80.0
-90.0
-100.0
-110.0
2003
SAT JAN 28
Lvl: -30.0 dBm
Video Level:-40 dBm
Start:99.5MHz
RBW:30 kHz
VBW:100 kHz
14:30:25
INT:REF
AMPL CAL
Center:100.0MHz
Span:1.0MHz
Stop:100.5MHz
Sweep:100.0ms
Free
Run
Video
Level
Exter
Sin
Delay
Freq
er
er
76
Page 79
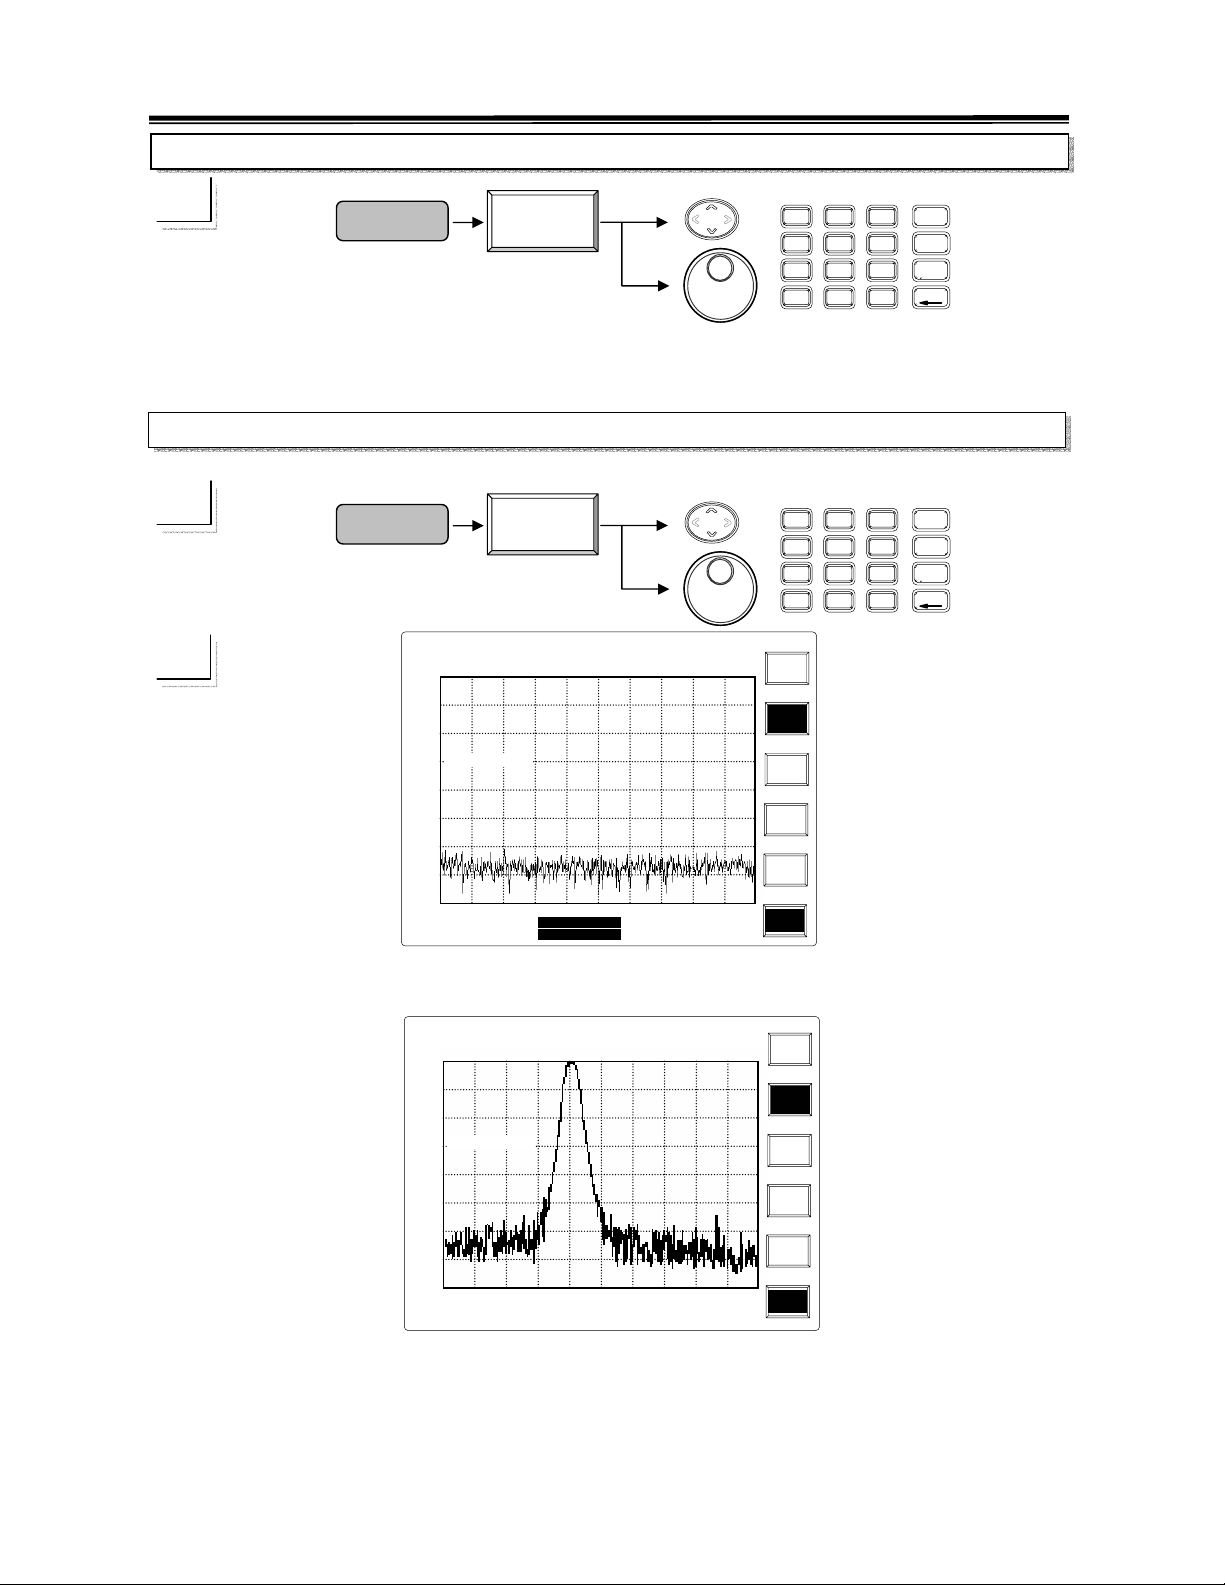
p
,
,
gl Trigg
Trigg
g
Trigg
Trigg
2.7GHz Spectrum Analyzer Operation Manual
Trigger Delay
☛
Trigger
Trigger
Delay
8
7
4
1
0
9
5
6
3
2
.
-
UP/DOWN and Scroll: To change the trigger delay by lμs for every movement.
Editing: To enter trigger delay directly.
Trigger Frequency
☛
1
Trigger
Ref Lvl: -30.0 dBm
-30.0
-40.0
-50.0
-60.0
-70.0
-80.0
-90.0
-100.0
-110.0
SAT JAN 28
Freq:100.1MHz
Start:99.5MHz
RBW:30 kHz
VBW:100 kHz
2003
Trigger
Freq
14:30:25
INT:REF
AMPL CAL
Center:100.0MHz
Span:1.0MHz
Stop:100.5MHz
Sweep:100.0ms
Free
Run
Video
Level
Exter
Sin
Delay
Freq
8
7
4
1
0
er
er
9
5
6
3
2
.
-
When a 100.1MHz signal rather than 100.0MHz appears at the input, trigger happens.
2003
SAT JAN 28
Ref
Lvl: -30.0 dBm
-30.0
-40.0
-50.0
Freq:100.1MHz
-60.0
-70.0
-80.0
-90.0
-100.0
-110.0
Start:99.5MHz
RBW:30 kHz
VBW:100 kHz
14:30:25
INT:REF
AMPL CAL
Center:100.0MHz
an:1.0MHz
S
Stop:100.5MHz
Sweep:100.0ms
Free
Run
Video
Level
Exter
Sin
Delay
Freq
l
er
er
GHz
dBm
MHz
dBmV
kHz
dBuV
BK SP
GHz
dBm
MHz
dBmV
kHz
dBuV
BK SP
77
Page 80
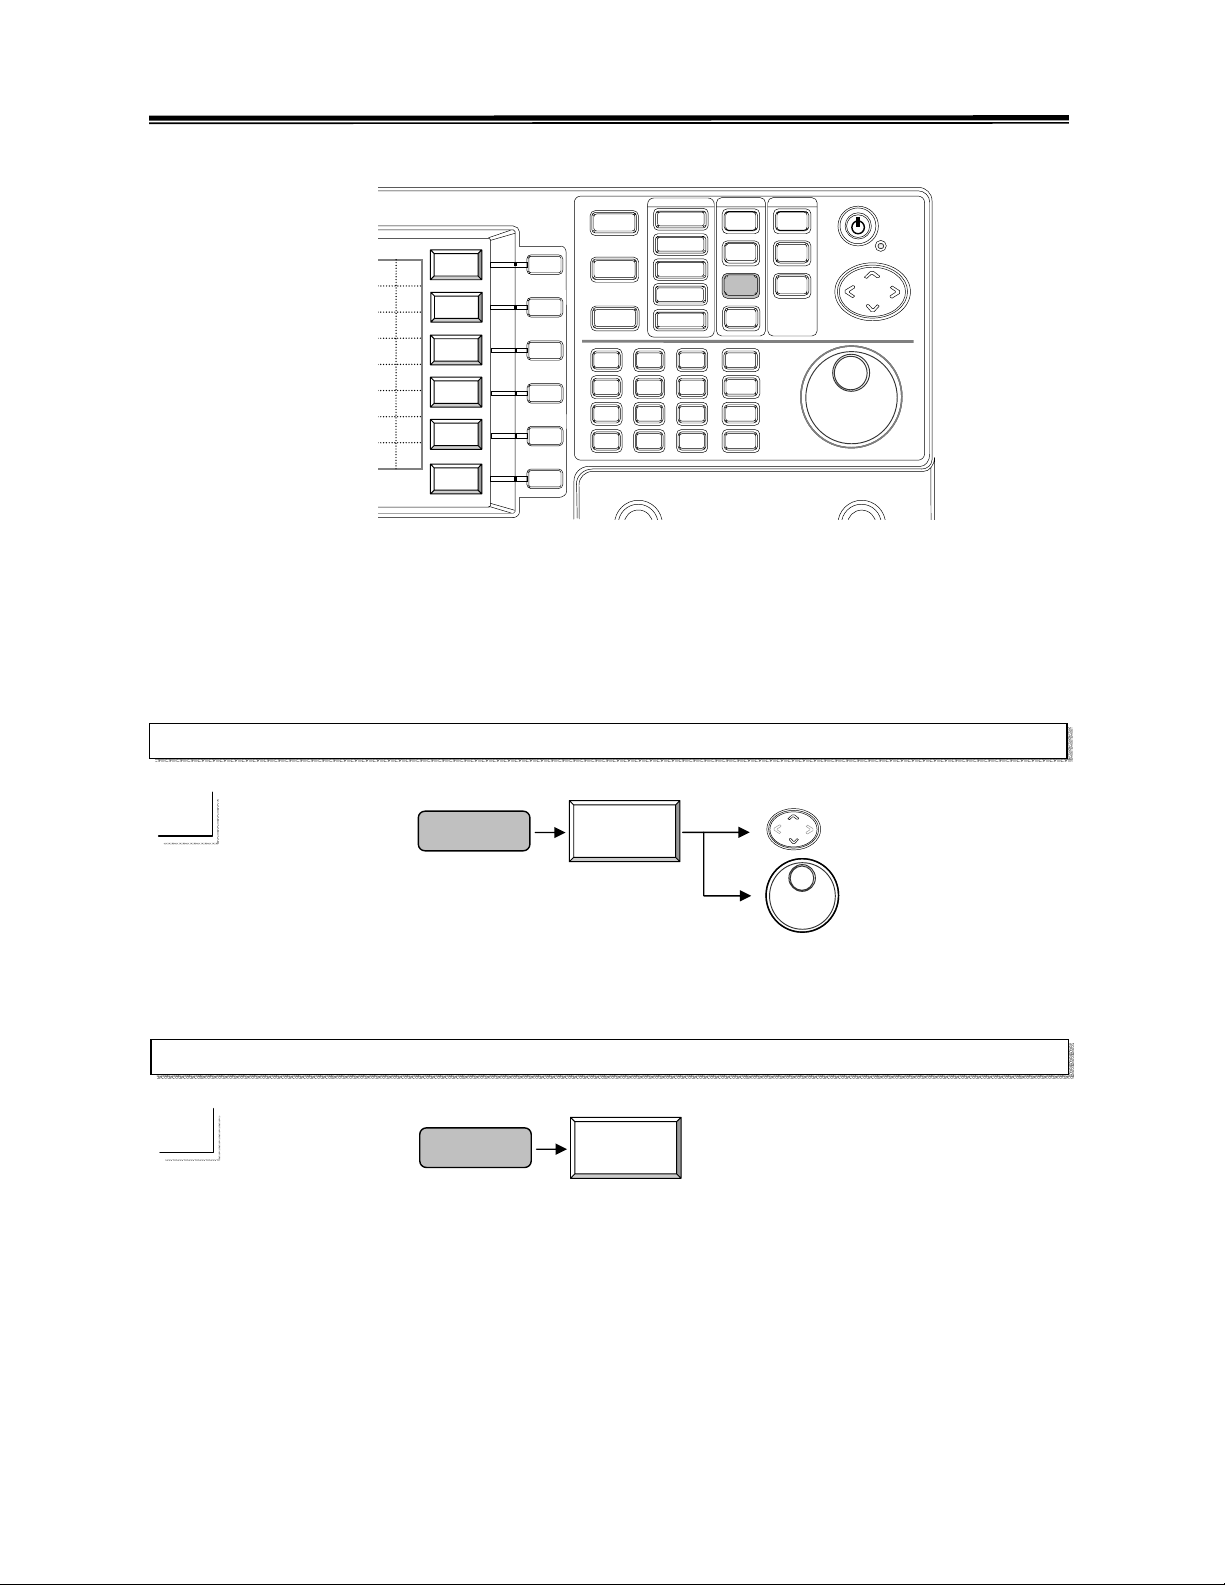
2.7GHz Spectrum Analyzer Operation Manual
8.3.3 Display Functions
LCD
Center
Cntrst
BkLight
Start
ON OFF
Invert
stop
Screen
Split
Step
ON OFF
Upper
ON OFF
Lower
ON OFF
F1
Display
F2
F3
F4
F5
F6
8
7
4
1
0
9
5
6
3
2
.
-
LCD Contract, Back light and Inverting Screen are controlled with display functions. Two
Split Windows offer separate measurement setting that is convenient to measure two signals
at the same time.
LCD contrast
☛
Display
LCD
Cntrst
UP/DOWN and Scroll: To increase or decrease the contrast to fit the best visual effect.
Back Light
☛
Display
BkLight
ON OFF
Repeating
BkLight ON/ OFF key can switch the LCD backlight ON and OFF.
78
Page 81
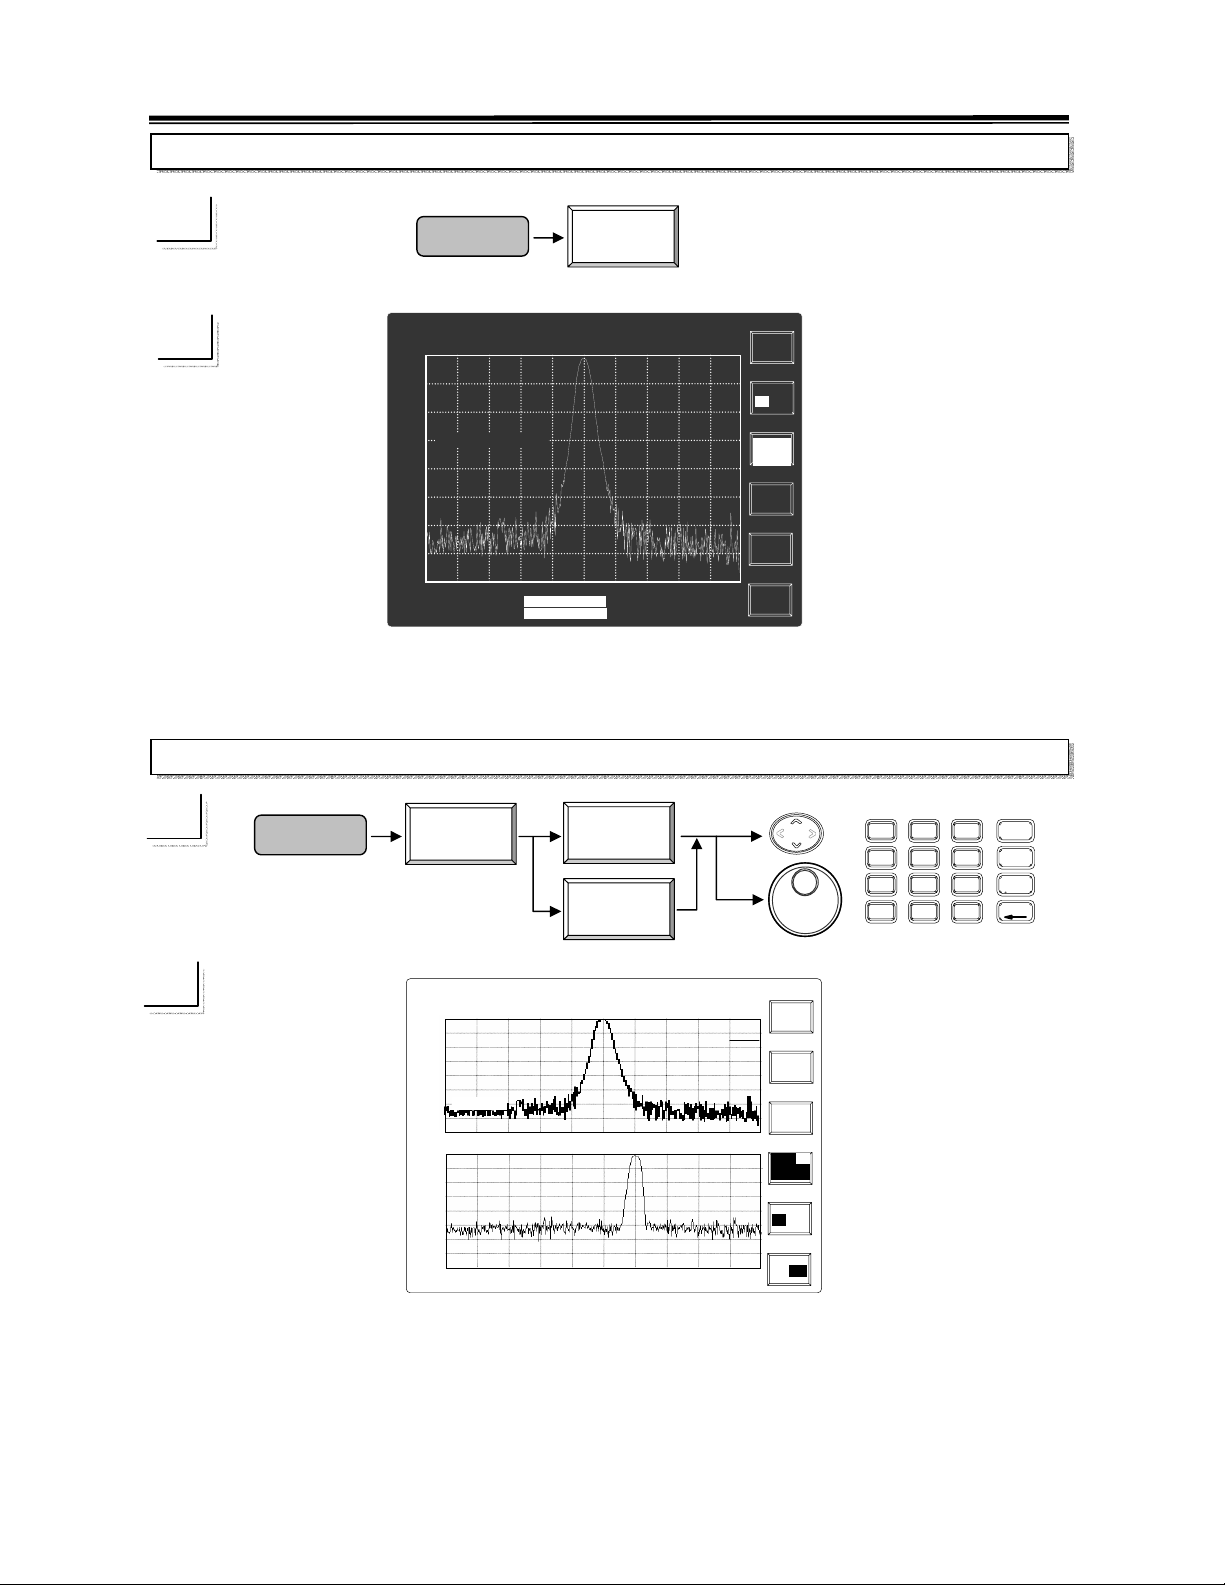
,
,
2.7GHz Spectrum Analyzer Operation Manual
Invert Screen
☛
Display
Invert
Screen
1
SAT JAN 28
Ref
Lvl: -30.0 dBm
-30.0
-40.0
-50.0
Video Level:-40 dBm
-60.0
-70.0
-80.0
-90.0
-100.0
-110.0
Start:99.5MHz
RBW:30 kHz
VBW:100 kHz
2003
14:30:25
INT:REF
AMPL CAL
Center:100.0MHz
Span:1.0M Hz
Stop:100.5MHz
Sweep:100.0ms
LCD
Cntrst
BkLight
ON OFF
Invert
Exter
Screen
Split
ON OFF
Upper
ON OFF
Lower
ON OFF
Split Window
☛
Display
Split
ON OFF
Upper
ON OFF
Upper
ON OFF
8
7
4
5
2
1
.
0
SAT JAN 28
2003
1
Ref
Lvl: -30.0 dBm
-30.0
-50.0
-70.0
-90.0
-110.0
Start:99.5MHz
VBW:100 kHz
-30.0
-50.0
-70.0
-90.0
-110.0
Start:94.0MHz
VBW:100 kHz
Level:-45
14:30:25
INT:REF
AMPL CAL
Center:100.0MHz
Center:99.0MHz
Stop:100.5MHz
Span:1.0MHz
Stop:101.0MHz
Span:10.0MHz
LCD
Cntrst
BkLight
ON OFF
Invert
Screen
Split ON
OFF
Upper
ON OFF
Lower
ON OFF
Display can be split into two windows and can be turned on and set separately. When both
windows are ON, they will toggle the measurement and present the trace at the same time.
GHz
9
dBm
MHz
6
dBmV
kHz
3
dBuV
BK SP
-
79
Page 82
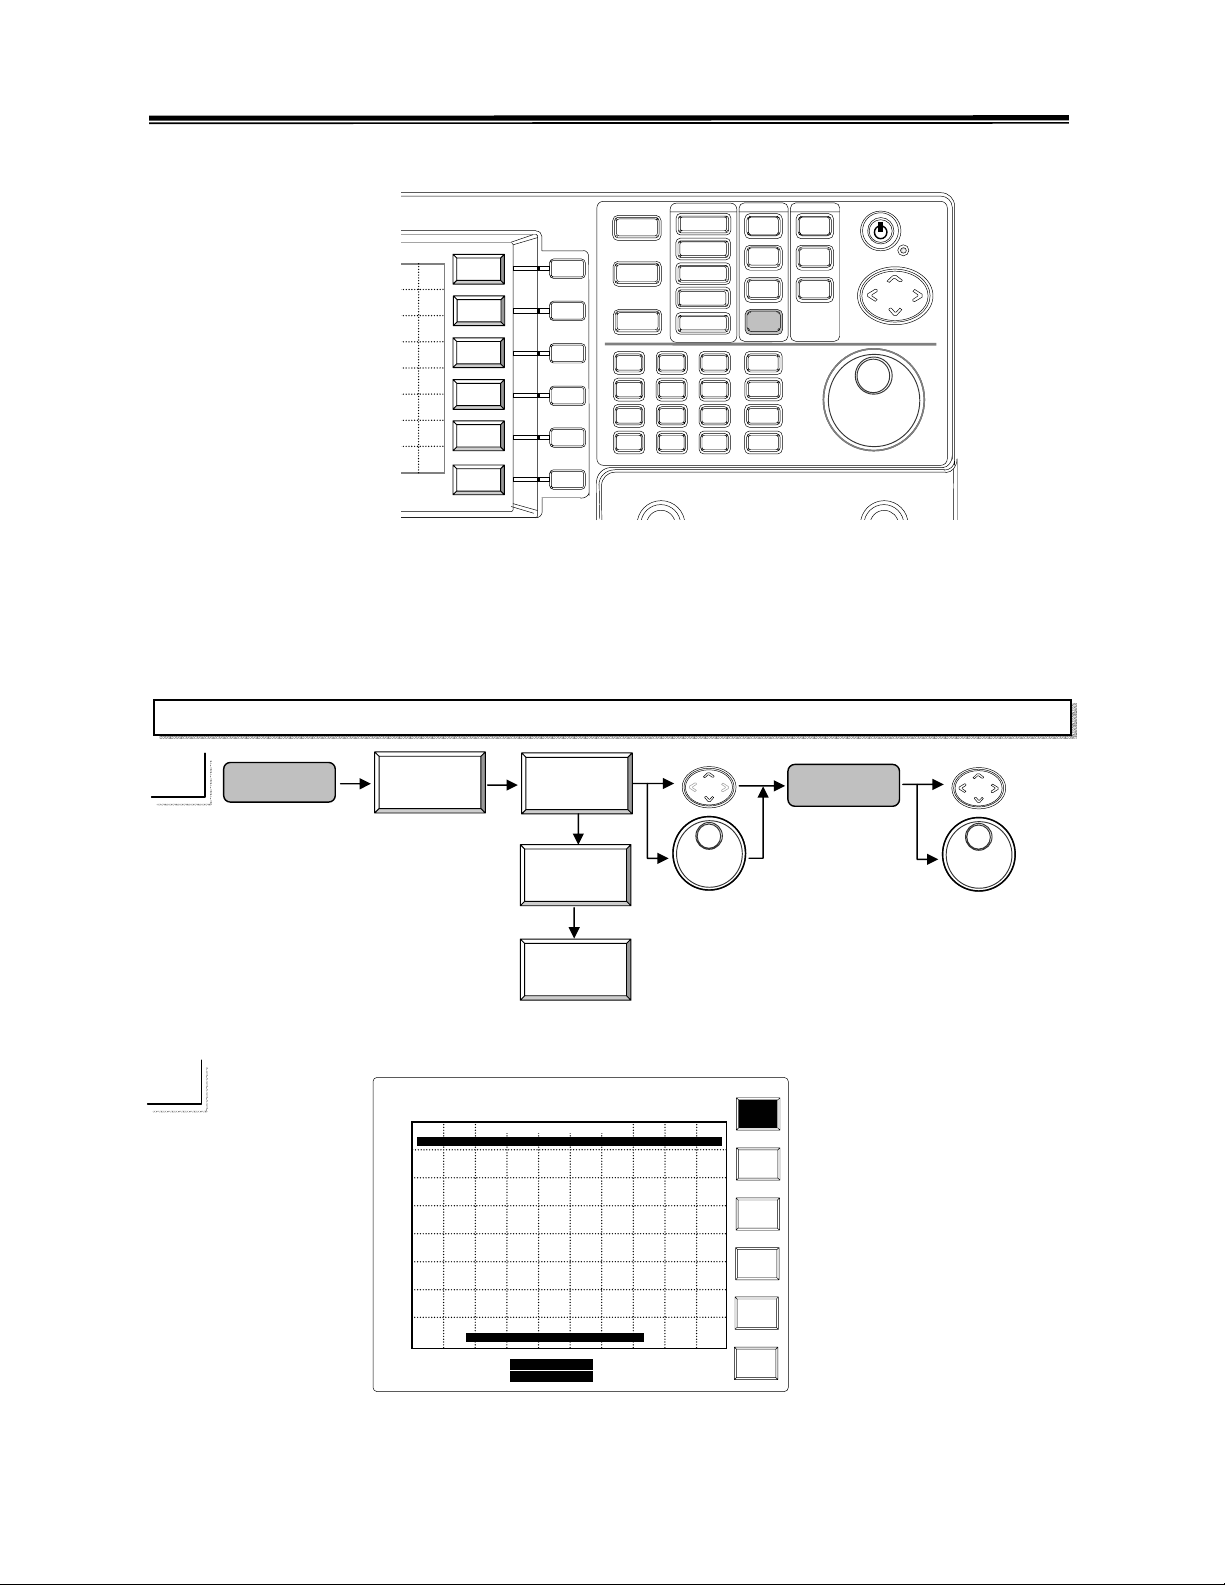
,
“
2.7GHz Spectrum Analyzer Operation Manual
8.3.4 Save/Recall
Save
Center
Trace
Recall
Start
Trace
Erase
stop
Trace
Erase
Step
All
From
Tr A
F1
F2
F3
F4
F5
8
7
4
5
2
1
.
0
Save/R
ecall
9
6
3
-
F6
There are 100 memories for saving and recalling the measured trace. When saving the trace,
the setup is also saved together. When the trace is recalled, the system will check if the setup
of recalled trace is same as current setup. If they are different, there will be prompted
message on the display to ask the user if the setup need to be changed.
Save trace
☛
Save
/Recall
Save
Trace
From
A
From
B
From
Live
Trace selection
Memory Location
selection
Enter
End
Trace”
Save
Edit filename
<,>: Select the
alphabet location.
∧,∨
: Select the
alphabet ,A~Z
1
SAT JAN 28
2003
14:30:25
Ref
Lvl: -30.0 dBm
-30.0
Index Date Time Name
81 SAT JAN 19 2003 11:00:09 BPFJOHN
-40.0
82 Empty
83 Empty
84 Empty
-50.0
85 Empty
86 Empty
87 Empty
-60.0
88 Empty
89 Empty
90 Empty
-70.0
91 Empty
92 Empty
93 Empty
-80.0
94 Empty
95 Empty
96 Empty
-90.0
97 Empty
98 Empty
99 Empty
-100.0
100 Empty
Press <F5> key to select Save from Location ------------------ >
Press <Enter> key to Save Trace to Memory
-110.0
Start:99.5MHz
RBW:30 kHz
VBW:100 kHz
INT:REF
AMPL CAL
Stored Trace Memory
Center:100.0MHz
Span:1.0MHz
Stop:100.5MHz
Sweep:100.0ms
Save
Trace
Recall
Trace
Erase
Trace
Erase
All
From
A
80
Page 83
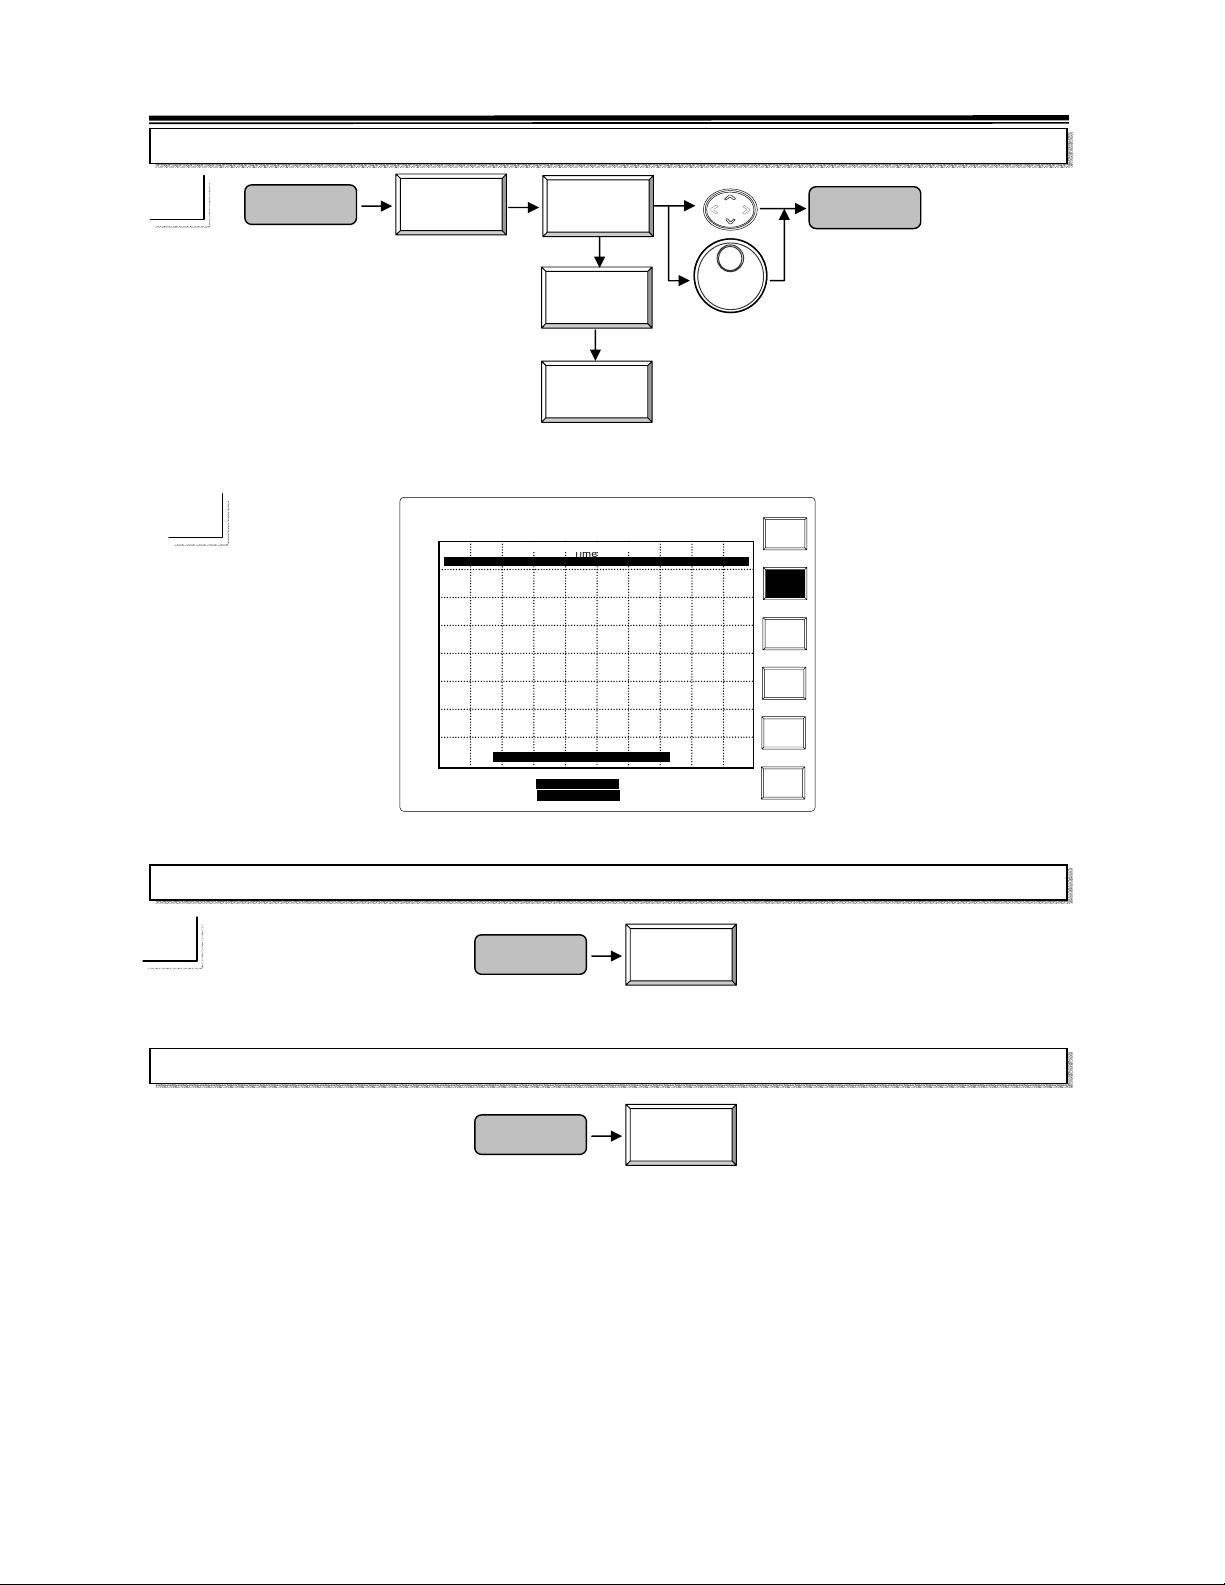
,
T
“
2.7GHz Spectrum Analyzer Operation Manual
Recall trace
☛
Save
/Recall
Recall
Trace
1
SAT JAN 28
Ref
Lvl: -30.0 dBm
-30.0
Index Date
81 SAT JAN 19 2003 11:00:09 BPFJOHN
-40.0
101 Empty
102 Empty
103 Empty
-50.0
104 Empty
105 Empty
106 Empty
-60.0
107 Empty
108 Empty
109 Empty
-70.0
110 Empty
111 Empty
112 Empty
-80.0
113 Empty
114 Empty
115 Empty
-90.0
116 Empty
117 Empty
118 Empty
-100.0
119 Empty
Press <F5> key to select Save from Location ------------------ >
Press <Enter> key to Save Trace to Memory
-110.0
Start:99.5MHz
RBW:30 kHz
VBW:100 kHz
Erase Trace
☛
Erase All
Trace selection
2003
14:30:25
INT:REF
AMPL CAL
Stored Trace Memory
Center:100.0MHz
Span:1.0MHz
Save
/Recall
Save
/Recall
To
A
To
B
Memory Location
To
Setup
ime Name
Stop:100.5MHz
Sweep:100.0ms
Erase
Trace
Erase
selection
All
Save
Trace
Recall
Trace
Erase
Trace
Erase
All
From
A
End
Trace”
Enter
Recall
81
Page 84
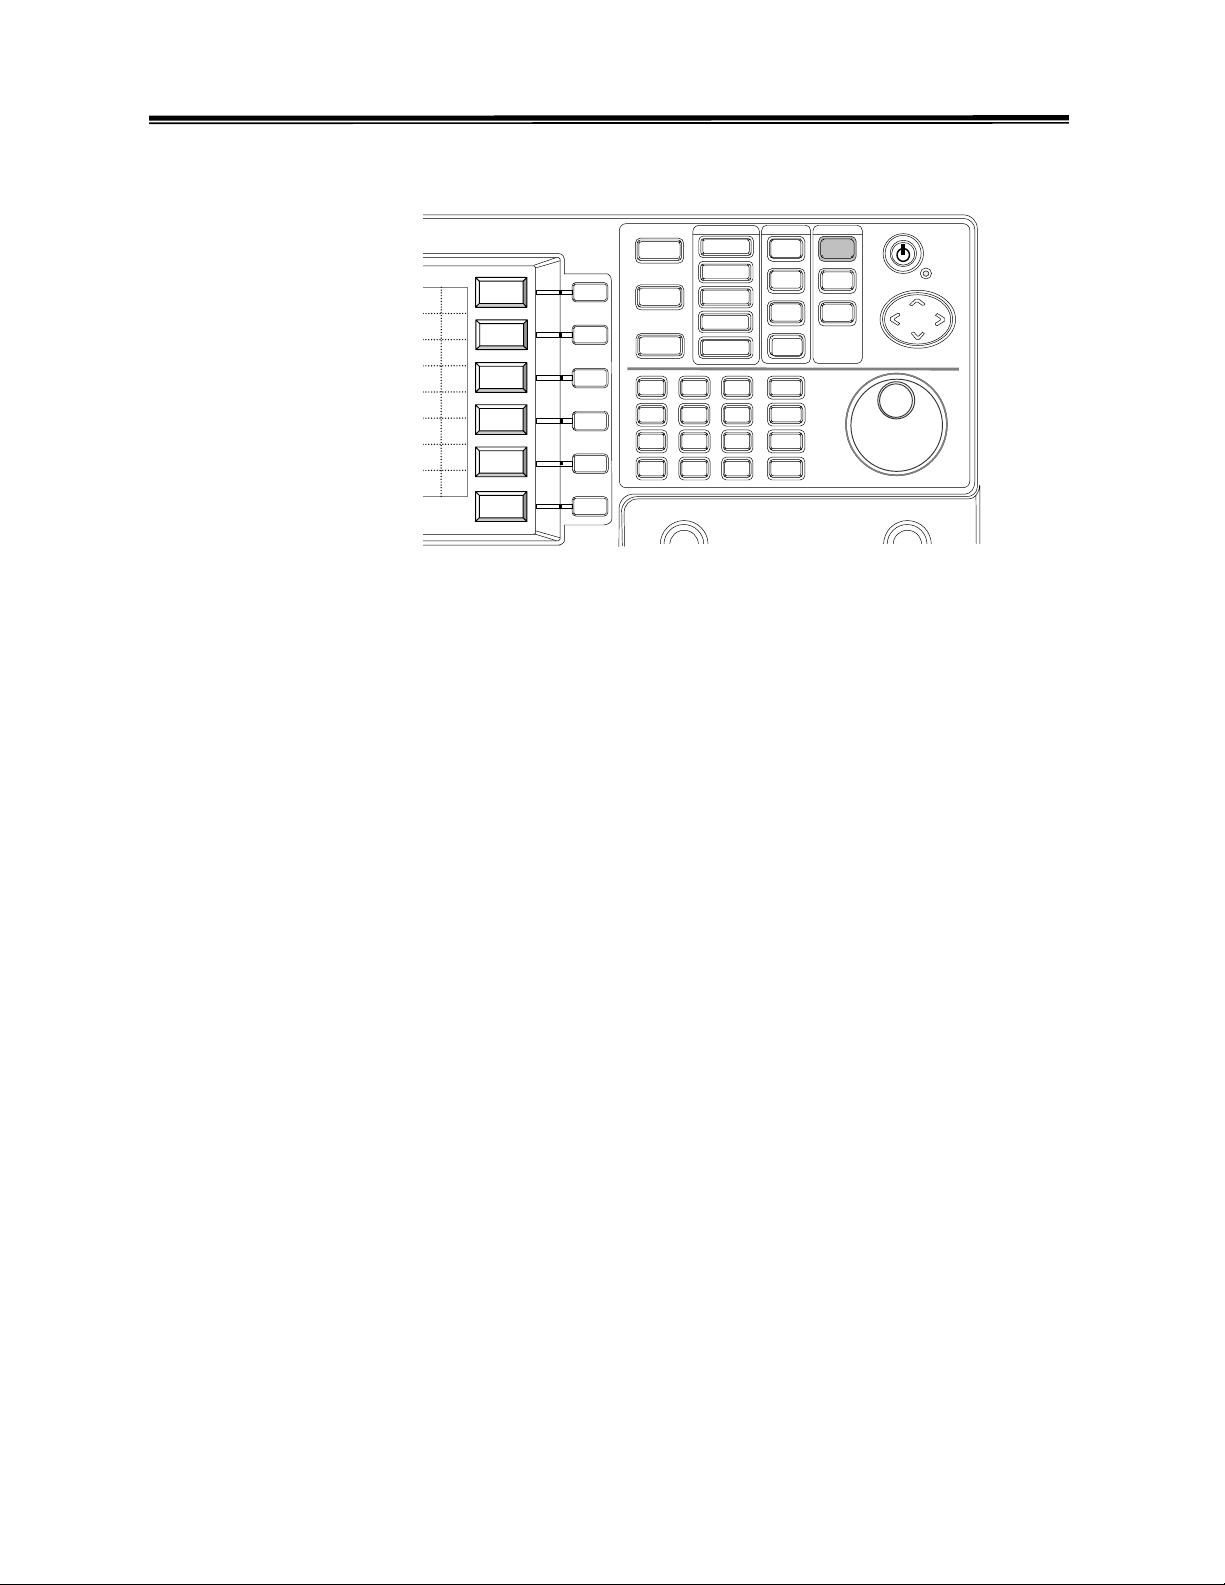
p
2.7GHz Spectrum Analyzer Operation Manual
8.4 State Functions
8.4.1 Calibration
Self
Center
Cal
RBW
Start
Cal
Freq
stop
Res
IFGine
Step
Fine
LO1
Gain
TG
Cal
F1
F2
F3
F4
F5
F6
8
7
4
1
0
9
5
6
3
2
.
-
Calibrate
The Calibration function features the final calibration of manufacturing or tuning from the
front panel.
It is intentionally not allowed user to access. Refer to service manual for
service demand.
82
Page 85
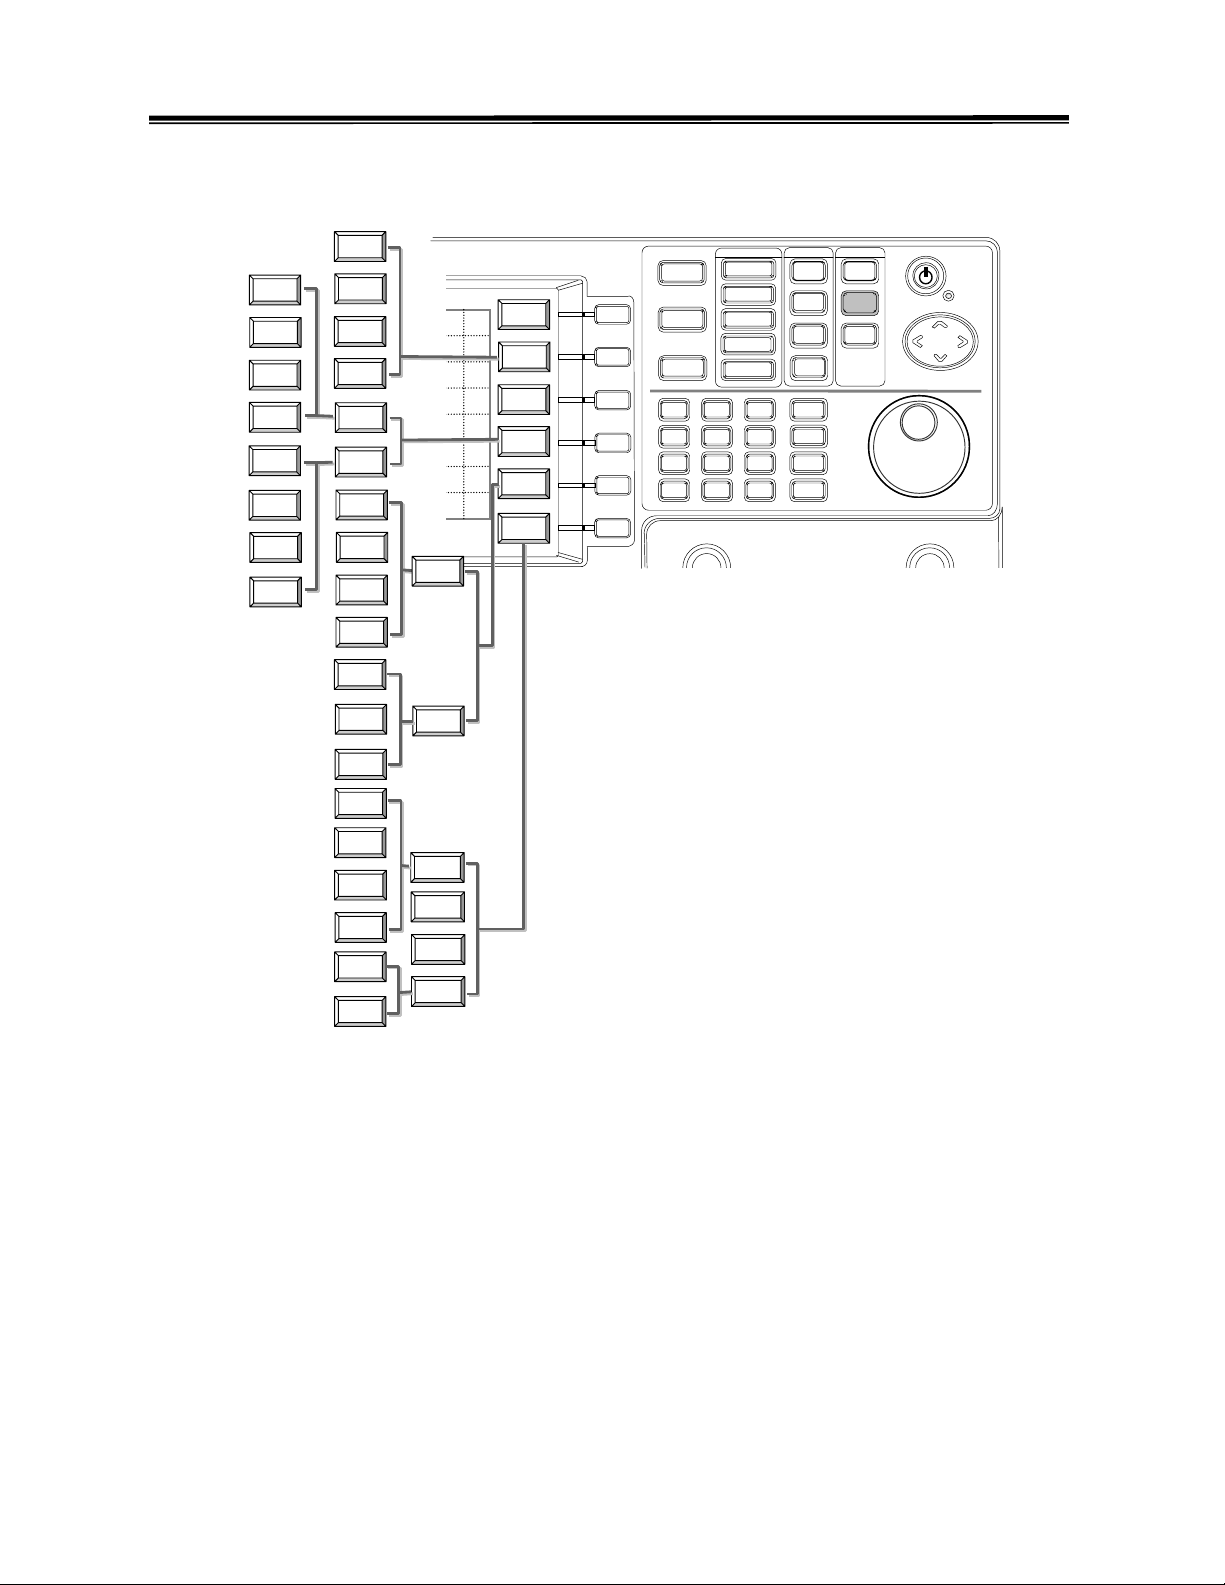
2.7GHz Spectrum Analyzer Operation Manual
8.4.2 System
Baud
LEDLO1
Center
ON OFF
LO1
Start
F
LO1
stop
N
LO1
Step
R
LEDREF
ON OFF
REF
F
REF
N
REF
R
Center
57600
HS
Start
None
Stop
stop
1
Data
Step
8
LO1
REF
Center
Year
Month
Start
stop
Day
Day of
Step
Week
Hour
Date
GPIB
Center
2
Serial
Start
Port
CalSig
stop
ON Off
RF
Step
Diagno
System
Clock
More
F1
F2
F3
F4
F5
F6
8
7
4
1
0
9
5
6
3
2
.
-
System
Minute
Second
GPIB
Pass
Flash
Start
Pass
NVRAM
stop
Pass
RTC
Step
Pass
RBW
Option
Time
Self
Test
System
Start
Preset
System
stop
Config
Mainte-
Step
nance
System functions include interface, calibration signal, simple diagnosis information, clock
and calendar set and information of system configuration.
GPIB is to define the address from 1 to 30. Serial Port is to tell the configuration of RS232.
GPIB is an option and RS232 is standard interface.
calibration signal which is a –30 dBm, 100MHz clock signal.
information of
to investigate.
LO1 and REFerence signal. With the information, the basic diagnosis is easy
System Clock is used to set the calendar and clock.
Calsig function is to turn on the internal
RF Diagno function offers the
Self Test provides the self test of digital system. Preset will reset the unit and go back to the
default parameters.
System Config will tell the system information like version number,
serial number,…, and so on.
Maintenance is to set the option configuration for manufacturer. It is intentionally not
allowed user to access. Refer to service manual for service demand.
83
Page 86
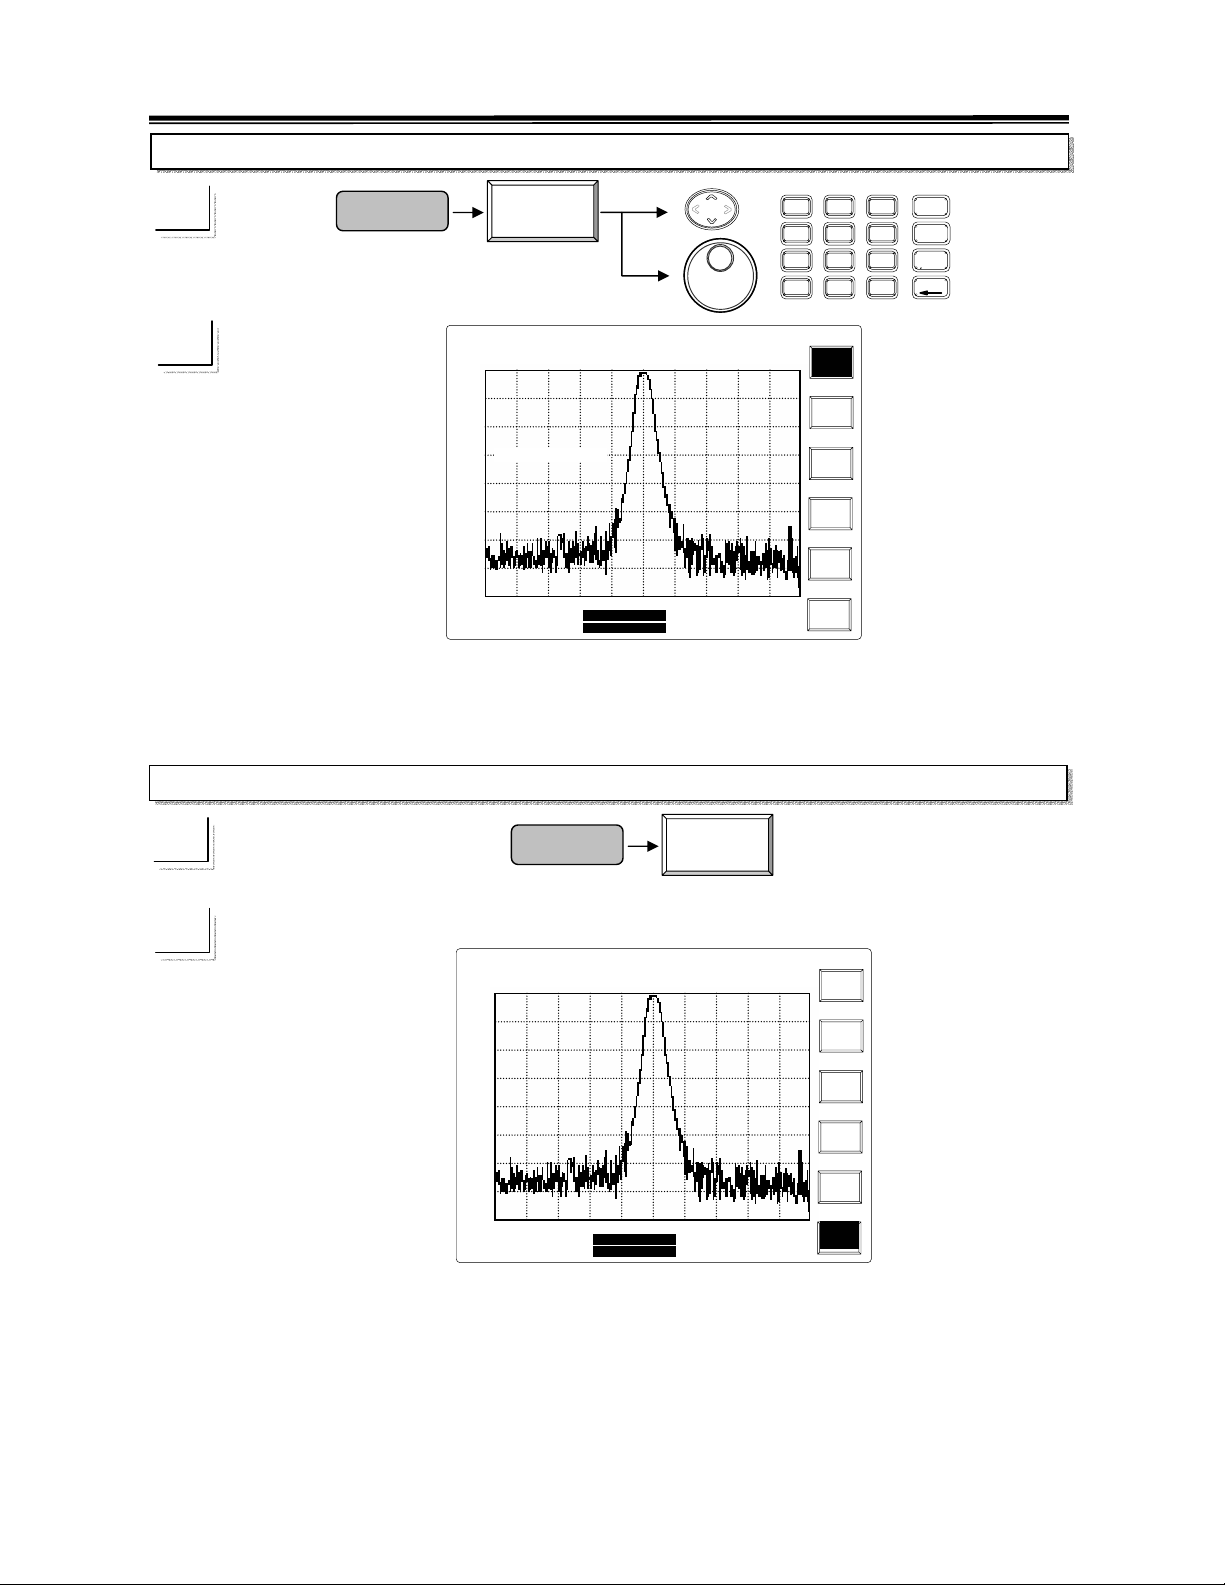
ON O
p
,
,
2.7GHz Spectrum Analyzer Operation Manual
GPIB
☛
System
GPIB
2
8
7
4
5
2
1
.
0
1
SAT JAN 28
Ref
Lvl: -30.0 dBm
-30.0
-40.0
-50.0
GPIB:2
-60.0
-70.0
-80.0
-90.0
-100.0
-110.0
Start:99.5MHz
RBW:30 kHz
VBW:100 kHz
2003
14:30:25
INT:REF
AMPL CAL
Center:100.0MHz
Span:1.0M Hz
Stop:100.5MHz
Swee
:100.0ms
GPIB
2
Serial
Port
CalSig
RF
Diagno
System
Clock
More
FF
UP/ DOWN and Scroll: To increase or decrease the GPIB address of this unit.
Editing: Enter the number and end up with Enter key to specify the GPIB address.
Serial Port
☛
System
Serial
Port
1
Ref
-30.0
-40.0
-50.0
-60.0
-70.0
-80.0
-90.0
-100.0
-110.0
2003
SAT JAN 28
Lvl: -30.0 dBm
Start:99.5MHz
RBW:30 kHz
VBW:100 kHz
14:30:25
INT:REF
AMPL CAL
Center:100.0MHz
Span:1.0M Hz
Stop:100.5MHz
Sweep:100.0ms
Baud
57600
HS
None
Stop
1
Data
8
Return
Serial Port will tell RS232 parameters.
GHz
9
dBm
MHz
6
dBmV
kHz
3
dBuV
BK SP
-
84
Page 87
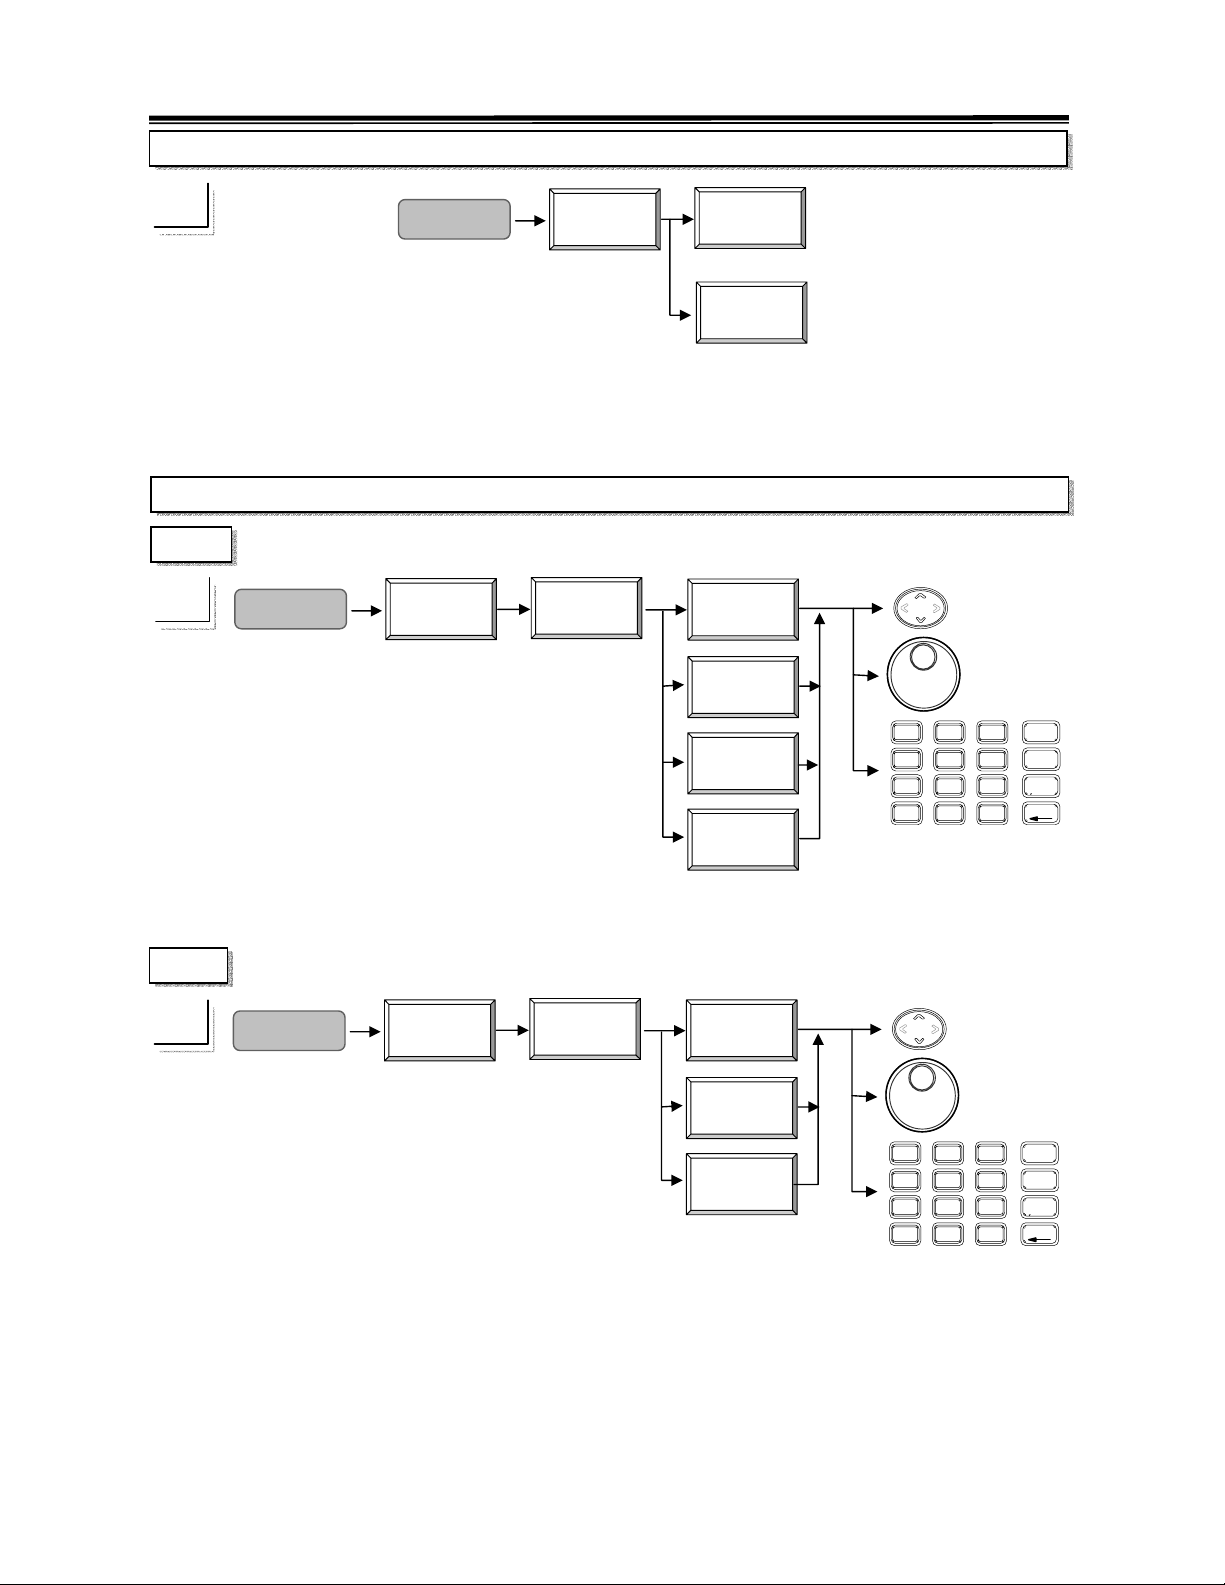
2.7GHz Spectrum Analyzer Operation Manual
RF Diagnosis
☛
System
RF
Diagno
The
RF Diagno will tell the LED status of LO1 and reference signal, F Word, N Word and
F Word. The LED has to be set ON in normal operation.
System Clock
Date
☛
System
System
Clock
Date
First select
Year, Month, Day, Day of Week and followed with UP/DOWN, Scroll or
Editing keys to specify the current date.
Time
+-
☛
System
System
Clock
Time
First select
Hour, Minute, Second and followed with UP/DOWN, Scroll or Editing keys to
specify the current date. The Hour here is in 24 hours form.
LO1
Year
Month
Day
Day of
Hour
Minute
Second
8
7
4
5
2
1
.
0
8
7
4
5
2
1
.
0
GHz
9
dBm
MHz
6
dBmV
kHz
3
dBuV
BK SP
-
GHz
9
dBm
MHz
6
dBmV
kHz
3
dBuV
BK SP
-
85
Page 88
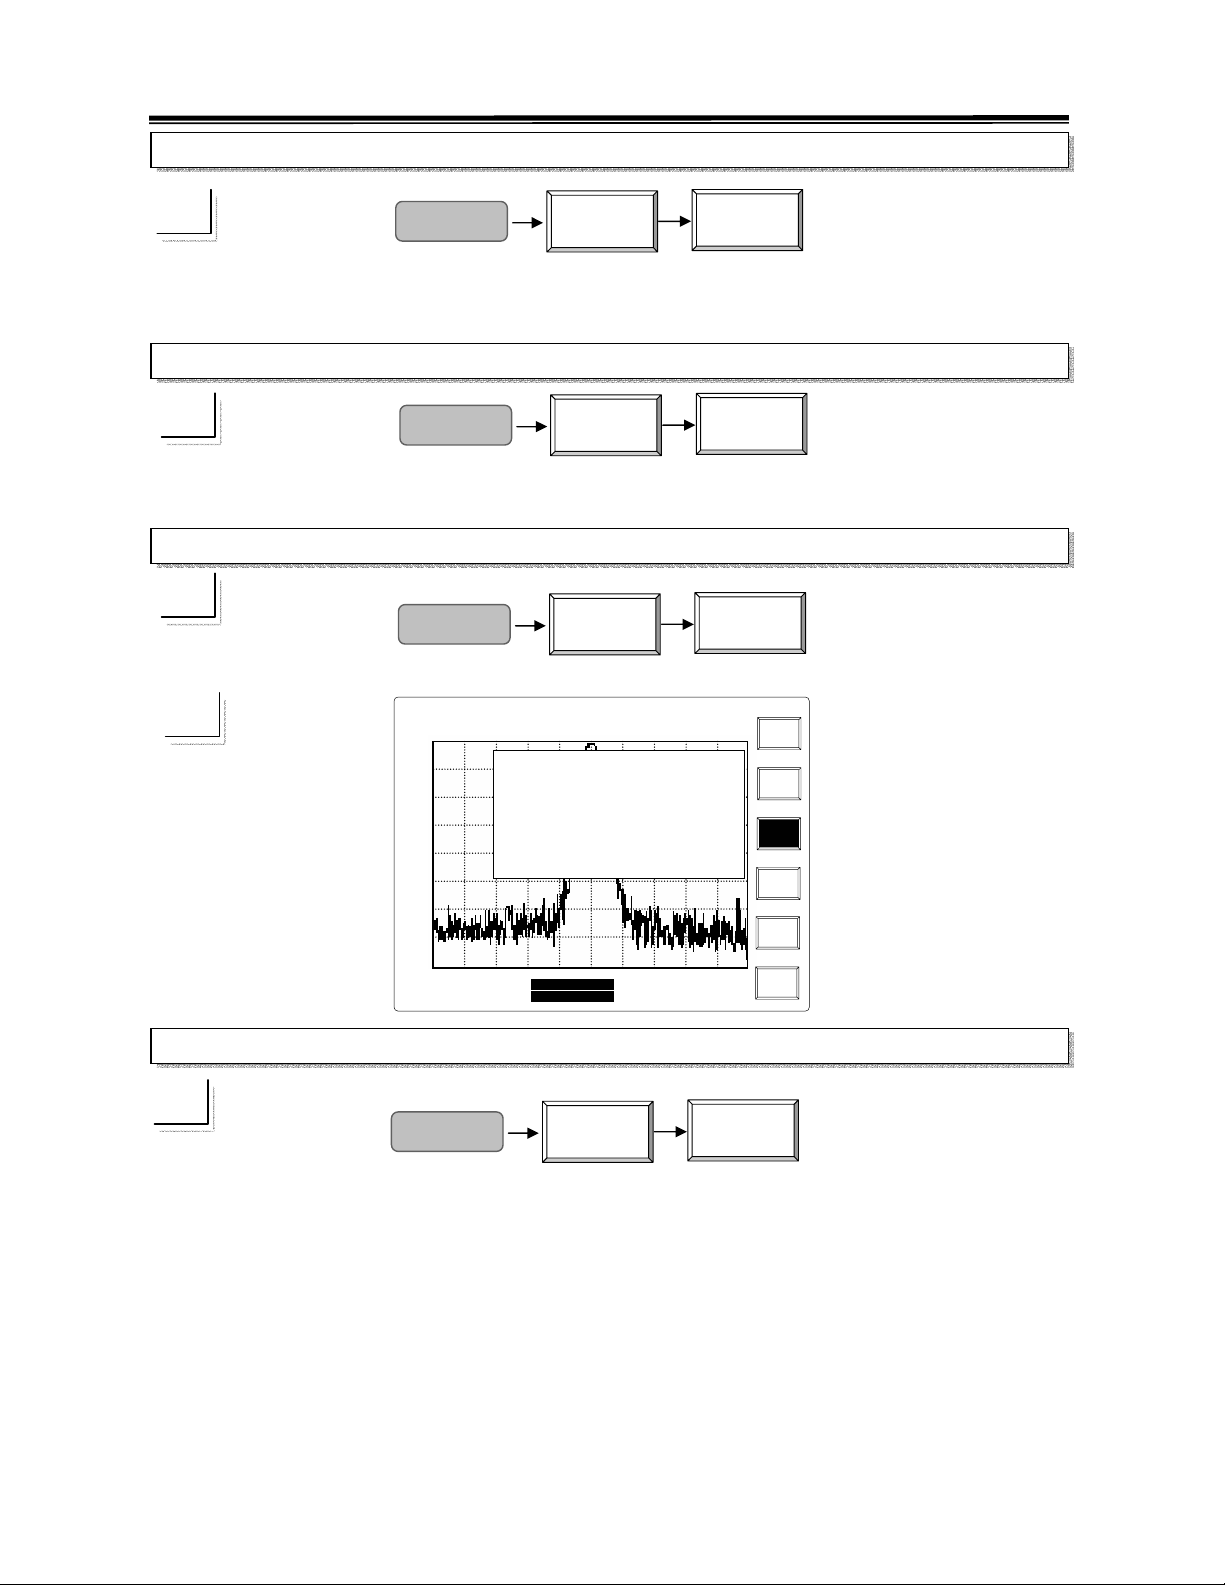
g
,
g
2.7GHz Spectrum Analyzer Operation Manual
Self Test
System
More
Self
Self Test will tell the test results of GPIB, Flash memory, NVRAM and RTC (Real Time
Clock).
System Preset
System
More
System
Preset
Preset will reset the unit and go back to the default parameters rather than the last one.
System Configuration
System
More
System
Confi
1
Ref
-30.0
-40.0
-50.0
-60.0
-70.0
-80.0
-90.0
-100.0
-110.0
2003
SAT JAN 28
Lvl: -30.0 dBm
Start:99.5MHz
RBW:30 kHz
VBW:100 kHz
14:30:25
INT:REF
AMPL CAL
: <P4011>
: 01.00
: 03/15/03
Firmware Version
: 2.0
: TG
LO Lock Stat us
: LO1 LOCKED
LO3 LOCKED
Reference Si
: INTERNAL, STD
Reference Status
: LOCKED
System Configuration
Serial Number
Software Version
Release Date
Option
nal
<Press any key to continue>
Center:100.0MHz
Span:1.0MHz
Stop:100.5MHz
Sweep:100.0ms
Self
Test
System
Preset
System
Config
Mainte-
nance
Return
Maintenance
System
More
Mainte-
nance
Maintenance is to set the option configuration for manufacturer. It is intentionally not
allowed user to access. Refer to service manual for service demand.
86
Page 89
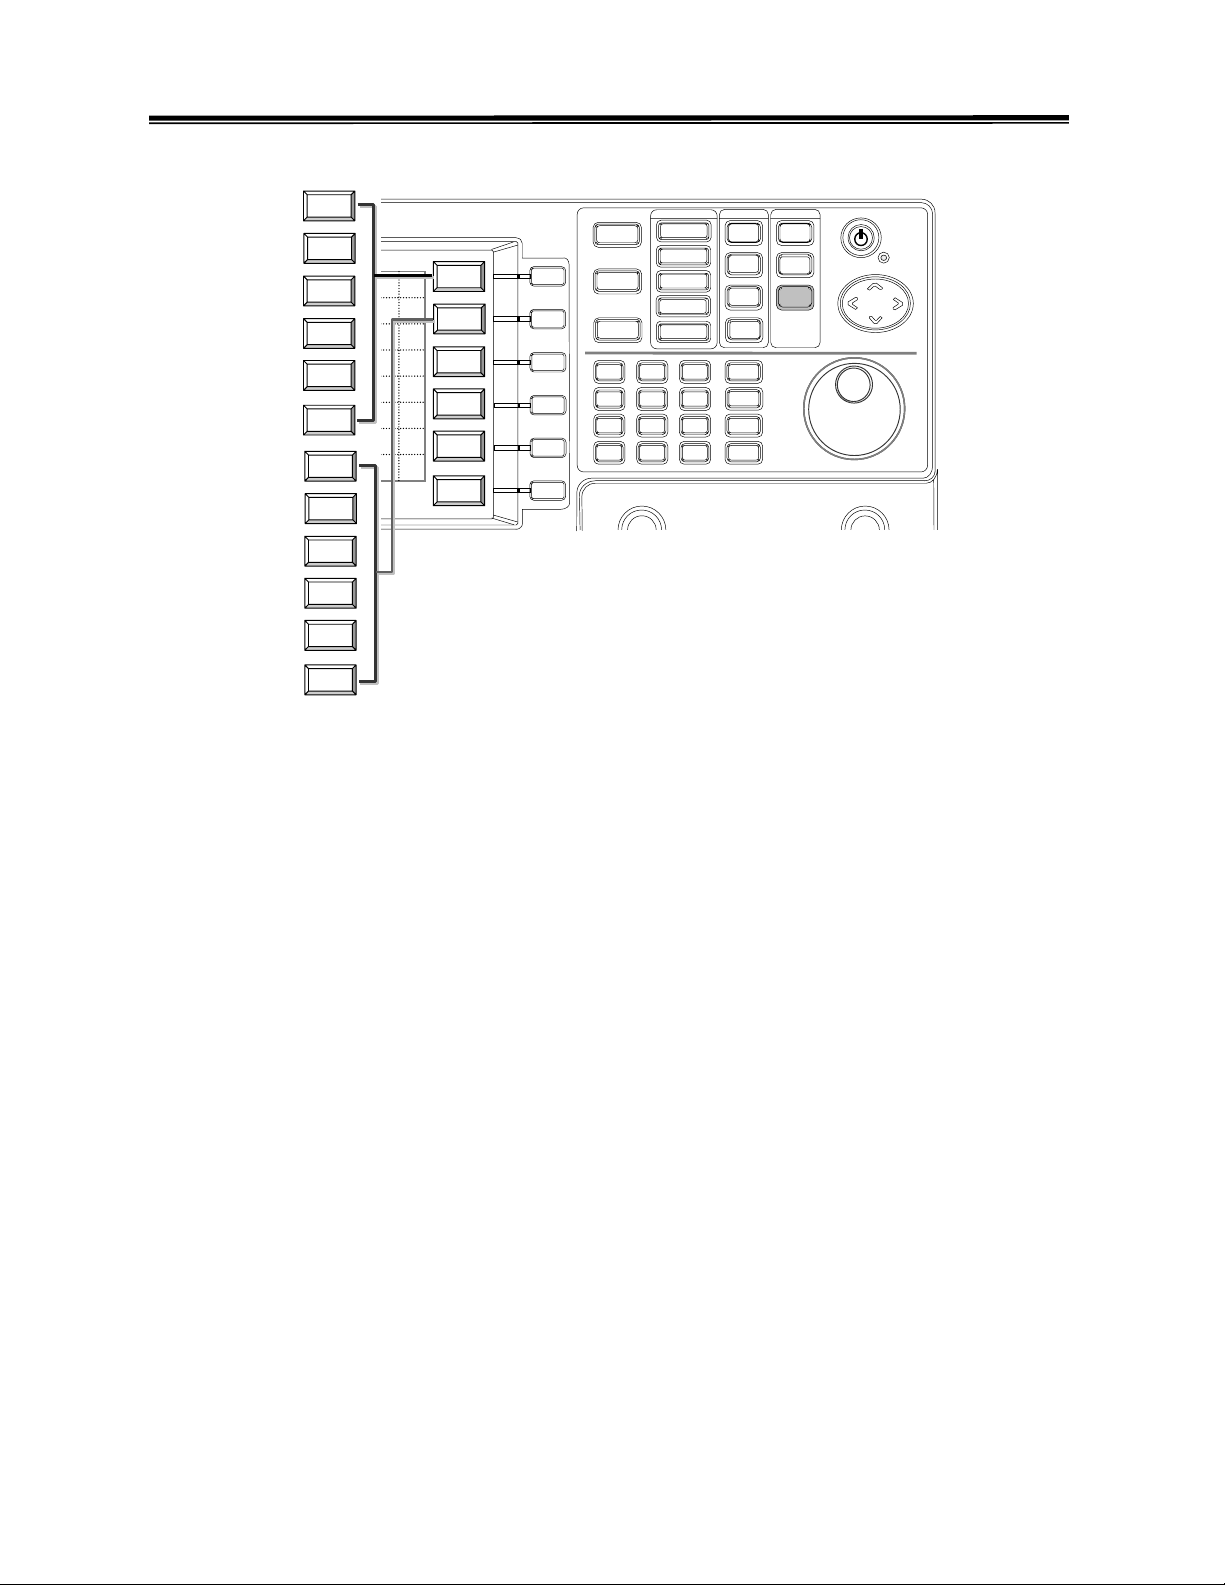
q
V
2.7GHz Spectrum Analyzer Operation Manual
8.4.3 Option
TG
Center
ON OFF
TG Level
Start
Normal
stop
ON Off
Step
Offset
Ref
Value
Return
FM OFF
Center
WB NB
AM
Start
ON OFF
stop
olume
Step
Tone
Center
TG
Start
Demod
ExtRef
stop
Fre
Step
Battery
F1
Option
F2
F3
F4
F5
F6
8
7
4
1
0
9
5
6
3
2
.
-
Squelch
FM Det
AC DC
Option function is to control the function of TG, Demodulator, Extern Reference Frequency
and Battery.
TG, Tracking Generator can be switched ON/OFF and its Output Level is controlled by TG
function keys.
Offset offers a frequency offset between TG output and input frequency of
spectrum analyzer. It is programmable from -990kHz to 990kHz. When the offset is at
100kHz, it means the TG output frequency is 100kHz greater than spectrum analyzer.
Considering the flatness calibration of TG measurement, the
Normalization is to make the
through response flat. Therefore if the frequency response test is about to performe, directly
connect the TG output and RF input with the same testing fixture to normalize first, then
connect the DUT into test. The normalization will calibrate the uneven characteristics of
fixtures used. The
Ref Value allows that the normalized line of through response can be
specified at any level.
There are AM and FM in the
Demodulator option. The related control like Tone and
Squelch are also provided. The External Reference Frequency allows 13 selections that
depend on user’s application. The most common frequency 10MHz is surely included. When
the
Battery Pack is installed, activating the Battery monitor will give the information of
battery status.
87
Page 90
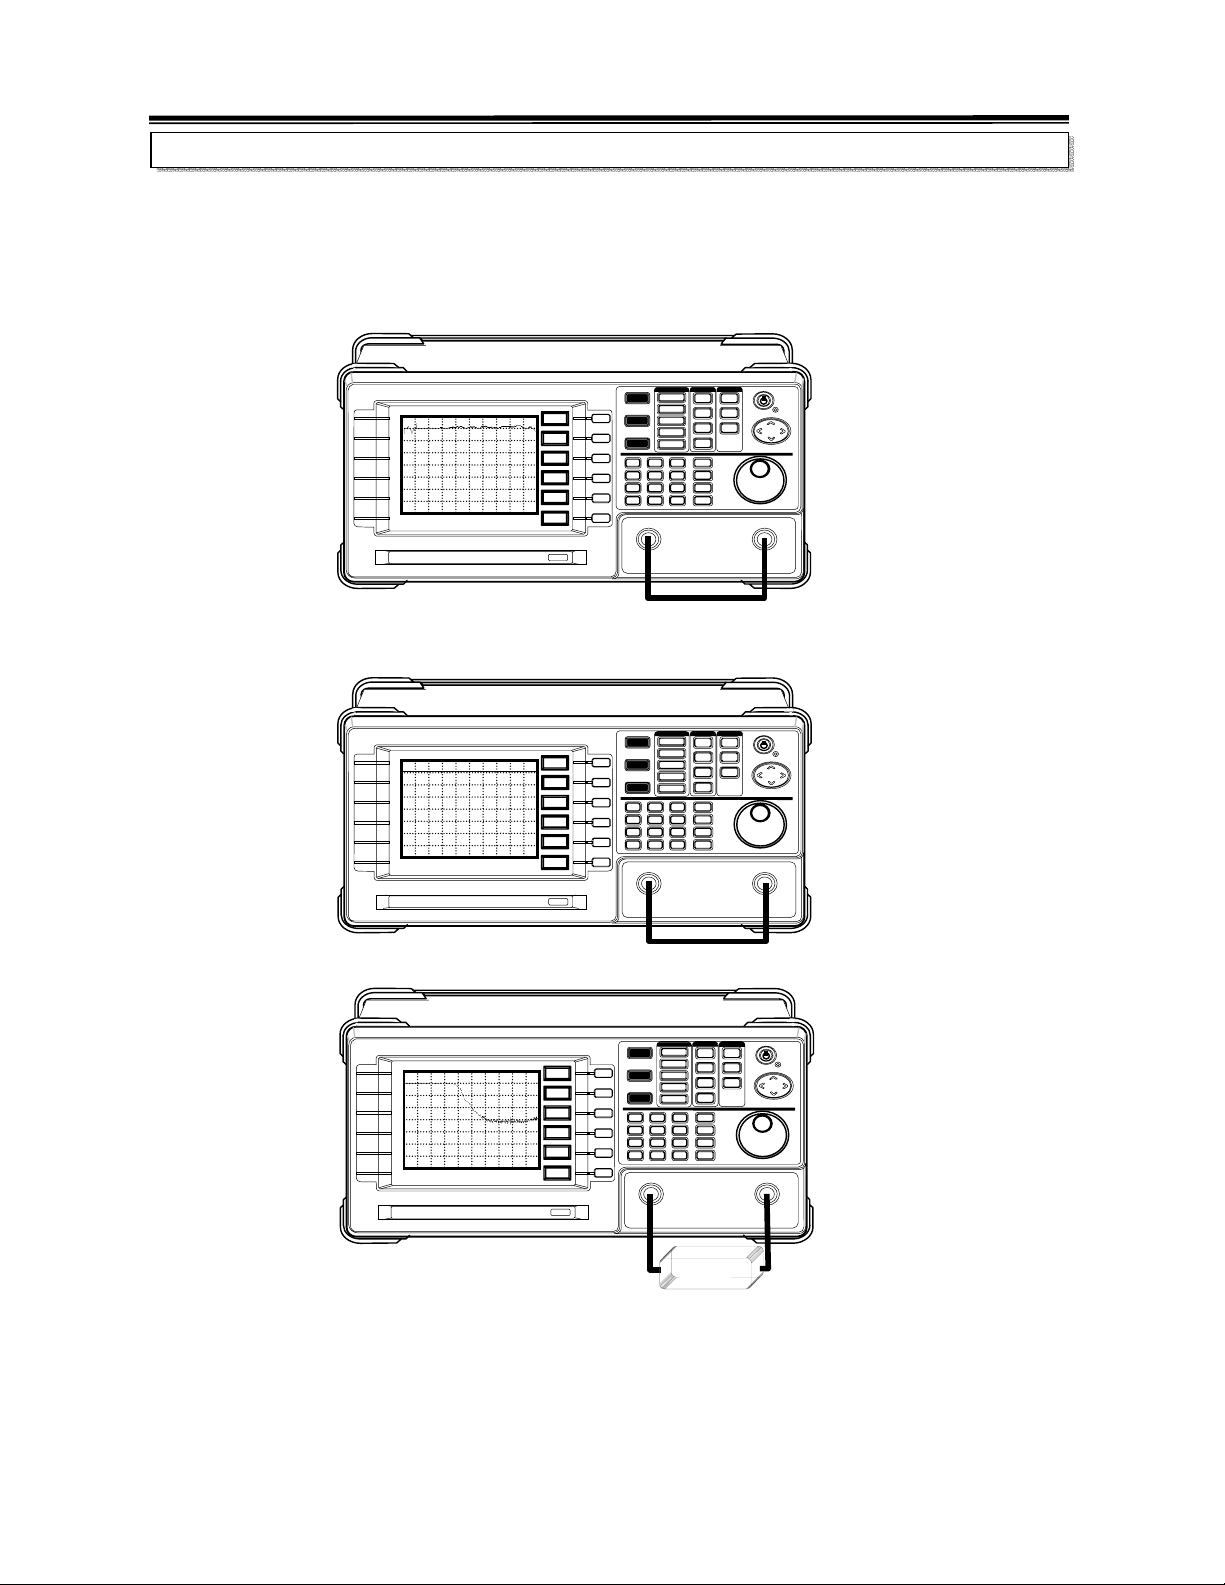
2.7GHz Spectrum Analyzer Operation Manual
Tracking Generator
Operation steps
Setup the spectrum analyzer. Frequency rage, Reference level, …, and so on.
(1)
(2)
Set the TG level.
Connect the TG output and RF input with the fixture and cables.
(3)
Turn the TG output ON
(4)
.
(5)
Perform Normalization function by turning the Normal ON.
Set the offset value.
(6)
Plug the DUT into the connection. The frequency response is measured accurately.
(7)
DUT
The operation detail is described in following paragraphs.
88
Page 91
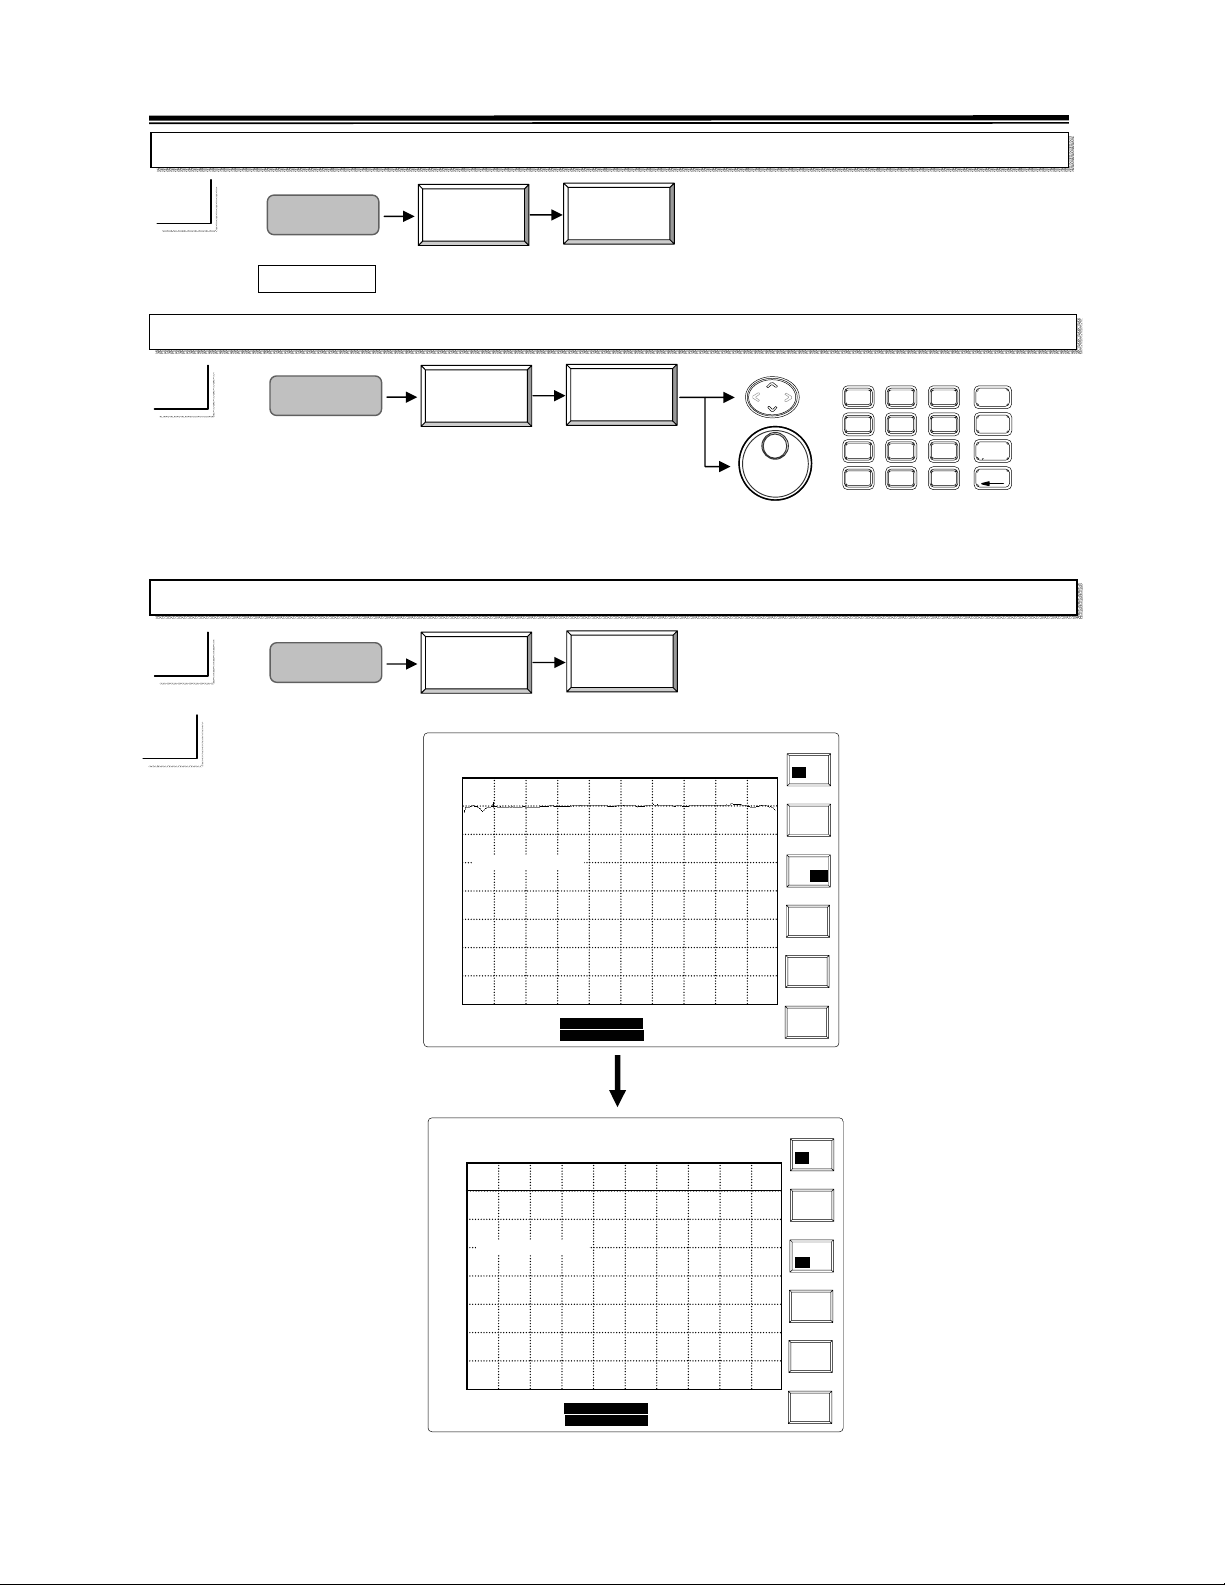
,
T
,
T
2.7GHz Spectrum Analyzer Operation Manual
TG ON/OFF
Option
TG
TG
ON/OFF
Pushing TG ON/OFF can switch TG ON and OFF.
TG Level
☛
Option
TG
TG
Level
8
7
4
1
0
9
5
6
3
2
.
-
UP/DOWN and Scroll: To change the TG level from -50dBm to 0dBm at 0.1dBm resolution.
Editing: To specify the TG output level directly.
Normalize
☛
Option
TG
Normal
ON OFF
1
SAT JAN 28
Ref
Lvl: 0.0 dBm
0.0
-10.0
-20.0
-30.0
-40.0
-50.0
-60.0
-70.0
-80.0
Start:99.5MHz
RBW:30 kHz
VBW:100 kHz
2003
14:30:25
INT:REF
AMPL CAL
TG Level : -10.0dBm
Center:100.0MHz
Span:1.0M Hz
Stop:100.5MHz
Sweep:100.0ms
Normalize
TG
ON OFF
G
Level
Normal
ON OFF
Offset
Ref
Value
Return
SAT JAN 28
Ref
Lvl: 0.0 dBm
0.0
-10.0
-20.0
-30.0
TG Level : -10.0dBm
-40.0
-50.0
-60.0
-70.0
-80.0
Start:99.5MHz
RBW:30 kHz
VBW:100 kHz
2003
14:30:25
INT:REF
AMPL CAL
Center:100.0MHz
Span:1.0MHz
Stop:100.5MHz
Sweep:100.0ms
TG
ON OFF
G
Level
Normal
ON OFF
Offset
Ref
Value
Return
GHz
dBm
MHz
dBmV
kHz
dBuV
BK SP
89
Page 92
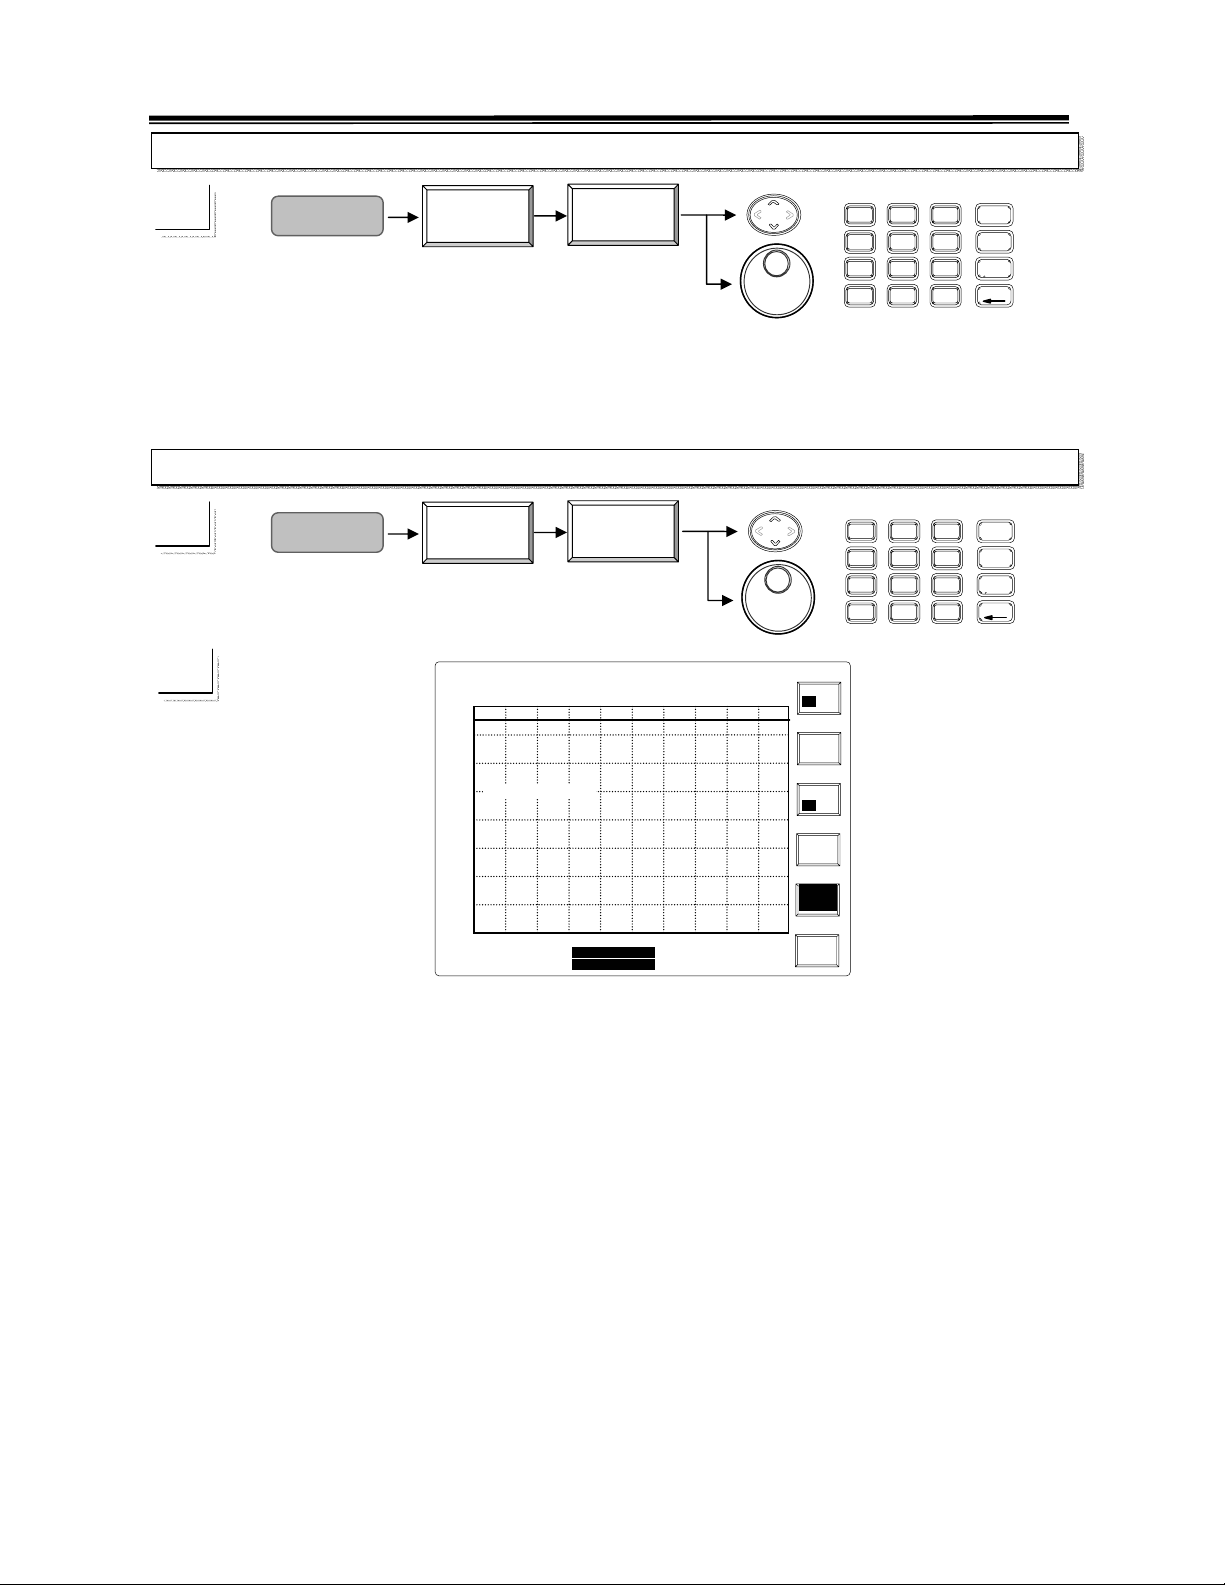
,
T
2.7GHz Spectrum Analyzer Operation Manual
Offset
☛
Option
TG
Offset
8
7
4
5
2
1
.
0
GHz
9
dBm
MHz
6
dBmV
kHz
3
dBuV
BK SP
-
UP/DOWN and Scroll: To change TG offset frequency from -990kHz to 990kHz at1kHz step.
Editing: To specify TG offset frequency from -990kHz to 990kHz directly.
Reference Value
☛
Option
TG
Ref
Value
8
7
4
5
2
1
.
0
GHz
9
dBm
MHz
6
dBmV
kHz
3
dBuV
BK SP
-
SAT JAN 28
2003
1
Ref
Lvl: 0.0 dBm
0.0
-10.0
-20.0
-30.0
Re f Level : -5.0d Bm
-40.0
-50.0
-60.0
-70.0
-80.0
Start:99.5MHz
RBW:30 kHz
VBW:100 kHz
14:30:25
INT:REF
AMPL CAL
Center:100.0MHz
Span:1.0M Hz
Stop:100.5MHz
Sweep:100.0ms
TG
ON OFF
G
Level
Normal
ON OFF
Offset
Ref
Value
Return
UP/DOWN and Scroll: To change the reference value in the display level range at 0.1dBm step.
Editing: To specify the reference value in the display level range directly.
90
Page 93
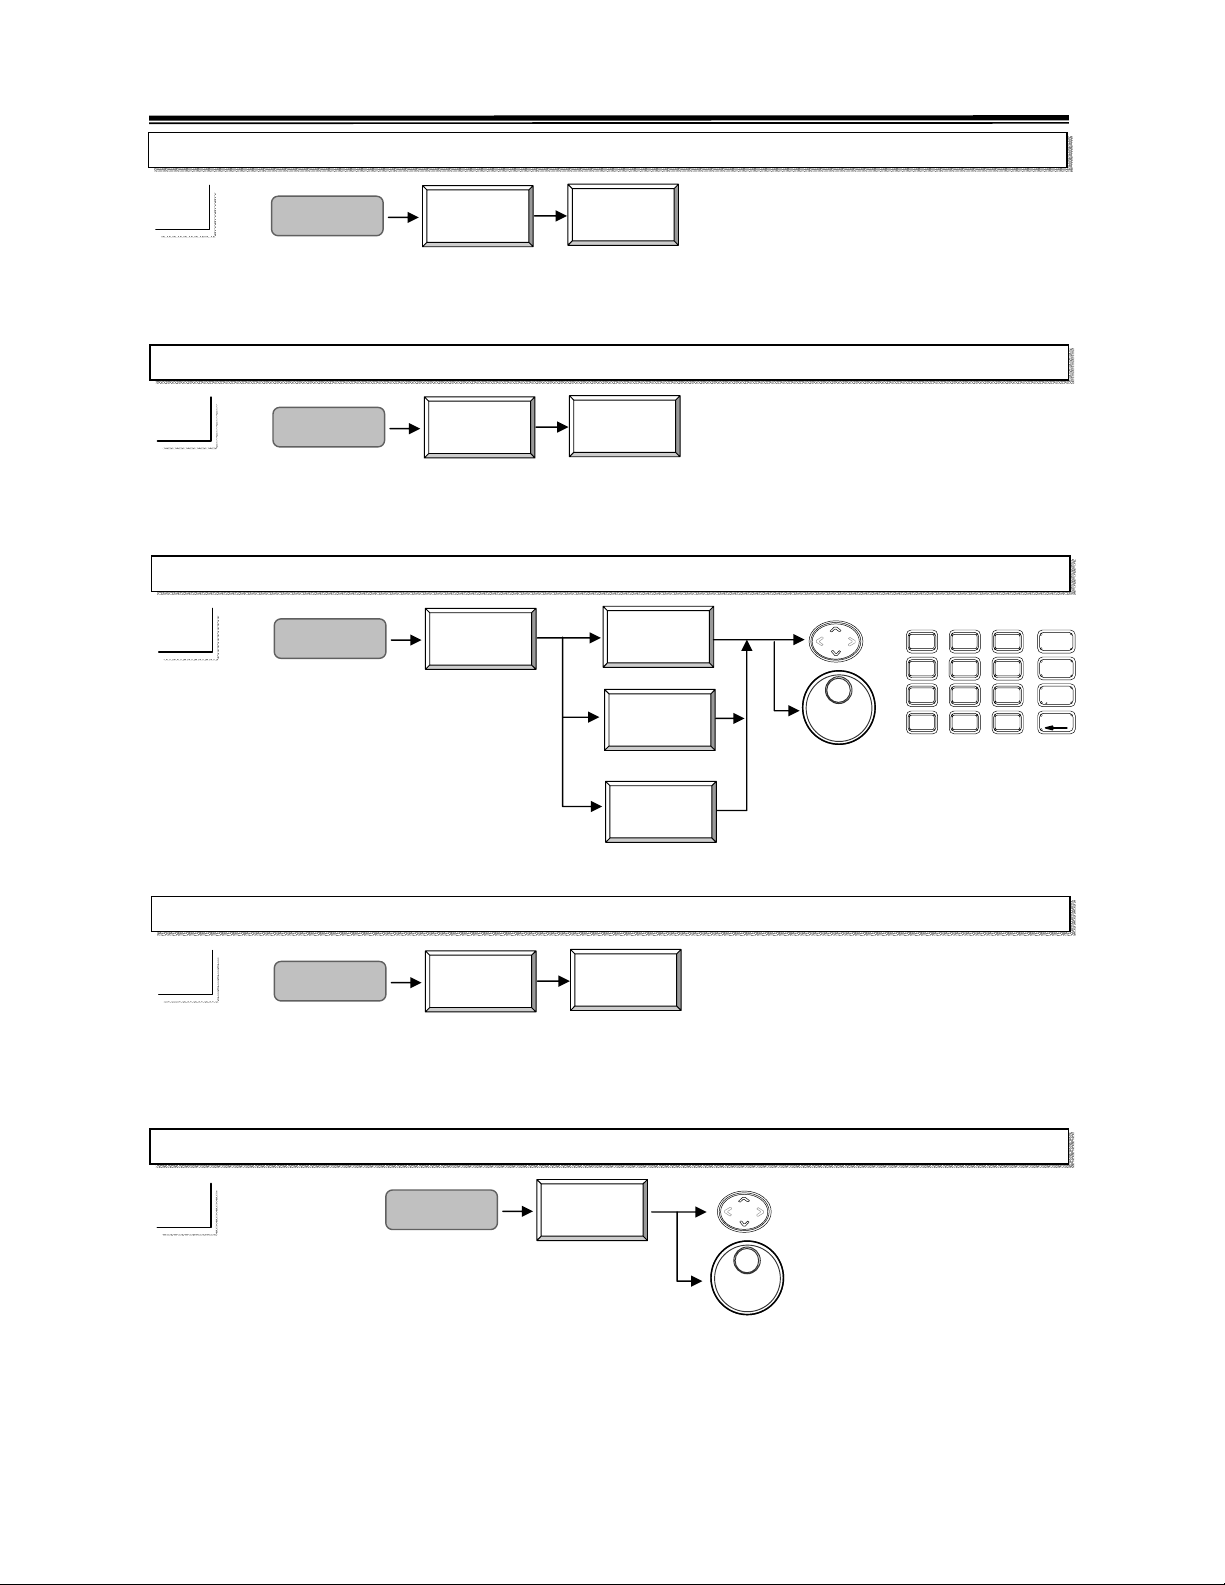
A
q
2.7GHz Spectrum Analyzer Operation Manual
Demodulation, FM
☛
Option
Demod
FM Off
WB NB
Push
FM ON WB NB can switch the FM between Narrow Band FM, Wide band FM
demodulation and OFF state.
Demodulation, AM
☛
Option
Demod
M
ON OFF
Push
AM ON OFF can switch the AM ON or OFF.
Volume, Tone and Squelch Control
☛
Option
Demod
Volume
Tone
Squelch
The volume, tone and squelch can be set from 0 to 64.
DC/AC FM Detection
☛
Option
Demod
FM Det
AC DC
Pushing
FM Det AC DC can select AC or DC detection of FM demodulation.
External Reference Frequency
☛
Option
ExtRef
Fre
UP/DOWN and Scroll: To select the external reference frequency in use.
8
7
4
5
2
1
.
0
GHz
9
dBm
MHz
6
dBmV
kHz
3
dBuV
BK SP
-
91
Page 94
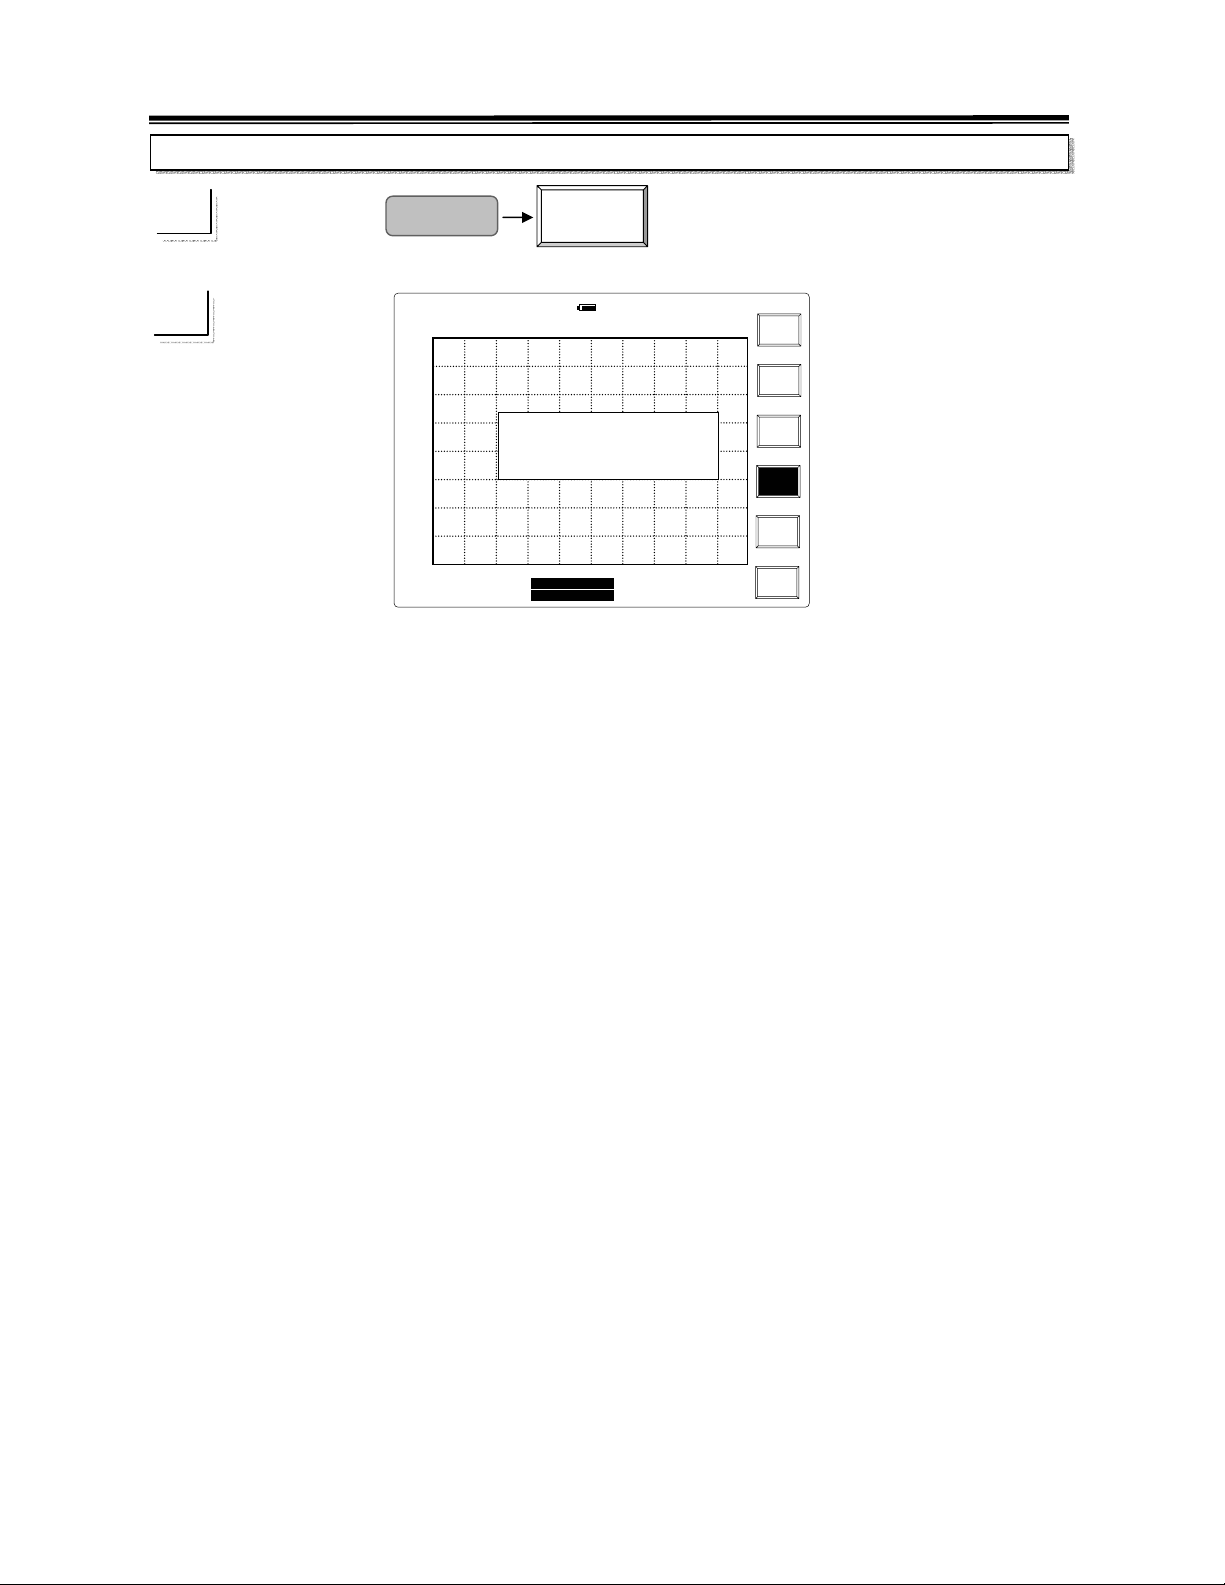
,
2.7GHz Spectrum Analyzer Operation Manual
Battery
☛
Option
Battery
SAT JAN 28
2003
14:30:25
1
Ref
Lvl: 0.0 dBm
0.0
-10.0
-20.0
-30.0
-40.0
-50.0
-60.0
-70.0
-80.0
Start:99.5MHz
RBW:30 kHz
VBW:100 kHz
INT:REF
AMPL CAL
Battery 1 Battery 2
Serial #: 1 167
Voltage: 11.44 11.44 Volts
Time to Empty: 179 760 Minutes
<Press any key to continue>
Center:100.0MHz
Span:1.0MHz
Stop:100.5MHz
Sweep:100.0ms
TG
Demod
ExtRef
Freq
Battery
A battery sign will show up on the display if the battery pack is installed correctly. The Battery
information is presented.
8.4 Power Control
Pushing and holding the power control switch for 2~3 seconds can set the unit to ON and
Standby mode.
8.5 Diagnosis Information on the Display
The diagnosis information is listed below. Only one item of error message will be displayed. If
several problems are detected, the first error message will be displayed. When all problems are
solved, the
REF status will appear. (One of INT REF, EXT:REF and INT:MED)
LO1 Unlock: First LO signal is not locked.
LO3 Unlock: Third LO signal is not locked.
INT REF: The reference signal is internal
INT REF Unlock: The internal reference signal is not locked.
EXT REF: The External reference signal is applying to be reference signal of system.
EXT REF Unlock: The system reference signal based on external reference is not locked.(*)
INT MED: The 1ppm stability reference is the system reference signal.
INT MED Unlock: The system reference signal based on 1ppm stability is not locked.
Battery Low: Battery pack is going to run out of energy.
NOTE(*): When External Reference is unlocked, make sure again the external reference frequency
select the right frequency. Refer to Chapter 8.4.3 Option-External Reference Frequecy.
92
Page 95
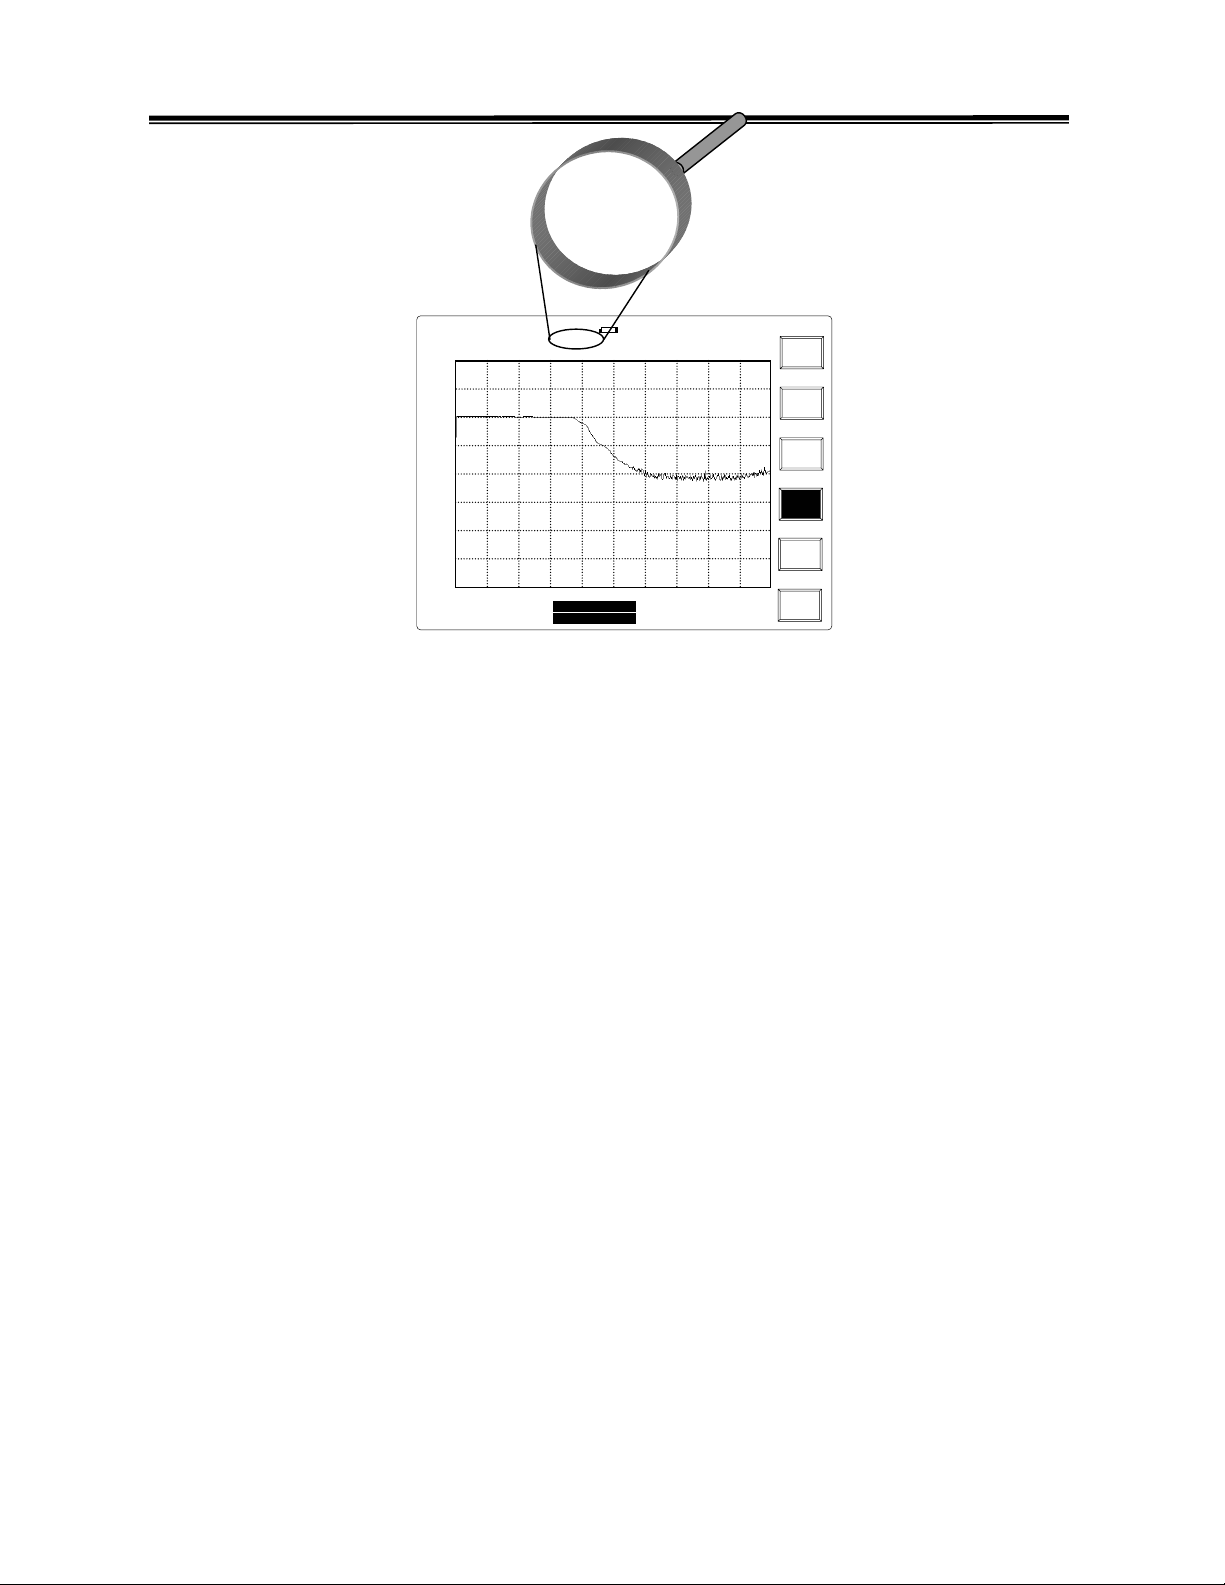
,
2.7GHz Spectrum Analyzer Operation Manual
Diagnosis information field
SAT JAN 28
Ref
-10.0
-20.0
-30.0
-40.0
-50.0
-60.0
-70.0
-80.0
Lvl: 0.0 dBm
0.0
Start:99.5MHz
RBW:30 kHz
VBW:100 kHz
2003
INT:REF
14:30:25
INT:REF
AMPL CAL
Center:100.0MHz
Span:1.0MHz
Stop:100.5MHz
Sweep:100.0ms
TG
Demod
ExtRef
Freq
Battery
93
Page 96

2.7GHz Spectrum Analyzer Operation Manual
9.0 Specification
Item Specification
Frequency Range 9kHz-2.7GHz
Accuracy see time base
Span Accuracy see time base
Span Range 2kHz to 2.5GHz in 1/2/5 sequence, full span, zero
span
Phase Noise -85dBc/Hz typical @ 1GHz 20kHz Offset
Time Base ± 10ppm, 0-50C, 5ppm/yr
Bandwidth RBW Selections 3kHz, 30kHz, 300kHz, 4MHz,
RBW Accuracy 15%
Video Bandwidth 10Hz to 1MHz in 1-3 steps
Sweep time 100 ms to 25.6 s
Amplitude Input Range -100dBm to +20dBm 1M to 2.5GHz,@3k RBW
-95dBm to +20dBm 150kHz to 1MHz,
2.5GHz to 2.7GHz,@3k RBW
-80dBm to +20dBm 50k to 150kHz,@3k RBW
Reference Level Range -30 to +20dBm, overload protected
Accuracy ± 1.5dB @100MHz
Frequency Flatness ±1.5dB,
Display Range Linearity ± 1.5dB over 70dB
Overload protection +30dBm, ±25VDC
Average Noise Floor -130dBm/Hz 1MHz to 2.5GHz
-125dBm/Hz 150kHz to 1MHz,
2.5GHz to 2.7GHz
-105dBm/Hz 50k to 150kHz
Harmonic Distortion <-60dBc @-40dBm Input
Non-harmonic Spurious <-60dB, down from Ref. Level 150k to 2.7GHz
<-50dB, down from Ref. Level 9k to 150kHz
Third Intermodulation <-70dBc @-40dBm Input
Trace Detection: Average, Maximum Hold, Freeze, Trace Math
Input
Impedance: 50 Ohm nominal
Return loss <1.5:1 @150k to 2.5GHz, 0dBm Ref. Level
Connector Type N Female
Others
Power measurement ACPR, OCBW, Channel power
Reference clock output 10MHz
General Display: 640 x 480 high resolution graphical LCD, B&W
Interface: RS232C,
Weight: 4.5kg without options
Size 330 (W) x 170(H) x 340(D) mm
RF input
Overload Protection
External reference clock input
Frequency
+30dBm Continuous
64k, 1M, 1.544M, 2.048M, 5M, 10M, 10.24M,
13M, 15.36M, 15.4M, 19.2M
Internal Memory 100 traces or Setup
94
Page 97
2.7GHz Spectrum Analyzer Operation Manual
Options
Tracking
Frequency Range 9kHz to 2.7GHz
Generator* Amplitude Range -50dBm to 0 dBm
Amplitude accuracy ±1dB @100MHz, 0dBm
Amplitude flatness ±1.5dB @0dBm
Harmonics <-30dBc
Reverse Power +30dBm
Impedance 50 Ohm nominal
Return Loss <1.5:1
Demodulation Am, FM AM, FM
EMI Filter* EMI filter and detector 9kHz and 120kHz 6dB RBW
Quasi-Peak Detector
Interface* GPIB IEEE-488 SCPI Command Compatibility
DC/AC Power
DC/AC dual mode power supply DC-12V and AC 100 to 260V
Supply*
Battery Pack* Chargeable from AC Line, Li Ion battery pack.
(1)
Note (1): Battery Pack works and be charged with AC line only when the DC/AC dual mode power
supply is installed.
95
Page 98

2.7GHz Spectrum Analyzer Operation Manual
96
 Loading...