

Page 1
The Leader in Water Instrumentation
Level • Flow • Samplers • Water Quality • Weather • Remote Monitoring • Control
FFPP110011--FFPP220011 GGlloobbaall FFllooww PPrroobbee
User’s Manual
Global Water
Visit Our Complete Online Catalog www.globalw.com • Call (800) 876-1172, 7:30 AM to 4 PM Pacific Time
International: US (916) 638-3429 • FAX: (916) 638-3270 • E-mail: globalw@globalw.com
11257 Coloma Road, Gold River CA 95670 USA
Page 2

CCoonntteennttss
General Instructions 1
Average Velocity 2
Computer Operation 3
Computer Set-Up 4
Maintenance 5
Calculations 6
Extensions 7
Graphic Overview 8
Troubleshooting 9
Global Water Warranty 10
Page 3

FP101/FP201 - 1
Global Water Instrumentation, Inc.
www.globalw.com • (800) 876-1172 • US (916) 638-3429 • FAX: (916) 638-3270 • E-mail: globalw@globalw.com
Congratulations on your purchase of a Global FP101 or FP201 Flow Probe!
Our Flow Probe has been field-tested in several hundreds of locations throughout the world. Our customers
praise the product’s ease-of-use, accuracy, durability, portability, and reasonable cost. Please follow the simple procedures for operation presented in this manual and you will be accurately and reliably monitoring realtime flow in no time.
GGeenneerraall II nnssttrruu ccttiioonnss
1) Make sure the Flow Probe’s propeller turns freely by blowing strongly on the prop.
2) Point the propeller directly into the flow you wish to measure. Face the arrow inside the prop housing
downstream. The FP101 probe handle is a two piece rod expandable from 3’ to 6’, and the FP201 is a
three section rod expandable from 5’ to 15’. To expand the rod for correct placement in flow, loosen the
locking nut on the handle, pulling out the top piece and retightening the nut.
3) Scroll with the right button until the “V” for velocity appears on the left hand of the screen. The top number in “V” mode is the instantaneous velocity to the nearest 0.1 ft/sec. Push the left button to toggle the
bottom number between maximum (“mx”) and average (“av”) velocities to the nearest 0.01 ft/sec.
4) With the propeller placed at your measuring point, push both the right and left buttons simultaneously and
release to clear the computer and reset the average and maximum velocities. Hold the probe in place for
several seconds until the average velocity reading steadies and then remove the probe. The average
velocity will freeze once the propeller stops turning. See Average Velocity section for more information on
obtaining average velocities.
5) Measure/calculate the cross-sectional area of your flow stream in square feet. If you are measuring flow in
round pipes, measure the depth of water and use the enclosed tables to determine cross-sectional area
(see Calculations section). If you are measuring flow in another channel type, manually measure water
depth at several points across the flow. These measurements are most easily recorded by drawing a diagram on graph paper with a scale of 1 square foot per graph paper square. Cross-sectional area (in
square feet) can then be found by counting the number of squares in the stream.
6) The average velocity (calculated with the Flow Probe in feet/second) times the cross-sectional area
(square feet) equals flow in cubic feet per second (cfs), or Q = V x A.
7) If the propeller gets fouled while measuring flow, clean it until the prop turns freely and start over.
Page 4

FP101/FP201 - 2
Global Water Instrumentation, Inc.
www.globalw.com • (800) 876-1172 • US (916) 638-3429 • FAX: (916) 638-3270 • E-mail: globalw@globalw.com
AAvvee rraaggee VVeell oocciitt yy
The Flow Probe is used to measure the average water velocity. Streamflow velocity varies for two reasons:
1) The velocities vary throughout the flow’s cross-section. In general, the velocities are greater in the center
of the flow and less near the bottom and sides of the channel.
2) The water surges in velocity with time. In a smooth running stream, the velocity at a specific point can
easily vary 1-2 feet per second over the period of a minute. This pulsating or surging of flow should be
averaged to obtain an accurate average flow reading (leave the probe in the flow through a series of flow
surges).
The Flow Probe can be used in three ways to determine average velocity in a stream.
1) For small streams and pipes, the probe can be moved slowly and smoothly throughout the flow during
average velocity measurement. Move the probe smoothly and evenly back and forth from top to bottom of
the flow so that the probe stays at each point in the flow for approximately the same amount of time.
Keep moving the probe for 20-40 seconds to obtain an accurate average value that accounts for surging.
(Move the probe as if you were spray painting and attempting to get an even coat of paint over the entire
surface.)
The Flow Probe uses true velocity averaging. When the average and maximum velocities are zeroed by
pushing both buttons, a running average is started. As long as the probe remains in the flow, the averaging continues. One reading is taken per second, and a continuous average is displayed. For example,
after 10 seconds, 10 readings are totaled and then divided by 10 and this average is displayed. Once the
average reading becomes steady, the true average velocity of the stream is obtained. When you pull the
probe from the water, this average value is frozen on the display until it is reset.
2) For larger streams and rivers where the Flow Probe can’t easily be moved throughout the flow, divide the
stream into subsections 2-3 feet wide. We recommend dividing subsections on your graph paper diagram
of the flow profile. Run a measuring tape across the stream for reference. Obtain a vertical flow profile at
the center of each subsection: zero the averaging function and move the Flow Probe vertically from the
surface to the bottom, up and down, slowly and smoothly for 20-40 seconds to obtain a good average.
The average velocity (obtained with the Flow Probe) times the area of the subsection (use your graph
paper diagram) equals the flow for the subsection (Q=VxA). Once the flow of each subsection is obtained,
add all of the subsection flows to obtain the Total Streamflow.
3) For the USGS “6 tens method”, the Flow Probe is placed at the center of the subsection at a depth from
the surface of 0.6 of the total depth. The Flow Probe is held in place and the average velocity is obtained
over a period of 40 seconds. The 0.6 depth is assumed to be the average velocity point for the vertical
profile. Therefore, this average is similar to that obtained in technique 2 (above), however, we feel that
technique 2 is more accurate.
Page 5

FP101/FP201 - 3
Global Water Instrumentation, Inc.
www.globalw.com • (800) 876-1172 • US (916) 638-3429 • FAX: (916) 638-3270 • E-mail: globalw@globalw.com
CCoommppuutteerr OOppeerraattiioonn
The Flow Probe is calibrated at the factory. When you receive the product, you may wish to set the computer’s clock (see Computer Set-Up), otherwise you should not have to alter any of your computer settings. You
will have to recalibrate the computer if you wish to change measuring units (English/Metric), and when you
change your unit’s batteries (see Computer Set-Up). Normal battery life for the Flow Probe is 1 year or more.
The Flow Probe computer has a simple 2- button operation. The right button scrolls between functions and
the left button picks the option. Pushing both buttons for 1 second zeros the average and maximum velocities. With a little practice, one or both buttons can be pushed with the thumb of the hand holding the top of
the probe.
Push the right button to scroll through the following functions:
• Velocity: “V” is instantaneous velocity to the nearest 0.1 foot per second.
Push Left button to scroll between “av” (average velocity) and “mx” (maximum velocity).
Push both buttons to zero the displayed values (“RMS” is not activated at this time).
• “D” Function: Not used for this application.
• Stop Watch/Clock Function: The top number is the stop watch (push the left button to start and stop
the function, push both buttons to zero). The bottom number is the time of day.
Page 6

FP101/FP201 - 4
Global Water Instrumentation, Inc.
www.globalw.com • (800) 876-1172 • US (916) 638-3429 • FAX: (916) 638-3270 • E-mail: globalw@globalw.com
CCoommppuutteerr SS eett--UUpp
The computer’s set-up sequence is entered automatically when the batteries are changed. You can also enter
the set-up sequence at any time by holding both buttons simultaneously for 8 seconds. During the set-up
sequence, all of the display segments are displayed first, and then “mi” appears for English units and “km”
appears for metric units. The left button toggles between English and Metric units.
If you wish to measure in English units (standard), or in “feet per second”, toggle to “mi”. Push the right
button to enter “CAL” mode. This is your Flow Probe calibration function. Set the calibration at 33 .3 1.
When you change your batteries, you must reset this number. Pushing the left button increases the number
when the arrow points up and decreases the number when the arrow points down.
If you wish to measure in Metric units, or in“meters per second”, toggle to “km”. Push the right button to
enter “CAL” mode. This is your Flow Probe calibration function. Set the calibration at 1603. When you
change your batteries, you must reset this number. Pushing the left button increases the number when the
arrow points up and decreases the number when the arrow points down. NOTE: Unless Metric units are
specified when ordering, then measuring in metric units (meters per second) the numbers on the display read
10 times higher than actual measurements (2.23 meters per second reads 22.3).
To continue the set-up sequence after you have set your English or Metric calibration:
• Push the Right button - be sure “CAD” is not displayed.
• Push the Right button - SLEEP will appear. If you are not using your Flow Probe for 1-2 month, leave it
in this SLEEP mode, to reduce battery drain.
• Push the Right button - push the Left button to toggle between 24 hr and 12 hr clock.
• Push the Right button - push the Left button to set HOUR (time of day).
• Push the Right button - push Left to set the MINUTE (time of day).
• Push the Right button - you are now out of Set Up and back in Velocity (“V”).
Page 7

FP101/FP201 - 5
Global Water Instrumentation, Inc.
www.globalw.com • (800) 876-1172 • US (916) 638-3429 • FAX: (916) 638-3270 • E-mail: globalw@globalw.com
MMaaiinntteennaannccee
Probe Handle:
When the Flow Probe expansion joint becomes submerged, water enters the Probe handle. After use, dry the
Probe by separating the two handle sections, draining the water inside the Probe handle, and letting the handle dry out in a warm place before reassembling. You can clean the Flow Probe handle with mild soap and
water. DO NOT submerge the top of the pole and the computer. Water may cause the computer
to short and a new computer will need to be purchased. If the computer gets wet- D R Y IMMEDIATELY
with a soft cloth. Take out the batteries and put the computer in a warm place overnight to dry.
Battery Replacement:
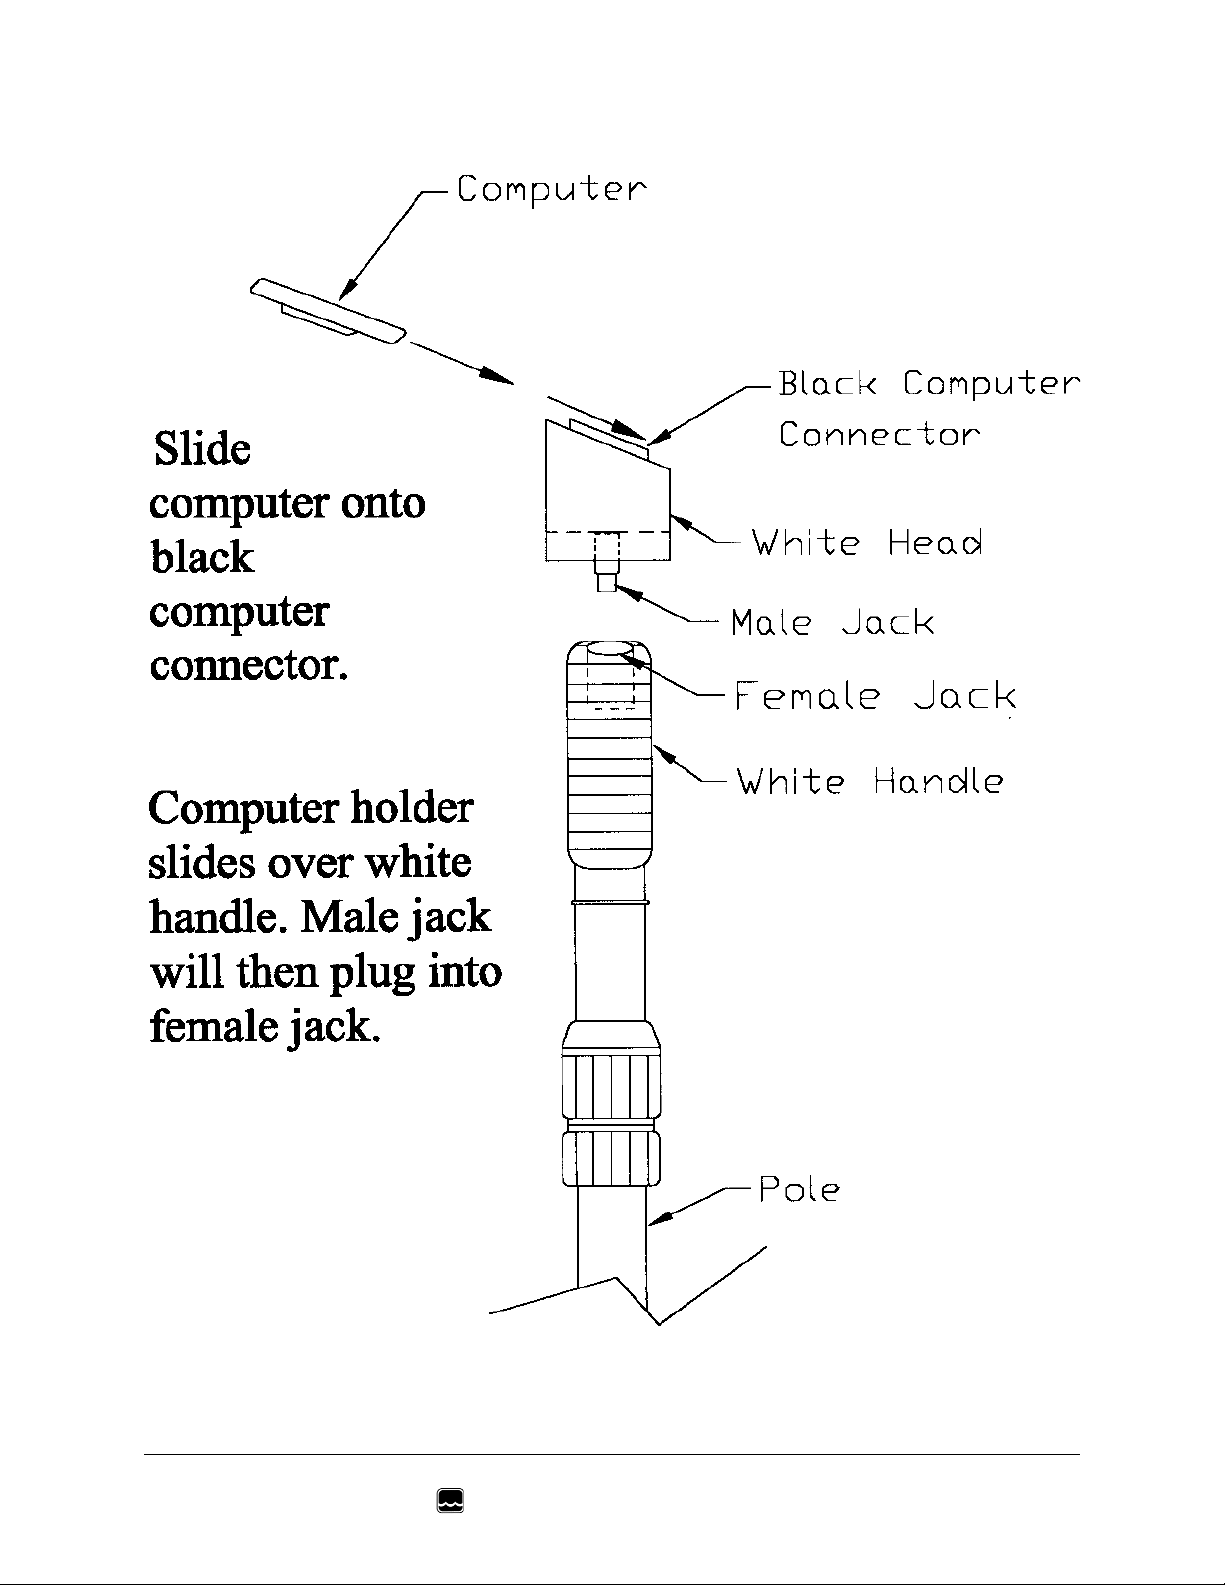
To replace battery, pull the computer holder unit from the top of the Flow Probe rod (the holder is connected
to the Probe by a jack and socket). The computer is connected to the holder by a tight fitting clip which
contains electrical connectors. Hold the computer holder in both hands and firmly push the bottom of the
computer up the slope of the holder until the computer pops off the holder (point the computer at a soft
object to protect the unit when it pops off). Pop open the battery compartment on the back of the computer
with a small screwdriver. Replace the battery with the “+” side up. Use a Radio Shack 675 HP battery, or the
equivalent. You can also obtain batteries from Global Water.
Propeller:
Make sure the Turbo Prop turns freely before and after your measurements. Blow on the prop in the direction
of flow. The prop should turn freely. If not, rinse the prop in clean water or soak it in mild soapy water and
remove any visible strings or hair materials from the prop bearing. To replace your prop, contact Global
Water to purchase a propeller kit.
Page 8

FP101/FP201 - 6
Global Water Instrumentation, Inc.
www.globalw.com • (800) 876-1172 • US (916) 638-3429 • FAX: (916) 638-3270 • E-mail: globalw@globalw.com
BC BC
0.010 0013 0.51 0.4027
0.02 0.0037 0.52 0.4127
0.03 0.0069 0.53 0.4227
0.04 0.0105 0.54 0.4327
0.05 0.0147 0.55 0.4426
0.06 0.0192 0.56 0.4526
0.07 0.0242 0.57 0.4625
0.08 0.0294 0.58 0.4723
0.09 0.0350 0.59 0.4822
0.10 0.0409 0.60 0.4920
0.11 0.0470 0.61 0.5018
0.12 0.0534 0.62 0.5115
0.13 0.0600 0.63 0.5212
0.14 0.0668 0.64 0.5308
0.15 0.0739 0.65 0.5404
0.16 0.0811 0.66 0.5499
0.17 0.0885 0.67 0.5594
0.18 0.0961 0.68 0.5687
0.19 0.1039 0.69 0.5780
0.20 0.1118 0.70 0.5872
0.21 0.1199 0.71 0.5964
0.22 0.1281 0.72 0.6054
0.23 0.1365 0.73 0.6143
0.24 0.1449 0.74 0.6231
0.25 0.1535 0.75 0.6318
0.26 0.1623 0.76 0.6404
0.27 0.1711 0.77 0.6489
0.28 0.1800 0.78 0.6573
0.29 0.1890 0.79 0.6655
0.30 0.1982 0.80 0.6736
0.31 0.2074 0.81 0.6815
0.32 0.2167 0.82 0.6893
0.33 0.2266 0.83 0.6969
0.34 0.2355 0.84 0.7043
0.35 0.2450 0.85 0.7115
0.36 0.2546 0.86 0.7186
0.37 0.2644 0.87 0.7254
0.38 0.2743 0.88 0.7320
0.39 0.2836 0.89 0.7384
0.40 0.2934 0.90 0.7445
0.41 0.3032 0.91 0.7504
0.42 0.3130 0.92 0.7560
0.43 0.3229 0.93 0.7612
0.44 0.3328 0.94 0.7662
0.45 0.3428 0.95 0.7707
0.46 0.3527 0.96 0.7749
0.47 0.3627 0.97 0.7785
0.48 0.3727 0.98 0.7816
0.49 0.3827 0.99 0.7841
0.50 0.3927 1.00 0.7854
CCaallcc uullaattiioonnss ff oorr FFllooww iinn PPaa rrttiiaallllyy FFiillllee dd PPiippeess
H= Height of water; D= Diameter of pipe
(in feet)
H/D = Column B
Read Column C adjacent to your pipe’s B
C x D2= Filled area, A (sq. ft.)
A x Average Velocity = Volumetric flow
(CFS)
CFS x 448.83 = Gallons/minute (GPM)
GPM x 1440 = Gallons/day (GPD)
H
D
Round Pipe
Page 9

FP101/FP201 - 7
Global Water Instrumentation, Inc.
www.globalw.com • (800) 876-1172 • US (916) 638-3429 • FAX: (916) 638-3270 • E-mail: globalw@globalw.com
EExxtteennssiioonnss
The FP101 probe handle is expandable from 3’ to 6’ by loosening the locking nut on the handle, pulling out
the top piece and retightening the nut. The FP201 is a three section rod expandable from 5’ to 15’.
If you want to remotely read the computer, purchase a standard stereo phone jack extension cable from Radio
Shack or your local electronics supplier. Pull the computer and computer holder up off the handle. Insert
one end of the extension cable into the handle and the other into the computer holder. Now one person can
hold the probe in a manhole or in a river while another person operates the computer and records the data at
street level, or from a bridge or stream bank.
If you need to make sewer flow measurements from the street level or measure off bridges or high banks
using your FP101, you can make an extension handle by using standard schedule 40 PVC pipe:
• Use a 6” piece of 1 1/4” pipe.
• Using PVC cement, cement a 1 1/4” - 1” pipe reducer to the 6” piece.
• Cement a 1” pipe of the length required to the reducer.
• Remove the computer and holder from the flow probe.
• Insert the waterproof stereo extension cable into the top of the original handle.
• Run the extension cable through the pipe.
• Slip the 1 1/4” end over the probe handle end.
• Push on firmly and duct tape the pipe onto the handle.
This type of extension should not be used for the FP201. An extension handle kit can also be purchased
from Global Water.
Page 10
FP101/FP201 - 8
Global Water Instrumentation, Inc.
www.globalw.com • (800) 876-1172 • US (916) 638-3429 • FAX: (916) 638-3270 • E-mail: globalw@globalw.com
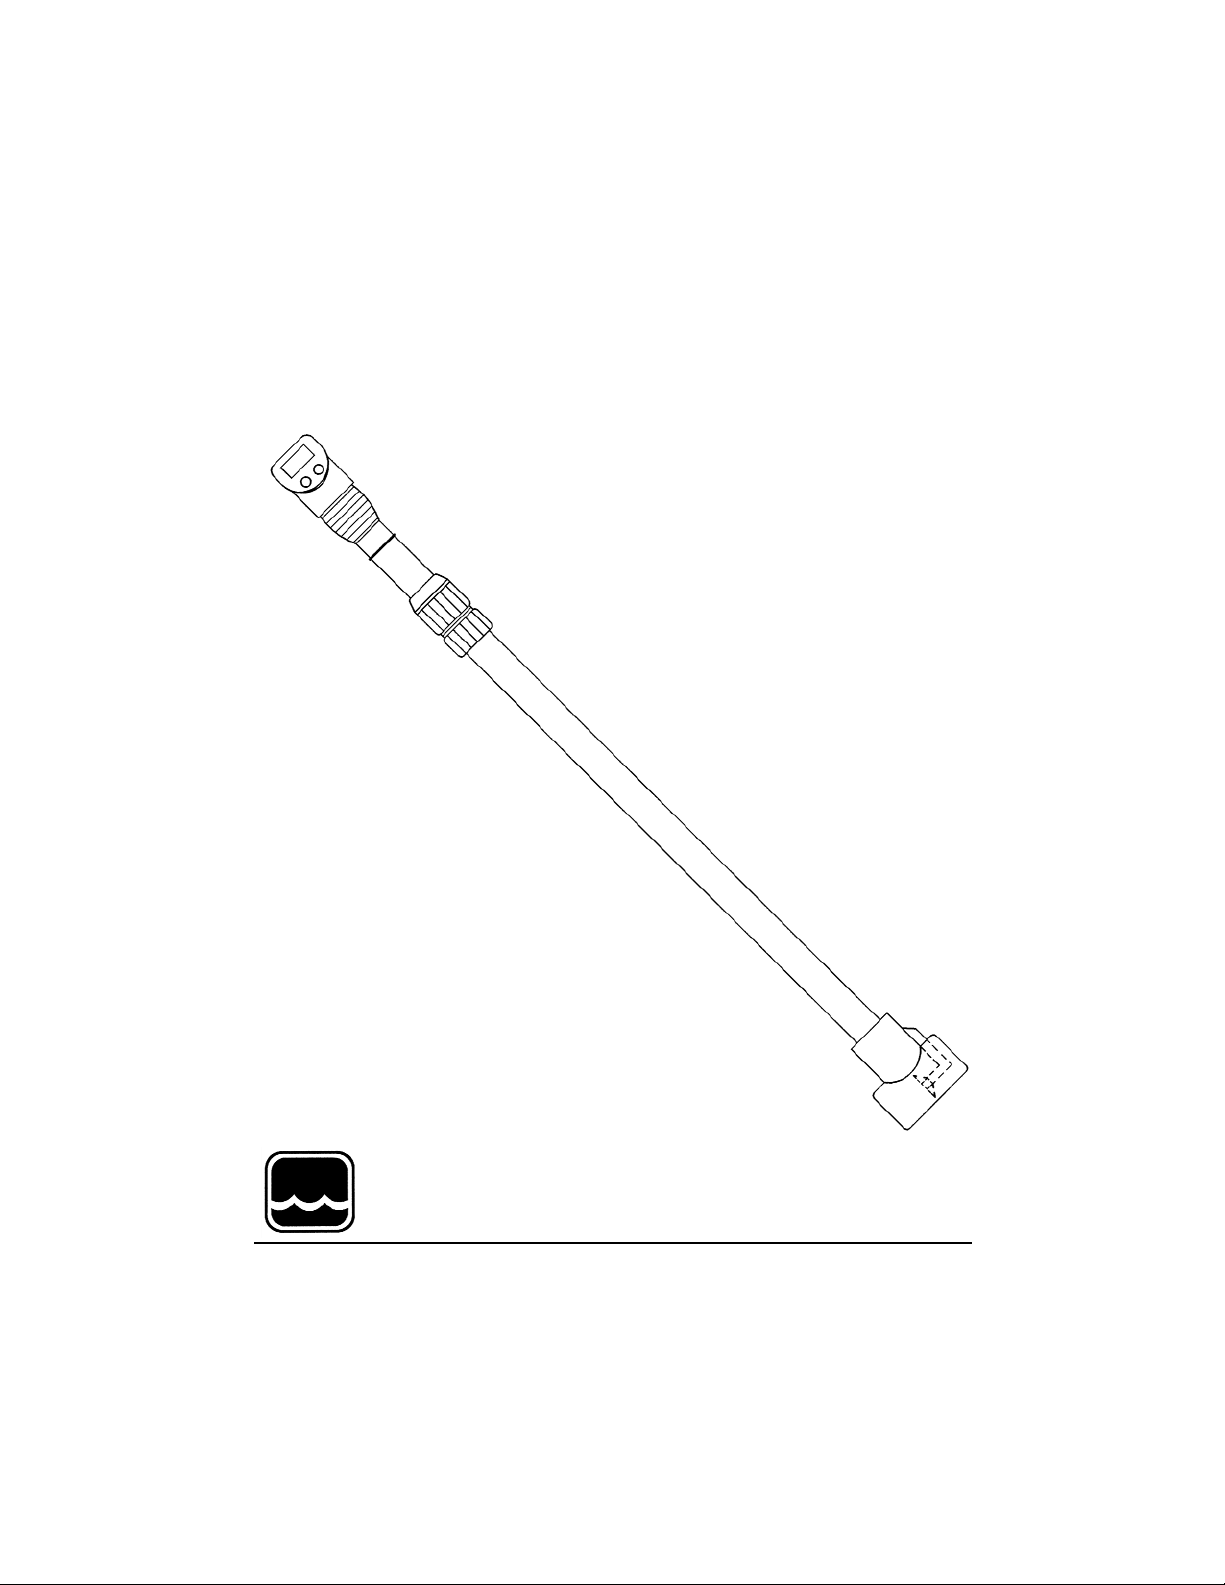
Global Flow Probe
Graphic Overview
Page 11

FP101/FP201 - 9
Global Water Instrumentation, Inc.
www.globalw.com • (800) 876-1172 • US (916) 638-3429 • FAX: (916) 638-3270 • E-mail: globalw@globalw.com
TTrroouubbllee SShhoooottiinngg
If your Flow Probe does not seem to be functioning properly:
1. Blow on the propeller. The prop should spin freely and make a noise (chatter) when you blow on it. The
prop should be loose on the shaft when you push it with your finger. If prop does not spin freely, rinse it
with clean water or soak it in mild soapy water.
2. A small metal magnet covered with clear rubber is installed on the back side of the prop on one blade (or
two blades if you ordered the low-flow option). Be sure the magnet is in place and has not been
removed. This magnet is necessary to make the signal for the computer.
3. Remove the computer holder from the pole handle by pulling the holder up away from the pole. The
holder should come off with a popping sound. Make sure there is no moisture around the plug or socket.
If the plug and socket are wet, dry the parts off and place both in a warm place overnight. Push the computer holder back on to handle HARD until you hear a "pop" or "snap" sound. If you don't hear this
sound, the holder is not on all the way or you have a defective socket connector. Zero the "av" mode and
blow on the prop for 5 to 7 seconds. You should see a number in "av" if the unit is working.
4. Remove the computer from the computer holder by pushing the bottom of the computer up the slope of
the holder with your thumbs until it pops off. You should hear a 'snap’ when it comes loose. Check the
two small brass contact pads on the clip. They should be clean and dry. They are springs and press
against the contacts on the computer. After repeated use, they can be pushed down and stop making
good contact. With a sharp pointed knife, you can pry the contacts back up to their original position.
5. Put the computer back into its clip by sliding it down the clip until it ‘snaps’ into place. Note that there is
an indentation on the back of the computer and a bump on the bottom of the clip. These need to mate
together with a ‘snap’ when the computer is fully in place. Zero the "av" mode and blow on the prop for 5
to 7 seconds. You should see a number in "av" if the unit is working.
6. If the display becomes weak or does not light up at all, replace the battery.
7. If these steps don't fix the Flow Probe, call the factory or return the Flow Probe for repair.
If your equipment needs to be returned to the factory for any reason, please call Global Water to
obtain a RMA number (Return Material Authorization). Do not return items without a RMA number
displayed clearly on the outside of the package.
When contacting Global Water for technical support, please have the following information accessible:
Product name and model number
Unit serial number
Purchase Order Number (if applicable)
Global Water invoice number
Detailed description of problems relating to the product
Page 12

GGlloobbaall WWaattee rr WWaarrrraanntt yy
Our goal is to provide you with the finest water instrumentation at a reasonable price. Our products are always
fully supported and 100% guaranteed.
Global Water warrants that its products are free from defects in material and workmanship under normal use
and service for a period of one year from date of shipment from factory. Global Water’s obligations under this
warranty are limited to, at Global Water’s option: (i) replacing, or (ii) repairing any products determined to be
defective. In no case shall Global Water’s liability exceed the product’s original purchase price. This warranty
does not apply to any equipment that has been repaired or altered by anyone but Global Water, or which has
been subjected to misuse, negligence, or accident. It is expressly agreed that this warranty will be in lieu of all
warranties of fitness and in lieu of the warranty merchantability.
FP101/FP201 - 10
Global Water Instrumentation, Inc.
www.globalw.com • (800) 876-1172 • US (916) 638-3429 • FAX: (916) 638-3270 • E-mail: globalw@globalw.com
 Loading...