

Page 1

I
Content
Brief Introduction ....................................................................................................... I!
Chapter 1 Accidence ................................................................................................ 1!
1.1 Accidence of Panel and Display Information ................................................................. 2!
1.2 Function Checking .......................................................................................................... 5!
1.3! Probe ................................................................................................................... 7!
1.3.1 Probe Safety .......................................................................................................... 7!
1.3.2 Probe Attenuation Setting .................................................................................... 7!
1.3.3 Probe Compensation ............................................................................................ 8!
Chapter 2 Functions Instruction and Operation ........................................................ 9!
2.1 Menu and Control Button ............................................................................................. 10!
2.2 Connector ...................................................................................................................... 12!
2.3 Auto Setup .................................................................................................................... 12!
2.4 Default Setup ................................................................................................................ 14!
2.5 Universal Knob ............................................................................................................. 15!
2.6 Vertical System ............................................................................................................. 15!
2.6.1 CH1, CH2 Channel ............................................................................................. 16!
2.6.2 Using Vertical “Position” Knob and “Volt/div” Knob ....................................... 21!
2.6.3 Math Functions .................................................................................................... 22!
2.6.4 Using Ref .............................................................................................................. 28!
2.7 Horizontal System ......................................................................................................... 30!
2.7.1 Horizontal Control Knob ..................................................................................... 31!
2.7.2 Window Zone ....................................................................................................... 32!
2.8 Trigger System .............................................................................................................. 33!
2.8.1 Signal Source ....................................................................................................... 34!
2.8.2 Trigger Type ......................................................................................................... 34!
2.8.3 Coupling ................................................................................................................ 47!
2.8.4 Position ................................................................................................................. 48!
2.8.5 Slope & Level ....................................................................................................... 48!
2.8.6! Trigger Holdoff ........................................................................................ 49!
2.9 Acquiring Signals System ............................................................................................. 49!
2.10 Display System ........................................................................................................... 55!
2.10.1 X-Y Format ......................................................................................................... 59!
2.11 Measure System .......................................................................................................... 59!
2.11.1 Scale Measurement .......................................................................................... 60!
2.11.2 Cursor Measurement ........................................................................................ 60!
2.11.3 Auto Measurement ........................................................................................... 66!
2.12 Storage System ........................................................................................................... 72!
2.13 Utility System ............................................................................................................. 85!
2.13.1 System Status ................................................................................................... 88!
2.13.2 Language ........................................................................................................... 88!
2.13.3 Self Calibration .................................................................................................. 89!
2.13.4 Self Test ................................................................................................................ 90!
2.13.5 Updating the System Software ....................................................................... 92!
2.13.6 Pass/Fail ............................................................................................................. 92!
2.13.7 Waveform Record ............................................................................................. 96!
2.13.8 Recorder ............................................................................................................. 99!
2.13.9 Remote Control ............................................................................................... 102!
Page 2

II
2.14 Online Help Function ................................................................................................ 109!
Chapter 3 Prompting Messages and Troubleshooting ......................................... 110!
3.1 Prompting Messages: .................................................................................................. 110!
3.2 Troubleshooting .......................................................................................................... 112!
Chapter 4 Service and Support ............................................................................ 114!
4.1 Maintain Summary ..................................................................................................... 114!
4.2 Contact GLOBAL SPECIALTIES ............................................................................. 114!
Appendix A: Default Setup ................................................................................... 115!
Appendix B: Daily Maintain and Cleaning ............................................................ 117!
Page 3

Chapter 1 Overview
DSC-5300 Series Digital Oscilloscope is mini-type and portable bench type instruments,
which could be used for measuring as the GND voltage.
This Chapter shows you how to operate following tasks:
• Accidence of panel and Display information
• Simple checking of functions
• Matching probes attenuation coefficient
• Probe compensation
Page 4

2
1.1 Overview of Panel and Display Information
1.1.1 Front Panel
It is important for you to understand the DSO’s front panel before operating it. The
following contents are the brief introduction for the front panel function, which is useful
to be familiar with the operation of the DSC-5300 Digital Storage Oscilloscope in short
time.
The oscilloscopes provides an easy-to-use front panel to convenience users to operate
them, the panel contains knobs and buttons. There is a list of five ashen buttons as menu
operational buttons on the right of display screen. You can set different options of the
current menu in virtue of them. Other buttons are function buttons; you can enter
different function menus or obtain given function application in virtue of them.
Picture 1.1-1 DSC-5300 Front Panel
Page 5

3
No.$
Description$
No.!
Description!
1!
On/Off!Button!
10!
Probe!Compensator!
2!
Menu!On/Off,!!
Menu!Softkeys!
11!
Horizontal!Controls!
3!
Intensity!Adjustment!
12!
External!Trigger!Input!
4!
Control!Keys!
13!
Vertical!Controls!
5!
Default!Setup!Key!
14!
Input!Channels!
6!
Help!Key!
15!
Print!Key!
7!
Run!Control!Panel!
16!
Front!USB!Connector!
8!
Autoset!Key!
17!
Display!
9!
Trigger!Control!Panel!
!
!
1.1.2 Back and Side Connections
The following images show back and side panel connection locations.
Picture 1.1-2 DSC-5300 Back and Side panel
Page 6

4
1. Handle
2. AC Power Input Terminal
3. USB Device Connector
4. Pass/Fail Output Connector
5. LAN Port
6. Lock Hole
1.1.3 User display interface
Picture 1.1-3
1.Product Logo
Global Specialties is the registered trademark of our company.
2. Trigger status
Armed. The oscilloscope is acquiring pre-trigger data. All triggers are ignored in this
state.
Ready. All pre-trigger data has been acquired and the oscilloscope is ready to accept
a trigger.
Trig’d. The oscilloscope has seen a trigger and is acquiring the posttrigger data.
Stop. The oscilloscope has stopped acquiring waveform data.
Auto. The oscilloscope is in auto mode and is acquiring waveforms in the absence of
Page 7

5
triggers.
Scan. The oscilloscope is acquiring and displaying waveform data continuously in scan
mode.
3. USB Host connected mark.
4. Waveform memory
Show the position of the current waveform in the memory of the oscillsocpe.
5. Trigger position.
Turn the HORIZONTAL POSITION knob to adjust the trigger position of the
waveform.
6. Show the LAN port.
Indicates the LAN port is connected.
Indicates the LAN port is disconnected.
7. Show the Channel symbol.
8. Readout shows trigger signal frequency..
9. Readout shows the trigger level value and trigger type..
10.Readout shows the trigger delay of waveform.
11. Readout shows the main time base setting.
12. Icon shows the channel setting.
13. Icon shows the channel offset position.
14. Icon shows the trigger level position
1.2 Function Checking
When you check whether or not the oscilloscope could work smoothly, please operate
as following:
1. Power On the oscilloscope.
Press “DEFAULT SETUP” to show the result of the self check. The probe default
attenuation is 1X.
Page 8

6
Picture 1.2- 1
2. Set the switch to 1X on the probe and connect the probe to channel 1 on the
oscilloscope. To do this, align the slot in the probe connector with the key on the CH 1
BNC, push to connect, and twist to the right to lock the probe in place. Connect the probe
tip and reference lead to the PROBE COMP connectors
Picture 1.2-2
3Press “AUTO” to show the 1 KHz frequency and about 3V peak-peak square wave
in couple seconds
Picture 1.2-3
Page 9

7
4. Press “CH1” two times to cancel the channel 1, Press“CH2” to change screen into
channel 2, reset the channel 2 as step 2 and step 3.
1.3 Probe
1.3.1 Probe Safety
A guard around the probe body provides a finger barrier for protection from electric
shock.
Picture 1.3-1
Connect the probe to the oscilloscope and connect the ground terminal to ground before
you take any measurements.
1.3.2 Probe Attenuation Setting
Probes are available with various attenuation factors which affect the vertical scale of
the signal. The Probe Check function verifies that the Probe attenuation option matches
the attenuation of the probe.
Note ● To avoid electric shock when using the probe, keep fingers behind the guard
on the probe body.
●
To avoid electric shock while using the probe, do not touch metallic portions of
the probe head while it is connected to a voltage source. Connect the probe to
the oscilloscope and connect the ground terminal to ground before you take any
measurements.
Page 10

8
You can push a vertical menu button (such as the CH 1 MENU button), and select the
Probe option that matches the attenuation factor of your probe.
Be sure that the attenuation switch on the probe matches the Probe option in the
oscilloscope. Switch settings are 1X and 10X.
1.3.3 Probe Compensation
As an alternative method to Probe Check, you can manually perform this adjustment to
match your probe to the input channel.
Picture1.3-2
1. Set the Probe option attenuation in the channel menu to 10X. Set the switch to 10X
on the probe and connect the probe to channel 1 on the oscilloscope. If you use the
probe hook-tip, ensure a proper connection by firmly inserting the tip onto the probe.
2. Attach the probe tip to the PROBE COMP 3V connector and the reference lead to the
PROBE COMP Ground connector. Display the channel and then push the “AUTO”
button.
3. Check the shape of the displayed waveform.
Note: The default setting for the Probe option is 1X.
Note: When the attenuation switch is set to 1X, the probe limits the bandwidth of the
oscilloscope to 6MHz (according to Probe spec). To use the full bandwidth of the
oscilloscope, be sure to set the switch to 10X
Page 11

9
Over Compensated Under
Compensated Correctly Compensated
Picture 1.3-3
4. If necessary, adjust your probe. Repeat as necessary.
Chapter 2 Functions Instruction and Operation
To use your oscilloscope effectively, you need to learn about the following oscilloscope
functions:
• Menu and control button
• Connector
• Auto Setup
• Default Setup
• Universal knob
• Vertical System
• Horizontal System
• Trigger System
• Acquiring signals System
• Display System
• Measuring waveforms System
• Utility System
• Storage System
• Online Help function
Page 12

10
2.1 Menu and Control Button
Showing as the following picture:
Picture 2-1
■ Channel buttons (1, 2): Press a channel button to turn that channel ON or OFF and
open the channel menu for that channel. You can use the channel menu to set up a
channel. When the channel is on, the channel button is lit.
■ MATH: Press to display the Math menu. You can use the MAH menu to use the
oscilloscopes Math functions.
■ REF: Press to display the Ref Wave menu. You can use this menu to save and recall
four or two reference waveforms internal memory.
Page 13

11
■ HORI MENU: Press to display the Horizontal menu. You can use the Horizontal menu
to display the waveform and zoom in a segment of a waveform.
■ TRIG MENU: Press to display the Trigger menu. You can use the Trigger menu to set
the trigger type (Edge. Pulse, Video, Slope, Alternative) and trigger settings.
■ SET TO 50%: Press to stabilize a waveform quickly. The oscilloscope can
set the trigger level to be halfway between the minimum and maximum
voltage level automatically. This is useful when you connect a signal to the
EXT TRIG connector and set the trigger source to Ext or Ext/5.
■ FORCE: Use the FORCE button to complete the current waveform acquisition
whether the oscilloscope detects a trigger or not. This is useful for Single acquisitions
and Normal trigger mode.
■ SAVE/RECALL: Press to display the Save/Recall menu. You can use the Save/Recall
menu to save and recall up to 20 oscilloscope setups or waveforms in internal memory
(up to 20 waveforms) or on a USB memory device (limited by memory capacity of USB
device). You can also use it to recall the default factory settings, to save waveform data
as a comma-delimited file (.CSV), and to save or print the displayed waveform image.
■ ACQUIRE: Press to display Acquire menu. You can use the Acquire menu to set the
acquisition Sampling Mode (Sampling, Peak Detect, Average).
■ MEASURE: Press to display a menu of measurement parameters.
■ CURSORS: Display the Cursor Menu. Vertical Position controls adjust cursor position
while displaying the Cursor Menu and the cursors are activated. Cursors remain
displayed (unless the “Type” option is set to “Off”) after leaving the Cursor Menu but
are not adjustable.
■ DISPLAY: Press to open the Display menu. You can use the Display menu to set grid
and waveform display styles, and persistence.
■ UTILITY: Press to open the Utility menu. You can use the Utility menu to configure
oscilloscope features, such as sound, language, counter, etc. You can also view
system status and update software.
■ DEFAULT SETUP: Press to reset the oscilloscope’s settings to the default
factory configuration.
Page 14

12
■ HELP: Enter the online help system.
■ AUTO: Automatically sets the oscilloscope controls to produce a usable display of the
input signals.
■ RUN/STOP: Continuously acquires waveforms or stops the acquisition.
NoteIf waveform acquisition is stopped (using the RUN/STOP or SINGLE
button), the SEC/DIV control expands or compresses the waveform.
■ SINGLE: Acquire a single waveform and then stops.
2.2 Connector
Picture 2-2
■ Channel Connector (CH1, CH2): Input connectors for waveforms display.
■ EXT TRIG: Input connector for an external trigger source. Use the Trigger
Menu to select the “Ext” or “Ext/5” trigger source.
■ Probe Component: Voltage probe compensation output and ground. Use
to electrically match the probe to the oscilloscope input circuit.
2.3 Auto Setup
The DSC-5300 Digital Storage Oscilloscopes have a Auto Setup function that identifies
Note: If you connect a voltage source to a ground terminal, you may
damage the oscilloscope or the circuit under test. To avoid this, do not
connect a voltage source to any ground terminals.
Page 15

13
the waveform types and automatically adjusts controls to produce a usable display of
the input signal.
Press the AUTO button, and then press the menu option button adjacent to the desired
waveform as follows:
Picture 2-3
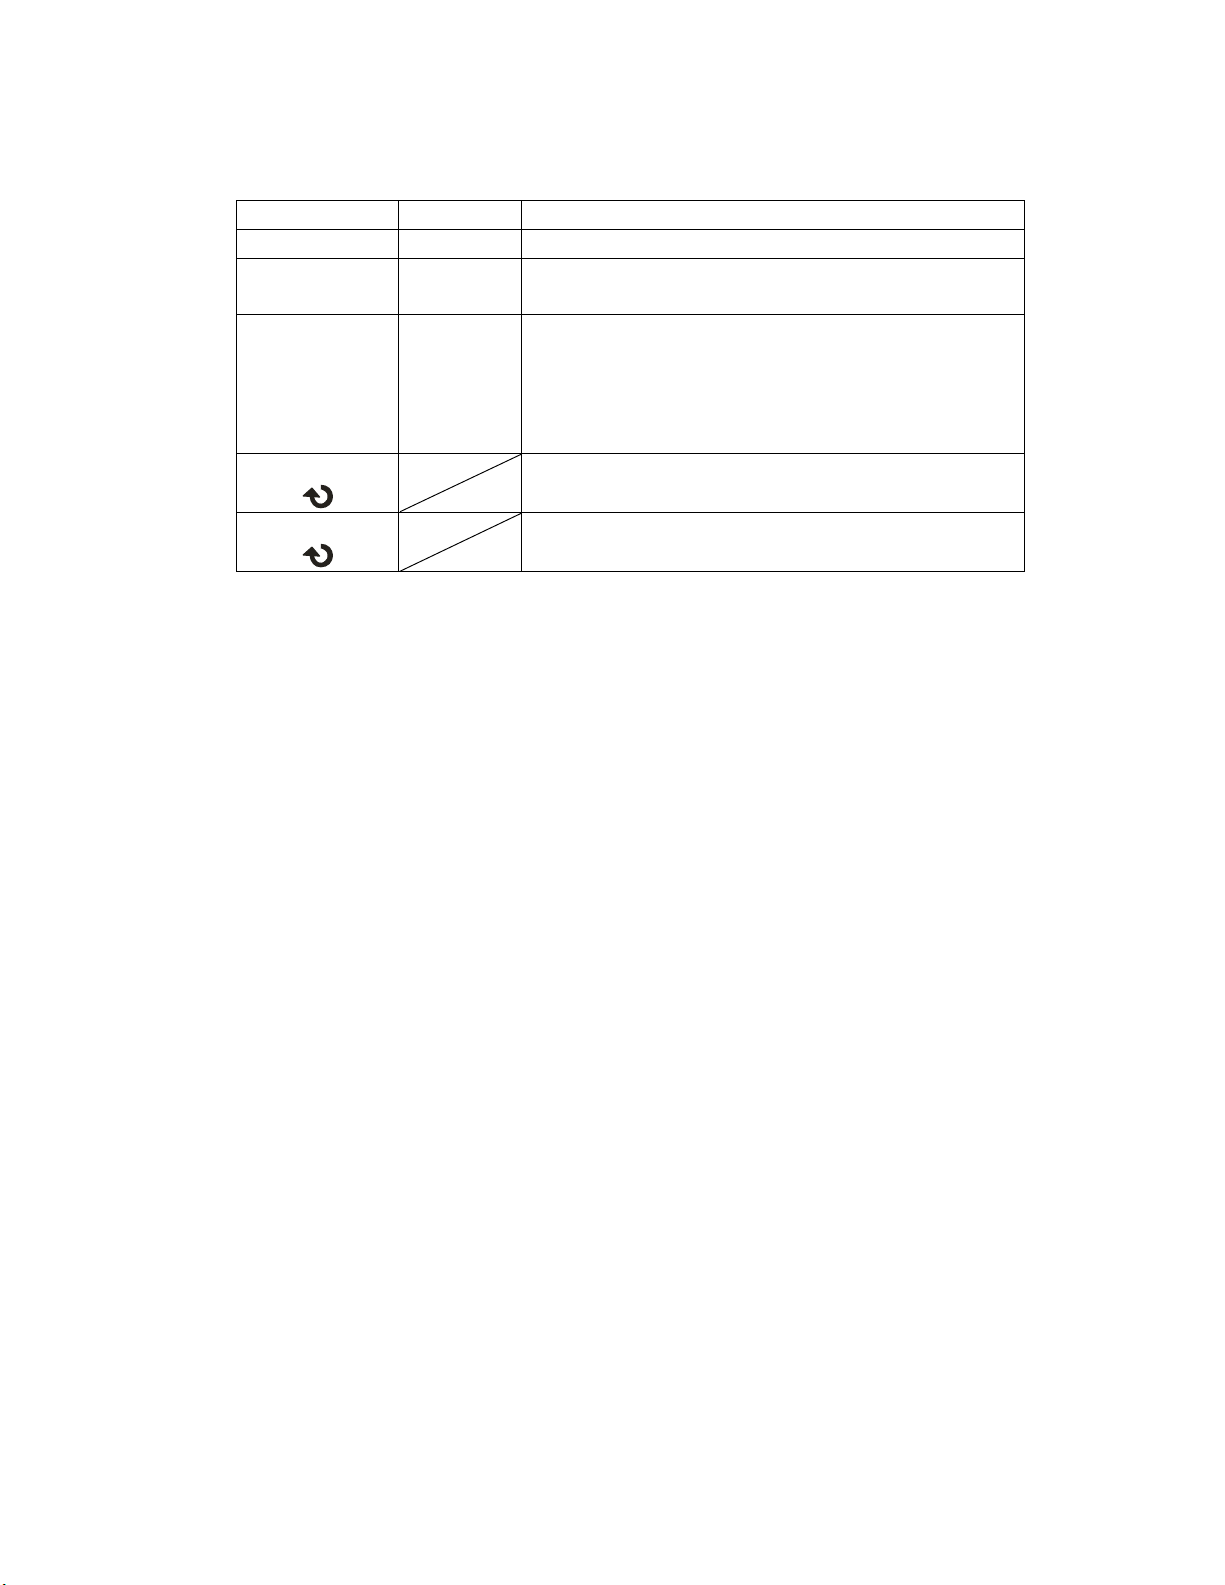
Table 2-1 Auto Set function Menu:
Option
Description
Multi-cycle sine
Auto set the screen and display several cyc
signal.
Single-cycle sine
Set the screen and auto display single cyc
signal.
Rising edge
Auto set and show the rising time.
Falling edge
Auto set and show the falling time.
Undo Setup
Causes the oscilloscope to recall the
previous setup.
Auto set determines the trigger source based on the following conditions:
● If multiple channels have signals, channel with the lowest frequency signal.
● No signals found, the lowest-numbered channel displayed when Auto set was invoked
● No signals found and no channels displayed, oscilloscope displays and uses channel
1.
Table 2-2 Auto set the function item
Function
Setting
Page 16

14
Acquire Mode
Adjusted to Sampling
Display Format
Y-T
Display Type
Set to Dots for a video signal, set to Vectors for
an FFT spectrum; otherwise, unchanged
Vertical Coupling
Adjusted to DC or AC according to the input
signal
Bandwidth Limit
Off(full)
V/div
Adjusted
VOLTS/DIV adjustability
Coarse
Signal inverted
Off
Horizontal position
Center
S/div
Adjusted
Trigger type
Edge
Trigger source
Auto detect the channel which has the input
signal
Trigger slope
Rising
Trigger mode
Auto
Trigger coupling
DC
Trigger holdoff
Minimum
Trigger level
Set to 50%
2.4 Default Setup
The oscilloscope is set up for normal operation when it is shipped from the factory. This
is the default setup. To recall this setup, press the DEFAULT SETUP button. The options,
buttons and controls that change settings when you press the DEFAULT SETUP button,
refer to appendix B.
The DEFAULT SETUP button does not reset the following settings:
● Language option
● Saved reference waveform files
● Saved setup files
● Display contrast
● Calibration data
Page 17

15
2.5 Universal Knob
Picture 2-5 Universal Knob
You can use the Universal knob with many functions, such as adjusting the holdoff
time, moving cursors, setting the pulse width, Setting the Video Linage, adjusting
the upper and lower frequency limit, adjust X and Y masks when using the pass/fail
function etc. You can also turn the “Universal” knob to adjust the storage position of
setups, waveforms, pictures when saving/recalling and to select menu options.
2.6 Vertical System
The vertical control could be used for displaying waveform, rectify scale and position.
Picture 2.6-1
Volt/div Knob
Vertical Position
Knob
Page 18

16
2.6.1 CH1, CH2 Channel
Table 2-1 CH1, CH2 function menu 1:
Option
Setting
Introduction
Coupling
DC
AC
GND
DC passes both AC and DC components of
the input signal.
AC blocks the DC component of the input
signal and attenuates signals below 10 Hz.
GND disconnects the input signal.
BW limit
On
Off
Limits the bandwidth to reduce display noise;
filters the signal to reduce noise and other
unwanted high frequency components.
Volts/Div
Coarse
Fine
Selects the resolution of the Volts/Div knob
Coarse defines a 1-2-5 sequence.
Fine changes the resolution to small steps
between the coarse settings.
Probe
1X,5X
10X,50X
100X,
500X,1000X
Set to match the type of probe you are using
to ensure correct vertical readouts.
Next Page
Page 1/3
Enter the second page of the menu.
Table 2-4 CH1, CH2 function menu 2:
Option
Setting
Instruction
Invert
on
off
Turn on invert function.
Turn off invert function.
Digital Filter
Press this button to enter the “Digital Filter
menu”.(See table 2-5)
Next Page
Page 2/3
Enter the second page of the menu.
Table 2-5 Digital Filter function menu:
Option
Setting
Introduction
Digital Filter
On
Off
Turn on the digital filter.
Turn off the digital filter.
Type
Setup as LPF (Low Pass Filter).
Setup as HPF (High Pass Filter).
Setup as BPF (Band Pass Filter).
Setup as BRF (Band Reject Filter).
Upper_limit
Turn the “Universal” knob to set upper limit.
Lower_limit
Turn the “Universal” knob to set lower limit.
Return
Return the digital filter main menu.
Page 19

17
Setting CH1, CH2 Channels
Each channel has its own separate Menu. The items are set up separately
according to each channel.
1. Choosing Coupling
Take the CH1 for example; the tested signal is a sine wave signal with DC deflection:
● Press“CH1”→“Coupling”→“AC”, Set to AC couple mode. It blocks the DC component
of the input signal.
● Press“CH1”→“Coupling”→“DC”, Set to DC couple mode. Both DC and
AC component could be obstructed.
● Press“CH1”→“Coupling”→“GND”, Set to GROUND mode. It disconnects the input
signal.
Picture 2.6-2
2. Bandwidth Limiting
Take the CH1 for example; the tested signal is a pulse signal with the high frequency
surge:
● Press “CH1”→“BW Limit”→ “On”Set the band width Limited to open state. The high
frequency component which is higher than 20 MHz obstructed.
● Press“CH1”→“BW Limit”→ “Off”, Set bandwidth Limited to close state, the High
Set to DC
Coupling
DC Status
Page 20

18
Frequency component in the tested signal could pass.
Picture 2.6-3
3. Adjust Sensitivity
Vertical scale adjusting has Coarse and Fine two modes, Vertical sensitivity range is
2mV/div10V/div scale.
Take the CH1 for example:
● Press “CH1”→“Volts/Div”→“Coarse”. It is the default setting of Volts/Div, and it makes
the vertical scaling in a 1-2-5-step sequence from 2mv/div, 5mv/div, 10mv/div to 10v/div.
● Press “CH1”→“Volts/Div”→“Fine”. This setting changes the vertical to small steps
between the coarse settings. It will be helpful when you need to adjust the waveform
vertical size in smooth steps.
Picture 2.6-4
Set BW
to 20MHz
BW Limit Symbol
Set to
Coarse
Page 21

19
4. Setting Probe Attenuation
In order to assort the attenuation coefficient, you need to response in the channel
operation Menu. If the attenuation coefficient is 10:1, the input coefficient should be set
to 10X, so that the mistake of the Volts/div information and measure testing should be
forbidden.
Take the CH1 for example, when you use the 100:1 probe:
● Press“CH1”→“Probe” →“100”
Picture 2.6-5
5. Inverting waveforms
Take the CH1 for example:
● Press“CH1”→Next Page“ page1/3” →“Invert”→“On”:
Probe
Attenuation
Factor
Status of 50X
Page 22

20
Picture 2.6-6
6. Using the Digital Filter
Press “CH1”→“Next Page page1/3”→ “Filter”, display the digital filter menu. Select
“Filter Type”, then select “Upper Limit” or “Lower Limit” and turn the “Universal” knob to
adjust them.
● Press “CH1”→“Next Page page1/3”→ “Filter” →“Off”. Turn off the Digital Filter
function.
Picture 2.6-7
● Press “CH1”→ “Next Page page1/3”→ “Filter” → “On”. Turn on the Digital Filter
Page 23

21
function.
Picture 2.6-8
2.6.2 Using Vertical “Position” Knob and “Volt/div” Knob
■ Vertical “POSITION” Knob
1. Use the Vertical “POSITION” knobs to move the channel waveforms up or down on
the screen. This button’s resolution is variety as per the vertical scale.
2. When you adjust the vertical position of channels waveforms, the vertical position
information will display on the left bottom of screen. For example “Volts
Pos=24.6mV”.
3. Press the vertical “POSITION” knob to set the vertical position to zero.
■ “Volts/div” Knob
1. Use the “Volts/div” knobs to control how the oscilloscope amplifies or attenuates the
source signal of channel waveforms. When you turn the “volts/div” knob, the
oscilloscope increases or decreases the vertical size of the waveform on the screen with
respect to the ground level;
2. When you press the “Volt/div” Knob, you can switch “Volt/div” option between “Coarse”
Page 24

22
and “Fine”. The vertical scale is made sure by the 1-2-5 step in the Coarse. Increase in
the clockwise, reduce in the anticlockwise. In the fine mode, the knob changes the
Volts/Div scale in small steps between the coarse settings. Increase in the clockwise,
reduce in the anticlockwise.
2.6.3 Math Functions
Math shows the results after +,-,*, / and FFT operations of the CH1 and CH2.
Press the MATH button to display the waveform math operations. Press the MATH
button again to remove the math waveform display.
Table 2-6 MATH function menu:
Function
Setting
Introduction
Operation
+ - * / FFT
Math operates between signal source
CH1 and CH2.
Invert
on
off
Invert the MATH waveform.
Turn off MATH Invert function.
Adjust the vertical position of the math
waveform by using universal knob.
Adjust the range of the math waveform
by using universal knob.
Table 2-7 MATH function instruction
Operation
Setting
Introduction
+
CH1+CH1
CH1 waveform adds CH2 waveform.
-
CH1-CH2
The channel 2 waveform is subtracted
from the channel 1 waveform.
CH2-CH1
The channel 1 waveform is subtracted
from the channel 2 waveform.
*
CH1*CH2
Channel 1 multiply Channel 2.
/
CH1/CH2
Channel 1 divides Channel 2.
CH2/CH1
Channel 2 divides Channel 1.
FFT
Fast Fourier Transform.
Page 25

23
Picture 2.6-9 Math Waveform
1. FFT Spectrum Analyzer
The FFT process mathematically converts a time-domain signal into its frequency
components. You can use the Math FFT mode to view the following types of signals:
● Analyze the Humorous wave in the Power cable.
● Test the Humorous content and distortion in the system
● Show the Noise in the DC Power supply
● Test the filter and pulse response in the system
● Analyze vibration
Table 2-8 FFT function menu 1:
FFT Option
Setting
Introduction
Source
CH1, CH2
Select this channel as the FFT source.
Window
Hanning
Hamming
Rectangular
Blackman
Select FFT window types.
Page 26

24
FFT ZOOM
1X
2X
5X
10X
Changes the horizontal magnification of
the FFT display.
Next Page
Page 1/2
Enter the second page of FFT menu.
Table 2-9 FFT function menu 2:
FFT Option
Setting
Introduction
Scale
Vrms
Set Vrms to be the Vertical Scale unit.
dBVrms
Set dBVrms to be the vertical Scale unit.
Display
Split
Full screen
Display FFT waveform on half screen.
Display FFT waveform on full screen.
Next Page
Page 2/2
Return the first page of FFT menu.
To use the Math FFT mode, you need to perform the following tasks:
1. Set up the source (time-domain) waveform.
● Press the AUTO button to display a YT waveform.
● Turn the vertical “POSITION” knob to move the YT waveform to the center vertically
(zero divisions).
● Turn the horizontal “POSITION” knob to position the part of the YT waveform that you
want to analyze in the center eight divisions of the screen.
The oscilloscope calculates the FFT spectrum using the center 1024 points of the
time-domain waveform.
● Turn the “Volts/div” knob to ensure that the entire waveform remains on the screen.
● Turn the “S/div” knob to provide the resolution you want in the FFT spectrum.
● If possible, set the oscilloscope to display many signal cycles.
To display FFT correctly, follow these steps:
1. Push the “MATH” button.
2. Set the “Operation” option to FFT.
3. Press “Source” button to select “CH1” or “CH2” according to input signal channel.
4. According to Nyquist law, turn the “S/div” knob to adjust the sampling rate (This
parameter is displayed behind the time base parameter) is at least double than input
signal frequency.
Page 27

25
2. Displaying the FFT Spectrum
Press the MATH button to display the Math Menu. Use the options to select the Source
channel, Window algorithm, and FFT Zoom factor. You can display only one FFT
spectrum at a time. You can select “Full screen” or “Split” in “Display” option to display
FFT waveform on full screen or display channel waveform and its FFT waveform on half
screen at a time.
Picture2.6-10 FFT function
3. Select FFT window
Windows reduce spectral leakage in the FFT spectrum. The FFT assumes that the YT
waveform repeats forever. With an integral number of cycles, the YT waveform starts
and ends at the me amplitude and there are no discontinuities in the signal shape A
non-integral number of cycles in the YT waveform causes the signal start and end points
to be at different amplitudes. The transitions between the start and end points cause
discontinuities in the signal that introduce high-frequency transients.
According to the tested options and source speciality, make sure the window you
need to use.
Table 2-10 FFT window instruction
Window
Speciality
Satisfied Test content
Rectangulr
Best frequency
resolution, worst
magnitude resolution.
This is essentially the
Symmetric transients or bursts.
Equal-amplitude sine waves
with fixed frequencies.
Broadband random noise with
Page 28

26
same as no window.
a relatively slowly varying
spectrum.
Hanning
Hamming
Better frequency, poorer
magnitude accuracy
than Rectangular.
Hamming has slightly
better frequency
resolution than Hanning.
Sine, periodic, and
narrow-band random noise.
Asymmetic transients or
bursts.
Blackman
Best magnitude, worst
frequency resolution.
Single frequency waveforms,
to find higher order harmonics.
4. Magnifying and Positioning an FFT Spectrum
You can magnify and use cursors to take measurements on the FFT spectrum. The
oscilloscope includes an “FFT Zoom” option to magnify horizontally, press this option
button to select “1X”, “2X”, “5X” or “10X”. Moreover, you also can turn the “Universal”
knob to magnify FFT waveform horizontally in a 1-2-5 step. To magnify vertically; you
can turn the “Volts/div” knob.
5. Measuring an FFT Spectrum Using Cursors
You can take two measurements on FFT spectrums: magnitude (in dB) and frequency
(in Hz). Magnitude is referenced to 0 dB, where 0 dB equals 1 VRMS. You can use the
cursors to take measurements at any zoom factor. (Refer to cursor measure2.11.2)
Use horizontal cursors to measure amplitude and vertical cursors to measure
frequency.
If you input a sine signal to channel 1, follow these steps:
1. Measure FFT Amplitude
1) Input a sine signal to channel 1, and press the “AUTO” button.
Page 29

27
2) Press the “MATH” button to enter the “MATH” menu.
3) Press the “Operation” option button to select “FFT”.
4) Press the “Source” option button to select “CH1”.
5) Press CH1 button to display CH1 menu.
6) Turn the “S/div” knob to adjust sampling rate (at least double bigger than frequency
of input signal).
7) If FFT display on full screen, press CH1 button again to remove channel waveform
display.
8) Press the “CURSOR” button to enter “Cursor” menu.
9) Press the “Cursor Mode” button to select “Manual”.
10) Press the “Type” option button to select “Voltage”.
11) Press the “Source” option button to select “MATH”.
12) Press the “CurA” option button; turn the “Universal” knob to move Cursor A to the
highest point of the FFT waveform.
13) Press the “CurB” option button, turn the “Universal” knob to move Cursor B to the
lowest point of the FFT waveform.
14) The amplitude (T) displays on the top of the left screen.
Picture 2.6-11
2. Measure FFT Frequency
Page 30

28
1) Press the CURSOR button.
2) Press the “Cursor Mode” button to select “Manual”.
3) Press the “Type” option button to select “Time”.
4) Press the “Source” option button to select “MATH”.
5) Press the “CurA” option button, turn the “Universal” button to move Cursor A to the
highest position of the FFT waveform.
6) The value of CurA displaying on the top of the left screen is FFT highs frequency.
This frequency should be the same as input signal frequency.
Picture 2.6-12
2.6.4 Using Ref
The reference control saves waveforms to a nonvolatile waveform memory. The
reference function becomes available after a waveform has been saved.
Table 2-11 REF function menu
Option
Setting
Introduction
Source
CH1,CH2,
CH1 off
CH2 off
Choose the waveform display to store.
REFA
REFB
Choose the reference location to store or recall
a waveform.
Save
Stores source waveform to the chosen
reference location.
Page 31

29
REFA
REFB
on
off
Recall the reference waveform on the screen.
Turn off the reference waveform.
Press the Ref button to display the “Reference waveform menu”.
Picture 2.6-13
Operation step
1. Press the “REF” menu button to display the “Reference waveform menu”.
2. Press the “Source” option button to select input signal channel.
3. Turn the vertical “POSITION” knob and “Volt/div” knob to adjust the vertical
position and scale to conformable positions.
4. Press the third option button to select “REFA” or “REFB” as storage position.
5. Press the “Save” option button.
6. Press the bottom option button to select “REFA On” or “REFB On” to recall the
reference waveform.
Page 32

30
Picture 2.6-14
2.7 Horizontal System
As follow Picture, there are one button and two knobs in the HORIZONTAL area.
Picture 2.7-1
Table 2- 12 SDS1000CML Horizontal system function menu:
Option
Setting
Description
Delayed
On
Off
Turn on this function that main timebase
waveform display on the top half screen and
window timebase waveform display on the
below half screen at the same time.
Turn off this function that only display main
Horizontal
position knob
S/div knob
Page 33

31
timebase waveform on the screen.
MemDepth
Normal
Long Mem
Set memory depth to normal.
Set memory depth to long Memory depth in
order to get more waveform dots.
Note: If Set memory depth to normal mode, the memory depth is 40Kpts
If Set memory depth to Long Mem mode, the memory depth is 2Mpts
MemDepth Detailed Specification
Memory
Depth
Channel Mode
Samping
Rate
Short
Memory
Long Memory
Single Channel
1Gsa/s
40kpts
No Support
Single Channel
500MSa/s
or lower
20kpts
2Mpts
Double
Channels
500MSa/s
or lower
20kpts
1Mpts
2.7.1 Horizontal Control Knob
You can use the horizontal controls to change the horizontal scale and position of
waveforms. The horizontal position readout shows the time represented by the center
of the screen, using the time of the trigger as zero. Changing the horizontal scale causes
the waveform to expand or contract around the screen center.
■ Horizontal “POSITION” Knob
1. Adjust the horizontal position of all channels and math waveforms (the position of the
trigger relative to the center of the screen). The resolution of this control varies with the
time base setting.
2. When you press the horizontal “POSITION” Knob, you can set the horizontal position
to zero.
■“S/div” Knob
1. Using to change the horizontal time scale to magnify or compress the waveform. If
waveform acquisition is stopped (using the RUN/STOP or SINGLE button), turn the
S/div knob to expand or compress the waveform.
Page 34

32
2. Select the horizontal time/div (scale factor) for the main or the window time base.
When Window Zone is enabled, it changes the width of the window zone by changing
the window time base.
■ Display Scan Mode
When the SEC/DIV control is set to100 ms/div or slower and the trigger mode is set to
Auto, the oscilloscope enters the scan acquisition mode. In this mode, the waveform
display updates from left to right. There is no trigger or horizontal position control of
waveforms during scan mode.
2.7.2 Window Zone
Use the Delayed option to define a segment of a waveform to see more detail. The
Window time base setting cannot be set slower than the Main time base setting.
You can turn the Horizontal Position and SEC/DIV controls to enlarge or diminish
waveforms in the Window Zone.
“M” Mean main time base, “W” mean window time base.. It is also a arrow on the scale
top to show the vertical position.
If you want to see a section of the waveform in detail, follow these steps:
(1) Press the “HORI MENU” button to enter the “Horizontal menu”.
(2) Turn the “S/div” knob to change the main timebase scale.
(3) Press the “Delayed” option button to select “On”.
Page 35

33
Picture2.7-2
(4) Turn the “Horizontal Position” knob (adjust window’s position) to select the
window that your need and expanded window waveform display on the below
half screen at the same time.
2.8 Trigger System
The trigger determines when the oscilloscope starts to acquire data and display a
waveform. When a trigger is set up properly, the oscilloscope converts unstable displays
or blank screens into meaningful waveforms.
There are three buttons and one knob in the Trigger area. See picture.2-29:
Picture 2.8-1
■“TRIG MENU” Button: Press the “TRIG MENU” button to display “Trigger Menu”.
■“LEVEL” Knob: The LEVEL knob is to set the corresponding signal voltage of trigger
point in order to sample. Press the “LEVEL” knob can set trigger level to zero.
■“SET TO 50” Button: Use the “SET TO 50%” button to stabilize a waveform quickly.
The oscilloscope can set the Trigger Level to be about halfway between the minimum
and maximum voltage levels automatically. This is useful when you connect a signal to
the EXT TRIG BNC and set the trigger source to Ext or Ext/5.
■“FORCE” Button: Use the FORCE button to complete the current waveform
acquisition whether the oscilloscope detects a trigger or not. This is useful for SINGLE
acquisitions and Normal trigger mode.
LEVEL knob
Page 36

34
■ Pre-trigger/Delayed trigger: The data before and after trigger the trigger position is
typically set at the horizontal center of the screen, in the full-screen display the 6div data
of pre-trigger and delayed trigger can be surveyed. More data of pre-trigger and 1s
delayed trigger can be surveyed by adjusting the horizontal position.
The feature is very useful because you can see the events that led up the trigger point
everything to the right of the trigger point is called posttrigger information the amount of
delay range (pre-trigger and posttrigger information) available is dependent on the
sweep speed selected.
2.8.1 Signal Source
You can use the Trigger Source options to select the signal that the oscilloscope uses
as a trigger. The source can be any signal connected to a channel BNC, to the EXT TRIG
BNC or the AC power line (available only with Edge triggers).
2.8.2 Trigger Type
The scopes have five trigger types: Edge, Video, Pulse, Slope, and Alternative
Edge Trigger
Use Edge triggering to trigger on the edge of the oscilloscope input signal at the trigger
threshold.
Table 2-13 Edge Trigger function Menu:
Option
Setting
Explain
Type
Edge
With Edge highlighted, the rising or falling edge of the
input signal is used for the trigger.
Source
CH1
CH2
Triggers on a channel whether or not the waveform is
displayed.
Page 37

35
EXT
Does not display the trigger signal; the Ext option uses
the signal connected to the EXT TRIG front-panel
BNC and allows a trigger level range of -1.2V to +1.2V.
EXT/5
Same as Ext option, but attenuates the signal by a
factor of five, and allows a trigger level range of +6V to
-6V.This extends the trigger level range.
AC Line
This selection uses a signal derived from the power
line as the trigger source; trigger coupling is set to DC
and the trigger level to 0 volts.
Slope
Trigger on Rising edge of the trigger signal.
Trigger on Falling edge of the trigger signal.
Trigger on Rising edge and Falling edge of the trigger
signal.
Mode
Auto
Use this mode to let the acquisition free-run in the
absence of a valid trigger; This mode allows an
untriggered, scanning waveform at 100 ms/div or
slower time base settings.
Normal
Use this mode when you want to see only valid
triggered waveforms; when you use this mode, the
oscilloscope does not display a waveform until after
the first trigger.
Single
When you want the oscilloscope to acquire a single
waveform, press the “SINGLE ”button.
Set up
Enter the “Trigger Setup Menu” (See table 2-14).
Table 2-14 Trigger Setup function menu
Option
Setting
Explain
Coupling
DC
Passes all components of the signal
AC
Blocks DC components attenuates signals
below 50 Hz.
HF Reject
Attenuates the high-frequency components
above 150 kHz.
LF Reject
Blocks the DC component , attenuates the
low-frequency components below kHz.
Holdoff
Using the “universal” knob to adjust holdoff
time(sec)the holdoff value is displayed.
Holdoff
Reset
Reset holdoff time to 100ns.
Return
Return the first page of “Trigger main menu”.
The image
cannot be
The image
cannot be
Page 38

36
Picture2.8-2
Operate Instruction:
1. Set up Type
1) Press the “TRIG MENU” button to display “Trigger” menu.
2) Press the “Type” option button to select “Edge”.
2. Set up Source
According to input signal, press the “Source” option button to select “CH1”,
“CH2”,“EXT”, “EXT/5”or “AC Line”.
3. Set up Slope
Press the “Slope” option button to select “ ”, “ ” or “ ”.
4. Set up Trigger mode
Press the “Trigger mode” option button to select “Auto”, “Normal”, “Single”.
Auto: The waveform refresh at a high speed whether the trigger condition is
satisfied or not.
Normal: The waveform refresh when the trigger condition is satisfied and waits for
next trigger event occurring when the trigger condition is not satisfied.
Single: The oscilloscope acquire a waveform when the trigger condition is
satisfied and then stops.
5. Set up Trigger coupling
a. Press the “Set up” button to enter the “Trigger Setup Menu”.
b. Press the “Coupling” option button to select “DC”, “AC”, “HF Reject” or “LF
Reject”.
The image
cannot be
The image
cannot be
Page 39

37
■ Pulse Trigger: Use Pulse Width triggering to trigger on aberrant pulses.
Table 2-15 Pulse Trigger function Menu 1
Option
Setting
Explain
Type
Pulse
Select the pulse to trigger
the pulse match the trigger
condition.
Source
CH1
CH2
EXT
EXT/5
Select input signal source.
When
(Positive pulse width less
than pulse width setting)
(Positive pulse width larger
than pulse width setting)
(Positive pulse width equal
to pulse width setting)
(Negative pulse width less
than pulse width setting)
(Negative pulse width larger
than pulse width setting)
(Negative pulse width equal
to pulse width setting)
Select how to compare the
trigger pulse relative to the
value selected in the Set
Pulse Width option.
Set
Width
20.0ns10.0s
Selecting this option can
turn the universal to set up
the pulse width.
Next
Page
Page 1/2
Press this button to enter
the second page.
Page 40

38
Picture 2.8-3
Table 2-16 Pulse Trigger function Menu 2
Option
Setting
Explain
Type
Pulse
Select the pulse to trigger the pulse match the
trigger condition.
Mode
Auto
Normal
single
Select the type of triggering; Normal mode is
best for most Pulse Width trigger applications.
Set up
Enter the “Trigger setup menu”.
Next Page
Page 2/2
Press this button to return the first page.
Picture 2.8-4
Operate Instruction:
1. Set up Type
1) Press the “TRIG MENU” button to display “Trigger menu”.
2) Press the “Type” option button to select “Pulse”.
2. Set up condition
Press the “When” option button to select “ ”,“ ”,
“ ”,“ ”,“ ”or“ ”
3. Set up pulse width
Turn the “Universal” knob to set up width.
Page 41

39
Video TriggerTrigger on fields or lines of standard video signals.
Table 2-17 Functional Manu of Video Trigger 1:
Option
Setting
Instruction
Type
Video
When you select the video type, put the
couple set to the AC, then you could trigger
the NTSC,PAL and SECAM video signal.
Source
CH1
CH2
Select the input source to be the trigger
signal.
EXT
EXT/5
Ext and Ext/5 use the signal applied to the
EXT TRIG connector as the source.
Polarity
(Normal)
Normal triggers on the negative edge of
the sync pulse.
(Inverted)
Inverted triggers on the positive edge of
the sync pulse.
Sync
Line Num
All lines
Odd field
Even Field
Select appropriate video sync.
Next Page
Page 1/2
Enter the second page of “Video
trigger menu”.
Table 2-18 Functional Manu of Video Trigger 2:
Option
Setting
Instruction
Type
Video
When you select the video type, put
the couple set to the AC, then you
could trigger the NTSC,PAL and
SECAM video signal.
Standard
NTSC
Pal/Secam
Select the video standard for sync and
line number count.
Mode
Auto
Use this mode to let the acquisition
free-run in the absence of a valid
trigger; This mode allows an
untriggered, scanning waveform at
100 ms/div or slower time base
settings.
Page 42

40
Normal
Use this mode when you want to see
only valid triggered waveforms; when
you use this mode, the oscilloscope
does not display a waveform until after
the first trigger.
Single
when you want the oscilloscope to
acquire a single waveform, press the
“SINGLE ”button.
Set up
Enter the “Trigger setup menu”.
Next Page
Page 2/2
Return the first page of “Video Trigger
menu”.
Picture 2.8-5
Operate Instruction
1. Set up Type
1) Press the “TRIG MENU” button to display “Trigger” menu.
2) Press the “Type” option button to select “Video”.
2. Set up Polarity
Press the “Polarity” option button to select “ ” or “ ”.
3. Set up synchronization
1) Press the “Sync” option button to select “All Lines”, “Line Num”, “Odd Field”, and
“Even Field”.
2) If you select “Line Num”, you can turn the “Universal” knob to set the appointed
line number.
Page 43

41
4. Set up Standard
1) Press the “Next Page Page 2/2” option button.
2) Press the “Standard” option button to select “PAL/SECAM” or “NTSC”.
Slope Trigger Trigger on positive slope of negative slope according to setup time
of the oscilloscope.
Table 2-19 Slope trigger function menu 1
Option
Setting
Instruction
Type
Slope
Trigger on positive slope of negative slope
according to setup time of the oscilloscope.
Source
CH1
CH2
EXT
EXT/5
Select trigger source.
When
Select trigger condition.
Time
Set time
Turn the “Universal” knob to set slope time.
Time setup range is 20ns-10s.
Next Page
Page 1/2
Enter the second page of slope trigger.
The image
cannot be
The image
cannot be
The image
cannot be
The image
cannot be
The image
cannot be
The image
cannot be
Page 44

42
Picture 2.8-6
Table 2-20 Slope trigger function menu 2
Option
Setting
Instruction
Type
Slope
Trigger on positive slope of negative slope
according to setup time of the oscilloscope.
Vertical
Select the trigger level that can be adjusted by
“LEVEL” knob. You can adjust “LEVEL A”,
“LEVEL B” or adjust them at the same time.
Mode
Auto
Use this mode to let the acquisition free-run in the
absence of a valid trigger; This mode allows an
untriggered, scanning waveform at 100 ms/div or
slower time base settings.
Normal
Use this mode when you want to see only valid
triggered waveforms; when you use this mode,
the oscilloscope does not display a waveform
until after the first trigger.
Single
When you want the oscilloscope to acquire a
single waveform, press the “SINGLE” button.
Set up
Enter “Trigger setup menu” (See table 2-14).
The image
cannot be
The image
cannot be
The image
cannot be
The image
cannot be
The image
cannot be
The image
cannot be
Page 45

43
Next Page
Page 2/2
Return the first page of slope trigger.
Picture 2.8-7
Operate Instruction:
Follow the next steps if you select “Slope trigger”:
1. Input a signal to CH1 or CH2.
2. Press the “AUTO” button.
3. Press the “TRIG MENU” button to enter “Trigger menu”.
4. Press the “Type” option button to select “Slope”.
5. Press the “Source” option button to select “CH1” or “CH2”.
6. Press the “When” option button to select “ ”, “ ”, “ ”, “ ”,
“ ” “ ”.
7. Press the “Time” button, turn the “Universal” knob to adjust slope time.
8. Press the “Next Page Page 1/2” option button to enter the second page
of “Slope trigger menu”.
9. Press the “Vertical” option button to select trigger level that can be adjusted.
10. Turn the “LEVEL” knob.
Alternative trigger
The image
cannot be
The image
cannot be
The image
cannot be
The image
cannot be
The image
cannot be
The image
cannot be
Page 46

44
The trigger signal comes from two vertical channels when you use alternative trigger.
In this mode, you can observe two irrelative signals at the same time. You can select
different trigger types for two vertical signals, and selected types cover edge, pulse,
video and slope trigger. Trigger information of two channel signals display on the bottom
right of the screen.
Picture 2.8-8
Table 2-21 Set trigger mode to edge trigger function menu 1:
Option
Setting
Instruction
Type
Alternative
When use alternative trigger, the trigger signal
comes from two vertical channels. In the mode, you
can observe two irrelative signals at a time.
Chann
els
CH1-CH2
Set the trigger channels
Source
CH1
CH2
Set trigger type information for CH1 signal
Set trigger type information for CH2 signal
Mode
Edge
Set trigger type of vertical channel signal to edge
Slope
Triggering on rising edge.
Triggering on falling edge.
Triggering on rising edge and falling edge.
Set up
Enter “Trigger setup menu” (See table 2-14).
The image
cannot be
The image
cannot be
Page 47

45
Table 2-22 Set trigger mode to pulse trigger function menu 1:
Option
Setting
Instruction
Type
Alternative
The trigger signal comes from two vertical
channels when you use alternative trigger. In
this mode, you can observe two irrelative
signals at the same time.
Source
CH1
CH2
Set trigger type information for CH1 signal
Set trigger type information for CH2 signal
Mode
Pulse
Set trigger type of the vertical channel signal to
Pulse trigger.
When
Select how to compare the trigger pulse relative
to the value selected in the Set Pulse Width
option.
Next Page
Page 1/2
Enter the second page of Alternative trigger
menu.
Table 2-23 Set trigger mode to pulse trigger function menu 2:
Option
Setting
Explain
Set Width
20.0ns
10.0s
Selecting this option can turn the universal to
set up the pulse width.
Set up
Enter the “Trigger Setup Menu”(see table
2-14).
Next Page
Page 2/2
Press this button to return the first page.
Table 2-24 Set trigger mode to video trigger function menu1:
Option
Setting
Instruction
Type
Alternative
The trigger signal comes from two vertical
channels when you use alternative trigger. In
this mode, you can observe two irrelative
signals at the same time.
Source
CH1
CH2
Set trigger type information for CH1 signal
Set trigger type information for CH2 signal
Mode
Video
Set trigger type of the vertical channel signal
to Video trigger.
Page 48

46
Polarity
(Normal)
(Inverted)
Normal triggers on the negative edge of the
sync pulse.
Inverted triggers on the positive edge of the
sync pulse.
Next
Page
Page 1/2
Enter the second page of Alternative trigger
menu.
Table 2-25 Set trigger mode to video trigger function menu 2:
Option
Setting
Instruction
Sync
Line Num
All lines
Odd field
Even Field
Select appropriate video sync.
Standard
NTSC
Pal/Secam
Select the video standard for sync and line
number count.
Next
Page
Page 1/2
Enter the second page of Alternative trigger
menu.
Table 2-26 Set trigger mode to slope trigger function menu 1
Option
Setting
Instruction
Type
Alternative
The trigger signal comes from two vertical
channels when you use alternative trigger. In
this mode, you can observe two irrelative
signals at the same time.
Source
CH1
CH2
Set trigger type informa
tion for CH1 signal
Set trigger type information for CH2signal
Mode
Slope
Set trigger type of the vertical channel signal to
slope trigger.
When
Select slope trigger condition.
Next Page
Page 1/2
Enter the second page of the alternative
trigger.
Table 2-27 Set trigger mode to slope trigger function menu 2
Option
Setting
Instruction
Time
Set time
Turn the “Universal” knob to set the slope
time. Time setup range is 20ns-10s.
Vertical
Select the trigger level that can be adjusted by
The image
cannot be
The image
cannot be
The image
cannot be
The image
cannot be
The image
cannot be
The image
cannot be
Page 49

47
“LEVEL” knob. You can adjust “LEVEL A”,
“LEVEL B” or adjust them at the same time.
Set up
Enter “Trigger setup menu”(see table 2-14).
Next Page
Page 2/2
Return to the first page of “Alternative trigger
menu”.
Operate Instruction:
Observe two irrelative channel signals, follow these steps
1. Input two irrelative signals to channel 1and channel 2.
2. Press the AUTO button.
3. Press the TRIG MENU button to enter “trigger menu”.
4. Press the “Type” option button to select “Alternative”.
5. Press the “Channels” option button to select “CH1-CH2”
6. Press the “Source” option button to select “CH1”.
7. Press the CH1 button and turn the “S/div” knob to optimize waveform display.
8. Press “Mode” option button to select “Edge”, “Pulse”, “Slope” or “Video”.
9. Set the trigger according to trigger edge.
10. Press the “Source” option button to select “CH2”.
11. Press the CH2 button and turn the “S/div” knob to optimize waveform display.
12. Repeat steps 8 and 9.
2.8.3 Coupling
Use the “Coupling” to make sure the signal that passes the trigger circuit. It is useful for
us to gather a steady wave form.
If you use the trigger coupling, you should press the “TRIGGER” button and then select
“edge”, “Pulse”, “Video” or “Slope” trigger. Then select the “coupling” option in “Set up
menu”.
The image
cannot be
The image
cannot be
The image
cannot be
The image
cannot be
The image
cannot be
Page 50

48
2.8.4 Position
The horizontal position control establishes the time between the trigger position and the
screen center. You can adjust the horizontal “POSITION” knob control to view waveform
data before the trigger, after the trigger, or some of each. When you change the
horizontal position of a waveform, you are changing the time between the trigger and the
center of the display actually. (This appears to move the waveform to the right or left on
the display.)
2.8.5 Slope & Level
The Slope and Level controls help to define the trigger. The Slope option (Edge trigger
type only) determines whether the oscilloscope finds the trigger point on the rising or the
falling edge of a signal.
The TRIGGER LEVEL knob controls where on the edge the trigger point occurs.
Picture 2.8-9
Falling edge
Rising edge
T
r
i
g
g
e
r
l
e
v
e
l
c
a
n
b
e
a
d
j
u
s
t
e
d
v
e
r
t
i
c
a
l
l
y
Note: ● Press the SINGLE button when you want the oscilloscope to
acquire a single waveform.
● Trigger coupling affects only the signal passed to the trigger
system. It does not affect the bandwidth or coupling of the signal
displayed on the screen.
● Normal Polarity Sync triggers always occur on negative-going
horizontal sync pulses. If the video waveform has positive-going
horizontal sync pulses, use the Inverted Polarity selection.
Page 51

49
2.8.6 Trigger Holdoff
You can use the Trigger Holdoff function to produce a stable display of complex
waveforms. Holdoff is time between when the oscilloscope detects one trigger and when
it is ready to detect another. The oscilloscope will not trigger during the holdoff time. For
a pulse train, you can adjust the holdoff time so the oscilloscope triggers only on the first
pulse in the train.
Holdoff time
Trigger position
Trigger level
Picture 2.8-10
If you want to change holdoff time, please follow next operations:
1. Press the “TRIG MENU” button to show the “TRIG Menu”.
2. Press the “Type” option button to select trigger type.
3. Press the “Set up” option button to enter the “Trigger setup menu”.
4. Press the “Holdoff” option buttonturn the “Universal” knob to change the holdoff
time until the waveform trigger steadily.
NoteUse trigger holdoff to help stabilize the display of aperiodic waveforms.
2.9 Acquiring Signals System
Showing as the follow picturethe “ACQUIRE” button for Acquiring Signals system is at
the menu.
Page 52

50
Picture 2.9-1
Table 2-28 The Function manual of Acquiring Signals:
Option
Setting
Introduction
Acquisition
Sampling
Use for sampling and accurately display most
of the waveform.
Peak
Detect
Detect the noise and decrease the possibility
of aliasing.
Average
Use to reduce random or uncorrelated noise in
the signal display.
Averages
4, 16,32
,64,128,
256
Select number of averages.
Sinx/x
On
off
Use sin interpolation
Use linear interpolation
Mode
Equ time
Real time
Set the Sampling mode to Equ time.
Set the Sampling mode to Real time.
Sa Rate
Display system sampling rate.
When you acquire a signal, the oscilloscope converts it into a digital form and displays
a waveform. The acquisition mode defines how the signal is digitized and the time base
setting affects the time span and level of detail in the acquisition.
■ Sampling: In this acquisition mode, the oscilloscope samples the signal in evenly
spaced intervals to construct the waveform. This mode accurately represents signals
most of the time.
Advantage: You can use this mode to reduce random noise.
Disadvantage: This mode does not acquire rapid variations in the signal that may occur
between samples. This can result in aliasing may cause narrow pulses to be missed. In
these cases, you should use the Peak Detect mode to acquire data.
Page 53

51
Picture 2.9-2 Sampling modes
■ Peak Detect: Peak Detect mode capture the maximum and minimum values of a
signal Finds highest and lowest record points over many acquisitions.
Advantage: In this way, the oscilloscope can acquire and display narrow pulses, which
may have otherwise been missed in Sample mode.
Disadvantage: Noise will appear to be higher in this mode.
Picture 2.9-3 Peak Detect mode
■ Average: The oscilloscope acquires several waveforms, averages them, and
Page 54

52
displays the resulting waveform.
Advantage: You can use this mode to reduce random noise.
Picture 2.9-4 Average Mode
■ Equivalent Time Sampling:
The equivalent time sampling mode can achieve up to 20 ps of horizontal resolution
(equivalent to 50GSa/s). This mode is good for observing repetitive waveforms.
■ Real Time Sampling: The scope has the highest Real-time sampling rate
up to 1GSa/s.
■ “RUN/STOP” Button: Press the RUN/STOP button when you want the
oscilloscope to acquire waveforms continuously. Press the button again to stop the
acquisition.
■ “SINGLE” Button: Press the SINGLE button to acquire a single waveform. Each time
you push the SINGLE button, the oscilloscope begins to acquire another waveform.
After the oscilloscope detects a trigger it completes the acquisition and stops.
Page 55

53
When you push the RUN/STOP or SINGLE buttons to start an acquisition, the
oscilloscope goes through the following steps:
1. Acquire enough data to fill the portion of the waveform record to the left of the trigger
point. This is also called the pre-trigger.
2. Continue to acquire data while waiting for the trigger condition to occur.
3. Detect the trigger condition.
4. Continue to acquire data until the waveform record is full.
5. Display the newly-acquired waveform.
■ Time Base: The oscilloscope digitizes waveforms by acquiring the value of an input
signal at discrete points. The time base allows you to control how often the values are
digitized.
Use S/div knob to adjust the time base to a horizontal scale suits your purpose,
■ Time Domain Aliasing
Aliasing occurs when the oscilloscope does not sample the signal fast enough to
construct an accurate waveform record. When this happens, the oscilloscope displays
a waveform with a frequency lower than the actual input waveform, or triggers and
displays an unstable waveform.
Sampl ed poi nt s
Ap p a r e n t l o w- f r e q u e n c y
wa v e f o r m d u e t o a l i a s i n g
Act ual hi gh- f r equency wavef orm
Picture 2.9-5
Page 56

54
Operate Introduction:
Set up Sampling Format
You can press the “Acquisition” option button or turn the “Universal” knob to select
“Sampling” mode, “Peak Detect” mode or “Average” mode..
Set up Averages
When you select “Average” format, you can press the “Averages” option button to select
“4”, “16”, “32”, “64”, “128”or “256”.
Set up function interpolation
You can also turn Sins/x interpolation on or off. Press the corresponding option button
to turn Sins/s on or off.
“Sinx” is sine interpolation
Picture 2.9-6
“X” is linear interpolation.
Page 57

55
Picture 2.9-7
Set up Sampling Mode
Press the “Mode” option button to select “Real Time” or “Equ Time”.
Set up Sampling Rate
Adjust the sampling rate by pressing the “Sa Rate” option button and turning the
Time/div front panel knob. The sampling rate is shown at the corresponding timebase
scale.
2.10 Display System
The display function could be expressed by the “DISPLAY” Button.
Picture 2.10-1
Table 2-29 Display system function menu 1:
Option
Setting
Introduction
Page 58

56
Type
Vectors
Dots
Vectors fill the space between adjacent
sample points in the display.
There is no link between adjacent
sample points.
Persist
Off
1 sec
2 sec
5 sec
Infinite
Sets the length of time each displayed
sample point remains displayed.
Intensity
<Intensity>
Set waveforms’ intensity.
Brightness
<Brightness>
Set grid brightness.
Next Page
Page 1/3
Press this button to enter second page.
Picture 2.10-2
Table 2-30 Display system function menu 2:
Option
Setting
Introduction
Format
YT
XY
YT format displays the vertical voltage in
relation to time (horizontal scale). XY
format displays a dot each time a sample
is acquired on channel 1 and channel 2
Screen
Normal
Inverted
Set to normal mode.
Set to invert color display mode.
Grid
Display grids and axes on the screen.
Turn off the grids.
Turn off the grids and axes.
Menu Display
2sec
Set menu display time on screen.
Page 59

57
5sec
10sec
20sec
Infinite
Next Page
Page 2/3
Press this button to enter the second
page of “Display menu”.
Picture 2.10-3
Table 2-31 Display system function menu3:
Option
Setting
Introduction
Skin
Classical
Modern
Tradition
Succinct
Set up screen style.
Next Page
Page 3/3
Press this button to return the first page.
Operate Introduction:
1. Set up waveform display type
1) Press the “DISPLAY” button to enter the “Display” menu.
2) Press the “Type” option button to select “Vectors” or “Dots”.
2. Set up Persist
Press “Persist” option button to select “Off”, “1 Sec”, “2 Sec”, “5Sec” or “Infinite”.
You can use this option to observe some especial waveforms.
Page 60

58
Picture 2.10-4
3. Set up Intensity
1) Press the “Intensity” option button and turn the “Universal” knob to adjust
waveforms’ intensity.
4. Set up Brightness
1) Press the “Brightness” option button and turn the “Universal” knob to adjust grid
brightness.
5. Set up display format
1) Press the “Next Page” option button to enter second display menu.
2) Press the “Format” option button to select “YT” or “XY”.
6. Set up Screen
Press the “Screen” option button to select “Normal” or “Inverted” to set the screen
display color.
7. Set up Grid
Press the “Grid” option button to select “ ”, “ ”or“ ”to set the screen
whether display grid or not.
8. Set up Menu Display
Press the “Menu Display” option button to select “2 sec”, “5sec”, “10sec”, “20sec” or
“Infinite” to set menu display time on screen.
9. Set Skin
Press the “skin” option button or turn the “Universal” knob to select “Classical”,
The image
cannot be
The image
cannot be
The image
cannot be
Page 61

59
“Modern”, “Traditional” or “Succinct”.
2.10.1 X-Y Format
Use the XY format to analyze phase differences, such as those represented by
Lissajous patterns. The format plots the voltage on channel 1 against the voltage on
channel 2, where channel 1 is the horizontal axis and channel 2 is the vertical axis. The
oscilloscope uses the untriggered Sample acquisition mode and displays data as dots.
XY mode has a breakthrough that traditional oscilloscopes restrict sampling rate at
1MSa/s
support 25KSa/s250MSa/s (1-2.5-5 sequence) adjusted ;
Operation steps
Channel 1 “Volt/div” and vertical “POSITION” set up the horizontal scale and
position.
Channel 2 “Volt/div” and vertical “POSITION” set up the horizontal scale and
position.
Turn the “S/div” knob to adjust the sampling rate
The following functions are forbidden at XY display form:
Benchmark wave form and wave mathematic
Cursor
Autoresets display format to YT
Trigger Control
Horizontal Position Knob
Vector Display Type
Scan Display
2.11 Measure System
The Oscilloscope displays the voltage in relation to time and test the wave form
Page 62

60
displayed. There are scale, Cursor and auto measure modes.
2.11.1 Scale Measurement
This method allows you to make a quick, visual estimate. For example, you might look
at waveform amplitude and determine that it is a little more than 100 mV. You can take
simple measurements by counting the major and minor graticule divisions involved and
multiplying by the scale factor. For example, if you counted five major vertical graticule
divisions between the minimum and maximum values of a waveform and knew you had
a scale factor of 100mV/div, then you could easily calculate your peak-to-peak voltage
as follows:
5 divisions x 100 mV/division = 500 mV.
2.11.2 Cursor Measurement
Picture 2-50 displays the cursor button on the front-panel for this menu.
Picture 2.11-1
Press the “CURSORS” button to display the “Cursor” Menu.
The cursor measurement has three modes: Manual, Track and Auto Measure.
Manual Mode
Page 63
61
Table 2-32 Manual cursor function menu:
Option
Setting
Instruction
Cursor Mode
Manual
In this menu, set the manual cursor measure.
Type
Voltage
Time
Use cursor to measure voltage parameters.
Use cursor to measure time parameters.
Source
CH1
CH2
MATH
REFA
REFB
Select input signal channel.
Cur A
Select this option use “Universal” knob to
adjust cursor A.
Cur B
Select this option use “Universal” knob to
adjust cursor B.
In this mode, the screen displays two horizontal parallel cursors or vertical parallel
cursors to measure voltage or time. You can move the cursor by turning the “Universal”
knob. Before using cursors, you should make sure that you have set the signal source
as the channel for measuring.
■ Voltage Cursor: Voltage cursors appear as horizontal lines on the display and
measure the vertical parameters.
■ Time Cursor: Time cursors appear as vertical lines on the display and measure the
horizontal parameters.
■ Cursor Moving: Use the “universal” knob to move cursor1 and cursor2 .They could
be moved when the corresponding cursor option are selected, and cursor value will
display on the bottom left and top left of the screen when you move the cursor.
To do manual cursor measurements, follow these steps:
1. Press CURSOR button to enter the cursor function menu.
2. Press the “Cursor Mode” option button to select “Manual”.
3. Press the “Type” option button to select “Voltage” or “Time”.
4. Press the “Source” option button to select “CH1”, “CH2”, “MATH”,
“REFA” ,“REFB” according to input signal channel.
5. Select “Cur A”, turn the “Universal” knob to adjust Cursor A.
6. Select “Cur B”, turn the “Universal” knob to adjust Cursor B.
Page 64

62
7. The measurement values are displayed on the top of the left corner:
If the measurement type is set to “Voltage”, the values are:
The value of Cur A: CurA
The value of Cur B: Cur B
The voltage increment between Cursor A and Cursor B: V
If the measurement type is set to “Time”, the values are:
The value of Cur A: CurA
The value of Cur B: Cur B
The time increment between Cursor A and Cursor B: T
The reciprocal of time increment between Cursor A and Cursor B: 1/T
Picture 2.11-2
Page 65
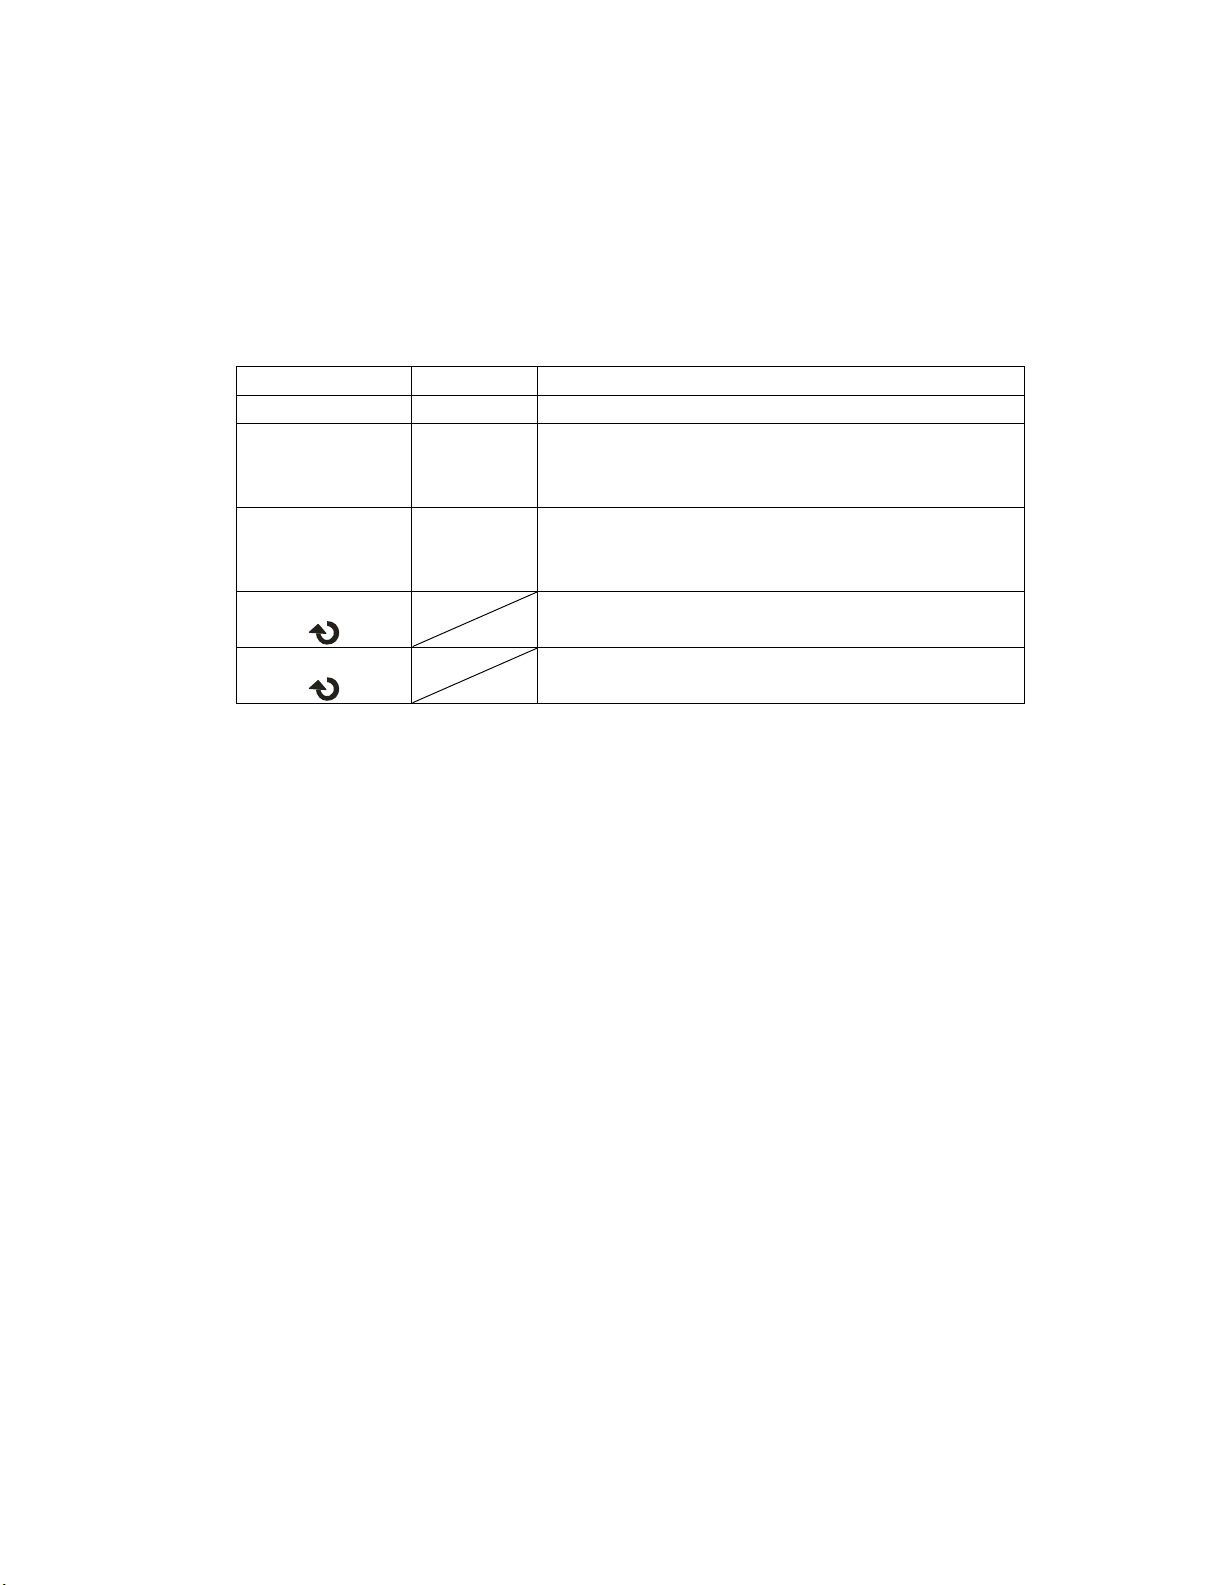
63
Track mode
Table 2-33 Track mode function menu:
Option
Setting
Instruction
Cursor Mode
Track
In this mode, set track cursor measure.
Cursor A
CH1
CH2
NONE
Set the input signal channel that the Cursor A
will measure.
Cursor B
CH1
CH2
NONE
Set the input signal channel that the Cursor B
will measure.
Cur A
Select this option, turn the “Universal” knob to
adjust horizontal coordinate of Cursor A.
Cur B
Select this option, turn the “Universal” knob to
adjust horizontal coordinate of Cursor B.
In this mode, the screen displays two cross cursors. The cross cursor sets the position
on the waveform automatically. You could adjust cursor’s horizontal position on the
waveform by turning the “Universal” knob. The oscilloscope displays the values on the
top of the right screen.
To do track cursor measurement, follow these steps:
1. Press CURSOR button to enter the cursor measure function menu.
2. Press the “Cursor Mode” option button to select “Track”.
3. Press the “Cursor A” option button to select the input signal channel.
4. Press the “Cursor B” option button to select the input signal channel.
5. Select “Cur A”, turn the “Universal” knob to move Cursor A horizontally.
6. Select “Cur B”, turn the “Universal” knob to move Cursor B horizontally.
7. The measurement values are displayed on the left of the top corner:
A T: The horizontal position of Cursor A (Time cursor centered around the
midpoint of screen).
AV: The Vertical position of Cursor A (Voltage cursor centered around channel
ground level).
Page 66

64
B T: The horizontal position of Cursor B (Time cursor centered around the
midpoint of screen).
BV: The Vertical position of Cursor B (Voltage cursor centered around channel
ground level).
T: Horizontal space between Cursor A and Cursor B (Time value between two
cursors).
1/T: The reciprocal of horizontal space between cursor A and cursor B.
V: Vertical space between Cursor A and Cursor B (Voltage value between two
cursors).
Picture 2.11-3
Page 67
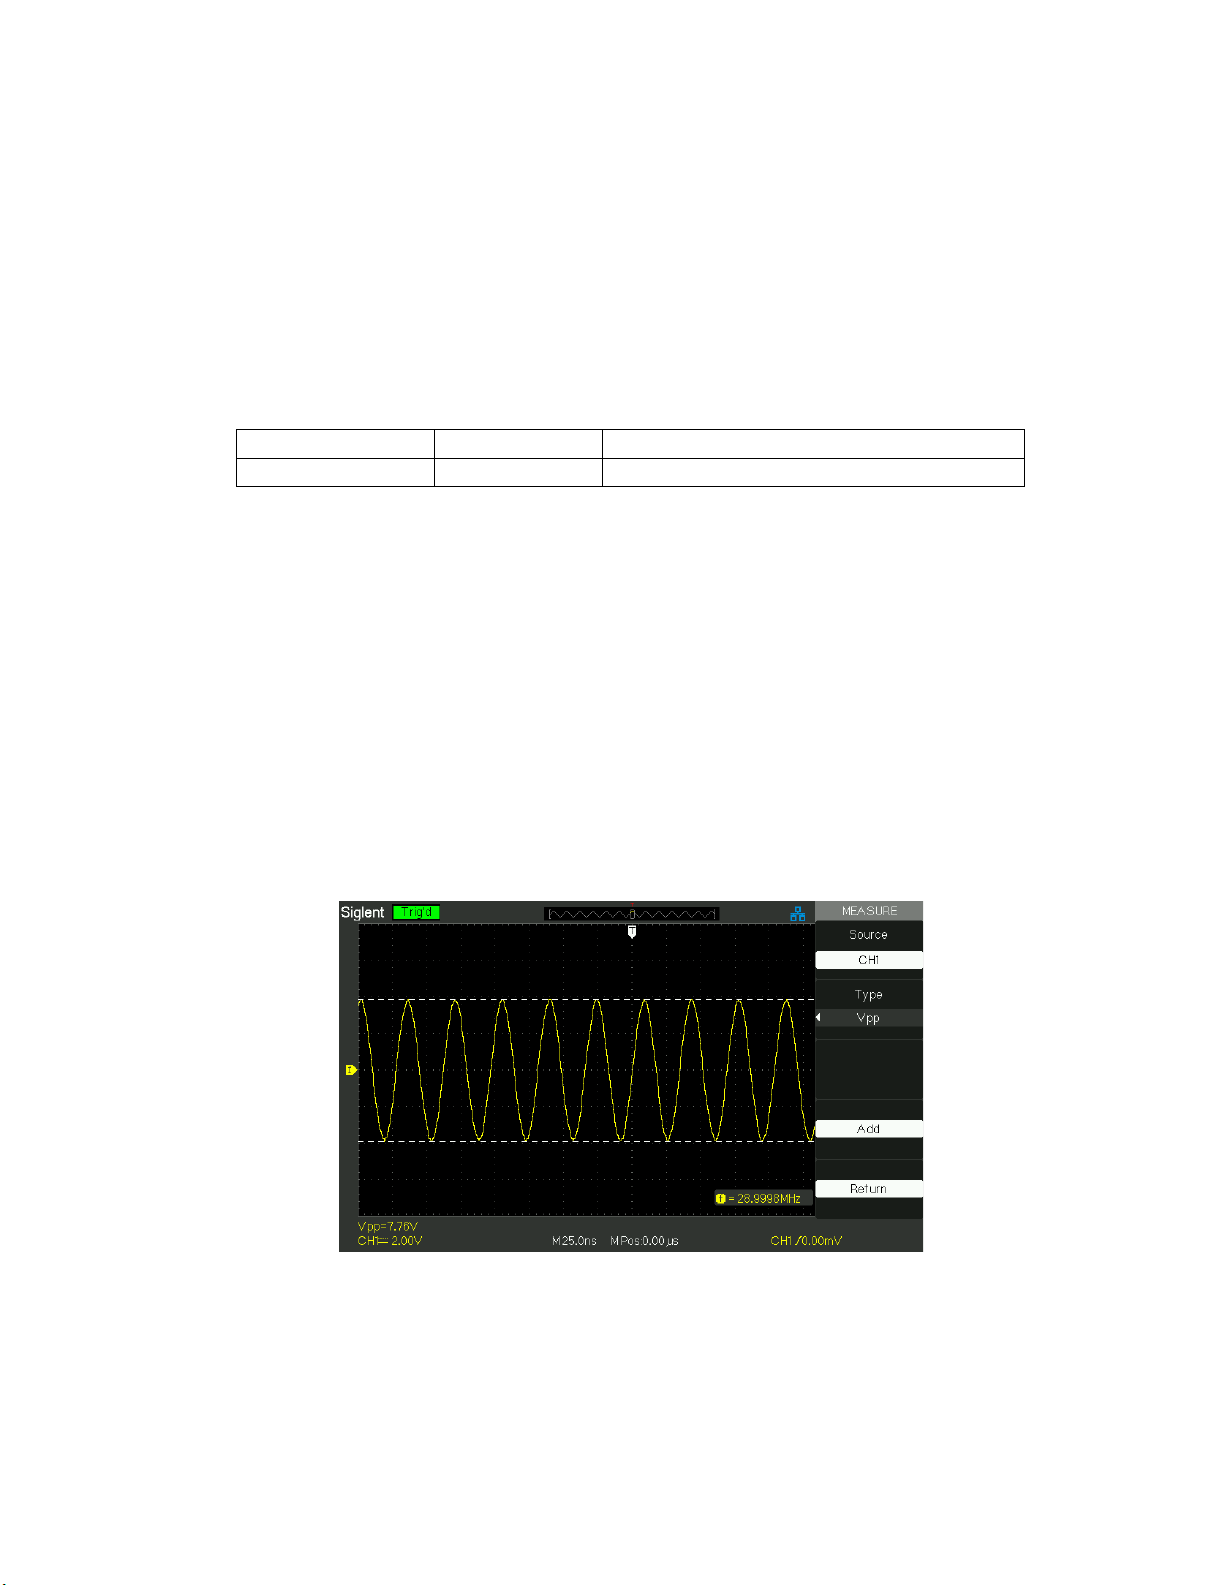
65
Auto mode
Table 2-34 Auto mode function menu:
Option
Setting
Instruction
Cursor Mode
Auto
Set to auto cursor measure mode.
This mode will take effect with automatic measurements. The instruments will display
cursors while measuring parameters automatically. These cursors demonstrate the
physical meanings of these measurements.
To do auto cursor measurements, follow these steps:
1. Press the CURSOR button to enter “Cursor measure menu”.
2. Press the “Cursor Mode” option button to select “Auto”.
3. Press the “MEASURE” button to enter “Auto cursor measure mode menu”
to select the parameter that you want to measure.
Picture 2.11-4
Page 68

66
2.11.3 Auto Measurement
Picture 2.11-5
When you take automatic measurements, the oscilloscope does all the calculating for
you. Because the measurements use the waveform record points, they are more
accurate than the graticule or cursor measurements.
Press the ‘MEASURE’ for the Automatic Test.
There are three auto measurement types: Voltage Measure, Time Measure and Delay
Measure. There are thirty two measure parameters in all.
Table 2-35 Auto measure function menu 1:
Option
Instruction
Voltage
Press this button to enter the Voltage measure menu.
Time
Press this button to enter the Time measure menu.
Delay
Press this button to enter the Delay measure menu.
All Mea
Press this button to enter the All Measurement menu.
Clear
Measure
Press this button to clear all the measurement that you chose.
Page 69

67
Picture 2.11-6
Table 2-36 Auto measure function 2-Voltage measure menu:
Option
Setting
Instruction
Source
CH1, CH2
Select input signal source for
Voltage measure.
Type
Vmax, Vmin, Vpp, Vamp,
Vtop, Vbase, Cycle Mean,
Mean, Cycle Vrms, Vrms,
ROVShoot, FOVShoot,
RPREShoot, FPREShoot
Press the “Type” button or turn
the “Universal” knob to select
Voltage measure parameter.
Add
Choose the measurement,
after pressing the button, the
measurement value will be
shown in the lower
left of the screen
Return
Return to the first page of auto
measurement menu.
Table 2-37 Auto measure function3-Time measure menu:
Option
Setting
Instruction
Source
CH1, CH2
Select input signal source for
Time measure.
Type
Rise TimeFall TimeFreq
Period BWidth +Width
-Width+Duty-Duty
Press the “Type” button or turn
the “Universal” knob to select
Time measure parameter.
Add
Choose the measurement,
after pressing the button, the
measurement value will be
shown in the lower
Page 70

68
left of the screen
Return
Return to the first page of auto
measurement menu.
Table 2-38 Auto measure function4-Delay measure menu:
Option
Setting
Instruction
Source
CH1-CH2
Select any two input signal
source for Delay measure.
Type
PhaseFRRFRFFFRFFF
LRRLRFLFRLFF
Press the “Type” button or turn
the “Universal” knob to select
Delay measure parameter.
Add
Choose the measurement, after
pressing the button, the
measurement value will be
shown in the lower
left of the screen
Return
Return to the first page of auto
measurement menu.
Table 2-39 All Measurement function menu:
Option
Setting
Instruction
Source
CH1
CH2
Select input signal channel.
Voltage
On
Off
Turn on the all measurement function to
measure voltage parameters.
Turn of the all measurement function to
measure voltage parameters.
Time
On
Off
Turn on the all measurement function to
measure Time parameters.
Turn of the all measurement function to
measure Time parameters.
Return
Return to the “All Measure main menu”.
Table 2-40 Introduction of the Measure Type:
Measure Type
Introduction
Vmax
The most positive peak voltage measured over the entire
waveform.
Vmin
The most negative peak voltage measured over the
entire waveform.
Vpp
Measures the absolute difference between the
maximum and minimum peaks of the entire waveform.
Vtop
Measures the highest voltage over the entire waveform.
Page 71

69
Vbase
Measures the lowest voltage over the entire waveform.
Vamp
Voltage between Vhig and Vlow of a waveform.
Vavg
The arithmetic mean over the first cycle in the waveform.
Mean
The arithmetic mean over the entire waveform.
Crms
The true Root Mean Square voltage over the first cycle
in the waveform.
Vrms
The true Root Mean Square voltage over the entire
waveform.
ROVShoot
Defined as (Vmax-Vhig)/Vamp after the waveform
rising.
FOVShoot
Defined as (Vmin-Vlow)/Vamp after the waveform
falling.
RPREshoot
Defined as (Vmin-Vlow)/Vamp before the waveform
rising.
FPREshoot
Defined as (Vmax-Vhig)/Vamp before the waveform
falling.
Rise Time
Rise Time Measures the time between 10% and 90% of
the first rising edge of the waveform.
Fall Time
Fall Time Measures the time between 90% and 10% of
the first falling edge of the waveform.
BWid
The duration of a burst.
Measured over the entire waveform.
+ Wid
+ Width Measures the time between the first rising edge
and the next falling edge at the waveform 50% level.
- Wid
-Width Measures the time between the first falling edge
and the next rising edge at the waveform 50% level.
+ Duty
Measures the first cycle waveform.
Positive Duty Cycle is the ratio between positive pulse
width and period.
Duty
Measures the first cycle waveform. Negative Duty Cycle
is the ratio between negative pulse width and period.
Phase
The amount one waveform leads or lags another in time.
Expressed in degrees, where 360 degrees comprise
one waveform cycle.
FRR
The time between the first rising edge of source X and
the first rising edge of source Y.
FRF
The time between the first rising edge of source X and
the first falling edge of source Y.
The image
cannot be
The image
cannot be
The image
cannot be
The image
cannot be
The image
cannot be
The image
cannot be
The image
cannot be
Page 72

70
FFR
The time between the first falling edge of source X and
the first rising edge of source Y.
FFF
The time between the first falling edge of source X and
the first falling edge of source Y.
LRR
The time between the first rising edge of source 1 and the
last rising edge of source 2.
LRF
The time between the first rising edge of source X and
the last falling edge of source Y.
LFR
The time between the first falling edge of source X and
the last rising edge of source Y.
LFF
The time between the first falling edge of source X and
the last falling edge of source Y.
If you want to measure voltage parameters, please follow next steps:
1. Press the “MEASURE” button to enter the “Auto measurement” menu.
2. Press the top first option button to enter the “second measurement menu”.
3 . Select measure type. If you press the “Voltage” option button, “Voltage
measurement” menu will display on the screen.
4. Press the “Source” option button to select “CH1”, “CH2” according to input signal
channel.
5. Press the “Type” option button to select the parameter type that you want to
measure, then press the “add” option button to add the measurement . The
corresponding icon and value will displayed in the lower left of the
screen.
Page 73

71
Picture 2.11-7
6. Press the “Return” option button to return the home page of “Auto Measurement”
menu. The selected parameter and the corresponding value will display on the top
first position of the home page.
You can display the other parameters and its’ value on the corresponding position
using the same way, and the screen can display five parameters at one time.
If you want to measure time parameters using all measure function, please
follow next steps:
1. Press the “MEASURE” button to enter the “Auto Measure menu”.
2.Press the top option button to enter the second page of “Auto Measure menu”.
3. Press “All Mea” option button to enter the “All Measure menu”.
4. Press “Source” option button to select input signal channel.
5. Press the “Time” option button to select “On”. Now all of time parameters value
will display on the screen at the same time.See Picture
Page 74

72
Picture 2.11-8
2.12 Storage System
Showing as following picture, The SAVE/RECALL is the Storage System Function
Button.
Picture 2.12-1
You can quickly save and recall up to 20 oscilloscope panel settings, 10 groups’
waveforms in internal memory. There is a USB Host interface in the front panel of the
oscilloscope and you can save setup data, waveform data, waveform interface image,
CSV file to a USB flash drive furthest at a time. Setup data and waveform data can be
recalled to the current oscilloscope or the other same model oscilloscopes. Picture data
and CSV file can’t be recalled to the oscilloscope, but it can be opened on the correlative
computer software.
■ Using SAVE /RECALL Screen
The SAVE ALL screen is divided into functions based on Files or Directory.
Page 75

73
Files shows option button for New File, Del File and Load.
Picture 2.12-2
While Directory shows option buttons for New Dir., Del Folder.
Picture 2.12-3
Recalling Files
The Load button is used to recall your setup files. Once you’ve navigated to the desired
file and it’s highlighted in the main screen area, press the Load option button and the
setup is recalled from the USB flash drive.
Note: The Load button option is disabled when BMP or CSV file types are selected.
Page 76
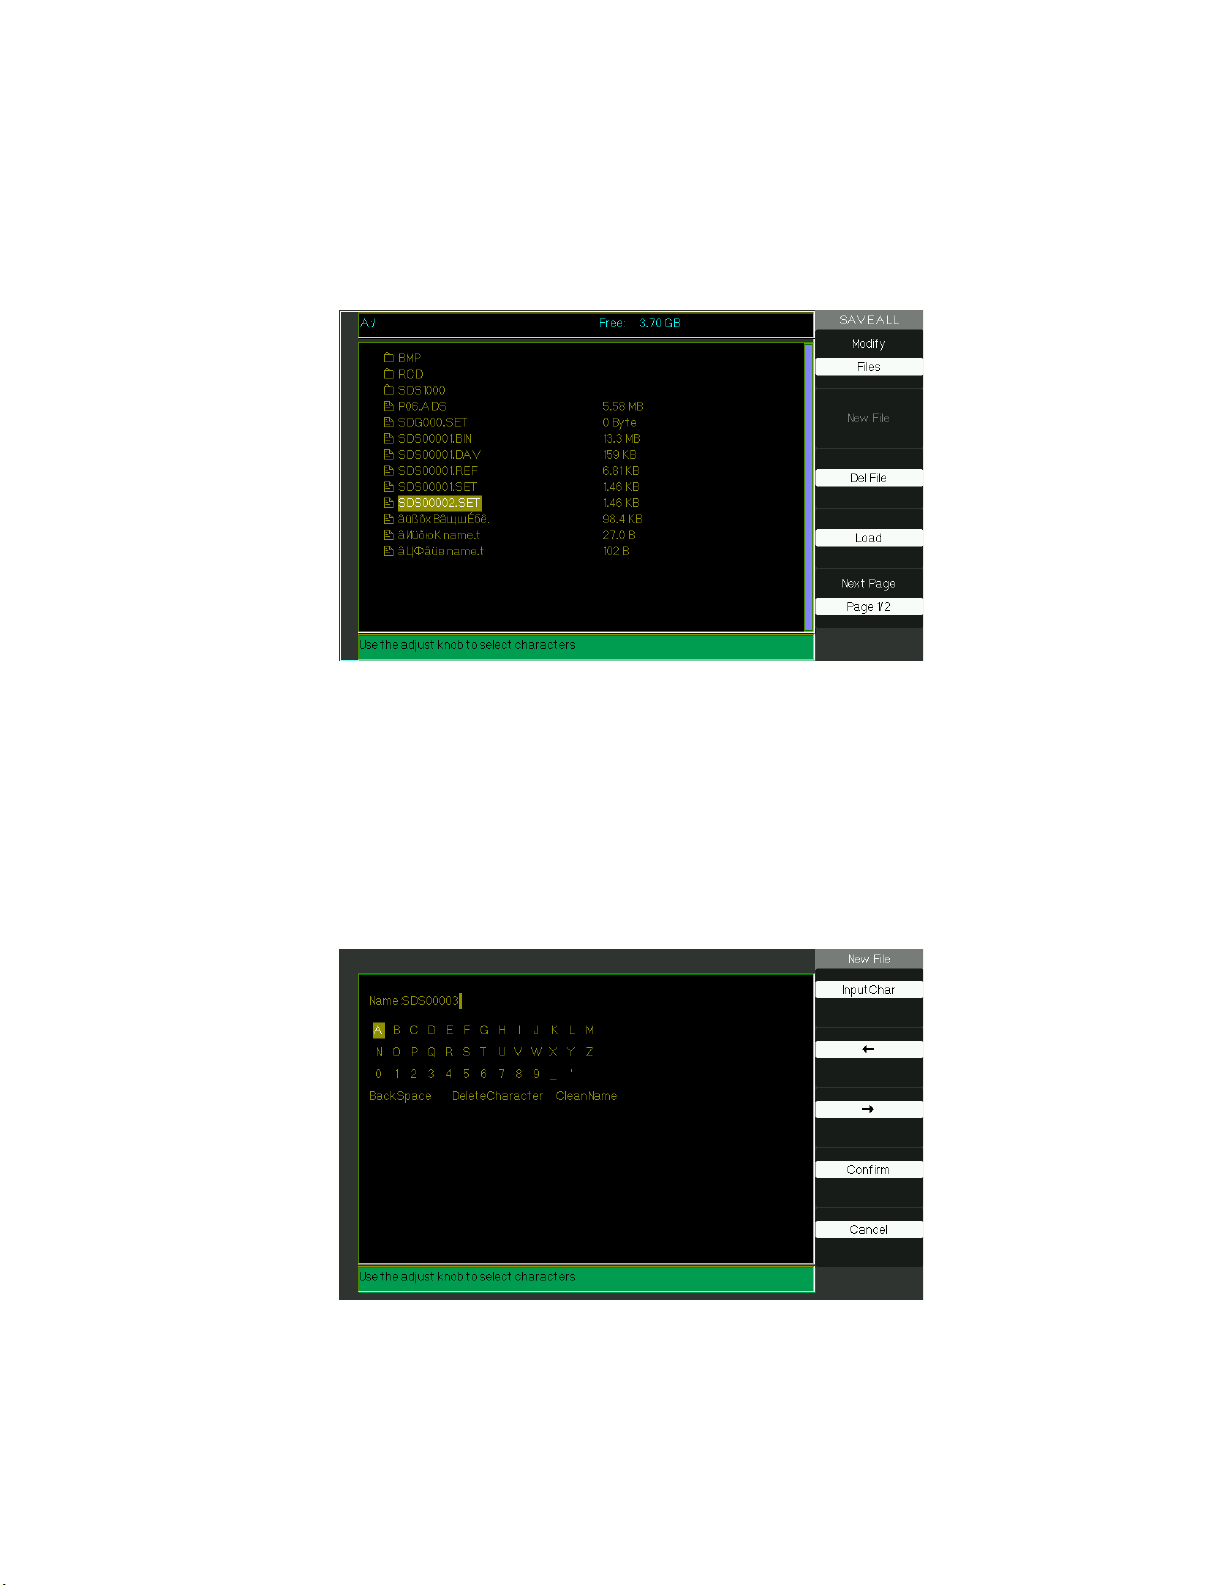
74
Both Directory and Files have Rename and Return option buttons on Page2/2. Use
these buttons to give an existing folder of file a new name or to exit the SAVE/REC ALL
screen, respectively.
Picture 2.12-4
Creating Directory and File
Create new directory and file by pressing the New Dir or New File option button. The
following screen is shown.
Picture 2.12-5
Page 77

75
● The New Filemenu choices and behavior is the same as the New Folder menu. It just
has a different heading. The InputChar option button adds the selected character to the
courser position in Name field.
● Move the cursor position in the name field using the “”and “” option buttons.
● Turn the Universal knob to move through character selections. When the desired
character is highlighted, press the Universal knob or press he “InputChar” option button
to add it to the specific position in the Name field.
● Additional selections for BackSpace, DeleteCharacter, and CleanName are available
for convenience and are also accessed using the “Universal” knob in the same manner.
● Press the “Confirm” option button (when you have the Name field completed as
desired) to save the file onto the memory device. After the “Confirm” option button is
pressed, a “Data Store Success!” messages briefly shown and the new folder or file is
shown on your USB flash drive.
SAVE/RECALL SETUP
■ Save Setups to Device The complete setup is stored in nonvolatile memory. When
you recall the setup, the oscilloscope will be in the mode from which the setup was
saved.
The oscilloscope saves the current setup if you wait three seconds after the last change
before you power off the oscilloscope. The oscilloscope recalls this setup the next time
you apply power.
Table 2-41 Save setup to device function menu:
Option
Setting
Introduction
Type
Setups
Menu for the Storage/Recall setting in the
oscilloscope
Save to
Device
Save setup to the oscilloscope’s internal
Page 78

76
memorizer.
Setup
No.1 to No.20
Press the “Setup” option button or turn the
“universal” knob to select storage position.
Save
Accomplish the storage
Recall
Recall the storage in the “Setup” operation
Picture 2.12-6
Save setups to the oscilloscope’s internal memorizer, follow next steps:
For example: Save setup that set waveform display type to “Dots” to internal memory.
1Press the “SAVE/RECALL” button to enter the “SAVE/RECALL” menu.
2Press the “Type” option button to select “setups”.
3Press the “Save to” option button to select “Device”.
4Press the “Setup” option button to select “No.1”.
5Press the “DISPLAY” button to enter the “Display” menu.
6Press the “Type” option button to select “Dots”.
7Press the “SAVE/RECALL” button to enter the “SAVE/RECALL” menu.
8Press the “Save” option button.
Recalling setup, follow next steps:
1Press the “SAVE/RECALL” button to enter the “SAVE/RECALL” display menu.
2Press the “Type” option button to select “Setups”.
3Press the “Save to” option button to select “Device”.
4Press the “Setup” option button or turn the “Universal” knob to select “No.1”.
Page 79

77
5Press the “Recall” option button.
■Save Setup to USB flash drive
Table 2-42 Save setup to USB flash drive function menu:
Option
Setting
Introduction
Type
Setups
Menu for the Storage/Recall settings.
Save to
File
Save setup data to USB flash drive.
Save
Go to the Save/Recall interface and save
the set file
Recall
Recall the saved set file
Picture 2.12-7
Save setup to USB flash drive, follow these steps
For example: Save setup that set waveform display type to “Dots” to USB flash drive.
Press the “SAVE/RECALL” button to select “Setups”.
1) Insert USB flash drive to USB host port of the oscilloscope and wait that the
oscilloscope has initialized USB flash drive (about five second).
2) Press the “Save to” option button to select “file”.
3) Press the “Save” option button then you’ll go into the Save/Recall interface.
4) Press the “New folder” button to create a new folder
5) Press the “Del folder” option button to delete a folder
6) Press the “Modify” option button to modify a folder.
7) Press the “New file” option button to create a new file
8) Press the “Del file” option button to delete a file
Page 80

78
9) Press “the next page” option button and press the “Rename” option button to modify
the name of the file or the folder.
10) Turn the “Universal” knob to select the folder and press the “Confirm” option button
and you save the set to the USB drive.
Recall setup data from USB flash drive, follow next steps:
1) Press the “SAVE/RECALL” button.
2) Press the “Type” button to select “Setups”.
3) Insert USB flash drive to USB host port of the oscilloscope and wait that the
oscilloscope has initialized USB flash drive (about five seconds).
4) Press the “Save to” option button to select “File”.
5) Press the “Save” option button then you’ll go into the Save/Recall interface .
6) Choose the file you want then press the “Load” option button (about five seconds,
there is a prompting message that “Read data success”), now setup data have been
recalled from USB flash drive.
■ RECALL FACTORY
You can use this option to recall the factory setup.
Table 2-43 Factory function menu:
Option
Setting
Instruction
Type
Factory
To view the Factory setup.
Update BW
Change the bandwidth of the
oscilloscope.
Depth
Recover
Recover the memory
Update cfg
Update the config file
Load
Recall the Factory setup.
Page 81

79
Picture 2.12-8
SAVE/RECALL WAVEFORM
■Save waveforms to Device
Table 2-44 Save waveform to device function menu:
Option
Setup
Introduction
Type
waveforms
Menu for the Storage/Recall waveforms in
the oscilloscope.
Save to
Device
Save waveforms to the oscilloscope’s
internal memorizer.
waveform
No.1 to No.10
Press the “waveform” option button or turn
the “Universal” knob to select storage
position.
Save
Accomplish the storage.
Recall
Recall the storage in the “waveform”
operation
Page 82

80
Picture 2.12-9
Save waveforms in internal memory, follow next steps:
1. Input a sine signal to channel 1 and press the “Auto” button.
2. Press the “SAVE/RECALL” button to enter “SAVE/RECALL” display menu.
3. Press the “Type” option button to select “waveforms”.
4. Press the “Save to” option button to select “Device”.
5. Press the “waveform” option button or turn the “Universal” knob to select “No.1”.
6.Turn the “Volts/div” knob or “S/div” knob to adjust the waveform that you want to need.
7. Press the “Save” option button.
Recall waveforms, follow next steps:
1. Press the “SAVE/RECALL” button to enter “SAVE/RECALL” display menu.
2. Press the “Type” option button to select “waveforms”.
3. Press the “Save to” option button to select “Device”.
4. Press the “waveform” option button or turn the “Universal” knob to select “No.1”.
5. Press the “Recall” option button.
Page 83

81
■ Save waveforms to USB flash drive
Table 2-45 Save waveforms to USB flash drive function menu
Option
Setup
Introduction
Type
Waveforms
Menu for the Storage/Recall waveforms.
Save to
File
Save waveforms to USB flash drive.
Save
Accomplish the storage.
Picture 2.12-10
Save waveforms to USB flash drive, follow next steps:
1)Input a sine signal to channel 1, press the “AUTO” button.
2)Press the “SAVE/RECALL” button to enter the “SAVE/RECALL” display menu.
3)Press the “Type” option button to select “Waveforms”.
4)Insert USB flash drive to USB host port of the oscilloscope and wait that the
oscilloscope has initialized USB flash drive (about five seconds).
5)Press the “Save to” option button to select “File”.
6)Press the “Save” option button then you’ll go into the Save/Recall interface.
7)Create a file then press the “Confirm” button (about five seconds, there is a
prompting message that “Save data success” displaying on the screen), now
waveform data have been saved to USB flash drive
Page 84

82
Recall waveforms form USB flash drive, follow next steps:
1. Press the “SAVE/RECALL” button.
2. Press the “Type” button to select “Waveforms”.
3 . Insert USB flash drive to USB host port of the oscilloscope and wait that the
oscilloscope has initialized USB flash drive (about five seconds).
4. Press the “Save to” option button to select “File”.
5. Press the “Save” option button then go into the Save/Recall interface.
6. Choose the file you want then press the “Load” option button (about five seconds,
there is a prompting message that “Recall data success” displaying on the screen),
now waveform data have been recalled from USB flash drive.
■ Save Picture
Waveform interface image can be saved to USB flash drive, but they can’t be recalled.
You can open them on correlative computer software.
Table 2-46 Picture storage function menu:
Option
Setting
Introduction
Type
Pictures
Menu for the Storage/Recall waveform
interface image.
Save
Go to the Save/Recall interface.
Page 85

83
Picture 2.12-11
Save waveform image to USB flash drive, follow next steps:
1). Select the screen image that you want.
2). Press the “SAVE/RECALL” button to enter “SAVE/RECALL” menu.
3). Press the “Type” option button to select “Pictures”.
4). Insert USB flash drive to USB host port of the oscilloscope and wait that
the oscilloscope has initialized USB flash drive (about five seconds).
5). Press the “Print Key” option button to select “Save Picture”.
6). Press the “Save” option button then go into the Save/Recall interface”.
7). Press the “Save” button then you’ll go into the Save/Recall interface
8). Create the picture name then press the “Confirm” button (about five seconds, there
is a prompting message that “Save data success” displaying on the screen), now picture
data have been saved to USB flash drive.
Save/Recall CSV
Table 2-47 CSV storage function menu:
Option
Setting
Introduction
Page 86

84
Type
CSV
Menu for the Storage CSV file to USB flash drive.
Data
Depth
Displayed
Maximum
Set to store displayed waveform data to CSV file.
Set to store maximum waveform data to CSV file.
Para
Save
On
Off
Set whether store parameters to CSV file or not.
Save
Go to the Save/Recall interface.
Picture 2.12-12
Save CSV file to USB flash drive, follow these steps:
1). Press the “SAVE/RECALL” button to enter “SAVE/RECALL” menu.
2). Press the “Type” option button to select “CSV”.
3). Insert USB flash drive to USB host port of the oscilloscope and wait that the
oscilloscope has initialized USB flash drive(about five seconds).
4). Press the “Data Depth” option button to select “Displayed” or “Maximum”.
5). Press the “Para Save” option button to select “On” or “Off”.
6). Press the “Save” option button then you’ll go into the Save/Recall
interface
7). Create a file name then press the “Confirm” button (About five seconds, there is a
prompting message that “Save data success” displaying on the screen), now CSV file
has been saved to USB flash drive.
Page 87

85
2.13 Utility System
Picture 2.13-1
Table 2-48 Utility System function menu 1:
Option
Setting
Introduction
System
Status
Displays summaries of the oscilloscope
settings.
Sound
Open the key-press voice.
Close the key-press voice.
Counter
On
Off
Turn on Frequency Counter
Turn off Frequency Counter.
Language
English
ﺔ"ﺑﺮﻌﻟ'
Français
Deutsch
Русский
Español
Português
Italian
Simplified Chinese
Traditional Chinese
English
Arabic
French
German
Russian
Spanish
Portuguese
Japanese
Korean
Italian
Next Page
Page 1/4
Press this button to enter second page.
Page 88

86
Picture 2.13-2
Table 2-49 Utility System function menu 2:
Option
Setting
Introduction
Do self cal
Auto self emendation.
Do Self
Test
Screen Test
Keyboard Test
LED Test
Run the screen detect program
Run the keyboard detect program
Run the dot lighten detect program.
Back USB
USBTMC
The oscilloscope connects to the
computer using USB cable. When you
execute EasyScopeX software, please
select “USBTMC”. Now the computer
icon displays on the screen.
Next Page
Page 2/4
Press this button to enter third page.
Picture 2.13-3
Table 2-50 Functional Menu of the Utility System 3:
Option
Setting
Introduction
Update
firmware
You can update the oscilloscope use USB flash
Driver (About need two minutes).
Pass/Fail
Pres this button to enter the “Pass/Fail menu”.
Record
Press this button to enter the waveform record
menu.
IO Setting
IP Setting
GPIB
Next Page
Page 3/4
Press this button to enter first page.
Page 89

87
Picture 2.13-4
Table 2-52 Function Menu of the Utility System
Option
Setting
Introduction
Screen-saver
1min, 2min, 5min, 10min
15min, 30min, 1hour,
2hour, 5hour ,Off
Set the time of Screen-saver
Recorder
Enter recorder function
Next Page
Picture 2.13-5
Page 90

88
2.13.1 System Status
Press the “System Status” option button of the Utility Menu to view the oscilloscope’s
hardware and software configuration.
Picture2.13-6
Table 2-53 System status instruction:
Option
Introduction
Startup Times
List the boot-strap times.
Software version
List the software version.
Hardware Version
List the hardware version.
Product type
List the product type.
Serial No.
List the product serial number.
2.13.2 Language
The oscilloscopes have twelve languages’ user menu to be selected.
Press the “Utility” button “language” to select language.
Page 91

89
Picture 2.13-7
2.13.3 Self Calibration
Self Calibration procedure can optimize the signal path at the most measurement
precision. You can run this procedure at any time. If the operating temperature changes
by more than 5° C or the units run more than thirty minutes, you should do the self
calibration.
When you run the self Calibration, you should cut off all the probes and lead. Then
press the “Utility” button to choose the “Do self cal” to show the self Calibration Menu,
and execute self calibration program according to the prompting on the screen.
Picture 2.13-8
Page 92

90
2.13.4 Self Test
Press “UTILITY”→ “Do Self Test”
Table2-54
Option
Introduction
Screen Test
Run Screen Test Program.
Keyboard Test
Run Keyboard Test Program.
LED Test
Run LED Test Program.
Operation Steps:
1. Screen Test:
Select “Screen Test” to enter the screen test interface. The clew words “Press ‘SINGLE’
Key to continuePress ‘RUN/STOP’ Key to exit” is displayed, you could press the “Single”
for test.
Picture 2.13-9
2. Keyboard Test
Select “keyboard Test” to enter the key test interface, the on-screen lathy rectangle
shapes represent the front panel keys. The shapes with two arrows beside them
represent the front panel knobs. The squares represent the knob presses for scale
knobs. Test all keys and knobs and you should also verify that all the backlit buttons
Page 93

91
illuminate correctly.
Note
When you operate, the screen would display the white (Color LCD) and black (single
LCD) repose.
The tested button or knobs corresponding area would display green (Color LCD) or
white (single LCD).
At the bottom of the screen display “Press‘ RUN/STOP’ Key Three Times to exit”
information prompt to show that press “RUN/STOP” three times for quitting the test .
Picture 2.13-10
3. LED test
Select “LED Test” to enter the lighten interface, the on-screen lathy rectangle shapes
represent the front panel keys; the lathy rectangle shapes represent the front panel
knobs. The squares represent the knob presses for scale knobs. The clew words “Press
‘SINGLE’ Key to continue , Press ‘RUN/STOP’ Key to exit” is displayed, you could press
the “Single” button continuously for testing, when buttons are lighted ,the corresponding
area on the screen would display green(Color LCD) or white(Single LCD ).
Page 94

92
Picture 2.13-11
2.13.5 Updating the System Software
■ Using USB flash drive update firmware
The software of the oscilloscope can be updated directly via USB Flash drive, this
process needs about two minutes. Follow next steps:
1. Insert USB Flash Drive with firmware procedure to USB Host interface on
the front panel of the oscilloscope.
2. Press the “UTILITY” button to enter the “Utility menu”.
3. Press “Next Page” option button to enter the third page of “Utility menu”.
4. Press the “Update Firmware” option button.
5. Press the “SINGLE” button to start updating the software according to prompt on the
screen.
Turn off the oscilloscope and turn on it again, the software has been updated. The
oscilloscope needs to execute “Do Self Cal” after update.
Note: Don’t cut off the power while the oscilloscope is updating.
2.13.6 Pass/Fail
The Pass/Fail function can monitor changes of signals and output pass or fail signals by
Page 95

93
judging the input signal is within the predefined mask or not.
Table 2-55 Pass/Fail function menu 1:
Option
Setting
Instruction
Enable
On
Off
Turn on Pass/Fail function.
Turn off Pass/Fail function.
Source
CH1
CH2
Select signal input channel.
Operate
Press to run the Pass/Fail test.
Press to stop the Pass/Fail test.
Msg Display
On
Off
Turn on times information display of the
waveform pass/fail.
Turn off times information display of the
waveform pass/fail.
Next Page
Page 1/2
Press this button to enter second page of
Pass/Fail menu.
Picture 2.13-12
Table 2-56 Pass/Fail function menu 2:
Option
Setting
Instruction
Stop On Output
On
Off
Stop test when output occur.
Continue test when output occur.
Mask Setting
Enter the “Mask Setting menu”.
Return
Return to the Pass/Fail main menu.
Next Page
Page 2/2
Return to the first page of Pass/Fail menu.
Page 96

94
Picture 2.13-13
Table 2-57 Mask Setting function menu 1:
Option
Setting
Instruction
X Mask
xdiv
Turn the “Universal” knob to set the range of
horizontal clearance to the waveform.
<0.04div-4.00div>
Y Mask
ydiv
Turn the “Universal” knob to set the range of
vertical clearance to the waveform.
<0.04div-4.00div>
Create
Mask
Create a test mask according to the above
clearance.
Location
Internal
External
Select position to store created mask.
Next Page
Page 1/2
Enter the second page of “Mask Setting
menu”.
Picture2.13-14
Page 97

95
Table 2-58 Mask Setting function menu 2:
Option
Setting
Instruction
Save
Store created mask setting.
Load
Recall stored mask setting.
Return
Return to the main menu of mask setting.
Last Page
Page 2/2
Return to the first page of “Mask Setting menu”.
Picture 2.13-15
RUN Pass/Fail test, please follow next page:
1) Press UTILITY button to enter the “Utility menu”.
2) Press the “Next Page Page1/4” option button.
3) Press the “Next Page Page2/4” option button to enter the third page of “Utility menu”
4) Press the “Pass/Fail” option button to enter the “Pass/Fail” function menu.
5) Press the “Enable Test” option button to select “On”.
6) Press the “Source” option button to select input signal channel.
7) Press the “Next Page Page1/2”option button to enter the second page of the
“Pass/Fail menu”.
8) Press the “Mask Setting” option button to enter the first page of “Mask menu”.
9) Press the “X Mask” button; turn the “Universal” knob to adjust the horizontal
clearance.
10) Press the “Y Mask” button; turn the “Universal” knob to adjust the vertical clearance.
Page 98

96
11) Press the “Create Mask” button to create mask and you also can enter the next
page of “Mask menu” to recall the stored mask.
12) Enter the second page of “Pass/Fail function menu”, press the “Output” option
button to set the output option.
13) Enter the first page of “Pass/Fail function menu”, press the “Operate” option button
to select “ ”to run the pass/fail test.
Picture 2.13-16
2.13.7 Waveform Record
Waveform record can record input waveform from CH1 and CH2 with a maximum record
length of 2500 frames. This record behavior can also be activated by the pass/fail test
output, which makes this function especially useful to capture abnormal signals in long
term without keeping an eye watching it.
Waveform recorder: Record the waveforms with specified interval.
Table 2-59 Waveform recorder function menu:
Option
Setting
Instruction
Mode
Record
Play Back
Storage
Off
Set Record function menu.
Set Play Back function menu.
Set Storage function menu.
Turn off waveform recorder menu.
Page 99

97
Source
CH1
CH2
P/F-OUT
Select record source channel.
Interval
Set time interval between record frames.
End Frame
Set max number of record frames.
Operate
Record
Stop
Press to start recording.
Press to stop recording.
Picture2.13-17
To record waveforms, follow these steps:
1. Press the UTILITY button to enter “Utility menu”.
2. Press the “Next Page” option button to enter the third page of “Utility menu”.
3. Press the “Record” button to enter “Waveform Record Menu”.
4. Press the “Mode” option button to select “Record”.
5. Press the “Source” option button to select the input signal channel.
6. Select “Interval” option, turn the “Univeral” knob to adjust time interval between
record frames.
7. Select “End Frame”, select the “Universal” knob to adjust the max record frame.
8. Press “ ”in “Operate” option to record waveform.
Page 100

98
Play Back: Play back current record waveforms or saved record waveforms.
Table 2-60 Waveform play back function menu 1
Option
Setting
Instruction
Mode
Play Back
Set the Play Back function menu.
Operate
Run
Stop
Press to start playback playing.
Press to stop playing.
Play Mode
Set circular play mode.
Set single time play mode.
Interval
Set time interval between frames.
Next Page
Page 1/2
Enter the second page of Play Back menu.
Picture 2.13-18
Table 2-61 Waveform play back function menu 2:
Option
Setting
Instruction
Start Frame
Set start frame.
Curr_Frame
Select current frame to be played.
End Frame
Set End frame.
Return
Press to return the waveform
recorder main menu.
Next Page
Page 2/2
Return to the first page of Play Back
function menu.
 Loading...