

Page 1

Manuals / Brands / Gima Manuals / Medical Equipment / TLC5000 / Use and maintenance book / PDF
GIMA TLC5000 USE AND MAINTENANCE BOOK
Available languages
ENITPT
RO
Table of Contents
Table of Contents
Chapter 1 Introduction
Environment Condition
Product Feature
Safety
Maintenance and Cleaning
Chapter 2 Frame Character of Product
Page 2

Sketch Map for every Orientation
Definition of Keystoke, Interface and Indicator Light
Chapter 3 Preparing Work before Using
Electrode Placement
Battery Installation and Notice
Chapter 4 Recorder Operation Explanation
New Record
Review Record
System Set
Replay Record
Chapter 5 Malfunction Analysis and Troubleshooting
Daily Maintenance
The Problem Related to the Battery
The Problem Related to the Skin and the Electrode
The Problem Related to the Cable and the Input Plug
Other Problems
Chapter 6 Instructions for Analysis Software
Appendix Ⅰ
Appendix III Guidance and Manufacture's Declaration
Appendix IV Accuracy of Operating Data
Appendix V Warranty
Capitolo 1 Introduzione
Condizioni ambientali
Caratteristiche del prodotto
Sicurezza
Manutenzione e pulizia
Capitolo 2 Caratteristiche fisiche del dispositivo
Raffigurazione schematica di ogni vista
Definizione dei pulsanti, dell'interfaccia e delle spie
Page 3

Capitolo 3 Procedure di preparazione all'utilizzo
Posizionamento elettrodi
Istruzioni e avvertenze per l'installazione delle batterie
Capitolo 4 Funzionamento del dispositivo
Nuova registrazione
Consultazione della registrazione
Impostazioni di Sistema
Rivedere la registrazione
Capitolo 5 Analisi dei malfunzionamenti e risoluzione dei problemi
Manutenzione quotidiana
Problemi legati all'alimentazione
Problemi legati alla pelle del paziente e agli elettrodi
Problemi legati ai cavi e all'attacco di ingresso
Problemi vari
Capitolo 6 Istruzioni per il software di analisi
Appendice Ⅰ
Allegato II
Appendice III Guida e dichiarazione del produttore
Appendice IV Precisione dei dati operativi
Appendice V Garanzia
Capítulo 1 Introdução
Condição Ambiental
Caraterística do produto
Segurança
Manutenção e Limpeza
Capítulo 2 Caráter da Estrutura do Produto
Mapa de Esboço para cada orientação
Definição de Gravação de teclas, Interface e Luz Indicadora
Capítulo 3 Preparação do trabalho antes de utilizar
Page 4

Colocação do Elétrodo
Instalação e aviso das pilhas
Capítulo 4 Explicação da operação do gravador
Nova Gravação
Rever Gravação
Definição do Sistema
Reprodução da Gravação
Capítulo 5 Análise de Mau Funcionamento e Resolução de Problemas
Manutenção Diária
O Problema Relativo às Baterias
O problema relativo à pele e ao elétrodo
O problema relativo ao cabo e à ficha de entrada
Outros Problemas
Capítulo 6 Instruções para o Software de análise
Apêndice Ⅰ
Apêndice III Orientação e Declaração do Fabricante
Apêndice IV Precisão dos Dados Operacionais
Apêndice V Garantia
Cuvânt înainte
Capitolul 1
Condiții de mediu
Caracteristica produsului
Introducere
Siguranță
Întreținere și curățare
Capitolul 2 Caracterul cadru al produsului
Schiță hartă pentru fiecare orientare
Definiția Keystoke, interfață și indicator luminos
Capitolul 3 Pregătirea lucrării înainte de utilizare
Page 5

Page 6
PROFESSIONAL MEDICAL PRODUCTS
ECG HOLTER WITH SOFTWARE
Use and maintenance book
TLC5000 (GIMA 35130)
CONTEC MEDICAL SYSTEMS CO., LTD
M35130-EN-Rev.2-01.24
No.112 Qinhuang West Street, Economic & Technical
Development Zone, Qinhuangdao, Hebei Province,
PEOPLE’S REPUBLIC OF CHINA
Made in China
Prolinx GmbH Brehmstr. 56, 40239,
Duesseldorf, Germany
Gima S.p.A.
Via Marconi, 1 - 20060 Gessate (MI) Italy
[email protected] - [email protected]
www.gimaitaly.com
-40˚C
+55˚C
86kPa
0123
106kPa
%
0%
Page 7

I
Foreword
Please read the User Manual carefully before using this product. The operating procedures
specifies in this User Manual should be followed strictly. This manual describes in detail the
operation steps must be noted, the procedures may result in abnormal, and possible damage to
the product or users, refer to following chapters for details. Failed to follow the User Manual
may cause measuring abnormality, device damage and personal injury. The manufacturer is NOT
responsible for the safety, reliability and performance issues of such results due to user’s
negligence of this manual for using, maintenance or storage. The free services and repairs does
not cover such faults either.
The content in this user manual complies with real product. For software upgrade and some
modifications, the content in this user manual is subject to change without prior notice, and we
sincerely apologize for that.
Note: Please read the user manual carefully before use, and operate the device strictly
following the procedures in the user manual.
Warnings
Before using this product, the safety and effectiveness described in the following shall be
considered:
Page 8

I
Type of protection against electric shock: internally powered equipment.
Degree of protection against electric shock: type BF applied part.
Working mode: continuous operating device.
Protection classification of shell: IP22.
Measurement results shall be described by qualified doctors combined with clinical
symptoms.
The using reliability depends on whether the operation guide and maintenance instructions
in this manual is followed.
The device is not applicable for infants weighting less than 10Kg.
Contraindications: none.
The device can not work directly on human heart.
Date of manufacture: see the label.
Warning: To ensure safety and effectiveness, please use the accessories recommended
by our company. Repair and maintenance shall be carried out by professional personnel
approved by our company. Replacement of accessories that are not supplied by our
company may result in errors. Any maintenance personnel who has not been trained by our
company or other authorized service organization should not attempt to maintain the
product.
Page 9

I
Responsibility of operator
The device should be operated by a professionally trained medical staff, and kept by a
special person.
The operator must carefully read the User Manual before using this product, and strictly
follow the operating procedure described in the User Manual.
The safety requirements have been fully considered in product designing, but the operator
should not ignore the observation on patient and the state of device.
The operator shall provide the use condition of the product to our company.
Responsibility of our company
Our company supplies qualified products to users.
Our company provides services of installation, debugging and technically training
according to the contract.
Our company performs device repair in warranty period (one year) and maintenance after
warranty period.
Our company is responsible to respond to users' requirements in time.
The user manual is written by Contec Medical Systems Co., Ltd. All rights reserved.
Page 10

IV
CONTENTS
Chapter 1 Introduction ............................................................................................................... 1
1.1 Environment Condition ............................................................................................. 1
1.2 Product Feature .......................................................................................................... 1
1.3 Safety ......................................................................................................................... 2
1.4 Maintenance and Cleaning......................................................................................... 6
Chapter 2 Frame Character of Product ....................................................................................... 7
2.1 Sketch Map for every Orientation .............................................................................. 7
2.2 Definition of Keystoke, Interface and Indicator Light ............................................... 9
Chapter 3 Preparing Work before Using .................................................................................. 10
3.1 Electrode Placement ................................................................................................ 10
3.2 Battery Installation and Notice ................................................................................ 12
Chapter 4 Recorder Operation Explanation ............................................................................. 16
4.1 New Record ............................................................................................................. 17
4.2 Review Record ........................................................................................................ 20
Page 11

V
4.3 System Set ............................................................................................................... 22
4.4 Replay Record ......................................................................................................... 27
Chapter 5 Malfunction Analysis and Troubleshooting ............................................................. 30
5.1 Daily Maintenance ................................................................................................... 30
5.2 The Problem Related to the Battery ......................................................................... 31
5.3 The Problem Related to the Skin and the Electrode ................................................. 33
5.4 The Problem Related to the Cable and the Input Plug ............................................. 34
5.5 Other Problems ........................................................................................................ 35
Chapter 6 Instructions for Analysis Software ........................................................................... 36
Appendix Ⅰ ................................................................................................................................ 131
Appendix II ............................................................................................................................... 133
Appendix III Guidance and Manufacture's Declaration ......................................................... 135
Appendix IV Accuracy of Operating Data ............................................................................. 140
Appendix V Warranty ............................................................................................................ 141
Page 12

1
Chapter 1 Introduction
1.1 Environment Condition
The environment requirement of operation, transport and storage for Dynamic ECG Systems:
Operation Environment:
Environment Temperature: 10 ℃~45 ℃
Relative Humidity: ≤85 %
Atmospheric Pressure: 86 kPa~106 kPa
Power Supply: DC 3 V
Transport and Storage Environment:
Environment Temperature: -40 ℃~+55 ℃
Relative Humidity: ≤85 %
Atmospheric Pressure: 86 kPa~106kPa
1.2 Product Feature
Dynamic ECG Systems contain recorder & analysis software. Recorder is an easy- to -use unit,
which collects 12-lead ECG waveform synchronously and records continuously for 24 hours. In
addition, it also reviews ECG waveform. It is easy for you to use analysis software which plays
back ECG waveform stored in ambulatory recorder and achieves kinds of analysis functions,
such as arrhythmia, HRVA, QTDA, TWA, etc.
Page 13

2
1.3 Safety
The design of Dynamic ECG Systems accords with the international safety standard
IEC60601-2-47.
Warning:
Arbitrary modification to the device is forbidden.
Avoid strong vibration and shock when using or moving the device. Doctor must tell the
patient monitored by recorder not to do violent movement.
Turn off the device before cleaning and disinfection. Do not use sharp material to wipe the
screen.
Do not use the device under interference by high-power equipment, such as high voltage
cable, X ray, ultrasonic machine, MRI machine or electrotherapy machine, and keep it
away from mobile phone and other radiation source.
The device should not be used together with any defibrillation device.
Do not connect the device to both the human body and computer at the same time.
Do not remove the USB plug when the device is in turning on state.
The environment where the device to be used should be kept away from vibration, dust,
corrosive or combustible matter, and avoid from extreme temperature and humidity, and
Page 14

3
do not use the device in a humid environment.
Maintenance and repair are not allowed during using the device.
Other equipment or network is forbidden to connect with the system except the signal
input/output part connected to the system accessories.
Materials of product accessories should comply with the biological compatibility
requirements.
The materials selected for the design and manufacture of the device shall meet its excepted
service life. Any corrosion, aging, mechanical wear or degradation of biological materials
caused by bacteria, plants, animals, etc. will not degrade the mechanical properties of the
device.
Avoid contact with water. Avoid using or storing the device in places where excessive air
pressure, humidity or temperature exceeds the specified standard, poor ventilation or
dusty.
NO modification of equipment.
Pay attention to battery’s positive and negative anodes when replacing.
Please use LR6 AA alkaline battery to ensure the normal work of device.
Dispose of packaging materials, waste batteries and end-of-life products in accordance with
local laws and regulations. User should perform proper treatment to the waste products
Page 15
4
and materials according to the regulations and try to classify the waste for recycling.
The ST algorithm has tested for accuary of the ST segment data.The significance of the ST
segment changes needs to be determined by a clinician.
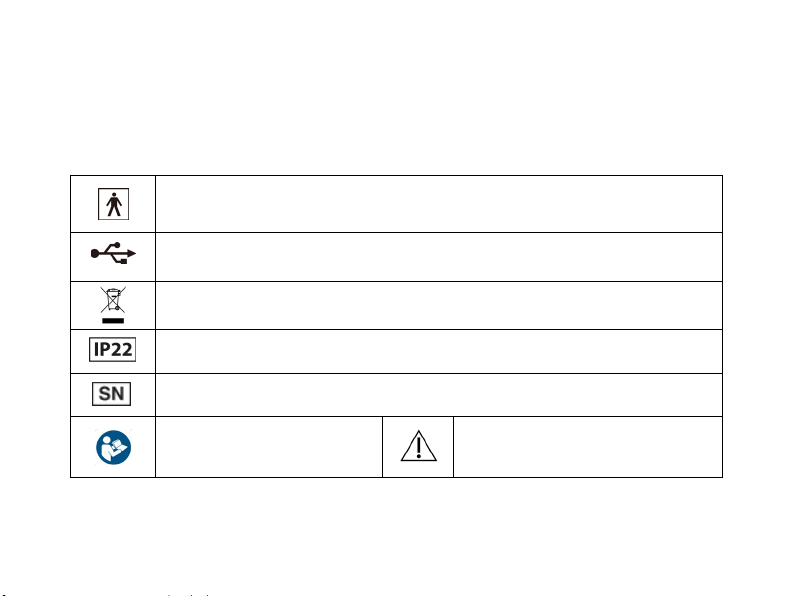
Typ e BF applied part
USB interface
WEEE disposal
Covering Protection rate
Serial number
Follow instructions for use
Caution: read instructions
(warnings) carefully
Page 16
5
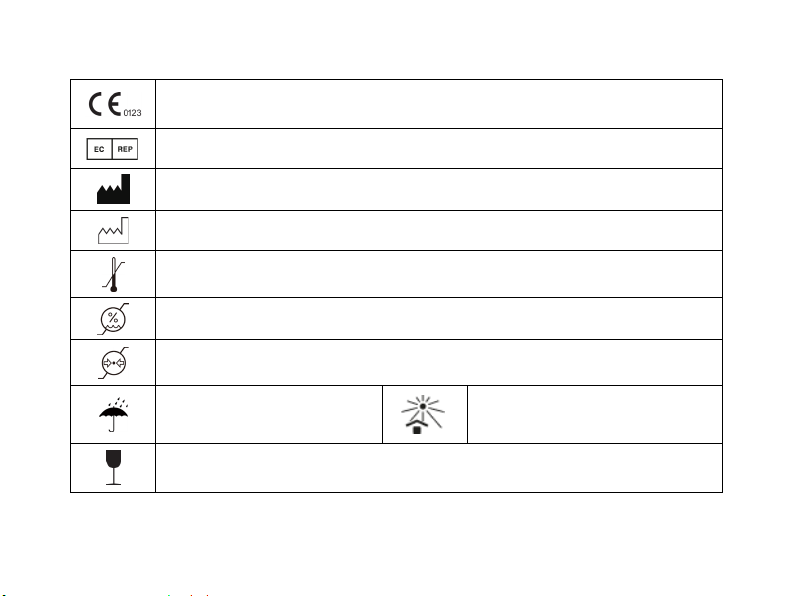
Medical Device compliant with Directive 93/42/EEC
Authorized representative in the European community
Manufacturer
Date of manufacture
Temperature limit
Humidity limit
Atmospheric pressure limit
Keep in a cool, dry place
Fragile, handle with care
Keep away from sunlight
Page 17
6
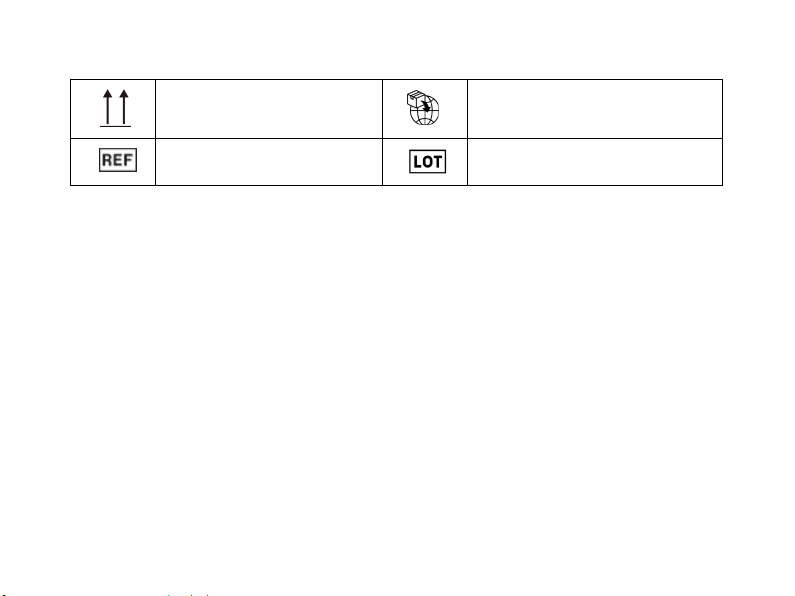
This side up
Product code
1.4 Maintenance and Cleaning
It is recommended that you check if there is any damage on the recorder or leads wires before
monitoring on the patient. If you find any damage, stop using it, and contact the biomedical
engineer of the hospital or our Customer Service immediately.
In addition, the overall check of the recorder, including the safety check, should be performed
only by qualified personnel once every 12 months.
The recorder can be cleaned with hospital-grade ethanol and dried in air or with dry and clean
cloth.
Please take out the batteries if the recorder is not in use for a long time and proper safekeeping.
Imported by
Lot number
Page 18
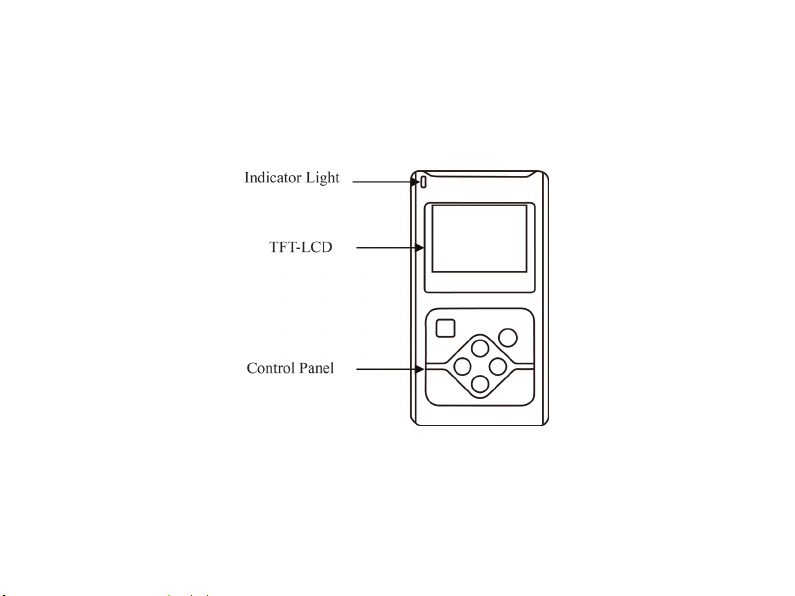
7
Chapter 2 Frame Character of Product
2.1 Sketch Map for every Orientation
2.1.1 Front view
Fig.2-1 Front view
Page 19
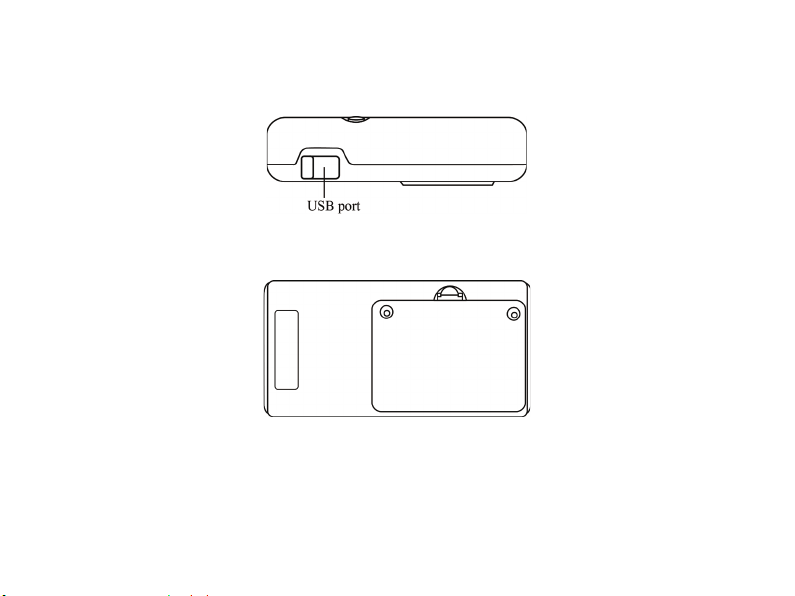
8
2.1.2 Side view
2.1.3 Bottom view
Fig.2-2 Side view
Fig.2-3 Bottom view
Page 20
9
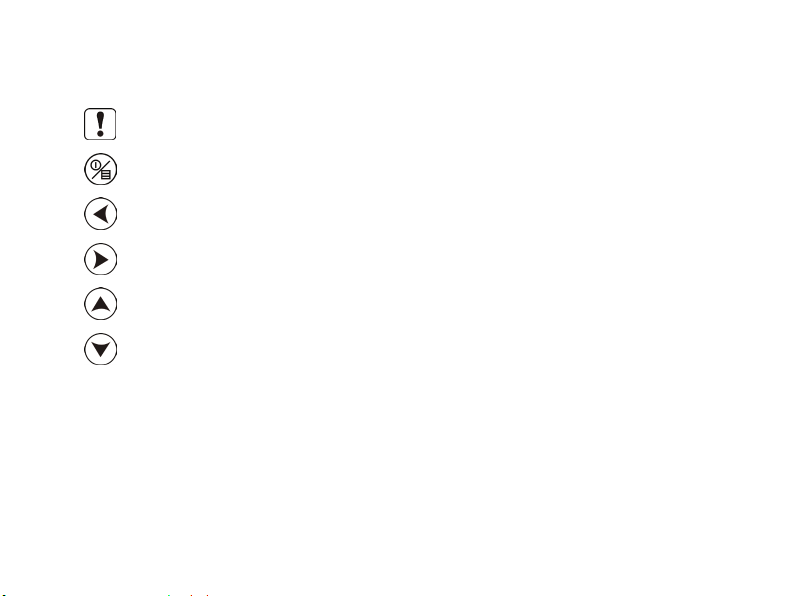
2.2 Definition of Keystoke, Interface and Indicator Light
function key: marker/affirmance/choice
function key: menu/cancel/turn on/off
direction key: left
direction key: right
direction key: go up
direction key: go down
Indicator light: (glint every 4 seconds when collecting ECG signal)
Show date communication status when connecting with the computer.
Page 21
1
Chapter 3 Preparing Work before Using
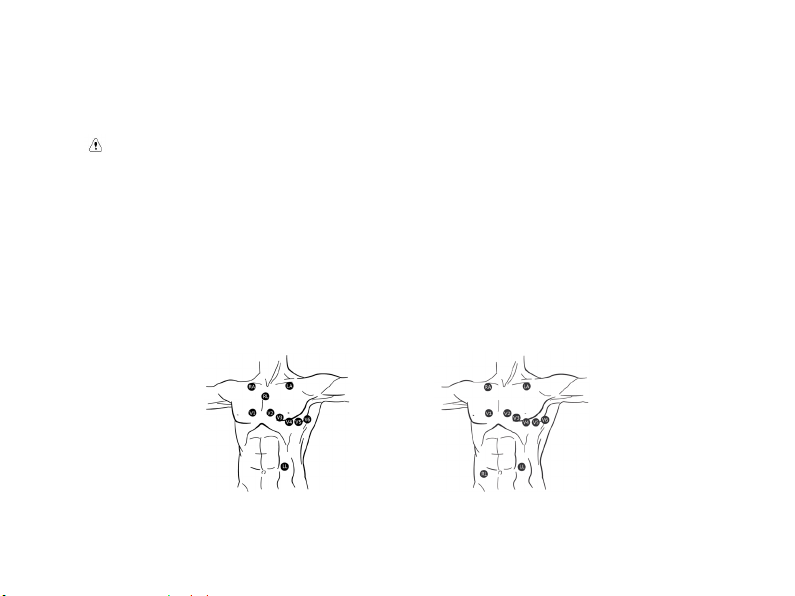
3.1 Electrode Placement
Notice:
The placement of electrode is the basic of holter recorder collecting ECG data signal. The
quality and position of electrode affect the quality of ECG signal. Please read this chapter
carefully before first operation.
The conductive part (applied part) of electrode should not contact with other conductive
parts or the earth.
Signal input/output part can be connected with the specified instrument only, please
contact our company for any replacement.
Position of the electrode placement is shown (as Fig.3-1).
Fig.3-1
Page 22

1
Deal with the skin
When attaching and placing the electrode, we need to deal with the skin at first, and be sure to
clean the skin. Use 95 % alcohol to scrub the skin, after the alcohol evaporates, use abrasive
paper attached to the electrode to wipe the attached place to remove cuticula on the surface of the
skin in order to reduce the resistance from the skin and the disturbance from the EMG. People
who have much hair need to shave it to ensure the skin well connected with the electrode. The
skin of old patients is dry and has many crinkles, so we have to clean the skin and make the
attached place flat. If the attached place is near the bosom of the woman patient, electrode and
cables should be covered by the bra and then fixed well.
Place the electrode
Use high-quality ECG electrode to attach the right place and connect with the correspond
electrode. To prevent the electrode drop and the baseline excursion caused by pulling, use the
medical adhesive belt or plaster to fix every electrode and cable properly. After the cables get
together, use the adhesive belt to fix in the abdomen; the rest cables can be tucked into the
recorder's waistband. Don't use the common adhesive belt to attach the cables for fear of dirtying,
corroding the cables and reducing the usage life span. If use the device in the environment of
high temperature or easy perspiring, "EKG Medical Gel" could be wiped on the skin around the
electrode beforehand.
Page 23
1
3.2 Battery Installation and Notice
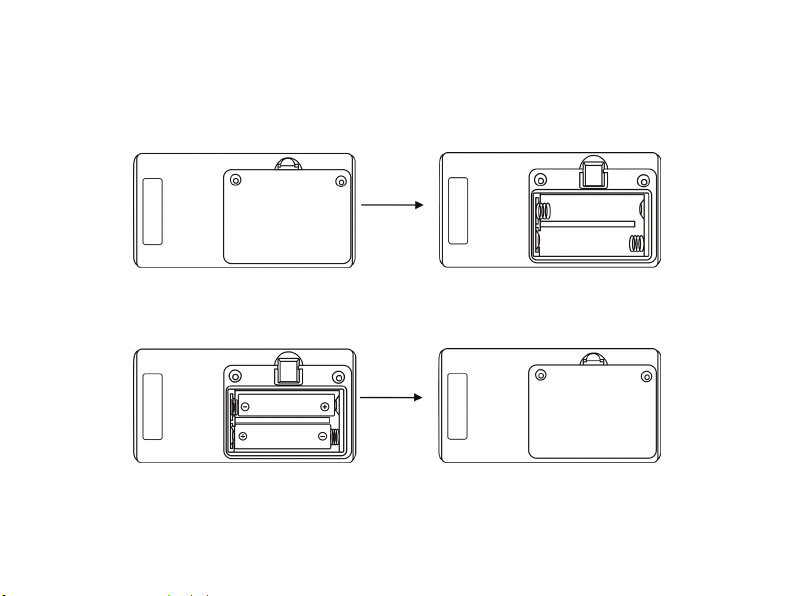
3.2.1 Open the battery cover according to the direction which the arrowhead on the cover
indicates. Follow as Fig.3-2.
Fig.3-2
3.2.2 Please insert the batteries properly in the right direction, and then close the cover. Follow
as Fig.3-3.
Fig.3-3
Page 24
1
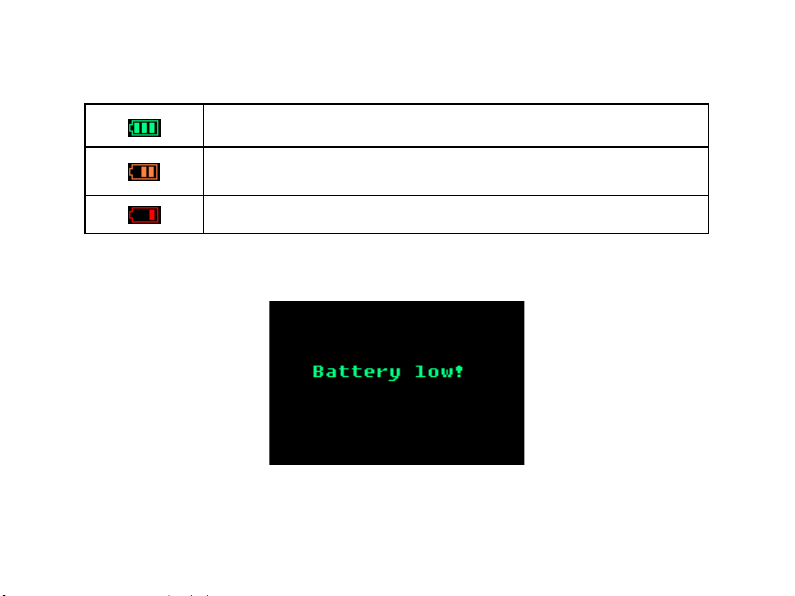
3.2.3 The state of battery and working requirements are shown as Table 3-a1.
The batteries are full, the device could run in gear.
The batteries are insufficient, suggest not record.
The batteries are almost drained, please replace the battery immediately.
Table 3-a1
When the batteries are almost drained and not replaced, the recorder will show the interface (as
Fig.3-4), and turn into protected mode.
Fig.3-4
When the energy of battery is low, the recorder turn into protected mode in order to protect the
Page 25
1
LA LL V1 V3 V5
RA RL V2 V4 V6
recorder from damaging. Under protected mode the device don't run until the device is
electricized by USB or the batteries are full.
Warning:
The batteries should be full when the device collects new information, otherwise the
recording time could not last long enough.
Notice:
Please confirm all electrodes and lead wires are connected well to patient. Otherwise,
interference in waveform at the beginning of record may lead to failure analysis.
Notice:
Please take off the battery after monitoring in order to protect the recorder from damaging
because of battery leak.
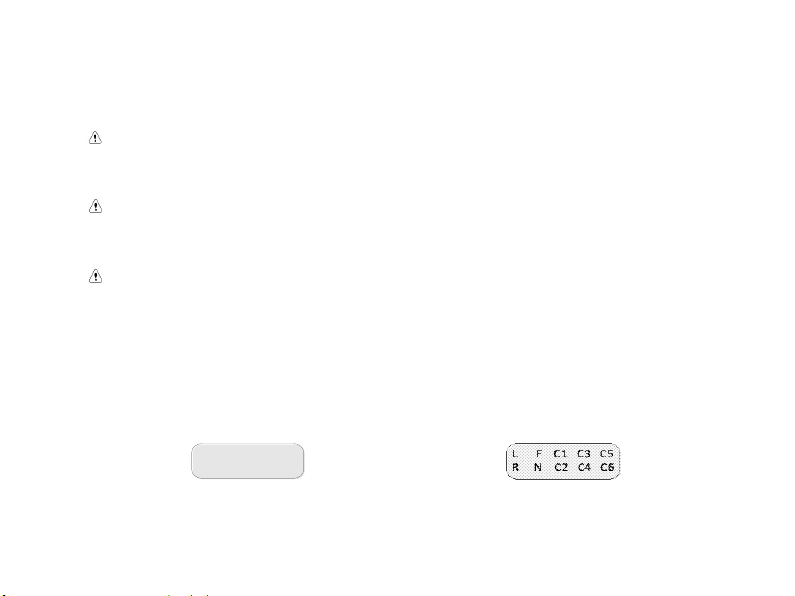
Instructions
The electrode indicator and pictures in this direction take example for usually American, if there
is some difference in the actual use,please operate and use refer to following usually European
indicator.
:
3-5 usually American 3-6 usually European
Page 26
1
usually American
usually European
LA L RA R LL F RL N V1
C1
V2
C2
V3
C3
V4
C4
V5
C5
V6
C6
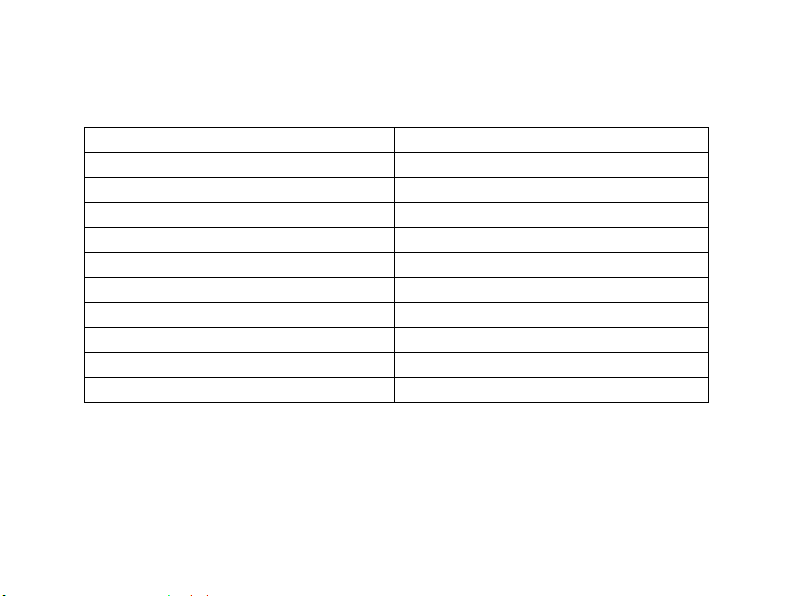
The usually American indicator is match up to the usually European indicator one by one, the
relationship of them are listed in the following table:
Page 27
1
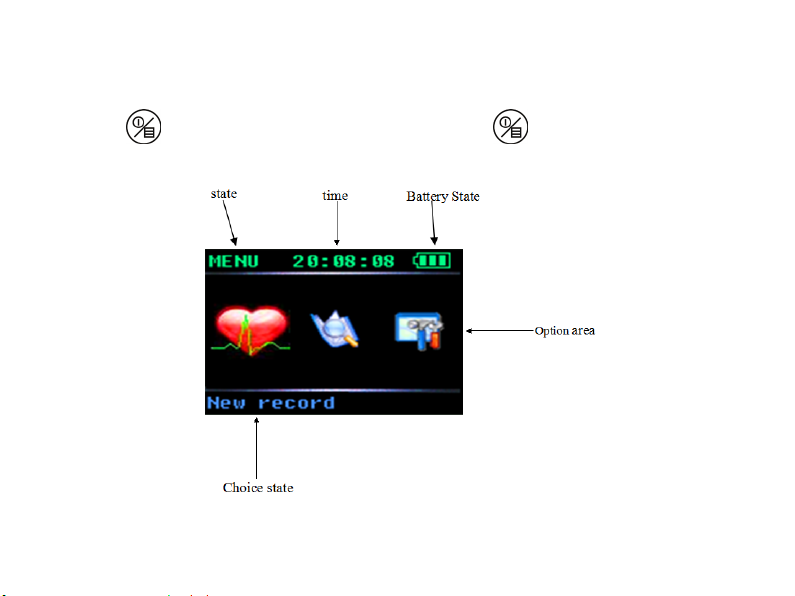
Chapter 4 Recorder Operation Explanation
Press for about 3 seconds to turn on the recorder (press for about 3 seconds to turn
off the recorder on the main interface), the main interface is shown in Fig.4-1.
Fig.4-1 Main interface
Page 28
1
4.1 New Record
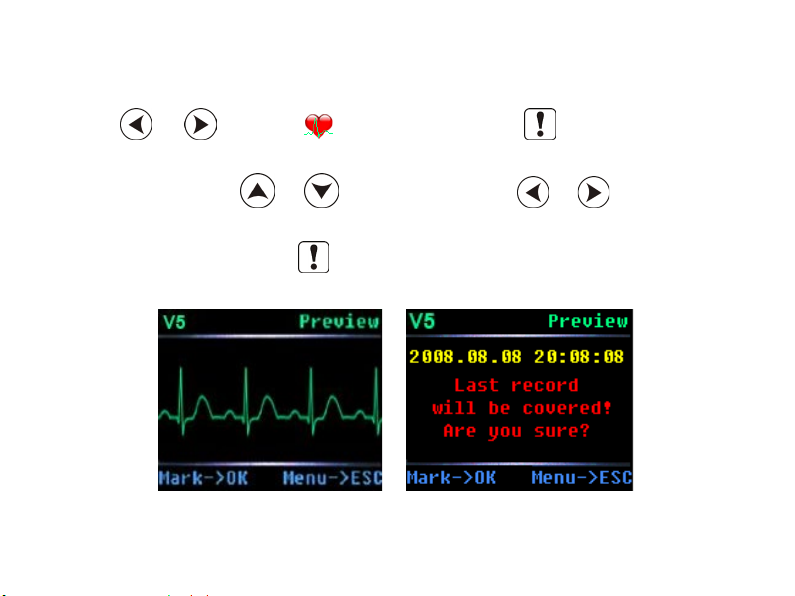
Use
operation, display interface is as Fig.4-2.
On the interface, press
status.
After recording one time, press
show the information "Last record will be covered! Are you sure?" as Fig.4-3.
or to choose on main interface, press to enter new record
or to change the gain, press or to switch lead
if you want to continue to record, here the interface will
Fig.4-2 Fig.4-3
Page 29
1
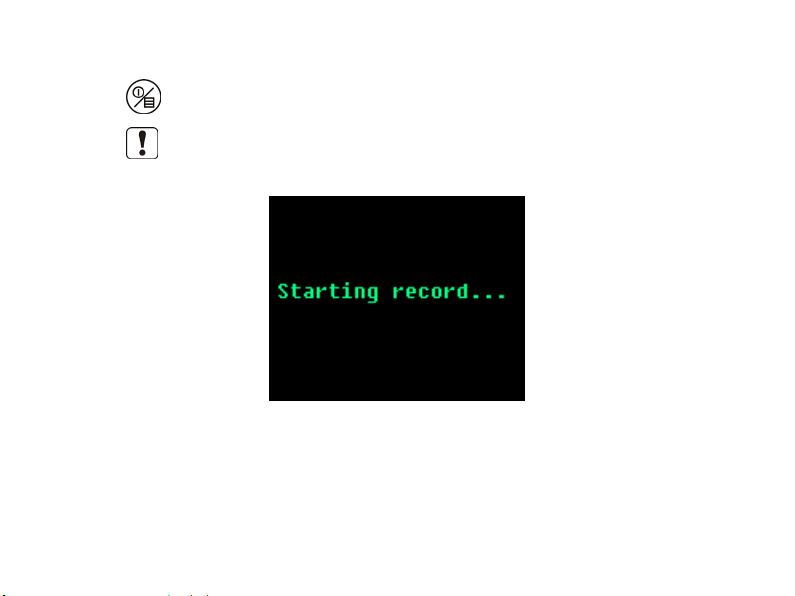
Press to cancel recording and return to the main interface.
Press
as Fig.4-4.
The interface as Fig.4-4 will last 2 seconds, then the recorder enter stand-by mode. The blue
indicator on the top left corner of recorder will glitter one time every 4 seconds to show the state
in gear.
to continue to record and the interface will show the information "Starting record"
Fig.4-4
Page 30
1
Press for about 3 seconds to record event marker when recording, in the meanwhile, the
beep from recorder indicates you have succeeded in event marker.
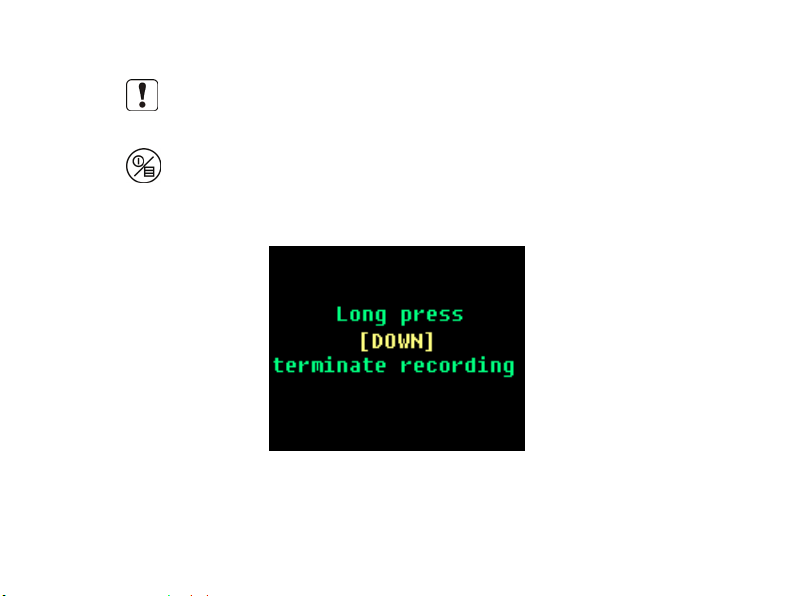
Press
recorder will show the information as Fig.4-5 to affirm whether the recording operation will be
stopped.
for about 3 seconds when recording if you want to end recording manually, then the
Fig.4-5
Page 31
2
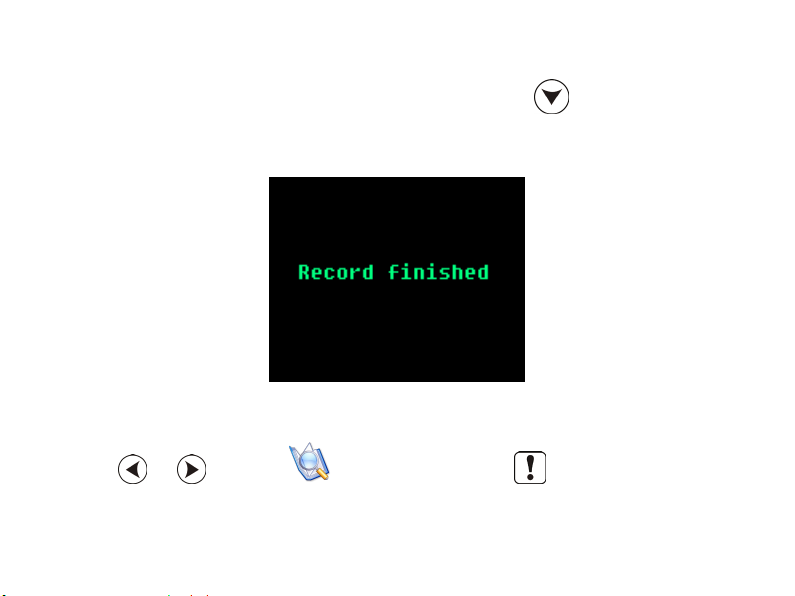
If you confirm that you want to terminate recording, please press for about 3 seconds
according to the information shown on the interface, at the same time the screen will display the
information as Fig.4-6. This interface will last about 2 seconds, then return to the main interface.
Fig.4-6
4.2 Review Record
Use
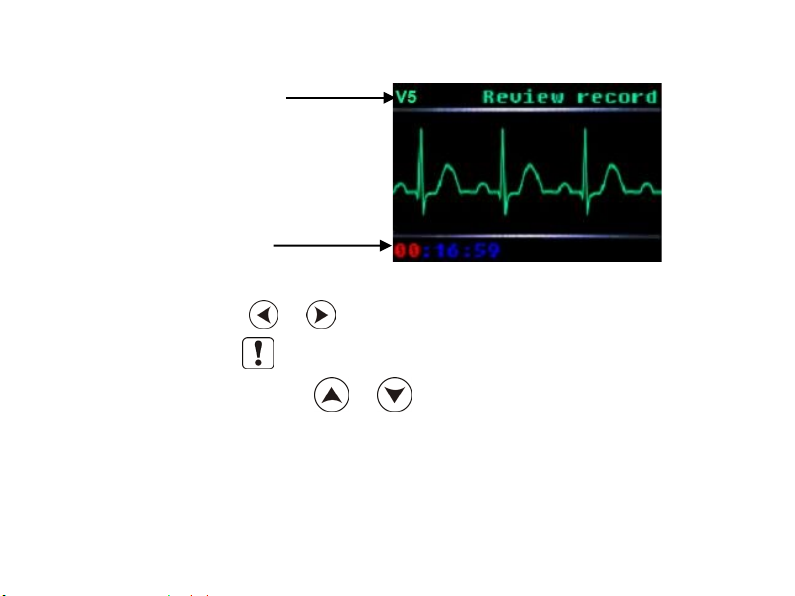
operation interface, if the recorder has storage record, there will be a interface as Fig.4-7.
or to choose on main interface, press to enter review record
Page 32
2
Lead state
waveform
display
Under this interface, use
V3, V4, V5, V6), press
option which has been chosen, use
or to change lead marker (Ⅰ, Ⅱ, Ⅲ, AVR, AVL, AVF, V1, V2,
to switch between hour, minute and second, the red one shows the
Fig.4-7
or to change the value.
Page 33
2
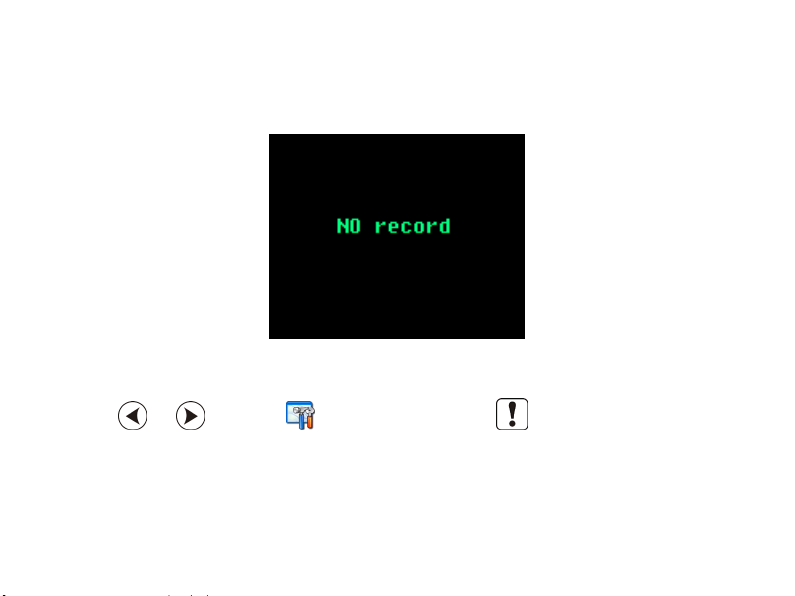
If the recorder hasn't storage record, there will be a "No record" information on the screen as
Fig.4-8, and the interface will return main interface automatically after 2 seconds.
Fig.4-8
4.3 System Set
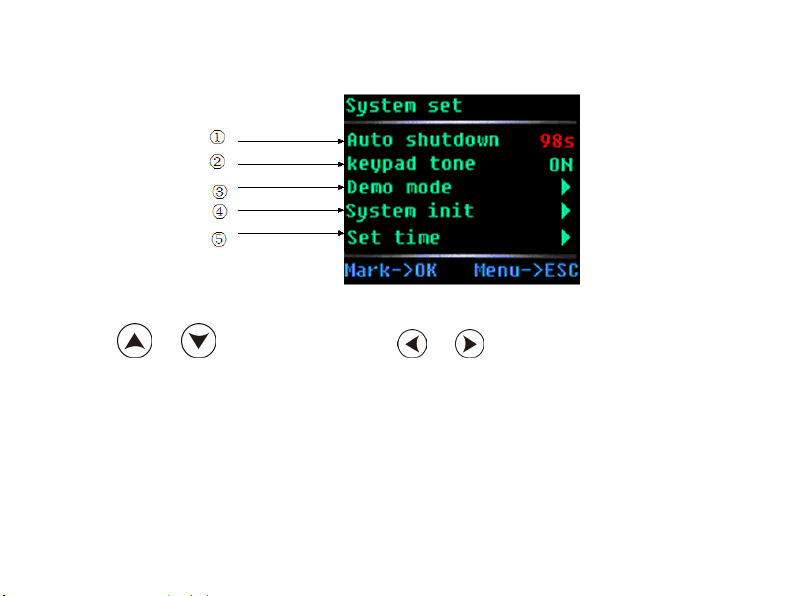
Use
interface as Fig.4-9.
or to choose on main interface, press to enter the "system set"
Page 34
2
Fig.4-9
Use
chosen or enter the inferior menu, the red one shows the option which has been chosen.
① Auto shutdown set
The time scope of auto shutdown is 3~98 seconds, if setting 99s, the recorder will open forever.
② Keypad tone set
Under this option, you can decide the keypad tone "ON/OFF".
or to choose the option, use or to set the option which has been
Page 35
2
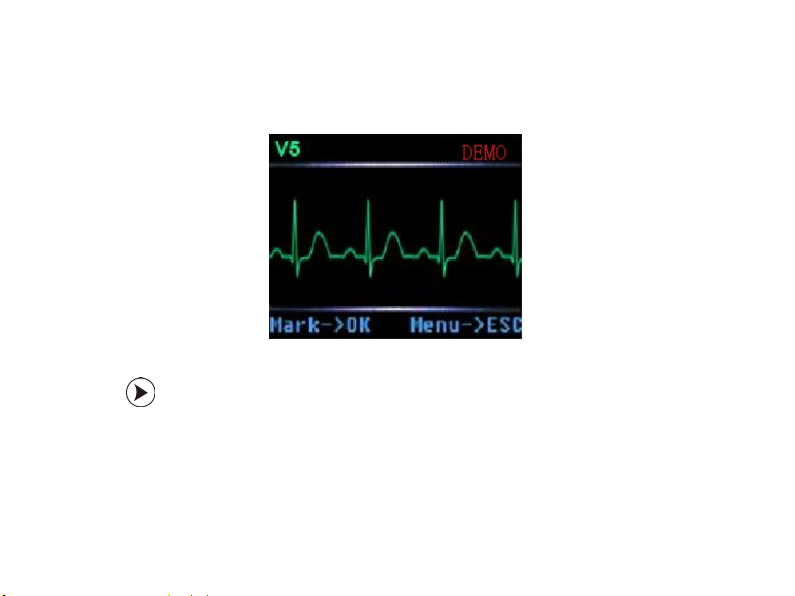
③ Demo mode
Under the item, the demonstration waveform is shown in Fig.4-10.
Fig.4-10
Press to switch ECG lead waveform.
Page 36
2
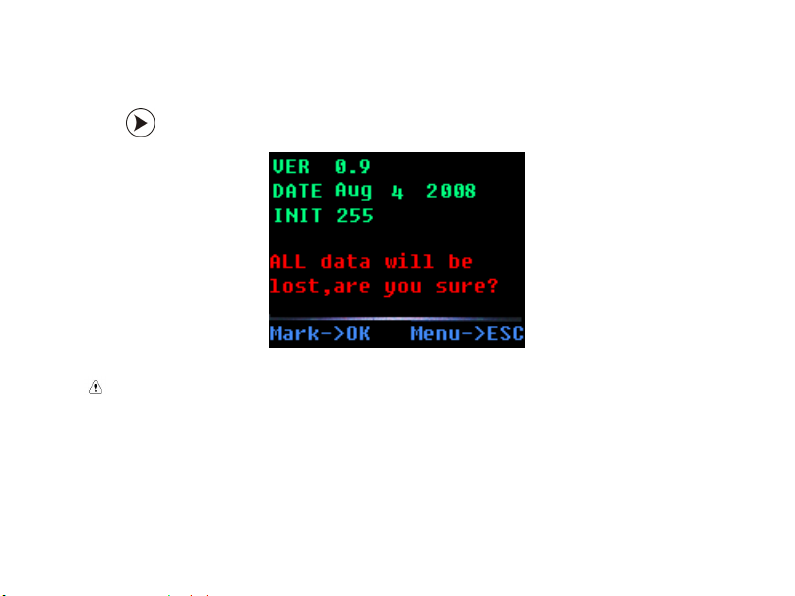
④ System initialization
Press
to enter the interface as shown in Fig.4-11.
Fig.4-11
Notice:
Detailed edition information depends on current recorder.
Page 37
2
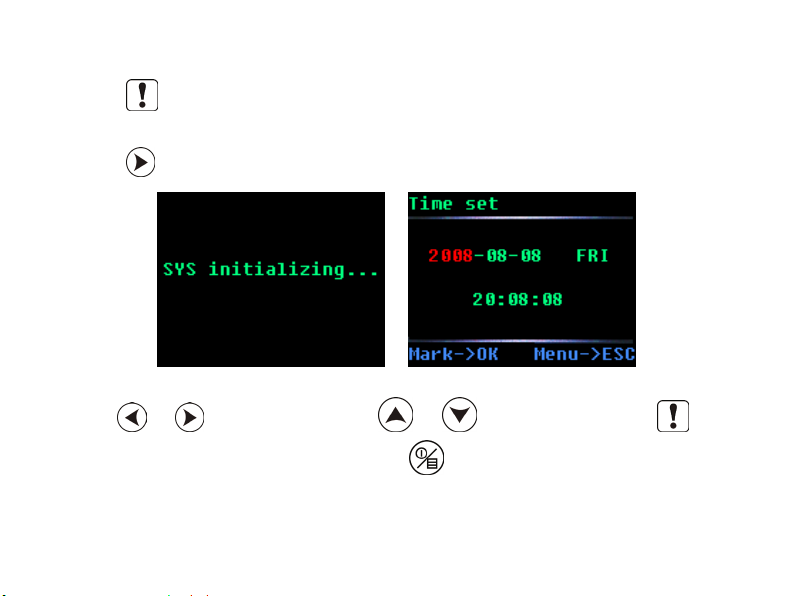
Press to enter the initialization interface as shown in Fig.4-12.
⑤ Time set
Press
Use or to choose the option, use or to change the value, press to
save the setting and return superior menu. Press
menu.
to enter the time set interface as Fig.4-13.
Fig.4-12 Fig.4-13
to cancel setting and returning superior
Page 38
2
4.4 Replay Record
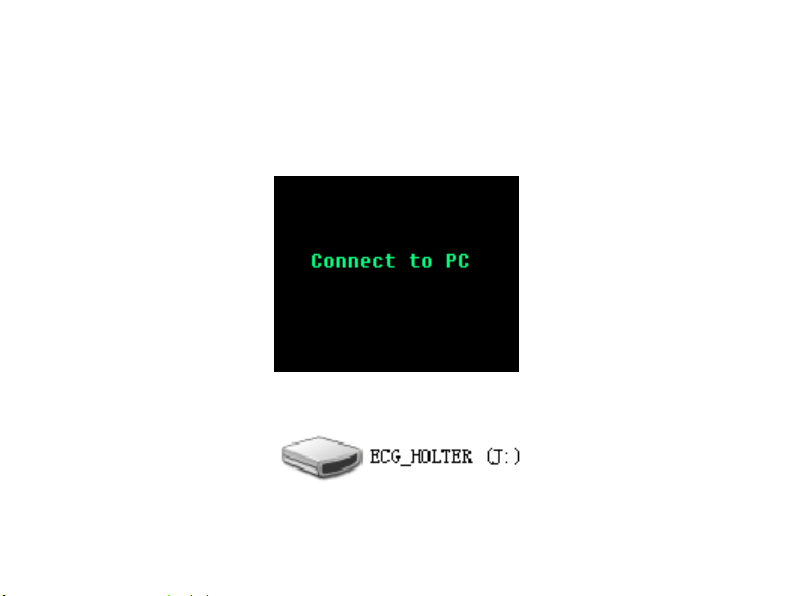
Please remove electrodes from patient, and then connect recorder to PC with USB cable. It is
recommended that batteries should be remained in the recorder. The indicator light is on, and the
interface displays the information as Fig.4-14 if the connection is normal.
Fig.4-14
In "My computer" of PC, there is a symbol as Fig.4-15.
Fig.4-15
Page 39
2
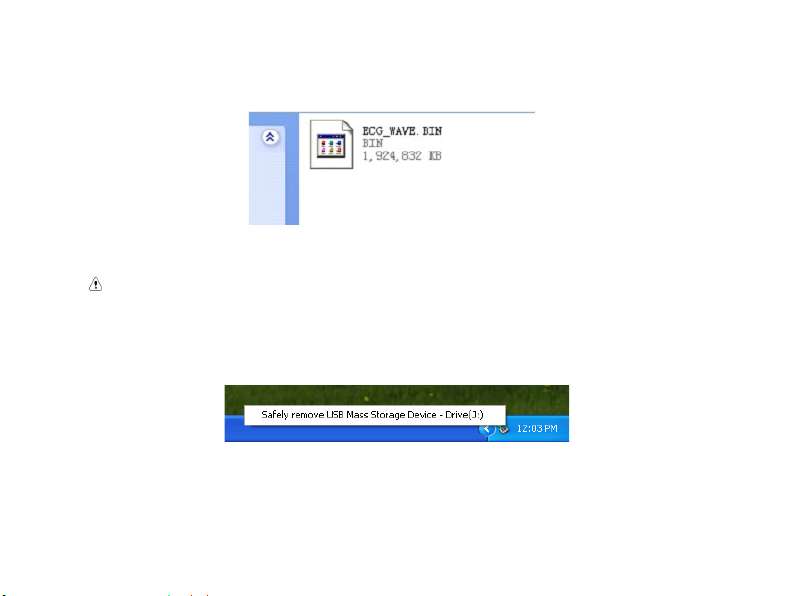
Open the disk, you can see a file named ECG_WAVE.BIN (as Fig.4-16).
Fig.4-16
Please choose this file of analyse software to perform the replaying operation.
Notice:
Please refer to the information of chapter 6 for the detail.
After replaying, please Safely remove USB Mass Storage Device as Fig.4-17, then pull out USB
connecting line to avoid damaging the device.
Fig.4-17
After cutting the connection with PC, this device will go back to the main interface.
Page 40

2
Notice:
The USB interface of recorder is USB2.0, please choose the USB2.0 interface in PC to
connect in order to make sure the speed of data communication.
Page 41

3
Chapter 5 Malfunction Analysis and Troubleshooting
5.1 Daily Maintenance
5.1.1 Maintenance after use
Long press
Unplug lead cables, please hold the plug part and do not pull the wire with force.
Clean the device and accessories.
Place the device in a cool and dry environment.
Do not soak the device into detergent for cleaning. Before cleaning the shell, please do turn the
device off. It is recommended to use neutral cleanser to wipe the recorder for its cleaning, then
air dry or use a clean and dry cloth to wipe it.
5.1.2 Inspection and Maintenance of Lead cables and Electrodes
Use a multimeter to detect the connectivity of the lead cable by checking whether each wire of
the lead cable is in good contact. The resistance of each wire from the electrode plug to the
corresponding pin in the lead cable plug should be less than 2Ω. The integrity of the lead cable
must be checked regularly. Any lead wire damage will cause a false waveform of the
corresponding lead or all leads on the ECG. The lead cable can be cleaned with water or neutral
to turn off the device.
Page 42
3
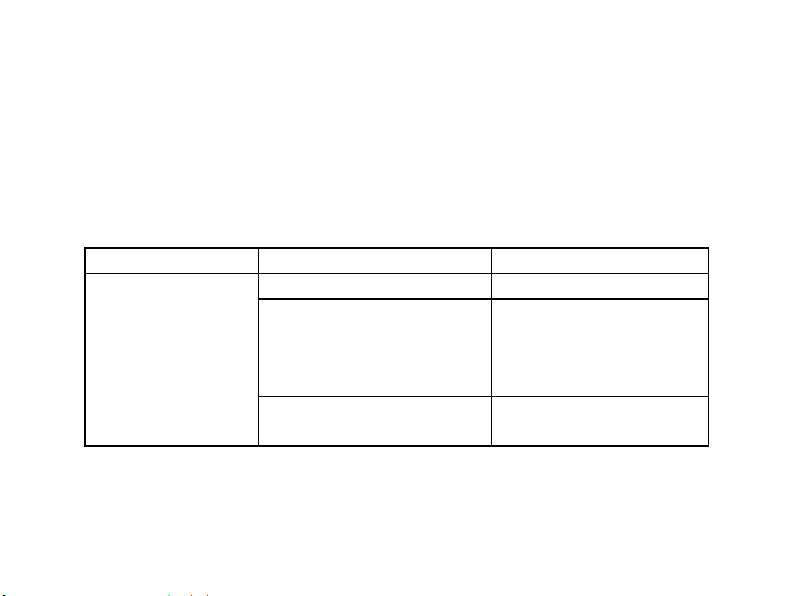
Problem
Cause
Correction
The recorder has no
response and the
indicator isn't light
1.The battery is used up.
Change another battery.
too low.
Change another brand of
"+" of battery and reed.
wrong.
Install the battery correctly
once again.
solvent. Do not use the detergent or germicide containing alcohol (Please do not immerse the
lead cables in liquid for disinfection).
Bending or knotting will shorten the service life of lead cable. When using it, please straighten
the lead cable first.
The lead cable should be replaced if it shows broken or corrosion phenomenon. The maintenance
of lead cable depends on its using frequency.
5.2 The Problem Related to the Battery
after the battery is put
in.
2.The battery can't connect with
the reed very well. The height of
"+" of some brand of battery is
3.The direction of the battery is
battery. or put a thick of metal
piece in the place between the
Page 43
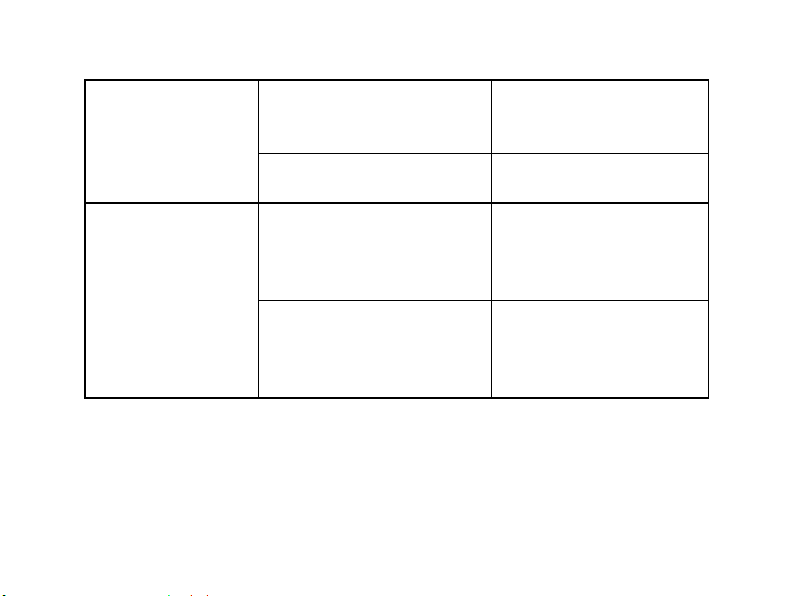
3
for a long time.
of the battery are different.
The data can't be
1. If the voltage above 3.5V,
which beyond the working
disk may be broken.
be damaged because the
out.
The record time of the
recorder can't reach 24
hours.
cleared away.
1.The quality of the battery is
poor. or the battery has been put
2. The characteristic and brand
voltage, part of the electron hard
2. Some part of the recorder may
electrolyte in the battery flows
Change another high-quality
new battery.
Change another new battery.
Please contact our company.
Please contact our company.
Page 44
3
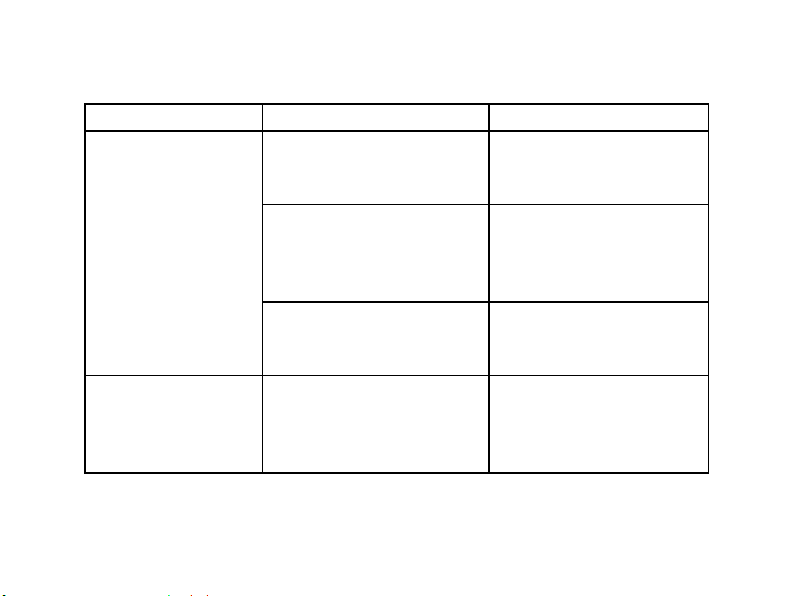
Problem
Cause
Correction
well, or the electrode isn't
attached right.
electrode is poor, or the
long time.
3. The movement of the
patient's upper limbs is too
severe.
ECG wave is small,
which is difficult for
analysis.
5.3 The Problem Related to the Skin and the Electrode
The wave is disturbed;
the quality of the ECG
signal is poor.
The amplitude of some
1. The skin can't be cleaned
2. The quality of the one-off
electrode has been stored for a
The cable is broken. Change a new cable.
Clean the skin and attach once
more.
Use new, high-quality
electrode.
Ask the patient to avoid severe
movement when monitoring.
Page 45
3
Problem
Cause
Correction
connect once again.
manual.
electrode is poor.
high-quality electrode.
5.4 The Problem Related to the Cable and the Input Plug
The output wave of the
recorder is a straight
line.
Some ECG wave is
disturbed a lot, and the
quality of ECG signal
is poor.
Please check if the needles of
1. The recorder isn't connected
well.
2. The cable is broken. Please contact our company.
3. The recorder is broken. Please contact our company.
1. The cable isn't connected
well
2. Lead cable is broken. Please change a new one.
3. The quality of the one-off
the plug is curved, broken or
lack. If the plug is well, please
Connect the cable once again
according to the operation
Please change new,
Page 46
3
USB cable.
The USB interface of computer
the recorder.
5.5 Other Problems
Problem Cause Correction
The communication
of data is failed.
There is something wrong with the
don't match the USB interface of
Change another USB cable.
Use 2.0 interface.
Page 47

3
Chapter 6 Instructions for Analysis Software
Overview
PC software name: 12 Channels ECG Holter System_L
PC software specification: no
PC software version: V5
Version naming rules: V<major version No.>.<minor version No.>.<revised version
No.>.<revised version No.>
PC software version can be obtained from PC software.
Algorithm:
Name: refer to Annex II
Type: ECG waveform processing algorithm
Purpose: be used for the check of waveform data analysis and calculation.
Clinical function: the algorithm is used to analyze and calculate the ECG waveform data
of the patient, provides the basis for diagnosis.
Page 48
3
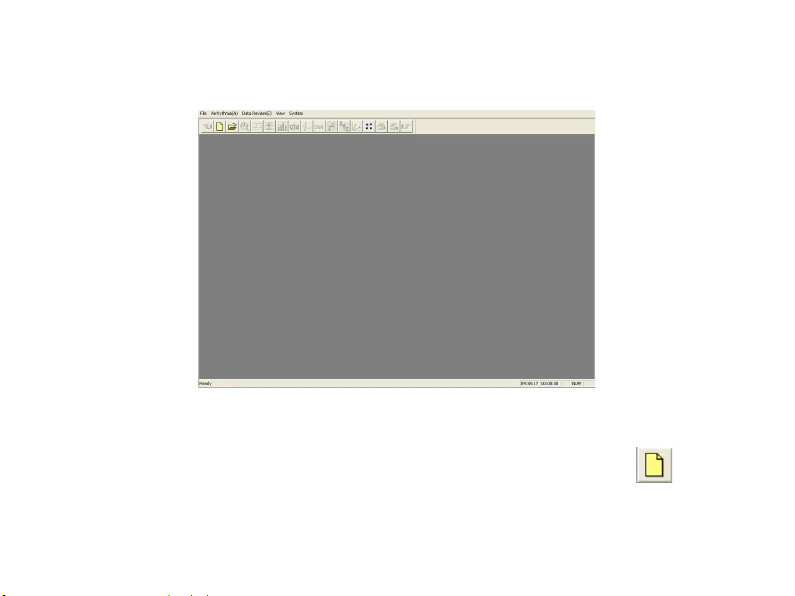
Start the analysis software for this system. The main interface is shown as (as Fig.6-1).
Fig.6-1
Replay HOLTER Recorder
Connect the HOLTER recorder with PC. Click the "New" in the menu of "File" or
input the new patient information.
, then
Page 49
3
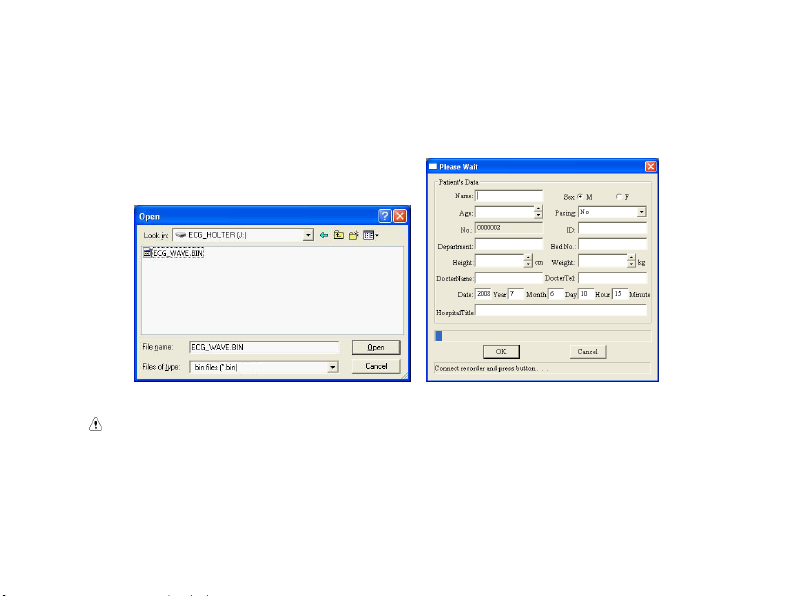
If the recorder to be used TF memory, please choose the collection file ECG_WAVE.BIN (as
Fig.6-2) first. Certainly you could also copy the case history to other place, then choose. If the
recorder to be used Flash memory, please turn to Fig.6-2.
Fig.6-2
Notice: If the patient takes a pacemaker, choose "Yes" in the item "pacing", then the
system can add the function of pacing analysis.
Page 50
3
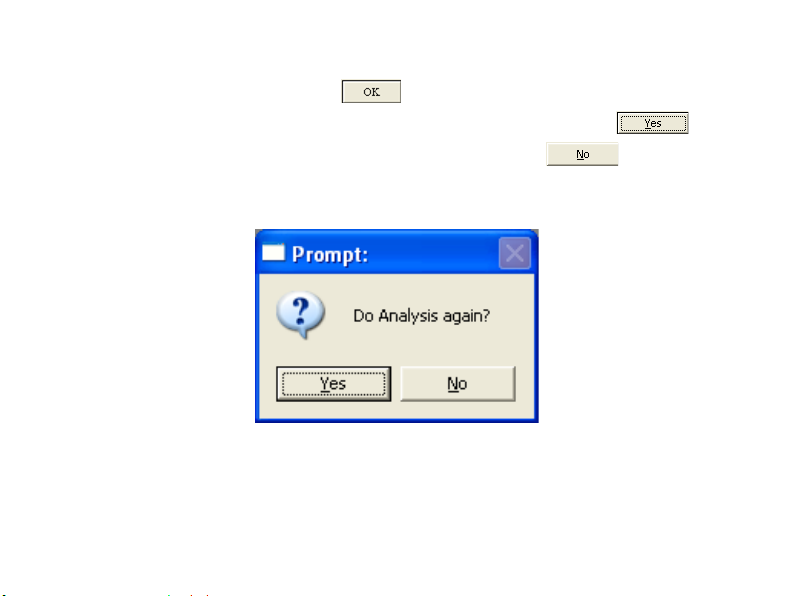
After inputting the patient's data, click , and the computer begins to read data from the
recorder. The process will finish when prompt as Fig.6-3 show up. Here click
enter the interface of arrhythmia analysis (as Fig.6-5), and click
template replay interface (for the analyzed cases) or to the order replay interface (for the not
analyzed cases).
Fig.6-3
to enter the
to
Page 51
4
Notice:
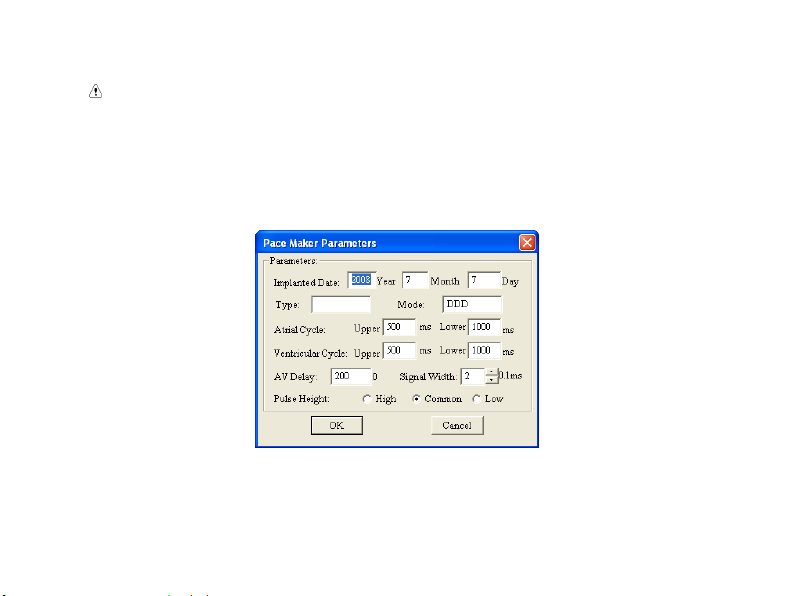
If the patient takes a pacemaker, the pace maker parameters setup interface (as Fig.6-4)
will pop up before arrhythmia analysis interface appears. Here doctors need modify the
following items according to patient's pace maker parameters. There into the accuracy of
pacing pulse analysis relates to the "high" or "low" of pacing pulse, usually it should be
"common", if the pulse is very low, please choose the "high".
Fig.6-4
Page 52
4
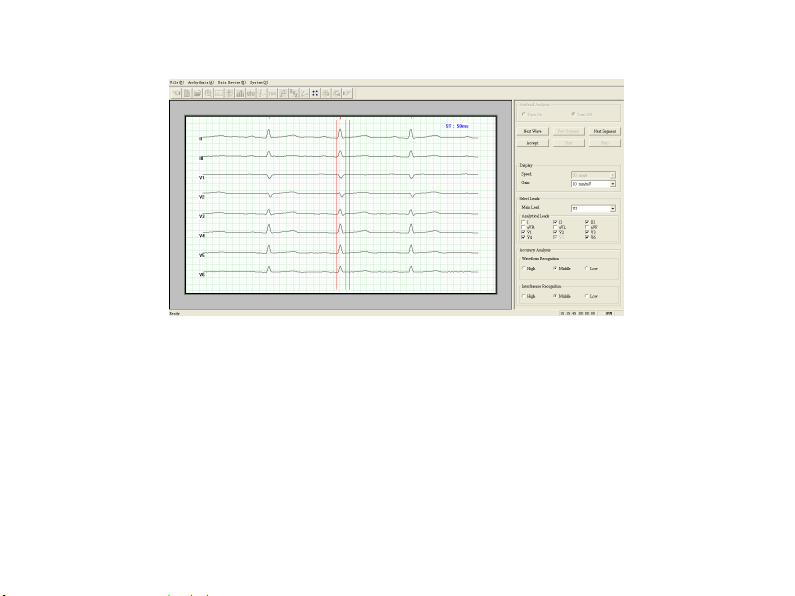
Fig.6-5
The left side of the interface (as Fig.6-5) is the waveform display window, showing the waves of
all analyses leads. Here need operators choose a meaningful wave to diagnose and adjust the
value of ST segment. Look at the picture. The three colored lines from left to right are baseline
point, ST segment beginning point, and ST segment ending point. If you want to adjust a line,
click this line to select it, and then move it through "←→" on the keyboard.
The right side of the picture is the control window, well the "Artificial Analyze" option is
designed for extending function.
Page 53

4
If the current wave is good, please click the "Accept" button, and then the system enters the
arrhythmia analysis (as Fig.6-6) automatically. If the user wants to exit this program, please
close direct. If the current wave is not good, please click the "Next Wave" or "Next Segment"
button, then the system will show the waves constantly until you click "Accept" to enter the
arrhythmia analysis.
Click the "▼" button at the right of "Show Lead" to choose other leads as main analytical lead.
RR refractory period: This parameter is general 300ms, it means the shortest time between the
two heart beats, the default value is 300ms, the user can adjust it according to the specific
circumstance, if the patient's heart rate is too quick, it should be set as low as possible, in order to
prevent losing the analysis for some heart beats.
Click the options under the "Leads Analyzed" could decide which leads to be analyzed, the
default is 8 collected leads.
When the amplitude of the case's wave is too low, please choose "H" in the resolution option
("Height").
When the case meets much disturbance, please choose "H" in the "distinguish O" Option. The
options "Height" and "distinguish O" don't need to adjust generally. The user can choose
according to the actual circumstances.
Page 54
4
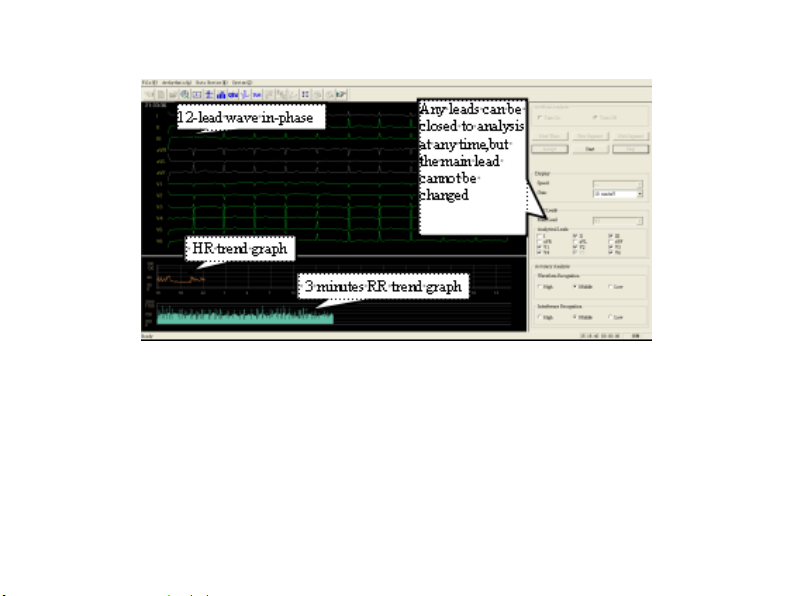
Fig.6-6
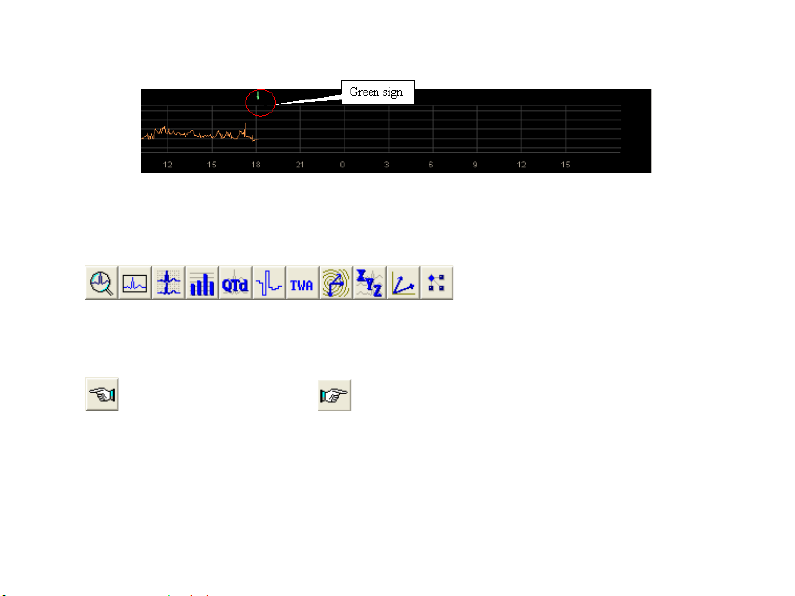
Click the "Stop" button, the system will stop temporarily. User can browse the 12 lead ECG
through "←↑→↓" on the keyboard. In the HR trend graph, there is a green symbol line, which
represents the place of the current wave. User can go back to a point, change condition ("Leads
Analyzed", "Height", "distinguish O"), click "Start", the part starting at the green sign will be
analyzed again. (as Fig.6-7).
Page 55
4
Fig.6-7
When the analysis finished, press "←↑→↓" on the keyboard to go back to certain point to
analyze again if necessary.
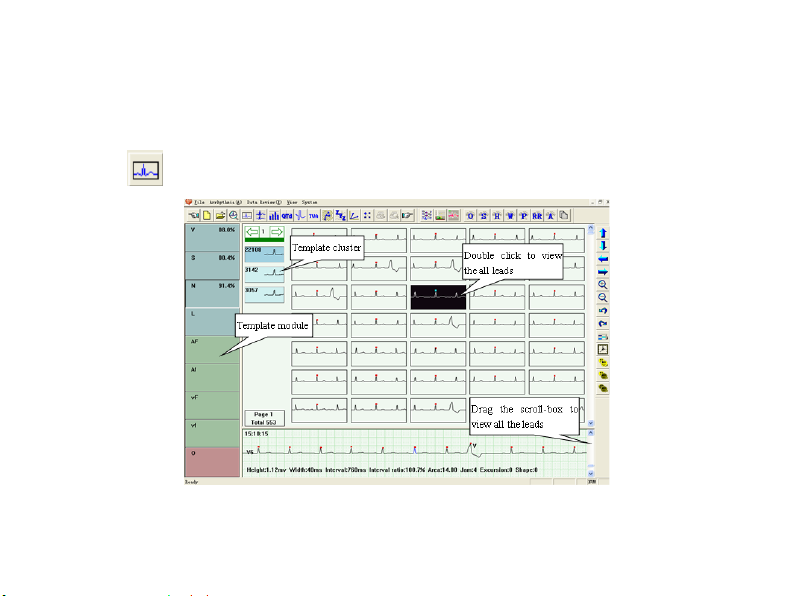
General function explanation of edit module
Represent: Arrhythmia analysis module,
Template replay module, Order replay module, HRV analysis module, QTD analysis module,
HRT module, TWA module, VCG module, VLP module, TVCG module and Parameter
definition module.
Go to the previous operation go to the next operation
Scroll bar usage
Click the "▲▼" at the right side of the Window or scroll bar to change the content shown in the
window.
Change window size
Page 56
4
Move the mouse arrowhead to the side of box, when the arrowhead turn to "↔"or"↕", press the
left keypad of mouse and don't set free until drag to the wanted location.
Screen interface distributing
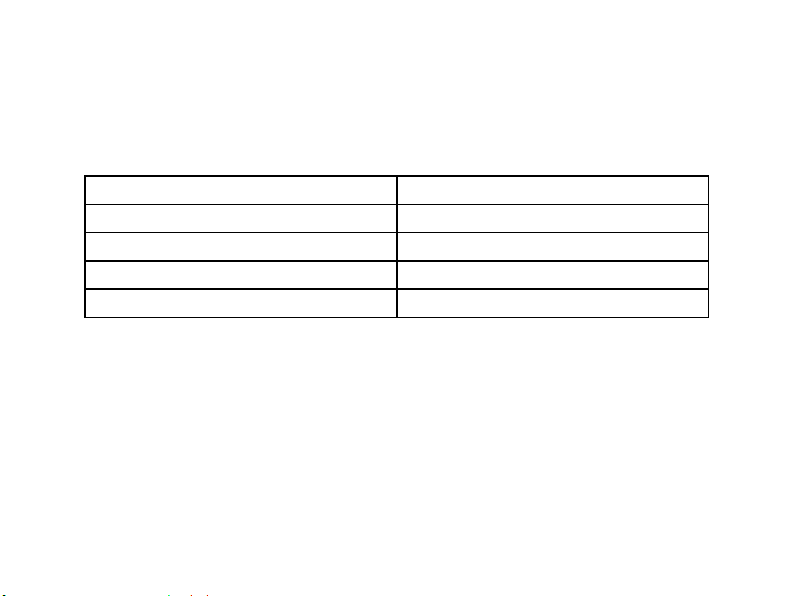
Click
into the template replay module. (as Fig.6-8)
Fig.6-8
Page 57
4
V: ventricular premature beat module
AF:atrial flutter module
S: supra premature beat module
Af: atrial fibrillation module
N: normal beat module
VF: ventricular flutter module
L: pause module
Vf: ventricular fibrillation module
O: Interference module
The left window is the template window. Every button is a template. The letter in the button
represents the type (for example: V means ventricular premature beat, S means atrial premature
beat), the percentage means what percentage this kind is in the total. No percentage means no
wave.
The top right window is display window for the selected template in the template cluster, which
displays every waveform.
The bottom right window is the waveform show window, which displays the detailed
information of the waveform which the mouse is pointing.
Page 58
4
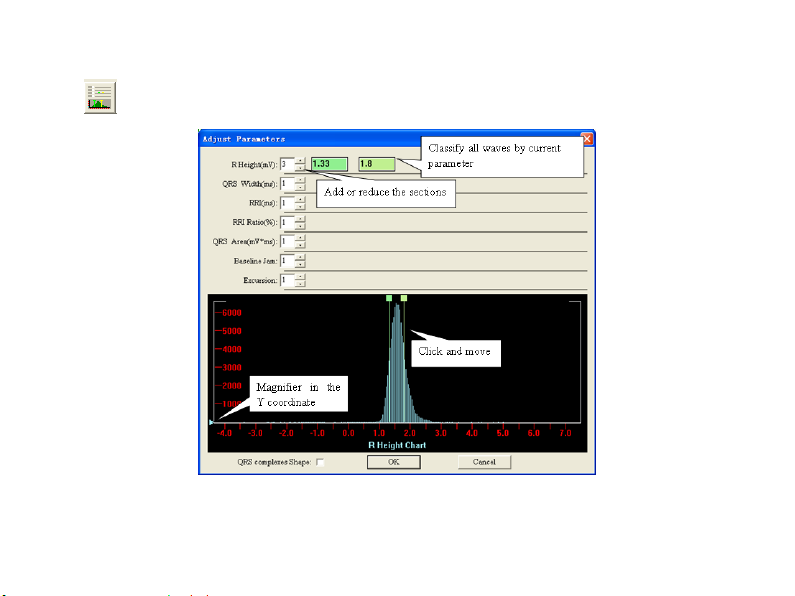
classifying parameter adjustment function (as Fig.6-9).
Fig.6-9
Page 59

4
Parameter name: the name of the parameter to be classified.
Number of class: set how many classes the parameter will be classified. It can be increased or
decreased by "▲" or "▼" buttons. When it increases 1, the numbers of both the threshold limit
value at its right and the boundary in the parameter distribution graph will also increase 1, and
the reverse is true. The number of class should be among 1 and 7.
Threshold Limit Value: the value of the corresponding boundary in the parameter distribution
graph.
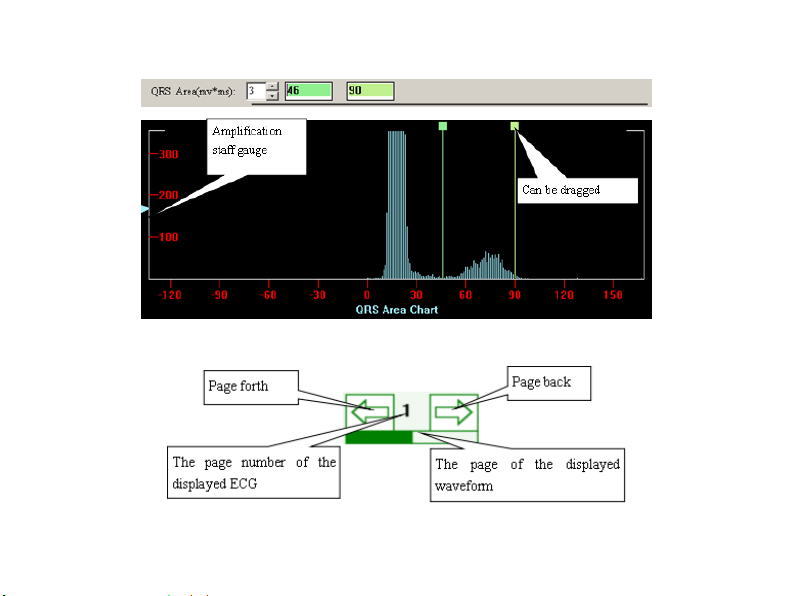
Parameter distribution graph: take the area distribution graph of QRS wave for example.
Fig.6-10 shows the distributing graph of the wave. The y-axis is the number of QRS wave, the
abscissa is the value of wave. The classified line corresponds to the editor box above. Move the
line by dragging the pane on it to change its threshold limit value. The blue triangle on the left is
the amplification staff gauge, you can change the magnification factor of the y-axis the by
dragging it up and down with the left key of the mouse.
Page 60
4
Fig.6-10
QRS complexes shape: select it to sort the waves according to QRS shape.
Page 61
5
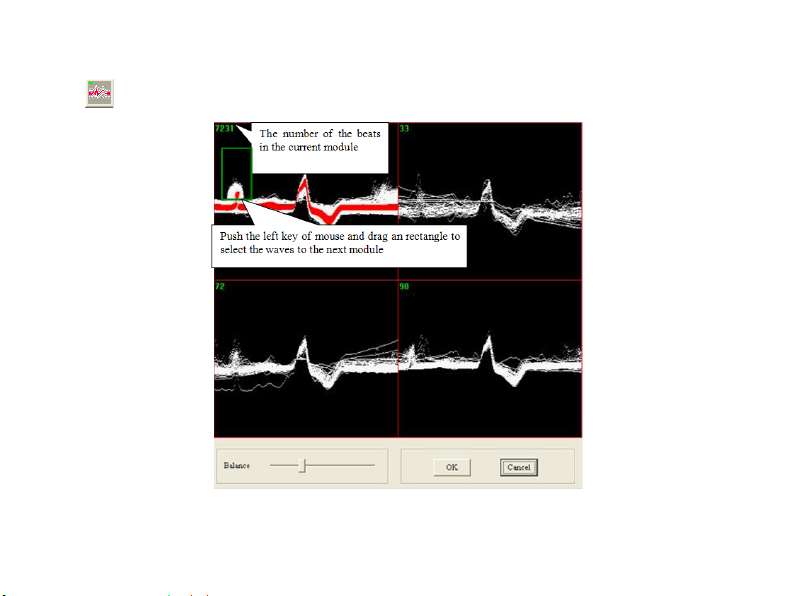
Classify all the selected beats by Demix;
Page 62
5
Enter the Demix analyze all the selected beats are shown in the fist module, the density of the
wave is more higher and the color is more ducker. Use the balance scroll-box to regulate the
color of density of the wave. Click the button "OK" can classify the selected beats.
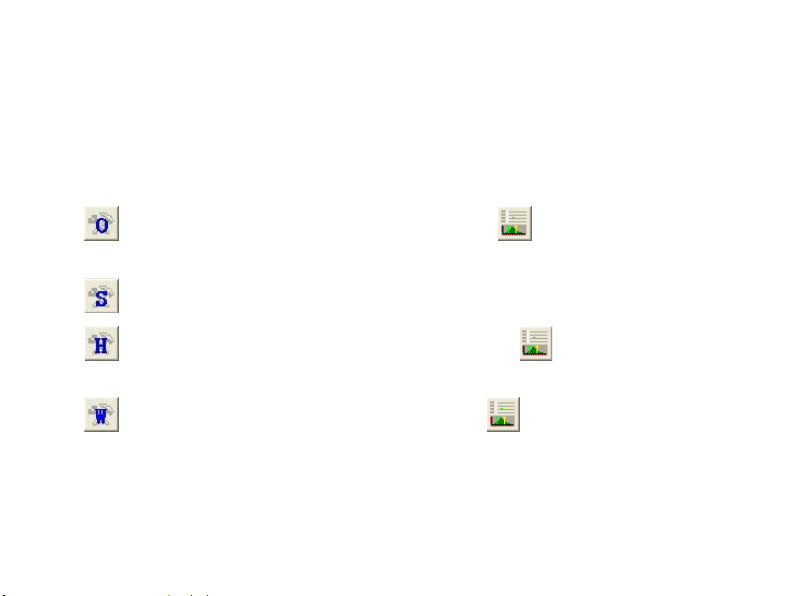
Quick classify
Classify by the shape of the Baseline jam, click the button to change the default
parameters;
Classify by the shape of the wave’s shape;
Classify by the shape of the R wave’s height, click the button to change the default
parameters;
Classify by the shape of the QRS width, click the button to change the default
parameters;
Page 63
5
Classify by the shape of the RR Interval, click the button to change the default
parameters;
Classify by the shape of the RR Interval Ratio, click the button to change the default
parameters;
Classify by the shape of the QRS’s Area(mv*ms), click the button to change the
default parameters.
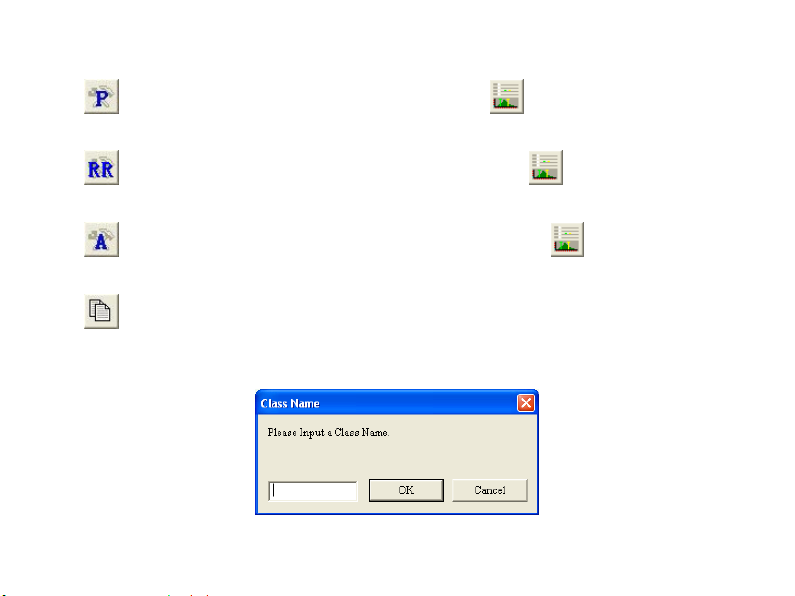
Add a new class: When click this button, the window "Class Name" as the following
figure will appear. Input the class name, viz. name of the new template that you want to add in
the blank, and click "OK", a new template will appear in the "template window" at the left side.
Page 64
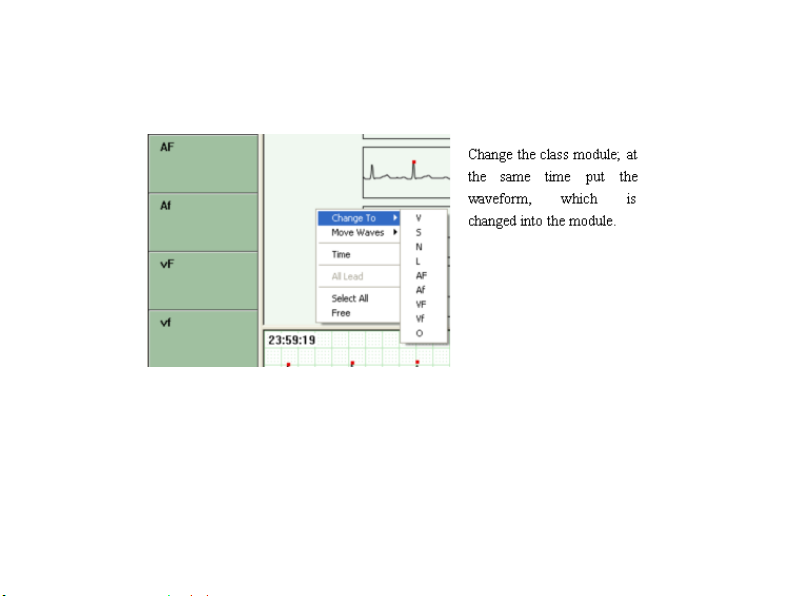
5
Right button editor menu
Click the right button of mouse, and then an editor menu will be opened.
Shortcut key
"V", "S", "N", "L" are the shortcut key to put the chosen wave into that class.
"Page up", "Page down", "home", "end", "^", "v" mean page up, page down, to the beginning of
the page, to the end of the page, up and down.
Page 65
5
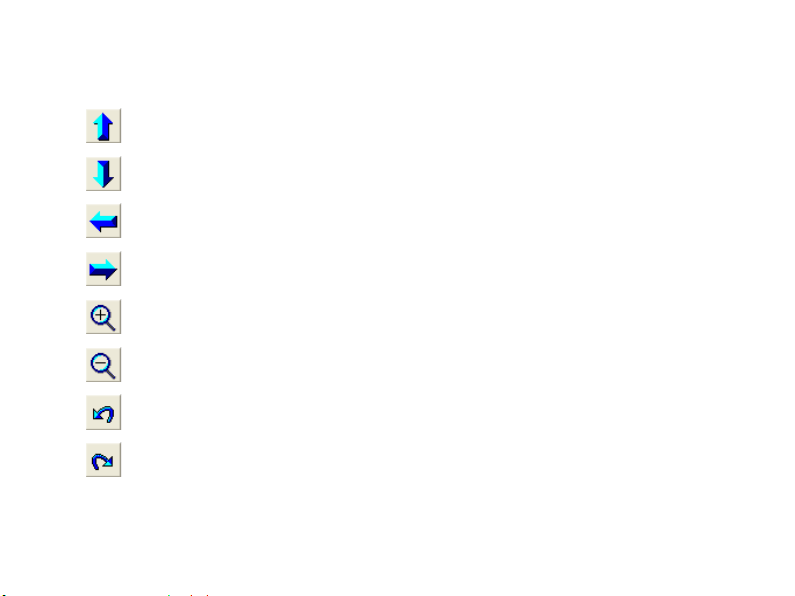
Control graph display key
Remove the ECG in the left window up
Remove the ECG in the left window down
Remove the ECG in the left window left
Remove the ECG in the left window right
Amplify the ECG in the left window
Lessen the ECG in the left window
Cancel the edit operation
Recover the edit operation
Page 66
5
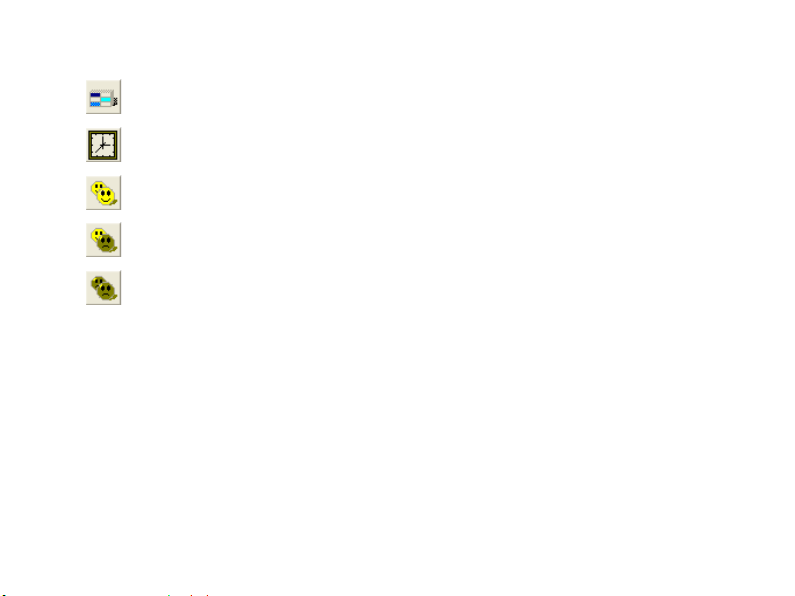
Display or hide the microimage
Display or hide the time
Choose all the ECG in the left window
Reverse choice the wave in the left window
Cancel choice in the left window
Page 67
5
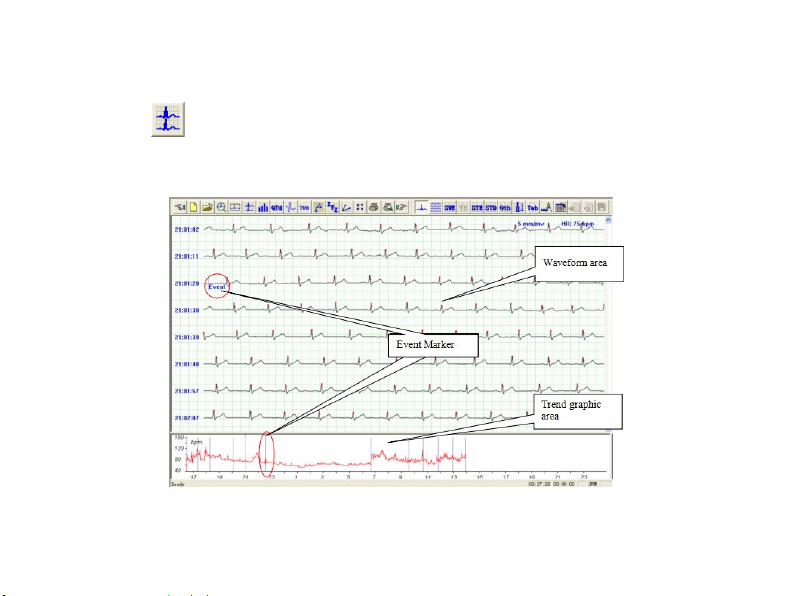
Order replay module
Click the
The waves of main analysis lead is displayed in the window as default. The event is the heart
beat mark.
button and enter order replay module.
Fig.6-11
Page 68
5
Event marker, including the blue lines and "Event" in the waveform area and the blue lines in the
trend graphic area, shows the operator has press the event button on this position and recorded an
event.
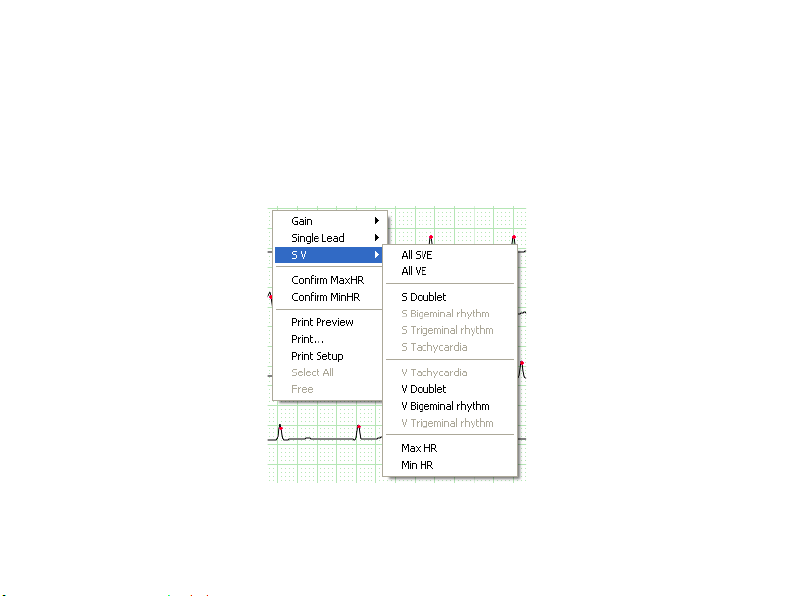
Put the arrowhead on the ECG and click the right key of the mouse, then appear the menu as
Fig.6-12. The physician can examine and analyze the ECG according to what he needs.
Fig.6-12
Page 69
5
Click "Gain" to adjust the wave's gain, viz. Amplification factor.
Click "Single lead" to change the lead no. and display the ECG of appointed lead.
Click "SV" to display all the strip graph of the appointed kinds in the current ECG.
Prompt:
The strip graph is a graph that it can plot a single lead ECG wave in a quadrate area and mark the
beginning time and average heart rate. The wave of 3.5s after the beginning time is the main
wave.
Pressing "Ctrl" key on the keyboard and clicking the left key of mouse on one strip graph can
select it to change the attribute or delete. The background of the selected strip graph will turn
black. The same operation can also cancel the selection.
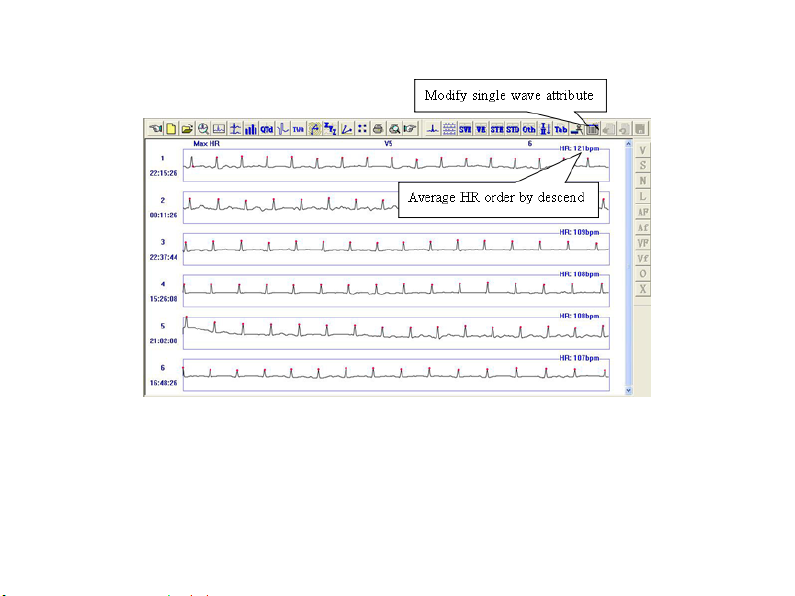
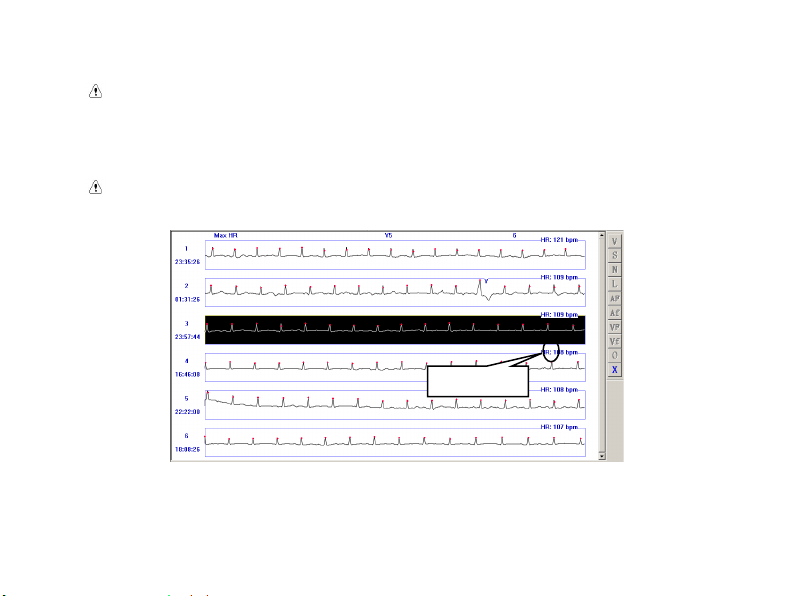
The following is the introduction taking example for "Max HR".
Click "Max HR" in the menu as Fig.6-12, and the strip graph of the max heart rate will appear,
which is for the main analytical lead. Of course, the physician can choose other leads according
to the needs by
button (as Fig.6-13).
Page 70
5
Fig.6-13
Page 71
6
V: Change type into ventricular premature
beat
S: Change type to supra ventricular
premature beat
N: Change type to normal beat
L: Change type to pause
AF: Change type to atrial flutter
Af: Change type to atrial fibrillation
VF: Change type to ventricular flutter
Vf: Change type to ventricular fibrillation
O: Change type to interference
X: Delete
In this interface, the software selects NO.1 strip graph as Max HR automatically. If you want to
change into other graph manually, click the right key of mouse on that graph and select "confirm
Max HR", then this graph will be set as Max HR and changed into the NO.1 graph, following
that, Max HR in the main report will also change.
Page 72
6
The X
Notice: for Max HR, default 6 strip graphs are displayed. If all of that 6 graphs are
interference waves or false error, select a graph and delete it. Then the software will
automatically analyze and get a new Max HR strip graph and add to the display, as
Fig.6-14.
Notice: it is similar between Min HR and Max HR in display and operation, so there
will be no extra introduction in the following content.
Fig.6-14
Page 73
6
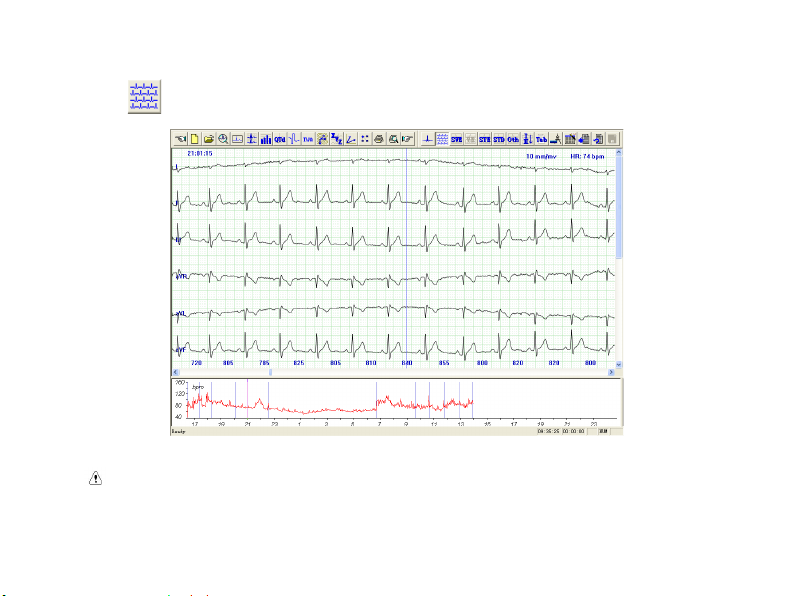
Click button, show the multi-lead ECG from the starting time (as Fig.6-15).
Fig.6-15
Notice: in the display interface of the strip graph, double click a graph with the left
key of mouse to switch it to the multi-lead cardiogram on the same time.
Page 74
6
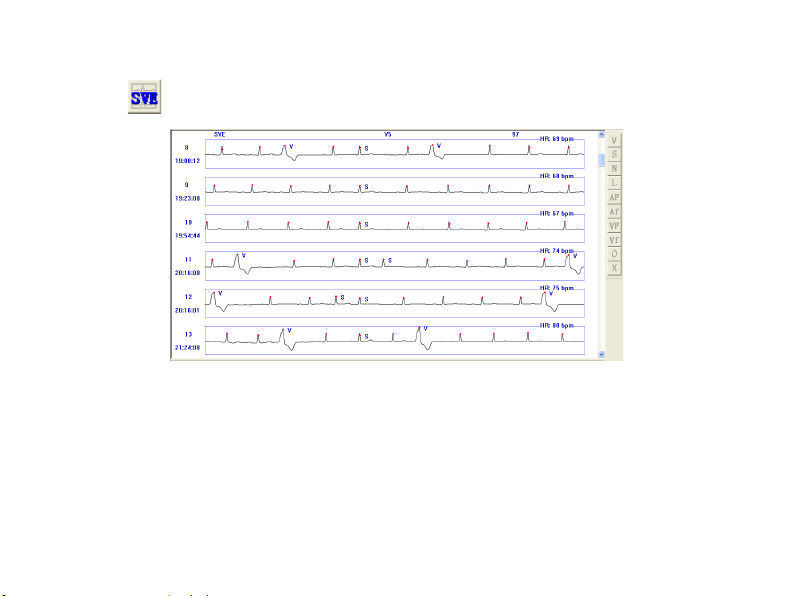
Click button, show the strip graph of supra ventricular electrocardiogram.
Fig.6-16
Page 75
6
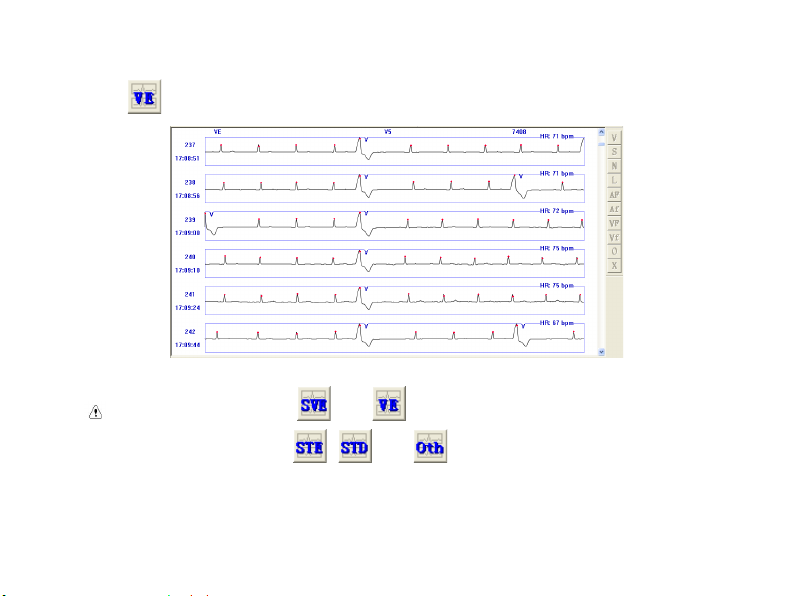
Click button, show the strip graph of ventricular electrocardiogram (as Fig.6-17).
Fig.6-17
Notice: the strip graph of and can be modified on attribute in the selected
state, while the strip graph of
, and can only be deleted.
Page 76
6
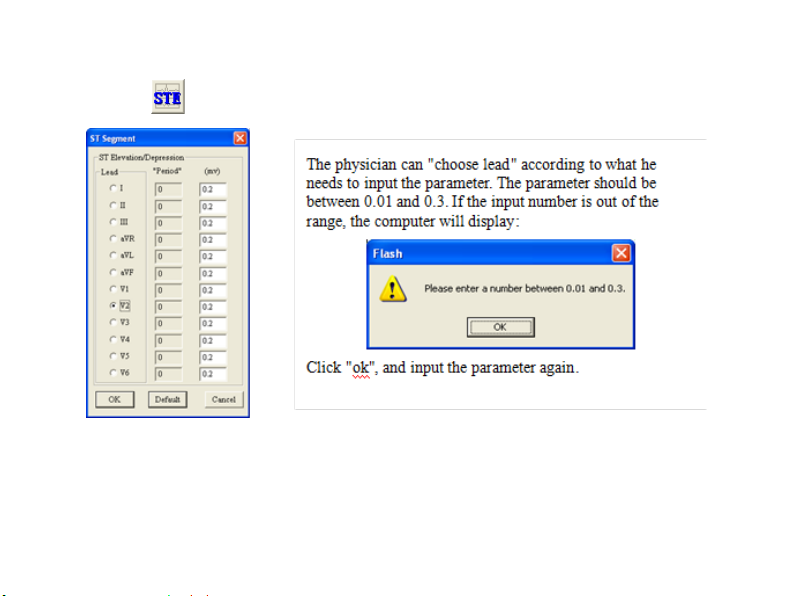
Click the button, enter ST elevation ECG analysis.
Page 77
6
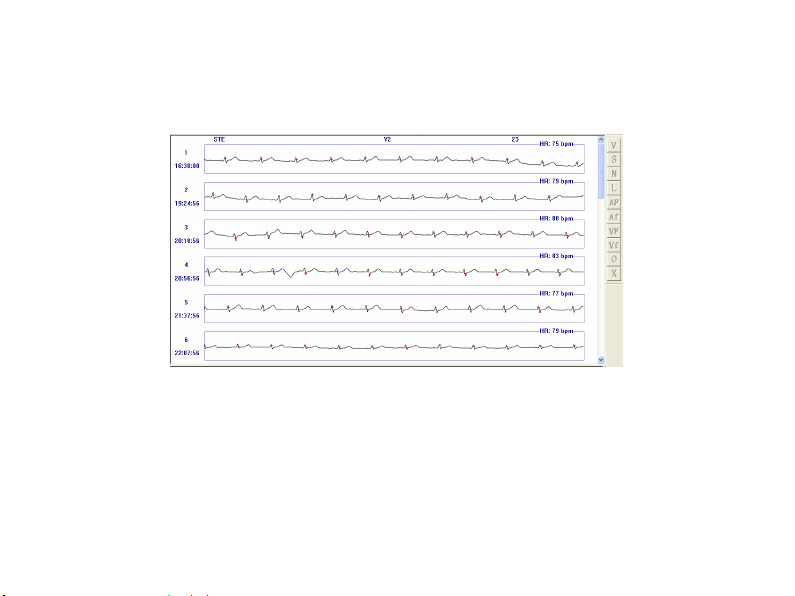
Select a lead and click "OK", and in the background window all of the STE strip graphs of this
lead, as Fig.6-18.
Fig.6-18
Page 78
6
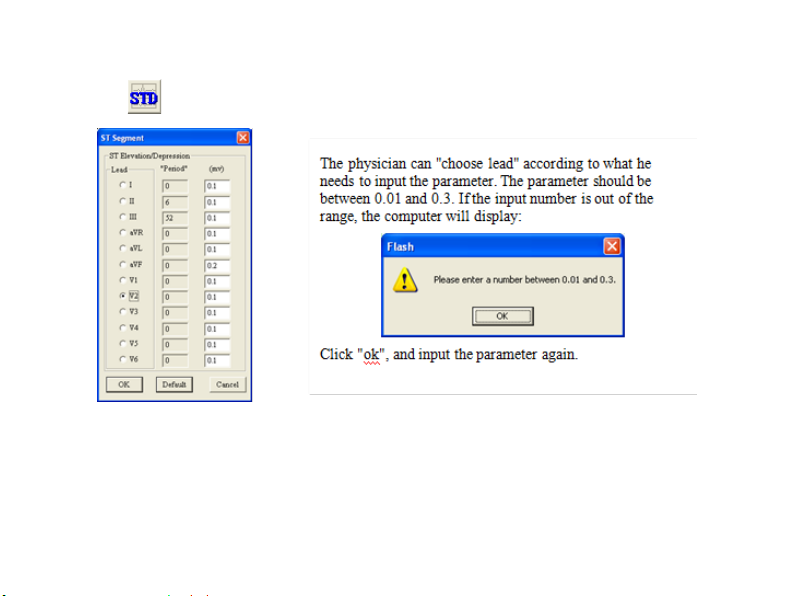
Click button, display ST depression electrocardiogram.
Page 79
6
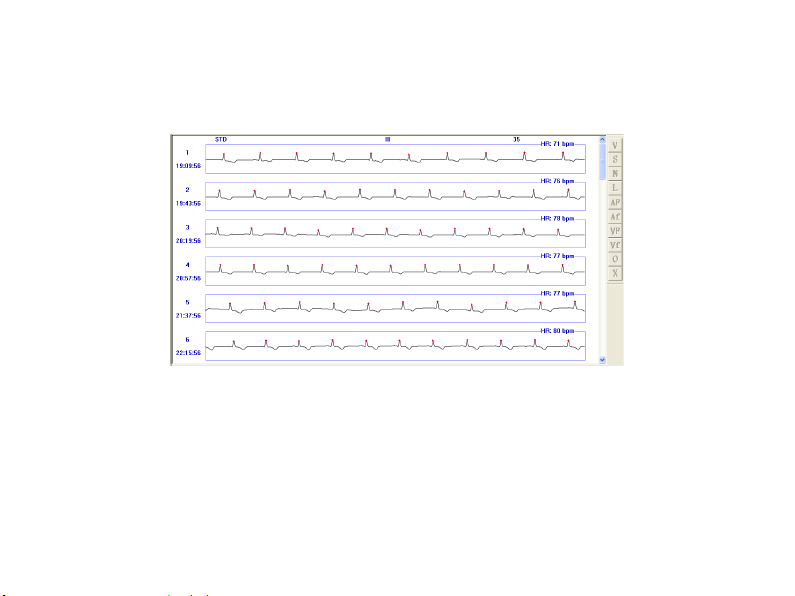
Select a lead and click "OK", and in the background window of all the STE strip graphs of this
lead, as Fig.6-19.
Fig.6-19
Note:
The ST segment analysis can be performed by the software when all leads are using
any one of or all calibration signals.
The parameters displayed in ST Segment interface are the analysis parameters used
Page 80
6
for “STE”(ST elevation) and “STD”(ST depression) analysis functions. Physician can
modify the parameters and then repeat the ST segment analysis to this lead.
The software has myocardial ischemia analysis function, which can analyze the ST
depression events, display the ST depression fragments of all leads in the myocardial
ischemia data table (Figure 6-23), and provide a print report.
Click
Trigeminal rhythm, S Run; V Run, V Couplet, V Bigeminal rhythm, V Trigeminal rhythm, R-R
Pause, Atrial flutter, Atrial fibrillation, V Flutter, V Fibrillation, Max HR, Min HR, Bradycardia.
Before above the classified ECG display operations, if refresh button
the data need refresh, click this button to refresh data.
Click
strip graph.
button, display other classified strip graph: S Couplet, S Bigeminal rhythm, S
(high bright) means
button to display single lead ECG waveform or change the lead displayed in the
Page 81
7
STLE analysis
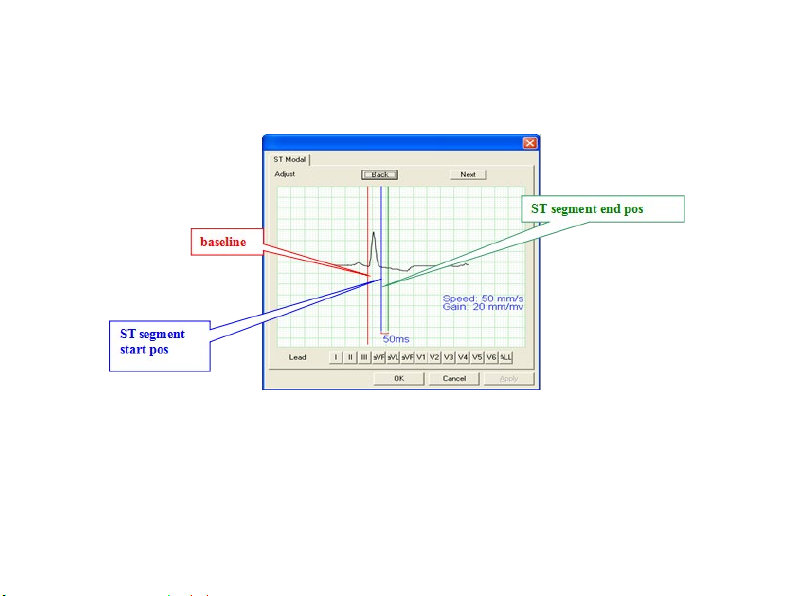
Click "STLE" item inside of "Arrhythmia" item, show ST adjusting window as Fig.6-20.
Fig.6-20
Back: display the former beat waveform;
Next: display the next beat waveform;
Lead: select a single lead from I to V6 or click "ALL" to display all the ECG waveforms.
Page 82
7
Adjust the position of baseline: set the mouse cursor about the line you want to adjust, click the
left key of mouse, this line will move to the position of the mouse cursor.
Click "OK" after adjusting well, the software will operate all beats ST analysis, and display the
analyzing result in the myocardium ischemia table.
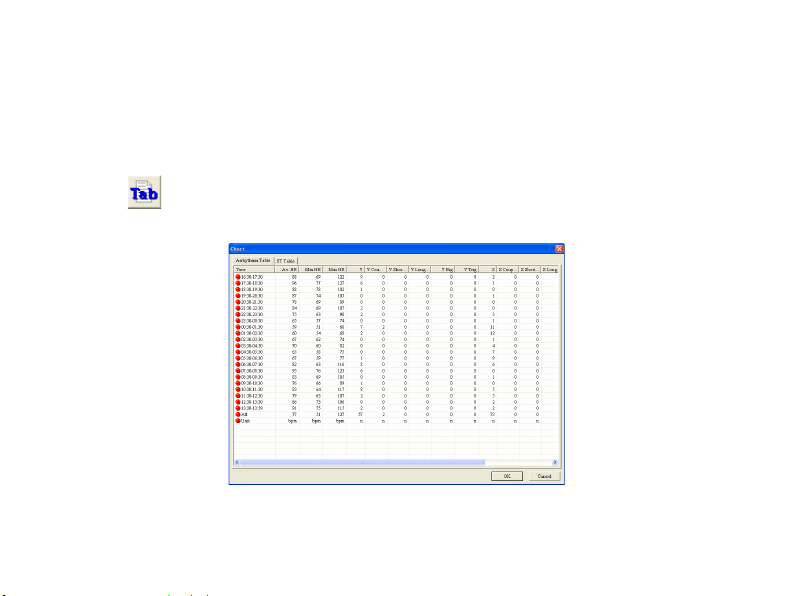
Click
Arrhythmia Table: display the arrhythmia statistic for every hour, as Fig.6-21.
button, display the Arrhythmia Table.
Fig.6-21
Page 83
7
Max HR: maximum HR
V: ventricular premature beat
V Couplet: ventricular couplet
V Short run: ventricular short run
V Long run: ventricular long run
V Big: ventricular bigeminy
V Trig: ventricular trigeminy
S: supra ventricular premature beat
S Couplet: supra ventricular couplet
S Short run: supra ventricular short run
S Long run: supra ventricular long run
S Big: supra ventricular bigeminy
S Trig: supra ventricular trigeminy
L: pause
BC: bradycardia
Av.HR: Average HR Min HR: minimum HR
Click any a data among the row of "Av. HR" "Min HR" and "Max HR" with the left key of
mouse to modify it, and click "OK" to save this modification.
Page 84
7
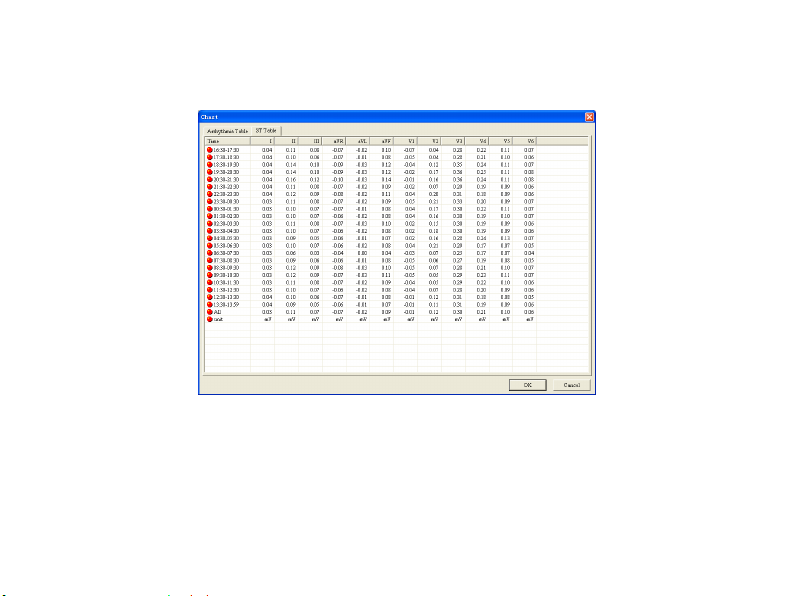
ST Table : display the ST average voltage statistic of each lead for every hour, as Fig.6-22.
Fig.6-22
Double click any a data in the row from "I" to "V6" with the left key of mouse to modify it, and
click "OK" to save this modification.
Page 85
7
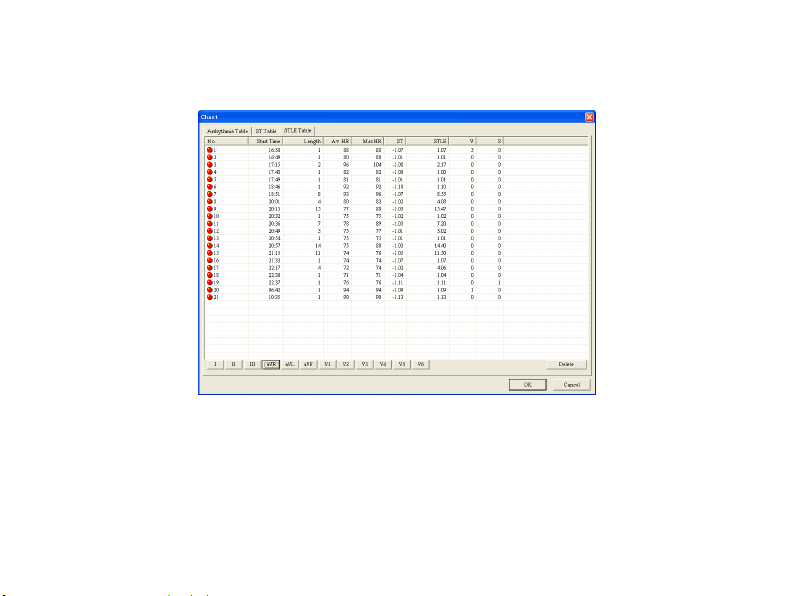
STLE table as Fig.6-23.
Fig.6-23
Each row in the table stands for each period of time of ST depression of display lead. The data of
table contains: Start time, lasting Length, Av.HR, Max HR, ST, STLE, V, S .
User could delete some periods of time in table directly, knock "ok", the changed file will be
saved.
Page 86
7
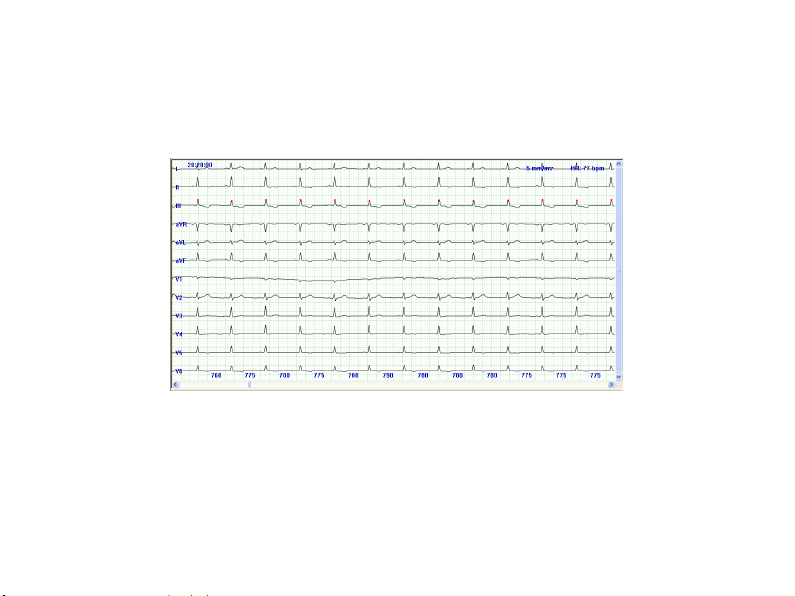
User could double click the row in the table, then the order review window will display
multi-lead waveform, the beginning time of waveform is the same as "beginning time" of the
row as Fig.6-24.
Fig.6-24
Page 87
7
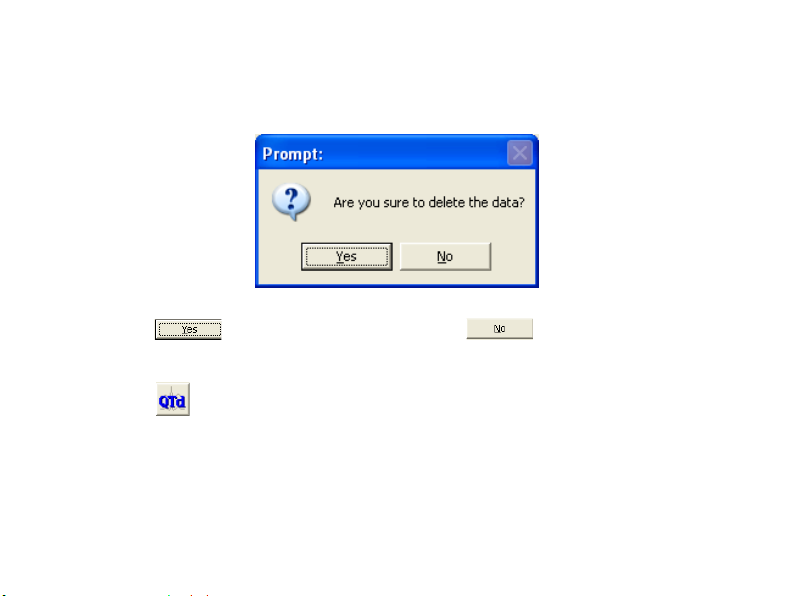
After deleting the some periods of time, if user don'' knock "ok" before double click the row in
the table, program will remind user to save the changed file or not with the dialog box below.
Choosing
QTD analysis
will save the changed file, choosing will not save.
Knocking
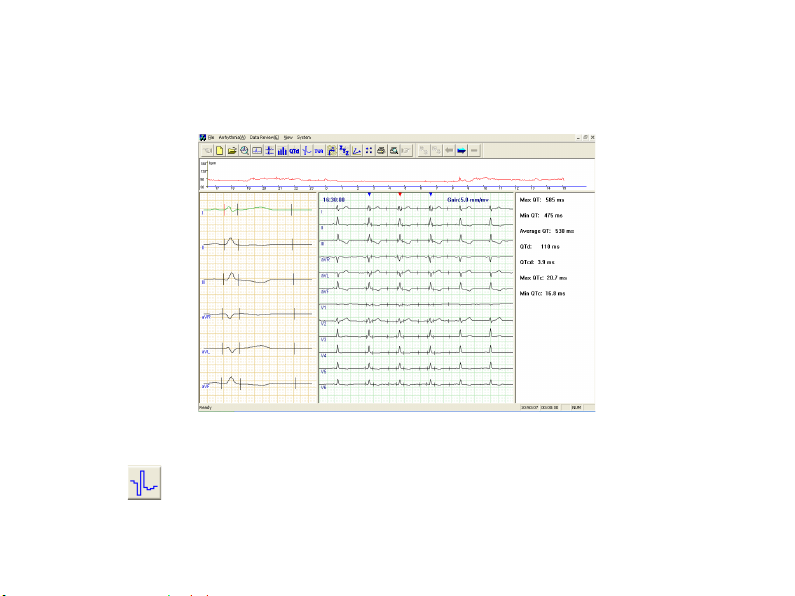
QT dispersion main incarnate the differentia of the QT Interval between 12 leads, it is the
difference between Max value and Min value which are the QT Interval between 12 leads. Its
main function is reflecting Ventricle Repolarization inconsistency, and denote inconsistent
button, enter QTD analysis system.
Page 88

7
degree of Ventricular excitability resumptive time, or denote difference degree of Ventricular
Refractory period.
QT dispersion graph is as Fig.6-25.
For increasing precision and reducing error, the system adopts the method that got the mean
value, which was based on the each interval produced in the 3 continuous cardiac cycle. The
result will show on the right of the interface. Using three arrows betwixt the interface to mark the
three continuous heart beats. You can move the heart beat which needs to be measured with the
"left" or "right" key, or adjusting the start or end position of Q, S and T wave of the chosen heart
beat in the left view. Click the left view, by using the up and down key to choose some lead
waveform, the waveform will become green, which shows that you have pitched on the
waveform of the heart beat. Then you can adjust the position of Q, S or T by pressing the "Tab"
key. If the upright line on the waveform is red, showing that you can adjust its position with the
left or right key. The data in the data view on the right will change automatically.
There are two buttons on the toolbar, one is limb lead, and the other is the chest lead. Each of
them stands for several waveforms of leads, which show in the left view. Under the default
situation, it displays the limb 6-lead.
Page 89
7
The HR trend graph can help you select the waveform of QTD, which need to be analyzed
quickly.
Fig.6-25
HRT analysis module.
Click
button, enter HRT analysis module.
Page 90
7
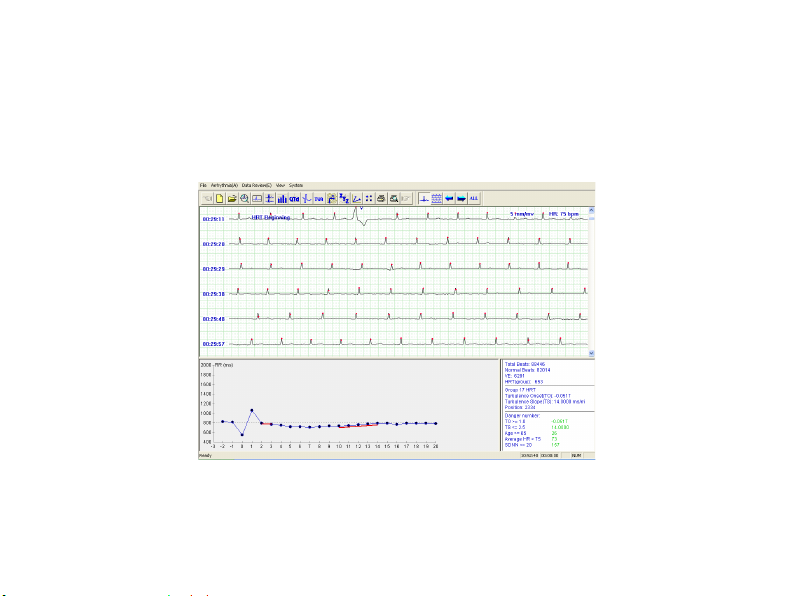
HRT could be quantification expressed by two parameters, the two parameters are TO and TS.
Ventricular premature beat causes artery blood pressure brief foul-up. When the adjustable
function is natural, this transitory change will be represented by the form of HRT immediately;
when the adjustable function is injured, the change will weaken or disappear (as Fig.6-26).
Fig.6-26
The position marked "HRT beginning" is the beginning position of wave that satisfies HRT
Page 91
8
judged condition, the third QRS wave after this position is ventricular premature beat, you can
see the RR interval trend graph in the whole HRT occurring term in the left below graph, which
have signed the TO, TS segment with red line to make the user more convenient to judge.
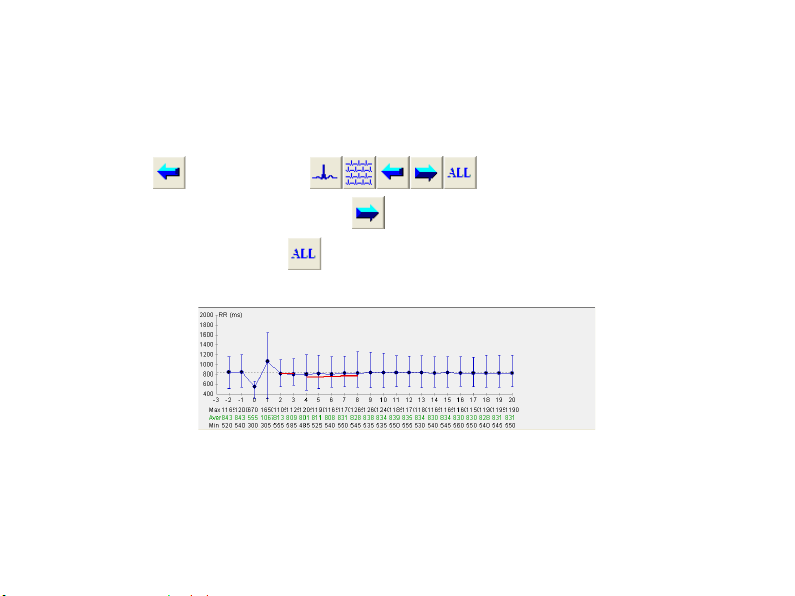
Click the
last HRT analysis condition, Click the
HRT analysis condition, click
left below window graph as Fig.6-27.
The erect line on the dot express RR interval the maximal value and minimal value on different
period of time.
button in toolbar will display the wave that satisfies
button will display the wave that satisfies next
will display the HRT waveform after superposition on the
Fig.6-27
Page 92
8
The three row number below graph express the RR interval the maximal value, the average and
minimal value for the corresponding dot.
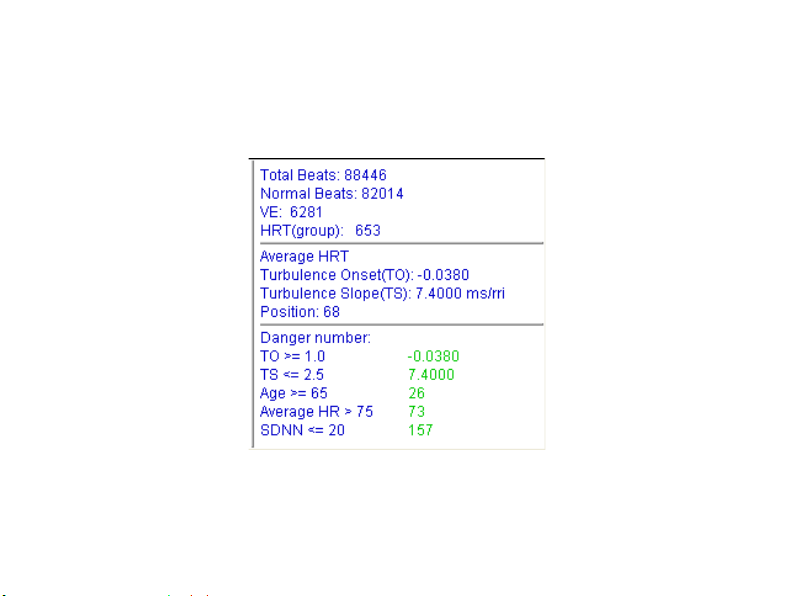
The graph on the right below window is the conclusion as Fig.6-28.
Fig.6-28
Page 93

8
Before seeing the whole case report, the option such as "Normal Beats" will show the word "Not
Judge". When the result is in the range that "Danger number" indicates, the corresponding result
will turn to red to remind the user.
T Wave alternation analysis module
Click
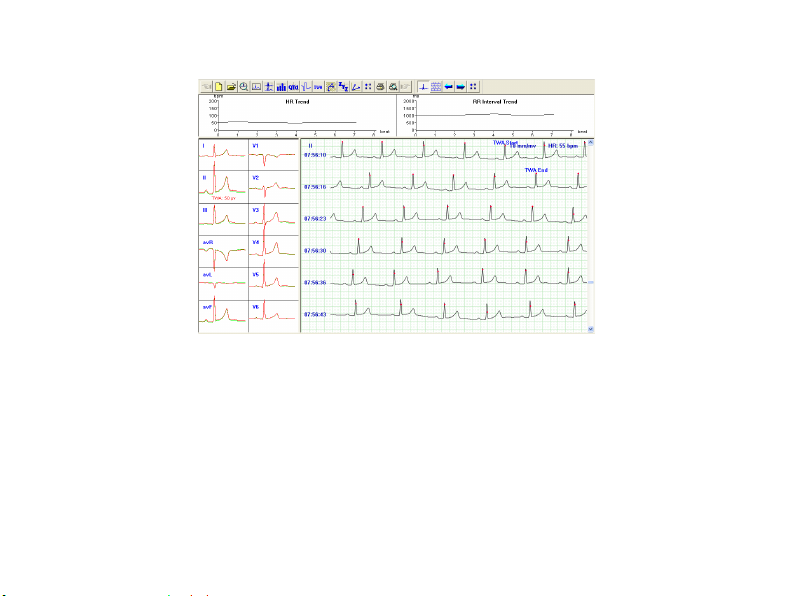
T wave alternation (TWA) is a periodic beat-to-beat variation in the amplitude or shape of the T
wave in an electrocardiogram, and the variation of the amplitude is ≥ 0.1mV. TWA is a
important index on judging and preventing Arrhythmia.
The analysis adopts TWA measure basing on the maximum of T wave. The general method is:
choose continuous 8 (16, 32 …128) waveforms, number QRS waveform from the first one, such
as 1, 2, 3, ……, 8, then compare the maximum of T wave. If the difference of T wave is larger
than the range that has preestablished, there is TWA phenomena. After comparing, carry out
superposition of the singular number (1, 3, 5……) wave and superposition of dual number (2, 4,
6……) wave respectively, then draw the result after superposition, it will be more obvious as
Fig.6-29:
button to enter the T Wave alternation analysis module.
Page 94
8
Fig.6-29
The position marked "TWA beginning", "TWA end" is the section of wave that satisfies TWA
judged condition. On the left, it is the superposition graph of the singular number wave and dual
number wave. The green line is the superposition wave of the singular number, the red line is the
superposition wave of the dual number. If there are red words below wave, it means there is
TWA phenomenon for this lead (such as II-lead on above the picture). The number express the
height difference after superposition of the singular number wave and superposition of dual
number wave. Click the rectangle where the wave is, the right wave graph will turn to
Page 95
8
single-lead wave of the appointed lead. "HR trend", "RR interval trend" above express the heart
rate of TWA segment and the mutative trend of RR interval.
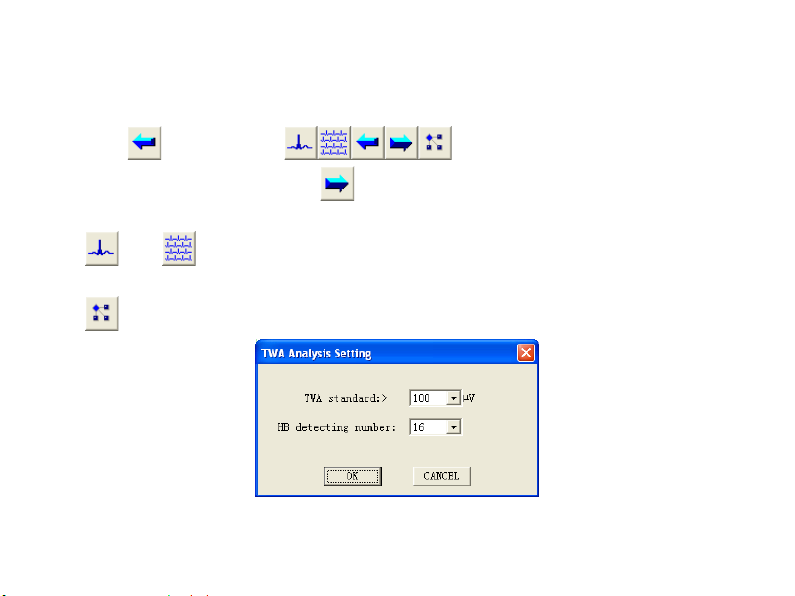
Click
TWA analysis condition, Click the
analysis condition.
displaying waves.
button in toolbar will display the wave that satisfies last
button will display the wave that satisfies next TWA
and express the switch between single lead and multi-lead for the current
is the setting button, click it, then the following dialog box will appear:
Page 96
8
The user can set the TWA judging standard and the heart beat detecting number. The range for
TWA judging standard is 40-100µV, HB detecting number is: 8-128.The purpose of setting is
analysis convenience and reducing mistake.
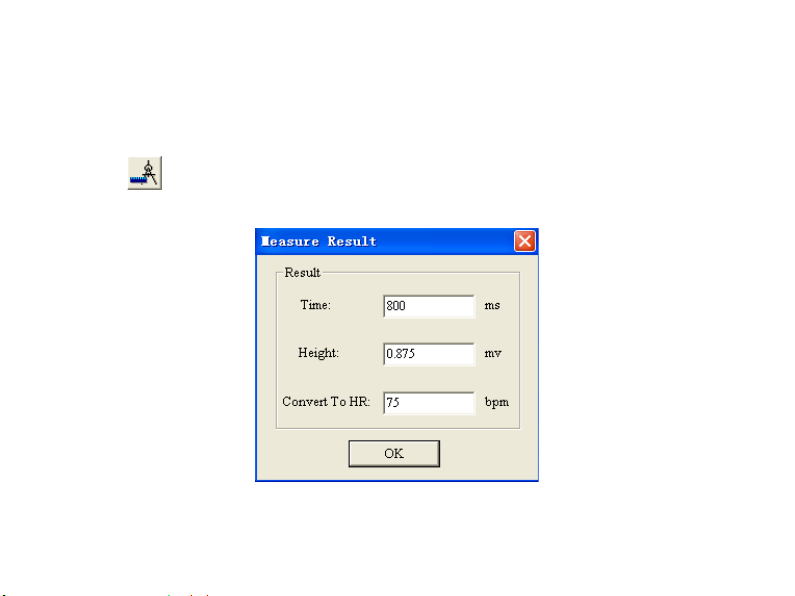
Click
left key and drag to draw an rectangle, then get the measure result;
button to measure RR and PR interval. Put the red point on the wave, pressing the
Page 97
8
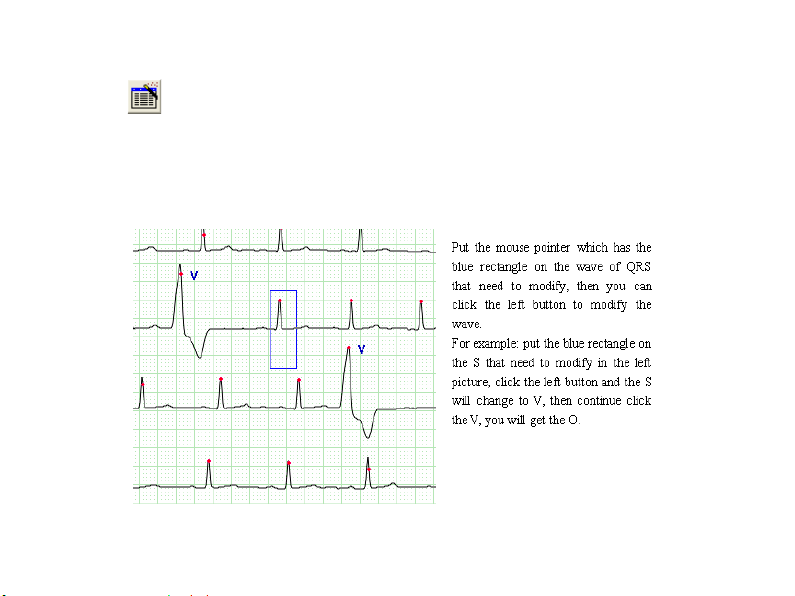
Click button to modify the type of QRS wave.
Put the mouse pointer which has the blue rectangle on the wave of QRS that need to modify,
then you can click the left button to modify the wave.
For example: put the blue rectangle on the S that need to modify, click the left button and the S
will change to V, then continue click the left button, you will get the O.
Page 98
8
Under such situation, the waveform could be modified continuously. Move the mouse to the
beginning of the waveform which needs modification, click the right button to choose the start
position, then move to the end, click the right button again to make sure the end position. Now
the segment can be modified.
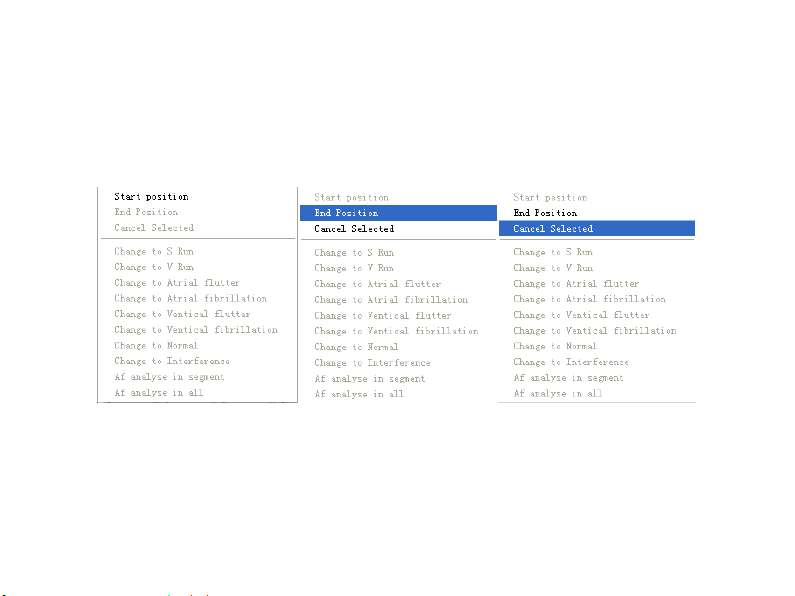
Choose the start pos Choose the end pos Modify the waveform in series
In the order replay interface, select the "Atrial Fibrillation" in the "Arrhythmia" menu to analyze
the atrial fibrillation of the case that the arrhythmia has been construed. The atrial fibrillation
analysis system will enter the interface as Fig.6-32 automatically.
Page 99
8
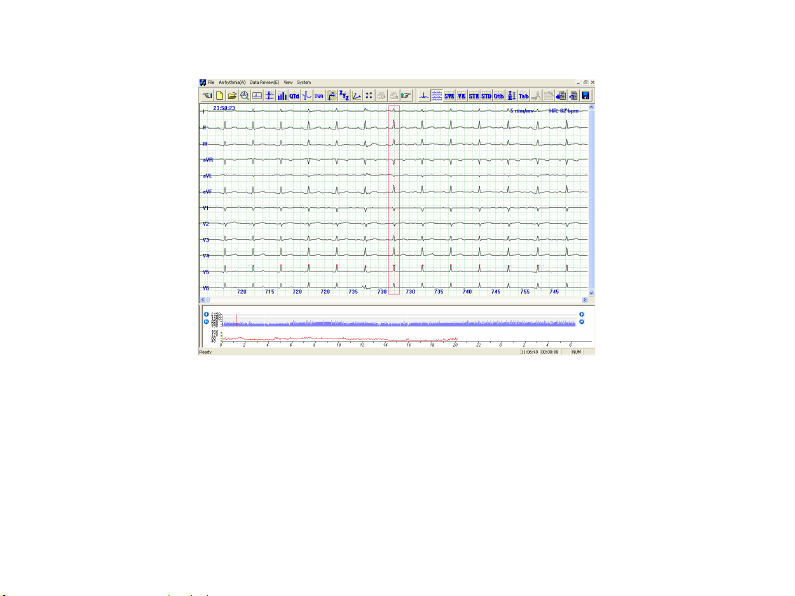
Fig.6-30
It is similar to the interface of order replay, but add the azury diagram above the HR trend. It is
the RR interval of the current position that displayed. At the same time, there is a red rectangle
appear on the multi-channel graph. The waveform that the red rectangle indicates corresponds to
the waveform indicated on the RR interval graph.
The user can choose any parts of RR interval to scan by using the HR trend at the bottom. User
Page 100

8
also can click directly. Use the to roll forwards or backwards and use the to
turn over the page. During this process, the multi-channel graph and the green line on the HR
trend will change at the same time.
You will see that there are azury, navy blue, gray and some white lines on the RR interval graph.
Their meaning is as follows:
The azury is general waveform; The navy blue means the continuous S, V, AF, Af, VF, Vf ( the
concrete meaning see the template elucidation part) etc.; Gray means the continuous artifacts.
The white lines means interference segment.
System support keyboard to view RR interval trend graph. Click the view below, passing the "
→ "" ← " can view the RR interval forward or backward, passing the " Page Up", " Page Down",
can turn over the page backward or forward, you can also pass the " ↑ " " ↓ "to play the RR
interval automatically, and press any key to stop playing.
The user can judge the atrial fibrillation occurrence time and length assumably by using RR
interval graph. Combining the multi-channel graph, if make sure that the segment is AF; pop up
the menu as follows by clicking the right button on the RR interval: set "Start position" and "End
position" to choose a segment, then the segment turn red, its attribute can be modified to S
Tachycardia, V Tachycardia, Atrial flutter, Atrial fibrillation, Ventricle flutter, Ventricle
 Loading...