

Page 1

HS-50
Horizontally Symmetrical
Ultrasonic Research
Anemometer
User Manual
Doc No. 1199-PS-0032
Issue 02
Gill Instruments Ltd recognise all trademarks
Gill Instruments Limited
Saltmarsh Park,
67 Gosport Street,
Lymington,
Hampshire.
SO41 9EG
UK
Tel: +44 (0) 1590 613500
Fax: +44 (0) 1590 613501
E-mail: anem@gill.co.uk
Website: www.gill.co.uk
Page 2
Page 3

Gill Instruments Ltd
HS-50 Research Anemometer Page 1 Issue 02
Doc. No. 1199-PS-0032 November 2004
Page 4

Gill Instruments Ltd
1. FOREWORD .....................................................................................................................................5
2. SYSTEM INSTALLATION..............................................................................................................6
2.1 Mounting.......................................................................................................................................6
2.2 Alignment .....................................................................................................................................6
2.3 Using the Inclinometer..................................................................................................................6
2.4 Corrosion ......................................................................................................................................6
2.5 Earthing.........................................................................................................................................6
2.6 Cabling..........................................................................................................................................6
3. SYSTEM OPERATION ....................................................................................................................7
3.1 Overview.......................................................................................................................................7
3.2 Operating modes...........................................................................................................................7
3.3 Measurement Mode ......................................................................................................................7
3.4 Sampling .......................................................................................................................................7
3.5 Averaging......................................................................................................................................7
3.6 Wind Measurement, SoS and Temperature Reporting Format.....................................................8
3.7 Analogue Input Reporting Formats ..............................................................................................8
3.8 Diagnostics....................................................................................................................................8
3.9 Confidence Tone...........................................................................................................................8
3.10 Result Reporting .........................................................................................................................8
3.11 Interactive Mode.........................................................................................................................9
3.12 Configuration Commands...........................................................................................................9
3.13 Interrogation Commands ............................................................................................................9
4. CONNECTION TO A PC OR OTHER DEVICE ...........................................................................10
5. USING THE ANEMOMETER WITH A PC RUNNING RCOM ..................................................11
5.1 PC Requirement..........................................................................................................................11
5.2 Installing RCOM.........................................................................................................................11
5.3 Starting RCOM ...........................................................................................................................11
5.3.1 Command line options..........................................................................................................11
5.3.2 Procedure if no anemometer is found...................................................................................12
5.4 Main Menu..................................................................................................................................13
5.5 Trend Display .............................................................................................................................13
5.6 Trend Options .............................................................................................................................13
5.7 Display Micro-met Parameters ...................................................................................................13
5.8 Micro-met Parameter Options ....................................................................................................13
5.9 Tabular Display...........................................................................................................................13
5.10 Configure Anemometer ............................................................................................................13
5.11 Options......................................................................................................................................13
5.12 Exit to DOS...............................................................................................................................13
5.13 Trend Display ...........................................................................................................................14
5.14 Display Micro-met Parameters .................................................................................................15
5.15 Micro-met Parameter Options ..................................................................................................15
5.16 Tabular Display.........................................................................................................................17
5.17 Configure Anemometer ............................................................................................................18
5.18 Options......................................................................................................................................19
5.19 Storage of settings.....................................................................................................................19
5.20 RCOM Error Messages.............................................................................................................20
5.21 Instructions For Using The Binary To ASCII Conversion Utility............................................20
6. USING THE ANEMOMETER WITH A PC RUNNING RCOM II ..............................................22
6.1 PC Requirement..........................................................................................................................22
HS-50 Research Anemometer Page 2 Issue 02
Doc. No. 1199-PS-0032 November 2004
Page 5

Gill Instruments Ltd
6.2 Installing RCOM II.....................................................................................................................22
6.3 Starting RCOM II .......................................................................................................................22
6.4 Using RCOM II ..........................................................................................................................22
7. USING THE ANEMOMETER WITH A PC RUNNING YOUR SOFTWARE ............................23
7.1 Digital Serial Output Format ......................................................................................................23
7.1.1 Binary Result Message Format ............................................................................................23
7.1.2 ASCII Result Message Format.............................................................................................24
7.1.3 Status Fields..........................................................................................................................25
7.1.4 Software commands .............................................................................................................28
8. USING THE ANALOGUE INPUTS OF THE ANEMOMETER ..................................................33
9. USING THE PRT INPUT................................................................................................................34
10. USING THE ANALOGUE OUTPUTS.........................................................................................35
10.1 Introduction...............................................................................................................................35
10.2 Analogue outputs ......................................................................................................................35
10.3 Analogue Sync. Output.............................................................................................................36
10.4 Status Output ............................................................................................................................36
10.5 Test Modes................................................................................................................................36
11. DRAWINGS ..................................................................................................................................37
1086-M-043 Anemometer Cable (Voltage Out)...............................................................................39
1189-K-022 Indoor PCI Unit Dimensions........................................................................................40
1199-K-066 3 Axis Horizontal Anemometer U,V &W Axis Definitions ........................................41
1199-K-089 3 Axis Horizontal Anemometer Head + Electronics Mounting Details.......................42
1210-K-068 R3 & HS Research Anemometer Measurement Sequence ..........................................43
Assembly of Amphenol C91A Screw Lock 4 Way Socket..............................................................44
12. TECHNICAL SPECIFICATION ..................................................................................................45
12.1 Wind Measurement...................................................................................................................45
12.2 Speed of Sound Measurement ..................................................................................................45
12.3 Environmental...........................................................................................................................45
12.4 Supply Input..............................................................................................................................45
12.5 Serial Interface..........................................................................................................................45
12.6 Analogue Inputs........................................................................................................................46
12.7 PRT ...........................................................................................................................................46
12.8 Anemometer Sync Output ........................................................................................................46
12.9 Inclinometer..............................................................................................................................46
12.10 Anemometer Power and Data Connector Hirose 20 way socket........................................46
13. POWER AND COMMUNICATIONS INTERFACE ...................................................................47
13.1 Desk Top PCI............................................................................................................................47
13.2 Connector Pin Assignments......................................................................................................47
13.3 PCI Specification ......................................................................................................................49
APPENDIX A ......................................................................................................................................51
SUMMARY OF ABBREVIATIONS USED IN THIS MANUAL .................................................51
PACKING LIST ...............................................................................................................................51
OPTIONAL EXTRAS......................................................................................................................51
APPENDIX B ......................................................................................................................................52
Principle of Operation.......................................................................................................................52
APPENDIX C ......................................................................................................................................53
Sonic Temperature Measurement .....................................................................................................53
APPENDIX D ......................................................................................................................................60
Micro-Met Calculations....................................................................................................................60
APPENDIX E.......................................................................................................................................67
HS-50 Research Anemometer Page 3 Issue 02
Doc. No. 1199-PS-0032 November 2004
Page 6

Gill Instruments Ltd
RCOM Binary File Format...............................................................................................................67
HS-50 Research Anemometer Page 4 Issue 02
Doc. No. 1199-PS-0032 November 2004
Page 7

Gill Instruments Ltd
1. FOREWORD
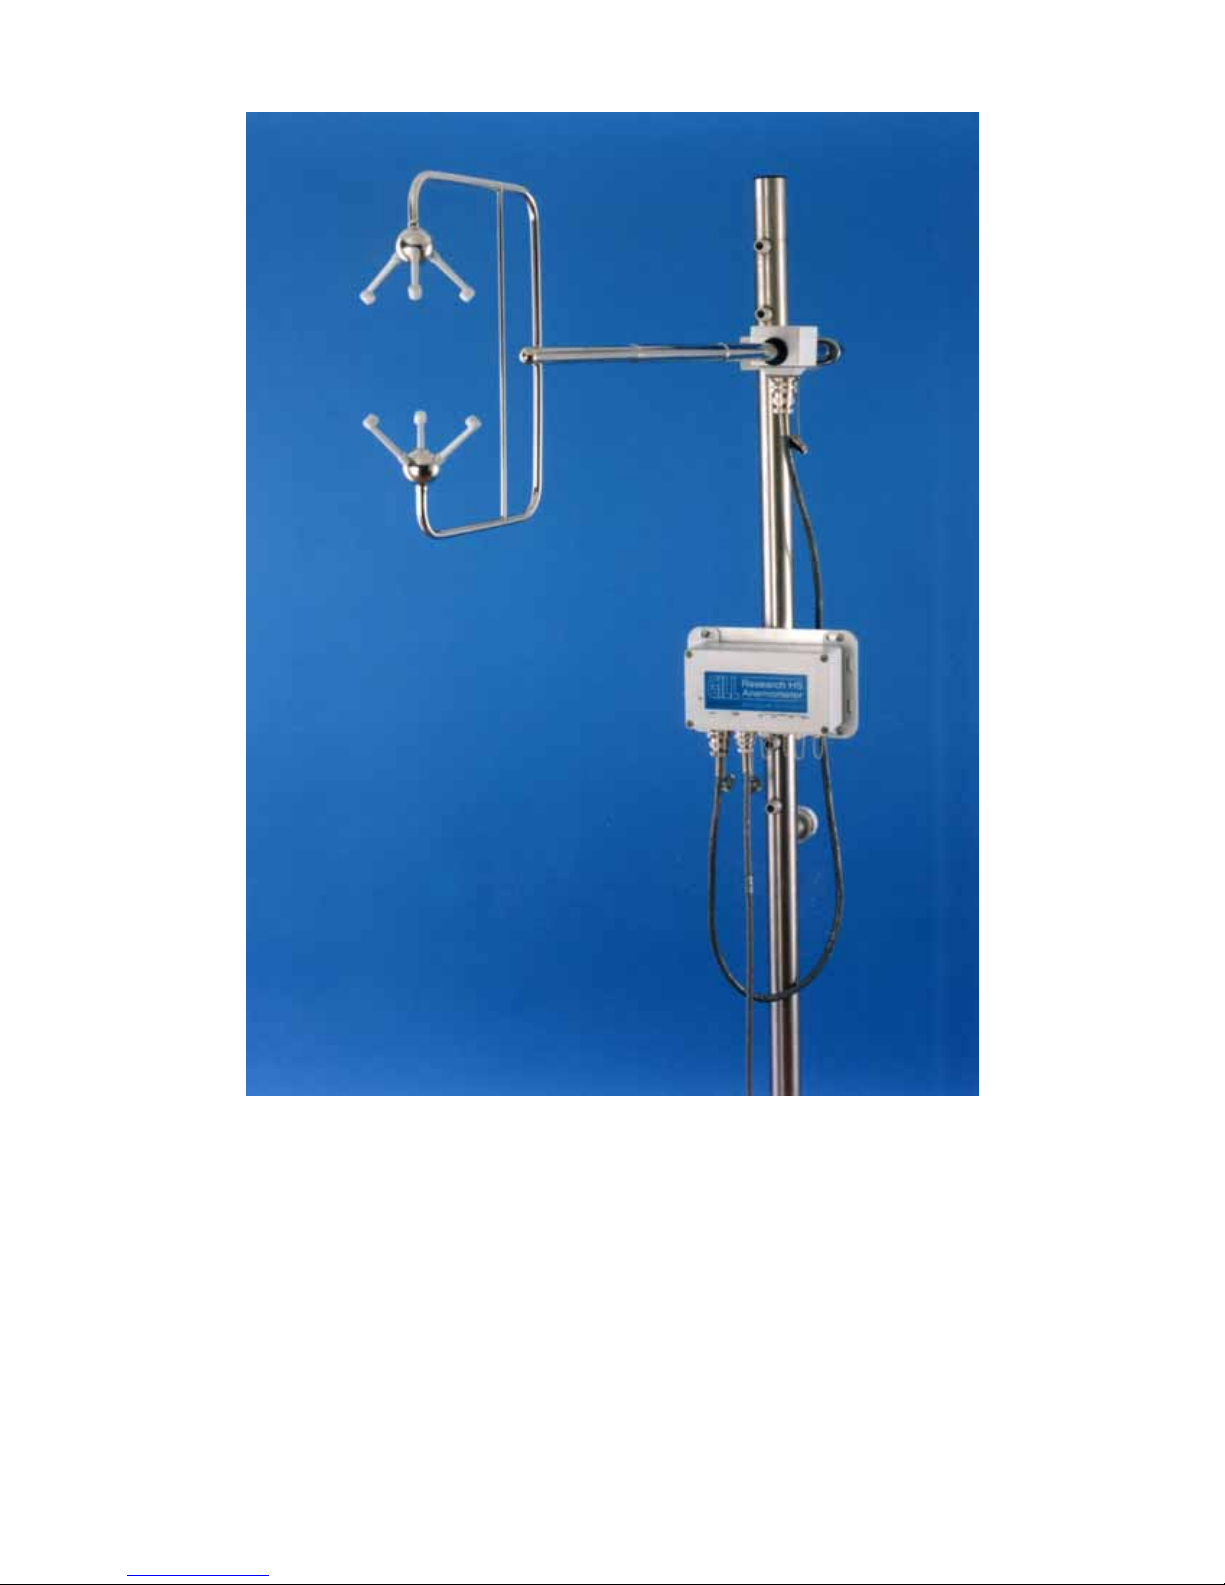
This manual refers to the Gill Instruments Ltd. Horizontally Symmetrical Research Ultrasonic
Anemometer. It is an extremely sophisticated instrument and to achieve optimum performance we
recommend that you read the whole of this manual before proceeding further with use.
The Solent Range is in continuous development and so specifications may be subject to change
without prior notice.
HS-50 Research Anemometer Page 5 Issue 02
Doc. No. 1199-PS-0032 November 2004
Page 8

Gill Instruments Ltd
2. SYSTEM INSTALLATION
2.1 Mounting
The head and electronics unit should be mounted in accordance with Drawing Number
1199-K-089.
2.2 Alignment
It is recommended that the head is aligned so that the upper transducer sphere is directly above the
lower transducer sphere. The inclinometer has been calibrated to read zero on both axes when this
position is reached.
2.3 Using the Inclinometer
The data from the inclinometer can be obtained in several ways:
a) RCOM displays this information at the bottom of the screen
b) By typing INCL in interactive mode (see Section 6).
c) By decoding the upper status addresses of the anemometer output message
(see Section 6).
2.4 Corrosion
Galvanic corrosion is possible unless stainless steel fixings are used for mounting the head and
electronics unit. This will ensure that the anemometer will provide long service under extreme
conditions e.g. marine.
2.5 Earthing
For maximum protection against lightning the head must be earthed via its mountings. The
electronics unit and PCI should be earthed using the earth studs provided.
2.6 Cabling
Ensure that strain relief measures are employed when installing the anemometer cables. Do not allow
the whole weight of a cable to be applied to the connector.
HS-50 Research Anemometer Page 6 Issue 02
Doc. No. 1199-PS-0032 November 2004
Page 9

Gill Instruments Ltd
3. SYSTEM OPERATION
3.1 Overview
• Data output rates up to 50s-1.
• Measurement of wind velocities in excess of 30ms-1 .
• Wind speed accuracy < 1% RMS.
• Accurate speed of sound measurement.
• Configuration carried out via serial port and stored in non-volatile memory.
• High speed, full duplex RS422 interface, operating up to 115200 baud.
• Background diagnostics providing the user with the confidence that the unit is operating
correctly.
• 6 differential 14 bit analogue inputs and one PRT100 input.
• Analogue outputs representing wind speed, SoS, and temperature optionally fitted in
PCI.
3.2 Operating modes
The anemometer has two operating modes:
1. Measurement mode - This is the normal mode of operation, which is the default
mode from power up.
2. Interactive mode - This allows the anemometer to be configured and interrogated.
3.3 Measurement Mode
The principle of operation is described in Appendix B. The parameters sampled are determined by
the anemometer’s configuration and consist of:
1. Wind velocity (axis velocities are always sampled)
2. Speed of Sound (SoS)
3. Analogue Inputs (6)
4. Absolute Temperature (PRT100).
The way in which the results are calculated, formatted and reported depends upon the configuration
of the anemometer.
3.4 Sampling
Wind velocity, SoS and analogue inputs are sampled every 10ms, in a fixed sequential pattern. The
PRT100 is sampled every 40ms. The measurement sequence is shown in Drawing Number 1210-K-
068.
3.5 Averaging
These samples are block averaged before being converted into results. For wind speed, SoS and
analogue inputs the number of samples used in the block average can be set to between 2 and 250
samples. The corresponding maximum number of PRT100 samples per result is 62.
HS-50 Research Anemometer Page 7 Issue 02
Doc. No. 1199-PS-0032 November 2004
Page 10

Gill Instruments Ltd
3.6 Wind Measurement, SoS and Temperature Reporting Format
The wind measurement can be output in one of the following formats:
1. U, V & W, calibrated (ms-1)
2. U, V & W, uncalibrated (ms-1)
3. Polar & W, calibrated (° & ms-1)
4. Polar & W, uncalibrated (° & ms-1)
5. Axis velocities, uncalibrated (ms-1)
In U, V,W modes the alignment of the U and V axes can be selected as follows:-
Axis U in line with Axis 1 when the anemometer is viewed from above.
Spar U is in line with the main spar when viewed from above. In this configuration U, V, W are
labelled U', V', W'.
The U, V, W axis alignment options are shown in the relevant U, V, W axis definition drawing in
Section 10.
The axis alignment can be selected using the Configuration menu within RCOM (Section 5.17) or
the ALIGNUVW command if using your own PC software (Section 6.1.4).
The speed of sound measurement results can be output in one of the following formats:
1. Speed of Sound (ms-1)
2. Sonic Temperature (K)
3. Sonic Temperature (°C)
Speed of sound measurements can be disabled.
The absolute temperature measurement results can be output in one of the following formats:
1. Absolute Temperature (K)
2. Absolute Temperature (°C)
Absolute temperature measurements can be disabled.
3.7 Analogue Input Reporting Formats
If ASCII format is selected, analogue input measurements are output in volts to 4 decimal places. If
binary format is selected, analogue input measurements are output in 2's complement.
The number of analogue inputs to be measured can be set from 0 to 6.
3.8 Diagnostics
The system reports error codes if a failure is detected of the ultrasonic transducers, non-volatile
memory or PRT.
3.9 Confidence Tone
If this function is enabled then normal operation is indicated by an intermittent tone within the
anemometer.
3.10 Result Reporting
The selected parameters are blocked together along with the diagnostic results and block control
information to form a result message. The result message can either be in a Binary or ASCII format.
HS-50 Research Anemometer Page 8 Issue 02
Doc. No. 1199-PS-0032 November 2004
Page 11

Gill Instruments Ltd
In the ASCII format the fields can be padded to form a fixed field size if required. The way the result
message is transmitted is dependant on the reporting mode:
1. Continuous mode - the result message is transmitted immediately after calculation.
2. Polled mode - the host pc requests data from the anemometer. The anemometer
responds by sending the current result message.
3.11 Interactive Mode
Interactive mode is entered from measurement mode, by sending the anemometer the appropriate
command. In this mode the user can communicate with the anemometer, issuing configuration
commands to the anemometer, or requesting information from the anemometer.
3.12 Configuration Commands
Configuration commands allow the user to configure the anemometer as required. The configuration
parameters are held in non-volatile storage, allowing the anemometer to retain it’s current
configuration when powered down.
3.13 Interrogation Commands
Interrogation commands allow the user to request various information from the anemometer.
HS-50 Research Anemometer Page 9 Issue 02
Doc. No. 1199-PS-0032 November 2004
Page 12

Gill Instruments Ltd
4. CONNECTION TO A PC OR OTHER DEVICE
Connection to a PC or other device requires the use of:
1. Either a standard PCI
2. Or a suitable alternative power supply and RS422 conversion unit, which meets the
specification of the anemometer.
2 cables will be required:
1. Anemometer EU to PCI
2. PCI to PC - RS232 or RS422
The PCI supplies power for the anemometer and provides conversion of the RS422 signal sent by the
EU and the RS232 signal required by a PC. The PCI requires connection to a mains power supply or
DC. Computers other than IBM PC’s or compatibles may require a customised cable for connection
to the PCI.
The anemometer outputs data through a connector on the EU. Data is provided in RS422 format only
and reconstituted to analogue if required at the PCI.
Baud rate options are:
1. 2400
2. 4800
3. 9600
4. 19200
5. 38400
6. 57600
7. 115200
Data format:
1. 8 data, 1 stop, no parity.
HS-50 Research Anemometer Page 10 Issue 02
Doc. No. 1199-PS-0032 November 2004
Page 13

Gill Instruments Ltd
5. USING THE ANEMOMETER WITH A PC RUNNING RCOM
5.1 PC Requirement
Minimum 286, VGA and 1Mb of RAM
Recommended 486 DX2 66MHz.
5.2 Installing RCOM
The RCOM program and its auxiliary files are stored on a single 3½” disk. They should be installed
on the hard disk in a directory named \RCOM. To install the software type the following commands
in this order. For the user settings within RCOM to be stored correctly the RCOM directory must be
in the root e.g. C:\RCOM.
MD C:\RCOM
COPY A:*.* C:\RCOM
NB This assumes that your 3½” drive is drive A: and your hard disk is drive C:. If not replace A: and
C: in the above commands with the drive letters for your 3½” and hard disk drives respectively.
5.3 Starting RCOM
To start the RCOM Program, change directory to the RCOM directory and type RCOM.
CD \RCOM
RCOM
RCOM may be followed by one or more command line options. The PC will search on its serial link
for an anemometer. When an anemometer is found the main menu is displayed.
5.3.1 Command line options
The RCOM program may be passed one or more command line parameters.
/Cn Sets the COM port to use for the anemometer. Valid settings are n = 1, 2, 3 or 4. Default is
COM1.
/CBn Serial port base address. If your PC has non-standard serial ports, it may be necessary to set the
base address of the port. Usually the PC can work this out from the COM port, so this command
should only be needed in rare circumstances. For instance, to set the base address to 2F8h use the
command line option /CB02F8.
/CInSerial port interrupt number. Sets the interrupt (IRQ) number used by the COM port. Usually
this is standard for COM1 and COM2 (IRQ4 and IRQ3 respectively). There is no generally accepted
defaults for COM3 and COM4. Therefore this command should only be necessary if you intend to
use COM3 or COM4, or if you have a non-standard COM1 or COM2.For example to instruct RCOM
to seek an anemometer on COM3 using interrupt 4 the command would be:
RCOM /C3 /CI4
HS-50 Research Anemometer Page 11 Issue 02
Doc. No. 1199-PS-0032 November 2004
Page 14

Gill Instruments Ltd
5.3.2 Procedure if no anemometer is found
If no anemometer is found then the program displays the following menu.
RCOM Gill Instruments Ltd
WARNING!
No anemometer found
Please ensure that the anemometer is connected
And that power is available
1. Search for Anemometer Again
2. Change Serial Port (COM2)
3. Change Base Address 02F8h
4. Change Interrupt vector 03h
5. Exit
The user should:
1. Ensure that the anemometer is connected and powered up. If you are using an indoor Power
and Communications Interface (PCI) and the RX LED is flashing then the anemometer is
powered up and communicating. If the RX LED is NOT flashing it DOES NOT imply that
the anemometer has no power, the anemometer may be awaiting a command over the serial
link.
2. Check that the COM port displayed (COM2 in the above example) is correct. If not select
option 2 on the menu and select the correct comms port.
3. Select option 1 on the menu. The software will seek the anemometer again. If you are using
an indoor Power and Communications Interface (PCI), the TX LED should flash during this
process. If it does not then either the serial port setting is wrong or there is a problem with the
communication cable between the PC and the PCI.
4. If the anemometer is still not found then check that the settings of base address and interrupt
vector are correct for your PC. If not use options 3 & 4 to correct them and option 1 to repeat
the search for the anemometer.
HS-50 Research Anemometer Page 12 Issue 02
Doc. No. 1199-PS-0032 November 2004
Page 15

Gill Instruments Ltd
5.4 Main Menu
The main menu allows the selection of primary functions.
1. RCOM V1. 01 Gill
Instruments Ltd
1. Trend Display
2. Trend Options
3. Display Micro-met Parameters
4. Micro-met Parameter Options
5. Tabular Display
6. Configure Anemometer
7. Options
8. Exit to DOS
5.5 Trend Display
This provides a graphical display of wind component trends. Raw data can be written to disk. (See
Section 5.14)
5.6 Trend Options
This allows the user to select which parameters to display on the trend display, and to select superVGA modes. The software supports 800x600 and 1024x768, 16-colour modes on VESA compatible
super-VGA cards.
5.7 Display Micro-met Parameters
This displays micro-meteorological parameters in real time. Raw data and calculated parameters can
be written to disk. (See Section 5.14)
5.8 Micro-met Parameter Options
This allows the user to select which micro-meteorological parameters to display and which micrometeorological parameters to download to disk. (See Section 5.15)
5.9 Tabular Display
This gives a scrolling display of wind measurement. Maximum and minimum values can be
displayed. Raw data can be written to disk. (See Section 5.16)
5.10 Configure Anemometer
This displays the configuration of the anemometer and allows the user to alter parameters. (See
Section 5.17)
5.11 Options
This allows the user to set various options. These are mostly to do with writing data to disk. (See
Section 5.18)
5.12 Exit to DOS
This quits the program and returns the user to the operating system.
HS-50 Research Anemometer Page 13 Issue 02
Doc. No. 1199-PS-0032 November 2004
Page 16
Gill Instruments Ltd
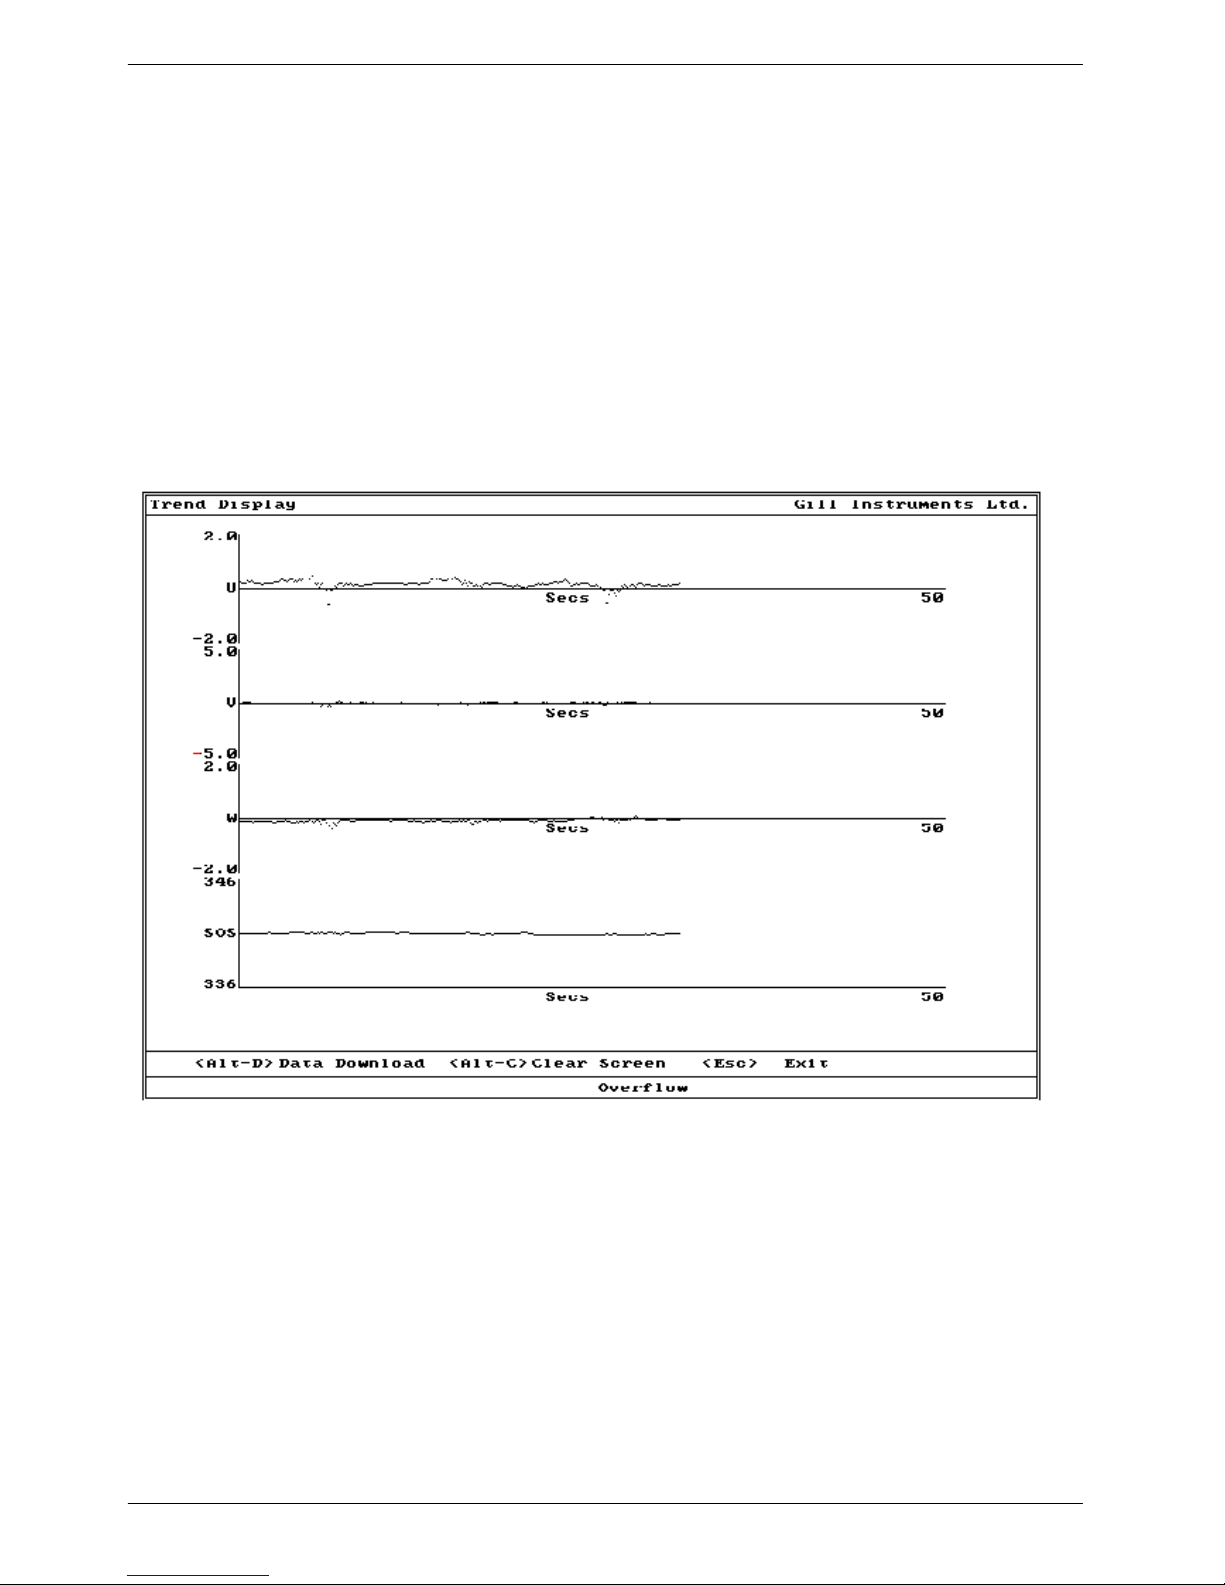
5.13 Trend Display
The Trend Display provides a graphical display of wind component trends. Each parameter is
displayed on its own set of axes and in a unique colour. The labels on the Y-axis give the name of the
parameter and the scale. The data is displayed from left to right. Each sample is displayed as a
separate pixel, therefore the speed of the display and the resolution of the X-axis is dependent on the
sample rate and the resolution of the screen. The X axis is labelled in seconds. When the extreme
right of the screen is reached the colour of the old data changes to grey, and the scale is displayed on
the right in grey. The display then starts again from the left-hand edge, with new scale values.
U, V, W and magnitude are displayed in m.s-1. Direction is displayed in degrees. Temperatures are
displayed either in Kelvin or degrees Celsius. Analogue inputs are in volts. Each display is scaled
individually. In the example below the W vector is scaled at ±5m.s-1 whilst U and V are scaled at
±2m.s-1.
Pressing the “Alt” and “D” keys simultaneously (Alt-D) will initiate a data download. The user will
be asked for a filename and the raw data will be written to that file. The format of the download is
selected from the Options Menu. Once a data display has been started the Alt-D combination will
stop the download without ending the display.
Pressing the “Alt” and “C” keys simultaneously (Alt-C) will clear the screen and start the data
display from the left, with new scale values. Pressing the “Esc” key will stop any download that is in
progress, terminate the display and return the user to the main menu.
HS-50 Research Anemometer Page 14 Issue 02
Doc. No. 1199-PS-0032 November 2004
Page 17

Gill Instruments Ltd
5.14 Display Micro-met Parameters
Micro-met Parameters screen displays micro-meteorological parameters in real time. The results
displayed are selected and the time over which they are calculated is set in the Micro-met options
menu. The calculations performed are described in Appendix B.
Calculated parameters can be written to disk. The results saved are selected in the Micro-met options
menu and are independent of the results displayed.
Pressing the “Alt” and “D” keys simultaneously (Alt-D) will initiate a data download. The user will
be asked for a filename and the selected calculated parameters will be written to that file. The format
of the download is selected from the Options Menu. Once a data display has been started the Alt-D
combination will stop the download without ending the display.
Pressing the “Alt” and “C” keys simultaneously (Alt-C) will clear the screen and re-start the display.
Pressing the “Esc” key will stop any download that is in progress, terminate the display and return
the user to the main menu.
The example screen shows what would be displayed with mean and standard deviation; U, V and W;
covariance of U with V; covariance of U with W; covariance of V with W;U* and Cd selected for
display. Pressing the “Esc” key exits this display and returns to the main menu.
Micro-met Parameters Gill
Instruments Ltd
Mean U +0.168 m/s
Mean V -0.001m/s
Mean W -0.140 m/s
Usig +0.237 m/s
Vsig +0.166 m/s
Wsig +0.087 m/s
UVcov +0.024 m2/s2
UWcov -0.003 m2/s2
Vwcov +0.002 m2/s2
U* +0.000 m/s
Cd +0.000
<Alt-D> Data Download <Alt-C> Clear Screen
<Esc> Exit
Status OK
5.15 Micro-met Parameter Options
This allows the user to select which micro-meteorological parameters to display and which micrometeorological parameters to download to disk. It also allows the setting of various user defined
parameters. The calculations performed to derive these parameters are contained in Appendix B.
For each parameter there are two entries. Each may be either a tick or a cross. If the entry under the
‘Disp’ label is a tick then that parameter will be displayed on the micro-met parameters screen. If the
entry under the ‘Log’ label is a tick then that parameter will be written to disk.
HS-50 Research Anemometer Page 15 Issue 02
Doc. No. 1199-PS-0032 November 2004
Page 18

Gill Instruments Ltd
Selecting Von Kármán Constant, Specific Density of Air, Specific Heat of Air, Gravity Constant or
Sample Time allows the user to edit these settings. The Temperature Input setting allows sonic
temperature or absolute temperature from the PT100 to be used as the input parameter T. The
example screen shows what would be displayed with means of U, V and W; covariance of U with V,
covariance of U with W and covariance of V with W selected for display and the means U, V and W
selected for download to disk. Selecting Exit or pressing the “Esc” key exits this menu and returns to
the main menu.
6. Micro Meteorology Options Gill
Instruments Ltd
Means Natural Stand Devs Input Means
Disp Log Disp Log Disp Log
Mean U 9 9 xsig X X Alp 1 X
X
Mean V 9 9 ysig X X Alp12 X
X
Mean W 9 9 zsig X X Alp3 X
X
Mean T X X Alp4 X
X
Turbulence Parameters Alp5 X X
Stnd Devs Disp Log
Disp Log tx X X
Usig X X ty X X Input Stnd Devs
Vsig X X tz X X Disp Log
Wsig X X u* X X Alp1sig X X
Tsig X X T* X X Alp2sig X X
Cd X X Alp3sig X X
Covariances L X X Alp4sig X X
Disp Log F X X Alp5sig X X
Uvcov 9 X Qh X X Alp6sig X
X
Uwcov 9 X TKE X X
Vwcov 9 X Input Covariances
UTcov X X Disp Log
VTcovX X AlpWcov X X
WTcov X X Alp2Wcov X X
Alp3Wcov X X
User Parameter Alp4Wcov X X
Von Karman Constant 0.40 Alp5Wcov X X
Specific Density of Air 1.225 Alp6Wcov X X
Specific Heat of Air 1004.67
Gravity Constant 9.80 Exit
Sample Time (Minutes) 60
Use Temperature Input Sonic Temp
HS-50 Research Anemometer Page 16 Issue 02
Doc. No. 1199-PS-0032 November 2004
Page 19

Gill Instruments Ltd
5.16 Tabular Display
This gives a scrolling display of wind measurement. The oldest results are at the top of the screen.
New results are added at the bottom of the screen and the whole display is scrolled upwards. If all the
options are turned on then the amount of data will exceed the screen width. In this instance the
number of decimal places used to display the analogue inputs will be reduced. The data written to
disc will use all decimal places and may therefore exceed eighty characters.
Maximum and minimum values can be displayed at the bottom of the screen. Maximum and
minimum are selected from the options menus. The maximum and minimum display can be cleared
by pressing “Alt-M”.
Raw data can be written to disk. Pressing the “Alt” and “D” keys simultaneously (Alt-D) will initiate
a data download. The user will be asked for a filename and the raw data will be written to that file.
The format of the download is selected from the Options Menu. Once a data display has been started
the Alt-D combination will stop the download without ending the display.
Pressing the “Alt” and “C” keys simultaneously (Alt-C) will clear the screen and start the data
display from the top of the screen. It does not clear the maximum and minimum display. Pressing the
“Esc” key will stop any download that is in progress, terminate the display and return the user to the
main menu.
Data Display Gill Instruments Ltd
Sa Sb U V W
04 00 +00.00 +00.00 -00.02 288.76
05 00 +00.00 +00.00 -00.02 288.76
06 01 +00.00 +00.00 -00.02 289.01
07 31 +00.00 +00.00 -00.02 288.78
08 00 +00.00 +00.00 -00.02 288.75
09 00 +00.01 +00.00 -00.02 288.75
0A 00 +00.00 +00.00 -00.03 288.77
01 08 +00.00 +00.00 -00.02 288.76
02 2C +00.00 +00.00 -00.02 288.74
03 00 +00.00 +00.00 -00.02 288.78
04 00 +00.01 +00.00 -00.01 288.76
05 00 +00.00 -00.01 -00.01 289.04
06 01 +00.00 +00.00 -00.02 288.75
07 31 +00.00 +00.00 -00.03 289.06
08 00 +00.00 +00.00 -00.03 289.04
09 00 +00.00 +00.00 -00.02 288.74
0A 00 +00.00 +00.00 -00.02 288.77
01 08 +00.01 +00.00 -00.01 288.75
02 2C +00.00 +00.00 -00.03 288.76
03 00 +00.00 +00.00 -00.02 288.77
04 00 +00.01 +00.00 -00.01 288.74
05 00 +00.00 +00.00 -00.02 288.75
01 00 -00.05 -00.39 -00.24 288.72
HS-50 Research Anemometer Page 17 Issue 02
Doc. No. 1199-PS-0032 November 2004
SoS
Page 20

Gill Instruments Ltd
0A 31 +00.24 +00.01 +00.01 289.30
<Alt-D> Data Download <Alt-C> Clear Screen <Esc> Exit
Status OK
5.17 Configure Anemometer
This displays the configuration of the anemometer and allows the user to alter parameters. Selecting
any option except “average” causes a small menu to be displayed. This menu offers all the possible
settings for that parameter. Selecting “average” allows the user to alter the number of firings
averaged by the anemometer. This can be any integer value between 2 and 250.
The example shows the “Message Mode” sub-menu “popped-up” over the configuration screen.
Selecting EXIT or pressing the “Esc” key exits this menu and returns to the main menu
2. Configuration Gill
Instruments Ltd
Serial Number:
0123456
Data Reported Reporting Speed
Report Mode UVW CAL Average 10
Speed of Sound mode SPEED Baud Rate 19200
Absolute Temp Mode OFF
Analogue
String Format Channels enabled
DDDDDD
String Format BINARY Full Scale Deflect
30
ASCII Terminator CRLF Direction Wrap
Mode 360
Echo
Message Mode Additional
Features
Confidence Tone
DISABLED
Axis Alignment
AXIS
EXIT
CON
HS-50 Research Anemometer Page 18 Issue 02
Doc. No. 1199-PS-0032 November 2004
Page 21

Gill Instruments Ltd
5.18 Options
This allows the user to set various options. These are mostly to do with writing data to disk.
Selecting “Output Field Separator” allows the user to select what separator will be used in ASCII
mode downloads. The choices are Comma, Space, Tab or Semi-Colon. If the download format is set
to Binary than this option has no effect.
Selecting “Output Line Terminator” allows the user to select what terminator will be used at the end
of lines in ASCII mode downloads. The choices are carriage return (CR) or carriage return and linefeed (CR/LF). If the download format is set to Binary than this option has no effect.
Selecting the "Download format" allows the user to choose whether to store data in ASCII or Binary.
ASCII files are suitable for reading into a text editor or spreadsheet directly.
They take longer to write and may require more disk space than binary files. Binary data needs to be
converted to ASCII by a separate program before reading into a text editor or spreadsheet. The
conversion program "Convert 3" is supplied with the anemometer for this purpose. Instructions for
Convert 3 are provided in Section 5.21. The binary file format
is specified in Appendix E.
“Output Field Separator”, “Output Line Terminator” and “Download format” affect downloads from
the trend display, the micro-met parameter display and the tabular display.
Selecting “Display Maxima and Minima” toggles the display of maximum and minimum values in
tabular display on or off.
Selecting "Output Period" allows the user to enter an averaging period (1 to 60 mins) for use when
displaying and logging data in trend and tabular display mode. A time of 0 gives no averaging.
Averaging period selected is displayed after the status code.
Selecting Return to Main Menu or pressing the “Esc” key exits this menu and returns to the main
menu.
4. Options Gill
Instruments Ltd
1. Output Field Separator COMMA
2. Output Line Terminator CR/LF
3. Download Format ASCII
4. Display Maxima and Minima On
5. Output Period O
6. Return to Main Menu
5.19 Storage of settings
All menu selections that set a parameter are stored in a data file on the hard disk in a file named
“\RCOM\MICROMET.SET”. This prevents the users from having to re-enter settings each time the
program is run. If this file cannot be found then default values will be used and the file created.
HS-50 Research Anemometer Page 19 Issue 02
Doc. No. 1199-PS-0032 November 2004
Page 22

Gill Instruments Ltd
5.20 RCOM Error Messages
Transducer pair(s) X failed
One or more transducer pairs (indicated by X) has failed. This may be due to failure of one
or both transducers or their associated electronics, or due to a blockage in the ultrasonic path.
Non-volatile memory error
Indicates a failure in the non-volatile EEPROM memory of the anemometer.
Absolute PRT failed
Indicates failure of the PRT temperature probe or its associated electronics
Configuration Mis-match
Indicates that the configuration reported by the status codes in Measurement Mode does not
match that reported by the CONFIG command in Interactive Mode.
Anemometer Type Mis-match
Indicates that the anemometer type reported by the status codes does not match the
anemometer type indicated by the serial number.
Transducer pair(s) X at n% gain
Indicates that one or more transducer pairs (indicated by X) is at a high gain setting (50, 90 or
100%, indicated by n).
5.21 Instructions For Using The Binary To ASCII Conversion Utility
• Convert 3 is used with RCOM, the Solent R3, HS and HS-50 research anemometer PC software.
• A binary file is converted to ASCII.
• DOS command line options:-
• convert3 <input file name> [output file name] [sos|abst|a1...a6|clino|none]
• If no output file name is specified then the output file name is used with a .CSV file extension.
• The anemometer status and wind data is always converted to ASCII.
• Additional data can be selected as follows:-
sos speed of sound or sonic temperature
abst absolute temperature
a1 analogue input 1
a2 analogue input 2
a3 analogue input 3
a4 analogue input 4
a5 analogue input 5
a6 analogue input 6
clino inclinometer x and y in 0.01° steps
none anemometer status and wind data only
HS-50 Research Anemometer Page 20 Issue 02
Doc. No. 1199-PS-0032 November 2004
Page 23

Gill Instruments Ltd
• Analogue inputs are output in volts to 4 decimal places.
• If no selection of additional data is made then all the available data is converted.
• A reminder of the above commands can be obtained by typing convert3 help.
HS-50 Research Anemometer Page 21 Issue 02
Doc. No. 1199-PS-0032 November 2004
Page 24

Gill Instruments Ltd
6. USING THE ANEMOMETER WITH A PC RUNNING RCOM II
6.1 PC Requirement
Recommended: Windows 98, P166 or higher, 32 MB RAM.
6.2 Installing RCOM II
Insert the installation CD, click on the set-up icon and follow the displayed instructions.
6.3 Starting RCOM II
Select Start->Programs->RcomII
6.4 Using RCOM II
RCOM II is a Windows program, which offers a simple terminal for viewing HS-50 output and or
configuring the HS-50 using Interactive Mode. Refer to the Software Commands section for details
on the Interactive Mode command set.
Port Configuration: The serial communications port can be configured via the Terminal->Configure
Ports dialog. The port status is shown at the bottom of the application window.
Data logging: Output can be directed to a file using the Terminal->Open Log File. Once a log file is
open the option Terminal->Close Log File can be used to halt all logging.
HS-50 Research Anemometer Page 22 Issue 02
Doc. No. 1199-PS-0032 November 2004
Page 25

Gill Instruments Ltd
7. USING THE ANEMOMETER WITH A PC RUNNING YOUR
SOFTWARE
7.1 Digital Serial Output Format
Data is sent in either binary or ASCII format as follows:
7.1.1 Binary Result Message Format
0xBA 0xBA StaA StaD Wc1H Wc1L Wc2H Wc2L Wc3H Wc3L CH CL TH TL A1H A1L ... AnH
AnL cc
where:
0xBA 0xBA - Start of result message identifier. 2 bytes, hex value BA.
StaA - Status Address
StaD - Status Data
Wc 1 - Wind component 1
Wc 2 - Wind component 2
Wc 3 - Wind component 3
C - Speed of sound
T - Absolute temperature
A1 - Analogue input 1
An - Analogue input n
Cc - checksum of all bytes. The checksum is an exclusive OR of all
bytes excluding the 2 start bytes.
These fields are defined as follows:
Wind Component Fields
UVW format Wc1 U axis velocity in 0.01ms-1 units (Two's complement signed)
Wc
Wc
V axis velocity in 0.01ms-1 units (Two's complement signed)
2
W axis velocity in 0.01ms-1 units (Two's complement signed)
3
Polar format Wc1 U V plane velocity direction in ° relative to N.
Wc
U V plane velocity magnitude in 0.01ms-1 units.
2
Wc3 W axis velocity in 0.01ms-1 units (Two's complement signed)
Axis Speeds Wc1 Ultrasonic axis 1 velocity in 0.01ms-1 units (Two's complement
signed)
Wc2 Ultrasonic axis 2 velocity in 0.01ms-1 units (Two's complement
signed)
Wc3 Ultrasonic axis 3 velocity in 0.01ms-1 units (Two's complement
signed)
Speed of Sound Field
Speed Of Sound Speed of sound in 0.01ms-1 units (Unsigned)
HS-50 Research Anemometer Page 23 Issue 02
Doc. No. 1199-PS-0032 November 2004
Page 26

Gill Instruments Ltd
Sonic Temperature Sonic temperature in 0.01K (Unsigned) or 0.01°C (Two's
complement signed)
Absolute Temperature Field
Absolute Temperature in 0.01K (Unsigned) or 0.01°C (Two's complement signed)
Analogue Input Fields
Analogue input value in twos complement:
0000 0.0000V
1FFF +4.9994V
E000 -5.0000V
Checksum Field
Exclusive OR of all bytes excluding the two start bytes.
7.1.2 ASCII Result Message Format
<STX>StaA, StaD,Wc1,Wc2,Wc3,C,T,A1,...,An,<ETX>cc<TERM>
where:
<STX> - Start of string character (ASCII value 2)
StaA - Status Address
StaD - Status Data
Wc 1 - Wind component 1
Wc 2 - Wind component 2
Wc 3 - Wind component 3
C - Speed of sound
T - Absolute temperature
A1 - Analogue input 1
An - Analogue input n.
<ETX> - End of string character (ASCII value 3)
cc - checksum of all characters between <STX> and <ETX>
<TERM> - <CR> or <CR><LF>, user selectable
These fields are defined as follows:
Wind Component Fields
UVW format Wc1 U axis velocity in 0.01ms-1 units (±UU.UU)
Wc
Wc
V axis velocity in 0.01ms-1 units (±VV.VV)
2
W axis velocity in 0.01ms-1 units (±WW.WW)
3
Polar format Wc1 U V plane velocity direction in ° relative to N (DDD)
Wc
Wc
U V plane velocity magnitude in 0.01ms-1 units (MM.MM)
2
W axis velocity in 0.01ms-1 units.(±WW.WW)
3
Axis Speeds Wc1 Ultrasonic axis 1 velocity in 0.01ms-1 units (±A1A1.A1A1)
Wc
HS-50 Research Anemometer Page 24 Issue 02
Doc. No. 1199-PS-0032 November 2004
Ultrasonic axis 2 velocity in 0.01ms-1 units (±A2A2.A2A
2
)
2
Page 27

Gill Instruments Ltd
Wc
Ultrasonic axis 3 velocity in 0.01ms-1 units (±A3A3.A3A3)
3
Speed of Sound Field
Speed Of Sound Speed of sound in 0.01ms-1 units (CCC.CC)
Sonic Temperature Sonic temperature in 0.01K (KKK.KK) or 0.01°C (±CC.CC)
Absolute Temperature Field
Absolute Temperature in 0.01K or 0.01°C (TTT.TT) or 0.01°C (±CC.CC)
Analogue Input Fields
Analogue input value in volts (±v.vvvv)
Checksum Field
Exclusive OR of all characters between <STX> and <ETX> reported as ASCII hex.
7.1.3 Status Fields
There are a number of different status codes, which give the user information about various aspects
of the anemometer. Each of these codes has an address field followed by a data field. The address
field defines which particular aspect of the anemometer the following data field refers to.
The address fields are defined as follows:
StaA - Status Address
Address Function
00 Error codes
01 Anemometer configuration
02 Data output configuration 1
03 Data output configuration 2
04 Error code history
05 Transducer gain levels
06 Anemometer Type
07 Inclinometer X axis MSB
08 Inclinometer X axis LSB
09 Inclinometer Y axis MSB
10 Inclinometer Y axis LSB
In normal operation the anemometer output cycles through the status codes 01 - 06 at each output
sample. If the anemometer detects an error then the status code 00 is displayed instead of the next
cyclic status code. When the error is cleared, the status codes will continue to cycle from where they
were interrupted.
If the error is caused by a transducer pair failure then the error code is displayed until the failure is
rectified.
If the error is caused by a memory or PRT failure, then after 16 consecutive failed readings, the error
condition is reduced to the error code history status and the error cleared.
StaD - Status Data
Address 00 - Error codes
Bit Function
HS-50 Research Anemometer Page 25 Issue 02
Doc. No. 1199-PS-0032 November 2004
Page 28

Gill Instruments Ltd
0 Transducer pair 1 failed.
1 Transducer pair 2 failed
2 Transducer pair 3 failed
3 Reserved
4 Non-volatile memory error
5 PRT failed
6 Reserved
7 Reserved
Address 01 - Anemometer configuration
Bit Function
0 Reserved
1 PRT fitted
2 Reserved
3 Inclinometer fitted
4 0 U, V, W axis definition (U aligned with transducer axis 1 when viewed from
above)
1 U', V', W' axis definition (U' aligned with the spar)
5 Reserved
6 Reserved
7 Reserved
Address 02 - Data output configuration 1
Bits 1,0
00 Wind mode UVW
01 Wind mode axis
10 Polar 360 wrap
11 Polar 540 wrap
Bits 3,2
00 ±10ms-1 Full Scale Deflection
01 ±20ms-1 Full Scale Deflection
10 ±30ms-1 Full Scale Deflection
11 ±60ms-1 Full Scale Deflection
Bits 5,4
00 SOS report off
01 SOS report speed of sound
10 SOS report sonic temp. K
11 SOS report sonic temp. C
Bits 7,6
00 PRT temp. off
01 PRT temp. K
10 PRT temp. C
11 Reserved
12
Address 02 is repeated for 8 samples after a power on reset or exit from ‘Interactive Mode’ to allow
the analogue output card or custom PC software to recognise the output configuration.
Address 03 - Data output configuration 2
Bits 2,1,0
HS-50 Research Anemometer Page 26 Issue 02
Doc. No. 1199-PS-0032 November 2004
Page 29

Gill Instruments Ltd
000 No inputs enabled
001 1 input enabled
010 2 inputs enabled
011 3 inputs enabled
100 4 inputs enabled
101 5 inputs enabled
110 6 inputs enabled
111 Not used
Bit 3
0 Reserved
1 Reserved
Bits 5,4
00 Reserved
01 Reserved
10 Reserved
11 Reserved
Bits 7,6
00 Reserved
01 Reserved
10 Reserved
11 Reserved
Address 04 - Error code history
Bit Function
0 Reserved
1 Reserved
2 Reserved
3 Reserved
4 Non-volatile memory error
5 PRT failed
6 Reserved
7 Reserved
The error history is cleared when the user enters interactive mode.
Address 05 - Transducer gain levels
Bits 1,0
00 Channel pair 1 nominal
01 Channel pair 1 @ 50%
10 Channel pair 1 @ 90%
11 Channel pair 1 @ 100%
Bits 3,2
00 Channel pair 2 nominal
01 Channel pair 2 @ 50%
10 Channel pair 2 @ 90%
11 Channel pair 2 @ 100%
Bits 5,4
00 Channel pair 3 nominal
01 Channel pair 3 @ 50%
10 Channel pair 3 @ 90%
11 Channel pair 3 @ 100%
HS-50 Research Anemometer Page 27 Issue 02
Doc. No. 1199-PS-0032 November 2004
Page 30

Gill Instruments Ltd
Bits 7,6
Reserved
Address 06 - Anemometer type
Bits 2,1,0
000 Single axis
001 Omnidirectional or Asymmetric
010 Three Axis Horizontal
011 Reserved
100 Reserved
101 Reserved
110 Reserved
111 Reserved
Bits 7,6,5,4,3 Not used.
Address 07 - Inclinometer X axis MSB
Address 08 - Inclinometer X axis LSB
Address 09 - Inclinometer Y axis MSB
Address 10 - Inclinometer Y axis LSB
The above data are output as 16 bit twos complement numbers. In ASCII output format two hex
characters are output for each status address.
If an inclinometer is not fitted or faulty the above addresses are not output.
7.1.4 Software commands
Command Format
All commands are entered as an ASCII string consisting of a mnemonic, representing the operation,
and zero or more parameters separated by spaces and terminated by either <CR> or <CR><LF>. The
case of the characters in the command is ignored.
Commands are only valid whilst in the interactive mode, with the exception of the “enter interactive
mode” command and polled data request command.
ASCII Output String Termination
The ASCII output string terminator can be configured to be either <CR> or <CR><LF>. The
expression <TERM> is used to indicate either one of these string terminators.
Character Echo
Character echo can be enabled or disabled. If enabled, received characters are only echoed while in
interactive mode.
The Backspace Character
The anemometer will respond to the <BACKSPACE> character by deleting the previous character
from its command buffer, and echo <BACKSPACE><SPACE><BACKSPACE>.
The Escape Character
The anemometer will respond to the <ESC> character by deleting all characters currently in it’s
command buffer, and echo <TERM><TERM>.
HS-50 Research Anemometer Page 28 Issue 02
Doc. No. 1199-PS-0032 November 2004
Page 31

Gill Instruments Ltd
Command Responses
Command responses are only issued when in interactive mode.
Configuration Commands
On receipt of a configuration command, the anemometer will respond with a validation
message if the command was successfully actioned, or an appropriate error message if
it was not. If a configuration command is entered with no data parameter, the current
data value is returned.
Interrogation Commands
On receipt of an interrogation command, the anemometer responds with the requested
information if the command was successfully completed, or an appropriate error
message if it was not.
Invalid Combinations of Commands
It is possible through the setting of various parameters to request a configuration where the required
output bit rate exceeds the configured baud rate.
If an issued configuration command requests a parameter change that would cause the above
situation, an appropriate error message is generated.
COMMANDS
The command descriptions use a modified form of the BNF format:| Option, one option from a list separated by the vertical bar must be included in
the command.
() Parenthesis, used to make the possible combinations unambiguous.
[] Option, the symbols within the square braces are optional.
n{}m Repeat, the symbols inside the braces can be repeated n to m times. If n is not
included then 0 is implied, if m is not present then infinity is implied.
<> Non literal symbol, this represents other non literal and literal symbols. A
further definition is required to define this non literal symbol.
IM
Syntax: IM
Description: Switches from measurement mode to interactive mode.
EXIT
Syntax: EXIT
Description: Exits from interactive mode back to measurement mode.
AVERAGE
Syntax: AVERAGE 2....250
Description: Sets the number of samples used in the block average.
WINDREP
Syntax: WINDREP ( UVW | POLAR ) ( CAL | UNCAL ) | AXIS
Description: Sets the wind measurement reporting format.
Parameters: UVW Reports wind velocity in UVW format.
POLAR Reports wind velocity in polar + W format.
AXIS Reports wind as axis velocities.
CAL Wind results are calibrated.
HS-50 Research Anemometer Page 29 Issue 02
Doc. No. 1199-PS-0032 November 2004
Page 32

Gill Instruments Ltd
UNCAL Wind results are uncalibrated.
SOSREP
Syntax: SOSREP OFF | SPEED | (SONICTEMP K | C)
Description: Sets the speed of sound reporting format.
Parameters: OFF SOS reporting is turned off.
SPEED SOS is reported as speed.
SONICTEMP SOS is reported as sonic temperature.
K Sonic temperature reporting in K.
C Sonic temperature reporting in °C.
ABSTEMP
Syntax: ABSTEMP OFF | (ON K | C)
Description: Enables and disables absolute temperature reporting from the PRT sensor.
Parameters: OFF PRT temperature reporting turned off.
ON PRT temperature reporting turned on.
K PRT temperature reporting in K.
C PRT temperature reporting in °C.
ANAIP
Syntax: ANAIP <ipno>{,< ipno> }6 ( D | E )
<ipno> = 1 | 2 | 3 | 4 | 5 | 6
Description: Turns on or off the specified analogue inputs.
Parameters: ipno Analogue input channel number.
D Disable specified channels.
E Enable specified channels.
AOPFSD
Syntax: AOPFSD 10 | 20 | 30 | 60
Description: Specifies the analogue outputs full scale deflection. Used to configure the
analogue output box only.
POLARWRAP
Syntax: POLARWRAP 360 | 540
Description: Specifies the analogue outputs polar reporting wrap angle. Used to
configure the analogue output box only.
STRFMT
Syntax: STRFMT BINARY | ASCII ( PAD | UNPAD)
Description: Sets the result message string format.
Parameters: BINARY Binary result message format.
ASCII ASCII result message format.
PAD ASCII fields padded to fixed size.
UNPAD ASCII fields unpadded.
ASCTERM
Syntax: ASCTERM CR | CRLF
Description: Sets ASCII output string terminator.
Parameters: CR ASCII output string terminator is <CR>.
CRLF ASCII output string terminator is <CR><LF>.
HS-50 Research Anemometer Page 30 Issue 02
Doc. No. 1199-PS-0032 November 2004
Page 33

Gill Instruments Ltd
ECHO
Syntax: ECHO OFF | ON
Description: Turns on or off character echoing.
Parameters: OFF Turn off character echoing.
ON Turn on character echoing.
MSGMODE
Syntax: MSGMODE CONT | POLL
Description: Sets the message reporting mode.
Parameters: CONT Result messages are reported continuously.
POLL Result messages are requested by the user.
BAUD
Syntax: BAUD 2400 | 4800 | 9600 | 19200 | 38400 | 57600 | 115200
Description: Sets the serial interface baud rate. Selection must be confirmed with a
letter B.
CTONE
Syntax: CTONE ON | OFF | DISABLE
Description: Enables an audible confidence tone
Parameters: ON Enables the confidence tone
OFF Disables the tone until the anemometer is next powered up.
DISABLE Disables the tone until the function is enabled using CTONE
ON.
?
Syntax: ?
Description: Request the current results message when in polled mode.
HELP
Syntax: HELP
Description: Reports a brief description of all the available commands.
Syntax: HELP command
Description: Reports a description of the command requested.
SN
Syntax: SN
Description: Reports the anemometer’s serial number.
VER
Syntax: VER
Description: Reports the anemometer’s software version.
HS-50 Research Anemometer Page 31 Issue 02
Doc. No. 1199-PS-0032 November 2004
Page 34

Gill Instruments Ltd
CONFIG
Syntax: CONFIG
Description: Reports the anemometer’s configuration.
INCL
Syntax: INCL
Description: Reports the inclination of the anemometer from the vertical axis.
The format is ±XX.XX, ±YY.YY.
VERIFY
Syntax: VERIFY E/D
Description: Enables or disables messages to verify that commands have been carried
out. The verification message is the command name prefixed by "V". e.g.
"VAVERAGE" for and "AVERAGE" command.
Parameters: E enables verification messages.
D disables verification messages.
ALIGNUVW
Syntax: ALIGNUVW AXIS | SPAR
Description: Selects UVW alignment from two alternative definitions
Parameters: AXIS Aligns the U axis to transducer axis 1 when viewed from above.
SPAR Aligns the U axis with the main spar.
HS-50 Research Anemometer Page 32 Issue 02
Doc. No. 1199-PS-0032 November 2004
Page 35

Gill Instruments Ltd
8. USING THE ANALOGUE INPUTS OF THE ANEMOMETER
Six differential analogue inputs are available of 14-bit resolution. A specification for these is given in
Section 11.6. This feature allows the user to power extra equipment local to the anemometer and to
take analogue data from that equipment. The anemometer digitises the analogue data and appends it
to the digital data string.
A sensor supply voltage is available at each connector. The voltage at this connector is the supply
voltage at the anemometer minus 1.5 volts. The sensor supply voltage is internally regulated to 21±2
volts for anemometer supply voltages above 22 volts.
For sensors with a common supply and signal ground, this ground should be connected to Sensor
Supply -. In this situation Analogue Input - should be connected to Sensor Supply - and Analogue
Ground left floating.
The total current drawn from the sensor supply by all the external sensors must not exceed 70mA.
Sensor connector pin out:
1 Sensor power 2 Analogue input 1+ / 3+ / 5+
3 Analogue ground
4 Analogue input 1- / 3- / 5 5 Analogue input 2+ / 4+ / 6+
6 Analogue input 2- / 4- / 6 7 Sensor power +
8 Chassis/screen
HS-50 Research Anemometer Page 33 Issue 02
Doc. No. 1199-PS-0032 November 2004
Page 36

Gill Instruments Ltd
9. USING THE PRT INPUT
The anemometer is set up to operate with any 4 wire PRT conforming to IEC 751 or DIN 43760.
Compatibility with other standards may be available on request.
PRT connector pin out:
1 Sensor power +
2 Analogue input 6 +
3 Analogue input 6 4 Analogue ground
5 PRT excitation +
6 PRT excitation 7 PRT sense +
8 PRT sense 9 Sensor power 10 Chassis/screen
PRT connection diagram:
PRT excitation +
PRT sense +
PRT 100
PRT sense -
PRT excitation -
For correct operation the PRT connections must be isolated from the rest of the system.
HS-50 Research Anemometer Page 34 Issue 02
Doc. No. 1199-PS-0032 November 2004
Page 37

Gill Instruments Ltd
10. USING THE ANALOGUE OUTPUTS
10.1 Introduction
Analogue outputs can be provided by an additional analogue output card mounted inside the power
supply and communications unit (PCI). PCIs with this card fitted have a model number 1189PCA.
PCIs without analogue outputs have a model number 1189PC.
The analogue output card decodes the serial message from the anemometer and generates the
appropriate analogue outputs. Seven analogue outputs are provided of 14 bit resolution. The pin
assignment and electrical specification for these is given in Section 13.
10.2 Analogue outputs
Channels 1,2 and 3 - Wind velocity
These channels represent the wind velocity. The variables represented by each channel depend on
the anemometer's operating mode, and are defined in the following table:
Output Channel
Mode 1 2 3
UVW U V W
Polar format Dir. Mag. W
Axis velocities Axis 1 Axis 2 Axis 3
For U, V and W magnitude, and axis velocities, ±2.5V represents ±10, ±20, ±30 or
±60m/ s as selected when configuring the anemometer. For direction in polar format the ±2.5V
output range represents either 360° or 540°. This option is also set up when configuring the
anemometer, either using the supplied RCOM software or using the anemometer's interactive mode
commands.
The direction representation is:
Output voltage (V)
-2.5 -0.833 0 +0.833 +2.5
360° -180° 0° +180°
540° 0° 180° 360° +540°
The 540° mode avoids the output oscillating between -2.5V and +2.5V in response to a direction
varying around 180°.
Channel 4 - Speed of Sound or Sonic Temperature
The variable represented by this analogue output also depends on the configuration of the
anemometer's speed of sound or sonic temperature. The representations for each available mode are:
Output voltage (V)
-2.5 -1.667 0 +2.5
Speed of Sound 300 311.667 335 370
Sonic temperature (Kelvin) 233.15 273.15 333.15
Sonic temperature (Celsius) -40 0 +60
Channel 5 - Absolute Temperature
The voltage output at a given temperature is independent of the anemometer's temperature output
configuration. The following table shows the mapping between voltage and temperature:
Output voltage (V)
-1.667 0 +2.5
HS-50 Research Anemometer Page 35 Issue 02
Doc. No. 1199-PS-0032 November 2004
Page 38

Gill Instruments Ltd
Celsius -40 0 +60
Kelvin 233.15 273.15 333.15
Channel 6 - Reserved for future expansion
This analogue output is not currently used.
Channel 7 and 8 - Analogue Inputs
Channels 7 and 8 echo the voltage on the lowest two analogue inputs that are enabled i.e. the first
two in the serial data message from the anemometer. The analogue inputs at the anemometer are in
the range ±5V. The analogue outputs have a range of ±2.5V. The voltage output is half the analogue
input value. For example an analogue input of +5V is echoed at +2.5V.
10.3 Analogue Sync. Output
A logic 1 on the Analogue Sync output indicates that the analogue outputs have settled. A logic 0 is
generated during the period when the analogue outputs are being updated (approximately 2ms
duration). The pin assignment and electrical specification of the Analogue Sync. output are
contained in Section 13.
10.4 Status Output
A logic 1 on the status output indicates that the analogue outputs are valid (i.e. the full set of
configuration data have been received from the anemometer and there are no data errors for the
current output data). The pin assignment and electrical specification of the status output are
contained in Section 13.
10.5 Test Modes
The analogue output system includes two self-test modes. They are activated by the pulling low the
relevant pin on the main 25-way connector, and remain active until the pin is pulled high or allowed
to go open circuit. The pin assignment and electrical specification are contained in Section 13.
Pulling Test Pin 1 low causes all eight analogue outputs to simultaneously cycle through the
following sequence of voltages:
-2.50v, -1.25v, 0.00v, 1.25v, 2.50v
The outputs remain at each voltage for four seconds so that the sequence repeats every twenty
seconds. Pulling Test Pin 2 low causes the same sequence of voltages to be output on each channel in
turn, while the unused channels are held at 0.00v. i.e. the sequence is first output on channel 1, then
channel 2, then 3 etc. For this test the complete sequence lasts 160 seconds.
HS-50 Research Anemometer Page 36 Issue 02
Doc. No. 1199-PS-0032 November 2004
Page 39

Gill Instruments Ltd
11. DRAWINGS
HS-50 Research Anemometer Page 37 Issue 02
Doc. No. 1199-PS-0032 November 2004
Page 40

Gill Instruments Ltd
1086-M-043 Anemometer Cable(Voltage Out)
HS-50 Research Anemometer Page 38 Issue 02
Doc. No. 1199-PS-0032 November 2004
Page 41

Gill Instruments Ltd
1189-K-022 Indoor PCI Unit Dimensions
HS-50 Research Anemometer Page 39 Issue 02
Doc. No. 1199-PS-0032 November 2004
Page 42

Gill Instruments Ltd
1199-K-066 3 Axis Horizontal Anemometer U,V &W Axis Definitions
HS-50 Research Anemometer Page 40 Issue 02
Doc. No. 1199-PS-0032 November 2004
Page 43

Gill Instruments Ltd
1199-K-089 3 Axis Horizontal Anemometer Head + Electronics Mounting Details
HS-50 Research Anemometer Page 41 Issue 02
Doc. No. 1199-PS-0032 November 2004
Page 44

Gill Instruments Ltd
1210-K-068 R3 & HS Research Anemometer Measurement Sequence
ULTRASONIC
MEASUREMENT
1 1 2 2 3 3
AXIS
TRANSDUCER
L → U U → L L → U U → L L → U U → L
ANALOGUE
INPUT
1 2 3 4 5 6
MEASUREMENT
SYNC.
TIME
1.14mS
1.14mS
1.14mS
1.14mS
1.14mS
10mS
1.14mS
NOTES:
1. L → U indicates lower to upper transducer firing
U → L indicates upper to lower transducer firing
2. Serial output of the previous measurement commences as SYNC goes high
0.88mS
PRT
0.88mS
HS-50 Research Anemometer Page 42 Issue 02
Doc. No. 1199-PS-0032 November 2004
Page 45

Gill Instruments Ltd
Assembly of Amphenol C91A Screw Lock 4 Way Socket
HS-50 Research Anemometer Page 43 Issue 02
Doc. No. 1199-PS-0032 November 2004
Page 46

Gill Instruments Ltd
12. TECHNICAL SPECIFICATION
12.1 Wind Measurement
Measurement Rate: 50s-1 (Full 3 axis measurement)
Data Output Rates: From 0.4 to 50s-1
Wind Speed Range: 0 to 45ms-1
Wind Speed Accuracy: <1%rms
Wind Speed Resolution: 0.01ms-1
Wind Speed Offset: <±0.01ms-1
Directional Accuracy: <±1°RMS
Directional Resolution: 1°
12.2 Speed of Sound Measurement
Measurement Rate: 50s-1 (Synchronous to wind measurement)
SOS Range: 300-370ms-1
SOS Accuracy: <±0.5% (For wind speeds <30ms-1)
SOS Resolution: 0.01ms-1
Accuracy specifications apply for wind speeds <32m/s and for wind incidence within ±50° of
horizontal.
12.3 Environmental
Operating Temperature: -40°C to +60°C
Storage Temperature: -50°C to +75°C
Relative Humidity: 5% to 100%
Precipitation: up to 300mm/hr
Altitude: 0 to 3000m
Moisture ingress: IP65
Suitable for marine environment
EMC Emissions: BS EN 50082-1:1992
EMC Immunity: BS EN 50081-1:1992
Input/Output Protection: >0.8J
12.4 Supply Input
Supply Voltage: 9 to 30VDC
Supply Current: <300mA for 12Vdc input
<150mA for 24Vdc input
12.5 Serial Interface
Electrical Interface: Full Duplex RS422
Baud Rates: 2400, 4800, 9600, 19200, 38400, 57600, 115200
Format: 8 data, 1 stop bit, No parity
HS-50 Research Anemometer Page 44 Issue 02
Doc. No. 1199-PS-0032 November 2004
Page 47

Gill Instruments Ltd
12.6 Analogue Inputs
Sampling Rate: 50s-1 Synchronous to wind measurement.
Diff. Input Voltage Range: -5.000V to +5.000V
Accuracy: >0.05% of full scale
Resolution: 14 bits
Common Mode Input Range: >±8V
Input Impedance: >1M Ohm (Differential)
>1M Ohm (Common Mode)
12.7 PRT
Resolution: 0.01°C
Measurement Accuracy: <±0.1°C (0°C to +50°C)
<±0.15°C (-40°C to +60°C)
12.8 Anemometer Sync Output
RS422 synchronous to wind measurement.
12.9 Inclinometer
Range: monotonic over ±30° of tilt
Resolution: 0.01°
Accuracy: ±0.3° for tilt angles between ±10°
Null Repeatability: ±0.15°
Temperature Coefficient-Null: 0.02° per °C
Temperature Coefficient-Scale Factor:0.2% per °C
12.10 Anemometer Power and Data Connector Hirose 20 way socket
Connector pin Designation
1 Reserved
2 RS422TXB (Data from anemometer)
3 RS422TXA (Data from anemometer)
4 RS422RXB (Data to anemometer)
5 RS422RXA (Data to anemometer)
6 Supply V+
7 Reserved
8 Reserved
9 Chassis
10 Anemometer Sync11 Not used
12 Not used
13 Digital 0V, signal ground
14 Supply V15 Reserved
16 Reserved
17 Reserved
18 Anemometer Sync +
19 Reserved
20 Reserved
HS-50 Research Anemometer Page 45 Issue 02
Doc. No. 1199-PS-0032 November 2004
Page 48

Gill Instruments Ltd
13. POWER AND COMMUNICATIONS INTERFACE
13.1 Desk Top PCI
This unit is for use with a single research anemometer and performs the following functions:
• DC supply for the anemometer for mains or dc input.
• Conversion of the RS422 anemometer serial data to RS232 for connection to a PC.
• Transient protection for all anemometer connections.
• Optional analogue output card.
• Provision of an RS422 interface for transmission of serial data to a PC at higher baud rates or
over long cables. RS232 is not recommended for baud rates above 19200 baud or for cable
lengths greater than 15 metres.
• This is a desktop unit and not suitable for outdoor use.
13.2 Connector Pin Assignments
Anemometer Connector 15 way D type socket
Pin Designation
1 Screen
2 RS422RXB (Data from anemometer)
3 RS422TXB (Data to anemometer)
4 Digital 0V, signal ground
5 Supply V+
6 Sync +
7 Not used
8 Sync 9 RS422RXA (Data from anemometer)
10 RS422TXA (Data to anemometer)
11 Supply V12 Not used
13 Not used
14 Not used
15 Not used
RS232 connector 9 way D type socket
Pin Designation
1 DCD
2 RXD (data from anemometer to PC)
3 TXD (data from PC to anemometer)
4 DTR
5 Signal Ground
6 DSR
7 RTS
8 CTS
HS-50 Research Anemometer Page 46 Issue 02
Doc. No. 1199-PS-0032 November 2004
Page 49

Gill Instruments Ltd
RS422 connector 9 way D type socket
Pin Designation
1 Not used
2 Not used
3 Not used
4 RS422 RXA(data from PC to PCI)
5 Signal GND
6 RS422 TXA(data from PCI to PC)
7 RS422 TXB(data from PCI to PC)
8 RS422 RXB(data from PC to PCI)
9 Earth (Screen)
D.C. Supply Amphenol C91A Screw Lock 4 Way Socket
Pin Designation
1 PCI V+
2 PCI V3 Anemometer V4 Anemometer V+
View of PCI Plug
1
2
4
3
Auxiliary Output 9 way D type plug
Pin Designation
6 Anemometer Sync +
7 Anemometer Sync –
Recommended Line Termination
Note: The above termination is for when the receive circuit is floating relative to the anemometer. If
the receive circuit is referred to Anemometer Signal Ground or Anemometer Supply - then the earth
connection marked 'e' should be omitted.
HS-50 Research Anemometer Page 47 Issue 02
Doc. No. 1199-PS-0032 November 2004
Page 50

Gill Instruments Ltd
Analogue Output Connector 25 way D type plug
Pin Designation Pin Designation
1 Analogue ground 1 14 Analogue output 1
2 Analogue ground 2 15 Analogue output 2
3 Analogue ground 3 16 Analogue output 3
4 Analogue ground 4 17 Analogue output 4
5 Analogue ground 5 18 Analogue output 5
6 Analogue ground 6 19 Analogue output 6
7 Analogue ground 7 20 Analogue output 7
8 Analogue ground 8 21 Analogue output 8
9 Test pin 1 22 Test pin 2
10 Signal ground 23 Earth
11 Earth 24 Status output
12 Signal ground 25 Sync output
13 Signal ground
13.3 PCI Specification
Electrical power requirements
(a) 100Vac - 120Vac, 10VA for the 115V switch position
(b) 200Vac - 250Vac, 10VA for the 230V switch position
(c) 9 - 30Vdc, 400mA max (anemometer)
8 - 15Vdc, 50mA max (PCI)
8 - 15Vdc, 90mA max (PCI with analogue outputs)
Environmental
The desk top PCI is not sealed and is intended for use in a protected environment.
Analogue Outputs
The analogue outputs have the following specification:
Full scale range: -2.5v to +2.5v
Accuracy: 0.25% of full scale (9 bits)
Resolution: 14 bits over ±3.0v
Settling time: 2ms to 0.25% accuracy (note that the minimum time between
samples is 10ms)
Output resistance: <0.5Ω at frequencies below 50Hz, short circuit proof
Load resistance: Greater than 10kΩ
Load capacitance: Between 0 and 1000pF (e.g. up to 10m of coaxial cable)
Analogue Sync and Status Outputs
Both Sync and status outputs conform to the following electrical specification:
Output Voltages: high +3V to +5V
(referred to signal ground) low <1V
Output resistance: <100Ω, short circuit proof
Load resistance: Greater than 10kΩ
Load capacitance: Between 0 and 1000pF (e.g. 10m of coax)
HS-50 Research Anemometer Page 48 Issue 02
Doc. No. 1199-PS-0032 November 2004
Page 51

Gill Instruments Ltd
Test 1, Test 2 Inputs
Logic high (inactive) +3V to +5V or open circuit
Logic low (active) <1V
The above voltages are referenced to signal ground.
HS-50 Research Anemometer Page 49 Issue 02
Doc. No. 1199-PS-0032 November 2004
Page 52

Gill Instruments Ltd
APPENDIX A
SUMMARY OF ABBREVIATIONS USED IN THIS MANUAL
ASCII American Standard Code for Information Interchange
PCI Power & Communications Interface
EU Electronics Unit
PRT Platinum Resistance Thermometer
RS232 Communications standard
RS422 Communications standard
SoS Speed of Sound
RCOM Gill Instruments Ltd. PC communications software
PACKING LIST
HS-50 anemometer, comprising:
• Head
• Electronics Unit
• 1.5m interconnecting cable
• Case
• RCOM software
• This manual
OPTIONAL EXTRAS
• PCI
• Connectors
• PCI to EU cable. Available in a range of lengths
• Custom software on application
HS-50 Research Anemometer Page 50 Issue 02
Doc. No. 1199-PS-0032 November 2004
Page 53

Gill Instruments Ltd
APPENDIX B
Principle of Operation
The basic time-of-flight operating principle is physically fundamental and provides vector
measurement of air velocity dependent mainly on the dimensions and geometry of the transducer
array. A pair of transducers act alternately as transmitters and receivers, sending pulses of high
frequency ultrasound between themselves. The times of flight in each direction, say t1 and t2, are
measured. If c is the speed of sound, L the distance between the transducers and there is an air flow
v along the line of the transducers, the following relationships are readily derived:-
t1 = L/(c+v) ; t2 = L/(c-v)
By inverting and subtracting, v is solved explicitly:-
v = 0.5L(1/t1-1/t2)
This wind vector derivation is not affected by c or any other parameters such as temperature or
contaminant content.
Conversely, c is obtained by inverting and adding:-
c = 0.5L(1/t1+1/t2)
v represents the vector component of air flow resolved along the line of the pair of transducers. By
arranging three pairs of transducers in different orientations, the direction and magnitude of the
incident air flow may be unambiguously derived. The transducer pairs do not have to conform to
cartesian axes. For optimum undisturbed airflow a non orthogonal arrangement is employed.
The main functions of the electronics are operation of the ultrasonics, processing of raw
measurement data, and high level data analysis and data transmission.
The velocities along each transducer axis are calculated as above.
If the anemometer is operating in a UVW mode a transformation is then carried out to calculate the
velocities in the U, V, W format. This transformation is given below.
If operating in a calibrated mode a correction operation is then applied to calibrate out the affects of
the transducers and head framework. The UVW processed data are then output on the serial output.
Vector Transformation
a1 = axis 1 velocity
a2 = axis 2 velocity
a3 = axis 3 velocity
Standard vector mathematics leads to the following equations:U velocity = (2a1 - a2 - a3)/1.9779
V velocity = (a3 - a2 )/1.1420
W velocity = (a1 + a2 + a3)/2.2555
HS-50 Research Anemometer Page 51 Issue 02
Doc. No. 1199-PS-0032 November 2004
Page 54

Gill Instruments Ltd
APPENDIX C
Sonic Temperature Measurement
HS-50 Research Anemometer Page 52 Issue 02
Doc. No. 1199-PS-0032 November 2004
Page 55

Gill Instruments Ltd
HS-50 Research Anemometer Page 53 Issue 02
Doc. No. 1199-PS-0032 November 2004
Page 56

Gill Instruments Ltd
HS-50 Research Anemometer Page 54 Issue 02
Doc. No. 1199-PS-0032 November 2004
Page 57

Gill Instruments Ltd
HS-50 Research Anemometer Page 55 Issue 02
Doc. No. 1199-PS-0032 November 2004
Page 58

Gill Instruments Ltd
HS-50 Research Anemometer Page 56 Issue 02
Doc. No. 1199-PS-0032 November 2004
Page 59

Gill Instruments Ltd
HS-50 Research Anemometer Page 57 Issue 02
Doc. No. 1199-PS-0032 November 2004
Page 60

Gill Instruments Ltd
HS-50 Research Anemometer Page 58 Issue 02
Doc. No. 1199-PS-0032 November 2004
Page 61

Gill Instruments Ltd
APPENDIX D
Micro-Met Calculations
HS-50 Research Anemometer Page 59 Issue 02
Doc. No. 1199-PS-0032 November 2004
Page 62

Gill Instruments Ltd
HS-50 Research Anemometer Page 60 Issue 02
Doc. No. 1199-PS-0032 November 2004
Page 63

Gill Instruments Ltd
HS-50 Research Anemometer Page 61 Issue 02
Doc. No. 1199-PS-0032 November 2004
Page 64

Gill Instruments Ltd
HS-50 Research Anemometer Page 62 Issue 02
Doc. No. 1199-PS-0032 November 2004
Page 65

Gill Instruments Ltd
HS-50 Research Anemometer Page 63 Issue 02
Doc. No. 1199-PS-0032 November 2004
Page 66

Gill Instruments Ltd
HS-50 Research Anemometer Page 64 Issue 02
Doc. No. 1199-PS-0032 November 2004
Page 67

Gill Instruments Ltd
APPENDIX E
RCOM Binary File Format
1. Binary File Header
Description Number of bytes Usual data type Comments
file_type 1 unsigned char 0=ASCII tabular, 1=Binary tabular,
2=ASCII micro-met 3=Binary micro-met
file_version 1 unsigned char Numeric
type 1 unsigned char O=R3 or R3A, H = HS, S= Single axis
serial_number 4 unsigned long Numeric
average 1 unsigned char Numeric, 1 to 250.
wind_report_mode 1 unsigned char 0=UVW cal, 1= UVW uncal,
2=Polar cal, 3= Polar uncal, 4 = axis
string_format 1 unsigned char 0 = Binary, 1= ASCII pad, 2= ASCII unpad
ascii_terminator 1 unsigned char 0 = CR, 1= CRLF
echo 1 unsigned char 0 = off, 1 = on
message_mode 1 unsigned char 0 = continuous, 1 = polled
confidence tone setting 1 unsigned char 0 = on, 1 = off, 2 = disabled
axis alignment setting 1 unsigned char 0 = axis, 1= spar
speed_of_sound_report_mode 1 unsigned char 0 = off, 1= speed,
2=sonictemp K, 3=sonictemp C
absolute_temperature_report_mode 1 unsigned char 0= off, 1 = K, 2 = °C
analogue_input_ 1_on 1 unsigned char 0 = off, 1 = on
analogue_input_ 2_on 1 unsigned char “
analogue_input_ 3_on 1 unsigned char “
analogue_input_ 4_on 1 unsigned char “
analogue_input_ 5_on 1 unsigned char “
analogue_input_ 6_on 1 unsigned char “
analogue_output_scale 1 unsigned char 0=10m/s, 1= 20m/s, 2= 30m/s, 3= 60m/s
analogue_output_wrap 1 unsigned char 0 = 360°, 1= 540°
file create time 4 unsigned long file create time in seconds since
00:00:00 GMT, January 1970
2. Binary Data
HS-50 Research Anemometer Page 65 Issue 02
Doc. No. 1199-PS-0032 November 2004
Page 68

Gill Instruments Ltd
Description Number of bytes Usual data type Comments
data valid / invalid 1 unsigned char 0=valid string, 1=otherwise invalid string,
2=checksum error
3=checksum error and invalid string
U or direction or axis velocity 1 2 short int velocity in 0.01m/s, direction in degrees
V or magnitude or axis velocity 2 2 short int velocity in 0.01m/s
W or axis speed 3 2 short int velocity in 0.01m/s
Reserved 4
Reserved 4
anemometer status 1 unsigned char
anemometer status address 1 unsigned char
absolute temperature 2 unsigned short int 0.01K increments (unsigned)
or short int 0.01°C increments (signed)
speed of sound / sonic temperature 2 unsigned short int in 0.01m/s or 0.01K increments (unsigned)
or short int 0.01°C increments (signed)
analogue input 1 4 long analogue input
analogue input 2 4 long “
analogue input 3 4 long ”
analogue input 4 4 long ”
analogue input 5 4 long ”
analogue input 6 4 long ”
clino_x 2 short int in 0.01° increments
clino_y 2 short int in 0.01° increments
HS-50 Research Anemometer Page 66 Issue 02
Doc. No. 1199-PS-0032 November 2004
Page 69

Gill Instruments Ltd
Notes On Binary File Format
Analogue Inputs
If the anemometer output string format is ASCII the analogue inputs are stored in the binary file in 100uV increments from -5V to +5V.
If the anemometer output string format is binary then analogue inputs are stored in the binary file as follows:-
Voltage Analogue Input Value
+ 4.9994 8191
0.0000 0000
- 5.0000 -8192
HS-50 Research Anemometer Page 67 Issue 02
Doc. No. 1199-PS-0032 November 2004
 Loading...