

Page 1
© Gigahertz Solutions GmbH - 1 - 350-027_NFA1000400-6-2_EN-von-susanne as of October 2011
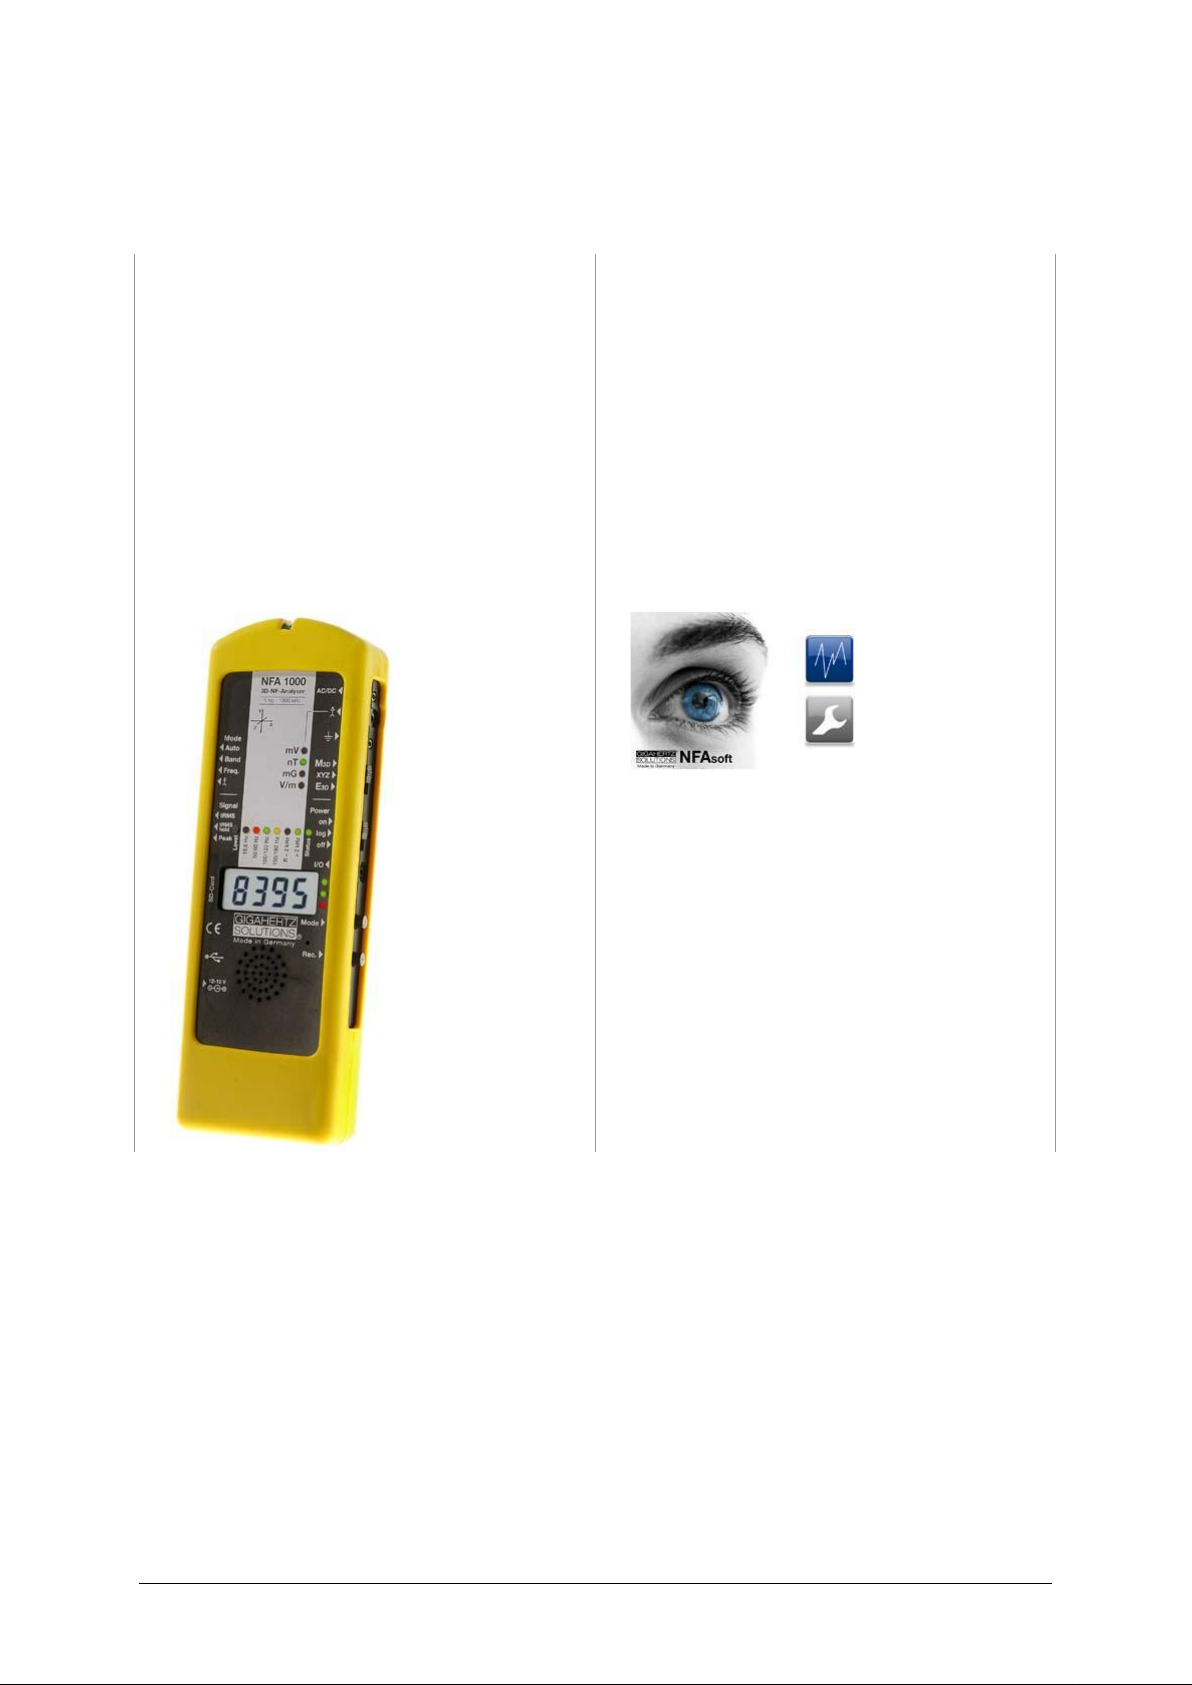
NFA 1000
NFA 400
3D Low Frequency
Analyzer
with Data Logger
NFAsoft
Analysis and Configuration Software
Operating Manual
(Version 6.2)
Page 2

350-027_NFA1000400-6-2_EN-von-susanne as of October 2011 - 2 - © Gigahertz Solutions GmbH
Thank you!
We thank you for the confidence you have shown by buying this product. It allows
for a professional analysis of AC electric and AC magnetic fields according to internationally recognized guidelines and the recommendations of the building biology.
In addition to this manual you can watch the tutorial videos on our website concerning the use of this meter.
Please note:
The only significant difference between the NFA 1000 and the NFA 400 in this man-
ual is the fact that the NFA 1000 allows a three-dimensional potentialfree measurement of the E-field, while the NFA 400 can only be used for one-dimensional potentialfree measurements of the E-field. This distinction is specified in detail in the relevant chapters.
Page 3

© Gigahertz Solutions GmbH - 3 - 350-027_NFA1000400-6-2_EN-von-susanne as of October 2011
Contents
1 Quick Start Guide............................................................................................ 4
2 NFA 1000 Front Cover..................................................................................... 5
3 LEDs / Display / Audio Signals ........................................................................ 6
4 Switches / Push-Buttons / Connectors........................................................... 9
5 How to Measure and Data-Log ......................................................................15
6 Power Supply .................................................................................................18
7 „NFAsoft“........................................................................................................20
8 Firmware-Update............................................................................................27
9 What if… (FAQ)...............................................................................................28
This manual is based on the firmware version 48 and NFAsoft version 109.
The firmware and software of the NFA will be continuously improved and made available via e-mail or download
from our homepage.
Features not yet implemented, but under development, are printed in GREY in this manual.
Page 4

350-027_NFA1000400-6-2_EN-von-susanne as of October 2011 - 4 - © Gigahertz Solutions GmbH
1 Quick Start Guide
The instructions below refer to the factory default settings. These settings can easily
be customized with the help of the supplied software „NFAsoft“.
When you switch on the instrument the LCD will briefly show “batt” and the remaining operation time in the log.-mode with the current capacity of the batteries.
Set all switches to their top position! (Auto, tRMS, M3D and On)
With these settings and the mode button, one can quickly and easily begin the conventional measurement process, without detailed knowledge of the instrument´s features.
The LCD display will now indicate the isotropic (3D) AC magnetic field strength as
the primary measurement. The coloured frequency LEDs above the LCD display
show the active frequencies, the red LED indicating the dominant one. The dominant
axis x, y or z is indicated by a red LED on the right of the LCD display. That’s it – no
further switches or steps needed.
NFA 1000:
To measure the E-field with ground-reference (1D) simply connect the grounding
cable. The NFA detects the attached cable and automatically shows the corresponding AC electric field strengths and frequencies. The E-field measurement will
now be displayed as the primary measurement and the 3D magnetic field as the
secondary. By depressing the ‘mode’ button you can easily switch from this to the
3D magnetic field on the display.
To measure the three dimensional potential-free AC electric field, switch to E3D
and fix the instrument onto a potential-free rod or onto a support. By pressing the
‘mode’ button you can easily switch from this to the Z-axis of the AC magnetic field
on the display.
NFA 400:
For an E-field measurement simply switch to Ey. You now have two possibilities:
If the grounding cable is plugged in and connected to the ground potential,
you are measuring “against ground”.
If you attach the meter to a potentialfree rod or place it onto a support, you
are measuring “potential free”.
Press the ‘mode’ button to switch from this to the 3D magnetic field on the display.
Should the meter not do what you expect, please turn to the chapter on FAQs (frequently asked questions) at the end of this manual (Chapter 9)!
Note: For potential-free e-field-measurements the highest accuracy will be reached when used without the
yellow silicone holster.
Page 5
© Gigahertz Solutions GmbH - 5 - 350-027_NFA1000400-6-2_EN-von-susanne as of October 2011
2 Front Cover NFA 1000 and NFA 400
Analogous front cover for NFA 1000 and NFA 400
NFA 400: „Ey“
12-15 V
Y
X
Z
Power
Signal
Made in Germany
R
GIGAHERTZ
Mode
NFA 1000
3D-NF-Analyser
5 Hz - 1000 kHz
Freq.
AC/DC
Peak
Rec.
Mode
mV
nT
mG
V/m
Band
E
3D
M
3D
tRMS
Auto
XYZ
On
Off
Log
I/O
X
Y
Z
Hold
/
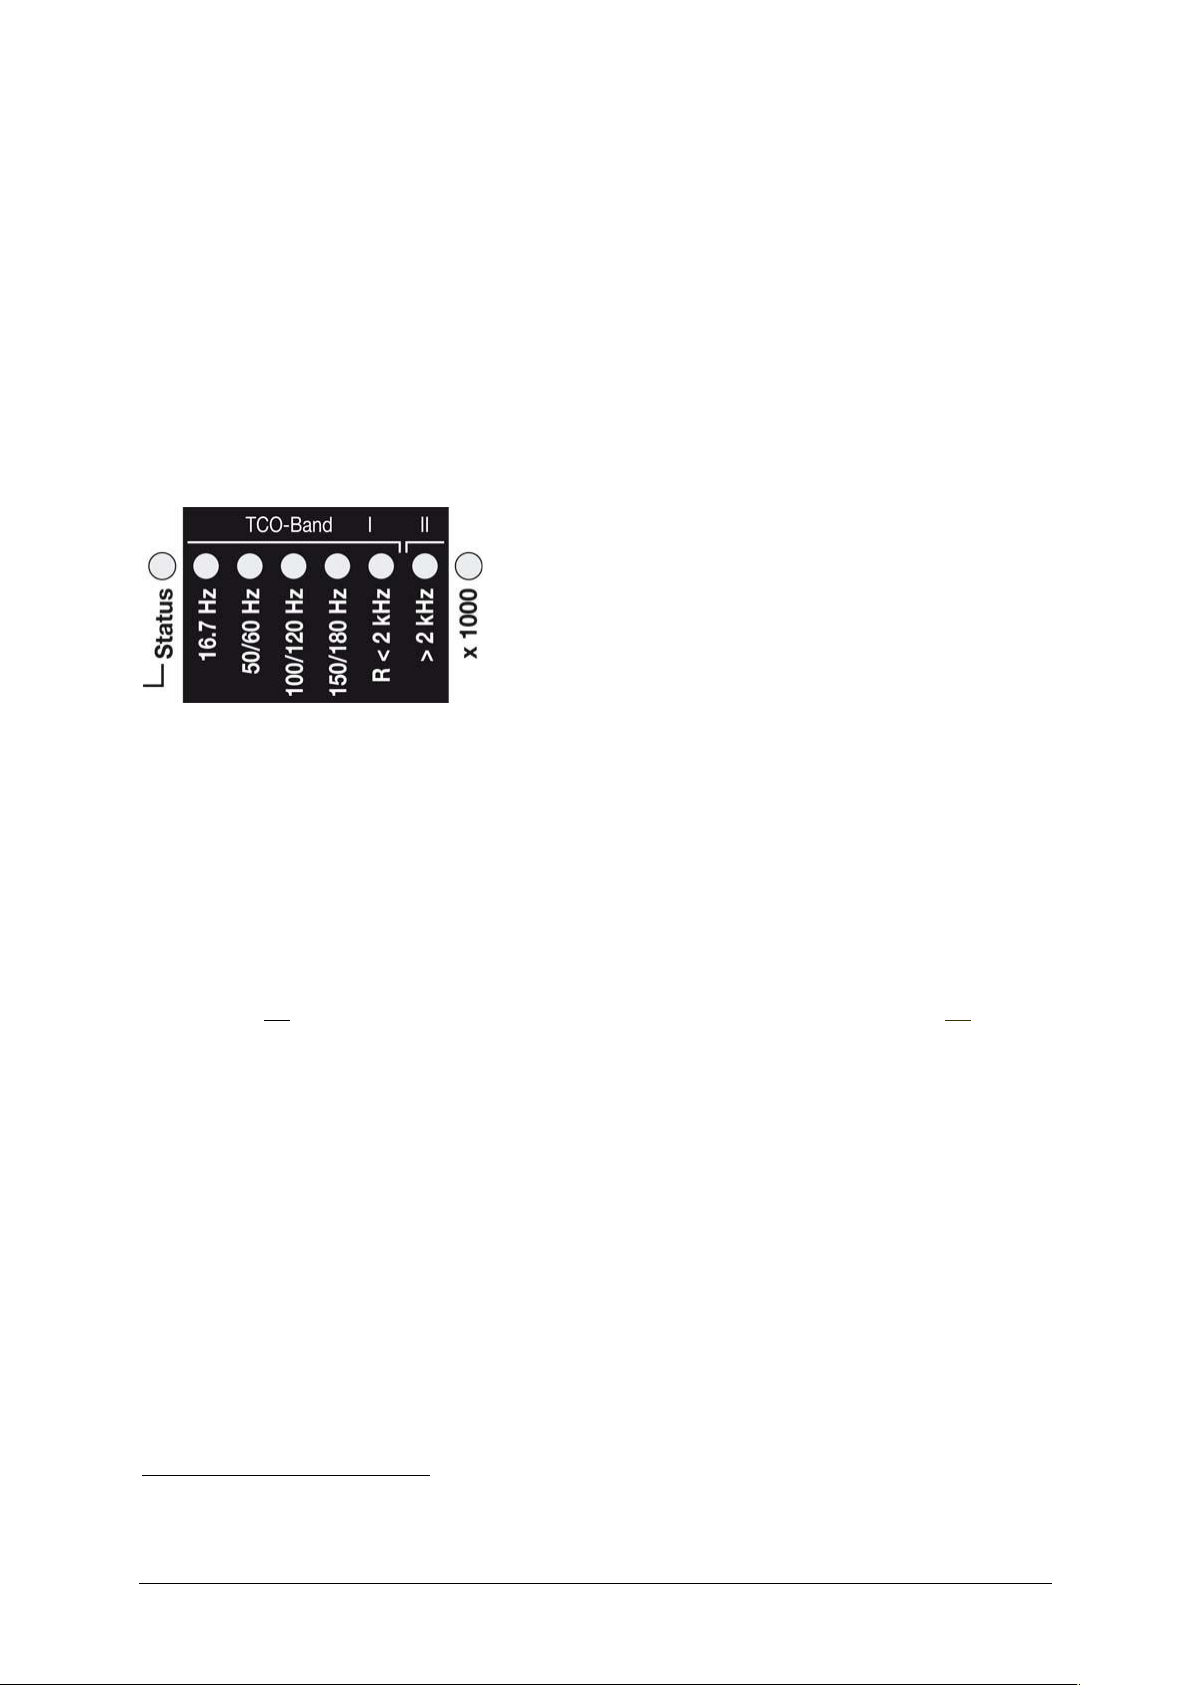
TCO-Band I II
Page 6

350-027_NFA1000400-6-2_EN-von-susanne as of October 2011 - 6 - © Gigahertz Solutions GmbH
3 LEDs / Display / Audio Signals
3.1 LEDs and Display
The measured value shown on the display ...
… is the unit adjacent to the solid green LED (primary measurement).
A flashing LED indicates the unit of the secondary measurement, which
can be selected by depressing the “Mode>” button .
In fields of very high magnetic intensity, the value will be displayed in uT
(microTesla), indicated by the red LED “X 1000”. Also the green LED will
then turn red indicating a change of scale. Both LEDs will start flashing red when the
measured values are higher than the instrument can display. Similarly, when measuring body voltage, a change from mV to V for higher values is indicated.
Special LCD Display Messages
“Low Batt“: The rechargeable battery is low – please charge the battery
“Err.“: Short for ‘Error’. Indicates an erroneous configuration. This can occur when a
grounding cable or mains adapter is connected and potential-free E-field measurement is selected. Select a different setting!
„----“: Instrument is in the process of determining the measurement, or the value is
too small to be measured.
„CHAr“: Instrument is being charged.
(For technical reasons “FULL” will be shown shortly before this, which is to be ignored)
„FULL“: During the charging process, with the mains adaptor connected, this indication means: charging process completed, battery loaded. During normal operation, however, “FULL” means the SD memory card is full.
The time indications are set up as follows:
„XXXd“: XXX days or
„Xd.XX“: X days and XX hours or
„XX.XX“: XX hours and XX minutes.
„XX.XX“: (with blinking dot): XX minutes und XX seconds.
It will be shown upon switching on the NFA and when logging (see chapter 5.4).
Due to the increased power consumption (LEDs, sound signal, etc), the remaining
battery life in the operating mode “ON” is reduced by up to 30%.
Page 7
© Gigahertz Solutions GmbH - 7 - 350-027_NFA1000400-6-2_EN-von-susanne as of October 2011
Status and Frequency LEDs
The “Status” LED indicates the current mode of operation
“Red” means “instrument is being charged”.
“Yellow” means “measurement in progress, NO recording”.
“Green” means “measurement in progress WITH recording”,
however with the switch set to “log.” the “Status”-LED is switched off to extend battery life.
LEDs to indicate the applicable frequency bands:
The frequency-LEDs change their colour in proportion to their contribution to the total field strength.
See below for details on LED display modes.
”16.7 Hz“: In use for railway lines in some European countries. The reading also includes the 2
nd
harmonic.
”50/60 Hz“1: Mains frequency. The bandwidth only
covers individual frequencies of 50 Hz and 60 Hz with their respective lock-in ranges.
”100/120 Hz“1: This LED indicates the contribution of the second through fifth
“even” harmonics. The strongest frequency can be numerically displayed when using “Freq” mode.
”150/180 Hz“1: This LED indicates the contribution of the third through fifth “uneven” harmonics. The third harmonics will presently be found in many homes and most offices as a signifi-
cant portion of the total measurement. The frequency of the strongest source can be numerically displayed when
using “Freq”.
”R < 2kHz“: Means “Remainder of frequencies below 2 kHz”.
This LED does not show the whole band, but only the sum of all frequencies below 2 kHz which are not covered
by the LEDs on the left.
”> 2kHz“: Comprises frequencies within the upper TCO-band of 2 KHz up to 1 MHz.
“x 1000”-LED
Turns red when the measurement scale increases.
The NFA automatically detects the mains frequency and adjusts the indication of its harmonics. With “Freq.”
the actual mains frequency can be determined exactly. The LED’s for 16.7 Hz, mains frequency and its harmonics up to 2 kHz have a suitable lock-in range to cover mains fluctuations.
1
Page 8
350-027_NFA1000400-6-2_EN-von-susanne as of October 2011 - 8 - © Gigahertz Solutions GmbH
There are two display modes for the frequency-LEDs:
“Simple/Steady“: (= preset)
The red LED represents the strongest frequency , and the yellow LED the second
strongest. The green LEDs indicate the total frequency range in the current setting.
“Full Information/Volatile”: This makes the LEDs rather unsteady/volatile. (To be
configured with NFAsoft)
The proportion of the respective frequency band in relation to the total signal is being displayed. These proportions are shown as follows3:
RED = DOMINANT (> 50%)
YELLOW = MEDIUM (< 50%)
GREEN = SMALL (< 10%)
3.2 Audio Signal
The acoustic signal is always linked to the respective measured value and has a
„Geiger Counter” characteristic, i. e. an increasing signal intensity will in turn cause
an accelerated rattling sound.
If the “Mode”-switch is set to „
/
“ , press the ‘Mode >’ button to turn the volume
up and the ‘Rec. >’ button to turn the volume down (and finally: off), as long as no
grounding cable is connected to the instrument.
Please note: For extra-precise measurement requirements turn the acoustic signal
volume down or even switch it off completely.
In order to allow for less fluctuations in this mode an internal high pass filter is switched on. With NFAsoft it can
be configurated to 16.7 and 50 Hz. Experience has shown that the best combination for a freehand measurement is a filter set to 16.7 Hz for magnetic fields and to 50 Hz for electric fields. Electric fields of the 16.7 Hz
railway line power frequency (in some European countries) are quite rare indoors and can still be evaluated in the
“band” mode. They can still be separately evaluated with NFAsoft.
To make it more ergonomic for the user, frequencies below the nominal display resolution (that is < 0.1 V/m or
< 1 nT) are not indicated by an LED-signal but will still be recorded down to the noise level. Hysteresis: 9/12%
resp. 45/50%.
2
2
3
Page 9
© Gigahertz Solutions GmbH - 9 - 350-027_NFA1000400-6-2_EN-von-susanne as of October 2011
4 Switches/Push-Buttons /Connectors
4.1 On / Off switch (“Power“)
“On” = Standard Measurement Setting
LEDs and acoustic signal remain activated for manual measurements
“Log” = Logging / long term recording
All LEDs and the acoustic signal are deactivated to save battery life during data logging. This is the mode in which the instrument is most precise.
“Off” = Device is off
4.2 Field Selection for 3D Measurement
M3D = Magnetic field measurement (3D)
The isotropic point or magnetic field sensors are below the coordinate
system printed on the meter faceplate. The dominating axis is indicated
by a red LED next to the display.
XYZ = Axis indication
Here, the NFA 1000 will show either the magnetic or the electric field in its three individual components depending on the field type from which the switch was set to
“XYZ”, whereas the NFA 400 will only show the individual components of the magnetic field. Press the ‘Mode >’ button to switch from one axis to the other. Please
see chapter 4.9 for details to this or to the automated scrolling.
E3D
(NFA1000)
/ Ey
(NFA400)
= Potential-free E-field measurement
The field sensor pairs for the X-, Y- and Z-axis (directions correspond to the imprint)
are situated within the meter close to the housing. For a proper measurement the
meter has to be set up more than 12 inches away from any metal objects on an insulated “holder” (accessory PM1) or held with an insulated rod (accessory PM4s).
Also cables or probes must not be connected during this measurement setting. In
the case of an erroneous configuration, the display will indicate “Err.” until the configuration is corrected or the setting is changed to magnetic field measurement. The
measuring person should avoid hectic movements and keep a distance of at least
1.5 m to the object of measurement.
Y
X
Z
Page 10
350-027_NFA1000400-6-2_EN-von-susanne as of October 2011 - 10 - © Gigahertz Solutions GmbH
For E-field measurements against earth potential, please plug in the grounding cable
and
- switch to “M3D” (automatic adjustment) on the NFA 1000
- switch to “Ey” on the NFA 400.
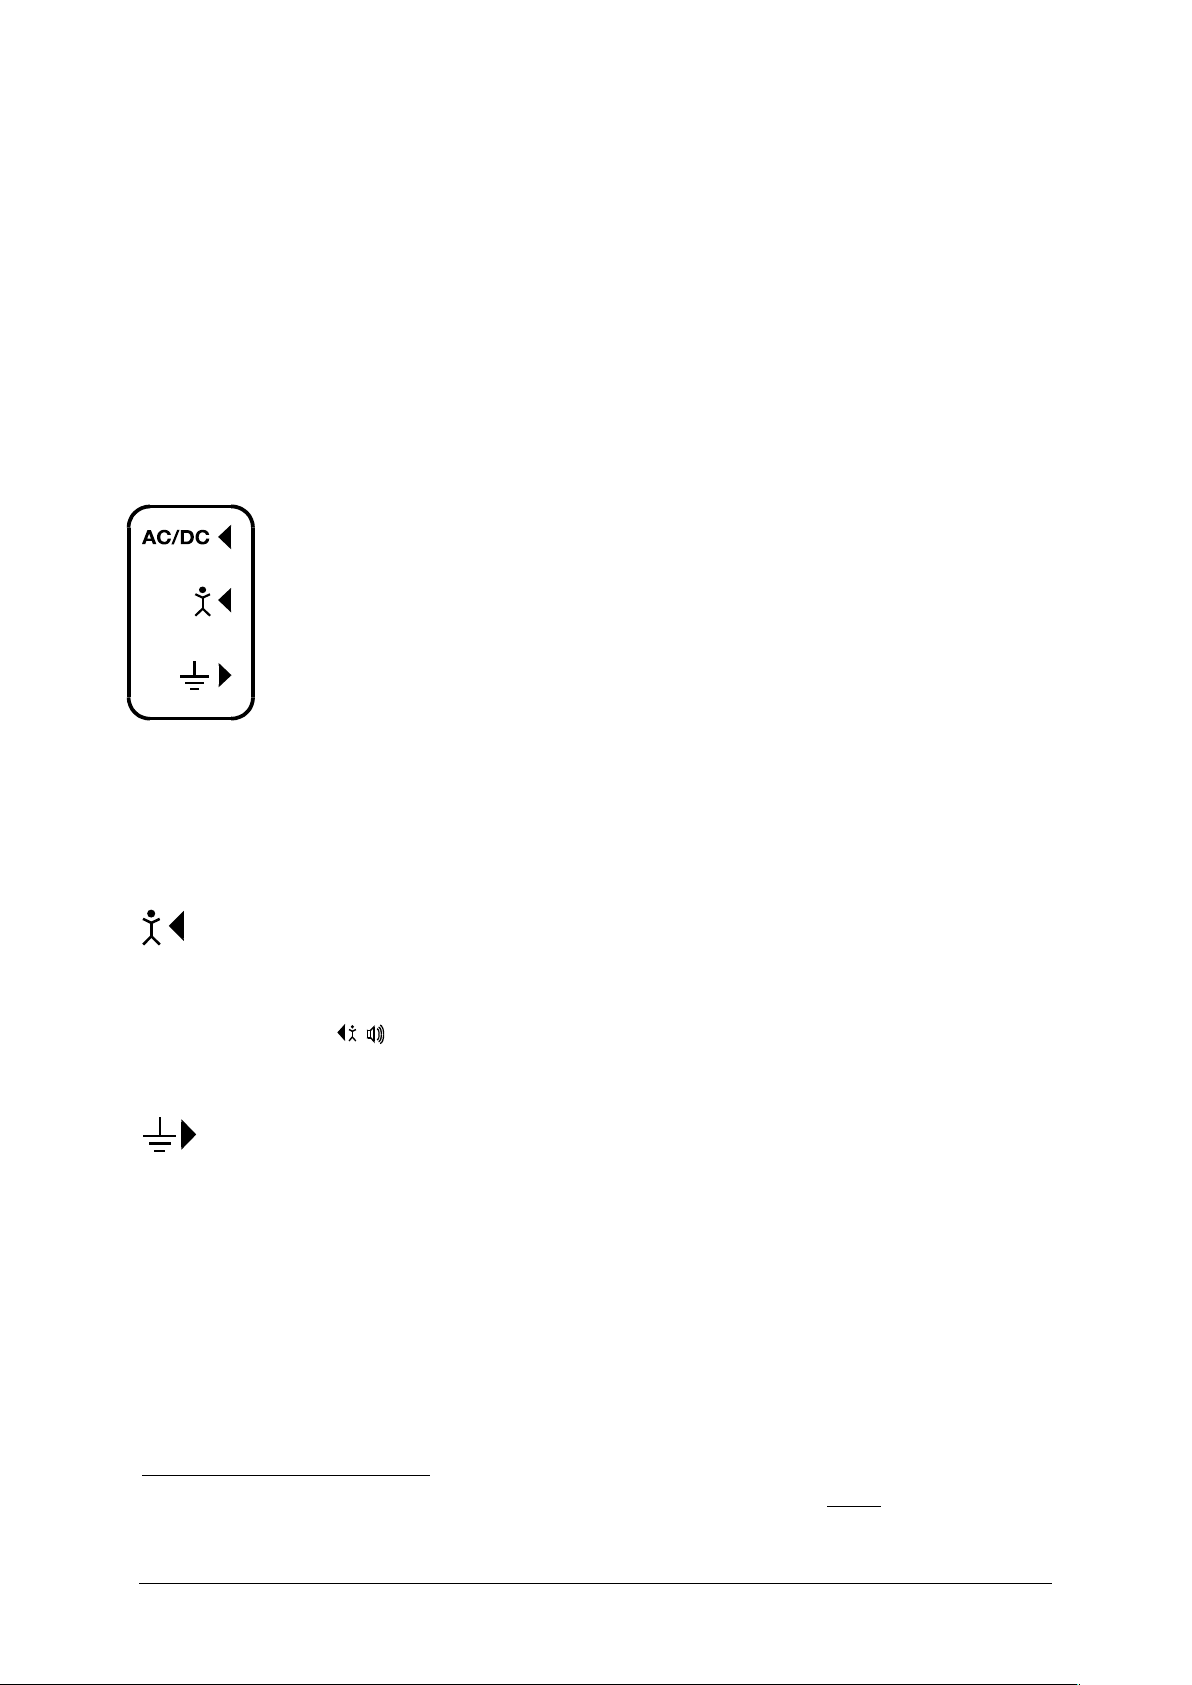
4.3 Sockets for Inputs and Grounding
AC/DC = Combined AC/DC-Input
The moment you connect an external sensor, its signal will automatically
be displayed in mV and recorded, if required. For recording, make sure
the “Mode” switch is set to “Auto”.
AC: A displayed value of 2000 corresponds to “1Vpeak-peak“4.
DC: +/- 0.1 to 1500 mV, i.e. with an HF59B connected in the
coarse measuring range (scaled to 1.5 V DC), the device plots
measurement values from 1 to 15,000 µW/m²; the displayed value in mV is 10 times less than the actual reading in µW/m².
This input can also be used for the connection of an optionally available magnetostatic and electrostatic sensor (in preparation).
= Input socket for body voltage hand probe
Input for the connection of a hand probe for the measurement of body voltage in
mV. The connector is a 4 mm banana jack. For displaying and recording, set the
“Mode”-switch to
/
and plug in the grounding cable.
This is the only input which cannot be recognized automatically (being single-pole).
= Socket for the grounding cable
Allows the connection of a grounding cable for an E-field measurement with reference to ground (in compliance with TCO). This will be detected automatically by the
instrument and the display will change to E-field with reference to ground correspondingly.
Socket for the TCO-conformed probe at the front end of
the meter
This is for the TCO-conformed probe available as an optional accessory from Gigahertz Solutions.
Note: The information produced by the frequency decomposition of a demodulated pulsed HF signal will, of
course, not provide any really useful data.
For other measuring ranges just compare the position of the comma and convert accordingly. Readings below
0.1µW/m² cannot be displayed or recorded because of noise-issues.
5
4
5
Page 11

© Gigahertz Solutions GmbH - 11 - 350-027_NFA1000400-6-2_EN-von-susanne as of October 2011
4.4 Mode = Selection of Measurement Mode
Selects all measurement and display options of the instrument with
the field selector switch and the “Mode >” button. Configuration
errors will be detected and indicated by “Err.” on the display until
resolved.
When set to the NFA recognizes probes connected to it,
and shows the corresponding values. If there is no external probe
connected to the instrument, it will show the selected 3D field type.
By pressing the mode button, you can “toggle” between the primary and secondary display measurements. The secondary measurement field is indicated by a short flashing of the corresponding
unit-LED.
and = Display of the individual frequency
bands resp. the exact frequency of the frequency bands
Selection of the individual frequency bands is possible by clicking the “Mode” button6. Please see chapter 4.9 for more details on this feature or on automated scrolling.
/
= Capacitive body coupling / volume
In this setting, the display will show the signal generated by connecting a hand
probe. The grounding cable needs to be connected in order to assure proper measurements. For volume regulation please see chapter 3.3.
If the 50 Hz high pass filter has been set with the help of the configuration part of the NFAsoft (maybe even as pre-setting), the
16.7 Hz LED will remain unlit. However, the filter only applies to the display in the “Auto”-mode and to loggings in the “All3D”channel. The aim is to tranquilize the display. Nevertheless, possible frequency components up to 16.7 Hz can be displayed by
using “Band” and “Freq.”.
Mode
Freq.
Band
Auto
/
6
Page 12

350-027_NFA1000400-6-2_EN-von-susanne as of October 2011 - 12 - © Gigahertz Solutions GmbH
4.5 Evaluation of Signal
tRMS
= true RMS value
tRMS = “true Root Mean Square”. The values displayed and recorded can be compared directly to classifications recommended
by building biologists.
peak
= Peak value
Real peak value measurement: With this setting the meter
measures the highest culminating point of the wave7. A new measurement feature
for building biologists which allows for a more detailed analysis of the LF world in a
way which has long since been considered essential in the analysis of high frequencies. This option supplies important information for the evaluation of “Dirty Power”
(E-field > 2 kHz).
Hold
= retain maximum value
Retains „tRMS“ or „Peak“ of the signal, depending on the switch position from
which „Hold“ was chosen. When the signal switch is set to „Hold“ only the reading
on the display is held, the real time value will still be recorded onto the SD card, if
recording.
4.6 SD Memory Card
This is the slot for the SD card. To prevent it from being ejected inadvertently slide it in beyond the external surface of the casing until it
snaps (use fingernail or pencil, if necessary). To extract it press again
to undo the snap mechanism.
The high-speed SD memory card (4 GB, SDHC) supplied with the
instrument contains the current version of the NFAsoft software and enough
memory for a continuous long-term recording of more than one week.
Your PC will recognize the SD card as an external device when connected by USB
cable or slid into a card reading device. It can then be processed with the standard
Windows or Linux functionality. By inserting the SD memory card directly into a card
reader of the PC, data transfer will be 40 times faster than by using the USB cable8.
Please note: Do not remove the SD memory card while the NFA is running!
Not to be mixed up with the „Hold“-function, which, in case of fluctuating fields „freezes“ the highest reading.
The resolution of the frequencies during the analysis of the (actually by their nature broadbanded) peak values
does not consider phase information that is being a worst-case consideration. Tolerances are much higher than
using the tRMS analysis. It cannot be used with the floating potential E-field measurement for the time being.
In order to make use of this speed advantage, your SD card reader needs to be specified „SDHC“ which is
standard for units built 2008 or later. For older units inexpensive adaptors are available. The SD-card reader is
included in the scope of supply of the NFA 1000 only.
Signal
Peak
tRMS
Hold
7
8
Page 13

© Gigahertz Solutions GmbH - 13 - 350-027_NFA1000400-6-2_EN-von-susanne as of October 2011
4.7 USB-Socket
USB 1.0 computer interface connection: Used for meter configuration
with NFAsoft. Please take care to have the NFA switched off when
connecting or disconnecting the USB-cable!
4.8 Charging Socket
For the connection of external DC sources:
External supply: 12 V battery or 12 V DC power supply unit is sufficient
to keep the instrument operational for long term data logging, but will
not recharge the battery.
Charging: 15 to 18 V DC battery or AC adaptor is required to charge the instrument.
The instrument comes with an AC adaptor (Euro mains plug!), which can be
switched either to 12 or to 15 V. Measurements or recordings parallel to the charging procedure are technically possible, but not specified, therefore not to be recommended.
4.9 „Mode“ and „Rec.“ - Buttons for
Navigation and Voice Recording
In connection with the “Mode”-switch and the switch for selecting the field type, the
“Mode” and “Rec.” keys form part of the many special functions of this device.
They are not needed for a simple measurement of the 3D magnetic field.
“Mode” = Change of display mode or “Step ahead”
The configuration of the “Mode”-button is context sensitive.
If the “Mode”-button on the left is on “Auto”, the NFA recognizes external probes
connected to it, and displays their corresponding values. If a probe is not connected
to the instrument, it displays the selected (“primary”) field type.
Press and release the “Mode>” button to switch from the primary to secondary
measurement fields. The secondary or background measurement field is indicated by a quick flashing LED corresponding to the unit-LED.
12-15
V
Page 14

350-027_NFA1000400-6-2_EN-von-susanne as of October 2011 - 14 - © Gigahertz Solutions GmbH
If the “Mode”-button on the left is on “Band” or “Freq.”,
Press and release the “Mode>” button to select the next frequency band (indi-
cated by the corresponding LEDs), and also the axis per band in the “XYZ”
mode.
Press and release the “Mode>” and “Rec>” buttons at the same time to display
the individual axis one after the other in an infinite loop until one of the buttons is
pressed again.
“Rec” = Record an audio note
Keep this button pressed and so activate the internal microphone to accept your live
comments. The microphone is positioned above the “Rec.” button (marked by the
hole in the casing lid). It is sufficiently sensitive to pick up audio comments from a
few metres distance.
While the “Rec.” button is pressed for taking your notes, these will be recorded in a
standard WAV file parallelly to logging value recordings. These audio notes will then
be directly allocated by NFAsoft to the corresponding recording times in the graphic.
4.10 I/O - Microphone / Headset
Allows the connection of a mono headset for dictating or listening to the audio analysis.
Page 15

© Gigahertz Solutions GmbH - 15 - 350-027_NFA1000400-6-2_EN-von-susanne as of October 2011
5 How to Measure and Data-Log
5.1 “Live”-Measurement
Of course the meter can be used the “conventional” way: simply switch it on, set the
required measurement parameters, and read the values recorded. When operating
in the conventional mode, the “Status-LED” will be yellow.
In addition, the device is capable of logging all settings as well as the measurement
values of all four channels at once (i.e. the three field axis values plus one additional
channel). This data is stored onto an SD-card for future analysis. This function can
be activated by temporarily switching the “Power” switch to “Log.” until the status
LED turns yellow. Then switch the “Power” switch back to “On”. Please note: When
logging with the power switch set to ”LOG” and changing the field of measurement
and recording (for instance from M3D to E3D), this will cause the recording session
to be closed and a new log file to be created.
These recordings can be annotated by real-time audio recordings which will be assigned automatically to the respective measurement for replay.
The following chapters 5.2 and 5.3 are only relevant for the NFA 1000.
5.2 Guided 9 Point Measurement
of Sleeping Areas
For alternating electric fields, the guidelines issued by the VDB
e.V., Germany, require a detailed analysis of the floating potential
electrical field in sleeping areas, specifying nine points (three
each in the head-, torso- and foot area, with the outer edge of the
instrument located 10 cm off the bed’s edge). The NFA in combination with NFAsoft allows for a “guided measurement” in order
to efficiently accomplish data collection and evaluation.
Preparation and start of the measurement:
Use the potential-free rod PM4s or the holder PM1 (stabilized by, for instance, a
stiff piece of cardboard or a plywood panel).
Switch the “Power”-button to “On” and choose “E3D”, “Auto” and “tRMS”
(choose M3D for magentic fields).
Press the “Mode”-button until 9Pt is indicated on the LCD and then let go. A
beep will indicate the activation of the 9 point measurement.
Page 16

350-027_NFA1000400-6-2_EN-von-susanne as of October 2011 - 16 - © Gigahertz Solutions GmbH
The NFA guides the user through the nine points by means of short audio signals
(“beeps”). These nine points shall always be processed in the same order, head area: left, middle, right, followed by torso area: left, middle, right and finally feet area:
left, middle, right.
The beeps are not time controlled but the NFA will adjust itself to your personal
work rhythm by “sensing” whether it is being moved or it is lying still9. This way
you can finish the nine point measurement within less than a minute or – if you
prefer to take it a bit slower – you need not let yourself “be rushed through the
measurement by the beeps”.
The algorithm is as follows: after the activation (see above) the NFA “waits pa-
tiently” to be moved (… that is being moved to the first measurement position:
top left) and it will not beep to confirm the next measurement before the instrument has been left still in that position for a couple of seconds10(… in order to
pick up a valid measurement). After the beep – and in your speed – you can proceed to the next measurement position11.
PLEASE NOTE: In order to support this algorithm move the NFA more or less
rapidly from one measurement position to the next, and “bump” it onto the bed’s
surface with a little impact in order to give the transition movement a clear end12.
For an analysis of the collected data use NFAsoft.
5.3 Guided 6-Point-Measurement
of Working Places
The NFA and the NFAsoft also support the measurement of
working places. In this case six measuring positions are to be
collected, as shown in the drawing. For a selection of the working place measurement on the NFA keep the “Mode” button
pressed until “6Pt” is displayed on the LCD. For the further procedure follow the instructions of the 9-Point-Measurement in the
order: head, elbow, bottom, hands, knees, feet.
5.4 Long Term Data Logging
The normal approach in building biology is to record only the AC magnetic field, and
this as tRMS. Why only the magnetic field? Only AC Magnetic Fields are subject to
large fluctuations, as they depend on the actual current flow which is variable. The
interval for recording data is set to 10 data sets/sec.
The interval from beep to beep can vary between 3 and up to 20 seconds according to your work rhythm and
movement pattern.
This time delay is user-definable with NFAsoft.
After the beep the NFA will wait up to 20 seconds for a movement
This way the NFA can distinguish more reliably whether it is in motion or kept still. If you use the potential-free
rod PM4s then try not to move the instrument after you have “hit“ the measurement point, if you use a holder
then withdraw quickly to a minimum distance of 1.5 m and keep still there in order to avoid movement-induced
"pseudo-fields”.
9
10
11
12
Page 17

© Gigahertz Solutions GmbH - 17 - 350-027_NFA1000400-6-2_EN-von-susanne as of October 2011
Initiating Long Term Logging of the Meter
For a long term recording of several hours or days, set the “Power” switch to “Log”.
In this mode the LEDs and the sound are turned off to extend the battery life. The
recording will start automatically after some seconds. The display will show the logfile number (“L999”), the elapsed time of recording as well as the remaining time of
use in an infinite loop until the battery is empty or the SD-card full. For information
on the display format please see chapter 3.2.
The instrument records all data corresponding to its field selection switch. The
fourth channel will automatically record the E-field if the field selection switch is set
to M3D and the AC/DC socket is not connected. However, if an HF analyzer is connected to the AC/DC socket, it will automatically record the output of this external
device.
“Locking” of the Instrument
“Locking” ensures that the instrument exclusively executes the predefined tasks
when left at the customer's place for long-term recordings. To lock, remove the SD
memory card from the instrument after predefining the measurement settings, set
the micro switch on the top left of the SD-card to “lock” or “write protect” and reinsert it. Note: The data will still be recorded!
IMPORTANT: Don't forget to unlock the SD memory card finishing the longterm
recording!
Page 18

350-027_NFA1000400-6-2_EN-von-susanne as of October 2011 - 18 - © Gigahertz Solutions GmbH
6 Power Supply
6.1 Internal Rechargeable Battery
The instrument features high performance Lithium Ion rechargeable batteries
(2 x 3.7 V). When fully charged, they will last for up to 36 hours of continuous data
logging13.
6.2 Charging
To charge the battery set the AC adapter switch to 15 Volts. If the device is
switched off while charging, the display will show “CHAr” and the potential runtime
of the instrument with the current capacity status in an infinite loop. Measurements
or recordings during the charging process are technically possible, but not specified, and therefore not recommendable.
With a completely discharged battery only about one hour of charging time is sufficient to operate the instrument for a couple of hours. To achieve the maximum operation time, charging will take 12 to 15 hours. Once the full capacity is reached, the
instrument will stop charging automatically and will show "FULL" on the LCD.
6.3 External Power Supply
Switch the AC adaptor to 12 Volts. With a 32 GB SD card and an external power
supply (AC adaptor) you can continuously log at full speed for over two months.
Longterm recordings of the 3D magnetic field and the AC entry can also be done
using external power from an AC adapter. In this case, the adapter should be placed
as far as possible from the instrument and turned in such a way that the resulting
magnetic field is as low as possible, as it can influence the readings.
Please note that Li-Ion batteries, even when treated with care, will lose some of their original capacity within
one or two years and their typical life expectancy is 250-500 complete charge cycles. In this case please always
replace both batteries. For initialisation of the indication of the remaining battery life of the instrument please fully
unload and recharge the instrument once. If possible store in a cool place..
To determine the emission created by the AC adapter at the location of the NFA, proceed as follows:
- Place the instrument and adaptor into their measurement location
- Plug the AC adapter into the wall and to the NFA. Wait until the readings on the display stabilize.
- Disconnect the adapter from the NFA without changing its position and orientation; wait for the display to
stabilize.
This procedure will also be logged, and should be marked with an audio note. This will be accessible when
evaluating the logged data on the PC. Now potential disturbances can be noted on each axis and corrections
be made, if necessary.
13
14
14
Page 19

© Gigahertz Solutions GmbH - 19 - 350-027_NFA1000400-6-2_EN-von-susanne as of October 2011
6.4 Operation from a Standard 9 V
Alkaline Battery
If you run out of battery power while measuring, one can temporarily operate the
NFA from a standard 9 V alkaline battery. To change the battery, remove the NFA
from its protective holster, and open the battery compartment. Carefully pull off the
cables of the integrated lithium ion batteries from the PCB-connector and remove
the batteries. Make sure to remember their exact position, as they fit tightly! The
plugs are keyed so they cannot be connected incorrectly. Connect the 9 V alkaline
battery to the battery clip, insert it into the meter, and close the lid.
DO NOT TRY TO CHARGE A 9 VOLT BATTERY, whether rechargeable or alkaline,
INSIDE THE METER!
Page 20

350-027_NFA1000400-6-2_EN-von-susanne as of October 2011 - 20 - © Gigahertz Solutions GmbH
7 „NFAsoft“
The provided software allows ...
for the analysis of the data logged by the NFA
for the configuration of the NFA according to your preferences and habits.
A double-click on the program-icon opens the window
shown on the left. Here you can chose between the tool for
the analysis of the data and the tool for the user-specific
configuration of your NFA .
The software is subject to continuous upgrade. The most
current revision can always be found for download on our
homepage.
System requirements
NFAsoft is compatible with Windows XP and above, or LINUX. NFAsoft requires no
installation – just double-click and start!
In some cases, it might be necessary to temporarily disable your anti-virus
software. Anti-virus software may interpret NFAsoft as a threat and hence might
disable or even erase it. It may be necessary to repeat this upon loading an upgraded version of NFAsoft. NFAsoft can be loaded and executed directly form the SD
memory card through a card reader or through the USB interface cable. The NFA is
supplied with a “Class 6 SDHC”-SD memory card (appropriate readers have been
available since 2008, adapters are available for older computers).
7.1 Data Analysis: File Types
A click on the button opens the program and a Windows-box for file selection.
The following file types are available (the consecutive numbering is independent
from the file type)
LOG00001.TXT log file (long time recording)
LOG00002.9PM 9-Point-Measurement (sleeping area)
LOG00003.6PM 6-Point-Measurement (workplace)
REC00004.WAV audio file (recorded note).
Page 21

© Gigahertz Solutions GmbH - 21 - 350-027_NFA1000400-6-2_EN-von-susanne as of October 2011
7.2 Data Analysis: Longterm Recordings
Double-click the appropriate log file for analysis. For longterm recordings the following window will open (check capter 7.2 for 9 point measurements) :
The far left column labelled “Channels“
displays statistic evaluations of the plot on
the right (in real-time)
The large area on the right shows the plot
of the collected data over time.
The “x” (horizontal) axis of the plotted da-
ta is the time scale and the “y” (vertical)
axis shows the units of measurement corresponding to the field of measurement.
Plotted Data Window
Units of measurement appear on the corresponding channel window on the left and
are not indicated on the y-axis. The different plots are colour coded. This allows for
different channels to be shown simultaneously.
The x-axis indicates the time span. The figures at the left and the
right end of the grey status line show the times of start and end of
the logging period.
If the status line is mouse clicked, the window on the right will appear. Here one can enter a preferred time span to view. The time
span can also be selected in the “View” menu.
The colouring scheme of the plot corresponds to the standards for building biology
measurements (SBM2008): Green for “no concern”. Yellow for “slight concern”. Red
for “severe concern”. Purple for “extreme concern”.
If one selects two channels with different units, the SBM colour scheme of the plot’s
background will be the one corresponding to the unit of the selected (= bold) channel. It will be bold for the one and regular for the other, equalling the markings in the
“Statistics/Channels” window.
Navigation within the Plotted Data
Within the plotted data you can easily navigate using a mouse and its scroll wheel.
Move the mouse pointer into the data plot. The scale of the x-axis will be
zoomed in when scrolling up or by using the “Up Arrow”, zoomed out when
scrolling down or by using the “Down Arrow”
centered around the clock time indicated by the position of the mouse
The data area can be repositioned on the x-axis by a left mouse click hold and drag
left or right. You may just as well use the “right” and “left” arrows of the keyboard.
Zooming of the time on the x-axis is also possible via the “View” menu.
Page 22

350-027_NFA1000400-6-2_EN-von-susanne as of October 2011 - 22 - © Gigahertz Solutions GmbH
Scaling of the y-axis is done automatically by default but can be adjusted manually if
desired through the “View” menu under “Y-Scale”. You can also adapt the scaling of
the y-axis manually via the menu (under “View / Scale”).
Listening to the Audio Notes
Audio notes dictated during measurement
or longterm recordings are shown in the
diagram directly at the corresponding
point of dictation. Simply click on them in
order to listen to the information recorded. The audio notes will be played back
by the audio player of your computer. The
grey bar on the top will show the file
name and a level preview.
A display of the audio files (.wav) within the diagram is only possible if they are
stored in the same folder as the LOG-file and if they are not renamed.
Insert Comments directly into the Diagram
Areas of special interest can be commented directly in the plotted data. Simply position your mouse where you need it, right click and enter your comments in the
comment window. When you click Ok, the comment will be embedded into the data,
marking an event or section of interest. .
Program Window “Statistics Channels”
To display the data of a particular channel, click the triangle to the left of the channel.
If multiple channels are open, an additional click on the channel information will bold
the channel’s plotted data and its statistical data.
The top five values are standard statistical values15. The numerical value “Edges
per hour” is used to analyse the number of steeply rising edges, spikes, peaks,
pulses, sharp bursts or high frequency transients of the field. The edge thresholds
can be defined in the “Channel” menu under “Set edge criteria”. This is an experimental function. PLEASE NOTE: If the 50 Hz high pass filter has been set with the
help of the configuration part of NFAsoft (maybe even as pre-setting), this only applies to the channels “All3D”, “AllX”, “AllY”, and “AllZ”. Nevertheless, possible frequency components at 16.7 Hz will also be recorded in the correspondent channel.
In this case the sum of the frequency specific channels may well be higher than that
of “All3D”.
The 95th percentile is calculated heuristically. If the possible deviation exceeds 10%, it will be not-
ed in parenthesis after the figure in absolute terms.
15
Page 23

© Gigahertz Solutions GmbH - 23 - 350-027_NFA1000400-6-2_EN-von-susanne as of October 2011
The light-blue field underneath the statistical channel data represents the frequency
distribution of the measured intensities of the specific channel („Histogram“). It is
self-scaling and can be interpreted as follows:
On the left side of the x-axis a formula calculates and plots how often the mini-
mum value has occurred in a given time interval, and similarly on the right side
for the maximum value.
The higher point marks the measured intensity - found most often. The lower
points indicate a specific value very seldomly measured.
Menu
Edit
“Copy all“: Copies the plotted data area as well as the drop-down of the “Statistics/Channels“ section into the buffer – from here it can be inserted directly into your
measurement protocol at any point of your choice. This is similar to a screen shot.
All other edit options are self explanatory.
View
“Edge Display”
Choose the menu option “View/Edge Display” to activate the edge display. The
edge display option will help find important field strength fluctuations. Steep edges
are marked in the diagram in the colour corresponding to each channel – the
marked channel will be bolded, the others won’t. This way you will always have an
overview of what’s going on in the other channels, even if your focal point is, for instance, the 3D-value. The threshold value for an edge display can be defined in the
menu opiton “Channel/Set edge crieteria”.
“Set Times”
Choose the “Set Times“ option to scale the graphic to a defined time segment.
“Y-Scale“
Automatic – The y-axis will be scaled automatically to give the best display of the
area selected for analysis.
Manual – The y-axis scaling can be manually controlled in this mode. Allows for
and will assist in analyzing small values (e.g. those over 2 kHz) overshadowed by
other very strong field intensities.
“All” – zooms out the x-axis and displays the complete data set on the data plot.
The keyboard “A” keys can alternatively be used.
Use the arrow keys to take over the functions of the mouse.
Page 24

350-027_NFA1000400-6-2_EN-von-susanne as of October 2011 - 24 - © Gigahertz Solutions GmbH
Channel
Set Edge Criteria (experimental!)
This feature is new and its intention is to facilitate professionals the dicussion and
analysis of “dirty electricity” beyond today’s definition. Activate “Edge Dispay” in the
menu option “View” to use this function.
This function allows you to define a threshold value with which a spike can be
marked directly in the “Edge Display” of the plot. This threshold can be selected individually for every channel. Standard values have been pre-selected as defaults.
When clicking “Set edge criteria”, the following window will open. Description:
Absolute increment = Marks a rise of the measured
field intensity between adjacent points of time by a
user defined absolute increment level in V/m, mG or
nT
Relative steepness = Marks a rise of the measured
field intensity between adjacent points in time by a
user defined factor or multiple.
Slope = Marks a rise of the measured field intensity
between adjacent points in time by a user defined slope rate in V/m, mG or nT per
second. This is independent of the measuring intervals. A hypothetical interval of 1
second would give that increment. This permits to compare results recorded with
different recording intervals.
Absolute threshold = Marks a rise of the measured field intensity between adjacent
points in time by a user defined threshold level in V/m, mG or nT. Any rise beyond
this absolute threshold value will be marked.
The selected edge criteria will be graphically displayed on the top of the plotted data
section and will appear numerically in the field channel statistical data section under
edges per hour for that particular time span. All edge markings displayed appear in
real time and allow for a quick visual analysis.
When clicking the „ok“ button, the selected criteria and the set value will be transferred into the statistical values of the channel. When re-accessing the menu option
“Set edge criteria”, the pre-set values will again be displayed (under construction).
Select HF-Unit
This function will only be displayed when selecting „CH 4“in the „Channels“ window
and the data recorded in this channel are those of
an external input device such as an HF-Analyser
(and are therefore recorded in mV). Upon selection
of this point of the menu the following window will
open up for a selection of the HF-Analyser settings
during the recording period.
nT <> mG
This function allows to subsequently convert a chosen channel’s data from milliGauss to nanoTesla and vice versa.
Page 25

© Gigahertz Solutions GmbH - 25 - 350-027_NFA1000400-6-2_EN-von-susanne as of October 2011
Convert Units
This function can be used to display whichever values recorded via the AC/DC input
port directly in its original unit. This way, an HF-recording can be shown either in
µW/m² or V/m. A new channel will autmatically be generated, thus avoiding any potential loss of data.
More help to be provided in future revisions.
Rename or Delete Channel
Allows for a renaming or deleting of the marked channel.
Summarise Channels
The plotted channels (selected on the left) will be added up (“square sum“) and added as a new channel. The sum of 100/120 Hz, 150/180 Hz, R<2kHz and >2kHz are
considered to be the relevant paramters for the evaluation of “dirty electricity”.
Extras
The first two items in the dropdown menu have been explained already.
Create KML-File
Required as a plugin for the connection of GPS-data, NFA logs and Google Earth
(currently in its beta phase). Please ask for the current manual by e-mail.
7.3 Data-Analysis:
9-Point-Measurement / 6-Point Measurement
For a graphical illustration of recorded 9-Point-Measurement please double-click the
respective file with the extension “.9PM”. The illustration is frequency specific.
Please note that the readings of the channels X, Y and Z as well as “All CH4” are
dependent on the position of the instrument and that the graphical illustration is for
orientation purposes only. “Edit” in the menu offers you the possibility to copy the
illustrations into your report, also individually. The evaluation of the 6-PointMeasurement is done analogous to the 9-Point-Measurement.
Page 26

350-027_NFA1000400-6-2_EN-von-susanne as of October 2011 - 26 - © Gigahertz Solutions GmbH
7.4 User-specific Configuration
of the NFA
This part of NFAsoft allows for a customized user definable configuration of the
NFA. The configurations will be made available in the “CONFIG.NFA” file of your
NFA. The new settings are automatically loaded by the NFA upon its next start when
saved on the SD memory card.
Several customized pre-settings for NFAsoft can be defined allowing a quick access. Simply select the settings as required and activate the button “save as presetting for NFAsoft”. All pre-settings are stored in the file “NFAsoft.ini” and are available for NFAsoft provided that this file is in the same folder.
For a synchronization of
the time, the SD-card in
the meter should be connected to your computer
via USB-cable. The synchronization will either
take place automatically
once “CONFIG.NFA” is
recorded onto the SDcard, or else the manually
entered time is applied at
that very moment.
If the high pass is set at
50 Hz, this only refers to
the broad band reading or
recording as it reduces
the influence of movement induced field components. For full information, the frequency
components of sinusoidal
waves at exactly 16.7 Hz
are still recorded separately and can be shown
with the help of the NFAsoft.
If the filter is set, it is
therefore not unusual for
the summary indication
“All3D” to be smaller than the indication for 16.7 Hz, as the signal components at
16.7 Hz are not integrated in the total sum of “All3D”. Furthermore, the signals of the
different frequencies are added up quadratically, which in turn means that the result
of simply adding the individual signals will also differ from the sum of “All3D”. (For
more information on this matter see chapter 9).
Page 27

© Gigahertz Solutions GmbH - 27 - 350-027_NFA1000400-6-2_EN-von-susanne as of October 2011
8 Firmware Update
The file: “firmware.nfa“ is the meter’s operating system stored in its internal
memory16. As known from computer programmes, this software is subject to continuous improvements and upgrade, and can be updated as follows:
Procedure for the Update:
Copy the new “firmware.nfa“ file onto your SD memory card. If need be, overwrite any old
versions as only one “firmware.nfa“ file should be on the card. It should not be renamed.
Lock your SD memory card by switching the small switch on left side of the card to “lock”.
Insert SD card into your powered-off NFA.
Turn on your NFA. The display will show “CodE”, the frequency LEDs will gradually
change from green to red during the update process. Then all LEDs will turn off except for the status LED. As soon as the status LED is green, the update process is
completed.
Do not switch the meter off during the update process!
Please remember to unlock the SD-card before applying the new firmware!
Which is the active firmware on your NFA?
Press the “Mode”-button while switching on the meter, and you will be shown the
currently active firmware version for a short period of time.
The NFA always has two firmware versions in its memory. In order to switch from
one version to the other, press the “Mode” and the “Rec.”-button simultaneously.
Please differentiate: With „NFAsoft“ one can configure the firmware, with these user settings being stored in the
file „CONFIG.NFA“. This has nothing to do with the firmware update described above.
16
Page 28

350-027_NFA1000400-6-2_EN-von-susanne as of October 2011 - 28 - © Gigahertz Solutions GmbH
9 What if… (FAQ)
Answers to frequently asked questions regarding the NFA1000
Make sure you’re always using the most current firmware version!
The device does not react when trying to switch or press a key
Unlock SD-card! (Push micro switch on the left
of the card upwards)
Restart: All switches up – switch off – switch on.
There is no recording (status LED does not turn green)
Insert or unlock SD-card!
(Push micro switch on the left of the card upwards)
No longterm recording over several hours or days possible
Solution 1: Update your firmware.
Solution 2: There is a file system error on your SD-card. In this
case, save the “good” files and re-format your SD-card (“quick
format” or simple deletion is not enough).
Note: Windows XP does NOT format the SD memory cards according to the stan-
dard (Vista or Windows 7 are ok). XP-users may use the following link to download a
standard-conformed formatter:
http://www.sdcard.org/consumers/formatter_3/SDFormatterEN2905.zip
E-field measurement against ground potential is not possible
The field type switch must be switched to “M3D”. Now you will
automatically be shown the E-field vs. ground potential once
you insert the grounding cable. Please see the “quick start
guide” at the beginning of this manual for further information.
The meter has four measurement channels which always work simultaneously. Three
of them are needed for the 3D measurement, the fourth channel can be used for any
other required measurement task
The meter turns off after quarter of an hour
NFAsoft allows you to change the interval for the auto-power-
off feature. (Auto-power-off is deactivated while recording!)
Page 29

© Gigahertz Solutions GmbH - 29 - 350-027_NFA1000400-6-2_EN-von-susanne as of October 2011
The sum of the frequency specific channels is higher than the
value of “All3D”
The signals of the different frequencies are added up quadrati-
cally (square root out of the sum of squares), which means that
a simple addition of the individual signals will result in a higher
value than the sum of “All3D”.
For example, if you take 500 nT at 16.7 Hz plus 1000 nT at
50 Hz, a simple addition will amount to 1500 nT, whereas the
quadratical addition (= “All3D”) will amount to only 1118 nT.
The 16.7 Hz LED is off although measurements with “Band”
or “Freq.” show values in this frequency
If the 50 Hz high pass filter has been set with the help of the
configuration part of NFAsoft (maybe even as pre-setting), the
16.7 Hz LED will remain unlit. However, the filter only applies to
the DISPLAY in the “Auto” mode and to recordings made in the
“All3D” channel. The aim is to tranquilize the display. Neverthe-
less, the device may well identify possible frequency compo-
nents at 16.7 Hz when using “Band” and “Freq.”.
NFAsoft is showing measurement values at 16.7 Hz inspite of
the 50 Hz high pass filter being set
and
The sum of the 16.7 Hz channel and the other channels is
higher than the value of “All3D”
If the 50 Hz high pass filter has been set with the help of the
configuration part of NFAsoft (maybe even as pre-setting), this
only applies to the channels “All3D”, “AllX”, “AllY”, and “AllZ”.
Nevertheless, possible frequency components at 16.7 Hz will
also be recorded in the correspondent channel. In this case the
sum of the frequency specific channels may well be higher than
that of “All3D”.
The NFA was configurated according to customer requirements with NFAsoft, but when restarting, NFAsoft shows the
original settings
The “CONFIG.NFA” file on the SD-card transfers user-specific
configurations to the NFA. NFAsoft can write this file, but not
read it. Therefore you cannot use NFAsoft to check the con-
figuration of the NFA, but only to instal new configurations.
You can save frequently used configurations as presets to a
dropdown menu in NFAsoft.
Page 30

350-027_NFA1000400-6-2_EN-von-susanne as of October 2011 - 30 - © Gigahertz Solutions GmbH
What is the purpose of the individual files and where are they
saved?
“CONFIG.NFA” -> user configurations of the NFA-> SD-card
“NFAsoft.ini” -> Presettings for NFAsoft -> same folder as
NFAsoft
“FIRMWARE.NFA” -> operating system of the NFA -> SD-card
9-Point-Measurement of the electric field (“E3D”)…
… in an (almost) field-free area: the indication of the dominant
frequency is unpredictable.
In fields of minimal values the indication of the dominant fre-
quency is a matter of pure stochastic
… in an (almost) field-free area we still have a reading
on the display
The function “Peak” does not work in combination with “E3D”
and a recording (the recording process onto the SD-card
causes periodic peaks of 10-20 V/m).
When using a telescopic rod, a reading may well be caused by
either movement-induced fields or alternating electrostatic
fields from your contact with the rod.
Solution: The configuration part of NFAsoft allows to set the
high pass filter at 16 Hz or 50 Hz. This will suppress most of
these “pseudo fields”, the 50 Hz filter of course more so than
the 16 Hz filter. In areas where the 16.7 Hz frequency is not
used for traction power you should choose the 50 Hz filter.
… in an (almost) field-free area and using the equipment holder
PM1 the evaluation with NFAsoft still shows high values at usually
only one point, especially in the “R<2k” channel which does not
usually show up during a “normal” measurement
This is nearly always a matter of “pseudo fields” caused by
movements or electrostatics in the area of the meter (for in-
stance by the person moving away from the measurement
device). Please check chapter 5.2 for more details on the con-
duction of a proper measurement avoiding this effect.
These pseudo-readings can, if need be, be deleted from the graph by opening the
9PM-file with a text editor and replacing the odd value by “0.0”.
Page 31

© Gigahertz Solutions GmbH - 31 - 350-027_NFA1000400-6-2_EN-von-susanne as of October 2011
The grounding cable plug slips out of the jack, or there is a loose connection
The plug is inserted too far
into the isolating material, so
there is no connection
Solution: Hold on to the middle
part of the contact on the plug
with a tong, and screw back the
isolation material
WRONG
Correct
Streaks and “scratches” on the display foil?
In order to assure a high resolution potential free measurement
of the E-field, a highly sensitive foil of a vapour deposited metal
layer has had to be mounted onto the display. Unfortunately,
scratches and streaks cannot be completely avoided.
There are very many small TXT-files on the SD-card?
Solution 1: You have activated the function “permanent log-
ging”, which causes the meter to log not only when switched to
“Log”. This option will cause a new file to be started each time
the meter is switched on, and each time you switch from one
mode to the other.
Solution 2: There is a file system error on your SD-card. In this
case, save the “good” files and re-format your SD-card (“quick
format” or simple deletion is not enough).
Note: Windows XP does NOT format the SD memory cards according to the
standard (Vista or Windows 7 are ok). XP-users may use the following link to down-
load a standard-conformed formatter:
http://www.sdcard.org/consumers/formatter_3/SDFormatterEN2905.zip
An existing audio note it is not shown in the diagram
window of NFAsoft.
The audio files (.wav) will only be displayed in the diagram if
they are stored in the same folder as the LOG-file and if they
are not renamed.
Page 32

350-027_NFA1000400-6-2_EN-von-susanne as of October 2011 - 32 - © Gigahertz Solutions GmbH
Hersteller / Manufacturer / Fabricant / Fabricante:
Gigahertz Solutions GmbH
Am Galgenberg 12
90579 Langenzenn
Germany
Tel : +49 (9101) 9093-0
Fax : +49 (9101) 9093-23
www.gigahertz-solutions.de
… .com / ... .fr / … .es / ... .it
Ihr Partner vor Ort / Your local partner
Votre partennaire local / Su socio local:
 Loading...