

Page 1
Contents
Functions & Controls 2
sets new standards in HF testing.
©
Professional Technology
Professional measurement engineering is
With the HF analyzers, GIGAHERTZ SOLU-
TIONS
Getting Started 3
Introduction to Properties and
Measurement of HF Radiation 4
Step-by-Step-Instruction
to HF-Measurement 5
Limiting values, recommendations
offered with a unique price/performance ratio
- the only one of its kind worldwide. This was
made possible through the consistent use of
innovative integrated components, as well as
highly sophisticated production engineering.
Some features have patents pending.
The HF analyzer you purchased allows a
and precautions 11
Audio Frequency Analysis 12
Analysis of the modulated / pulsed signal 13
Use of Signal Outputs 13
Battery management 14
Remediation and Shielding 15
Warranty 15
Conversion tables 16
Safety Instructions:
It is imperative to carefully study the instruction manual prior
to using the HF analyzer. Important information regarding
safety, use and maintenance is provided herein.
competent assessment of HF exposures be-
tween 800 MHz and 2.5 (3.3) GHz. From a
building biology perspective, this particular
frequency range is particularly relevant be-
cause cellular phones, cordless phones, mi-
crowave ovens as well as next-generation
technologies such as UMTS/3G or Bluetooth
and WLAN all make extensive use of it.
We appreciate the confidence you have
shown in purchasing this HF Analyzer. With
the confidence that your expectations will be
met, we wish you great success in collecting
valuable information with this HF analyzer.
If you should encounter any problems,
please contact us immediately. We are here
The HF analyzer should never come into contact with water or
be used outdoors during rain. Clean the case only from the
outside, using a slightly moist cloth. Do not use cleaners or
to help.
sprays.
Prior to cleaning the HF analyzer or opening the case, shut it
off and unplug all extension cords. There are no user-
serviceable parts inside the instrument.
Due to the high sensitivity level, the electronics of the HF
Canada and U.S.:
Enviratest Inc.
8 Settlers Court, Morriston, On, N0B 2C0
analyzer are very sensitive to heat, impact as well as touch.
Therefore do not leave the instrument in the hot sun, on a
heating element or in other damaging environments. Do not let
it drop or try to manipulate its electronics inside when the
case is open.
This HF analyzer should only be used for the purposes de-
scribed in this manual and only in combination with supplied
or recommended accessories.
www.enviratest.com
Other:
GIGAHERTZ SOLUTIONS GmbH, Germany
90579 Langenzenn
www.gigahertz-solutions.de
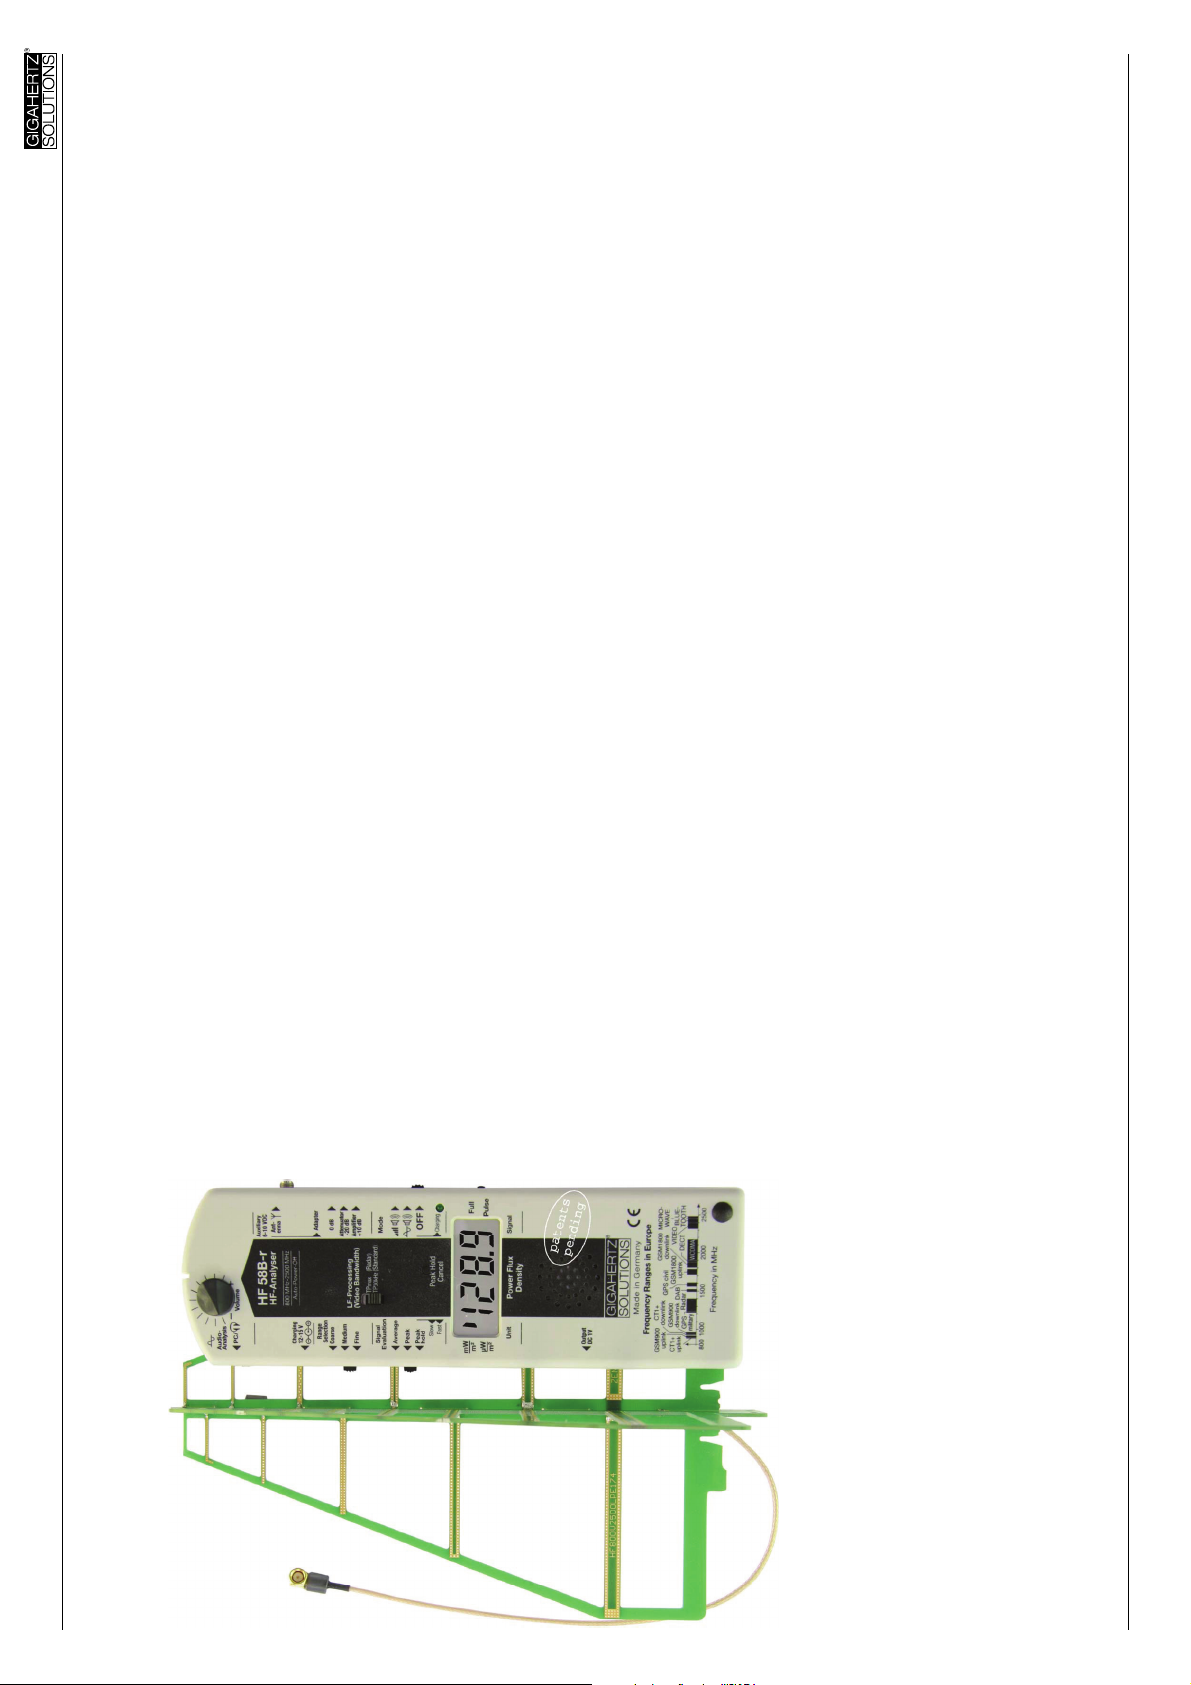
(to 3.3 GHz with additional tolerance)
HF-Analyser for Frequencies from 800 MHz
HF58B-r
to 2.5 GHz
Instruction Manual
Revision 4.5
This manual will be continuously updated, improved and
expanded. You will find the current version at your local
distributors homepage or at www.gigahertz-solutions.de
Please carefully review the manual before using the device. It
contains important advice for use, safety and maintenance of
the device. In addition it provides the background information
necessary to make reliable measurements.
© by GIGAHERTZ SOLUTIONS GmbH, 90579 Langenzenn,
Germany. All rights reserved. No reproduction or distribution
© Gigahertz Solutions GmbH, 90579 Langenzenn, Germany Revision 4.5 (Febuary 2006) Page 1
in part or total without editor’s written permission.
Digital High Frequency Analyser HF58B-r
Page 2
. set-
(Push and
.
1
.
2
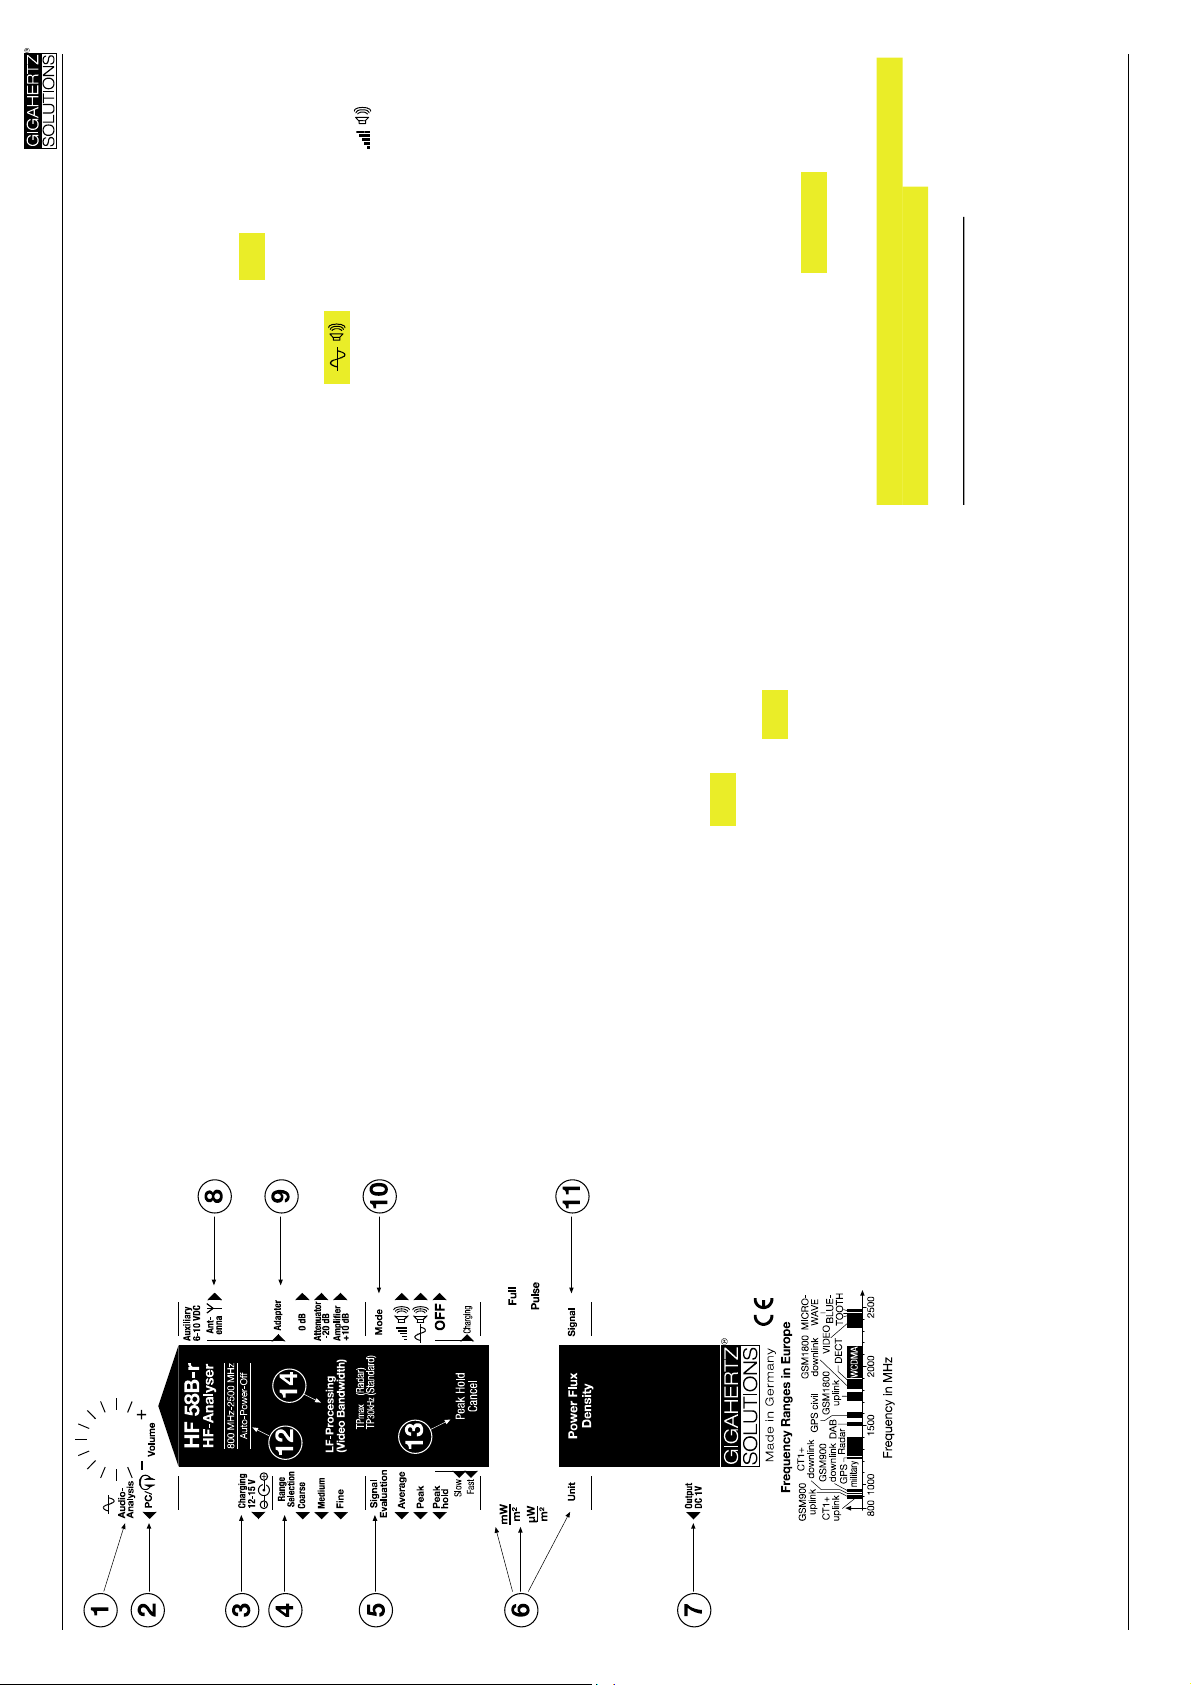
antenna is inserted into the “cross like”
opening at the front tip of the instrument.
8) Connecting socket for antenna cable. The
optional amplifier or attenuator only. For
9) Power Level Adapter Switch for external
lated part of the signal, for Audio analysis
will shift the decimal point to an incorrect position.)
regular use of the instrument the switch
should be in pos. “0 dB“. (Any other position
via PC or headset.
battery. AC adapter for 230 Volt/50 Hz
is activated. In upper position
position . . .., the audio analysis mode
ting, you can additionally hear a signal
similar to a “Geiger counter”, propor-
10) ON/OFF switch. In middle switch-
and 60 Hz is included. For other Volt-
ages/Frequencies please get an equiva-
lent local AC adaptor with the output pa-
rameters 12 – 15 Volt DC / >100mA.
Caution: If an alkaline battery is used,
hold for 2 seconds or until the readings do not fur-
tional to the field strength
signal strength is displayed. In “Pulse”
mode, only the pulsed / amplitude modu-
lated part of the signal is displayed.
11) Signal fraction: In mode “Full“, the total
under no circumstances should the
power adapter be connected at the same
time, otherwise the battery may explode.
function“ to avoid unintentional discharge
of the battery
12) This instrument has an “Auto-Power-Off
(=19 990µW/m²)
coarse = 19.99 mW/m²
Scaling with external amplifier or damper is differ-
medium = 199.9 µW/m²
ent!
fine = 19.99 µW/m²
ther decrease )
13) Push button to reset peak hold.
Standard setting: “Peak”. In peak hold
width for the LF-Signal processing.
Standard setting: “TP30MHz”
14) Switch for choosing the Video Band-
mode you can choose a time setting for
the droop rate (Standard = Slow) With
the push button (pos. 13 ) you can manu-
ally reset the peak hold value.
Typical default settings of major functions are
marked yellow in the text above.
dicates the unit of the numerical reading:
bar on top = mW/m² (Milliwatts/m²)
For this feature the volume control should be turned
1
down completely because otherwise the sound mixes
bar on bottom = uW/m² (Microwatts/m²)
tional instruments, e.g. data logging de-
The instrument switches off after about 30 Minutes at
with the “audio analysis”. Similar to Geiger counter.
2
regular charging level of the battery and after about 3
Minutes when “Low Batt.” is displayed on the LCD.
vices(1 VDC full scale).
Functions and Controls
1) Volume control for the audio analysis.
2) Jack, 3.5 mm : AC output for the modu-
3) Jack, 12 – 15 Volt DC for charging the
Digital High Frequency Analyser HF58B-r
4) Measurement ranges
5) Selector switch for signal evaluation.
6) A little bar on the very left of the LCD in-
7) DC output, allows you to connect addi-
English printwork to follow!
The HF component of the testing instru-
ment is shielded against interference by
an internal metal box at the antenna input
(shielding factor ca. 35 – 40 dB)
© Gigahertz Solutions GmbH, 90579 Langenzenn, Germany Revision 4.5 (Febuary 2006) Page 2
Page 3
Checking Battery Status
When the “Low Batt“ indicator appears in the
center of the display, measurement values
are not reliable anymore. In this case the bat-
tery needs to be charged.
If there is nothing displayed at all upon
switching the analyzer on, check the connec-
tions of the rechargeable battery. If that does
not help try to insert a regular 9 Volt alkaline,
(non-rechargeable) battery. If a non-
rechargeable battery is used, do not con-
nect the Analyser to a charger / AC-
adaptor !
Insert fully charged batteries only.
Note
Each time you make a new selection (e.g.
switch to another measurement range) the
display will systematically overreact for a
moment and show higher values that droop
down within a couple of seconds.
the antenna cable!
The instrument is now ready for use.
for true, accurate HF-measurement.
In the next chapter you will find the basics
. Do not remove
3
This SMA connector has gold-plated con-
tacts is the highest quality commercial HF
connector in that size.
Carefully check the tight fit of the connection
at the antenna tip. This connection, at the tip
of the antenna, must not be opened.
At the tip of the antenna, there are two LED’s
for monitoring the proper function of all con-
nections of the antenna and the cable during
operation. The red one checks the cable, the
green one the antenna itself.
Slide the antenna into the vertical / cross
Do not bend, break or stretch
shaped slot at the rounded top end of the HF
analyzer. Make sure the antenna cable has
no tension and lies below the instrument. It
may help to loosen the SMA-connector tem-
porarily to let the cable fall into a “relaxed”
position.
The antenna can be used by attaching it to
the top end of the HF analyzer or holding it in
your hand. When holding the antenna in your
hand, please ensure that your fingers do not
touch the first resonator or antenna conduc-
tors. Therefore it is recommended to hold it
at the opposite end. For a precision meas-
urement, the antenna should not be held with
your fingers, but be attached to the desig-
nated slot at the top end of the HF analyzer.
There are small ferrite-rolls fitted on the con-
them!
nectors of the antenna cable. They serve the
purpose of fine-tuning
Should they loosen they can be glued again with any
3
household glue
Digital High Frequency Analyser HF58B-r
Long and short switches
Some of the switches are recessed in the
casing of the instrument to avoid uninten-
tional switching for rarely used functions
Contents of the package
Instrument
Attachable antenna
NiMH rechargeable Batteries
(inside the meter )
AC-Adaptor
Several Adaptor-connectors
Comprehensive instruction manual
Check the HF analyzer and its antenna by
following the instructions under “Getting
Started.“
Getting Started
Connecting the Antenna
Screw the angle connector of the antenna
connection into the uppermost right socket
of the HF analyzer. It is sufficient to tighten
the connection with your fingers. (Do not use
a wrench or other tools because over tight-
ening may damage the threads.)
© Gigahertz Solutions GmbH, 90579 Langenzenn, Germany Revision 4.5 (Febuary 2006) Page 3
Page 4
Measuring HF Radiation
When testing for HF exposure levels in an
apartment, home or property, it is always
recommended to record individual measure-
ments on a data sheet. Later this will allow
you to get a better idea of the complete
situation.
It is important to repeat measurements sev-
eral times: First, choose different daytimes
and weekdays in order not to miss any of the
fluctuations, which sometimes can be quite
substantial. Second, once in a while, meas-
urements should also be repeated over
longer periods of time, since a situation can
Polarization
When HF radiation is emitted, it is sent off
with a “polarization“. In short, the electro-
magnetic waves propagate either vertically or
horizontally. Cellular phone technology,
which is of greatest interest to us, is usually
vertically polarized. In urban areas, however,
it sometimes is already so highly deflected
that it runs almost horizontally or at a 45-
degree angle. Due to reflection effects and
the many ways in which a cellular handset
can be held, we also observe other polariza-
tion patterns. Therefore it is always strongly
recommended to measure both polarization
planes, which is defined by the orientation of
the antenna.
literally change “overnight.“ A transponder
only needs to be tilted down by a few de-
grees in order to cause major changes in
exposure levels (e.g. during installation or
repair of cellular phone transmitters). Most of
all it is the enormous speed with which the
cellular phone network expands every day
that causes changes in exposure levels. In
the future we will also have to deal with third
generation networks (e.g. UMTS/3G), which
are expected to increase exposure levels
considerably since their system design re-
quires much more tightly woven “cells“ of
base stations compared to current GSM net-
works.
Even if you only intend to test indoors, it is
Please note that the LogPer-antenna sup-
plied with this instrument is optimized for one
polarization only (vertical if mounted to the
instrument - even if the horizontal “wing”
suggests the opposite.)
Fluctuations with Regards to Space and
Time
Amplification or cancellation effects can oc-
cur in certain spots, especially within houses.
This is due to reflection and is dependent on
the frequencies involved. Most transmitters
or cellular handsets emit different amounts of
energy during a given day or over longer pe-
recommended first to take measurements in
each direction outside of the building. This
will give you an initial awareness of the “HF
tightness“ of the building and also potential
HF sources inside the building (e.g. 2.4 GHz
telephones, also from neighbours).
riods of time, because reception conditions
and network usage change constantly.
All the above-mentioned factors affect the
measurement technology and especially the
procedure for testing. This is why in most
cases several testing sessions are necessary.
Furthermore you should be aware that taking
measurements indoors adds another dimen-
Digital High Frequency Analyser HF58B-r
Introduction to Properties and
Measurement of HF Radiation
This instruction manual focuses on those
properties that are particularly relevant for
measurements in residential settings.
Across the specified frequency range (and
beyond), HF radiation causes the following
effects in materials exposed to it:
1. Partial Permeation
2. Partial Reflection
3. Partial Absorption.
The proportions of the various effects de-
pend, in particular, on the exposed material,
its thickness and the frequency of the HF
radiation. Wood, drywall, roofs and windows,
for example, are usually rather transparent
spots in a house.
Minimum Distance
In order to measure the quantity of HF radia-
tion in the common unit “power density“
(W/m²), a certain distance has to be kept
from the HF source. The distance depends
on the frequency – the higher the Frequency
At 27 MHz from ca. 27 meters
At 270 MHz from ca. 2.7 meters
At 2700 MHz from ca. 0.27 meters
the lower the distance. The transition fre-
quency between so called far field and near
field conditions is not determined exactly, but
here are some typical distances:
That means the distances are inversely pro-
portional.
© Gigahertz Solutions GmbH, 90579 Langenzenn, Germany Revision 4.5 (Febuary 2006) Page 4
Page 5
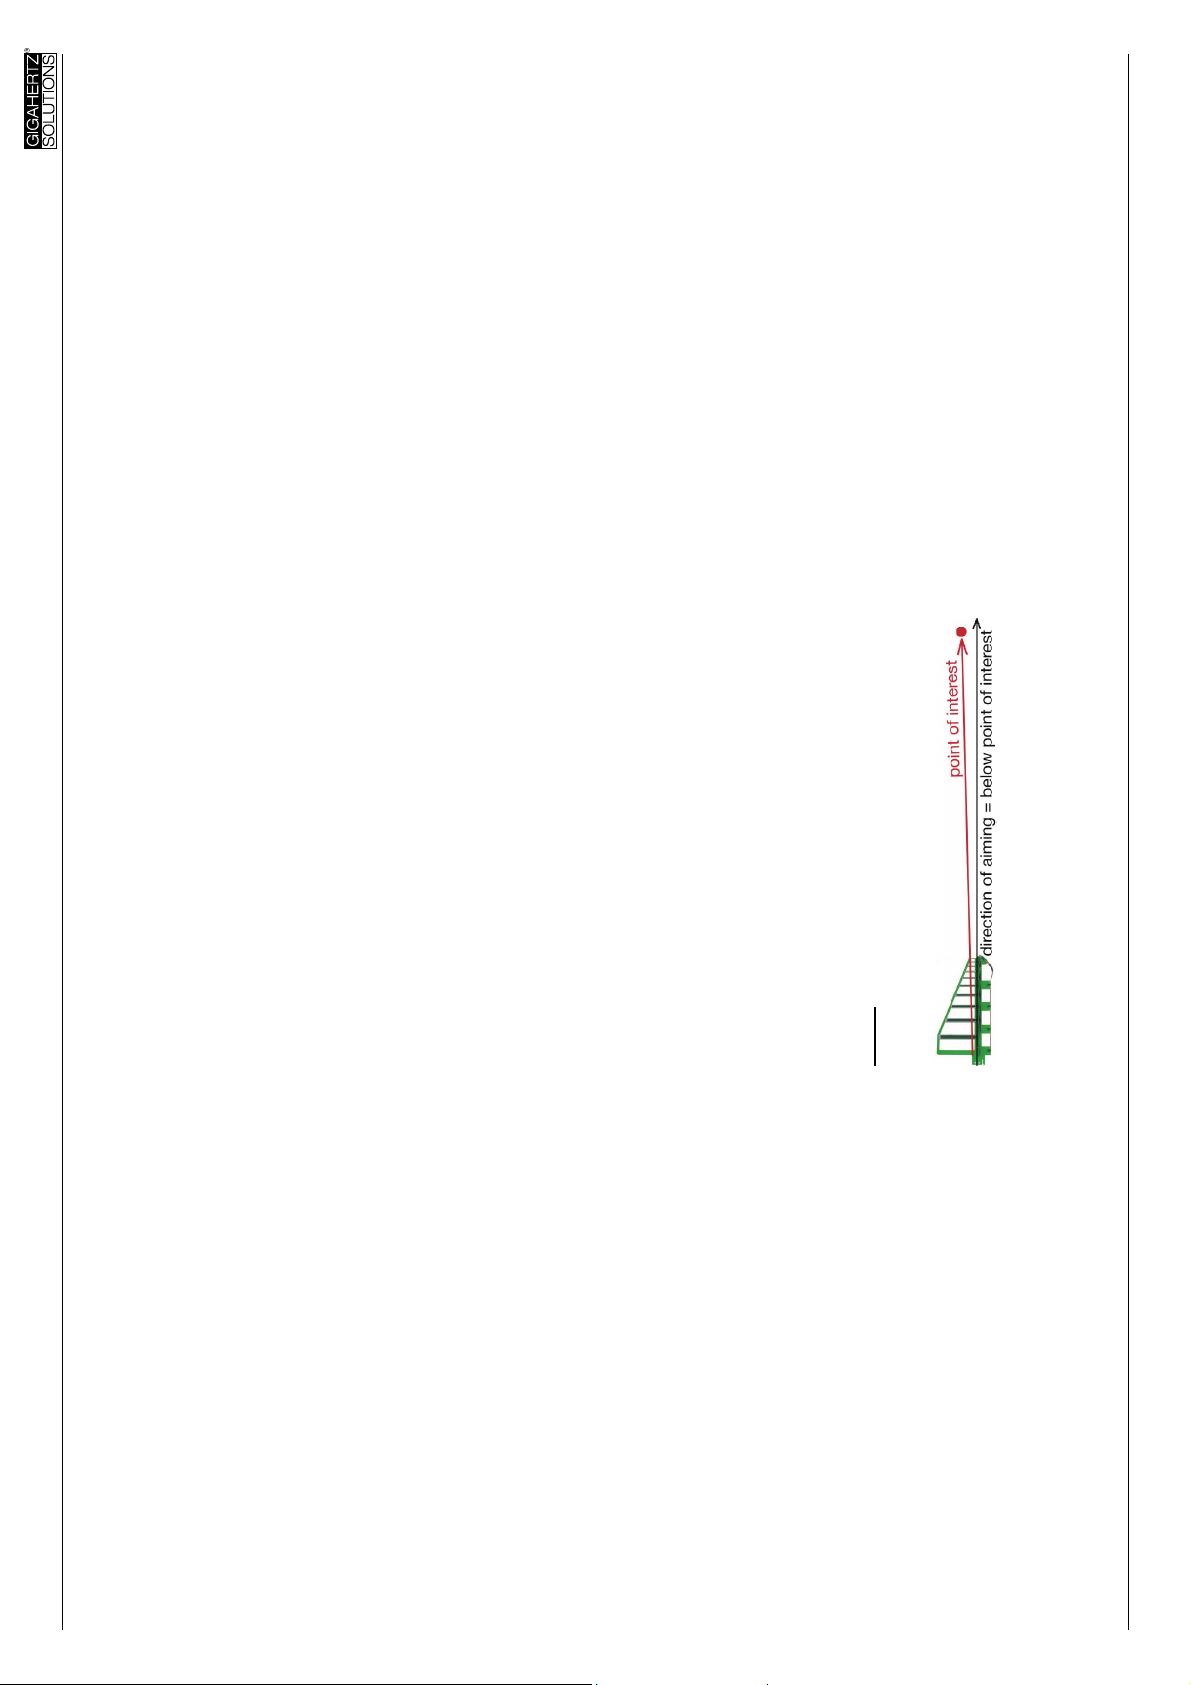
does not matter if the angle gets a little too
wide.
The readings from the instrument’s display
reflect the integral power density in the “an-
tenna lobe”. (ie., the antenna is most sensi-
tive, with a rounded peak, to radiation from a
direction parallel to its axis with the sensitiv-
ity tapering off rapidly with increasing angle
Step-by-Step-Instruction to
HF-Measurement
Preliminary Notes Concerning the An-
tenna
The supplied logarithmic-periodic antenna (or
of incidence.)
The frequency range of the LogPer aerial
supplied covers cellular phone frequencies
(e.g. GSM800, GSM1900, TDMA, CDMA,
AMPS, iDEN), 2.4-GHz (DECT) cordless
phones, frequencies of third generation tech-
nologies, such as UMTS, WLAN and Blue-
tooth, as well as other commercial frequency
bands and microwave ovens. All the fre-
quencies in between are also included. This
is the frequency range which you would find
most pulse-modulated signals, concerned
scientists are worried about.
For monitoring of these critical sources of
radiation as conveniently as possible the fre-
aerial), has exceptional directionality. Thus
it becomes possible to reliably locate or “tar-
get“ specific emission sources in order to
determine their contribution to the total HF
radiation level. To know exactly the direction
from where a given HF radiation source origi-
nates is a fundamental prerequisite for effec-
tive shielding. Our logarithmic periodic an-
tenna, the “LogPer antenna”, provides a dis-
tinct division of the horizontal and vertical
polarization plane. Also the frequency re-
sponse is exceptional. There is a patent
pending for its design.
The missing directionality of standard tele-
scope antennae is one of the reasons why
they are not suited for reliable HF measure-
quency band of the LogPer aerial supplied
ments in building biology EMR.
together with the instrument has been limited
intentionally by its design to frequencies
above 800 MHz, i.e. frequencies below 800
MHz are suppressed. The suppression is
additionally enforced by an internal highpass
filter at 800 MHz. This reduces the disturbing
impact of most sources like radio broadcast-
ing, television stations or amateur radio on
the measurements to a minimum.
the emitting source one wants to
measure. This is to avoid distortions of the
Important:
As the LogPer Antenna provided with this
instrument is shielded against ground influ-
ences one should “aim” about 10 degrees
below
reading.
In order to measure frequencies below 800
MHz down to 27 MHz the instruments
HFE35C and HFE59B are available from Gi-
gahertz Solutions. They come with an active
The upper edge of the foremost resonator is
a good “aiming aid” for the required angle. It
Digital High Frequency Analyser HF58B-r
sion of testing uncertainties to the specified
accuracy of the used HF analyzer due to the
narrowness of indoor spaces. According to
the “theory“ quantitatively accurate HF
measurements are basically only reproduci-
ble under so-called “free field conditions”,
yet we have to measure HF inside buildings
because this is the place where we wish to
know exposure levels. In order to keep sys-
tem-immanent measurement uncertainties as
low as possible, it is imperative to carefully
follow the measurement instructions.
As mentioned earlier in the introduction, only
slight changes in the positioning of the HF
analyzer can lead to rather substantial fluc-
tuations in measurement values. (This effect
is even more prevalent in the ELF range.) It is
suggested that exposure assessments are
based on the maximum value within a lo-
cally defined area even though this particu-
lar value might not exactly coincide with a
particular point of interest in, for example, the
head area of the bed.
The above suggestion is based on the fact
that slightest changes within the environment
can cause rather major changes in the power
density of a locally defined area. The person
who performs the HF testing, for example,
affects the exact point of the maximum
value. It is quite possible to have two differ-
ent readings within 24 hours at exactly the
same spot. The maximum value across a
locally defined area, usually changes only if
the HF sources change, which is why the
latter value is much more representative of
the assessment of HF exposure.
© Gigahertz Solutions GmbH, 90579 Langenzenn, Germany Revision 4.5 (Febuary 2006) Page 5
Page 6
.
4
Quantitative Measurement:
Settings
After having identified the relevant measure-
ment points following the instructions in the
previous section. The actual testing can be-
gin. Setting:
Set the “Signal Evaluation” switch to “Peak”
HF radiation exposure can differ at each
point and from all directions. Even though the
HF field strength of a given space changes
far more rapidly than at lower frequencies, it
is neither feasible nor necessary to measure
all directions at any given point.
Measurement Range Selection
Select the appropriate switch settings as
Since this is not an accurate quantitative
measurement, but a quick overview assess-
ment, the antenna can be removed from the
top end of the HF analyzer, for convenience.
described under “Quick Overview Measure-
ments“. Basic rule for measurement range
selection:
- As coarse as necessary, as fine as possible.
Holding the antenna at its very end as de-
scribed in “Getting Started”, the polarization
plane (vertical or horizontal) can easily be
changed with a turn of your wrist. However,
you can just as well use the HF analyzer with
Note:
the antenna attached to it.
Since there is no need to look at the display
To allow for as wide a range of power densi-
ties to be read out without using an external
attenuator, a factor of 100 lies between adja-
cent ranges. That means for example an ac-
tual value of 150 µW/m² will be displayed as
150.0 µW/m² in the range “Medium” and as
0.15 mW/m² in the range “Coarse”. Due to
technical reasons the tolerances of the in-
strument are relatively high in this overlap-
ping 1% of the next higher range
easy to walk slowly through in-door or out-
door spaces in question. In doing so con-
stantly moving the antenna or the HF ana-
lyzer with attached antenna, in each direc-
tion. This will provide you with a quick over-
view of the situation. In in-door spaces, an-
tenna movements towards the ceiling or the
during an overview measurement, you only
need to listen to the audio signal. It is very
floor will reveal astonishing results.
As already mentioned above, overview
Power densities of a few hundred µW/m², displayed
4
as 0.01 up to about 0.30 mW/m² in the setting
measurements are not meant to provide
accurate results, but to identify those
"Coarse", are those with the highest measurement
uncertainties as % of the actual values. On the other
zones within which local peak values are
found.
hand setting the switch to "Medium" activates an inter-
nal amplifier, which brings with it an additional wavi-
ness of up to +/- 1 dB, depending on the actual fre-
quency analysed. Worst case combined to worst case
could absorb almost +/- 3 dB, the maximum tolerance
of the instrument. For very small readings in "Coarse"
that could result in a factor of 4 difference of the corre-
Digital High Frequency Analyser HF58B-r
horizontally isotropic ultra broad band aerial
down to 27 MHz, the UBB27
In order to measure frequencies below 800
MHz down to 27 MHz the instruments
HFE35C and HFE59B are available from Gi-
gahertz Solutions. They come with an active
horizontally isotropic ultra broad band aerial
down to 27 MHz, the UBB27
Measurements for a Quick Overview
, and
This is helpful to gain insight into the overall
situation. Since the actual number values are
of secondary interest in this phase, it is usu-
ally best to simply follow the audio signals
which are proportional to the field strength.
(Set“ On/Off“ switch (“Mode” to:
turn down the audio analysis knob to low).
Procedure for the
Quick Overview Measurement:
The HF analyzer and antenna are to be
checked following the instructions under
“Getting Started.“
First set the measurement range (“Range
Selection”) switch to “Coarse”. Only if the
displayed measurement values are persis-
tently below ca. 0.10 mW/m², change to the
W/m²).
Note: When switching from the range
19.99mW/m² to 199.9µW/m², the volume of
the audio signal increases sharply. When
switching from the range 199.9µW/m² to
19.99µW/m² there is no difference in volume.
measurement range “Medium” (199.9µW/m²)
or to “Fine” (19.99 μ
© Gigahertz Solutions GmbH, 90579 Langenzenn, Germany Revision 4.5 (Febuary 2006) Page 6
Page 7
An experienced measuring technician will be
able to obtain additional information from the
comparison of average and peak values. Ba-
sic Rule: The more the two measurement
values differ from one another (in 2.4-GHz
cordless phones the ratio can be as high as
1:100.), the higher is the potential of a contri-
bution from e.g. a 2.4-GHz cordless phone or
other pulsed signal source to the total maxi-
mum value.
Still today, some field meters only display
average values. They are of little help when
considering the potential health risks associ-
ated with pulse-modulated HF radiation since
through the “averaging“ of steep HF pulses,
HF radiation exposure can be underrated up
to a factor of 100, such as in 2.4-GHz cord-
less phones.
Signal Evaluation – Peak Hold
Many measuring technicians work with the
function “Signal Evaluation” “Peak Hold“. In
“peak hold” mode the highest value of the
signal within a defined time span can be ob-
tained /“collected”.
In order to obtain accurate readings you
must use the small black button on the meter
face labeled "Peak Hold Cancel. Failure to
clear the LCD display screen by pressing this
button, for two seconds, will result in inaccu-
rate readings. While this button is pushed
and held, the readings are regular "Peak"
readings. If any switch settings are changed
while measuring, and also in order to
start any new "Peak Hold" measurement, you
must always first hold this "Peak Hold Can-
cel" button for 2 seconds, then release it.
This will ensure accurate readings.
nW/m².
• TPmax (Radar) : Approx. 1 nW/m²
• TP 30kHz (Standard) : Approx. 0.1
resolution of 0.0001 µW/m², displayed as
0.01 Nanowatt/m². The actual minimum reso-
lution depends on the video bandwidth se-
lected. When the video Bandwidth Switch is
set to:
A list of all ranges, which can be measured
and displayed, is at the end of this brochure.
Setting:
Signal Evaluation
Signal Evaluation – Average / Peak
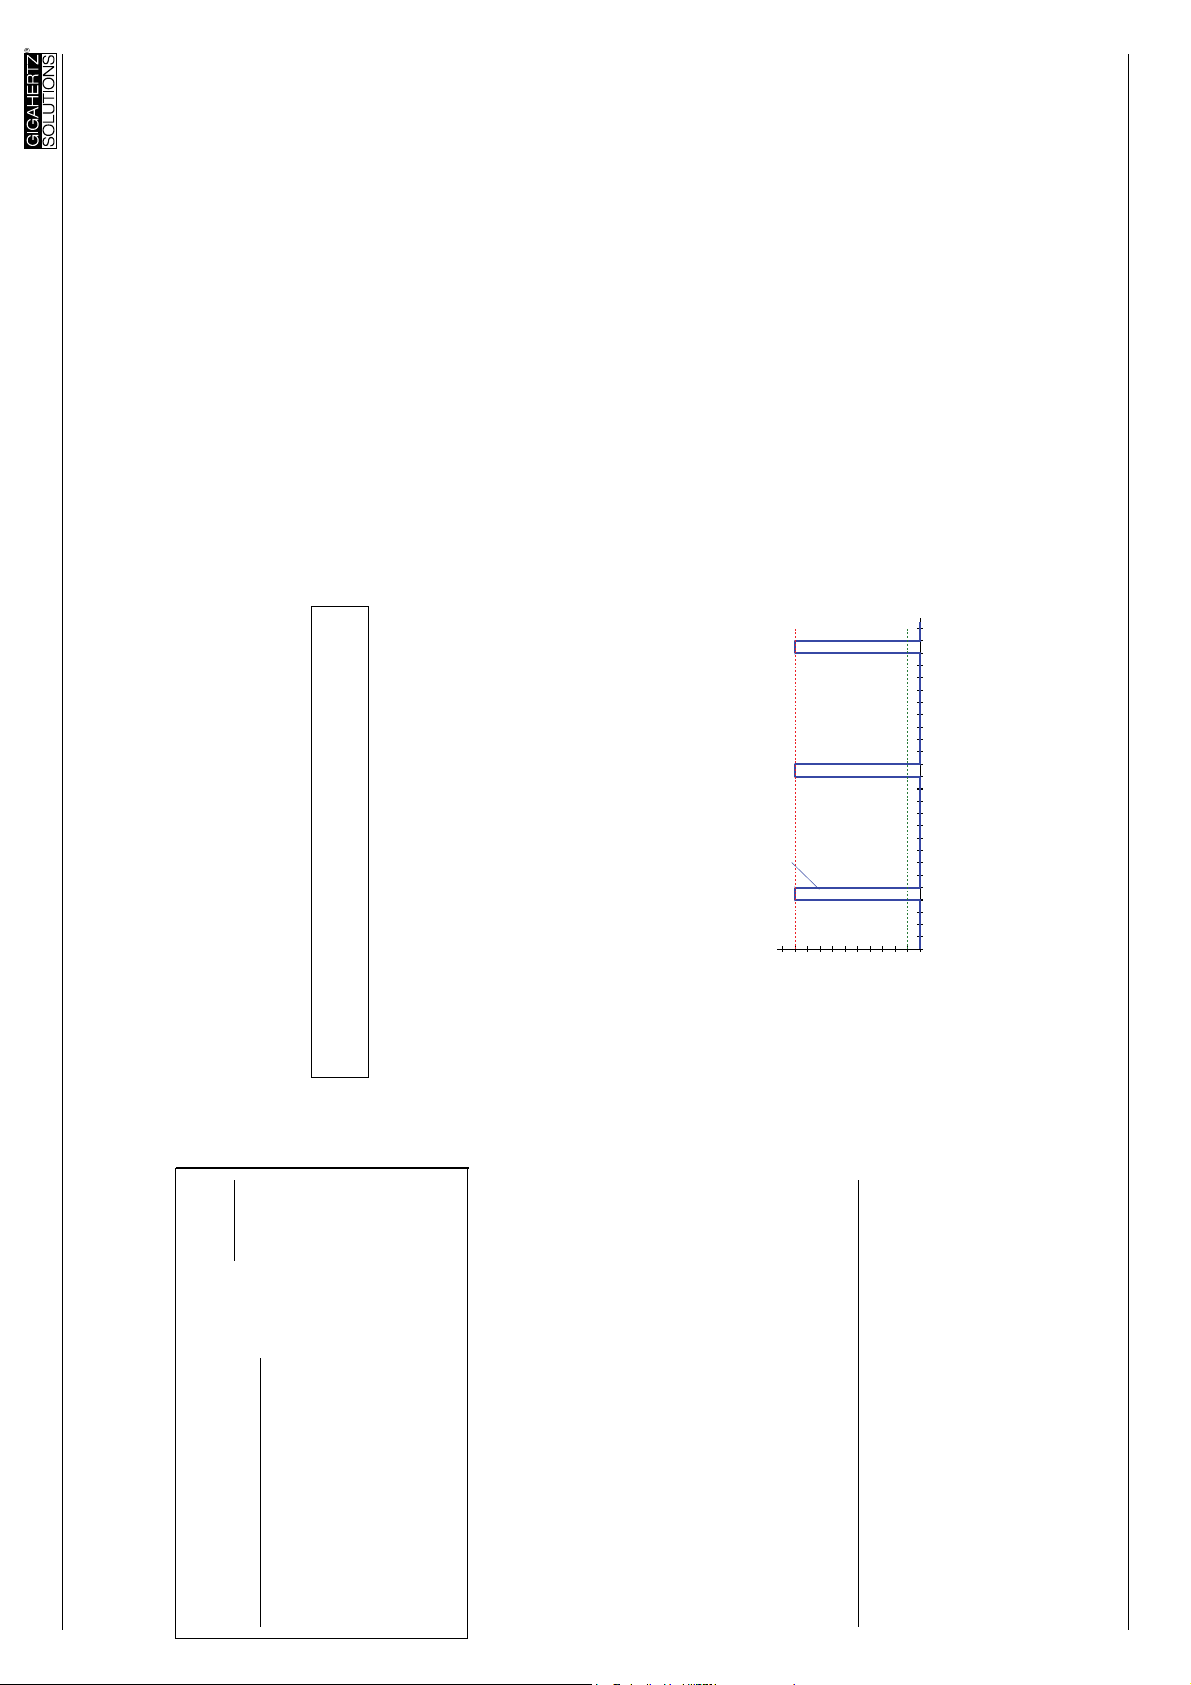
A pulsed signal consists of sections of its
time period with high output and another
sections with zero output. Their maximum
output is the wave peak. The following illus-
tration shows the difference in the evaluation
of a pulsed signal if displayed as an average
value reading or a peak value reading.
HF-energy in µW/qm
peak value: 10
. Theoreti-
5
e.g. 1 pulse every 10 µS
avg. value: 1
Note: The peak HF radiation value, not the
average value, is regarded as the measure-
ment of critical “biological effects“. The peak
value is displayed in the switch setting:
“Peak”. The average value is displayed in the
switch setting: “Average”.
Digital High Frequency Analyser HF58B-r
Rules of thumb for the interpretation of
the results
Readings in the two adjacent sensitivity
ranges “Medium” and “Coarse” use the
one with the higher value.
Numbers below 0.05 mW/m² shown in the
range “Coarse” are within the range of its
potential zero bias. Use the reading shown in
range “Medium”.
For comparative measurements (before /
after shielding) use the same range selector
position when possible.
Power densities beyond the designed range
of the instrument (display shows “1” on its
left side with the range set on “Coarse”) can
still be measured by inserting the attenuator
DG20_G3, available as an optional acces-
sory. By setting the “Adapter” switch to “At-
tenuator – 20 dB on your instrument ensures
the correct display of the measurement.
Also available are two HF preamplifiers for
factors 10 (HV10) and 1000 (HV30) as plug-
ins into the antenna input socket
sponding reading with setting "Medium". Numerical
example: In "Medium" you read 150.0 µW/m². In
cally the HF58B-r would have a minimum
"Coarse" you could read up to 0.6 mW/m² or down to
The power level adaptor switch is provided for the
0.03 mW/m² in an extreme case. Normally the differ-
ences shown will be much smaller.
5
factor HV10 amplifier only, not for the HV1000. The
HV1000, has the decimal point in its correct position.
The numbers are displayed in nanoW/m² instead of
µW/m² which is indicated on the LCD.
© Gigahertz Solutions GmbH, 90579 Langenzenn, Germany Revision 4.5 (Febuary 2006) Page 7
Page 8
.
6
the range selector
setting TPmax and
“fine” the noise can be up to a value be-
tween 30 and 120 digits. The tolerance
level of bandwidth and associated noise is
wide, but the bandwidth is beyond 2 MHz
minimum. A high noise level indicates an
even higher bandwidth of the instrument
: In view of the unavoidable
Please note
higher noise associated with the high video
bandwidth one should not use TPmax as
standard setting.
standard default setting for general pur-
- TP30kHz (Standard): This should be the
pose use of the instrument. The video
bandwidth is about 30 kHz, which will rep-
resent the shortest continuously pulsed
signals (e.g. DECT) without distortion. At
the same time, even with the range switch
on “Fine” the noise is significantly less than
with TPmax.
When the setting “Tpmax” and “Peak Hold – slow” is
6
chosen the reading on the display will at first rise for a
few second or even minutes, as also minute stochastic
peaks will be picked up and retained, which in normal
processing would be just “averaged out”. After some
time some slightly varying state of equilibrium will be
established.
for measur-
ing radar and UMTS/3G signals, as along
with the high video bandwidth comes a
an unparalleled high value which guarantees
the best accuracy available on this sector.
Use the setting “TPmax” only
higher noise level as illustrated in the picture
higher noise
Video-
low Noise
below.
ideal for Radar
"high"
"low"
UMTS (3G) and
(e.g. 2 MHz)
(e.g. 30 kHz)
Radar readings
and UMTS (3G)
bandwidth
displayed too small
With this setting the full 2
MHz bandwidth is at your disposal. Select
this when you have identified Radar or a
UMTS/3G signal by audio analysis. Please
note that with this setting not only the
UMTS/3G and the Radar signals are
measured, also any signals from other
The standard setting therefore is “TP30kHz”.
Only if a Radar signal or UMTS (G3) signal is
detected, by means of the audio analysis,
the “Tpmax” setting is used.
Some technical background
The circuits processing the incoming high
frequencies are only a small fraction of the
total circuitry. Their output is a signal propor-
tionate to the power density in the frequency
of the modulations or the pulses of the in-
coming HF signal, i.e. an LF signal in the
broadest sense.
The video bandwidth is important for the po-
tential as well as the limitations of an instru-
ment. Your HF analyzer allows you to select
between two settings of bandwidth, depend-
- TPmax (Radar):
ing on the objective of the measurement:
sources in this frequency range. With this
Digital High Frequency Analyser HF58B-r
In everyday measurement practice this func-
tion has great value. The peak value is re-
lated to the actual signal situation. This is
important because the immission situation
can change rapidly with time, direction of the
radiation, polarization, and the points of
measurements.. The “Peak Hold” mode
guarantees that you do not miss single
peaks.
The tone signal works independently of data
collection in the peak hold mode. Its sound is
proportional to the actual value measured. It
helps to identify the location, direction, and
polarization of the maximum field strength.
You can chose the (inevitable) droop rate, at
which the held peak value decreases over
time. Set the switch below the signal evalua-
tion switch (recessed in the casing) to “Slow”
or “Fast”. In “Slow” mode it takes about 20
minutes to run out of tolerance, but in order
to get an accurate reading the display should
be checked frequently. If very short signal
peaks occur then the holding capacity of the
function needs some recurrences to load
fully. Setting:
LF-Processing - Video Bandwidth
The video bandwidth defines the minimum
duration of short pulses that still can be
measured by the meter without being dis-
torted.
For measurement of exceptionally short
pulses (e.g. Radar) or specific signals like
UMTS/3G an extremely high video band-
width is needed for accurate readings. The
HF58B-r allows for 2 MHz video bandwidth,
© Gigahertz Solutions GmbH, 90579 Langenzenn, Germany Revision 4.5 (Febuary 2006) Page 8
Page 9
Quantitative Measurement:
Special case 1: UMTS / 3G
(Universal Mobile Telecommunication Sys-
tem, also known as the third generation of
mobile phones.) This technology is designed
to process huge amounts of data and has a
narrowly meshed network.
For measuring UMTS/3G the switch “Low
Frequency” Video Bandwith should be set to
“TPmax”.
With LogPer aerial and in “Peak “ mode iden-
tify the main direction of the signal and
switch to “ Peak Hold – long”
Now “gather“ the highest value without mov-
ing the meter ( use a wooden tripod ) for at
least 2 minutes in the same position. This is
important as because of the signal character-
istics of the UMTS/3G signal fluctuations by
the factor +/- 6 are common.
To hear samples how a UMTS/3G signal
sounds in the audio-analysis please check
“Pulse” .
use the combination of
our website for links to MP3 files.
Please note that when measuring UMTS/3G
you should not
switch-positions ”Average” and
radiation source.
In general, it is well accepted that
Most manufacturers of professional testing
equipment, however, do not share this view.
from the direction of the strongest
based on the maximum value emitted
exposure limit comparisons should be
But the details of the situation need to be
considered! For example, if a 2.4-GHz tele-
phone inside the house emits a similar level
of microwaves as a nearby cellular phone
base station outside the house, it would be
helpful to first turn off the 2.4-GHz telephone
in the house. Now measure the exposure
level originating from the outside. After hav-
ing measured the emission of the 2.4-GHz
telephone on its own, the sum of both meas-
urement values could be used for the expo-
sure assessment.
There is no “official regulation” nor clearly
defined testing protocol, because according
to German national standard-setting institu-
tions, as described earlier, quantitatively reli-
able, targeted and reproducible measure-
ments are only possible under “free field con-
ditions“ but not in indoor environments.
Cellular phone channel emissions vary with
the load. The minimum HF level occurs,
when only the control channel operates. It is
suggested that measurements should be
taken at different times during the day / week
in order to find out the times of highest traf-
fic.
LogPer to locate the direction from which
the major HF emission(s) originate, move
your wrist right and left. For emission
sources behind your back, you have to
turn around and place your body behind
Digital High Frequency Analyser HF58B-r
Quantitative Measurement:
Determination of Total High Frequency
Pollution
As described in Getting Started, attach the
LogPer antenna to the HF analyzer. Hold
the HF analyzer with a slightly outstretched
arm because objects (mass) directly behind
it “like yourself”, have effects on the testing
result. Your hand should not get too close to
the antenna, but should be near the bottom
end of the instrument.
In the area of a local maximum, the posi-
tioning of the HF analyzer should be changed
until the highest power density (the most im-
portant measurement value) can be located.
- When scanning “all directions“ with the
This can be achieved as follows:
the HF analyzer.
tached LogPer antenna, around its longi-
tudinal axis, determine the polarization
- Through rotating the HF analyzer, with at-
plane of the HF radiation.
- Change the measurement position and
avoid measuring exclusively in one spot..
because that spot may have local or an-
tenna-specific cancellation effects.
Some manufacturers of field meters propa-
gate the idea that the effective power density
should be obtained by taking measurements
of all three axes and calculating the result.
© Gigahertz Solutions GmbH, 90579 Langenzenn, Germany Revision 4.5 (Febuary 2006) Page 9
Page 10
(SBM 2003)
Below 0.1 µW/m²
below 1 µW/m²
areas for pulsed radiation
Limiting values, recommenda-
tions and precautions
Quantitative Measurement:
Identify where the radiation enters a struc-
ture
Precautionary recommentation for sleeping
As a first step eliminate sources from within
the same room (e.g. cordless phones, wire-
less routers, etc.) Once this is completed, the
remaining radiation will originate from out-
side. For remedial shielding it is important to
identify those areas of all walls (including
(Landessanitätsdirektion Salzburg, Austria)
The official regulations in many countries
specify limits far beyond the recommenda-
tions of environmentally oriented doctors,
“building biologists” and many scientific in-
stitutions and also those of other countries.
They are vehemently criticised, but they are
nonetheless “official”. The limits depend on
frequencies and in the HF range of interest
here they are between 4 and 10 W/m², far
beyond 10 million times the recommenda-
tions. Official limits are determined by the
potential heat generation in the human body
and consequently measurements of averages
rather than peaks. This ignores the state of
potentiell
durchlässiger
Bereich
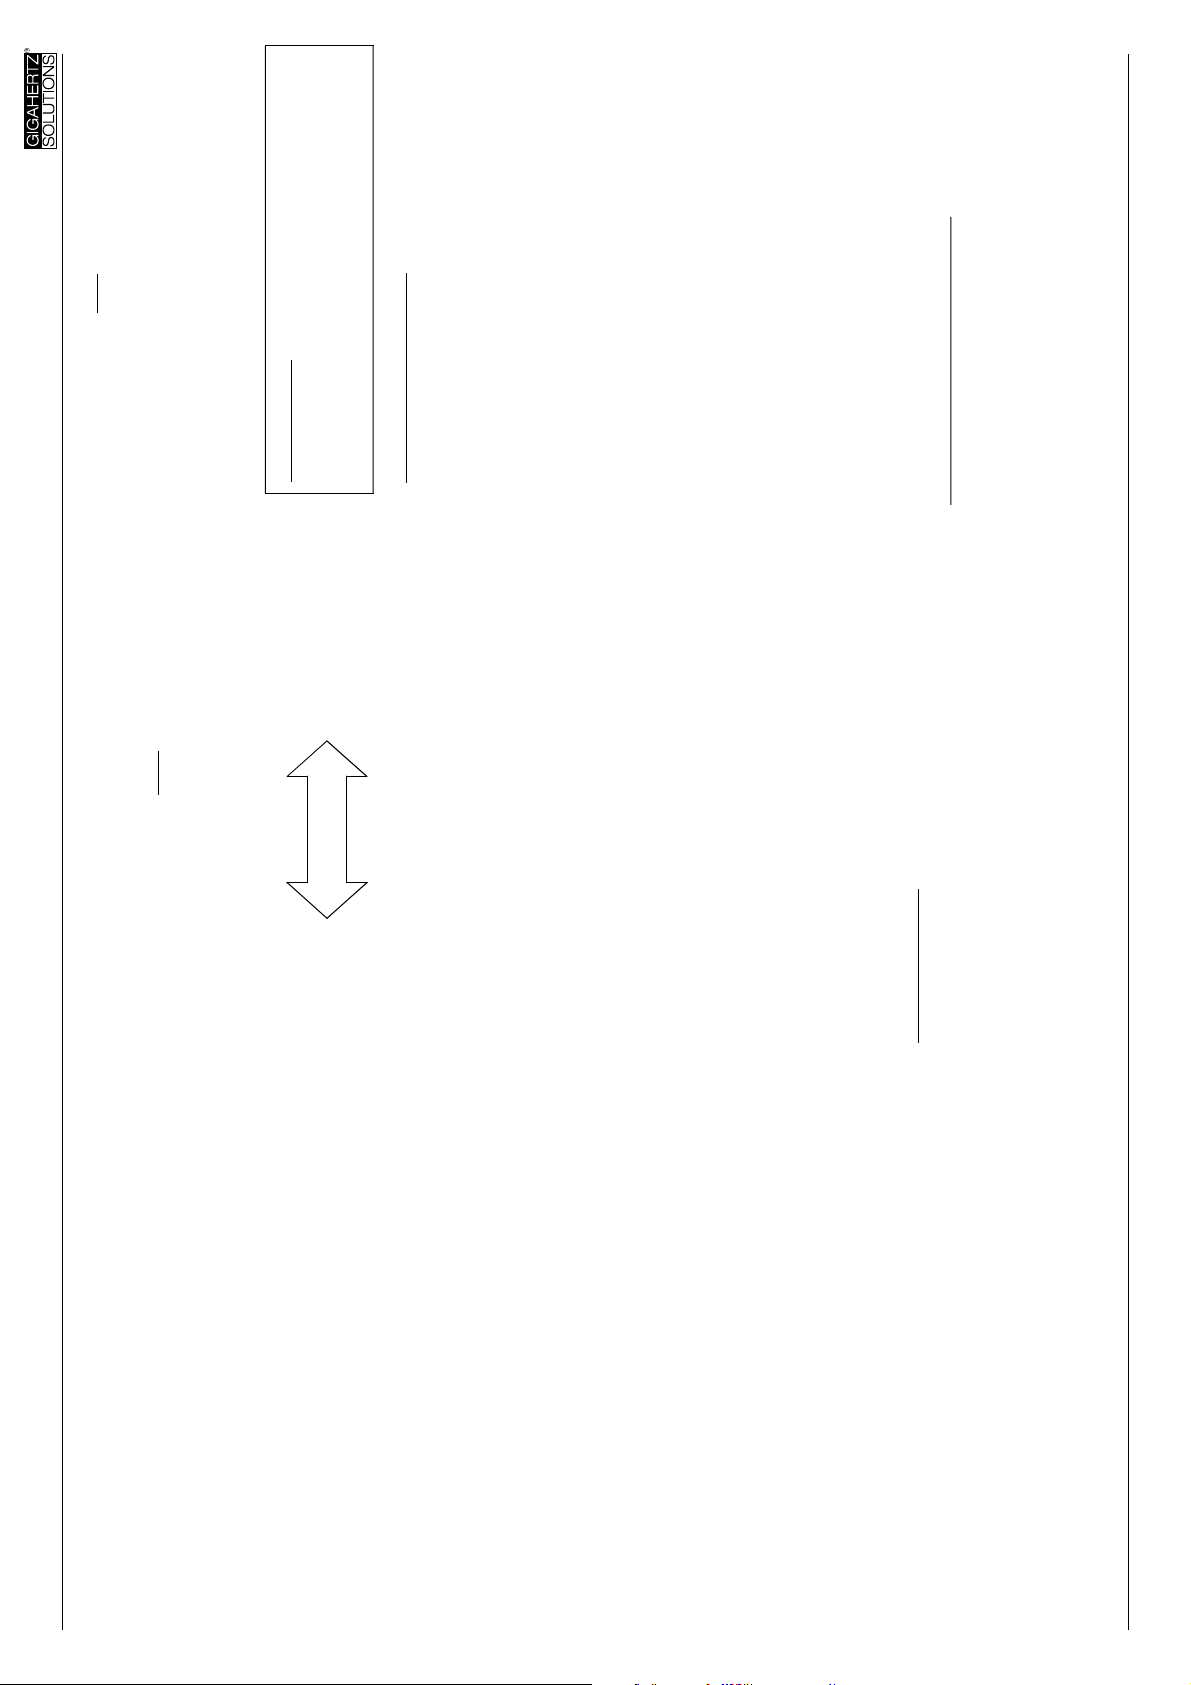
wall
stand in the
. That is because
7
wrong!
wall
doors, windows and window frames!), ceiling
and floor, which are penetrated by the radia-
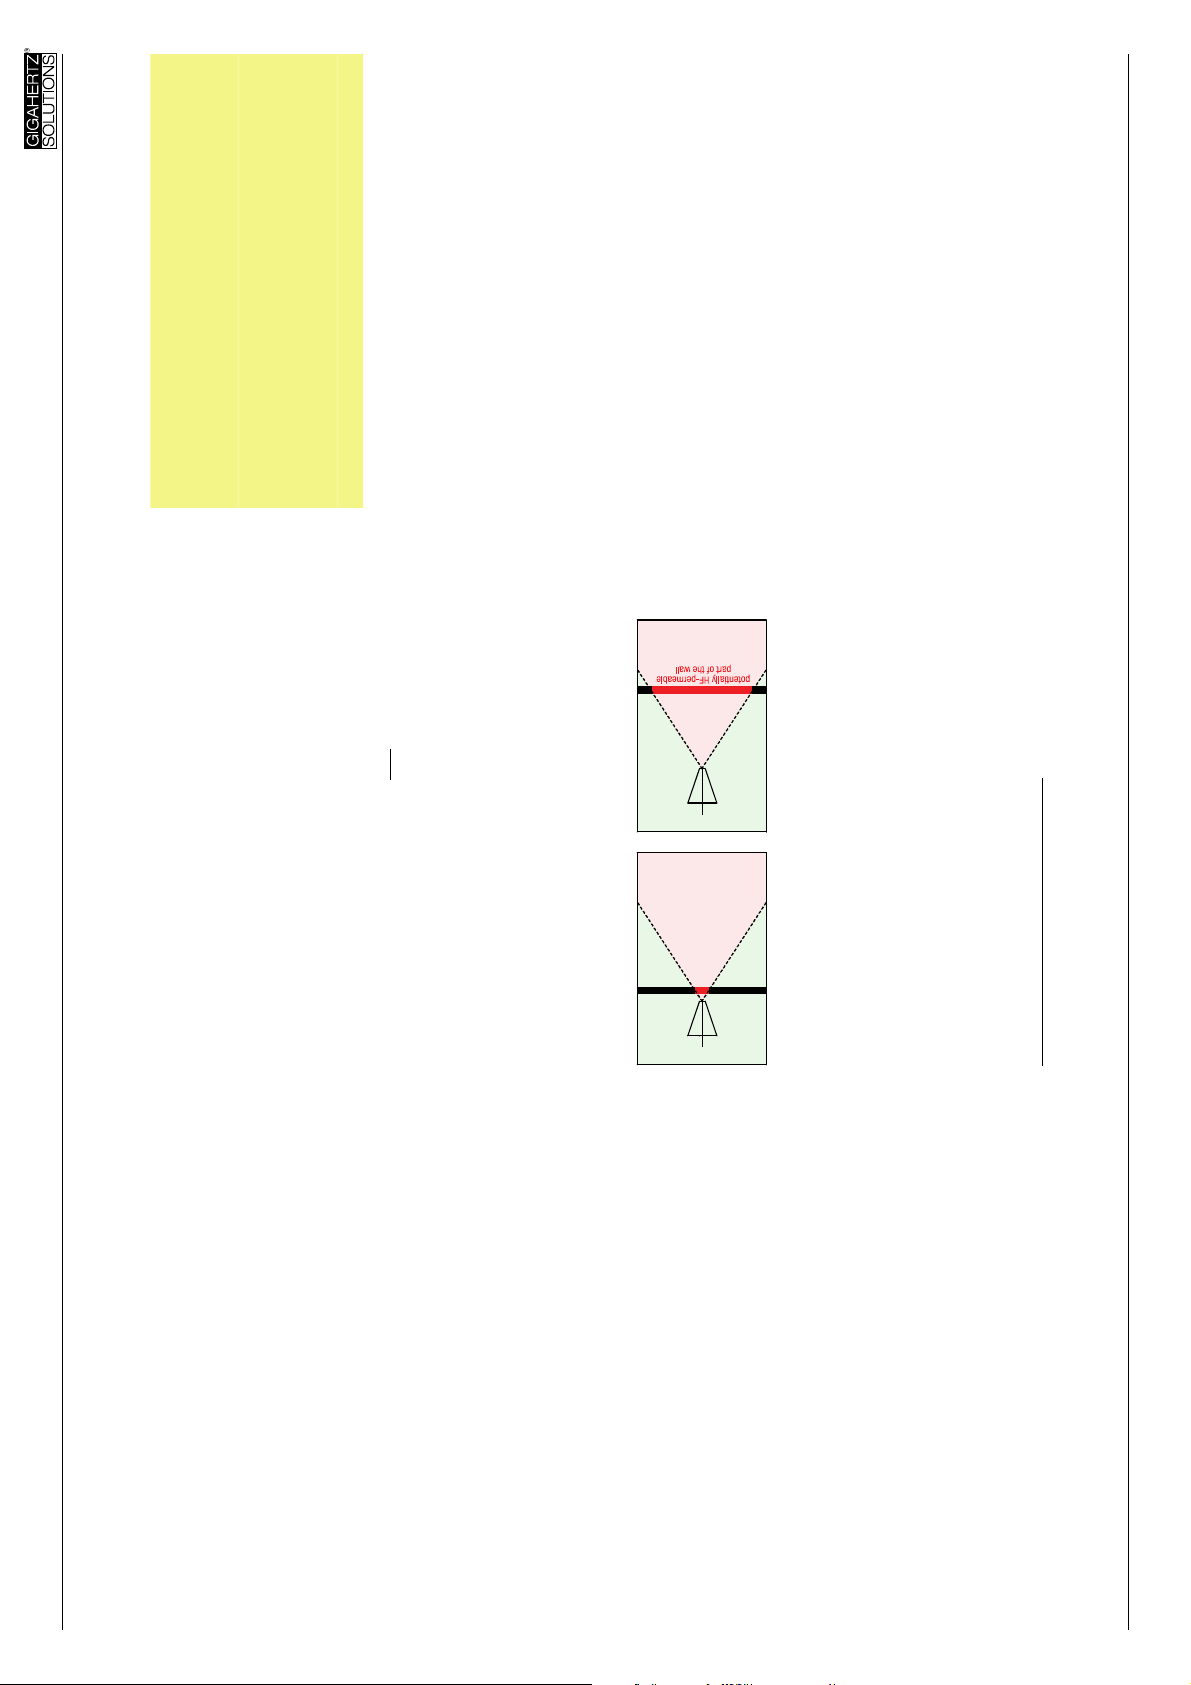
tion. To do this one should not
centre of the room, measuring in all direc-
tions from there, but monitor the permeable
areas with the antenna (LogPer) directed and
positioned close to the wall
the antenna lobe widens with increasing fre-
quency. In addition reflections and cancella-
tions inside rooms make it difficult and often
right!
impossible to locate the “leaks” accurately.
See the illustrating sketch below!
antenna
potentially HF-permeable
part of the wall
antenna
environmental medicine. The “official” limits
are far beyond the range of this instrument,
which is optimized for accurate measurement
of power densities targeted by the building
biologists.
The standard SBM 2003 cited above classi-
fies power densities of below 1µW/m² as “no
anomaly” for non pulsed radiation in sleeping
areas, and for pulsed radiation one tenth of
that.
The uncertainty of localization with HF-antennas
The shielding itself should be defined and
surveyed by a specialist and in any case the
area covered by it should be much larger
than the leak
7
The "Bund für Umwelt und Naturschutz
Deutschland e. V." (BUND) proposes 100
Please note: In this position the readings on the LCD
only indicate relative highs and lows that cannot be
interpreted in absolute terms.
Digital High Frequency Analyser HF58B-r
Quantitative Measurement:
Special Case 2: Radar
For air and sea navigation a radar antenna
slowly rotates around its own axis, thereby
emitting a tightly bundled “radar ray“. Even
with sufficient signal strength, this ray can
only be detected every couple of seconds,
for a few milliseconds. This requires special
measurement technology.
The HF58B-r with its video bandwidth of 2
MHz provides this technology. Please use
the following procedure to ensure correct
readings:
Setting: Video bandwidth to “Tpmax”. Signal
Evaluation – “Peak”. With the help of the au-
dio analysis (a very short “Beep” every cou-
ple of seconds), one can clearly identify a
radar signal. With this setting and the LogPer
antenna you can identify the direction of the
source of the signal.
With the signal Evaluation switch set to
“Peak Hold” and the LogPer antenna di-
rected towards the signal emitting source.
Wait for several circles of the radar ray, move
the instrument a little left and right in order to
get the relevant maximum reading.
The long delays between pulses may con-
sume a great deal of time trying to detect
signal direction with a LogPer aerial.
Please note that there are Radar systems
that are operated at even higher frequencies
that can be measured with this instrument,
yet possibly not the full intensity.
© Gigahertz Solutions GmbH, 90579 Langenzenn, Germany Revision 4.5 (Febuary 2006) Page 10
Page 11
Audio Frequency Analysis
Many different frequencies within the fre-
quency band between 800MHz and 2.5GHz,
are being used by many different services.
The audio analysis of the modulated portion
of the HF signal, help to identify the source
of a given HF radiation signal.
First get the HF analyzer ready for testing by
following the instructions in the relevant sec-
tion.
Important: For the audio analysis switch the
small switch on the right of the display to
“Pulse”. This will eliminate the content of
unpulsed signals, since their acoustical
marking (“rattling” with 16 Hz) will make the
acoustical analysis difficult.
How to proceed:
For audio analysis, simply turn the volume
knob of the speaker at the top of the case all
.
the way to the left (“-“). If you are switching
to audio analysis while high field strength
levels prevail, high volumes can be generated
quite suddenly. This is especially true for
measurements which are to be taken without
audio analysis. The knob is not fastened with
glue to prevent over winding. However, if by
accident you should turn the knob too far,
simply turn it back again. No damage will be
caused.
Set the On/OFF switch at
Sounds and signals are very difficult to de-
scribe in writing. The best way to learn the
signals is to approach known HF sources
very closely and listen to their specific signal
patterns. Without detailed knowledge, the
characteristic signal patterns of the follow-
could not be established with sufficient cer-
tainty.
In summary it confirms the justification of
precautionary limits well below the pre-
sent legal limits. Note for owners of cellular phones:
Digital High Frequency Analyser HF58B-r
µW/m² outside buildings. In view of the
shielding properties of normal building mate-
rials, far lower values exist inside buildings.
In February 2002 the Medical Authority of the
Federal State Salzburg, Austria, recommends
to reduce its “Salzburger Precautionary Rec-
ommendation” from 1 000 µW/m² to 1 µW/m²
Unimpaired reception of calls is possible with
power densities far below even the very strict
precautionary recommendation of 0.1 µW/m²
for pulsed HF frequencies by the SBM 2003.
inside buildings and 10 µW/m² outside.
These limits are based on empirical evidence
over the past few years.
The ECOLOG-Institute in Hannover, Ger-
many made a recommendation only for out-
side areas, namely 10000 µW/m². This is well
above the recommendation by building bi-
ologists and aims at getting consent also
from the industry. This would possibly enable
a compromise for a more realistic limit than
the government regulations cited above. The
authors qualify their recommendation in
mum possible emission of the transmitting
stations. As the emission measured de-
pends on the constantly varying actual
load, this restricts the normal exposure
- The limit should be applicable to the maxi-
much further.
than one third to this total.
- A single station should not contribute more
medical and building biology specialists
could not be considered for the proposed
limits, as their results are not sufficiently
documented. The authors state, that “sci-
entific scrutiny of their recommendations is
- The extensive experience and findings of
needed urgently”.
research could be considered for the pro-
posed limits, as their damaging potential
- Not all effects on and in cells found in their
© Gigahertz Solutions GmbH, 90579 Langenzenn, Germany Revision 4.5 (Febuary 2006) Page 11
Page 12

volume proportional to its contents of the
total signal. This “marking” has a frequency
of 16 Hz, and an audio sample can also be
downloaded as a MP3 file from our website.
This marking tone will only be audible with
the switch to the right of the display set to
“Full“. If the switch is set to “Pulse” the cir-
cuitry to suppress the content of un-pulsed
Analysis of the modulated /
pulsed signal ( total / pulse )
The exposure limits of pulsed radiation (acc.
to SBM2003) are lower by a factor of 10 than
that of non–pulsed signals. It is very impor-
tant to distinguish between these two types.
Without this knowledge you will not be able
to determine which limit to apply..
signals is activated. There will be nothing to
be marked.
Note concerning the switch setting “Pulse“:
The feature to distinguish between these two
types of radiation in absolute numbers has
been introduced for a broad band instrument
Under special laboratory conditions a signal can be
created, which causes an additional deviation from the
actual value of up to -3 dB. Under field conditions like
DECT and GSM signals only minimal deviations.
Use of Signal Outputs
AC output:
The AC output “PC/head-set”, 3.5 mm jack
socket, is meant for in-depth analysis of the
AM/pulsed content of the signal by headset
or a PC-audiocard and appropriate software.
For PC sound card or headphones or PC
software please ask or write us. DC output (2.5 mm jack socket):
of this price range for the first time. This is a
significant advantage over the commercial
spectrum analyzers, with which this differen-
tiation requires extra work.
The little switch to the right of the display
allows one to distinguish between the com-
plete signal including the pulsed part and its
pulsed or modulated part only.
In the “Full” setting, the power densities of all
signals in the frequency range of interest are
displayed. In “Pulse” setting only those
which are amplitude modulated are dis-
played. Signals like GSM (mobile phone),
DECT, Radar and WLAN/Bluethooth and
others can have similar intensities in either
switch setting. Even within tolerance limits,
they have no content of carrier frequency.
For logging devices or optional external dis-
play unit. When “Full Scale“ is displayed, it
has 1 VDC output, depending on the position
of switch 7.
The auto power off function is deactivated if
external devices are connected. Neverthe-
less, the battery is still protected against total
discharge.
Superposition and background radiation,
however, will mostly lead to a moderate dif-
ference in intensity.
Marking of unpulsed signals
Un-pulsed signals by their very nature are not
audible in the audio analysis and therefore
easily missed. For that reason they are
marked by a uniform “rattling” tone, with its
Digital High Frequency Analyser HF58B-r
ing HF sources can be easily identified: 2.4-
GHz telephones (base station and handset)
as well as cellular phones, the signal patterns
of which can be divided into “a live con-
nected phone call“, “stand-by mode“ and
especially the “establishing of a connection“.
The typical signal patterns of a cellular phone
base station can also be identified this way.
For comparison reasons you are well advised
to take measurements during high-traffic
times, as well as some times during the
night, in order to familiarize yourself with the
different noises.
The volume can be controlled with the “vol-
ume” (speaker) knob. Note: The power con-
sumption of the speaker is directly propor-
tional to the volume.
The optional variable frequency filters VF2 or
VF4 available help to facilitate the audio
analysis significantly and at the same time
add to its accuracy. They filter out individual
frequencies so contributions from other
sources can be identified.
On our home page (www.gigahertz-
solutions.de) is a link to some typical sam-
ples of audio analyses as MP3-files.
pulsed signals see the next section.
For more on acoustical marking of un-
© Gigahertz Solutions GmbH, 90579 Langenzenn, Germany Revision 4.5 (Febuary 2006) Page 12
Page 13

nector into either the AC or DC output.
This will deactivate the automatic power
off function. Switch on the meter until it
turns off (which happens automatically
shortly before the battery is damaged by
“deep discharging”)
green “Charging” LED should turn on. If
not, switch the analyzer on and then off
until it turns on.. After 10 to 13 hours the
charging process will finish automati-
cally. When charging is complete, the
green LED will turn off automatically.
times. Repeat every few months to
maintain maximum charging capacity.
Battery Management
Conditioning of the internal rechargeable
battery
The instrument comes with a rechargeable
internal NiMH-Battery. This should be condi-
tioned to achieve its maximum capacity.
We are working on a new instrument for the
analysis of yet higher frequencies (up to
about 6 GHz, i.e. WLAN, WIMAX and some
directional radio sources and flight radar)
.This will be available in 2006.
Available for low frequencies:
Electrosmog is not limited to the Radio Fre-
1. Plug the included, 2.5mm adapter con-
Please proceed as follows:
quency range!
Also for the low frequency range such as
power (distribution and domestic installa-
tions) including their higher harmonics we
offer a broad range of affordably priced in-
struments with high professional standards.
2. Connect the AC-Power adaptor. The
Please refer to a list of contacts is at the end
of this brochure.
3. Repeat this procedure one or two more
The rechargeable battery will thank you with
a longer life and a full capacity.
amongst other features will enable to dis-
play the results in other units, like e.g.
V/m and widen the range displayable to
49990 instead of the present 19990
digits.
Digital High Frequency Analyser HF58B-r
Further Analysis /
Optional Accessories:
Gigahertz Solutions offers a range of pream-
plifiers and attenuators, to widen the range of
power densities which can be processed
with this instrument, See section Quantitative
Measurement.
Furthermore there are two variable frequency
filters (“variable traps”) for quantitative sepa-
ration between different sources of radiation.
One of them blocks the selected frequency
by 20 dB to one hundredth of its real inten-
sity; the other version blocks by 40 dB for a
more accurate reading.
Future developments for this instrument:
1. A digital extension module, which
recording of single readings or for a long
term series of readings (data logging) in-
cluding PC software for their evaluation.
2. A digital internal extension module for
Instrument for lower frequencies
For measurement of signal frequencies
above 27 MHz (including: CB radioing, ana-
logue and digital TV and radio TETRA etc.)
we offer the instruments HFE35C and
HFE59B. Instrument for yet higher frequencies
© Gigahertz Solutions GmbH, 90579 Langenzenn, Germany Revision 4.5 (Febuary 2006) Page 13
Page 14

Remediation and Shielding
Please call us or send us an e-mail.
We will assist you in any shielding project
you might have.
The shielding effect of the various materials
is stated normally in “- dB”, e.g. “– 20 dB”.
use a charger or AC-adapter!
Conversion of shielding effect into reduction
of power density
„-10dB“ is measured value divided by 10
“-15dB” is measured value divided by ~30
”-20dB” is measured value divided by 100
”-25dV” is measured value divided by ~300
”-30dB” is measured value divided by 1000
etc.
Please be aware of the manufacturer’s notes
about the normally achievable shielding ef-
fects, as 100 % shielding is almost always
impossible. Partial shielding reduces the at-
tenuation considerably. That is why shielding
of seemingly radiation tight adjacent areas is
highly recommended.
the HF analyzer or it has been turned ON
accidentally during transport, it will shut
off automatically after 40 minutes of con-
tinuous use.
the digits in the center of the display, the
HF analyzer will turn OFF after 3 min in
order to avoid unreliable measurements.
In that case charge the rechargeable
battery.
will only be de-activated by plugging in a
2.5mm jack into one of the output sock-
ets AC or DC, see “Conditioning…” two
sections up. The function will be re-
activated to automatically prevent total
discharging of the battery by further op-
eration.
Auto-Power-Off
Digital High Frequency Analyser HF58B-r
Changing the rechargeable Battery
The battery compartment is at the back of
the analyzer. To remove the lid, press on the
grooved arrow and pull the cap off. Insert
only rechargeable batteries. If you use
regular alkaline (non – rechargeable) bat-
teries do not
This function conserves energy and extends
1. In case you have forgotten to turn OFF
the total operating time.
2. If “low batt” appears vertically between
3. The built-in function, Auto-Power-Off,
© Gigahertz Solutions GmbH, 90579 Langenzenn, Germany Revision 4.5 (Febuary 2006) Page 14
Page 15

Digital High Frequency Analyser HF58B-r
Warranty
We provide a two year warranty on factory
defects of the HF analyzer, the antenna and
accessories.
Antenna
Even though the antenna appears to be
rather delicate, it is made from a highly dura-
ble FR4 base material that can easily with-
stand a fall from table height.
HF Analyzer
The analyzer itself is not impact proof, due to
the comparatively heavy battery and the
large number of wired components.
Any damage as a result of misuse is ex-
cluded from this warranty
© Gigahertz Solutions GmbH, 90579 Langenzenn, Germany Revision 4.5 (Febuary 2006) Page 15
Page 16

( µW/m² to V/m )
Conversion Table
- - 1,2 21,3 120 213
- - 1,4 23,0 140 230
- - 1,6 24,6 160 246
- - 1,8 26,0 180 261
- - 2,5 30,7 250 307
µW/m² mV/m µW/m² mV/m µW/m² mV/m
0,01 1,94 1,0 19,4 100 194
0,02 2,75 2,0 27,5 200 275
0,03 3,36 3,0 33,6 300 336
- - 3,5 36,3 350 363
0,04 3,88 4,0 38,8 400 388
0,05 4,34 5,0 43,4 500 434
0,06 4,76 6,0 47,6 600 476
0,07 5,14 7,0 51,4 700 514
0,08 5,49 8,0 54,9 800 549
0,09 5,82 9,0 58,2 900 582
0,10 6,14 10,0 61,4 1000 614
0,12 6,73 12,0 67,3 1200 673
0,14 7,26 14,0 72,6 1400 726
0,16 7,77 16,0 77,7 1600 777
0,18 8,24 18,0 82,4 1800 824
0,20 8,68 20,0 86,8 2000 868
0,25 9,71 25,0 97,1 2500 971
0,30 10,6 30,0 106 3000 1063
0,35 11,5 35,0 115 3500 1149
0,40 12,3 40,0 123 4000 1228
0,50 13,7 50,0 137 5000 1373
0,60 15,0 60,0 150 6000 1504
0,70 16,2 70,0 162 7000 1624
0,80 17,4 80,0 174 8000 1737
0,90 18,4 90,0 184 9000 1842
conversion” therefore does not
formula, which depends on frequency and specifics of
the antenna used. A “re
make sense.
Instrument as delivered,
i.e. without preamplifier or attenuator
switch "Adapter"("Pegelanpassung") to "0 dB"
Bar on LCD
Displayed value & unit
0.01 - 19.99 mW/m²
00.1 - 199.9 µW/m²
0.01 - 19.99 µW/m²
1 - 1999 mW/m²
0.01 - 19.99 mW/m²
Displayed value & unit
With ext. Attenuator DG20,
switch "Adapter" to "Attenuator -20 dB"
Simply read out, no correction factor
Bar on LCD
.001 - 1.999 mW/m²
Simply read out, no correction factor
00.1 - 1999 µW/m²
0.01 - 19.99 µW/m²
Displayed value & unit
switch "Adaptor" to "Amplifier +10dB"
With ext. Preamplifier HV10,
Bar on LCD
.001 - 1.999 µW/m²
Why no column „dBm“?
Most recommended limiting values for HF radiation are
given in W/m² (sometimes also in V/m), which is why
this instrument is displaying in power density, µW/m²
resp. mW/m². A display in dBm as e.g. on a spectrum
analyzer requires transformation by a complicated
With ext. Preamplifier HV30,
00.1 - 199.9 µW/m² nW/m²
switch "Adapter"("Pegelanpassung") to "0 dB"
0.01 - 19.99 mW/m² µW/m²
Simply read out, no correction factor
Displayed value & unit Actual unit
Bar on LCD
0.01 - 19.99 µW/m² nW/m²
Same decimal point, but next smaller unit
Digital High Frequency Analyser HF58B-r
Measurement ranges of the HF58B-r
Range
Coarse
Medium
Fine
Range
Coarse
Medium
Fine
Range
Coarse
Medium
Fine
Range
Coarse
Medium
Fine
(Coarse = grob; Medium = mittel; Fine = fein)
© Gigahertz Solutions GmbH, 90579 Langenzenn, Germany Revision 4.5 (Febuary 2006) Page 16
Page 17

GIGAHE
SOLUTIO
GIGAHERTZ
SOLUTIONS
GIGAHERTZ
SOLUTIONS
GIGAHERTZ
SOLUTIONS
GIGAHERTZ
SOLUTIONS
GIGAH
SOLUT
GIGAHERTZ
SOLUTIONS
GIGAHERTZ
SOLUTIONS
GIGAHERTZ
SOLUTIONS
GIGAHERTZ
SOLUTIONS
GIGA
SOLU
GIGAHERTZ
SOLUTIONS
GIGAHERTZ
SOLUTIONS
GIGAHERTZ
SOLUTIONS
GIGAHERTZ
SOLUTIONS
TZ
NS
GIG
SOL
GIGAHERTZ
SOLUTIONS
GIGAHERTZ
SOLUTIONS
GIGAHERTZ
SOLUTIONS
GIGAHERTZ
SOLUTIONS
RTZ
ONS
G
SO
GIGAHERTZ
SOLUTIONS
GIGAHERTZ
SOLUTIONS
GIGAHERTZ
SOLUTIONS
GIGAHERTZ
SOLUTIONS
ERTZ
TIONS
G
S
GIGAHERTZ
SOLUTIONS
GIGAHERTZ
SOLUTIONS
GIGAHERTZ
SOLUTIONS
GIGAHERTZ
SOLUTIONS
HERTZ
UTIONS
GIGAHERTZ
SOLUTIONS
GIGAHERTZ
SOLUTIONS
GIGAHERTZ
SOLUTIONS
GIGAHERTZ
SOLUTIONS
AHERTZ
LUTIONS
GIGAHER
SOLUTION
GIGAHERTZ
SOLUTIONS
GIGAHERTZ
SOLUTIONS
GIGAHERTZ
SOLUTIONS
IGAHERTZ
OLUTIONS
GIGAHE
SOLUTIO
GIGAHERTZ
SOLUTIONS
GIGAHERTZ
SOLUTIONS
GIGAHERTZ
SOLUTIONS
GIGAHERTZ
SOLUTIONS
GIGAH
SOLUT
GIGAHERTZ
SOLUTIONS
GIGAHERTZ
SOLUTIONS
GIGAHERTZ
SOLUTIONS
GIGAHERTZ
SOLUTIONS
GIGA
SOLU
GIGAHERTZ
SOLUTIONS
GIGAHERTZ
SOLUTIONS
GIGAHERTZ
SOLUTIONS
GIGAHERTZ
SOLUTIONS
GIG
SOL
GIGAHERTZ
SOLUTIONS
GIGAHERTZ
SOLUTIONS
GIGAHERTZ
SOLUTIONS
GIGAHERTZ
SOLUTIONS
G
SO
GIGAHERTZ
SOLUTIONS
GIGAHERTZ
SOLUTIONS
GIGAHERTZ
SOLUTIONS
GIGAHERTZ
SOLUTIONS
G
S
GIGAHERTZ
SOLUTIONS
GIGAHERTZ
SOLUTIONS
GIGAHERTZ
SOLUTIONS
GIGAHERTZ
SOLUTIONS
GIGAHERTZ
SOLUTIONS
GIGAHERTZ
SOLUTIONS
GIGAHERTZ
SOLUTIONS
GIGAHERTZ
SOLUTIONS
GIGAHER
SOLUTION
GIGAHERTZ
SOLUTIONS
GIGAHERTZ
SOLUTIONS
GIGAHERTZ
SOLUTIONS
GIGAHE
SOLUTIO
GIGAHERTZ
SOLUTIONS
GIGAHERTZ
SOLUTIONS
GIGAHERTZ
SOLUTIONS
GIGAH
SOLUT
GIGAHERTZ
SOLUTIONS
GIGAHERTZ
SOLUTIONS
GIGAHERTZ
SOLUTIONS
GIGA
SOLU
GIGAHERTZ
SOLUTIONS
GIGAHERTZ
SOLUTIONS
GIGAHERTZ
SOLUTIONS
GIG
SOL
GIGAHERTZ
SOLUTIONS
GIGAHERTZ
SOLUTIONS
GIGAHERTZ
SOLUTIONS
G
GIGAHERTZ
GIGAHERTZ
GIGAHERTZ
ME 3951A
With F1B2H31 (Frequency Filter Module: 16 Hz Band Pass/50Hz High Pass/2kHz High Pass)
User's Guide
- Functions & Controls
- Operation and Maintenance
- Measurement Instructions
- Field Theory
It is important to read carefully the instruction manual prior to using the field meter. Important information regarding
safety, use and maintenance is provided herein.
GIGAHERTZ
SOLUTIONS
R
1
Page 18

With the field meters of the ME 3 series, GIGAHERTZ SOLUTIONS® sets new standards in electromagnetic field testing. Professional measurement engineering is offered with a unique
price/performance ratio - the only one of its kind worldwide. This was made possible through the
consistent use of innovative integrated components, some of which have patents pending, as well
as highly sophisticated production engineering.
The field meter you purchased allows a competent assessment of AC electric as well as AC
magnetic field exposures according to the internationally recognized Swedish guidelines for computer monitors (TCO/MPR), covering the entire frequency range from 5 Hz up to 400 kHz.
We appreciate the confidence you showed when purchasing the ME 3951A field meter. With the
confidence that your expectations will be met, we wish you great success in collecting useful
information with this field meter.
© by the manufacturer: GIGAHERTZ SOLUTIONS®GmbH, D-90579 Langenzenn. All rights reserved. No part of this
document may be reproduced or transmitted in any form or by any means, electronic or mechanical, including photocopying, or recorded by any information storage or retrieval system, without permission in writing by GIGAHERTZ
SOLUTIONS®GmbH.
2
© by GIGAHERTZ SOLUTIONS®GmbH, 90579 Langenzenn, www.gigahertz-solutions.com
Preface
GIGAHERTZ
SOLUTIONS
R
Page 19

Contents
Page
Safety instructions ........................................................................................................................3
Function & controls ........................................................................................................................4
Getting started ...............................................................................................................................6
Measurement instructions ...............................................................................................................8
Changing Batteries .......................................................................................................................16
Battery management ....................................................................................................................18
Safety Instructions:
It is important to read carefully the instruction manual prior to using the field meter. Important information regarding safety, use and maintenance is provided herein.
The adapter is only to be used with the specified, rechargeable battery. Never try to recharge nonchargeable primary batteries (e.g. zinc-coal or alkaline batteries) with it: Explosion Hazard!
The grounding of the field meter required for the electric field measurements should be performed
with the supplied grounding lead, which can be connected to bare water, gas or heating pipes. If
there is none of the above-mentioned grounding options available, a licensed electrician could
temporarily also make use of the grounding conductor in a grounded outlet. In this case, however, an electric shock hazard may occur when the grounding clip touches the current-carrying
phase conductor.
To prevent shock hazards or the destruction of the field meter, neither the instrument itself nor the
adapter should ever come into contact with water. The penetration of water into the case may lead
to the destruction of the electronics inside. Field meters are not to be stored outdoors or used
during rain. Clean the case only from the outside, using a slightly moist cloth. Do not use cleaners
or sprays.
Prior to cleaning the field meter or opening the case, shut it off and unplug all extension cords.
There are no user-serviceable parts inside the instrument.
Due to the high sensitivity level, the electronics of the field meter are very sensitive to heat, impact
as well as touch. Therefore do not leave the instrument in the hot sun, on a heating element or the
like. Do not let it drop nor try to manipulate its electronics inside when the case is open.
This field meter should only be used for the purposes described herein and only in combination
with supplied or recommended accessories.
3
© by GIGAHERTZ SOLUTIONS®GmbH, 90579 Langenzenn, www.gigahertz-solutions.com
Contents, Safety Instructions
GIGAHERTZ
SOLUTIONS
R
Page 20

4
© by GIGAHERTZ SOLUTIONS®GmbH, 90579 Langenzenn, www.gigahertz-solutions.com
Function & Controls
GIGAHERTZ
SOLUTIONS
R
Battery Charging
Extension cord of the supplied
adapter: 12-24 VDC, with (+)
at the internal conductor and
(-) at the external conductor.
Only to be used during battery
charging see pages 6, 18
Range Selection
200 nT/Vm: (fine)
0 to 199.9 Nanotesla (nT)
0 to 199.9 Volt per Meter (V/m)
2000 nT/Vm: (coarse)
0 to 1999 Nanotesla (nT)
0 to 1999 Volt per Meter (V/m)
see page 9
AC - Signal output
1 VAC at maximum display:
Connector for a spectrum
analyzer to analyze the frequency spectrum of the measured signals. At maximum
display, the maximum frequency output is 30 kHz.
see page 15
Field type
E: Electric Field
M: Magnetic Field
Test: Offset Display
see pages 7, 10, 11
Operation
"Speaker Icon": Speaker turned on
On: Field meter turned on
Off : Field meter turned off
see pages 7, 11, 18
Frequency Filter F1B2H31
16 Hz Band pass, 50 Hz High
pass, 2 kHz Highpass, for building biology assessments to
identify railway systems, electric power grid as well as harmonics of higher frequencies
see pages 11, 12, 14
Light diode: comes on while
battery is being charged
see page 18
Button to be pressed for the
display of the battery status as
well as the display check
see page 19
Display of the Field Type in Use
Dash at the top: Electric field
strength is displayed
Dash at the bottom: Magnetic
flux density is displayed
Two Dashes: Self-diagnostics
LC-Display: 3.5-digit display of the measu-
rement value (mean value)
see page 19
DC - Signal output
0 to -1 VDC Signal output
Suitable for long-term monitoring with a data logger or data
plotter, but also for connecting
the optional external display
unit (DP 3000A)
see page 15
Picture 01
Ground
Connection of the grounding
lead (for electric field testing)
see page 9
Page 21

5
© by GIGAHERTZ SOLUTIONS®GmbH, 90579 Langenzenn, www.gigahertz-solutions.com
GIGAHERTZ
SOLUTIONS
R
Function & Controls
Switch to short-circuit the
magnetic sensor, which is only
used by the manufacturer for
calibration purposes.
Sensor for AC Magnetic
Fields
see pages 7
Rechargeable Battery (”9
Volt E-Block”)
Caution: Battery should only
be used within the supplied
isolation compartment made
of cardboard in order to avoid
short-circuit damage of the
instrument.
see pages 17
Battery Compartment
LC-Display: 3.5-digit display
of the measurement value
(RMS) including field type and
low batt. indicator
see page 19
2 Miniature Speakers in a
magnetically shielded circuit
Pegs to hold the rechargeable
battery in place
Picture 02
Frequency Filter Module
F1B2H31
Can be replaced with modules featuring other threshold
frequencies.
see pages 11, 12, 14
Sensor for AC Electric
Fields ("Field plate")
see pages 7
Switch to short-circuit the field
plate, which is only used by the
manufacturer for calibration
purposes
Page 22

Instrument Contents:
1.) 2.) 3.)
4.) 5.) 6.)
7.) 8.) 9.)
1.) Field meter
2.) Adapter with external voltage jack (2.0 mm)
3.) Grounding lead (5 m) with jack plugs (2.5 mm, mono) and alligator clip
4.) Grounding clip
5.) BNC measurement adapter on jack plug (3.5 mm, mono)
6.) Measurement jack adapter (3.5 mm, mono) on jack plug (2.5 mm, mono)
7.) Jack plug (2.5 mm, mono) for creating your own measurement adapter
8.) Wedge for opening the case to change batteries or frequency filter modules
9.) Rechargeable battery with 9 V nominal voltage (Depending on shipping conditions, it is
sometimes already inserted into the field meter.).
Getting Started
Turning On
If no display is activated, insert rechargeable battery. (See section "Changing Battery").
Charging
If display shows low-batt. indicator, charge battery or insert a fully charged battery. (See section
"Battery Management").
6
© by GIGAHERTZ SOLUTIONS®GmbH, 90579 Langenzenn, www.gigahertz-solutions.com
Instrument Contents, Getting Started
GIGAHERTZ
SOLUTIONS
R
Page 23

Function Testing - Display of Magnetic Flux Density:
1.Display:
Field Type = “M”, Measurement Range = ”200 nT/Vm”, Frequency Range = ”5 Hz - 400 kHz”, Operation = "Speaker Icon”
2.Move the field meter in fast and short movements around its longitudinal axis back and forth, as shown in picture 03.
Picture 03 As a result, the static geomagnetic field is turned into a "quasi
alternating field." The faster and greater the movements, the
stronger the induced alternating field will be. This will be reflected
in the higher measurement values on the display and the faster
"rattling" noise from the speaker, which is proportional to the field
strength.
Function Testing - Display of Electric Field Strength:
1. Display:
Field Type = “E”, Measurement Range = ”200 nT/Vm”, Frequency Range = ”5 Hz - 400 kHz”, Operation = "Speaker Icon”
2.Keep the field meter steady while tapping the front of the case
with your fingers, as shown in picture 04.
Picture 04 Due to your fingers' mass potential a "quasi AC electric field" is
created whose strengths is reflected through higher measurement
values on the display and the faster "rattling" noise from the speaker.
Defining the Offset:
Turn on the instrument and set the switch "field type" to the "test"
position. On the left-hand side of the display a "1" (as icon for the
test mode) will appear and on the right-hand side either "00.0" or
"000", depending on the selected measurement range.
If instead of "000" or "00.0" a higher measurement value is displayed, this value would reflect the current deviation from zero.
Picture 05
Such a situation can occur because of current environmental conditions (e.g. temperature, air humidity, etc.) The tolerance of the
subsequent electric and magnetic field measurements will be
increased by this deviation value.
7
© by GIGAHERTZ SOLUTIONS®GmbH, 90579 Langenzenn, www.gigahertz-solutions.com
Function Testing, Offset
GIGAHERTZ
SOLUTIONS
R
Tap here!
Page 24

Measurement Instructions
Introduction to the Properties of AC Electric and Magnetic Fields
Generally speaking, the sensory organs of the human body cannot perceive alternating electric
and magnetic fields. These fields are "simply there" and expand into three-dimensional space, following rather complex physical laws. For measurement practice, the following properties of alternating electric and magnetic fields are very important:
1. Any measurement is always determined by position as well as direction. The slightest change
in position or direction of the field meter can have substantial consequences for the measurement value, especially in AC magnetic fields.
2. Electric as well as magnetic fields not only penetrate into solid materials including walls, glass
or the like, but also pass right through them. This holds especially true for magnetic fields,
whose shielding is rather costly.
3. AC electric fields occur whenever an alternating voltage is applied. In residential situations, for
example, all plugged-in extension cords and appliances including switches are surrounded by
alternating electric fields. This even holds true when the appliance is turned off! As soon as an
appliance is turned on, there is current flow and an AC magnetic field is added.
4. Beside the field strength, AC electric or magnetic fields are also characterized by their frequency. We distinguish between the low frequencies of the ELF and VLF range between 5 Hz
and 400 kHz as defined by the MPR/TCO guidelines for the assessment of computer monitors
as well as all the higher frequencies including radio waves and microwaves. Furthermore there
are also static magnetic and electrostatic fields, each of which requires a totally different
approach to testing just like RF radiation.
Introduction to Measurement Instructions
In order to obtain meaningful testing results, the Ökotest magazine (6/96) demands the following
minimum requirements for testing equipment of electric and magnetic fields in the ELF and VLF
range:
1.Separate measurements of AC electric fields (with ground reference) and AC magnetic fields.
2.Reproducible, high accuracy.
3.Flat frequency response across the entire specified frequency range, which should at least cover
the railway frequency 16.67 Hz all the way through to the kilohertz range (only in Europe).
4.High sensitivity: 10 nT or 1 V/m, or better.
The field meters by GIGAHERTZ SOLUTIONS
®
meet all the above requirements.
8
© by GIGAHERTZ SOLUTIONS®GmbH, 90579 Langenzenn, www.gigahertz-solutions.com
Measurement Instructions
GIGAHERTZ
SOLUTIONS
R
Page 25

Preparations Prior to Testing
1. Check the field meter according to the instructions laid out under "Getting Started".
2. First of all take measurements of AC electric and magnetic fields outdoors to get a feel for the
background radiation. If the field meter registers more than 5 V/m or 5 nT (0.05 mG), this will
give you an idea of the background exposure. By means of turning off the circuit breakers in
the main panel, it is possible to determine which of the fields are caused from inside the house
and which ones from outside such as high-tension power lines, railway trails, pole-mounted or
surface transformers as well as neighboring houses/apartments. If external fields are suspected, their sources can be traced by moving the field meter into the direction of the highest readings.
3. When performing an EMR survey in homes or at workplaces, all typical electric appliances and
electronic devices should be turned on, also including those that come on only temporarily such
as refrigerators or storage space heaters (e.g. in adjoining rooms). By turning the various appliances off and on, it is possible to locate the most important field sources.
4. A sketch of the area to be measured that shows the corresponding test results and allows for
a later analysis of the situation. Thus appropriate remediation strategies can be assigned.
5. Start with the measurement range "200 nT/Vm." Only if the display goes in overload because
of rather high ambient field strengths, switch to the higher range "2000 nT/Vm".
6. Ideally, all measurements are to be repeated during various times of the day and on different
days of the week in order to identify fluctuations.
7. The additional sound signal that is proportional to the field strength makes the detection of field
sources easy.
Measurement Instructions - AC Electric Fields
1. Grounding the Field Meter and the Person Performing the Testing
According to relevant guidelines (TCO, MPR II, TÜV), prior to any electric field testing the field
meter needs to be connected to ground potential through the supplied grounding lead in order to
obtain reliable, reproducible testing results. Without a proper connection to ground potential no
reliable statements on AC electric fields can be made.
Unvarnished, metal piping for water, gas or heating can be used
to connect the grounding lead with its grounding clip. As an alternative, a licensed electrician could also use an alligator clip to
establish a grounding connection through the grounding conductor in a grounded outlet. Warning: In case the phase conductor is
touched, an electric shock hazard may result.
Picture 06
9
© by GIGAHERTZ SOLUTIONS®GmbH, 90579 Langenzenn, www.gigahertz-solutions.com
Measurement Instructions
GIGAHERTZ
SOLUTIONS
R
Page 26

Insert the jack plug of the grounding lead into the dedicated
socket ("ground", "ground icon") and at the same time run the
grounding lead alongside the case to the back. Touch the "AC" or
"DC" socket with your finger in order to bring your own body to
ground potential. Picture 07
Picture 07
Picture 08 Picture 09 Picture 10
Caution: In case the grounding lead runs in front of the instrument case or a finger is between the
DC socket and the front of the instrument case, testing results will become distorted. (See also
footnote 1)
2. Positioning of the Field Meter for AC Electric Field Testing
The field meter is calibrated for measurements taken in close proximity to the body (Picture 11).
The field sources located behind the field meter are shielded through the body. Therefore misleading concentrations of field lines onto the electric field sensor are avoided. Therefore try to avoid
taking measurements with a stretched-out arm. In general, this would lead to higher testing results
(Picture 12). This type of distortions can be reduced or avoided by placing a conductive surface
behind the field meter. (Picture 13, see also footnote 1)).
Picture 11 Picture 12 Picture 13
1) The electric field strength measured with ground reference always depends on the geometry of the field source and the sensor, the distance
between sensor and field source as well as ambient potentials. Following TCO guidelines, the ME 3951A is calibrated according to the TCOcalibrated field meter "Radians Innova - Enviromentor EMM-4 (Serial. No. 4348)" at a distance of 50 cm from a 4-sqm large copper plate operating at 50 Hz and 270 V. Instead of a person, which is also grounded during testing in the field, a grounded, square copper plate measuring
50 cm (ca. 20") on its sides is placed behind the field meter during calibration. The same procedure is recommended for reproducible tripod
measurements. Testing results of the ME 3951A can only be expected to correspond with those of an original TCO sensor when the distance
from the field plate is greater than 30 cm (12"). The measured field strength represents a spatial integral across the testing equipment, whose
simplification "measurement value in the direction of the highest display = resultant field strength" is a good approximation for practical purposes.
10
© by GIGAHERTZ SOLUTIONS®GmbH, 90579 Langenzenn, www.gigahertz-solutions.com
Measurement Instructions
GIGAHERTZ
SOLUTIONS
R
Page 27

3. AC Electric Field Testing
Turn on the field meter and set the switch "Field Type" to "E" for
AC electric field. (Picture 14)
Set the switch for the frequency filter to "50 Hz to 400 kHz". Thus
self-inductions due to micromovements (shaking of hand) will be
suppressed. (Picture 14)
Picture 14 During testing always ensure that the grounding lead runs to the
back of the case and that the person performing the survey as
well as anybody else present are located behind the field meter.
Keep the field meter close to your body. The further away you hold the instrument or if it is even
put down, the falsely higher the testing results tend to become. Either point to the suspected field
source or - if no such concrete source is known - check the space systematically. Proceed as follows:
- First of all, move slowly through the room to be measured.
- Stop frequently and take measurements pointing to the back, to the left, to the right and to the
ceiling. Always keep in mind to have the grounding lead run to the back of the instrument.
- Follow into the direction of the highest reading in order to identify the field source.
- In areas where people spend substantial amounts of time such as in bed or at a workplace,
check all directions as mentioned above and make note of the orientation of the field meter at
maximum readings. In such a position, a reference measurement of the absolute value should
be taken as close to the body as possible.
- After having checked all directions, the maximum measurement value can be used as a first
approximation of the resultant field strength.(See footnote 1))
When the field meter is placed on a tripod or on a table, it is necessary to also place a person 5
cm (2") behind the instrument to obtain accurate measurements. For reproducible measurements,
a metal plate (50 cm x 50 cm) is required to be orthogonal and centered 5 cm behind the instrument.
An EMR survey of sleeping areas should also include measurements under "sleep conditions,"
that is bedside lamp turned off. Under certain circumstances the electric field can even increase
after something was turned off.
Recommended Exposure Limit up to 2 kHz:
Below 10 V/m, better yet below 1 V/m.
(For frequencies above 2 kHz always below 1 V/m)
11
© by GIGAHERTZ SOLUTIONS®GmbH, 90579 Langenzenn, www.gigahertz-solutions.com
Measurement Instructions
GIGAHERTZ
SOLUTIONS
R
Page 28

AC Magnetic Field Testing:
Turn on the field meter and set the switch "Field Type" to "M" for
AC magnetic field. (Picture 15)
Set the switch for the frequency filter to "50 Hz to 400 kHz". Thus
self-inductions due to micromovements (shaking of hand) will be
suppressed. (Picture 15)
Picture 15 For reliable measurements of AC magnetic fields, neither the field
meter nor the person performing the measurements need to be
grounded. Other persons or mass potentials in the vicinity of the field meter do not affect the
testing results.
If a field source is suspected, point into that direction. Otherwise check the space systematically.
Proceed as follows:
- First of all, move slowly through the room to be measured. The magnetic sensor is positioned
in such a way in the instrument that most typical field sources in residential settings are detected as long as the field meter is held horizontally. In addition, all three dimensions should be
checked from time to time as shown in the pictures 16 through 18.
- In practice, the identification of a field source has proven to be most effective by locating the
direction of the highest reading first. Then you follow the direction, which continues to show
increasing measurement values. Simply keep the field meter aligned in the direction of the
maximum readings. For an accurate measurement, however, hold the instrument very steady
or put it down at a relevant measurement point.
- In the important places where we work, sit or sleep, all three dimensions of AC magnetic fields
should be checked each time. Proceed as follows.
Accurate Measurement of the Magnetic Field Strength in the Presence of
Several Field Sources
In this event, it is necessary to take three separate measurements and write the readings down.
The field meter should be held as shown in the pictures: point to the front (Picture 16), to the ceiling (Picture 17) and to the side so that it is perpendicular to the front axis (Picture 18).
In order to estimate the resultant, that is the actual AC-magnetic-field exposure, the following rules
of thumb can be applied.
Rules of Thumb for Estimating the Total Magnetic Field Strength
Measurement Value: Corresponding Total Magnetic Field :
- One high, two low values ~ Highest value
- Two high, one low value ~ Highest value + half of the second highest value
- Three similar values ~ One and a half times of the highest
12
© by GIGAHERTZ SOLUTIONS®GmbH, 90579 Langenzenn, www.gigahertz-solutions.com
Measurement Instructions
GIGAHERTZ
SOLUTIONS
R
Page 29

Picture 16 Picture 17 Picture 18
Recommended Exposure Limit up to 2 kHz:
Below 200 nT, better yet below 20 nT.
(For frequencies above 2 kHz below 20 nT, better yet below 2 nT)
The resultant, total magnetic field strength (the sum of the single field strengths, 3-D Measurement) can be accurately calculated according to the following equation:
Resultant Field Strength = Square Root(x² + y² + z²)
Picture 19 illustrates the direction of the resultant field, which is also called "substitute field." The
photos for pictures 16 through 18, showing the single measurements of the three dimensions, as
well as picture 20 were taken in a kitchen during a typical testing session. If you would insert the
display values in the above equation, the result would come very close to the value, which is displayed in picture 20. There the field meter is held perpendicular to the resultant field.
Picture 19 Picture 20
13
© by GIGAHERTZ SOLUTIONS®GmbH, 90579 Langenzenn, www.gigahertz-solutions.com
Measurement Instructions
GIGAHERTZ
SOLUTIONS
R
x
Res.
y
z
Page 30

Frequency Analysis (AC Electric and Magnetic Fields)
An AC electric or magnetic field is not only defined by its field strength, but also by the frequency
with which the polarity of the field changes. We encounter various common frequencies:
- Overhead railway wires operate at 16.7 Hz (only in Europe).
- The electric power grid (home wiring, high-tension power lines) operates at a 60-Hz frequen-
cy in North America and at a 50-Hz frequency in Europe. So-called natural harmonics are the
multiples of the respective fundamental frequency (50 Hz or 60 Hz).
- In addition, various electronic devices are used in our homes that generate a variety of fields
with higher frequencies in the kHz range (artificial harmonics) such as switch-mode power
adapters ("transformers"), ballasts of fluorescent tubing and energy saving lamps as well as
dimmer switches with so-called switch mode technology and the like.
For the assessment of a certain area and especially with regards to appropriate remediation strategies, it is very useful to know how many of the different frequencies contribute to the total exposure. An exposure caused by overhead railway wires, for example, cannot be remedied by installations of the homeowner. However, it is possible to avoid certain signals of the kHz range by
choosing devices without such emissions (e.g. incandescent lamp instead of fluorescent tubing)
(only in Europe).
The ME 3951A field meter offers you different options to analyze frequencies:
Frequency Analysis with Frequency Filter Module F1B2H31
Picture 21 Picture 22
Depending on the testing situation, GIGAHERTZ SOLUTIONS®offers several different frequency filter modules for the ME 3951A. The Frequency Filter Module F1B2H31 (Picture 21/22) already supplied with the field meter is specifically designed for building biology needs. The following
frequencies can be selected:
1) 5 Hz to 400 kHz = Entire TCO frequency range, best suited for tripod measurements
2) 16.7 Hz = 4th order band pass filter with Q-Factor 10 for the frequency of
overhead railway wires (only in Europe)
3) 50 Hz to 400 kHz = 5th order high pass filter for the electric power grid and its harmo-
nics
4) 2 kHz to 400 kHz = 5th order high pass filter for so-called artificial harmonics above 2
kHz. This frequency range corresponds with band 2 of the Swedish
TCO guidelines.
In order to measure fields of overhead railway wires or harmonics, first the respective filter in the
14
© by GIGAHERTZ SOLUTIONS®GmbH, 90579 Langenzenn, www.gigahertz-solutions.com
Measurement Instructions
GIGAHERTZ
SOLUTIONS
R
Page 31

field meter needs to be activated. Generally speaking, the testing follows the same principles as
described in the section "Measurement Instructions" for the fields of the power grid system. There
are only two points, which deserve special mention here:
- Usually the source of the railway currents is located outside of a house. It is recommended,
nonetheless, that the entire house is roughly checked anyway because sometimes railway frequencies can also be found on, for example, water or gas piping as well as the electric wiring
system due to coupling effects. If a house to be tested is closer than 2 to 3 km to an electric
railway track, such potential sources should be checked to be on the safe side.
- "Artificial" harmonics usually are less energetic than power or railway frequencies and therefo-
re show lower testing results. For this frequency band, however, all renowned institutes recommend exposure limits that are 10 times lower than those for power frequency fields. Therefore
the frequency range "200 nT/Vm" is usually sufficient.
Note: Due to 1/f higher and white noise, filter tolerances, micromovements of the instrument and
frequencies beyond the filtered frequency bands, the testing results of the position "5 Hz to 400
kHz" can deviate from the sum of the filtered values.
Frequency Analysis via AC Output
Even in a "normal" work and living environment it is possible to encounter a great variety of frequencies in addition to the power frequency 60 Hz or 50 Hz, respectively. For a more detailed analysis of the different frequencies, a spectrum analyzer can be connected directly to the AC output
of the field meter by means of the supplied adapter. At the AC output a DC offset of maximum 50
mV is applied. It is standard in oscilloscopes and spectrum analyzers that this DC offset is usually suppressed by a capacitive coupling. In case the peripheral analysis instruments are connected
to the power grid including grounding conductor, the grounding of the field meter should not be
connected in order to avoid ground loops!
Following convention, the technical specifications of the field meter refer to the maximum values
given on the display, according to which the bandwidth of the AC output is limited to 30 kHz. If,
however, the measurement value is less than 1/20 of the maximum reading (e.g. in the measurement range 2000 nT this would equal 100 nT), there is still a sinusoidal input signal up to 400 kHz
with a non-linearity < 1% provided at the AC output. Since the field strengths in home and workplace settings often are in this range and not that much higher, this output can actually be used
up to 400 kHz then.
With a mono headset (adjustable volume is recommended) plugged into the AC socket, it is possible to perform a rough acoustic frequency analysis across the audible frequency range (ca. 16
Hz to 20 kHz). If needed, use adapter plug. The headset LS0002 is available as an accessory from
GIGAHERTZ SOLUTIONS
®
.
Data Logging via DC Output
The field strength of a given point in space often changes over a longer period of time. For a complete assessment, it is recommended to monitor the field strengths (DC values), for instance, for
24 hours. Therefore the field meter comes equipped with outputs where data logging and analy-
15
© by GIGAHERTZ SOLUTIONS®GmbH, 90579 Langenzenn, www.gigahertz-solutions.com
Measurement Instructions
GIGAHERTZ
SOLUTIONS
R
Page 32

sis equipment can be connected. In general, the DC output (direct current output) is used for longterm monitoring with, for example, data loggers or data plotters.
Across the DC output a DC signal is applied, which is proportional to the measurement values. It
equals minus 0.5 mV per digit. That would, for example, translate into minus 1 Volt at a maximum
reading "2000 nT/Vm" or "200 nT/Vm". The negative signal was preferred over the positive signal
because it clearly offered better linearity and correspondence with the display value. Most analysis instruments can internally convert the input signal into the appropriate absolute value. If this is
not the case, simply reverse the polarity of the plug of the analysis instrument in order to display
positive values. When using the BNC adapter, the shielding of the testing lead is connected to
mass potential. Even though the maximum values of the display show either 2000 nT or 2000 V/m,
the DC signal at the DC output is actually still quite linear up to 5000 nT or 5000 V/m, respectively. The technical specifications of the field meter refer to the values shown as maximum values on
the display. As long as a jack plug is plugged into the DC socket, the "Auto-Power-Off" function
is deactivated in order to accommodate long-term data logging.
Caution: If during data logging the battery runs so low that "low Batt." is displayed, the "AutoPower-Off" function will be activated in order to prevent the battery from becoming completely
discharged, which otherwise might destroy the rechargeable battery.
24-hour data logging can be supported through a connection to the electric power system via the
adapter or a 12 V battery. In the event a power outage occurs during data logging, the rechargeable battery in the instrument will take over automatically. As soon as electric power comes back
on, the instrument will automatically switch back to the adapter. Place the adapter as far away
from the field meter as possible in order to keep the detection of its emissions as low as possible.
By making note of the field strength with and without having the adapter plugged into the outlet,
it is possible to calculate the correction value, which of course should be subtracted from the total
measurement values.
Changing Batteries
Opening the Case
Turn off the field meter and disconnect all extension cords plug-
ged into it. Having the labeled side facing up toward you, hold the
field meter in your hand or put it down on a table.
Use the supplied wedge to open the case.
Picture 23
1.While opening the case, hold the instrument firmly in one hand
and with the other insert the wedge into the notch on the side,
about 1 cm (1/2") below the upper corner, and press the wedge
down on its thick end. There the lid will then lift slightly. Picture 23.
Picture 24
16
© by GIGAHERTZ SOLUTIONS®GmbH, 90579 Langenzenn, www.gigahertz-solutions.com
Measurement Instructions
GIGAHERTZ
SOLUTIONS
R
Page 33

2.The same procedure shall be repeated on the same side, but this
time about 1 cm (1/2") above the lower corner. Picture 24
Now the cover is open on one side.
Picture 25
3.Points 1 through 2 will also have to be repeated on the opposite
side. Pictures 25 and 26
Now the cover can be easily lifted off.
Picture 26
Closing the Case
Place the cover flush with the open field meter. Ensure that the
battery check button, the light diode and the frequency filter button all fit snugly into their designated openings in the cover. Using
thumbs and pointing fingers of both hands, press down on the
cover with a steady and gentle pressure. As a result, the cover will
snap into its place on both sides. Picture 27
Picture 27
Removing Batteries
Change batteries only while the instrument is turned off!
After having opened the cover, the rechargeable battery including
its clip can be removed or lifted out sideways.
In order to remove the battery clip from the rechargeable battery,
slip the small end of the wedge as far up between both contacts
as possible, then move the wide end of the wedge up and down.
Thus the clip can be easily detached. Picture 28
Picture 28
Under no circumstances ever pull at the leads or the plastic clip of the contacts; otherwise
they can easily be damaged or broken.
Inserting Batteries
Attach the new rechargeable battery to the battery clip and place it back into the battery compartment. While putting the battery back into the compartment, ensure that none of the battery
17
© by GIGAHERTZ SOLUTIONS®GmbH, 90579 Langenzenn, www.gigahertz-solutions.com
Changing Batteries
GIGAHERTZ
SOLUTIONS
R
Page 34

leads will get trapped between the battery and some protruding part from the circuit board. In this
case you would be unable to slide the cover back properly.
In order to replace the supplied frequency filter with another one from GIGAHERTZ SOLUTI-
ONS®, please follow the instructions enclosed with the new frequency filter.
Battery Management
Operating Time:
Immediately after having recharged the supplied battery for a total of 11 continuous hours, it can
be operated continuously for about 8 hours.
Battery Charging:
First, plug the supplied or a similar power adapter into an outlet. Insert the low-voltage jack of the
power adapter into the designated socket (upper left).
Caution: Take great care that the polarity of the adapter ((+) internal conductor and (-) external
conductor) as well as the corresponding voltage (12-24 VDC) are correct!
In order to start charging the battery, turn on field meter and then off just once. After that leave it
turned off.
The green light of the diode will shine during the charging. After about 11 hours the charging mode
will be turned off automatically.
Low Batt.:
1.When the field meter is turned on and the two dots appear in the
display (low batt.), the battery is in a low state. Using the meter in
this condition will cause measuring errors. Picture 29
But even before the low-battery indicator comes on, you can find
out the charge status of the battery with the "Batt. Check" by
pressing the respective button.
Picture 29
Auto-Power-Off
This function conserves energy and extends the total operating time.
1. In case you forgot to turn off the field meter or it was accidentally turned on during transport,
it will be automatically shut off after 40 minutes of continuous use.
18
© by GIGAHERTZ SOLUTIONS®GmbH, 90579 Langenzenn, www.gigahertz-solutions.com
Battery Management
GIGAHERTZ
SOLUTIONS
R
Page 35

2. When two dots appear in the center of the display (low batt.), the field meter will be turned off
after 3 min in order to protect the rechargeable battery from becoming completely discharged,
which would cause damage.
In order to turn on the field meter after an Auto-Power-Off, simply turn it off and on again.
Caution: If the DC signal output is connected, the normal Auto-Power-Off function is disabled.
This way it becomes possible to perform data logging supported by the rechargeable
battery, up to 8 hours. The low-battery shut-off, however, will kick in after 3 min just the
same in order to protect the rechargeable battery from the damages of a complete
(deep) discharge.
With an alkaline battery, it is possible to perform 24-hour data logging.
Caution: If an alkaline battery is being used, under no circumstances ever should the power
adapter be connected at the same time. Otherwise the battery may explode.
Checking Battery Status and Display-Check
Since the integrated rechargeable battery is not always charged
completely, it is possible to find out the remaining operating time
as well as the proper functioning of all display segments by pressing the "Batt.-Check" button.
1.In order to check the battery status, simply turn on the field meter,
press the button and continue to keep it pressed. If the display
shows "1999" or "1888," the instrument is optimally supplied with
power and all display elements function accurately. Picture 30.
Picture 30
2.When the instrument is turned on and the low battery button is
pressed, “low batt.” in the center of the display indicate that under
normal conditions the operating time will be less than 1 hour.
Picture 31
If need should be, recharge battery or turn off field meter.
Picture 31
Contact:
Gigahertz Solutions GmbH For your local distributor please contact
Am Galgenberg 12 www.gigahertz-solutions.com
D - 90579 Langenzenn
Germany
Phone +49 (9101) 9093-0
Fax +49 (9101) 9093-23
www.gigahertz-solutions.com
19
© by GIGAHERTZ SOLUTIONS®GmbH, 90579 Langenzenn, www.gigahertz-solutions.com
Battery Management
GIGAHERTZ
SOLUTIONS
R
Press the button!
Press the button!
Page 36

20
© by GIGAHERTZ SOLUTIONS®GmbH, 90579 Langenzenn, www.gigahertz-solutions.com
Technical data
GIGAHERTZ
SOLUTIONS
R
DRU0147a KW482006
ME 3951A
mit F1B2H31
Professional Dual Function - Gauss/Tesla meter for AC electric
and AC magnetic fields 5 Hz to 400 kHz with integrated Frequency Filter Module
magnetic flux density electric field strength
one dimension in nT/mG against ground potential in V/m
Frequency Range 5 Hz to 400 kHz 5 Hz to 400 kHz
(-1 dB limit) (-1 dB limit)
Range Selection 200,0 nT 2000 nT 200,0 V/m 2000 V/m
Resolution* 0,1 nT 1 nT 0,1 V/m 1 V/m
basic tolerance* ± 2 % ± 2 % ± 2 % ± 2 %
(50 Hz tracable calibrated normal)
Linearity Deviation* ± 0,3 nT ± 3 nT ± 0,2 V/m ± 0,2 V/m
(at 50 Hz)
Offset* ± 0,4 nT ± 4 nT ± 0,4 V/m ± 0,4 V/m
(at 50 Hz)
Power Supply 15 - 20 mA, according to the mode of operation
Further functions and equipment
33..55--ddiiggiitt LLCCDD
easy to read display, indication of field type
being measured and low Batt.
Tone signal proportional to field strength.
SSiiggnnaall oouuttppuuttss
for AC-signals up to 30 kHz and DC-signals.
To connect for ex. data loggings, plotters or head phones for
acoustic frequency analysis.
Test mode to correct
OOffffsseett
.
IInnssttrruummeenntt CCoonntteennttss
:
·· 1166 HHzz bbaanndd ppaassss ffiilltteerr
4th order, Q-Factor 10, be selected
·· 5500 HHzz hhiigghh
ppaassss ffiilltteerr
5th order, be selected
·· 22 kkHHzz hhiigghh ppaassss ffiilltteerr
5th order, be selected
··
High flexible grounding lead (5 m) to measure electric field
strength.
·· BBNNCC mmeeaassuurreemmeenntt aaddaapptteerr
to connect with a spectru ana-
lyzer
·· DDeettaaiilleedd ssppeezziiffiiccaattiioonnss
and
uusseerr’
’ss gguuiiddee
Power Supply
Integrated rechargeable battery with a soft
bbaatttteerryy cchhaarrggee
mmaannaaggeemmeenntt
, to protect from becoming completely dischar-
ged or overcharged.
Operating time 8 hours according to the mode of operation.
BBaatttteerryy llooww iinnddiiccaattoorr
and
aauuttoo ppoowweerr ooffff
function (auto power
off is not active when data logging).
1122 VVDDCC aaddaapptteerr
to charge the rechargeable battery included.
Optional Accessories
CCaalliibbrraattiinngg CCeerrttiiffiiccaattee
( calibration periode: 1 year).
Stable plastic box with protectors.
External
eexxttrraa rreecchhaarrggeeaabbllee bbaatttteerryy
with high capacity for data
loggings (> 48 hours)
Extra,
eexxtteerrnnaall DDiissppllaayy MMeetteerr
to measure in areas with difficult
or no entries or for observation the measurement by a 2nd person.
Retrofitable
FFrreeqquueennccyy FFiilltteerr
MMoodduull
with extra switchable limit-
ing frequencies.
Guaranteed Quality
Innovative electronics, patented technology.
DDuurraabbllee pprreecceessssiioonn tthhrroouugghh sseellff ccaalliibbrraattiinngg cciirrccuuiitt eelleemmeennttss
.
MMaaddee iinn GGeerrmmaannyy,, ssttaattee ooff tthhee aarrtt SSMMD
D
MMaannuuffaaccttuurriinngg pprroocceessss
.
High end components, FR4 material and reproducible manufacturing methods.
22 YYeeaarrss WWaarrrraannttyy oonn mmaannuuffaaccttuurriinngg ddeeffeeccttss
.
Technical data
* At 20°C and 45% of the relative air humidity
Measuring procedures according to the international. Recognized standards of workstations (TCO and MPR).
Dimensions 74 x 122 x 31 mm, weight appr. 196 grams.
ohne_Filter 100,0V/m Filter 1 100,0V/m Filter 2 100,0V/m Filter 3 100,0V/m -1dB 100,0V/m -3dB 100,0V/m
120
100
80
60
[V/m]
40
20
electric field strength
0
1 10 100 1000 10000 100000 1000000
Typical frequency response curve
frequency [Hz]
600
500
400
300
[nT]
200
100
0
magnetic flux density
ohne_Filter 500nT Filter 1 500nT Filter 2 500nT Filter 3 500nT -1dB 500nT -3dB 500nT
1 10 100 1000 10000 100000 1000000
frequency [Hz]
 Loading...