

Gigahertz NFA 400 Operating Manual
Made in Ger many
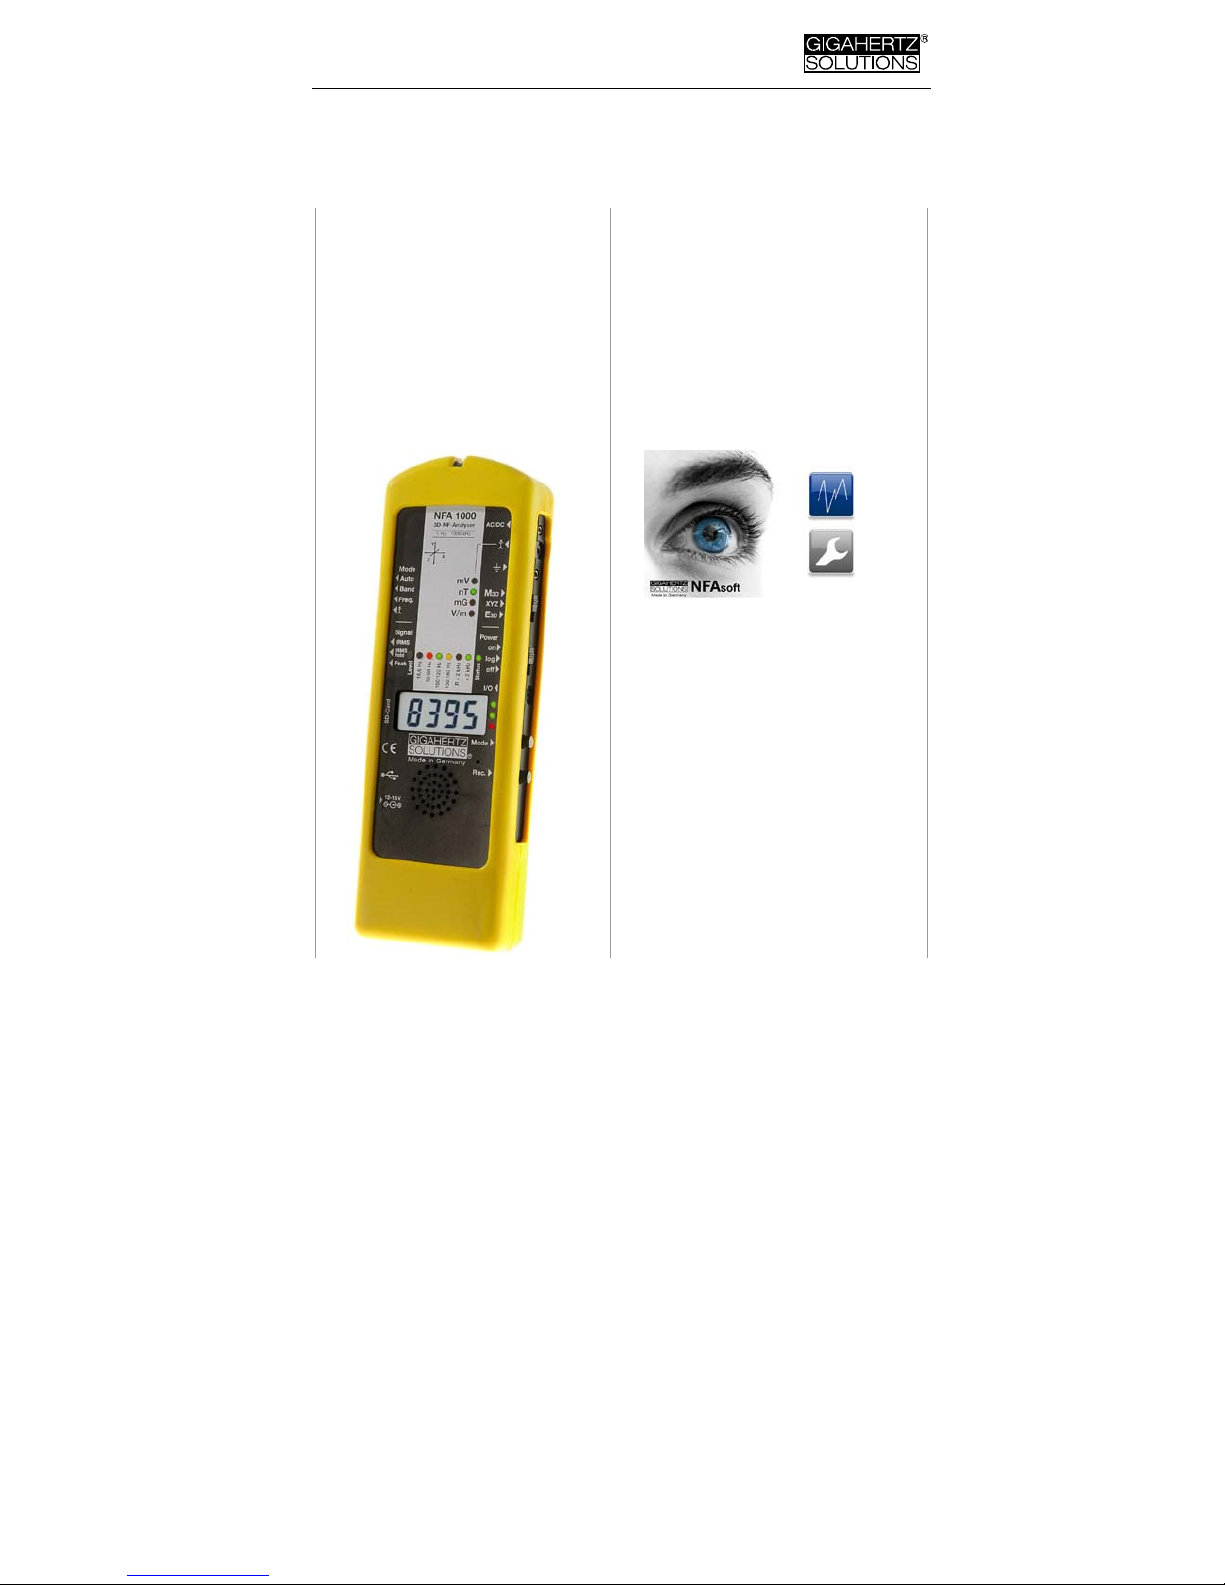
NFA 1000
NFA 400
3D Low Frequency
Analyzer
with Data Logger
NFAsoft
Analysis and
Configuration
Software
Operating Manual
Version 7.9
About this Manual
e only significant difference between the NFA 1000 and the NFA
400 in this manual is the fact that the NFA 1000 allows a three-dimensional potentialfree measurement of the E-field, while the NFA
400 can only be used for one-dimensional potentialfree measurements of the E-field. This distinction is specified in detail in the relevant chapters

Made in Ger many
Thank you!
We thank you for the confidence you have shown by buying this
product. It allows for a professional analysis of AC electric and AC
magnetic fields according to internationally recognized guidelines
and the recommendations of the building biology.
In addition to this manual you can watch the tutorial videos on
our channel “gigavideos” on youtube.com concerning the use of
this meter. However, binding in details and most up-to-date is this
manual.
Technical data and specifications are to be found on our website
www.gigahertz-solutions.com.
Contents
1 Quick Start Guide 1
2 NFA 1000 Front Cover 2
3 LEDs / Display / Audio Signals 3
4 Switches / Push-Buttons / Connectors 6
5 How to Measure and Data-Log 12
6 Power Supply 15
7 „NFAsoft“ 17
8 Firmware-Update 24
9 What if… (FAQ) 26
Do not leave in the hot car, protect from
humidity (also from condensing air humidity),
do not wipe or touch display foil!
(details on page 29)
This manual is based on the firmware version 84 and NFAsoft version 172.
The firmware and software of the NFA will be continuously improved and made available
via download from our homepage.
.

© Gigahertz Solutions GmbH - 1 - December 2018
Made in Ger many
1 Quick Start Guide
The instructions below refer to the default settings, which can
easily be customized with the help of the supplied software
„NFAsoft“.
After switching on, the CPU boots, performs some self tests and
then automatically starts measuring. When turning off the device,
allow some seconds for shutting down its operating system before switching it back on.
Set all switches to their top position!
(Auto, tRMS, M3D and On)
With these settings you will achieve your first meaningful results
without further knowledge about the instrument.
The LCD display will now indicate the 3D magnetic field
strength
. The coloured frequency LEDs above the LCD display
show the comprised frequencies. The dominant axis x, y or z is indicated by a red LED on the right of the LCD display.
NFA 1000:
To measure the E-field with ground-reference simply connect
the grounding cable. The NFA detects the attached cable and automatically shows the corresponding electric field strength and
frequencies.
The ‘mode’ button toggles between this and the 3D magnetic
field.
To measure the three dimensional potential-free AC electric
field, switch to E
3D and fix the instrument onto a potential-free
rod or onto a support.
The ‘mode’ button toggles between this and the
magnetic Z-axis.
NFA 400:
For an E-field measurement, simply switch to Ey.
If the grounding cable is plugged in and connected to the
ground potential, you are measuring “against ground”.
If you attach the meter to a potentialfree rod or place it
onto a support, you are measuring “potential free”.
The ‘mode’ button toggles between this and the 3D magnetic field.
Should the meter not do what you expect, please turn to the
chapter on FAQs (frequently asked questions) at the end of this
manual (Chapter 9)!
Notes:
For potential-free E-field-measurements the highest accuracy will be reached when used
without the yellow silicone holster.
To allow a simplified freehand measurement, the meter is pre-adjusted with a 16 Hz high
pass filter for the magnetic field and a 50 Hz high pass filter for the electric field (see page
23 for measurements from 5 Hz onwards).
December 2018 - 2 - © Gigahertz Solutions GmbH
Made in Ger many
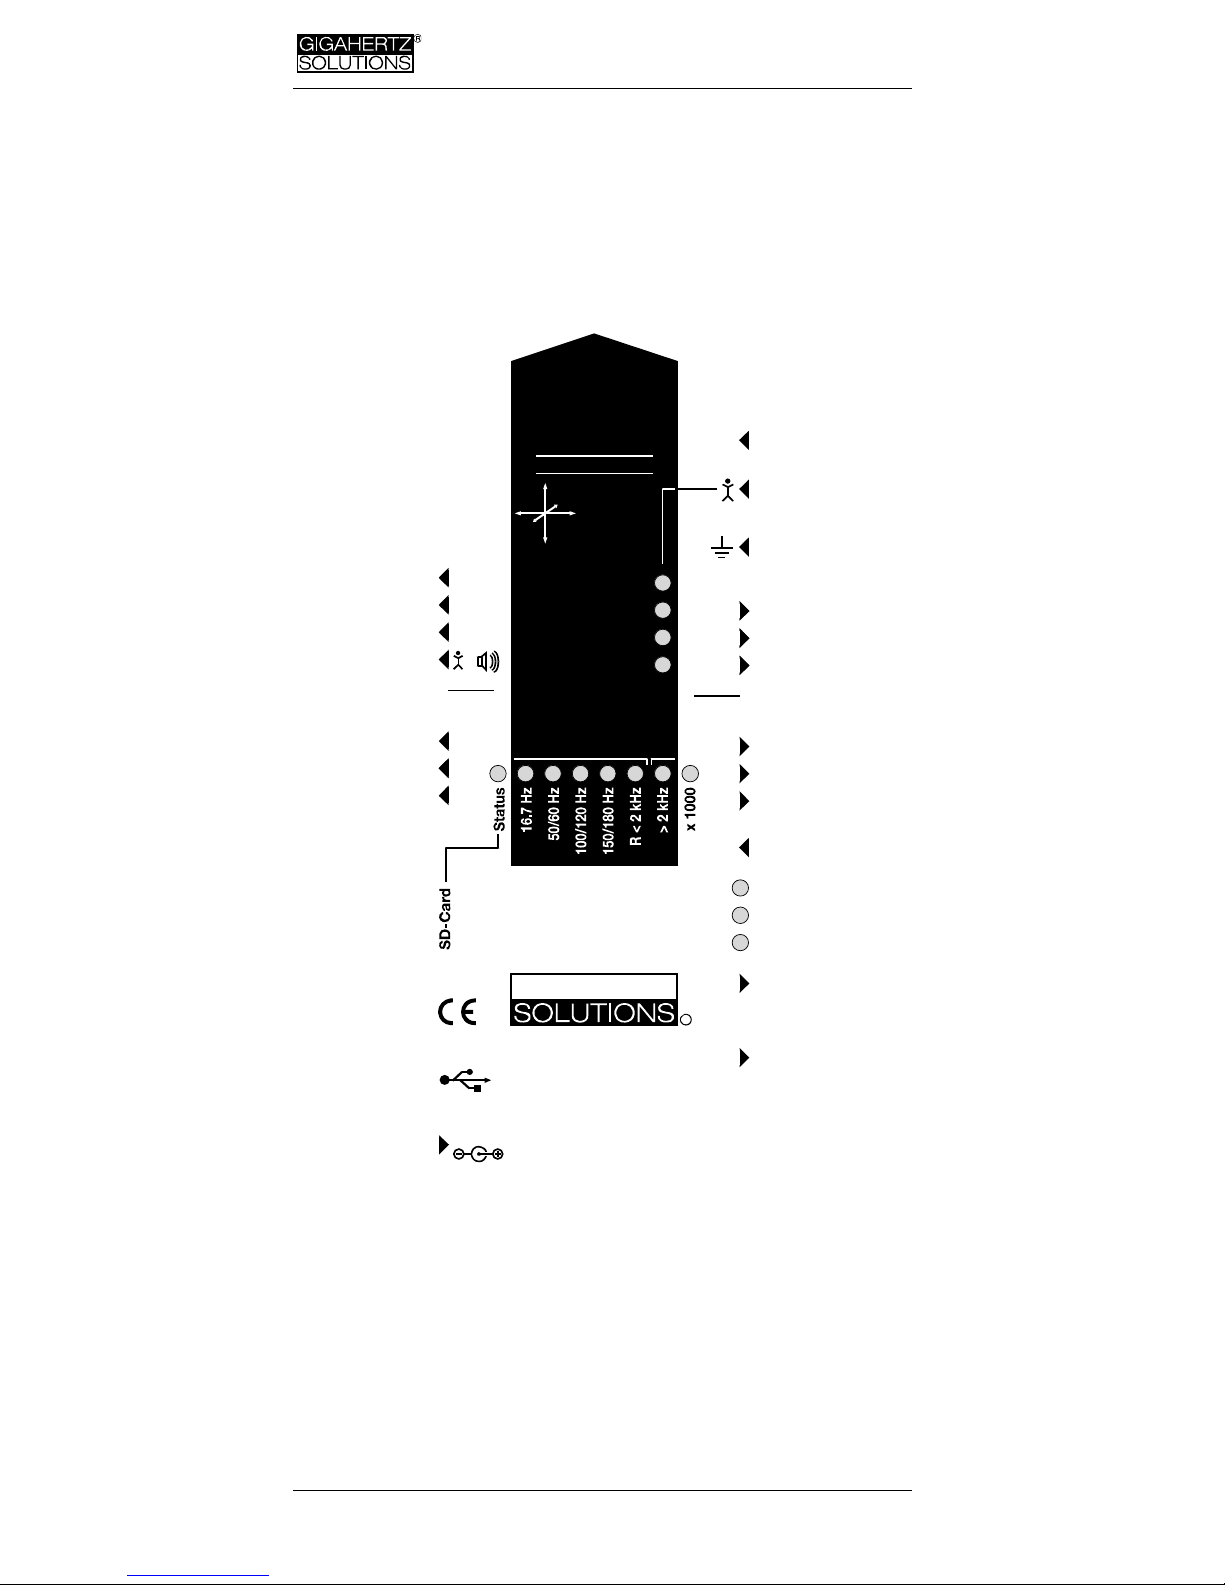
2 Front Cover NFA 1000 and
NFA 400
Analogous front cover for NFA 1000 and NFA 400
NFA 400: „Ey“
12-15 V
Y
X
Z
Power
Signal
Made in Germany
R
GIGAHERTZ
Mode
NFA 1000
3D-NF-Analyser
5 Hz - 1000 kHz
Freq.
AC/DC
Peak
Rec.
Mode
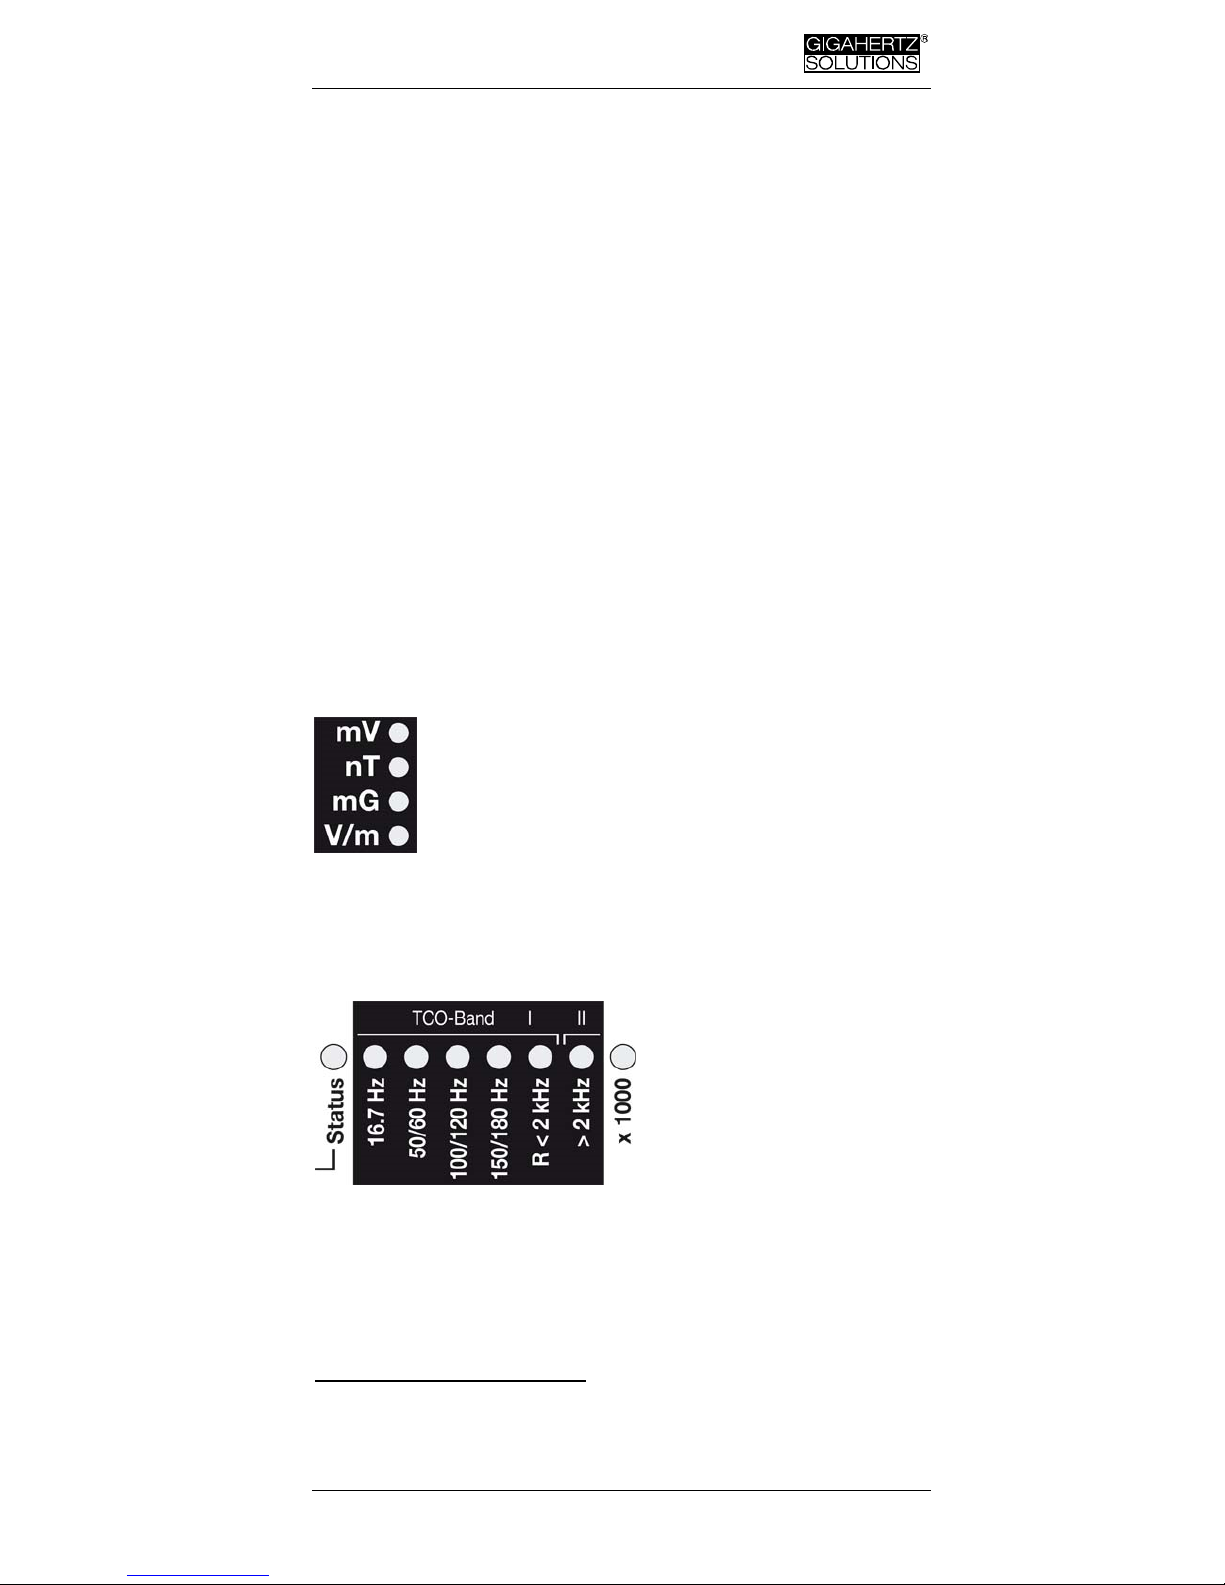
mV
nT
mG
V/m
Band
E
3D
M
3D
tRMS
Auto
XYZ
On
Off
Log
I/O
X
Y
Z
Hold
/
TCO-Band I II
© Gigahertz Solutions GmbH - 3 - December 2018
Made in Ger many
3 Display / LEDs / Audio
3.1 Display and LEDs
When switched to “On”, the NFA will briefly show the remaining
battery life in the log mode. When switched to “Log”, the remaining battery life is shown cyclically with the elapsed log time and
name of the log file. After some self tests the measurement starts
automatically.
Time indications are set up as follows:
„Xd.XX“: X days and XX hours or
„XX.XX“: XX hours and XX minutes.
„XX.XX“: (with blinking dot): XX minutes und XX seconds.
1 day, 12 hours is the specified minimum logging time. The real
capacity can be higher, notably for new batteries.
The unit of the reading shown on the LCD
is indicated by the adjacent green LED
A flashing LED indicates the unit of a secondary
measurement parameter, which can be selected by
depressing the “Mode>” button.
If the LCD range for the standard unit is exceeded,
the next higher unit is displayed, that is uT instead of
nT and Volt instead of mV. Additionally the color of
the
adjacent LED changes to red and the “x 1000”-LED is also lit
red.
LEDs to indicate the applicable frequency bands:
The frequency-LEDs change
their colour (“traffic light principle”).
”16.7 Hz“: In use for railway
lines in some European countries. The reading also includes the 2
nd
harmonic.
”50/60 Hz“
1
: Mains frequency. The bandwidth only covers individual frequencies of 50
Hz and 60 Hz with their respective lock-in ranges.
”100/120 Hz“
1
: This LED indicates the contribution of the second
through fourth “even” harmonics.
The strongest frequency can be numerically
displayed when using “Freq” mode.
1
The NFA automatically detects the mains frequency and adjusts the indication
of its harmonics. With “Freq.” the actual mains frequency can be determined exactly. The LED’s for 16.7 Hz, mains frequency and its harmonics up to 2 kHz
have a suitable lock-in range to cover mains fluctuations.

December 2018 - 4 - © Gigahertz Solutions GmbH
Made in Ger many
”150/180 Hz“1: This LED indicates the contribution of the third
through fourth “uneven” harmonics.
The third harmonics will presently be
found in many homes and most offices as a significant portion of the total measurement.
The frequency of the strongest source can be numerically displayed when using “Freq”.
”R < 2kHz“: Means “Remainder of frequencies below 2 kHz”.
This LED does not show the whole band, but only the sum of all frequencies below 2 kHz
which are not covered by the LEDs on the left.
”> 2kHz“: Comprises frequencies within the upper TCO-band of 2
KHz up to 1 MHz.
Status LED
The “Status” LED indicates the current mode of operation
“Red” means “instrument is being charged”.
“Yellow” means “measurement in progress, NO recording”.
“Green” means “measurement in progress WITH recording”,
Note: with the switch set to “Log.”, the “Status”-LED is switched off after a short
while, in order to extend battery life.
“x 1000”-LED
Turns red when the scale increases to the superior unit.
Special LCD Display Messages
“Low Batt“: Please recharge the battery a.s.a.p.
“Err.“: Short for ‘Error’. Indicates an inappropriate configuration.
This can occur when a grounding cable or mains adapter is connected AND potential-free E-field measurement is selected.
„----“: Instrument is in the process of determining the measurement, or the value is too small to be measured.
„CHAr“: Instrument is being charged.
(For technical reasons “FULL” will be
shown shortly before this, which is to be ignored)
„FULL“means: battery fully loaded or SD memory card is full.
„nbAt“:The processor cannot recognize the battery
(see chapter 9)
or the 15 V AC adapter should be disconnected (the batteries have
reached their maximum possible capacity. Storage at this capacity level is not advised)
There are two display modes for the frequency-
LEDs:
“Simple/Steady“: (= preset)2
The red LED represents the strongest frequency , and the yellow
2
In order to allow for less fluctuations in this mode an internal high pass filter is
switched on. With NFAsoft it can be configurated to 16.7 and 50 Hz. Experience
has shown that the best combination for a freehand measurement is a filter set
to 16.7 Hz for magnetic fields and to 50 Hz for electric fields. Electric fields of the
© Gigahertz Solutions GmbH - 5 - December 2018
Made in Ger many
LED the second strongest. The green LEDs indicate the total frequency range in the current setting.
“Full Information/Volatile”: This makes the LEDs rather unsteady/volatile. (To be configured with NFAsoft)
The proportion of the respective frequency band in relation to the
total signal is being displayed. These proportions are shown as
follows
3
:
RED = DOMINANT (> 50%)
YELLOW = MEDIUM (< 50%)
GREEN = SMALL (< 10%)
3.2 Audio Signal
The acoustic signal is always linked to the respective measured
value and has a „Geiger Counter” characteristic, i. e. an increasing
signal intensity will in turn cause an accelerated rattling sound.
If the “Mode”-switch is set to „ “, press the ‘Mode >’ button
to turn the volume up and the ‘Rec. >’ button to turn the volume
down (and finally: off), as long as no grounding cable is connected
to the instrument.
Please note: For extra-precise measurement requirements turn
the acoustic signal volume down or even switch it off completely.
16.7 Hz railway line power frequency (in some European countries) are quite rare
indoors and can still be evaluated in the “band” mode. They can still be separately evaluated with NFAsoft.
3
To make it more ergonomic for the user, frequencies below the nominal display
resolution (that is < 0.1 V/m or < 1 nT) are not indicated by an LED-signal but will
still be recorded down to the noise level. Hysteresis: 9/12% resp. 45/50%.
/
December 2018 - 6 - © Gigahertz Solutions GmbH
Made in Ger many
4 Switches / Push-Buttons /
Connectors
4.1 On / Off switch (“Power“)
“On” = Standard Measurement Setting
Allow some seconds for self-testing until measurement starts automatically. LEDs and acoustic signal are activated for full information during manual measurements. They remain activated
when you start logging by shortly switching to “Log” until the Status-LED is lit green and then back to “On”.
“Log” = Logging / long term recording
All LEDs and the acoustic signal are deactivated in order to save
battery life during data logging.
“Off” = Device is off
When turning off the device allow some seconds for shutting
down its operating system before switching it back on.
4.2 Field Selection for
3D Measurement
M3D = Magnetic field measurement (3D)
The isotropic point or magnetic field sensors are below
the coordinate system printed on the meter faceplate.
The dominating axis is indicated by a red LED next to
the display.
XYZ = Axis indication
Here, the NFA 1000 will show either the magnetic or the electric
field in its three individual components depending on the field
type from which the switch was set to “XYZ”, whereas the NFA
400 will only show the individual components of the magnetic
field. Press the ‘Mode >’ button to switch from one axis to the
other. Please see chapter 4.9 for details to this or to the automated scrolling.
E3D
(NFA1000)
/ Ey
(NFA400)
= Potential-free E-field meas-
urement
The field sensor pairs for the X-, Y- and Z-axis (directions correspond to the imprint) are situated within the meter close to the
housing. For a proper measurement the meter has to be set up
Y X
Z
© Gigahertz Solutions GmbH - 7 - December 2018
Made in Ger many
more than 12 inches away from any metal objects on an insulated
“holder” (accessory PM1) or held with an insulated rod (mounting
aid PM5s). Also cables or probes must not be connected during
this measurement setting. In the case of an erroneous configuration, the display will indicate “Err.” until the configuration is corrected or the setting is changed to magnetic field measurement.
The measuring person should avoid hectic movements and keep
a distance of at least 1.5 m to the object of measurement.
For E-field measurements against earth potential, please plug in
the grounding cable and
- switch to “M3D” (automatic adjustment) on the NFA 1000
- switch to “Ey” on the NFA 400.
4.3 Sockets for Inputs and Grounding
AC/DC = Combined AC/DC-Input
The moment you connect an external sensor, its
signal will automatically be displayed in mV and
logged if required.
(“Mode” switch is set to “Auto”.
Protected against overvoltage).
AC: A displayed value of 2000 corresponds to an
AC signal of “1V
RMS
”.
DC: It can linearly display and log signals from +/-
0.1 to +/- 1500mV, i.e. with an HF59B connected and set to
coarse (adjust to 1V), the values recorded will be between 1µW/m²
and approx. 30,000 µW/m². The value will be displayed in mV
4
.
For logging high frequencies please make sure to remember the
settings of the connected HF-Analyser, as they will not be registered by the NFA. You may use the audio note feature for that.
Available options for the AC/DC Socket
Connecting cable for an HF-Analyser for data logging high-fre-
quency (KAB0053). Potentially falsifying LF- or RF-inductions can
reliably be suppressed by means of our suppression kit (EDY).
Electrostatic probe for measuring electrostatic charges of surfaces (ES-NFA).
3D-magnetostatic probe for measuring the Earth’s magnetic
field and its distortions (MS3-NFA).
An AC signal being connected to the AC/DC socket will by default
be displayed as total RMS signal in CH4. For the analysis and mitigation of dirty power it is useful to have the signal of a current
clamp (e.g. the CA MiniFlex MA) to be split into the frequency
4
For all measurement ranges, even when using an attenuator or amplifier, NFAsoft offers a comfortable conversion tool. The random noise will make it impossible to properly display or record measurement values below 0.1µW/m², though.
December 2018 - 8 - © Gigahertz Solutions GmbH
Made in Ger many
ranges of the NFA (like with the field strengths). Beginning with
firmware version 84 this feature can be activated optionally (FA1).
= Input socket for body voltage hand probe
Input for the connection of a hand probe for the measurement of
body voltage in mV. The connector is a 4 mm banana jack. For
displaying and recording, set the “Mode”-switch to
and plug
in the grounding cable.
This is the only input which cannot be recognized automatically
(being single-pole).
= Socket for the grounding cable
Allows the connection of a grounding cable for an E-field measurement with reference to ground (in compliance with TCO). This
will be detected automatically by the instrument and the display
will change to E-field with reference to ground correspondingly.
Socket for the TCO-conformed probe at the
front end of the meter
This is for the TCO-conformed probe available as an optional accessory from Gigahertz Solutions. No data logging!
4.4 Mode = Selection of
Measurement Mode
Selects all measurement and display options of
the instrument with the field selector switch
and the “Mode >” button. Configuration errors
will be detected and indicated by “Err.” on the
display until resolved.
When set to
the NFA recognizes
probes connected to it, and shows the corresponding values. If there is no external probe
connected to the instrument, it will show the
selected 3D field type. By pressing the mode
button, you can “toggle” between the primary
and secondary display measurements. The
secondary measurement field is indicated by a short flashing of
the corresponding unit-LED.
/
Mode
Freq.
Band
Auto
/
 Loading...